Article

UAV-Based Disease Detection in Palm Groves of Phoenix canariensis Using Machine Learning and Multispectral Imagery

by
Enrique Casas
1,
Manuel Arbelo
1,*,
José A. Moreno-Ruiz
2,
Pedro A. Hernández-Leal
1 and
José A. Reyes-Carlos
3
1
Departamento de Física, Universidad de La Laguna, 38200 San Cristóbal de La Laguna, Spain
2
Departamento de Informática, Universidad de Almería, 04120 Almería, Spain
3
Sección de Sanidad Vegetal, Dirección General de Agricultura, Consejería de Agricultura, Ganadería y Pesca, 47014 Santa Cruz de Tenerife, Spain
*
Author to whom correspondence should be addressed.
Remote Sens. 2023, 15(14), 3584; https://doi.org/10.3390/rs15143584
Submission received: 25 May 2023 / Revised: 23 June 2023 / Accepted: 12 July 2023 / Published: 18 July 2023
(This article belongs to the Special Issue Machine Learning for Multi-Source Remote Sensing Images Analysis)

Abstract

:
Climate change and the appearance of pests and pathogens are leading to the disappearance of palm groves of Phoenix canariensis in the Canary Islands. Traditional pathology diagnostic techniques are resource-demanding and poorly reproducible, and it is necessary to develop new monitoring methodologies. This study presents a tool to identify individuals infected by Serenomyces phoenicis and Phoenicococcus marlatti using UAV-derived multispectral images and machine learning. In the first step, image segmentation and classification techniques allowed us to calculate a relative prevalence of affected leaves at an individual scale for each palm tree, so that we could finally use this information with labelled in situ data to build a probabilistic classification model to detect infected specimens. Both the pixel classification performance and the model’s fitness were evaluated using different metrics such as omission and commission errors, accuracy, precision, recall, and F1-score. It is worth noting the accuracy of more than 0.96 obtained for the pixel classification of the affected and healthy leaves, and the good detection ability of the probabilistic classification model, which reached an accuracy of 0.87 for infected palm trees. The proposed methodology is presented as an efficient tool for identifying infected palm specimens, using spectral information, reducing the need for fieldwork and facilitating phytosanitary treatment.

1. Introduction

Human activities have led to the global redistribution of species, causing a decline in biodiversity and the apparition of non-native species in natural environments [1]. Introducing these species affects the native populations and jeopardizes the function of the ecosystem [2]. This phenomenon is being enhanced by climate change, allowing for the arrival of invasive pests and new pathogens to crops and forests [3,4]. The apparition of these diseases poses a severe threat to food security and the resilience of natural landscapes [5], especially in island ecosystems, which are especially vulnerable to climate change [6].
The Canarian archipelago, and its unique vegetation landscape, shaped by Canarian palm tree (Phoenix canariensis) groves, is being affected by this worldwide spread phenomenon, with the groves consequently being in decline. Numerous pests and diseases can be found, the most important of which are Serenomyces phoenicis and Phoenicococcus marlatti. S. phoenicis is a fungus that mainly affects mature and older leaves, invading the vascular tissues and drying localized leaf areas. P. marlatti is an insect that feeds on palm sap and can cause severe damage by reducing the growth and production. In addition, although the threat of the palm weevil (Rhynchophorus ferrugineus) has been eradicated [7], there is another similar species, the spotted coconut weevil (Diocalandra frumenti), a coleopteran that attacks palm trees, that causes the lower leaves to dry and the formation of small galleries in the rachis that can affect the vascular bundles, causing severe damage to the palm tree.
The European Union Natura 2000 protection areas designated P. canariensis groves as a priority habitat as an essential endemic Canary Islands plant species, contributing to its identity and economy [8]. In this context, new tools to monitor and treat the pathologies that affect and jeopardize the populations of P. canariensis are required. Traditionally, visual inspection through fieldwork has been the predominant method. However, this methodology requires highly qualified personnel, and its success depends on the expertise of the technicians. In addition, its diagnosis can be affected by the variability of different pathologies over time, causing inconsistencies in the assessments and impoverishing their repeatability and reproducibility [9,10]. Therefore, phytosanitary monitoring needs reliable and efficient alternatives to improve disease detection. In this sense, remote sensing is a suitable alternative for disease monitoring and surveillance [11,12,13,14].
Although the images obtained from satellites and aircraft allow for thorough monitoring and can cover larger areas, compared with UAV images, their spatial resolution may be too coarse to draw significant conclusions [14]. In this sense, high-resolution UAV imagery presents clear advantages [15,16]. Additionally, UAVs can be used alongside satellites to combine the detailed information of high-resolution images with the large-scale coverage of satellite data [17,18,19]. The potential of UAVs for conducting detailed surveys in vegetation has been demonstrated in diverse applications, such as species identification [20], plant stress detection [21], forest health assessments [22], early detection of insect infestations [23], weed management [24], and senescence prediction [25].
Among the sensors mounted on UAVs, multispectral cameras are predominantly used for disease identification [14]. The spectral information of the images obtained by these cameras allows for the calculation of different vegetation indices (VIs), representative of the biophysical and biochemical properties of plants, which change, such as loss of pigmentation or variations in the structure of their leaf cells in response to different stresses [26]. These indices help characterize these changes [10] and represent one of the most critical factors for identifying crop diseases [14].
The applicability of multispectral data is not limited to calculating the spectral indices. Recent innovations in data analytics and image processing contribute to developing and applying new techniques and algorithms for studying vegetation pests and diseases, further deepening our understanding of the capabilities of multispectral data and improving the accuracy and processing times [12]. Among them, machine learning (ML) algorithms for image classification and segmentation [27] stand out, and their application is handy for phytosanitary monitoring. These techniques have been used to study the prevalence of different crop diseases [28,29,30], the location of diseased or stressed specimens in different scenarios [31,32,33], or the identification of damaged leaves with a high level of detail [34,35,36].
SVM is an ML algorithm that successfully deals with limited training samples [13] and has been found to outperform other algorithms for detecting vegetation diseases [37,38]. For example, in [39], the authors detected Bakanae disease in rice seedlings with an accuracy of 0.88 using SVM classifiers, and in [40], wheat leaf rust was detected with accuracies approaching 0.93. Another ML algorithm used to identify crop diseases successfully is RF, reaching accuracies close to 0.79 in [41], while [17] used RF classifiers to detect infected banana trees with an accuracy of 0.97. In other research [42], UAV RGB and thermal images were used to estimate sap flow and leaf stomatal conductance in a range of forest tree species, with RF being the model that achieved the best accuracy (better than 0.9). In [33], the authors developed a model to predict tree mortality using RF algorithms and spectral indices derived from multispectral UAV imagery.
Although SVM and RF are usually preferred [43], other algorithms, such as ANNs, show sufficiency for plant disease and pest surveillance in complex scenarios [44,45]. In [46], ML with visible and IR reflectance data was used to classify damaged soybean seeds, obtaining the highest accuracy with ANN classifiers among several models that were tested, and in [47], diseased leaves in cotton plants were identified using ANN and RGB images.
Considering P. canariensis, we only found examples in the literature using RS and ML techniques for identifying red palm weevil (Rhynchophorus ferrugineus). In [48], the authors used thermal infrared and RGB images with a 0.5 m and 38 mm spatial resolution, respectively, taken on a platform 3 m above the canopy in order to identify the infected palm trees, achieving an accuracy of 0.75. Another example can be found in [49], where the authors used time series of thermal images acquired by a balloon platform to detect the effects of vascular damage in the tree canopy. These studies focussed on urban areas, and we attempts to study diseases that threaten the distribution of P. canariensis in natural habitats, as well as studies focusing on pathologies present in the Canarian archipelago are lacking.
In this context and considering the ecological and socio-cultural importance of palm groves in the Canary Islands, the Guarapo project http://guarapo.lagomera.es/ (accessed on 17 July 2023) was proposed to assess the conservation status of Phoenix canariensis. Within the framework of this project, our objective was to develop a tool for monitoring diseases through probabilistic classification modelling, in order to identify infected specimens using high-resolution multispectral UAV images and ML techniques.

2. Materials and Methods

A probabilistic classification model was developed to identify infected palm specimens based on the prevalence of affected leaves within each palm tree. First, the ability of different vegetation indices to discriminate between affected and healthy leaves was studied using a Jeffries-Matusita spectral separability analysis. Then, three different steps were followed, namely: (i) image segmentation, to detect and identify individual palm trees; (ii) pixel-level classification within each previously segmented palm tree, using ML and considering the reflectance of bands 1 to 5 of a Micasense Altum camera, where the spectral indices showed the highest spectral separability in the previous analysis; and (iii) calculation of the relative prevalence of pixels classified as affected leaves in each individual, which were later to be used as the predictor variable in the probabilistic classification model (Figure 1).

2.1. Study Area

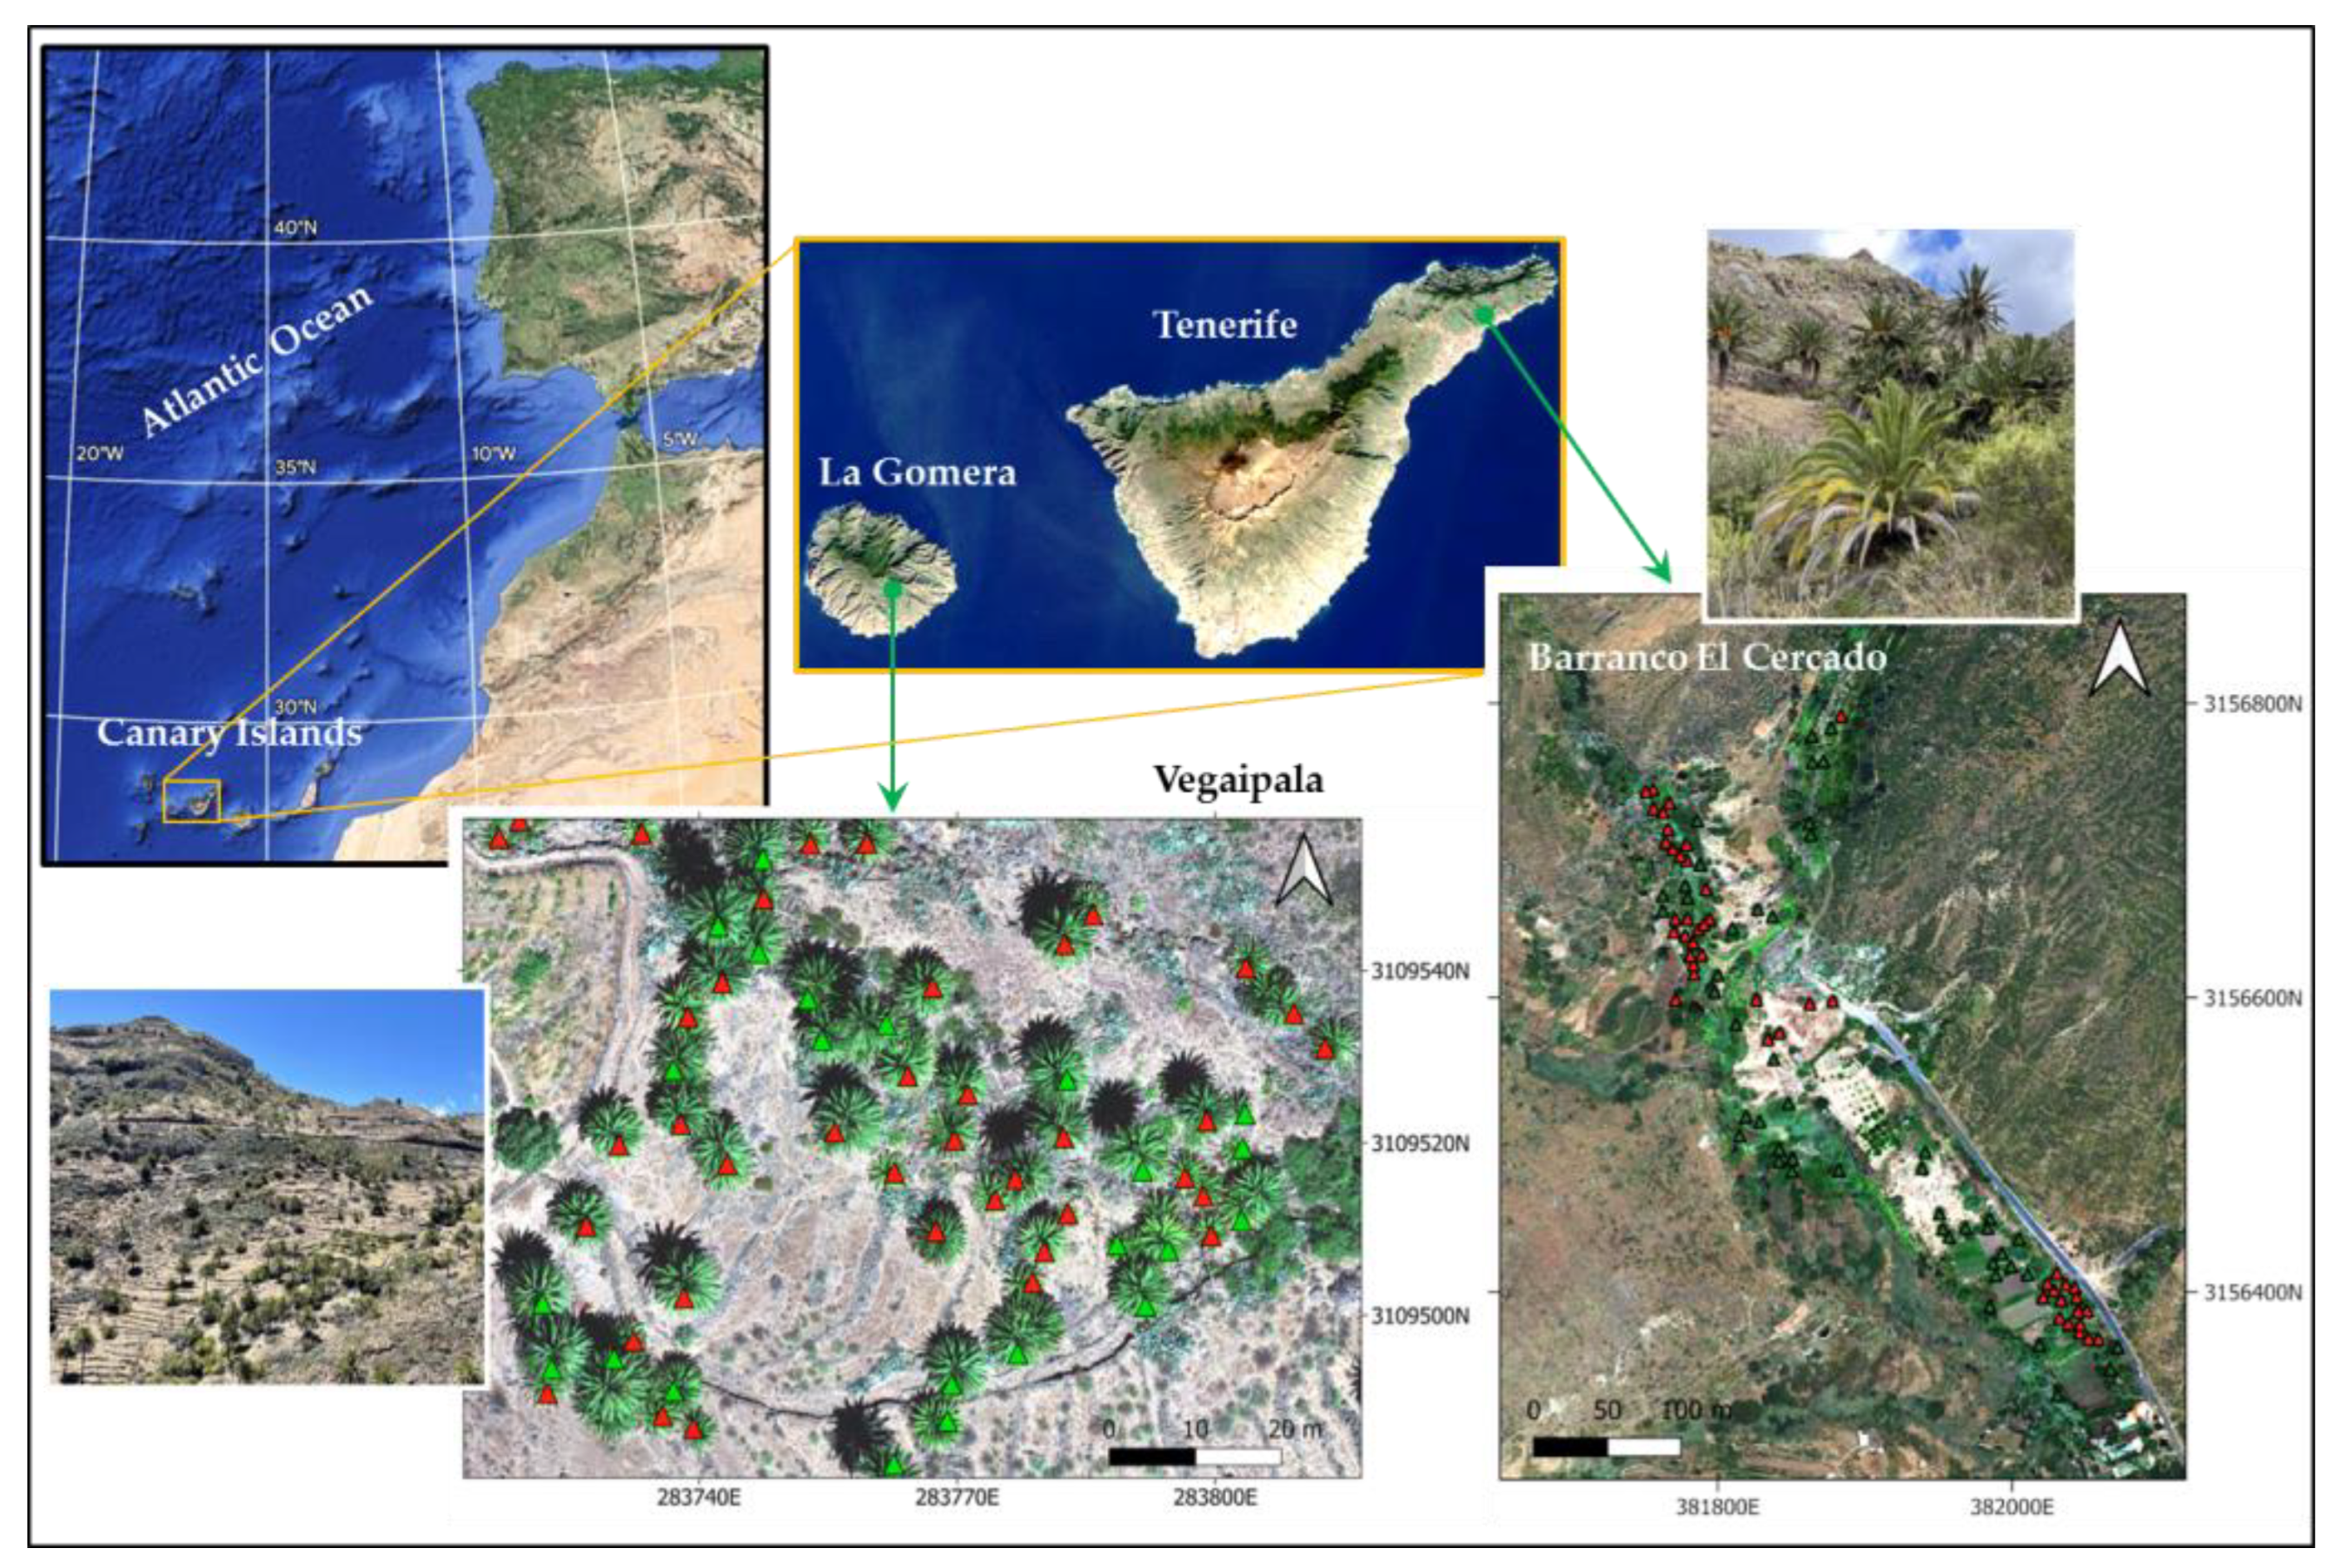
Two study areas were chosen, namely the Vegaipala area on the island of La Gomera and Barranco El Cercado on Tenerife, located in the Canary Island archipelago (Figure 2). This archipelago, consisting of eight islands, is located in the Northeast Atlantic, and it is characterized by a subtropical climate with a low seasonal temperature variability [50]. The trade winds with prevailing north-east direction characterize the precipitation patterns, with the areas exposed to north and north-east being the most humid [51].
These study areas, located on the southern slopes of the islands, were chosen because of their representativity of the health status of the palm groves in the archipelago. The main harmful agents found are S. phoenicis and P. marlatti, which, along with the increasing drought problems characteristic of these slopes, are causing the general palm groves to exhibit a declining trend in the archipelago.

2.1.1. Vegaipala

The selected study area covers approximately 0.84 ha. Its geographical coordinates are at 28.093°N and 17.201°W, with an approximate altitude of 800 m above sea level. This palm grove is near the hamlet of Vegaipala, in the San Sebastián de La Gomera municipality, and it is located on a hillside with terraces of abandoned crops.
According to the Köppen classification, the climate in Vegaipala is Csa—temperate with dry and warm summers. The average annual temperature varies from 12.4 °C in January to 21.5 °C in August. The accumulated annual rainfall is 394.7 mm https://atlasclimatico.sitcan.es/ (accessed on 17 July 2023).
Other species of vegetation that are present are Micromeria gomerensis, Cistus monspeliensis, Agave americana, and Opuntia maxima Mill. M. gomerensis is a protected endemic plant of the island of La Gomera, belonging to the Lamiaceae family, which grows in mountain areas and ravines. C. monspeliensis is a perennial plant that grows in arid and rocky areas of the island, and it is also common in the Mediterranean, with ecological and cultural value in the archipelago. A. americana is a perennial succulent plant native to America, highly resistant to arid conditions, and Opuntia maxima Mill. is a species of cactus belonging to the Cactaceae family, native to America, which may pose a threat to other native species due to its colonizing potential.

2.1.2. Barranco El Cercado

The area selected for the study occupies an area of approximately 6.12 ha, with geographical coordinates centered at 28.530°N and 16.207°W, with an approximate height of 200 m above sea level. This ravine is located within the Anaga Natural Park’s boundaries in the Santa Cruz de Tenerife municipality. It has become a tourist attraction with anthropic influence due to the proximity of urban areas.
Its climate is also classified as Csa—temperate with a dry and warm summer, with an average annual temperature ranging from 17.2 °C in January to 24.4 °C in August. The accumulated annual rainfall is 385.4 mm https://atlasclimatico.sitcan.es/ (accessed on 17 July 2023).
The area is also home to Periploco laevigatae, an evergreen shrub with a high resistance to drought and exposure, and Juniperus canariensis, another type of drought-resistant shrub capable of growing in poor soils. Both species are endemic to the Canary Islands, with the latter holding a protected status.

2.2. Data Collection

Various flight missions were conducted at 60 m above ground level for each of the study areas using a Micasense Altum multispectral camera (MicaSense, Inc., Washington, DC, USA) mounted on a DJI Matrice 200 v2 (Da-Jiang Innovations (DJI), Shenzhen, Guangdong, China). The flight speed was set to 2 m/s with a front and lateral overlap of 85%. At Vegaipala, the wind conditions for the day of the flight (14 September 2022) were optimal, with wind speeds close to 2.5 m/s. For the Barranco El Cercado, the prevailing wind during the planned month for measurements (June 2022) was northbound moderate, with gusts exceeding 50 km/h. These gusts conditioned the capture of the images, having to make up to four trips between 1 and 12 June 2022 to the study area before being able to carry out the flights safely on 12 June.
The Altum camera captures five radiance bands in the visible and near-infrared regions (i.e., blue, green, red, red edge, and near infrared) comprising wavelengths of 475.0 nm, 560.0 nm, 668.0 nm, 717.0 nm, and 842.0 nm, respectively (Figure 3). For radiometric calibration, reference images were taken before and after each flight by pointing the camera to a calibrated reflectance panel (CRP). An additional correction step was applied with the Downwelling Light Sensor (DLS 2) (MicaSense Inc., Washington, DC, USA), an advanced light sensor that adjusts for lighting changes and provides GPS data to the camera.
Image processing resulted in developing two orthomosaics for both study areas, using Pix4dFields® software (Figure 2). Image processing carried out included the following (i) georeferentiation, (ii) rig relative correction, and (iii) radiometric correction. The orthomosaics presented a spatial resolution of 3.94 cm/pixel.
The assessment of the health status of the P. canariensis specimens in both study areas was conducted by technicians from the Plant Health Service of the Dirección General de Agricultura of the Consejería de Agricultura, Ganadería y Pesca from the Canary Government. Information was collected from 95 palms for El Cercado and 68 for Vegaipala, and they were labelled as either healthy or infected.
To evaluate different vegetation indices and their spectral separability later, healthy leaves as well as those with different levels of affection were selected and cut. Images were taken of these leaves placed on a black background of near-zero reflectance (ρ < 0.02) with the Altum camera at a height of 5 m. The images, with a spatial resolution of 2.4 mm, were calibrated using CRP.

2.3. Spectral Indices Separability Analysis

Among the plethora of available spectral indices known to be suited to characterize the physiological and biochemical variations in vegetation, a selection criterion was defined by applying a series of filters. First, indices incorporating an atmospheric correction dimension, single band, and weighted indices were discarded. Then, a set of indices was defined, seeking equitable representation of the available bands in the Altum Micasense camera, aiming for similar ranges of values for potential indices and enhancing the comparability of the results of the later analysis. Following this criterion, eight spectral indices were selected for application and analysis (Table 1): BNDVI (blue normalized difference vegetation index) [52], GNDVI (green normalized difference vegetation index) [53], NDRE (normalized difference red edge index) [54], NDVI (normalized difference vegetation index) [55], SIPI 2 (structure insensitive pigment index 2) [56], OSAVI (optimized soil-adjusted vegetation index) [57], NDYI (normalized difference yellowness index) [58], and SIPI (structure insensitive pigment index) [59].
The indices were calculated for different regions defined by groups of leaflets representing three types of leaves: (i) healthy, with green shades; (ii) affected, with yellow-green shades; and (iii) dry, with whitish shades. These regions were identified and defined based on visual interpretation. For each index, the mean reflectance and variance were calculated. From these values, a spectral separability analysis was performed between the different selected regions using the Jeffries-Matusita (JM) distance, defined by Equation (1) [60]:
J M 1,2 = 2 1 B 1,2
which represents the distance between two probability density functions or statistical distributions—in our case, two types of leaves. B1,2 is the Bhattacharyya distance (Equation (2)).
B 1,2 = 1 8 μ 1 μ 2 T Σ 1 + Σ 2 2 1 μ 1 μ 2 + 1 2 ln Σ 1 + Σ 2 2 Σ 1 + Σ 2
where μ 1 and μ 2 represent the mean vectors of two distributions, and Σ 1 and Σ 2 are the covariance matrices.
JM exhibits asymptotic behavior at 2.0, implying maximum spectral separability when this value is reached between two classes [60].

2.4. Image Processing

2.4.1. Palm Tree Segmentation

All individual palm trees were segmented using a regional growth method [61]. The segmentation consisted of the selection of seed points based on the published P. canariensis distribution map https://www.idecanarias.es/listado_servicios/mapa-palmeras-canarias (accessed on 17 July 2023), a similarity threshold of 10–15% difference in spectral values, and an eight-connection scheme for the neighboring pixels. The stopping criterion was set to a maximum region size of 10% of the total image or a change in the similarity between neighboring pixels of less than 1%. Post-processing with a median 3 × 3 kernel was carried out. Among all of the segmented palm trees, we only selected those specimens that had been previously labelled by the technicians (both healthy and infected), so as to carry on with the analyses.

2.4.2. Pixel Classification

A pixel-based classification was performed using SVM (support vector machine), ANN (artificial neural network), and RF (random forest). These algorithms were considered due to their maturity and developed state for classification procedures [62] and their wide application in vegetation monitoring [12,27].
Pixels belonging to the identified palm trees in the previous segmentation process were classified, and four thematic classes were defined: (i) affected leaves, (ii) healthy leaves, (iii) shadow, and (iv) dates. For selecting the representative pixels of the class affected leaves, both those showing yellowish pigmentation and those with whitish colorations (dry leaves) were considered. The selected number of pixels representative of each thematic class was chosen by seeking the proportionality between the number of selected pixels and the approximate class prevalence in the images [63].
The classification process involved two steps: (i) application of the three ML classifiers so as to choose the best algorithm and (ii) testing.
First, all of the selected pixels were randomly divided, reserving 80% of them to implement and compare the different classifiers (this data group will later be referred to as the training/validation set). The remaining 20% was used to test the classifier selected in the previous step (later called the testing set). For the Barranco El Cercado study area, 12,565 pixels were obtained. The training/validation set comprised 10,052 selected pixels, while the testing test comprised 2513. For Vegaipala, 8280 selected pixels were used, with 6624 for the training/validation set and 1656 for the testing set (Table 2).
A five-fold cross-validation technique with 10 replicates was used to implement the classifiers, and the training/validation set was randomly divided between 80% training and 20% validation. The robustness of the classifiers was assessed and compared by analyzing the confusion matrices using the following metrics: (i) omission error, (ii) commission error, (iii) accuracy [64], (iv) precision, (v) recall, and (vi) F1-score [65,66] (Table 3). The mean values for these metrics for all classes were used as criteria to identify the best algorithm.
Finally, the testing set was used to validate the selected classifier, considering the same metrics (Table 3).

2.5. Palm Disease Probabilistic Classification Modelling

Once the representative pixels of the healthy and affected leaves had been identified for each specimen, the prevalence of the affected leaves was calculated. A simple mathematical operation was performed by dividing the number of pixels classified as affected by the total number of representative leaf pixels (excluding dates and shadows).
Then, a probabilistic classification model was built considering the target variable as the palm health status (with values of 1 for infected specimens and 0 for the healthy ones), and the prevalence of affected leaves as the predictor variable. The same ML algorithms selected for the previous pixel-level classification were tested (SVM, ANN, and RF), and the output of the model was a probability map of any given palm tree being infected (that is, to belong to the infected class).
The 95 labelled palm trees from El Cercado were used to train and validate the model using a five-fold cross-validation technique and ten replicates, with 80% of the palm trees randomly selected for training (76) and 20% for validation (19). The robustness of the algorithms was compared using the metrics in Table 3. The algorithm showing the best validating metrics was used to build the model. The result was tested with the 68 labelled palms in Vegaipala. Building the model with data from Barranco El Cercado and testing them with information from Vegaipala allowed us to use 100% independent data. On the other hand, the more significant number of palms whose health status was previously assessed in the El Cercado resulted in a more robust database for training and validation.
To train, validate, and test the model, we used a threshold of 0.6 probability, considering any given palm tree surpassing that threshold as belonging to the class “infected”, and those presenting values below 0.6 were classified as “healthy”.

3. Results

3.1. Spectral Indices Separability

Figure 4 shows the mean values for the spectral indices obtained for the different leaf regions (healthy, affected, and dry) and their variances.
For all of the indices, healthy leaves had the highest values (>0.3), except for both SIPI, where the opposite occurred, with dry leaves acquiring absolute maximum values of 1.82 and 1.28 for SIPI2 and SIPI, respectively. It is worth highlighting NDVI as the index that obtained the maximum value for healthy leaves (0.74), and it was also the one that showed the most remarkable differences between healthy and affected and dry leaves.
Regarding the results of the J M analysis (Table 4), we found that for the healthy vs. affected pair, NDVI and OSAVI showed the highest separability (0.98 and 0.81, respectively). For the healthy vs. dry pair, NDVI, SIPI2, and SIPI stood out, with the highest separability for the three pairs analyzed, with values of 1.75, 1.95, and 2, respectively. The results for the affected vs. dry were the lowest, demonstrating the difficulty when discriminating between both types of leaves. Only SIPI2 and SIPI, with values of 0.92 and 1.42, respectively, seemed to be close to a potential separability. These results suggest combining dry and affected leaves in the same class, distinguishing them from healthy leaves, and pointing to a synergy between NDVI, SIPI2, and SIPI indices for their use in the segmentation and classification process.

3.2. Palm Tree Segmentation and Pixel-Based Classification

Table 5 shows the metrics obtained for the four-class pixel-level classification within the segmented palm trees selected in both scenes, using the training/validation set. SVM presented the highest scores for all of the metrics in both images. The accuracy for both scenes (0.97 for Vegaipala and 0.98 for El Cercado) stands out, with values around 10% higher than for the other two algorithms and with commission errors (0.05 and 0.04), with values approximately 50% lower than the rest. Therefore, SVM was selected as the most robust classifier for both scenes. The metrics for the testing set are shown in Table 6 and Table 7.
The only metrics with a value below 0.9 were recall for the dates class in both study areas (0.85 for Vegaipala and 0.83 for El Cercado), and for the shadow class in Vegaipala (0.89) and F1-score for dates in El Cercado. It is worth noting the omission errors for these two classes (dates and shadow) in Vegaipala palm trees with an order of magnitude higher than the rest (0.15 and 0.11, respectively), as was found for the dates class in the case of El Cercado (0.17). The misclassifications were also quite balanced, with a higher percentage in the dates and shadow classes, especially in Vegaipala. The results obtained with the testing set confirmed what was found in the average metrics with the training/validation set.
The resulting pixel classifications within each previously selected segmented palm tree in both study areas are presented in Figure 5 and Figure 6. In both images, it is possible to identify female palms by the presence of dates and those with a higher prevalence of affected leaves, especially in the external areas.

3.3. Palm Disease Detection

Table 8 shows the metrics resulting from the construction of the model with the prevalence of affected leaves for the 95 palms of Barranco El Cercado. The predefined threshold criterion of 0.6 probability was applied to assign each palm to the infected class.
The results in Table 8 suggest choosing the RF algorithm to finally build the probabilistic classification model. RF showed the lowest omission and commission errors, with values of 0.12 and 0.14, respectively. Concerning the rest of the metrics (accuracy, precision, recall, and F1-score), RF also presented the highest values, around 15% higher than those of SVM and ANN.
Validation of the model built with the RF algorithm was carried out with all 68 palms labelled in Vegaipala, where 26 specimens were classified as healthy and the remaining 42 were classified as infected. Table 9 shows the metrics for this testing.
As with the training/validation set, the RF model had high predictive capabilities with a precision of 0.93 for the infected palm trees compared with 0.77 for healthy, and an accuracy of 0.87 in both cases. The commission error for the infected class was much lower for the testing set (0.07) than for the mean of the training/validation set (0.14), while the opposite was true for the healthy class, which doubled (0.23) about the same error.
The output of the model expressed the probability of each palm tree being infected, considering a threshold of 0.6. The model identified 23 palms as healthy and 45 as infected (Figure 7).

4. Discussion

Using high-resolution (3.94 cm) UAV multispectral imagery and ML algorithms, a probabilistic classification model was built to detect potential infections in Phoenix canariensis. The spatial resolution was achieved with 60 m altitude drone flights, an optimal flight altitude that has been proven to enhance the biophysical parameters extraction of vegetation [67]. This approach represents the first attempt to identify and detect possible infections on a palm tree scale in the Canary Islands based on spectral response.
There is no clear consensus on which VI is the most appropriate for disease detection, as it may depend on the species studied, their conditions, and the intrinsic characteristics of the data [31]. We proposed eight spectral indices commonly used in the literature [10,12]. Based on a JM analysis, NDVI, SIPI, and SIPI2 were selected for their ability to differentiate between healthy and dry leaves. Other studies also found a good synergy between NDVI and SIPI to identify scab infections in wheat using hyperspectral data and SVM algorithms [68]. In [69], the authors demonstrated the effectiveness of combining these two VIs to study how aphid infestation affects the phenological stages of mustard plants. However, to the best of our knowledge, there are no examples of the concrete combination of NDVI, SIPI, and SIPI2 to feed machine learning algorithms for identifying pests in palm tree groves.
Because of the nature of our in situ data, namely labelling infected and healthy individuals, it was our goal to characterize the prevalence of unpigmented and dry leaves at an individual scale, to later use this information as the predictor variable in our probabilistic classification model. To assess this prevalence at the individual scale, a prior palm tree segmentation step was needed.
Procedures for palm tree detection [66] and individual specimen segmentation [70] based on deep learning techniques are gaining visibility in literature, although these are data demanding [71,72]. Because of the limited number of available specimens captured in our dataset, we considered a region growing algorithm for this step. This methodology allowed for individual palm tree segmentation, although the outcome needed simple manual corrections by visual inspection in some areas. The algorithm struggled to discriminate between different but overlapping palm trees and between other kinds of vegetation. The main reason for this was probably due to the inherent heterogeneity in the spatial distribution of palm trees in their natural habitat and the presence of other types of vegetation with a similar spectral response. Generally, this type of image processing is usually performed on crops [13,73,74,75], whose homogeneous and planned spatial distribution greatly helps segmentation algorithms. However, the complexity increases in natural habitats such as P. canariensis groves in the Canary Islands. Other studies in similar scenarios have had the same problems, to the point of manually segmenting the tree canopies [32,33].
The combination of NDVI, SIPI, and SIPI2 with the SVM classifier outperformed the other algorithms in both study areas, with accuracies of 0.97 and 0.98 for Vegaipala and El Cercado, respectively. These results agree with the findings of [76], where a classification with two classes (trees and background) was performed using NDVI and SIPI among other VIs, and SVM was the best classifier, with an overall accuracy of 0.95. While the authors of other studies have relied on the exclusive use of VIs or even performed dimension-reducing principal component analysis (PCA) [17], we decided to add the selected VIs to the five bands of the Altum Micasense camera. When the VIs and the spectral bands were used together, the accuracy and precision of the classifiers increased. Similar results were obtained in [77], where the authors found that combining spectral bands and VIs improved the classification performance. However, this improvement was only found when an appropriate subset of these indices was selected, to the extent that the overall accuracy decreased when more than four VIs were used, probably caused by redundancies and collinearity in the data. The strongest classifier was also SVM, with an overall accuracy of 0.96. The mentioned potential presence of collinearity in the data may be the reason behind the better performance of SVM against other tested algorithms, namely RF, known to outperform other algorithms in several studies, but also to be particularly sensitive to non-independence in the training data [78]. Selecting five-fold cross-validation allowed for a trade-off between computational cost and accuracy. While small values of k may hinder the robustness of the classification [79], optimal values of this parameter may be found for different scenarios [80]. In this particular study, k = 5 was the threshold upon which the computational cost of the analyses dramatically raised, without significantly improving accuracy. A data split of 80:20 was selected due to its common practice in the literature [81]. In addition, the relatively large number of available pixels to train and validate the classifications allowed us to maintain a substantial number of validating pixels, even though a relatively low percentage (20%) was defined for the validation subset.
Because of the relatively low spectral separability between affected (with different levels of depigmentation) and dry leaves, we decided to combine these two classes to carry out the image classification. Other studies also found that combining different levels of affection under one class resulted in a more robust classification. For example, in [32], an initial classification was carried out with four classes, between (i) asymptomatic, (ii) less than 50% defoliated, (iii) more than 50% defoliated and (iv) dead trees, and finally finding that the aggregation of classes depicting affected leaves improved the accuracy of the classification from 0.67 to 0.91.
The three ML algorithms tested to build the probabilistic classification model have been previously proposed for similar purposes. SVM is an algorithm that successfully deals with limited training data, outperforming other algorithms in disease detection [13] and it is widely used for this type of study [43]. On the other hand, ANN stands out for its usefulness in complex scenarios [44], such as ours. However, in our study, RF was the algorithm of choice for constructing the probabilistic classification model, with a mean accuracy of 0.87 and a precision of 0.85. These findings agree with other studies that employed similar methodologies in natural habitats [33]. In this case, the authors pointed out RF as the algorithm with the best accuracies, with values close to 0.84 for predicting tree mortality.
When identifying infected individuals, the errors of commission were significantly lower than for healthy individuals, and the precision and F1-score were higher. The selection of a threshold value of 0.6 likely influenced this result. However, this threshold allowed us to find a trade-off between identifying healthy and diseased specimens. In this way, we prioritized obtaining greater accuracy for identifying infected palm trees, while seeking to reduce errors of commission, considering it more important to state with certainty that the palms identified as infected were indeed infected.

5. Conclusions

The probabilistic classification model developed, based on the machine learning RF algorithm, is an efficient tool for identifying infected palm tree specimens from multispectral information derived from UAV onboard sensors. This tool showed performances similar, and even superior in some cases, to that of more complex and data-demanding techniques.
The model resulted in the identification of 26 healthy palms for the study area in Vegaipala, while 42 were found to be infected, representing a prevalence of approximately 62%.
Collecting new images and in situ data will allow, on the one hand, to further validate the proposed model and to construct more complex models based on DL architecture, such as Mask R-CNN. In addition, studying the palm groves at different times of the year will broaden our knowledge of the seasonal variations of P. canariensis.
The developed algorithms for palm tree segmentation, pixel classification within segmented palm trees, and probabilistic classification could be applied to new scenarios, considering a transfer learning procedure. This will imply the possibility of enhancing future phytosanitary treatment without the need for further in situ labelled data, or user-defined selection of pixels for classification, potentially significantly reducing costs.

Author Contributions

Conceptualization, E.C. and M.A.; formal analysis, E.C., M.A., J.A.M.-R., P.A.H.-L. and J.A.R.-C.; funding acquisition, M.A. and J.A.R.-C.; methodology, E.C. and M.A.; software, E.C., M.A., J.A.M.-R. and P.A.H.-L.; validation, E.C., M.A. and J.A.R.-C.; writing—original draft, E.C., M.A., J.A.M.-R., P.A.H.-L. and J.A.R.-C.; writing—review and editing, E.C., M.A., J.A.M.-R., P.A.H.-L. and J.A.R.-C. All authors have read and agreed to the published version of the manuscript.

Funding

This study is part of the Project Guarapo (Conservation and management of Macaronesian island palm groves through sustainable use) (MAC2/4.6d/230) of the INTERREG V-A Spain-Portugal Cooperation Programme MAC (Madeira-Azores-Canary Islands) 2014–2020, co-financed by ERDF (European Regional Development Fund).

Data Availability Statement

The data presented in this study are available upon request from the corresponding author. The data are not publicly available due to privacy issues.

Acknowledgments

We are grateful for the collaboration of the technicians of the public company Gestión del Medio Rural de Canarias, S.A.U. (GMR Canarias) for the identification and diagnosis of the palm trees in both study areas.

Conflicts of Interest

The authors declare no conflict of interest.

References

  1. Baiser, B.; Olden, J.D.; Record, S.; Lockwood, J.L.; McKinney, M.L. Pattern and Process of Biotic Homogenization in the New Pangaea. Proc. R. Soc. B Biol. Sci. 2012, 279, 4772–4777. [Google Scholar] [CrossRef]
  2. Clavel, J.; Julliard, R.; Devictor, V. Worldwide Decline of Specialist Species: Toward a Global Functional Homogenization? Front. Ecol. Environ. 2011, 9, 222–228. [Google Scholar] [CrossRef] [Green Version]
  3. Bebber, D.P.; Ramotowski, M.A.T.; Gurr, S.J. Crop Pests and Pathogens Move Polewards in a Warming World. Nat. Clim. Chang. 2013, 3, 985–988. [Google Scholar] [CrossRef]
  4. Anderson, P.K.; Cunningham, A.A.; Patel, N.G.; Morales, F.J.; Epstein, P.R.; Daszak, P. Emerging Infectious Diseases of Plants: Pathogen Pollution, Climate Change and Agrotechnology Drivers. Trends Ecol. Evol. 2004, 19, 535–544. [Google Scholar] [CrossRef]
  5. Bebber, D.P.; Holmes, T.; Gurr, S.J. The Global Spread of Crop Pests and Pathogens. Glob. Ecol. Biogeogr. 2014, 23, 1398–1407. [Google Scholar] [CrossRef]
  6. Veron, S.; Mouchet, M.; Govaerts, R.; Haevermans, T.; Pellens, R. Vulnerability to Climate Change of Islands Worldwide and Its Impact on the Tree of Life. Sci. Rep. 2019, 9, 14471. [Google Scholar] [CrossRef] [PubMed] [Green Version]
  7. FAO. Proceedings of the Scientific Consultation and High-Level Meeting on Red Palm Weevil Management, Rome, Italy, 29–31 March 2017; FAO: Rome, Italy, 2019; p. 200. [Google Scholar]
  8. Sosa, P.A.; Saro, I.; Johnson, D.; Obón, C.; Alcaraz, F.; Rivera, D. Biodiversity and Conservation of Phoenix Canariensis: A Review. Biodivers. Conserv. 2021, 30, 275–293. [Google Scholar] [CrossRef]
  9. Bock, C.H.; Parker, P.E.; Cook, A.Z.; Gottwald, T.R. Visual Rating and the Use of Image Analysis for Assessing Different Symptoms of Citrus Canker on Grapefruit Leaves. Plant Dis. 2008, 92, 530–541. [Google Scholar] [CrossRef] [PubMed] [Green Version]
  10. Steddom, K.; Bredehoeft, M.W.; Khan, M.; Rush, C.M. Comparison of Visual and Multispectral Radiometric Disease Evaluations of Cercospora Leaf Spot of Sugar Beet. Plant Dis. 2005, 89, 153–158. [Google Scholar] [CrossRef] [Green Version]
  11. Daniya, T.; Vigneshwari, S. A Review on Machine Learning Techniques for Rice Plant Disease Detection in Agricultural Research. Int. J. Adv. Sci. Technol. 2019, 28, 49–62. [Google Scholar]
  12. de Castro, A.I.; Shi, Y.; Maja, J.M.; Peña, J.M. UAVs for Vegetation Monitoring: Overview and Recent Scientific Contributions. Remote Sens. 2021, 13, 2139. [Google Scholar] [CrossRef]
  13. Zhang, J.; Huang, Y.; Pu, R.; Gonzalez-Moreno, P.; Yuan, L.; Wu, K.; Huang, W. Monitoring Plant Diseases and Pests through Remote Sensing Technology: A Review. Comput. Electron. Agric. 2019, 165, 104943. [Google Scholar] [CrossRef]
  14. Neupane, K.; Baysal-Gurel, F. Automatic Identification and Monitoring of Plant Diseases Using Unmanned Aerial Vehicles: A Review. Remote Sens. 2021, 13, 3841. [Google Scholar] [CrossRef]
  15. Barbedo, J.G.A. A Review on the Use of Unmanned Aerial Vehicles and Imaging Sensors for Monitoring and Assessing Plant Stresses. Drones 2019, 3, 40. [Google Scholar] [CrossRef] [Green Version]
  16. Anderson, K.; Gaston, K.J. Lightweight Unmanned Aerial Vehicles Will Revolutionize Spatial Ecology. Front. Ecol. Environ. 2013, 11, 138–146. [Google Scholar] [CrossRef] [PubMed] [Green Version]
  17. Gomez Selvaraj, M.; Vergara, A.; Montenegro, F.; Alonso Ruiz, H.; Safari, N.; Raymaekers, D.; Ocimati, W.; Ntamwira, J.; Tits, L.; Omondi, A.B.; et al. Detection of Banana Plants and Their Major Diseases through Aerial Images and Machine Learning Methods: A Case Study in DR Congo and Republic of Benin. ISPRS J. Photogramm. Remote Sens. 2020, 169, 110–124. [Google Scholar] [CrossRef]
  18. Nomura, K.; Mitchard, E.T.A. More than Meets the Eye: Using Sentinel-2 to Map Small Plantations in Complex Forest Landscapes. Remote Sens. 2018, 10, 1693. [Google Scholar] [CrossRef] [Green Version]
  19. Maimaitijiang, M.; Sagan, V.; Sidike, P.; Daloye, A.M.; Erkbol, H.; Fritschi, F.B. Crop Monitoring Using Satellite/UAV Data Fusion and Machine Learning. Remote Sens. 2020, 12, 1357. [Google Scholar] [CrossRef]
  20. Sprott, A.H.; Piwowar, J.M. How to Recognize Different Types of Trees from Quite a Long Way Away: Combining UAV and Spaceborne Imagery for Stand-Level Tree Species Identification. J. Unmanned Veh. Syst. 2021, 9, 166–181. [Google Scholar] [CrossRef]
  21. Di Gennaro, S.F.; Battiston, E.; Marco, S.D.I.; Matese, A.; Nocentini, M.; Palliotti, A.; Mugnai, L.; Gennaro, S.F.D.I.; Battiston, E.; Marco, S.D.I.; et al. Unmanned Aerial Vehicle (UAV)-Based Remote Sensing to Monitor Grapevine Leaf Stripe Disease within a Vineyard Affected by Esca Complex. Phytopathol. Mediterr. 2016, 55, 262–275. Available online: https://www.jstor.org/stable/44809332 (accessed on 17 July 2023).
  22. Dash, J.P.; Watt, M.S.; Pearse, G.D.; Heaphy, M.; Dungey, H.S. Assessing Very High Resolution UAV Imagery for Monitoring Forest Health during a Simulated Disease Outbreak. ISPRS J. Photogramm. Remote Sens. 2017, 131, 1–14. [Google Scholar] [CrossRef]
  23. Klouček, T.; Komárek, J.; Surový, P.; Hrach, K.; Janata, P.; Vašíček, B. The Use of UAV Mounted Sensors for Precise Detection of Bark Beetle Infestation. Remote Sens. 2019, 11, 1561. [Google Scholar] [CrossRef] [Green Version]
  24. Sandler, H.A. Weed Management in Cranberries: A Historical Perspective and a Look to the Future. Agriculture 2018, 8, 138. [Google Scholar] [CrossRef] [Green Version]
  25. Khokthong, W.; Zemp, D.C.; Irawan, B.; Sundawati, L.; Kreft, H.; Hölscher, D. Drone-Based Assessment of Canopy Cover for Analyzing Tree Mortality in an Oil Palm Agroforest. Front. For. Glob. Chang. 2019, 2, 12. [Google Scholar] [CrossRef] [Green Version]
  26. Moghadam, P.; Ward, D.; Goan, E.; Jayawardena, S.; Sikka, P.; Hernandez, E. Plant Disease Detection Using Hyperspectral Imaging. In Proceedings of the 2017 International Conference on Digital Image Computing: Techniques and Applications (DICTA), Sydney, Australia, 29 November–1 December 2017; pp. 1–8. [Google Scholar] [CrossRef]
  27. Liakos, K.G.; Busato, P.; Moshou, D.; Pearson, S.; Bochtis, D. Machine Learning in Agriculture: A Review. Sensors 2018, 18, 2674. [Google Scholar] [CrossRef] [PubMed] [Green Version]
  28. Kerkech, M.; Hafiane, A.; Canals, R. VddNet: Vine Disease Detection Network Based on Multispectral Images and Depth Map. Remote Sens. 2020, 12, 3305. [Google Scholar] [CrossRef]
  29. Kerkech, M.; Hafiane, A.; Canals, R. Vine Disease Detection in UAV Multispectral Images Using Optimized Image Registration and Deep Learning Segmentation Approach. Comput. Electron. Agric. 2020, 174, 105446. [Google Scholar] [CrossRef]
  30. Amarasingam, N.; Gonzalez, F.; Salgadoe, A.S.A.; Sandino, J.; Powell, K. Detection of White Leaf Disease in Sugarcane Crops Using UAV-Derived RGB Imagery with Existing Deep Learning Models. Remote Sens. 2022, 14, 6137. [Google Scholar] [CrossRef]
  31. Behmann, J.; Steinrücken, J.; Plümer, L. Detection of Early Plant Stress Responses in Hyperspectral Images. ISPRS J. Photogramm. Remote Sens. 2014, 93, 98–111. [Google Scholar] [CrossRef]
  32. Guerra-Hernández, J.; Díaz-Varela, R.A.; Ávarez-González, J.G.; Rodríguez-González, P.M. Assessing a Novel Modelling Approach with High Resolution UAV Imagery for Monitoring Health Status in Priority Riparian Forests. For. Ecosyst. 2021, 8, 61. [Google Scholar] [CrossRef]
  33. Bergmüller, K.O.; Vanderwel, M.C. Predicting Tree Mortality Using Spectral Indices Derived from Multispectral UAV Imagery. Remote Sens. 2022, 14, 2195. [Google Scholar] [CrossRef]
  34. Ozguven, M.M.; Adem, K. Automatic Detection and Classification of Leaf Spot Disease in Sugar Beet Using Deep Learning Algorithms. Phys. A Stat. Mech. Its Appl. 2019, 535, 122537. [Google Scholar] [CrossRef]
  35. Mohanty, S.P.; Hughes, D.P.; Salathé, M. Using Deep Learning for Image-Based Plant Disease Detection. Front. Plant Sci. 2016, 7, 1419. [Google Scholar] [CrossRef] [Green Version]
  36. Pantazi, X.E.; Moshou, D.; Tamouridou, A.A. Automated Leaf Disease Detection in Different Crop Species through Image Features Analysis and One Class Classifiers. Comput. Electron. Agric. 2019, 156, 96–104. [Google Scholar] [CrossRef]
  37. Rasmussen, J.; Nielsen, J.; Garcia-Ruiz, F.; Christensen, S.; Streibig, J.C. Potential Uses of Small Unmanned Aircraft Systems (UAS) in Weed Research. Weed Res. 2013, 53, 242–248. [Google Scholar] [CrossRef]
  38. Sankaran, S.; Mishra, A.; Maja, J.M.; Ehsani, R. Visible-near Infrared Spectroscopy for Detection of Huanglongbing in Citrus Orchards. Comput. Electron. Agric. 2011, 77, 127–134. [Google Scholar] [CrossRef]
  39. Chung, C.L.; Huang, K.J.; Chen, S.Y.; Lai, M.H.; Chen, Y.C.; Kuo, Y.F. Detecting Bakanae Disease in Rice Seedlings by Machine Vision. Comput. Electron. Agric. 2016, 121, 404–411. [Google Scholar] [CrossRef]
  40. Römer, C.; Bürling, K.; Hunsche, M.; Rumpf, T.; Noga, G.; Plümer, L. Robust Fitting of Fluorescence Spectra for Pre-Symptomatic Wheat Leaf Rust Detection with Support Vector Machines. Comput. Electron. Agric. 2011, 79, 180–188. [Google Scholar] [CrossRef]
  41. Panigrahi, K.P.; Das, H.; Sahoo, A.K.; Moharana, S.C. Maize Leaf Disease Detection and Classification Using Machine Learning Algorithms; Springer: Singapore, 2020; Volume 1119, ISBN 9789811524134. [Google Scholar]
  42. Ellsäßer, F.; Röll, A.; Ahongshangbam, J.; Waite, P.A.; Hendrayanto; Schuldt, B.; Hölscher, D. Predicting Tree Sap Flux and Stomatal Conductance from Drone-Recorded Surface Temperatures in a Mixed Agroforestry System-a Machine Learning Approach. Remote Sens. 2020, 12, 4070. [Google Scholar] [CrossRef]
  43. Khan, N.; Kamaruddin, M.A.; Sheikh, U.U.; Yusup, Y.; Bakht, M.P. Oil Palm and Machine Learning: Reviewing One Decade of Ideas, Innovations, Applications, and Gaps. Agriculture 2021, 11, 832. [Google Scholar] [CrossRef]
  44. Liu, Z.Y.; Wu, H.F.; Huang, J.F. Application of Neural Networks to Discriminate Fungal Infection Levels in Rice Panicles Using Hyperspectral Reflectance and Principal Components Analysis. Comput. Electron. Agric. 2010, 72, 99–106. [Google Scholar] [CrossRef]
  45. Yuan, L.; Huang, Y.; Loraamm, R.W.; Nie, C.; Wang, J.; Zhang, J. Spectral Analysis of Winter Wheat Leaves for Detection and Differentiation of Diseases and Insects. Field Crop. Res. 2014, 156, 199–207. [Google Scholar] [CrossRef] [Green Version]
  46. Wang, D.; Ram, M.S.; Dowell, F.E. Classification of Damaged Soybean Seeds Using Near-Infrared Spectroscopy. Am. Soc. Agric. Eng. 2002, 45, 1943–1948. [Google Scholar] [CrossRef]
  47. Shah, N.; Jain, S. Detection of Disease in Cotton Leaf Using Artificial Neural Network. In Proceedings of the 2019 Amity International Conference on Artificial Intelligence (AICAI), Dubai, United Arab Emirates, 4–6 February 2019; pp. 473–476. [Google Scholar] [CrossRef]
  48. Golomb, O.; Alchanatis, V.; Cohen, Y.; Levin, N.; Cohen, Y.; Soroker, V. Detection of Red Palm Weevil Infected Trees Using Thermal Imaging. In Precision Agriculture 2015—Papers Presented at the 10th European Conference on Precision Agriculture, ECPA 2015; Wageningen Academic Publishers: Wageningen, The Netherlands, 2015; pp. 643–650. [Google Scholar] [CrossRef]
  49. Cammalleri, C.; Capodici, F.; Ciraolo, G.; Filardo, G.; La Loggia, G.; Maltese, A. The Rhynchophorus Ferruginous Disease of Phoenix Canariensis: Early Detection through Proximity Thermal Sensing. In Proceedings of the Volume 8174, Remote Sensing for Agriculture, Ecosystems, and Hydrology XIII, Prague, Czech Republic, 19–21 September 2011; p. 81741M. [Google Scholar] [CrossRef]
  50. Casas, E.; Martín-García, L.; Hernández-Leal, P.; Arbelo, M. Species Distribution Models at Regional Scale: Cymodocea Nodosa Seagrasses. Remote Sens. 2022, 14, 4334. [Google Scholar] [CrossRef]
  51. Azorin-Molina, C.; Menendez, M.; McVicar, T.R.; Acevedo, A.; Vicente-Serrano, S.M.; Cuevas, E.; Minola, L.; Chen, D. Wind Speed Variability over the Canary Islands, 1948–2014: Focusing on Trend Differences at the Land–Ocean Interface and below–above the Trade-Wind Inversion Layer. Clim. Dyn. 2018, 50, 4061–4081. [Google Scholar] [CrossRef] [Green Version]
  52. Ye, X.; Sakai, K.; Asada, S.I.; Sasao, A. Use of Airborne Multispectral Imagery to Discriminate and Map Weed Infestations in a Citrus Orchard: Research Paper. Weed Biol. Manag. 2007, 7, 23–30. [Google Scholar] [CrossRef]
  53. Gitelson, A.A.; Merzlyak, M.N.; Lichtenthaler, H.K. Detection of Red Edge Position and Chlorophyll Content by Reflectance Measurements near 700 Nm. J. Plant Physiol. 1996, 148, 501–508. [Google Scholar] [CrossRef]
  54. Scroll, P.; For, D. Remote Estimation of Chlorophyll Content in Higher Plant Leaves. Int. J. Remote Sens. 1997, 18, 2691–2697. [Google Scholar]
  55. Rouse, J.W.; Haas, R.H.; Schell, J.A.; Deering, D.W.; Harlan, J.C. Monitoring the Vernal Advancements and Retrogradation of Natural Vegetation; Final Report; NASA/GSFC: Greenbelt, MD, USA, 1974; pp. 1–137. [Google Scholar]
  56. Blackburn, G.A. Spectral Indices for Estimating Photosynthetic Pigment Concentrations: A Test Using Senescent Tree Leaves. Int. J. Remote Sens. 1998, 19, 657–675. [Google Scholar] [CrossRef]
  57. Rondeaux, G.; Steven, M.; Baret, F. Optimization of Soil-Adjusted Vegetation Indices. Remote Sens. Environ. 1996, 55, 95–107. [Google Scholar] [CrossRef]
  58. Sulik, J.J.; Long, D.S. Spectral Considerations for Modeling Yield of Canola. Remote Sens. Environ. 2016, 184, 161–174. [Google Scholar] [CrossRef]
  59. Peñuelas, J.; Gamon, J.A.; Fredeen, A.L.; Merino, J.; Field, C.B. Reflectance Indices Associated with Physiological Changes in Nitrogen- and Water-Limited Sunflower Leaves. Remote Sens. Environ. 1994, 48, 135–146. [Google Scholar] [CrossRef]
  60. Richards, J.A. Remote Sensing Digital Image Analysis: An Introduction; Springer: Berlin/Heidelberg, Germany, 2013; ISBN 978-3-642-30062-2. [Google Scholar]
  61. Mehnert, A.; Jackway, P. An Improved Seeded Region Growing Algorithm. Pattern Recognit. Lett. 1997, 18, 1065–1071. [Google Scholar] [CrossRef]
  62. Maxwell, A.E.; Warner, T.A.; Fang, F. Implementation of Machine-Learning Classification in Remote Sensing: An Applied Review. Int. J. Remote Sens. 2018, 39, 2784–2817. [Google Scholar] [CrossRef] [Green Version]
  63. Olofsson, P.; Foody, G.M.; Herold, M.; Stehman, S.V.; Woodcock, C.E.; Wulder, M.A. Good Practices for Estimating Area and Assessing Accuracy of Land Change. Remote Sens. Environ. 2014, 148, 42–57. [Google Scholar] [CrossRef]
  64. Janssen, L.L.F.; van der Wel, F.J.M. Accuracy Assessment of Satellite Derived Land-Cover Data: A Review. Photogramm. Eng. Remote Sens. 1994, 60, 419–426. [Google Scholar]
  65. Mao, J.; Tian, W.; Li, P.; Wei, T.; Liang, Z. Phishing-Alarm: Robust and Efficient Phishing Detection via Page Component Similarity. IEEE Access 2017, 5, 17020–17030. [Google Scholar] [CrossRef]
  66. Jintasuttisak, T.; Edirisinghe, E.; Elbattay, A. Deep Neural Network Based Date Palm Tree Detection in Drone Imagery. Comput. Electron. Agric. 2022, 192, 106560. [Google Scholar] [CrossRef]
  67. Avtar, R.; Suab, S.A.; Syukur, M.S.; Korom, A.; Umarhadi, D.A.; Yunus, A.P. Assessing the Influence of UAV Altitude on Extracted Biophysical Parameters of Young Oil Palm. Remote Sens. 2020, 12, 3030. [Google Scholar] [CrossRef]
  68. Huang, L.; Zhang, H.; Ruan, C.; Huang, W.; Hu, T.; Zhao, J. Detection of Scab in Wheat Ears Using in Situ Hyperspectral Data and Support Vector Machine Optimized by Genetic Algorithm. Int. J. Agric. Biol. Eng. 2020, 13, 182–188. [Google Scholar] [CrossRef]
  69. Kumar, J.; Vashisth, A.; Sehgal, V.K.; Gupta, V.K. Assessment of Aphid Infestation in Mustard by Hyperspectral Remote Sensing. J. Indian Soc. Remote Sens. 2013, 41, 83–90. [Google Scholar] [CrossRef]
  70. Ferreira, M.P.; Almeida, D.R.A.d.; Papa, D.d.A.; Minervino, J.B.S.; Veras, H.F.P.; Formighieri, A.; Santos, C.A.N.; Ferreira, M.A.D.; Figueiredo, E.O.; Ferreira, E.J.L. Individual Tree Detection and Species Classification of Amazonian Palms Using UAV Images and Deep Learning. For. Ecol. Manag. 2020, 475, 118397. [Google Scholar] [CrossRef]
  71. Barros, T.; Conde, P.; Gonçalves, G.; Premebida, C.; Monteiro, M.; Ferreira, C.S.S.; Nunes, U.J. Multispectral Vineyard Segmentation: A Deep Learning Comparison Study. Comput. Electron. Agric. 2022, 195, 106782. [Google Scholar] [CrossRef]
  72. Ferentinos, K.P. Deep Learning Models for Plant Disease Detection and Diagnosis. Comput. Electron. Agric. 2018, 145, 311–318. [Google Scholar] [CrossRef]
  73. Sharma, A.; Jain, A.; Gupta, P.; Chowdary, V. Machine Learning Applications for Precision Agriculture: A Comprehensive Review. IEEE Access 2021, 9, 4843–4873. [Google Scholar] [CrossRef]
  74. Yudhana, A.; Umar, R.; Ayudewi, F.M. The Monitoring of Corn Sprouts Growth Using the Region Growing Methods. J. Phys. Conf. Ser. 2019, 1373, 012054. [Google Scholar] [CrossRef]
  75. Thakur, P.S.; Khanna, P.; Sheorey, T.; Ojha, A. Trends in Vision-Based Machine Learning Techniques for Plant Disease Identification: A Systematic Review. Expert Syst. Appl. 2022, 208, 118117. [Google Scholar] [CrossRef]
  76. DadrasJavan, F.; Samadzadegan, F.; Seyed Pourazar, S.H.; Fazeli, H. UAV-Based Multispectral Imagery for Fast Citrus Greening Detection. J. Plant Dis. Prot. 2019, 126, 307–318. [Google Scholar] [CrossRef]
  77. Zhang, Y.; Yang, W.; Sun, Y.; Chang, C.; Yu, J.; Zhang, W. Fusion of Multispectral Aerial Imagery and Vegetation Indices for Machine Learning-Based Ground Classification. Remote Sens. 2021, 13, 1411. [Google Scholar] [CrossRef]
  78. Belgiu, M.; Drăgu, L. Random Forest in Remote Sensing: A Review of Applications and Future Directions. ISPRS J. Photogramm. Remote Sens. 2016, 114, 24–31. [Google Scholar] [CrossRef]
  79. Raschka, S. Model Evaluation, Model Selection, and Algorithm Selection in Machine Learning. arXiv 2018, arXiv:1811.12808. [Google Scholar]
  80. Bengio, Y.; Grandvalet, Y. No Unbiased Estimator of the Variance of K-Fold Cross-Validation. J. Mach. Learn. Res. 2004, 5, 1089–1105. [Google Scholar]
  81. Lyons, M.B.; Keith, D.A.; Phinn, S.R.; Mason, T.J.; Elith, J. A Comparison of Resampling Methods for Remote Sensing Classification and Accuracy Assessment. Remote Sens. Environ. 2018, 208, 145–153. [Google Scholar] [CrossRef]
Figure 1. Working flow diagram.
Remotesensing 15 03584 g001
Figure 2. Study areas: red and green triangles depict infected and healthy palm tree locations, respectively.
Remotesensing 15 03584 g002
Figure 3. Relative spectral response curves of the Altum Micasense bands.
Remotesensing 15 03584 g003
Figure 4. Values of the spectral vegetation indices derived from the reflectance obtained from the selected pixels (Altum images) for the three types of leaves. Black lines depict the ±variance.
Remotesensing 15 03584 g004
Figure 5. Classified palm trees in Vegaipala.
Remotesensing 15 03584 g005
Figure 6. Classified palm trees in Barranco El Cercado.
Remotesensing 15 03584 g006
Figure 7. Projection of the model describing probabilities of affectation.
Remotesensing 15 03584 g007
Table 1. Proposed spectral indices.
IndexNameFormula *
BNDVIBlue Normalized Difference Vegetation Index(NIR − B)/(NIR + B)
GNDVIGreen Normalized Difference Vegetation Index(NIR − G)/(NIR + G)
NDRENormalized Difference Red Edge Index(NIR − Re)/(NIR + Re)
NDVINormalized Difference Vegetation Index(NIR − R)/(NIR + R)
SIPI 2Structure Insensitive Pigment Index 2(NIR − G)/(NIR – R)
OSAVIOptimized Soil-Adjusted Vegetation Index(NIR − R)/(NIR + R + 0.16)
NDYINormalized Difference Yellowness Index(G − B)/(G + B)
SIPIStructure Insensitive Pigment Index(NIR − B/NIR − R) − 1
* B (blue) = B1; G (green) = B2; R (red) = B3; Re (red edge) = B4, NIR (near infrared) = B5; Bi = Altum Micasense bands.
Table 2. Selected pixels for image classification.
VegaipalaBarranco El Cercado
Training/ValidationTestTraining/ValidationTest
Affected12923231956489
Healthy315678947881197
Shadow15123782292573
Dates6641661016254
Table 3. Formulas for the calculation of the metrics.
MetricFormula
True PositivesTP: Correctly classified positive instances
True NegativesTN: Correctly classified negative instances
False PositivesFP: Incorrectly classified positive instances
False NegativesFN: Incorrectly classified negative instances.
Omission ErrorFN/(FN + TN)
Commission ErrorFP/(FP + TP)
Accuracy(TP + TN)/(TP + TN + FP + FN)
PrecisionTP/(TP + FP)
RecallTP/(TP + FN)
F1-Score(2* × Precision × Recall)/(Precision + Recall)
Table 4. Jeffries-Matusita analysis results.
Healthy vs. AffectedHealthy vs. DryAffected vs. Dry
BNDVI0.640.960.04
GNDVI0.330.390.11
NDRE0.240.270.04
NDVI0.981.750.13
SIPI20.371.950.92
OSAVI0.811.520.09
NDYI0.651.400.16
SIPI0.622.001.42
Table 5. Mean values for validating the metrics for all of the classes in both scenes.
VegaipalaBarranco El Cercado
RFSVMANNRFSVMANN
Omission Error0.080.060.090.090.070.11
Commission Error0.090.050.100.100.040.09
Accuracy0.830.970.860.860.980.89
Precision0.890.950.920.870.960.91
Recall0.910.920.880.890.930.88
F1-Score0.870.920.890.910.940.87
Table 6. Testing metrics for Vegaipala.
Vegaipala
ClassTPTNFPFNO. ErrorC. ErrorAccuracyPrecisionRecallF1-Score
Affected30712621680.030.050.980.950.970.96
Healthy7398305060.010.060.970.940.990.96
Shadow366120312460.110.030.960.970.890.93
Dates15714129270.150.050.980.950.850.90
Table 7. Testing metrics for Barranco El Cercado.
Barranco El Cercado
ClassTPTNFPFNO. ErrorC. ErrorAccuracyPrecisionRecallF1-Score
Affected472192617350.070.030.980.970.930.95
Healthy1137126160160.010.050.970.930.990.97
Shadow547185126130.020.050.980.940.980.97
Dates242215612510.170.050.970.920.830.88
Table 8. Mean values for validating metrics for the machine learning algorithms considered.
RFSVMANN
Omission error0.120.160.18
Commission error0.140.190.17
Accuracy0.830.690.71
Precision0.890.720.76
Recall0.910.770.73
F1-Score0.880.740.78
Table 9. RF probabilistic classification model testing metrics.
ClassTPTNFPFNO. ErrorC. ErrorAccuracyPrecisionRecallF1-Score
Infected3920360.130.070.870.930.870.90
Healthy2039630.130.230.870.770.870.82
Disclaimer/Publisher’s Note: The statements, opinions and data contained in all publications are solely those of the individual author(s) and contributor(s) and not of MDPI and/or the editor(s). MDPI and/or the editor(s) disclaim responsibility for any injury to people or property resulting from any ideas, methods, instructions or products referred to in the content.

