Article

Coupling the Relationship between Land Subsidence and Groundwater Level, Ground Fissures in Xi’an City Using Multi-Orbit and Multi-Temporal InSAR

1
School of Geosciences and Info-Physics, Central South University, Changsha 410083, China
2
The Central Southern China Electric Power Design Institute, Wuhan 430071, China
3
The Xi’an Institute of Surveying and Mapping, Xi’an 710054, China
4
Hunan Geological Disaster Monitoring, Early Warning and Emergency Rescue Engineering Technology Research Center, Changsha 410004, China
5
The College of Geographic Sciences, Hunan Normal University, Changsha 410081, China
*
Author to whom correspondence should be addressed.
Remote Sens. 2023, 15(14), 3567; https://doi.org/10.3390/rs15143567
Submission received: 5 July 2023 / Revised: 14 July 2023 / Accepted: 14 July 2023 / Published: 16 July 2023

Abstract

:
The Xi’an region of China has been suffering from groundwater depletion, ground fissure hazards, and surface subsidence for a long time. Due to the complex tectonics and frequent human and natural activities, land deformation in the region is aggravated, posing a threat to infrastructure and human life. This study adopted the multi-orbit and multi-temporal InSAR technology to measure multi-dimensional displacements and time-series displacements in Xi’an City. Through the multi-dimensional deformation verification, it was found that the control of groundwater flow direction by ground fissures is the cause of horizontal deformation. On the contrary, the flow direction of groundwater from west to east was inferred using multi-dimensional deformation. Further analysis was performed by calculating the deformation gradient of the cumulative deformation to obtain differential land subsidence and angular distortions, and it was quantitatively determined that the threshold for the generation of ground fissures caused by differential subsidence is 1/500. Then, through the mutual verification of the time series data and the groundwater level, a positive correlation was obtained. However, due to the inconsistent geological conditions and soil layers at the monitoring positions of Well 2 and Well 3, the lag time was 64 days and 4 days, respectively. Finally, the relationship between the surface deformation and the groundwater in the sustained uplift areas was explored. The Well 1 groundwater-level data with a monitoring period of 22 years and the corresponding monitoring points’ time series data were modeled; it was concluded that, in the future, the groundwater level will continue to rise and surface deformation will mainly increase, without a slowing trend. Therefore, research on the impact of surface uplift on infrastructure should be strengthened. By quantifying the relationship between land subsidence, ground fissures, and the groundwater level in Xi’an, the results of this study provide a reference for groundwater monitoring and management.

1. Introduction

Land subsidence caused by groundwater overexploitation has become a global problem. As a geological environmental disaster, land subsidence has affected at least 200 regions worldwide in the past century due to its harmfulness, wide range of impact, and long duration [1]. These areas include not only the California Basin [2,3,4,5], the Mexico Basin [6,7,8,9], the Iran Basin [10,11], Indonesia [12], and Egypt [13], but also include in the North China Plain [14,15,16,17] and the Fenwei Basin [18,19]. Especially in large cities, such as Beijing [20,21], Shanghai [22], Suzhou [23], Wuhan [24], and Xi’an [25], land subsidence is more severe. The rapid growth of the population and increasing exploitation of groundwater resources aggravate the existing phenomenon of land subsidence, which can lead to surface cracking, uneven settlement, tilting of buildings, and damage to other urban infrastructure.
Due to human activities and complicated geological conditions, Xi’an has suffered a huge impact from land subsidence in the past 60 years. According to historical data during 1960–1996, the maximum subsidence reached 2.6 m, and according to existing InSAR monitoring results, the maximum subsidence also reached 1 m between 1996 and 2021 [25], with a total surface subsidence of 3.6 m. This is mainly due to excessive groundwater exploitation and urban development and construction. Because there is less rainfall in the Xi’an region, it is difficult to meet the demand for groundwater recharge, leading to the depletion of its groundwater aquifer system and ultimately exacerbating surface subsidence. Long-term subsidence will lead to surface fractures at the discontinuities of aquifers or geological soil layers, especially in Xi’an, where special tectonic ground fissures have formed. According to a previous geological survey report, there were 10 ground fissures before 2000, and 3 new ones developed between 2000 and 2001; this finding is consistent with the intensification seen in surface subsidence. Ground fissures may cause significant damage to infrastructure, such as buildings, transportation facilities, and underground pipelines.
Interferometric synthetic aperture radar (InSAR) is one of the most effective techniques for studying surface deformation. Previous research has proven that InSAR can be used to study the relationship between land deformation and changes in the groundwater level [26,27,28]. Combining the groundwater level with InSAR deformation monitoring can help researchers understand the compaction phenomenon of aquifers related to groundwater overextraction [29,30,31]. Many of the existing studies were conducted in the Xi’an region.
Although previous studies have successfully measured Xi’an’s subsidence using techniques such as MT-InSAR, they have neglected the influence of faults or ground fissures. Land subsidence is not only vertical deformation, but also presents three-dimensional deformation. This phenomenon also occurs in California due to the obstruction of groundwater flow by faults, resulting in three-dimensional deformation [32]. In the presence of ground fissures or faults, multi-dimensional deformation monitoring is required in order to obtain real surface deformation.
In this study, by analyzing the complete SAR data of the descending orbit TerraSAR (2017–2019) and the ascending orbit Sentinel-1 (2015–2022), we investigated the present-day deformation trend in Xi’an from the perspective of surface displacement mapping. We first applied the small baseline subset (SBAS) technique as a data processing method [33,34] to obtain ground deformation maps of Xi’an City. The accuracy of the InSAR displacement was verified by using real-data validation of eight levels in Xi’an. Secondly, angular distortions were obtained via the calculation of the land subsidence gradient, and the location and prediction of ground fissures were identified. We further used cross-correlation analysis to quantify the time delay effect between displacement and the groundwater level and determined their causal relationship. Using data obtained from 22 years of monitoring of groundwater-level changes and the InSAR displacement analysis, we concluded that surface deformation in the future will mainly be caused by uplift deformation and there is no sign of a slowing trend. We used the groundwater-level change curves and InSAR deformations to comprehensively analyze the temporal and spatial evolution of natural surface displacement after groundwater extraction or recharge. In addition, multiple observation geometries were used to estimate the multi-dimensional deformation, such as horizontal and vertical displacements, thereby enhancing our knowledge of the three-dimensional surface deformation that affects cities. This is another novelty of this study, as the combination of different orbital data to obtain multi-dimensional deformation has not been previously studied in the Xi’an region.
By obtaining the multi-dimensional surface deformation in Xi’an and studying the relationship between surface deformation and ground fissures, the faults and changes in the groundwater level can be used to evaluate the efficiency of groundwater management policies implemented to restore the over-developed aquifer system in Xi’an in the years to come.

2. Study Area and Data

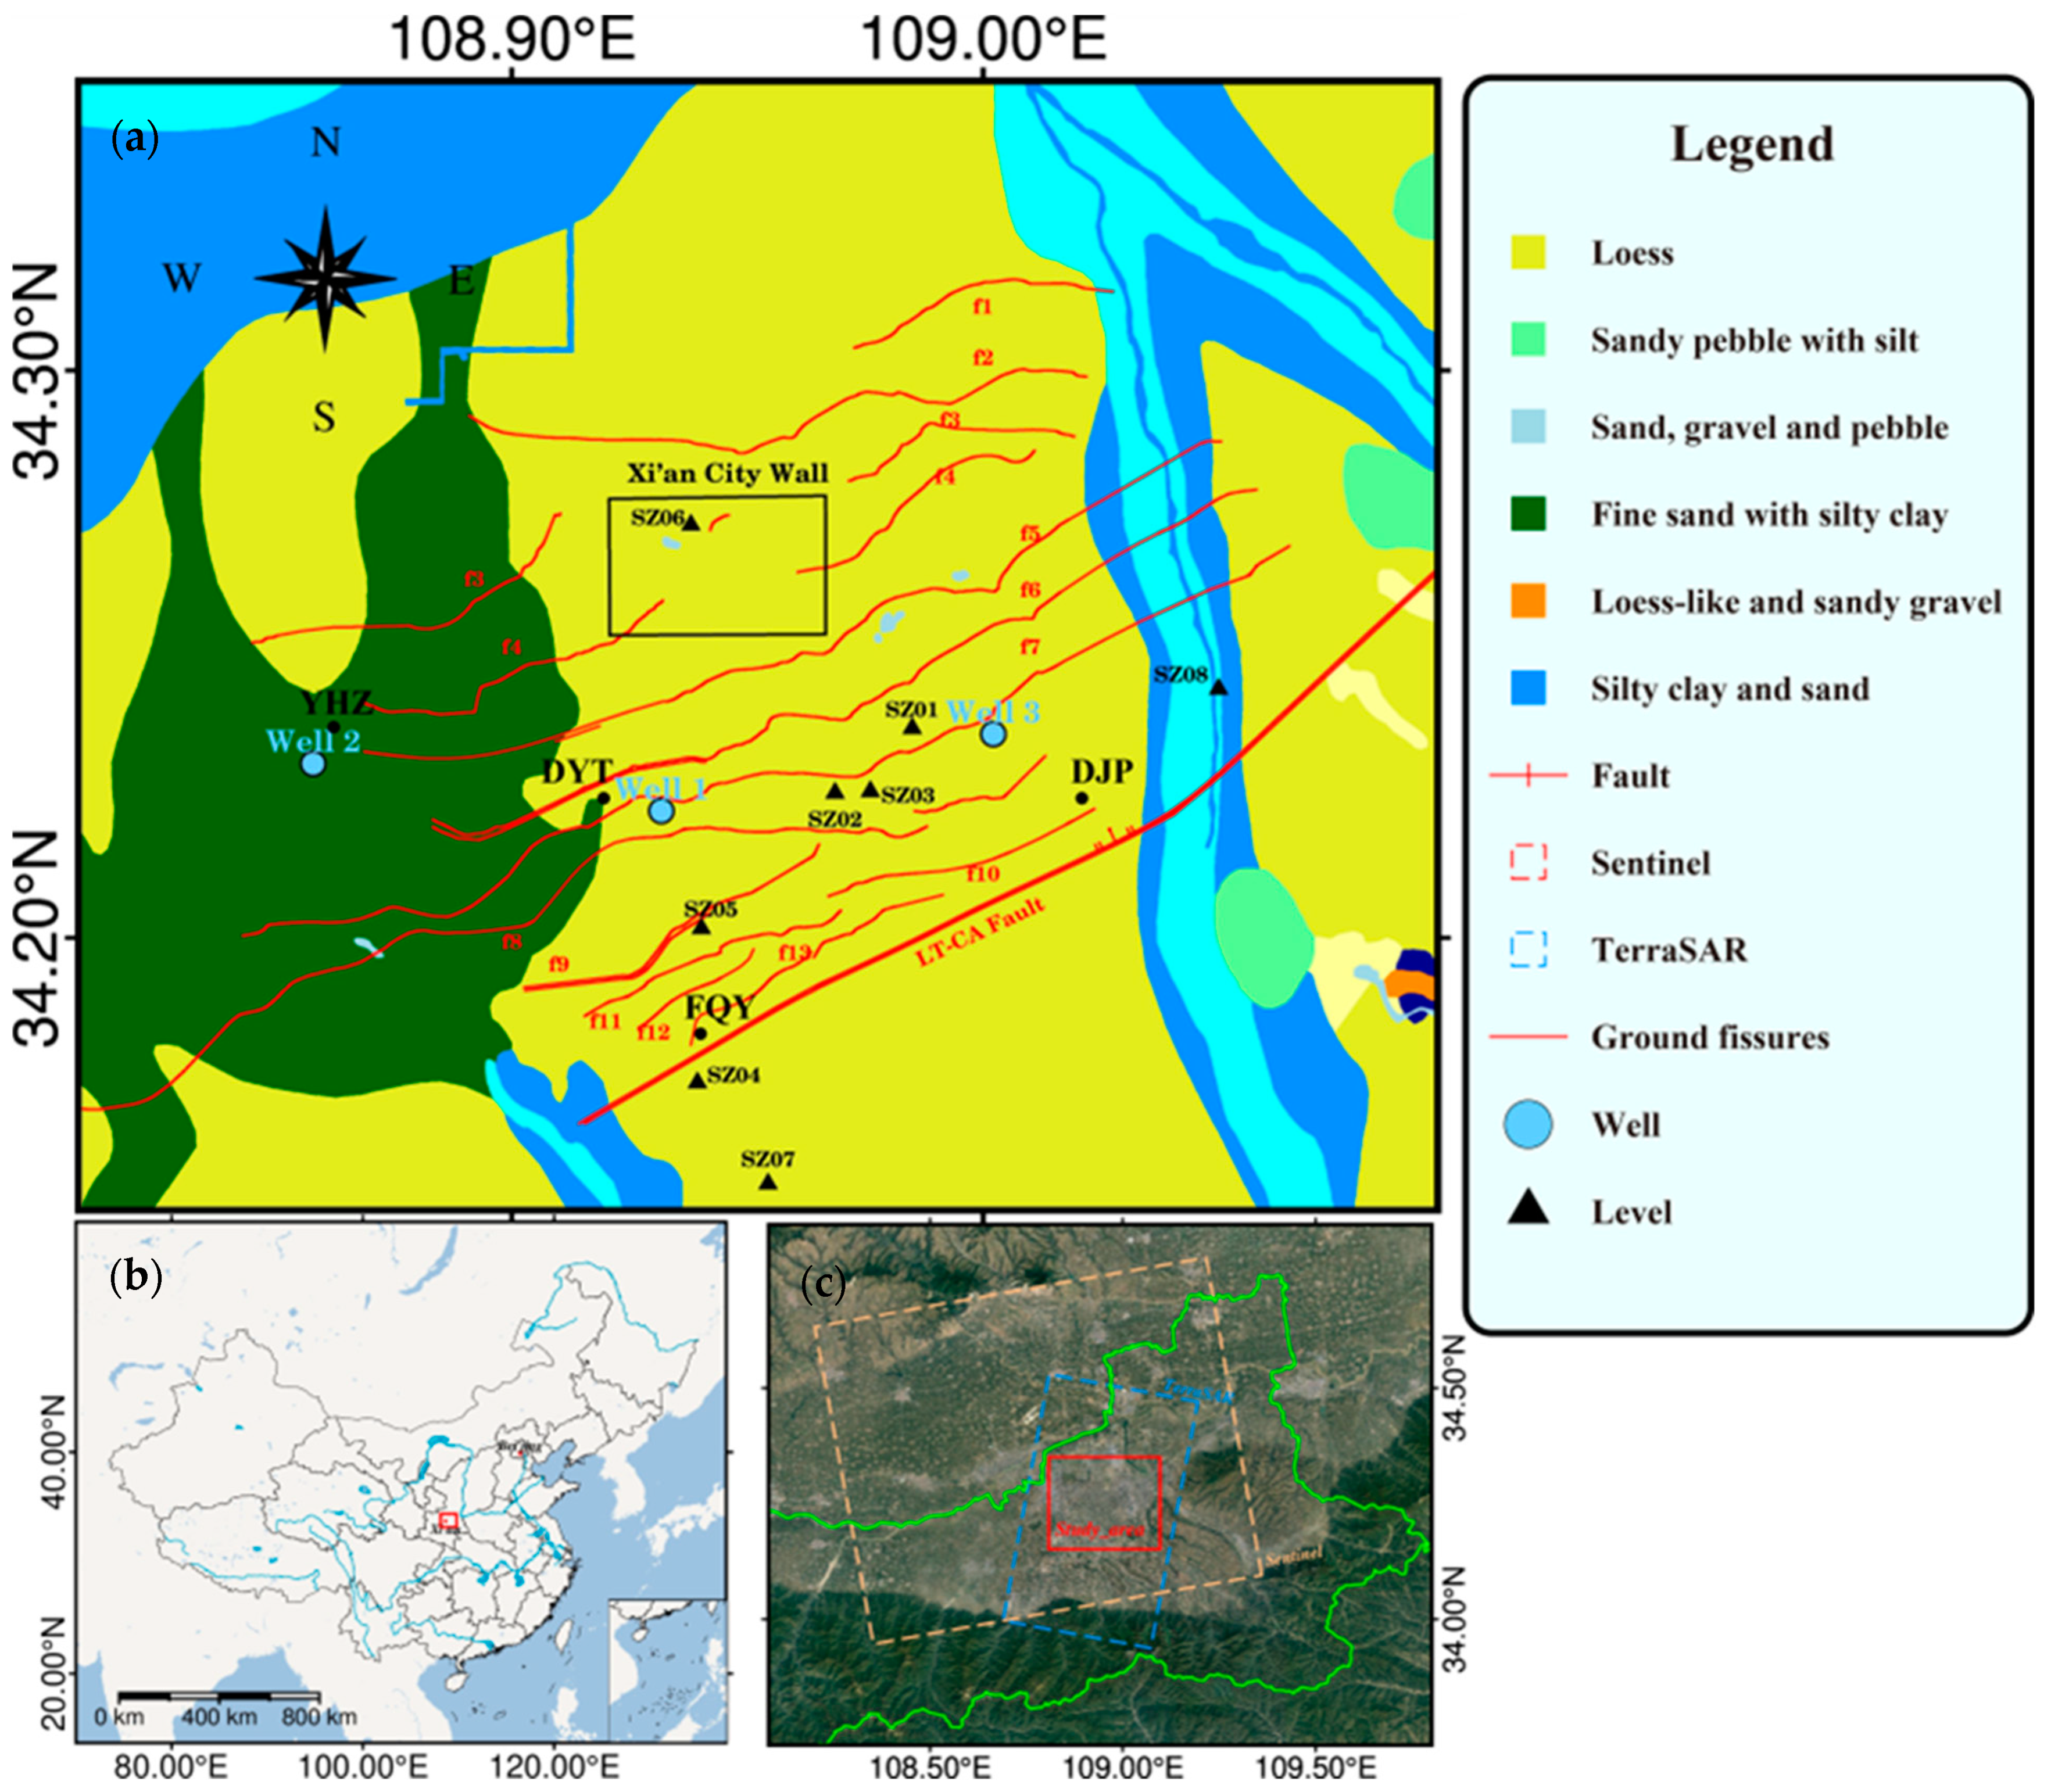
2.1. Overview of the Study Area

Xi’an is located in the middle of the Guanzhong Plain. The main urban area is located at the junction of different tectonic units in the Weihe River Basin, with complex engineering geological conditions and abundant faults, such as the Lintong Chang’an Fault (LT-CA Fault). Additionally, Xi’an City has developed 13 ground fissures, roughly in a northeast-to-southeast direction, with the longest fissure, f7, exceeding 14 km (Figure 1a). As it is affected by these ground fissures, the funnel area with land subsidence is oval and expands rapidly to one side [35].
Figure 1 shows the geological map of the main urban area of Xi’an, where structural faults and ground fissures overlap [25]. Since the Cenozoic era, the deposits in this area have mainly consisted of sand, alluvial soil layer, proluvial sediments, and lacustrine deposits formed by loess accumulation and water flow [35]. The accumulation layer is relatively thick, especially with the loess accumulation layer exceeding 100 m. Loess is prone to surface deformation due to its unique soil properties.

2.2. Data

2.2.1. InSAR Datasets

In order to obtain the true spatial–temporal characteristics of deformation in the entire Xi’an region from 2015 to 2022, we used the SAR data from two sensors, including 25 TSX images from May 2017 to April 2019 and 187 S1 images from June 2015 to July 2022, totaling 208 images. The coverage range of the two sensors’ SAR images is shown in Figure 1c. The basic parameters of the two SAR datasets are presented in Table 1. The external DEM data were provided by NASA’s space shuttle radar terrain mission-1 (SRTM), with a spatial resolution of 30 m, for simulating and eliminating the terrain phase [36].

2.2.2. Field Datasets

(1)
Hydraulic head
In the Xi’an study area, the relationship between the groundwater level and surface deformation was explored using three long-term observations of groundwater monitoring data. The hydraulic head observation frequency is once a month. The recorded depths of the three wells are 80–130 m from the ground, indicating that groundwater exploitation occurs in deep confined aquifers (Figure 1a).
(2)
Level
There are eight level stations located within our study area (Figure 1a), obtained from two periods, 2015–2016 and 2020–2021, respectively, and used for InSAR data accuracy verification.

3. Method

3.1. SBAS-InSAR Data Processing

The SBAS-InSAR has become the most commonly used time-series deformation processing algorithm since 2002 [33]. After acquiring N SAR images of repeated observations and setting a spatio-temporal baseline threshold to form M interferograms, differential interferometry and phase unwrapping were performed on selected interferometric pairs, which were finally geocoded to obtain the final unwrapped interferogram. Next, we utilized the final unwrapped interferogram with a short baseline as the observation value, and considered the sequential interferometric phase as the unknown parameter; then, the relationship between the two can be expressed as:
δ φ = B φ
where δ φ = [ δ φ 1 ,   δ φ 2 ,   ,   δ φ M ] T represents the known vector of the unwrapped phases of M differential interferograms, φ = [ φ 1 ,   φ 2 ,   ,   φ N ] T represents the N parameters to be solved, and B is the design matrix. The unknown parameters φ   can be solved by the least square (LS) and singular value decomposition (SVD) method:
φ = ( B T B ) 1 B T   δ φ
Finally, we obtained the average deformation rate map and time series maps.
In this study, GAMMA software was used to process the data from the Sentinel-1 and TerraSAR satellites, and the SBAS-InSAR technology was utilized separately for each dataset. After generating the differential interferograms, NASA’s 30 m resolution digital surface model (DSM) for the space shuttle radar terrain mission (SRTM) was used to remove registration errors caused by terrain phases and fluctuations, phase unwrapping was performed using minimum-cost flow (MCF), and the atmospheric phase delay and removal related to altitude were calculated. Finally, the least squares and singular value decomposition (SVD) were used to estimate the land subsidence based on the Sentinel-1 data from 2015 to 2022 and the TerraSAR data from 2017 to 2019.

3.2. Multi-Dimensional Deformation Method

The InSAR-monitored deformation over each point of each frame is a one-dimensional (1D) projection along the LOS direction ( d L O S ) of the three-dimensional (3D) surface displacement (east–west component ( d e ), north–south component ( d n ), and up component ( d u )) [37]. Its estimation is as follows:
d L O S i = c o s θ i · d u s i n θ i s i n α a z i i 3 π / 2 · d e s i n θ i c o s α a z i i 3 π / 2 · d n
where θ i , α a z i i , and α a z i i 3 π / 2 represent the i SAR satellite incidence angle, the included angle between the i SAR satellite’s flight direction and the north direction, and the included angle between the range direction and the north direction, respectively.
Due to the nearly north–south flight direction of the existing SAR satellites, their monitoring results are less sensitive to north–south displacement; therefore, the north–south displacement has a low contribution to the LOS value and can be ignored. When there are both ascending and descending data in the study area, the assumption that d n = 0 is made, and the d u and d e components are solved as follows:
d L O S a s c = c o s θ a s c · d u s i n θ a s c s i n α a z i a s c 3 π / 2 · d e d L O S d s c = c o s θ d s c · d u s i n θ d s c s i n α a z i d s c 3 π / 2 · d e
When the study area covers only one geometric observation (ascending or descending), we can solve for the d u component as follows:
d u = d L O S i c o s θ i

3.3. Angular Distortions and Differential Subsidence

Differential subsidence at the edge of the surface deformation zones often occurs at the discontinuity of an aquifer structure, which is the main origin of shallow fault development, cracks, and urban infrastructure damage [38]. When evaluating the harm caused by land subsidence, we can measure the harm based not only on the annual average deformation rate or total subsidence, but also based on the different settlement d u i between the two points under consideration [39], and then the value can be transformed into an angular distortion β . The solution is as follows:
β = d u i l
where l is the distance between the two points.
The calculation process of Equation (4) can be considered as fitting the slope of the central pixel in a 3 × 3 unit window with the plane of the surrounding 8 units, which is consistent with the standard method used for evaluating digital elevation data in GIS [40]. This process is calculated using the average maximum technique, as shown in Figure 2.
The data processing procedure consists of two steps (Figure 3). Step one estimates the land subsidence via an InSAR time-series analysis of the multi-orbit SLC data stacks. Step two jointly analyzes the groundwater level, ground fissures, and land subsidence to explore their relationship.

4. Results

A short baseline interferometric measurement network was created using the Sentinel-1A data for the ascending orbit and the TerraSAR data for the descending orbit, and interferogram pairs were generated, as shown in Figure 4. The resolution of the Sentinel interferogram is approximately 20 m × 20 m; five rounds of multi−look generation at distance and one multi−look generation at azimuth were performed. The resolution of the TerraSAR interferogram is also 20 m × 20 m; the Goldstein filtering method was used to eliminate noise from the interferogram, and the MCF was used to unfold the interferogram. To reduce data processing errors, we selected interferograms with a coherence greater than the average threshold of 0.5. We used time-domain high-pass filtering to remove some high-frequency turbulent atmospheric data. Finally, we used the LS method to convert the short baseline interference phase into a sequence interference phase, and we multiplied the phase by a constant, λ /   4   π , to obtain the deformation time series.

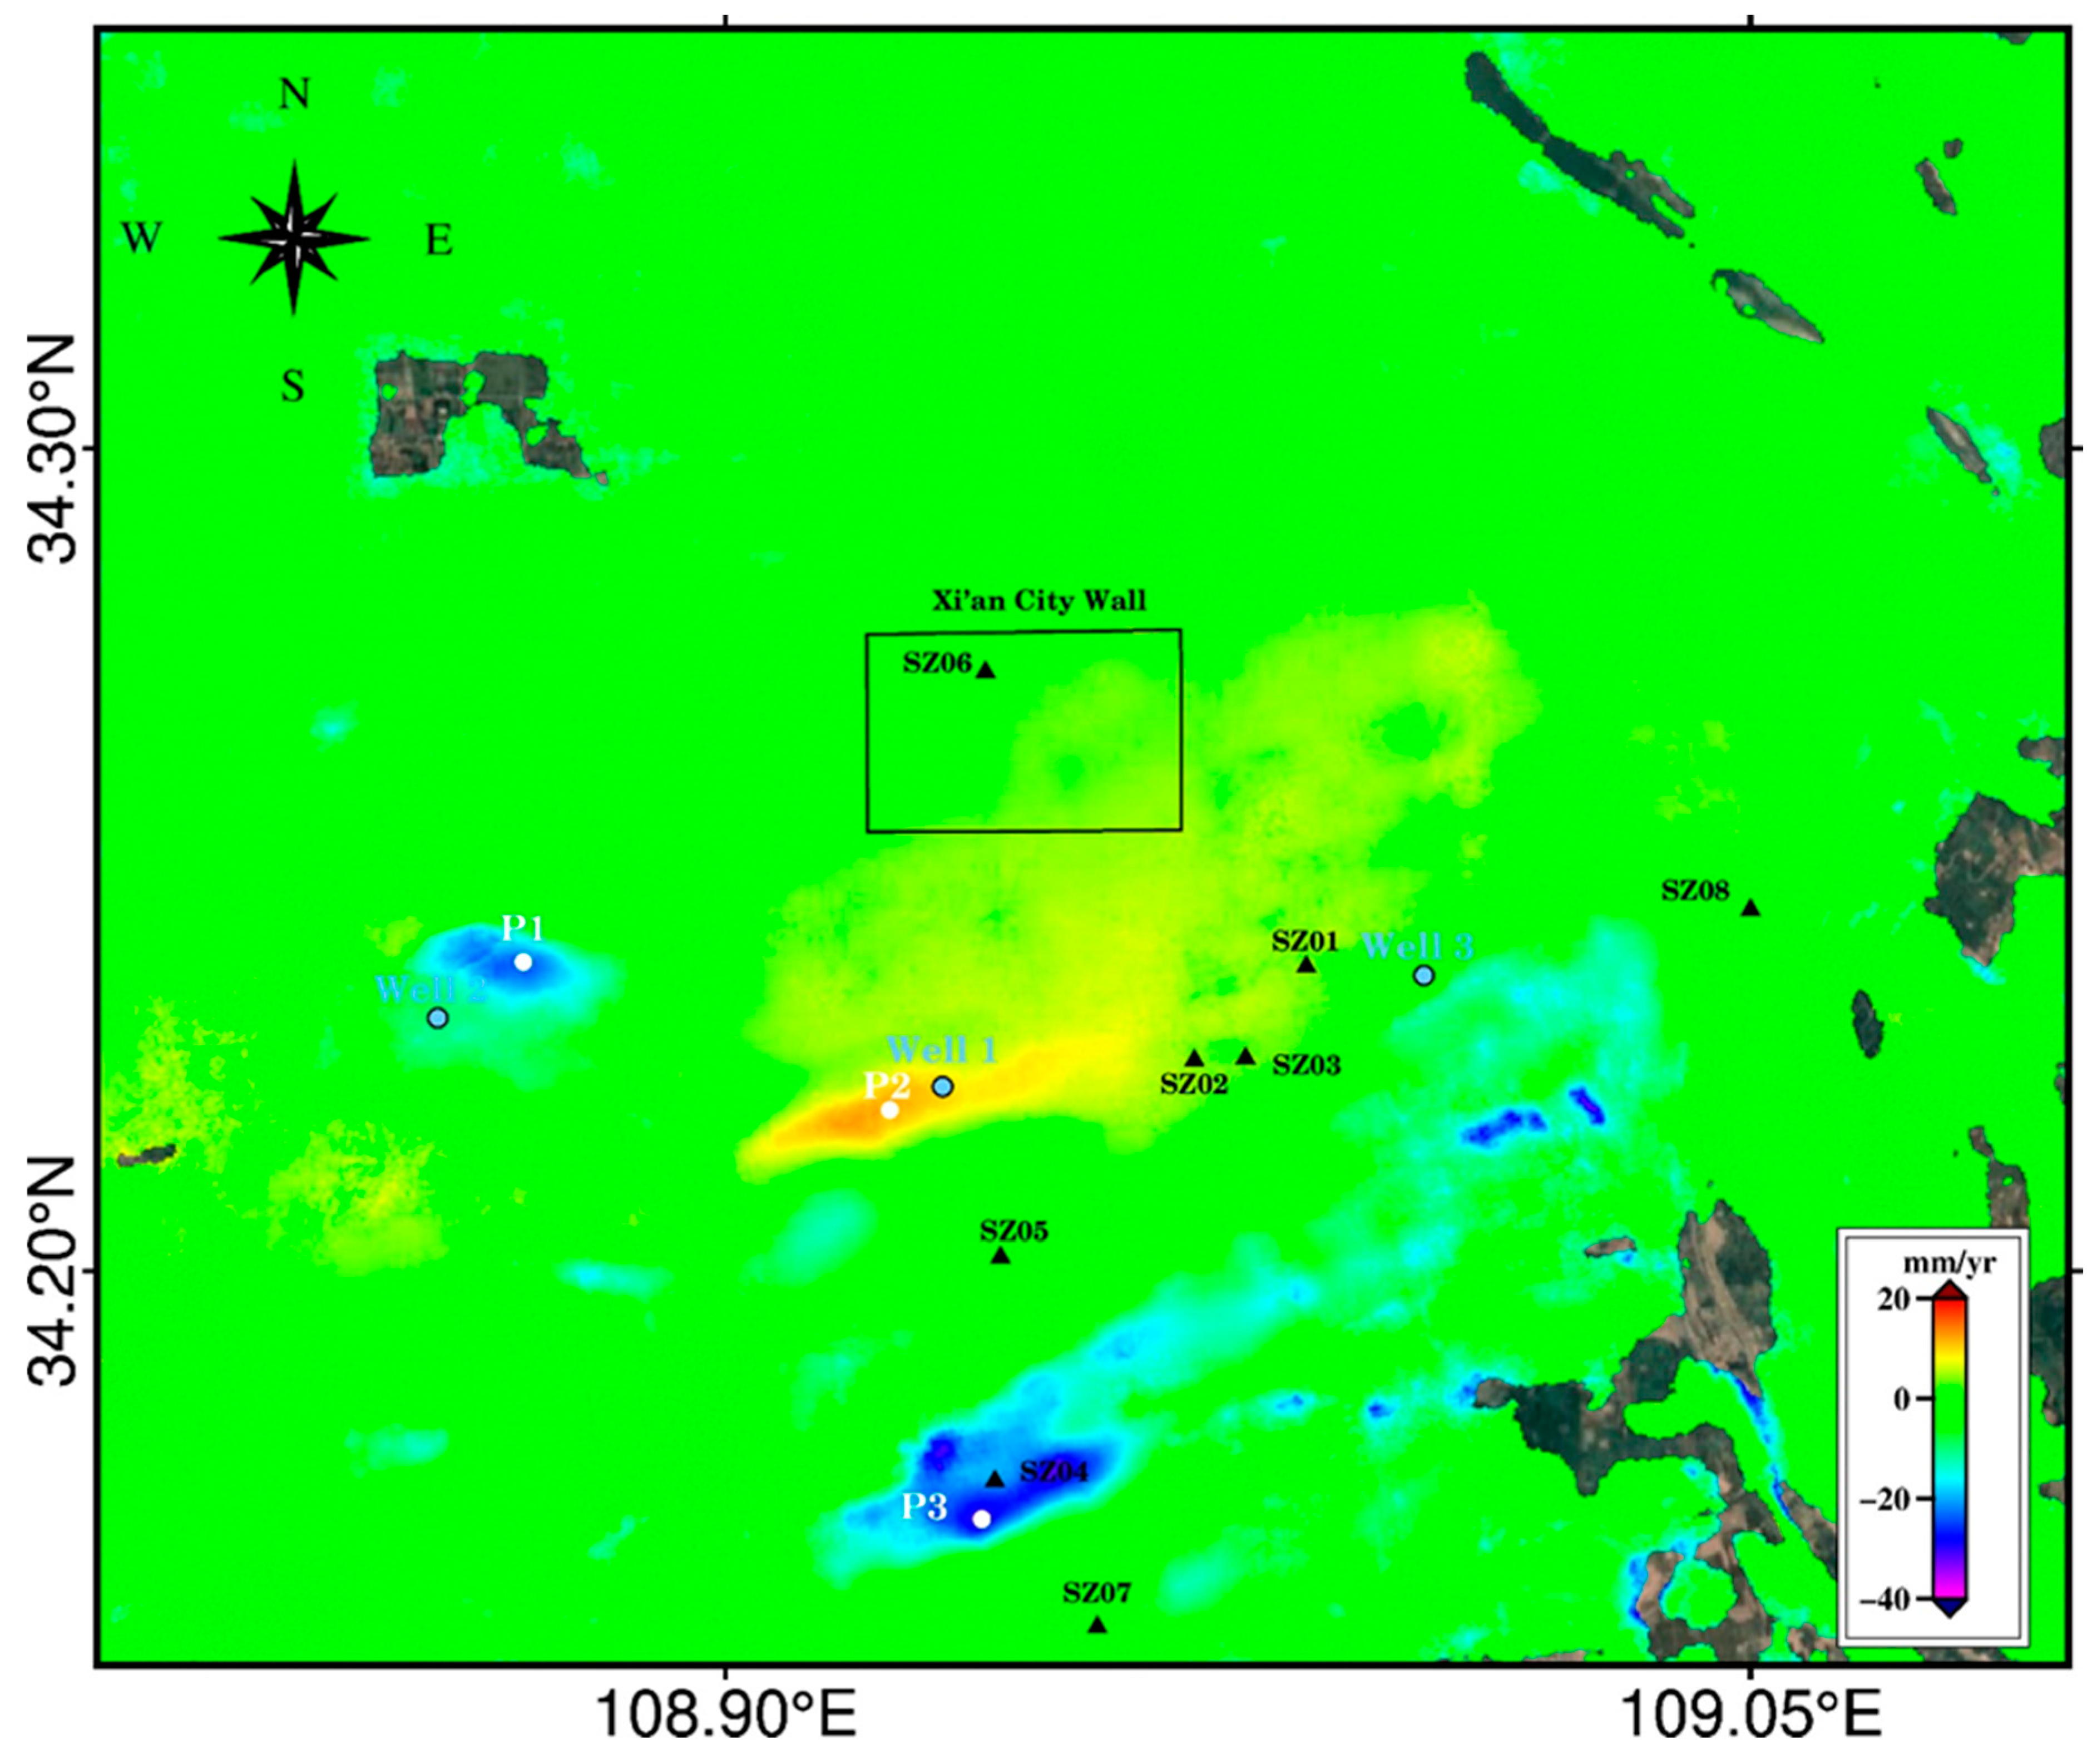
4.1. InSAR Monitoring Velocity Map

Figure 5 shows the map of deformation rate in the study area from 2015 to 2022. It can be seen clearly that there are five subsidence funnels with a maximum settlement rate exceeding 40 mm/yr, and an uplift zone with a maximum uplift rate exceeding 15 mm/yr.
In addition, in order to obtain the true spatial–temporal characteristics of deformation, we calculated the vertical deformation rate field for different years. Figure 6a–f shows the deformation patterns of 2016, 2017, 2018, 2019, 2020, and 2021–2022, respectively. The spatial pattern of deformation from 2015 to 2022 was inconsistent, and the deformation rate varied over time. From 2016 to 2017, settlement was still the main deformation, with a maximum deformation rate exceeding −150 mm/yr. From 2018 to 2019, the phenomenon of surface subsidence disappeared, leading to surface uplift, with a maximum rate of 40 mm/yr. The uplift phenomenon is related to groundwater recovery. In 2020, the surface slightly uplifted, with a relatively small amplitude of uplift. The spatial–temporal characteristics are most obvious from 2021 to 2022, with the largest uplift amplitude and deformation rate exceeding 60 mm/yr. Due to the fact that most areas of the surface have risen rather than sunk, there is a trend of uplift. Based on the available research in the area, it can be inferred that the groundwater in this aquifer has achieved significant recharge over the past seven years. However, the rate of deformation recovery is less than settlement, and, finally, the overall effect still manifests as settlement. Therefore, it is inferred that irreparable non-elastic compression deformation occurs in the aquifer.
Figure 7 shows the map of the vertical deformation rate based on the TerraSAR data in the study area from 2017 to 2019, which is consistent with the deformation spatial distribution of the Sentinel-1 data shown in Figure 6. It is also evident that there are multiple subsidence funnels with a maximum subsidence rate exceeding −45 mm/yr, and two uplift zones with a maximum subsidence rate exceeding 30 mm/yr. The difference from the Sentinel-1’s results is that there is a linear surface uplift area, which is referred to as the “Happiness Forest Belt Development Area”, a large-scale urban development project. Large-scale urban infrastructure construction can also bring about surface deformation.
To further analyze the spatiotemporal evolution patterns of key regions, we selected three subsidence center points (P1–P3) shared by the Sentinel-1 and TerraSAR results, as shown in Figure 8. P1 is located in the YHZ area, where groundwater was overexploited from 2015 to 2018, leading to the most severe land subsidence. The rapid rebound phenomenon in October 2018 occurred due to the implementation of artificial water injection. P2 is located in the DYT area and showed an uplift phenomenon from 2015 to 2022; the uplift phenomenon occurred more rapidly from 2021 to 2022. P3 is located in the FQY area, and after a long period of continuous settlement, it started to rebound in 2021. With the issuance of the start of artificial water injection projects, the completion of water transfer hub projects, and groundwater extraction restrictions, land deformation in the Xi’an region continues to rebound, and in the future, land deformation in Xi’an City will mainly be uplifted.

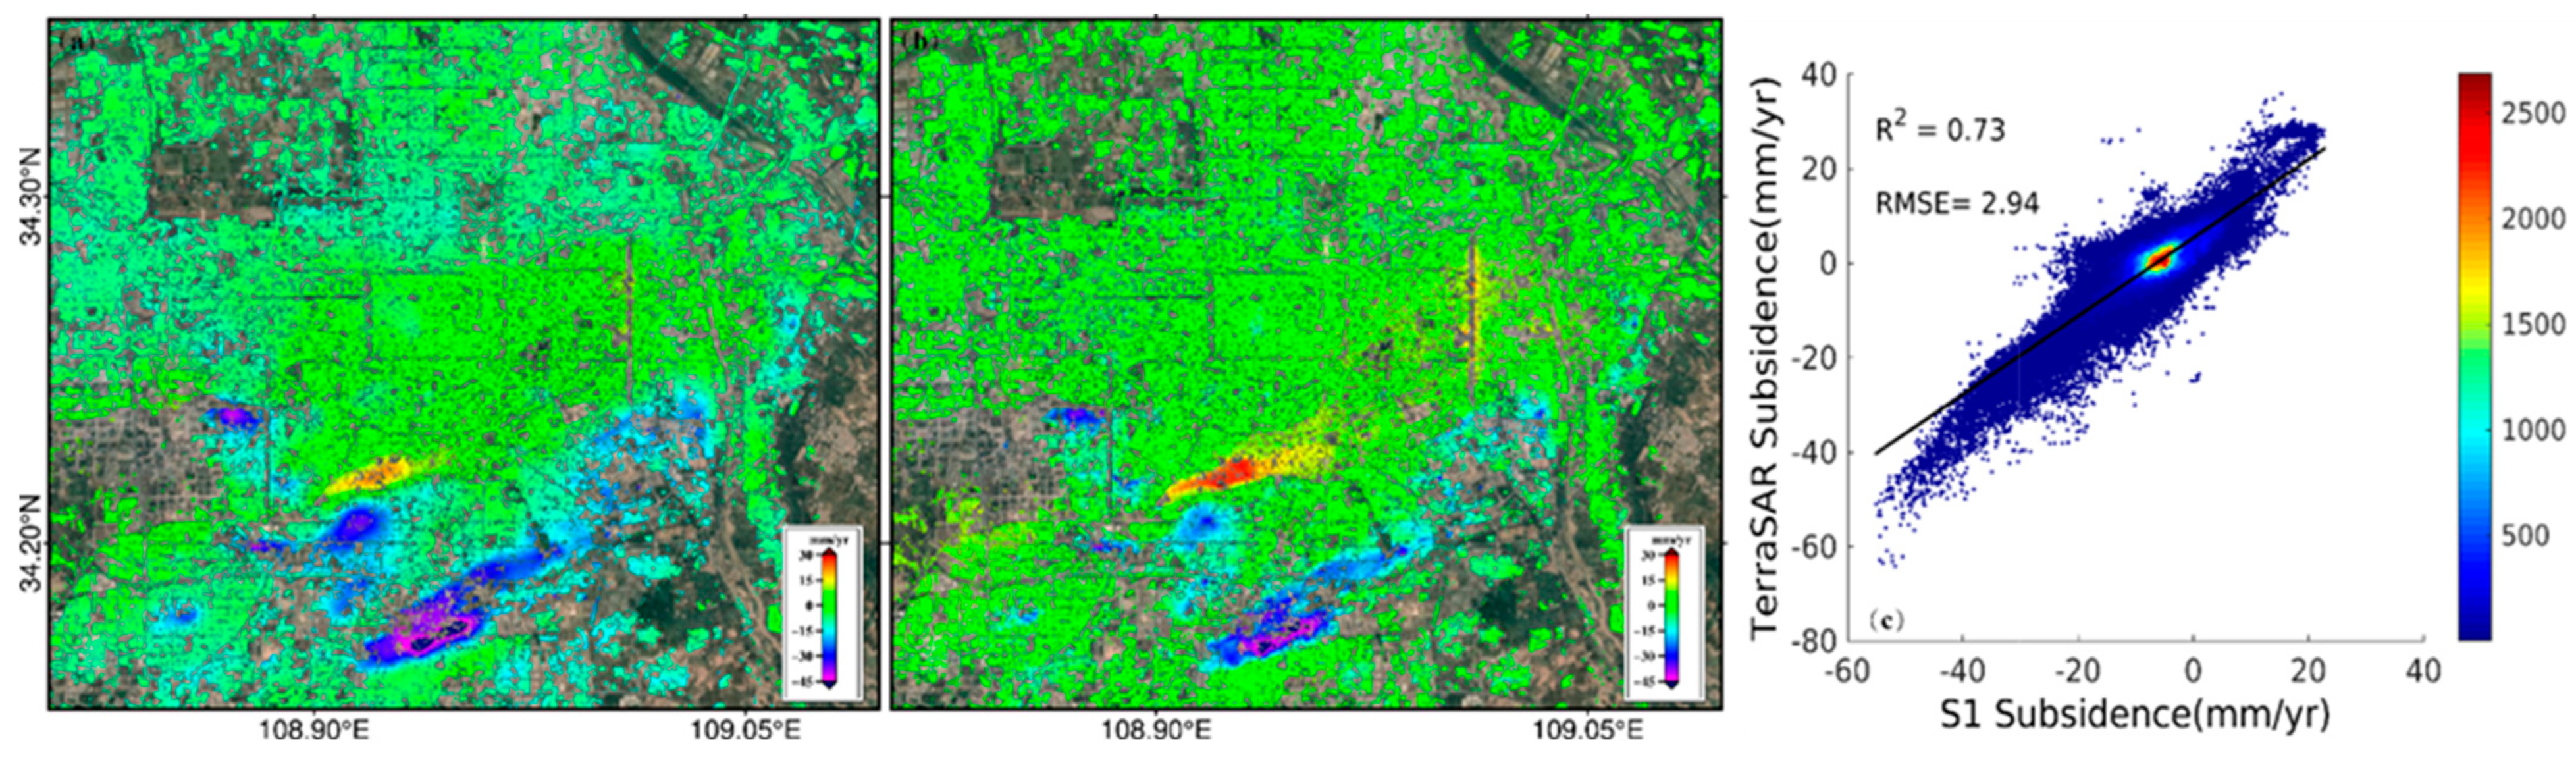
4.2. Accuracy Assessment

To validate the InSAR results, we used leveling data from 2016 and 2020 to verify the accuracy of the InSAR results. Figure 1a shows the position of the level stations. Figure 9 shows a comparison of the level measurement results in 2016 and 2020. The STD of the differences is 3.1 and 2.5 mm in 2016 and 2020, respectively. Meanwhile, a field survey was also conducted, as shown in Figure 10. There are cracks in the houses in the subsidence funnel area, and large cracks appear on the surface, as shown in Figure 10a,b. In the area with ground cracks, there are also two sides falling away from an arching phenomenon in the middle, as shown in Figure 10d, further verifying the accuracy of the monitoring results. Overall, the precision of the InSAR measurement is high enough to investigate land subsidence.
In addition, a cross−comparison verification of the vertical InSAR results for S1 and TSX was also conducted, and the results are shown in Figure 11. The root mean square error (RMSE) is 2.3 mm/yr, and the correlation coefficient ( R 2 ) is 0.73. Due to the low correlation coefficient, it can be inferred that surface deformation not only involves vertical deformation, but also horizontal deformation.

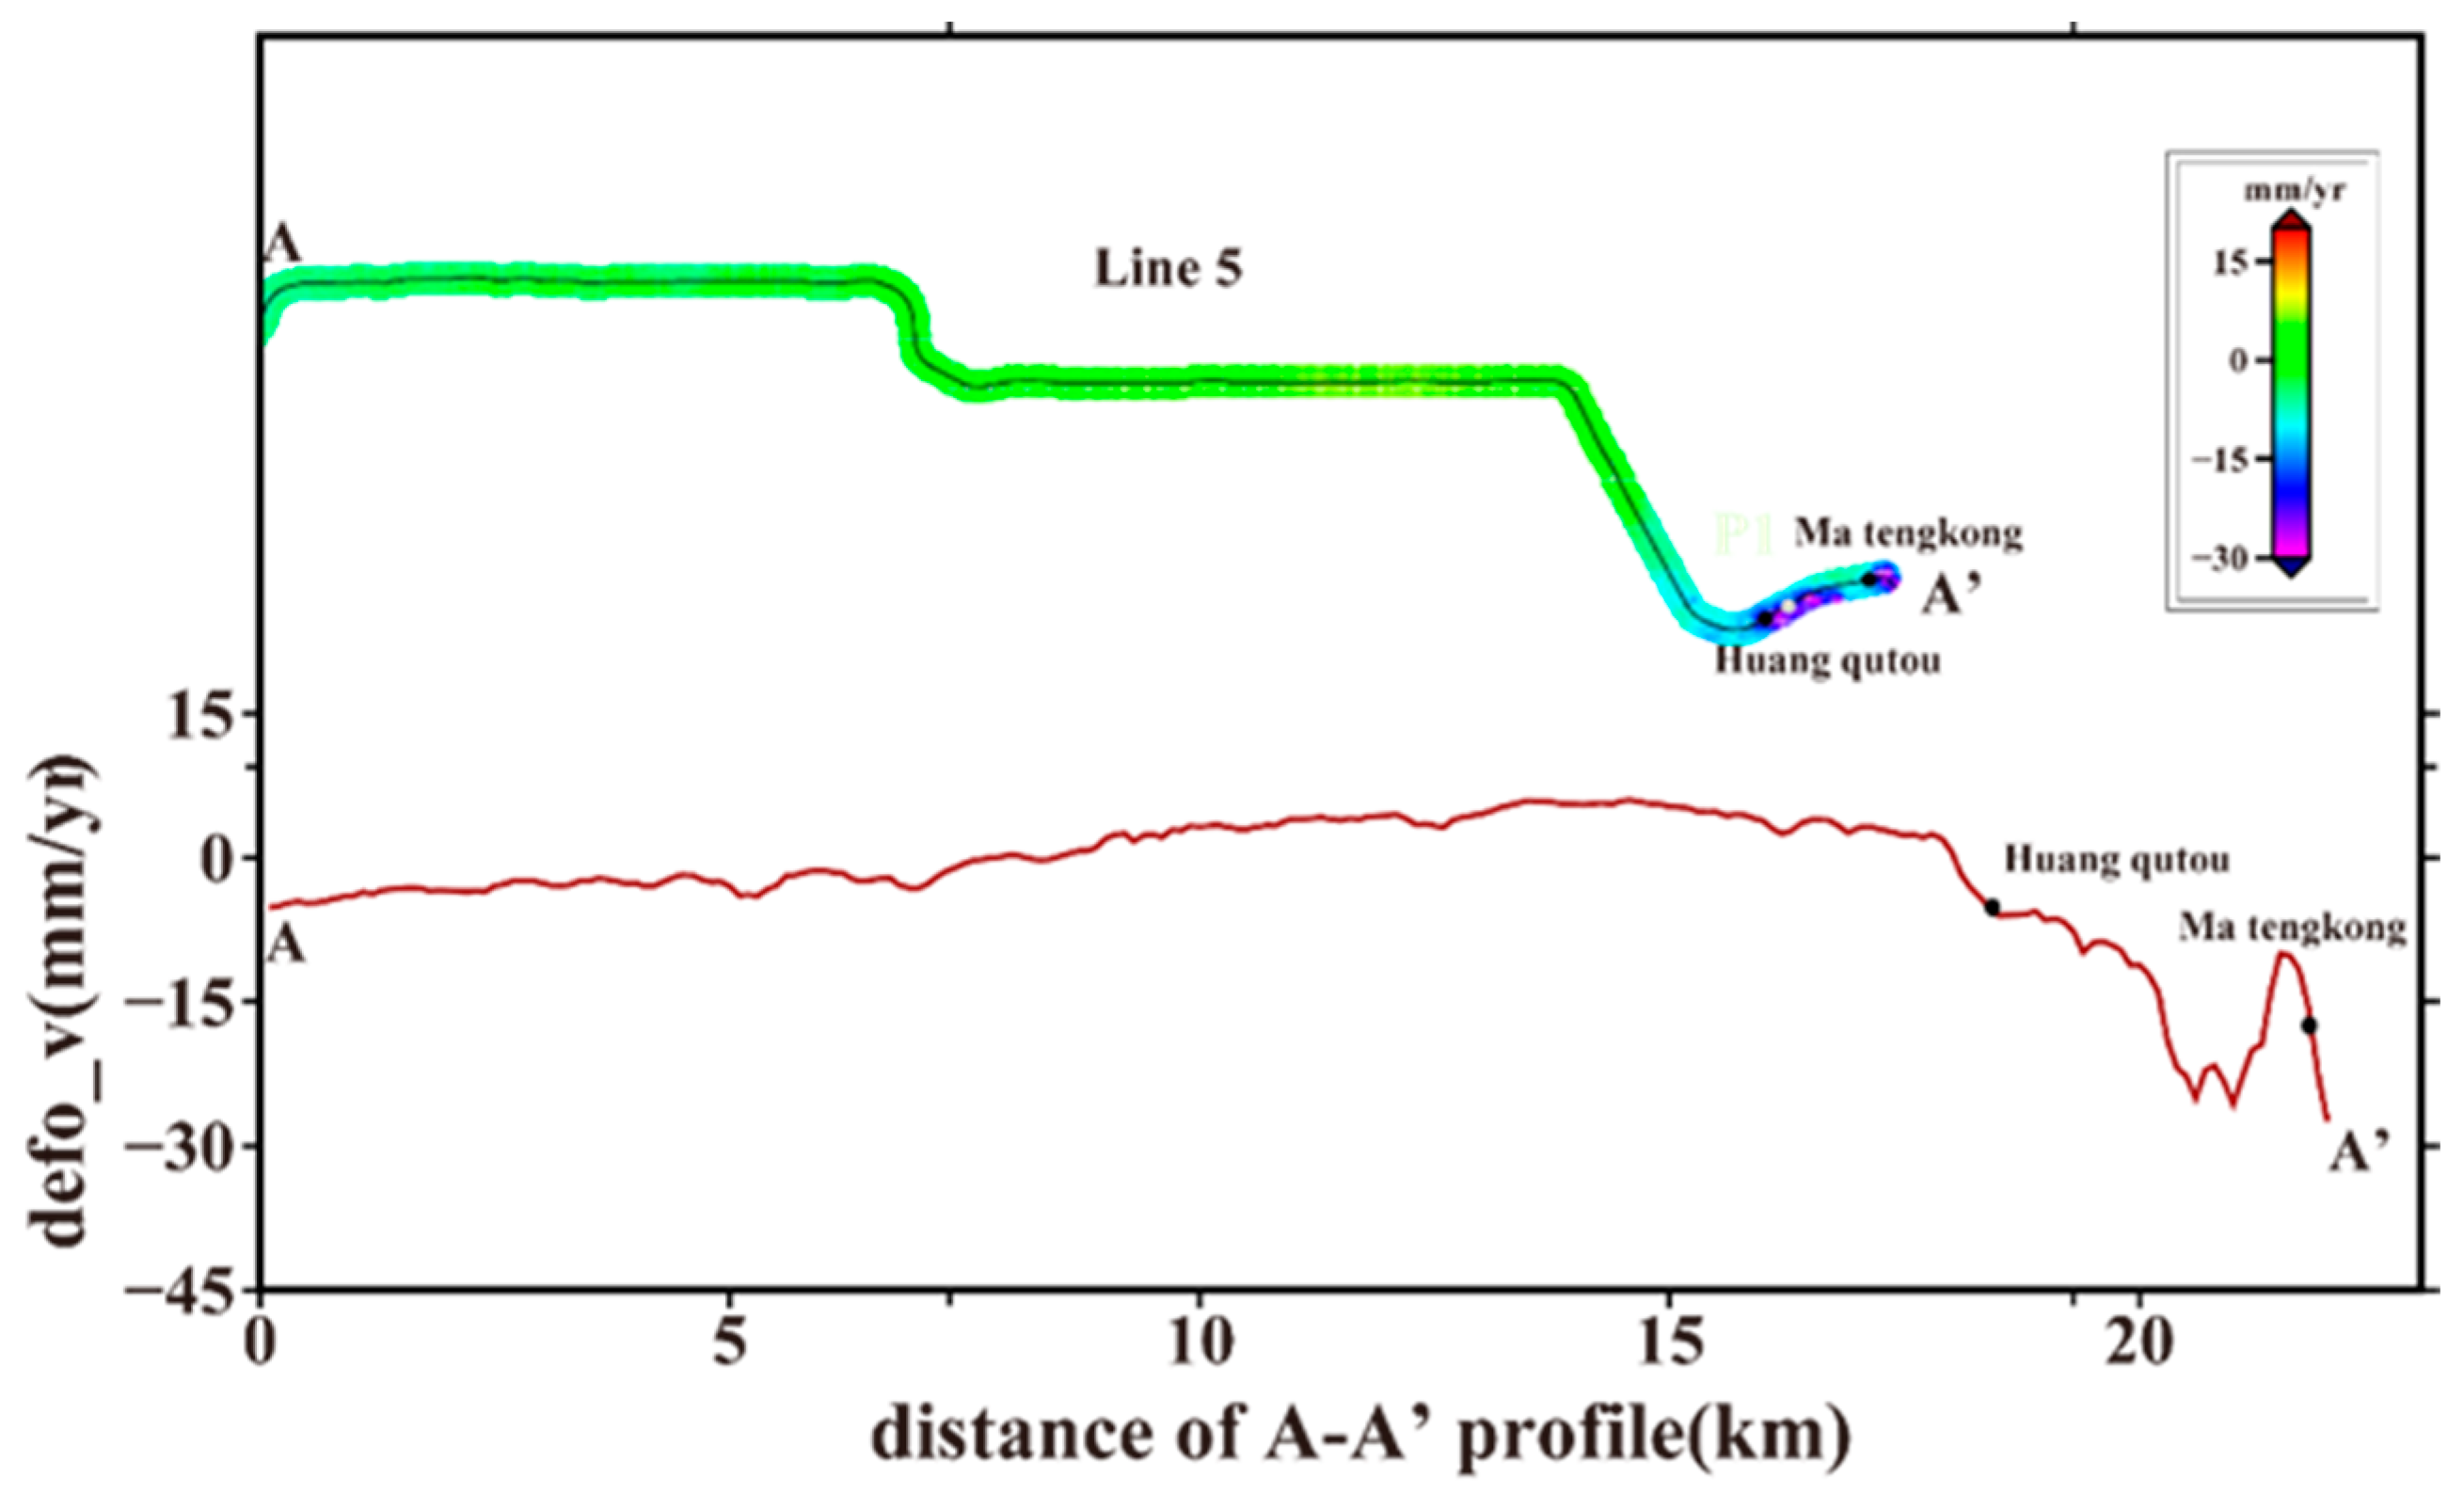
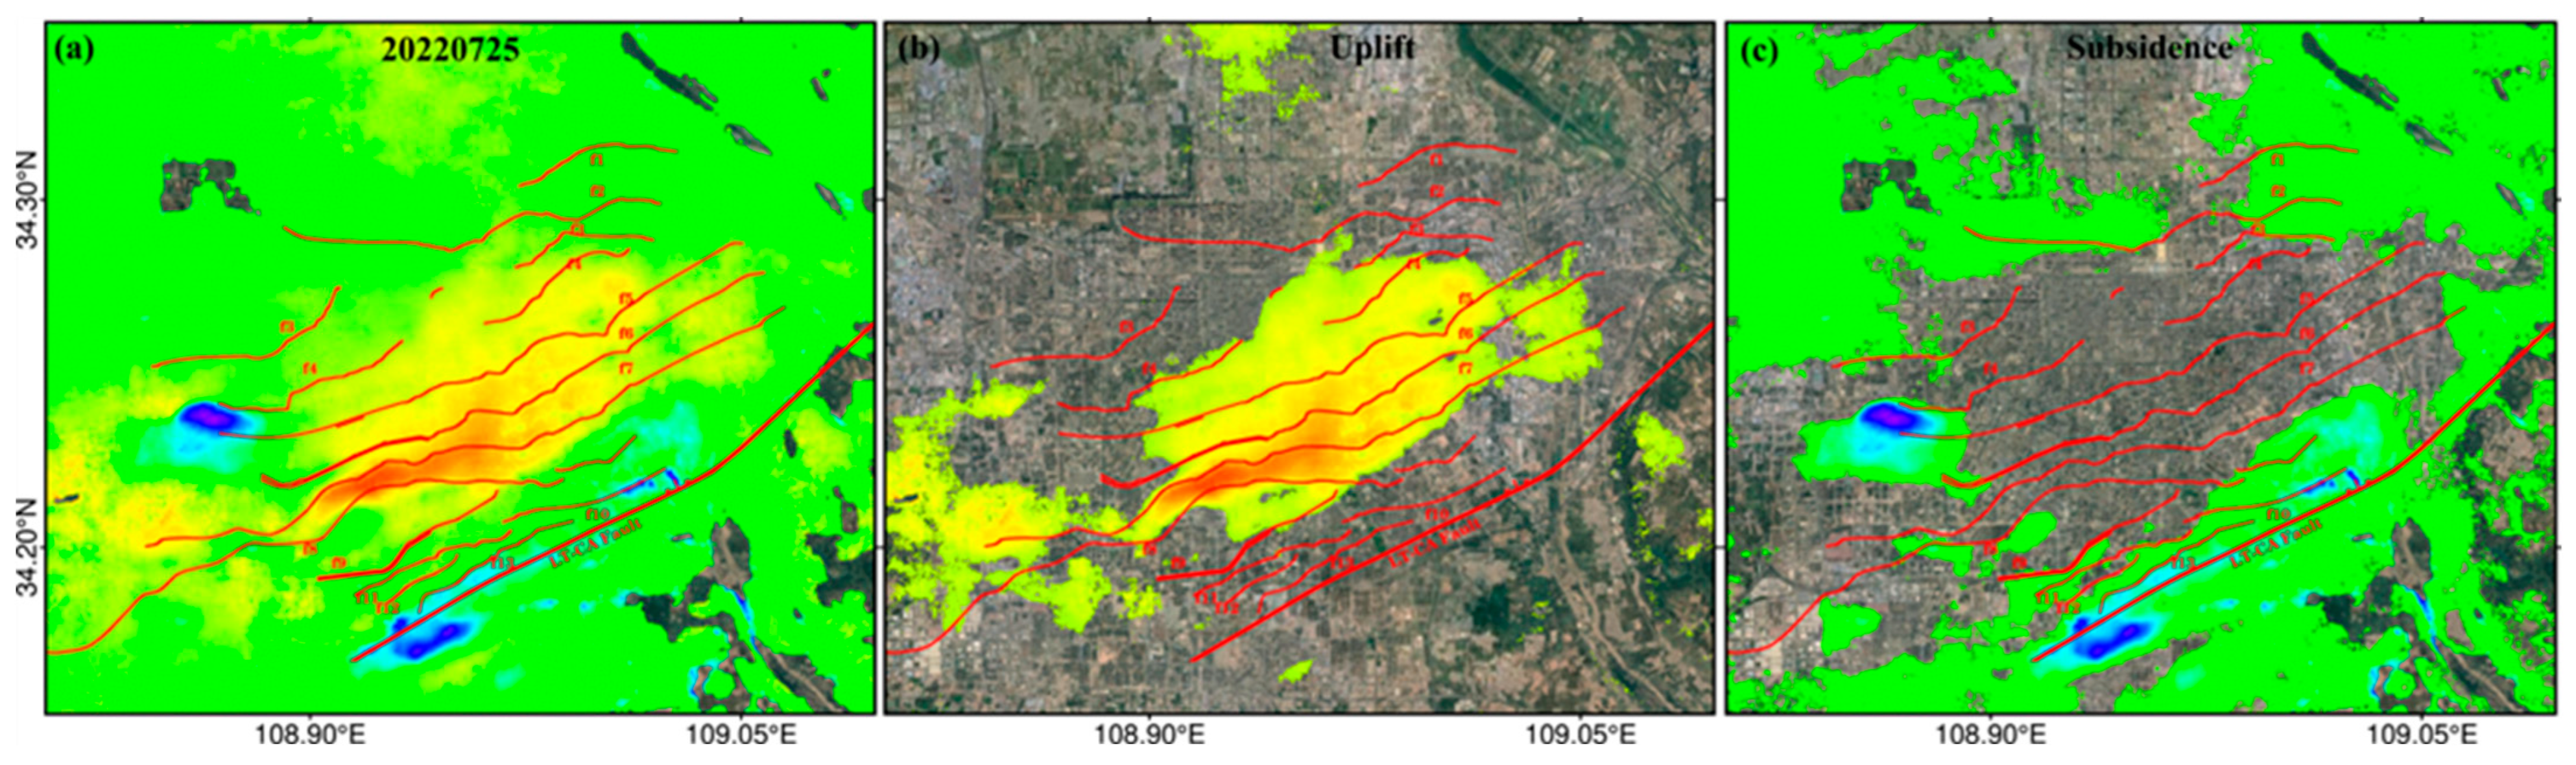
4.3. InSAR Multi-Dimensional Deformation

From the cross-validation, it was found that surface deformation in Xi’an has not only vertical deformation, but also horizontal deformation. We solved the multi-dimensional deformation using the S1 data of the ascending orbit and the TSX data of the descending orbit. Under the premise of ignoring the north–south deformation, a two-dimensional deformation rate field was obtained, which is shown in Figure 12, and based on this, the ground fissure and fault data were superimposed. As shown in Figure 12a, it can be concluded that surface deformation in Xi’an City is mainly vertical deformation, and the multiple deformation boundaries formed are consistent with the boundaries of ground fissures, especially between the f7 and f8 ground fissures, where there is a clear surface uplift boundary. As shown in Figure 12b, it can be concluded that there is a significant narrow horizontal deformation in Xi’an, especially between the f7 and f8 ground fissures, where there is a horizontal deformation moving eastward. Based on the analysis of the hydrogeological data, it can be concluded that the direction of the groundwater flow is affected by ground fissures, which hinder the diffusion of groundwater and force the direction of the groundwater flow to follow the direction of the ground fissures, leading to horizontal deformation.

5. Discussion

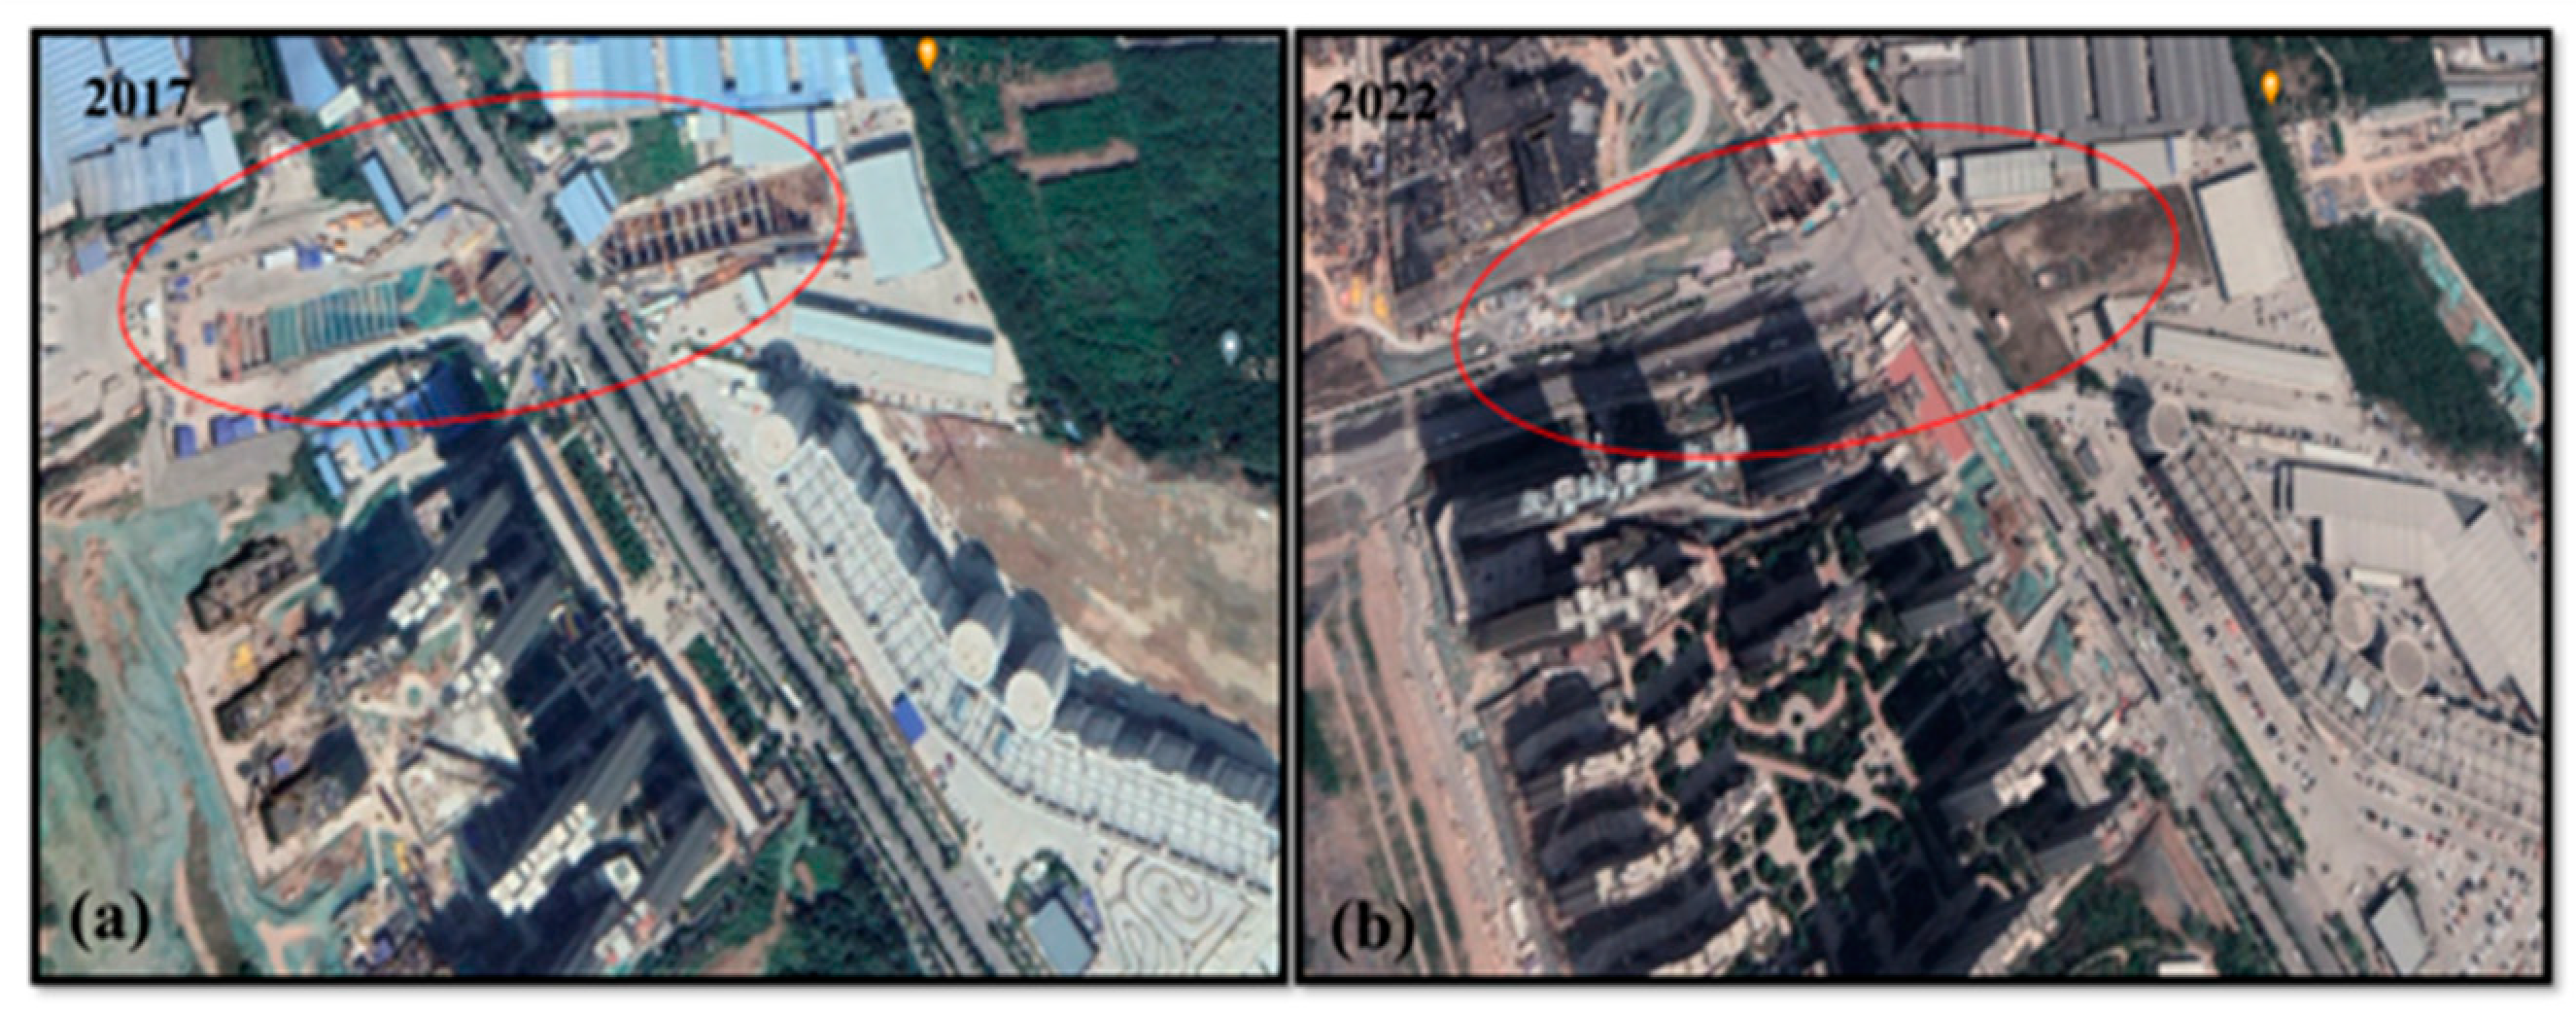
5.1. The Relationship between Subway Construction and Deformation

Ground subsidence has a negative impact on the construction and operation of urban rail transit systems, as it is considered the most serious type of disaster. Ground subsidence affects the stability of a subway system and its surrounding infrastructure. Identifying land subsidence during construction and operation is crucial for the safety of subways. This study used long-term time-series displacement to study the impact of ground subsidence caused by underground earthwork excavation during subway construction and surface deformation caused by groundwater extraction on subway lines. We analyzed the distribution of subway ground subsidence and quantified the time-series variation characteristics of deformation throughout the entire period, including construction and operation. The subway displacement rates obtained using the Sentinel-1 data from 2015 to 2022 and the TerraSAR data from 2017 to 2019 are shown in Figure 13. A statistical analysis was conducted on the maximum displacement and average displacement rates of six subway lines, and the results are shown in Table 2. From the deformation maps and statistical data, it can be concluded that the Xi’an subway lines are relatively stable, and only the deformation of the ground subsidence funnel area is large. For example, Line 2, Line 3, and Line 5 cross the ground subsidence funnel area in the YHZ District of the Yanta District and the FQY District of the Changan District. The average deformation rate of Line 2, Line 3, and Line 5 ranges from −24 mm/yr to −33 mm/yr.
The construction period of Line 5 Phase I was from January 2016 to December 2020. We combined the construction period and the operation period as the “life cycle” of the subway line, with the construction period of Line 5 from January 2016 to December 2020 and the operation period of Line 5 from December 2020 to July 2022. We obtained the “life cycle” deformation monitoring results, as shown in Figure 14, and we selected typical P1 points and plotted the time series deformation, as shown in Figure 15. The land deformation during the construction period showed linear subsidence and the cumulative deformation reached −138 mm in December 2020. Then, during the operation period from January 2021 to July 2022, for a total of 19 months, the ground subsidence was −22 mm, and the deformation still existed, but a slowing trend was obvious, which was in line with the natural sedimentation pattern. Comparing the optical images of 2017 and 2022, it can be concluded that the reason for the severe deformation area of the subway system here is caused by the excavation construction of the subway line, as shown in Figure 16.

5.2. The Relationship between Ground Fissures and Deformation

Figure 17a shows the cumulative deformation results in Xi’an City from 2015 to 2022. It can be seen that most of the area presents as an uplift area, which also includes multiple settlement funnel centers and multiple settlement boundaries. To better reflect the deformation boundary, the deformation map was separated into an uplift and a subsidence map. Figure 17c shows that the subsidence funnels have obvious boundaries, Moreover, as shown in Figure 17b, it can be seen that the uplift area presents a linear shape that matches the ground fissures, and there are clear boundaries in the uplift area between ground fissures f7 and f8. Discontinuities in deformation often present the most hazardous areas. Further calculation of the differential subsidence and acquisition of angular distortions is needed.
According to the subsidence difference calculation method adopted in this study, the differential subsidence and angular distortions were extracted from the total subsidence (Figure 17a), and the results of the angular distortions were obtained, as shown in Figure 18. It can be seen clearly that there are two significant differences in deformation, as well as significant angular distortions, located in the YHZ area and the DJP area, respectively.
In these areas, within seven years, the differential subsidence has exceeded 25 cm, with a resolution unit of 100 m (0.25%), which is converted into an angular deformation β of 1/400 (i.e., 0.14°). We need to further determine the critical settlement gradient threshold related to the generation of ground fissures in order to quantitatively assess the harmfulness of the ground fissures. We established four hazard level categories based on   β : low ( β     1 / 3000 ), medium ( 1 /   3000 < β     1 / 1500 ), high ( 1 / 1500 < β     1 / 500 ), and very high ( β > 1 /   500 ) [41], as shown in Figure 19, indicating an increasing likelihood of damage, therefore compromising the serviceability of the urban infrastructure affected. The zone of very high hazard is around the YHZ area. In this study, we statistically analyzed the two regions with the largest angular deformations, and the result shows that severe surface fissures have begun to occur with an angular distortion of 1/500, which is consistent with the study of ground fissures in Mexico City [41].
Based on the research above, we believe that there is an undiscovered ground fissure in the YHZ area; thus, we identified the deformation boundary and angular damage area of the YHZ area as the location of the ground fissure, as shown in Figure 20. The red dashed line represents the predicted ground fissure, and the red solid line represents the existing ground fissure in Xi’an. This study can provide a dual quantitative and qualitative evaluation for the study of ground fissures in Xi’an.

5.3. The Relationship between Groundwater and Deformation

The measurement of surface displacement can serve as a supplement to groundwater monitoring, as the surface displacement reflects changes in the groundwater reserves, benefiting from the high resolution of the InSAR technology. Data on the groundwater level can also be used to reveal the causes of surface deformation. We selected the groundwater level curves of Well 2 and Well 3 presented in Figure 1 and the time series results of the nearest InSAR monitoring point. As shown in Figure 21a, the groundwater level of Well 2 first decreases and then rapidly increases. The reason for the rapid increase is due to human water injection, which causes the water level to quickly rise. At the same time, the surface also shifts from surface subsidence to surface elevation. During the period from 2015 to 2018, the groundwater level decreased by 22 m and the surface subsidence was 200 mm. However, during the period from 2018 to 2021, the groundwater level rose by 30 m and the surface elevation was 76 mm, indicating that most of the displacement at the Well 2 site area was inelastic. As shown in Figure 21b, the groundwater level of Well 3 shows an upward trend, and the corresponding surface also shows an upward phenomenon. Based on Figure 21, it can be seen that their changes over time have good consistency, and there is a positive correlation between the groundwater level and the displacement time series, indicating that the land uplift and subsidence in Xi’an are controlled by the groundwater injection and exploitation processes.
Through the cross-correlation analysis, we determined the relationship between the vertical deformation time series and the groundwater level, which can quantify the impact of groundwater level fluctuations on land displacement. We obtained the cross−correlation coefficient parameters of two sequences, which can explain well the correlation between the land displacement time series and the groundwater level. The correlation coefficients between the groundwater data of Well 2 and Well 3 and the corresponding InSAR data are shown in Figure 22. Figure 22a shows a positive correlation between the displacement and groundwater level in Well 2, with a lag of 64 days. Figure 22b shows a positive correlation between the displacement and groundwater level in Well 3, with a lag of four days, evidencing the rapid response of land displacement to groundwater level fluctuation. Why there is a significant difference in the lag days between Well 2 and Well 3? This is because W3 well is located in a loess layer with a thickness of 100 m, while Well 2 well is located in an area with fine sand and gravel, thus leading to the different responses.
Since 2002, Xi’an has been supplied with water through the Heihe Reservoir, which greatly alleviates the phenomenon of groundwater depletion in Xi’an. As shown in Figure 23a, it is evident that the groundwater level of Well 1 well has been showing an upward trend. We further quantitatively evaluated the relationship between the secular variation in the groundwater level and the deformation of the uplifted area. The rebound of the groundwater level and the land uplift follow an exponential function curve [42,43]. We conducted an exponential regression of the groundwater level and displacement at the Well 1 site using the following equation:
d e f ( t ) = M ( e k t 1 )
where d e f ( t ) is the vertical deformation time series, M is the value that characterizes the cumulative displacement, and k [ 1 , 0 ] . Firstly, the groundwater-level curve and the exponential function are well matched (Figure 23a, green line, RMSE = 4.8), showing that the groundwater level tends to be stable but is still rising. Secondly, the curve of the deformation time series and the exponential function have a good fitting (Figure 23b, red line, RMSE = 5.2), showing that the observed uplift can be explained by the elastic rebound of the pores in the aquifer system due to the groundwater level recovery. The surface uplift in Xi’an has become the main mode of surface deformation, and the harm caused by the uplift is uncertain. More research is needed in the future.

6. Conclusions

The Xi’an region has been suffering from long-time problems of groundwater depletion, ground fissure hazards, and surface subsidence. By using the multi-temporal InSAR technology and ascending C-band Sentinel-1 SAR data from 2015 to 2022, and descending X-band TerraSAR SAR data from 2017 to 2019, the land deformation was investigated and analyzed in a Xi’an urban area. There are multiple subsidence funnel areas and a narrow and long uplift area extending from the southwest to the southeast in Xi’an, and through annual deformation extraction, it can be observed that land subsidence had shifted from subsidence to an uplift phenomenon. The deformation time series is highly correlated with the variation in the groundwater level in aquifers, evidencing that surface deformation changes are controlled by fluctuations in the groundwater level. There are positive correlations between the vertical deformation time series and the groundwater levels, with lags of 64 days in Well 2 and 4 days in Well 3. Further, through the modeling and analysis of the 22-year Well 1 groundwater level and the InSAR time series data of the adjacent uplift area, it is shown that the groundwater recharge has not yet reached a stable state, and the deformation uplift has not slowed down. It can be imagined that under the implementation of the “Water Diversion Project from Han to Wei“, the uplift phenomenon in the main urban area of Xi’an will be more significant, and attention should be paid to the harm of surface uplift to infrastructure in the later stage.
Through multi-dimensional deformation research, it has been shown that, due to the obstruction of groundwater diffusion by ground fissures, the flow direction of the groundwater is forced to be consistent with the direction of the ground fissures, leading to the occurrence of horizontal surface deformation in Xi’an. This study also demonstrated that by solving the deformation gradient and angular deformation, the critical conditions for the generation of ground fissures caused by uneven settlement were quantitatively evaluated, and new ground fissures in the YHZ region were predicted.
Our research results indicate that multi-dimensional deformation results and time-series deformation using InSAR have significant advantages in quantitatively evaluating the harm of ground fissures and the loss of groundwater reserves, which helps us to understand the relationship between ground fissures and surface deformation and evaluate the future of groundwater resource reserves in Xi’an under the background of large-scale water transfer projects.

Author Contributions

Methodology, X.Z., Z.C., R.G. and J.H.; Software, X.Z., B.X. and Q.Y.; Formal analysis, X.Z.; Resources, X.Z.; Writing—original draft, X.Z.; Writing—review & editing, R.G., C.Y. and T.X. All authors have read and agreed to the published version of the manuscript.

Funding

This work was supported by the National Natural Science Foundation of China under Grants 42030112 and 42201432, and the Technology and Fundamental Research Funds for the Central Universities of Central South University under Grant 2020zzts190.

Data Availability Statement

The data presented in this study are available from the corresponding author upon request.

Acknowledgments

The authors would like to thank the European Space Agency (ESA) for providing the Sentinel-1 data. The authors would like to thank the Xi’an Institute of Surveying and Mapping for providing the TerraSAR images, the leveling data, and the groundwater data.

Conflicts of Interest

The authors declare no conflict of interest.

References

  1. Herrera-Garcia, G.; Ezquerro, P.; Tomas, R.; Bejar-Pizarro, M.; Lopez-Vinielles, J.; Rossi, M.; Mateos, R.M.; Carreon-Freyre, D.; Lambert, J.; Teatini, P.; et al. Mapping the global threat of land subsidence. Science 2021, 371, 34–36. [Google Scholar] [CrossRef] [PubMed]
  2. Jeanne, P.; Farr, T.G.; Rutqvist, J.; Vasco, D.W. Role of agricultural activity on land subsidence in the San Joaquin Valley, California. J. Hydrol. 2019, 569, 462–469. [Google Scholar] [CrossRef] [Green Version]
  3. Murray, K.D. Short-lived pause in Central California subsidence after heavy winter precipitation of 2017. Sci. Adv. 2018, 4, eaar8144. [Google Scholar] [CrossRef] [Green Version]
  4. Chaussard, E.; Farr, T.G. A New Method for Isolating Elastic From Inelastic Deformation in Aquifer Systems: Application to the San Joaquin Valley, CA. Geophys. Res. Lett. 2019, 46, 10800–10809. [Google Scholar] [CrossRef]
  5. Hoffmann, J.; Galloway, D.L.; Zebker, H.A. Inverse modeling of interbed storage parameters using land subsidence observations, Antelope Valley, California. Water Resour. Res. 2003, 39, 1031. [Google Scholar] [CrossRef]
  6. Amelung, C.C. Land subsidence in central Mexico detected by ALOS InSAR time-series. Remote Sens. Environ. 2014, 140, 94–106. [Google Scholar]
  7. Cabralcano, E.; Solano Rojas, D.E.; Olivercabrera, T.; Salazartlaczani, L.; Wdowinski, S.; Demets, C.; Pacheco, J. Subsidence and associated shallow faulting hazard assessment in central Mexico using InSAR and GPS. In Proceedings of the Agu Fall Meeting, San Francisco, CA, USA, 15–19 December 2014. [Google Scholar]
  8. Castellazzi, P.; Martel, R.; Rivera, A.; Huang, J.; Pavlic, G.; Calderhead, A.I.; Chaussard, E.; Garfias, J.; Salas, J. Groundwater depletion in Central Mexico: Use of GRACE and InSAR to support water resources management. Water Resour. Res. 2016, 52, 5985–6003. [Google Scholar] [CrossRef]
  9. Cigna, F.; Tapete, D. Satellite InSAR survey of structurally-controlled land subsidence due to groundwater exploitation in the Aguascalientes Valley, Mexico. Remote Sens. Environ. 2021, 254, 112254. [Google Scholar] [CrossRef]
  10. Motagh, M.; Shamshiri, R.; Haghighi, M.H.; Wetzel, H.U.; Akbari, B.; Nahavandchi, H.; Roessner, S.; Arabi, S. Quantifying groundwater exploitation induced subsidence in the Rafsanjan plain, southeastern Iran, using InSAR time-series and in situ measurements. Eng. Geol. 2017, 218, 134–151. [Google Scholar] [CrossRef]
  11. Haghighi, M.H.; Motagh, M. Ground surface response to continuous compaction of aquifer system in Tehran, Iran: Results from a long-term multi-sensor InSAR analysis. Remote Sens. Environ. 2019, 221, 534–550. [Google Scholar] [CrossRef]
  12. Chaussard, E.; Amelung, F.; Abidin, H.; Hong, S.-H. Sinking cities in Indonesia: ALOS PALSAR detects rapid subsidence due to groundwater and gas extraction. Remote Sens. Environ. 2013, 128, 150–161. [Google Scholar] [CrossRef]
  13. Halipu, A.; Wang, X.; Iwasaki, E.; Yang, W.; Kondoh, A. Quantifying Water Consumption through the Satellite Estimation of Land Use/Land Cover and Groundwater Storage Changes in a Hyper-Arid Region of Egypt. Remote Sens. 2022, 14, 2608. [Google Scholar] [CrossRef]
  14. Gong, H.; Pan, Y.; Zheng, L.; Li, X.; Zhou, C. Long-term groundwater storage changes and land subsidence development in the North China Plain (1971–2015). Hydrogeol. J. 2018, 26, 1417–1427. [Google Scholar] [CrossRef] [Green Version]
  15. Shi, M.; Gong, H.; Gao, M.; Chen, B.; Zhou, C. Recent Ground Subsidence in the North China Plain, China, Revealed by Sentinel-1A Datasets. Remote Sens. 2020, 12, 3579. [Google Scholar] [CrossRef]
  16. Wei, F.; Wang, C.; Mu, D.; Min, Z.; Xu, H. Groundwater storage variations in the North China Plain from GRACE with spatial constraints. Chin. J. Geophys. 2017, 60, 1630–1642. [Google Scholar]
  17. Guo, H.; Zhang, Z.; Cheng, G.; Li, W.; Li, T.; Jiao, J.J. Groundwater-derived land subsidence in the North China Plain. Environ. Earth Sci. 2015, 74, 1415–1427. [Google Scholar] [CrossRef]
  18. Dong, Y.; Zhang, M.; Liu, J.; Zhang, X.; Feng, L. Coupling relationship between groundwater and ground fissures of land subsidence in Xi’an city and risk prevention and control technology. Northwest. Geol. 2019, 52, 95–102. [Google Scholar]
  19. Qu, W.; Lu, Z.; Zhang, Q.; Li, Z.; Peng, J.; Wang, Q.; Drummond, J.; Zhang, M. Kinematic model of crustal deformation of Fenwei basin, China based on GPS observations. J. Geodyn. 2014, 75, 1–8. [Google Scholar] [CrossRef]
  20. Bai, Z.; Wang, Y.; Balz, T. Beijing Land Subsidence Revealed Using PS-InSAR with Long Time Series TerraSAR-X SAR Data. Remote Sens. 2022, 14, 2529. [Google Scholar] [CrossRef]
  21. Chen, B.; Gong, H.; Chen, Y.; Li, X.; Zhou, C.; Lei, K.; Zhu, L.; Duan, L.; Zhao, X. Land subsidence and its relation with groundwater aquifers in Beijing Plain of China. Sci. Total Environ. 2020, 735, 139111. [Google Scholar] [CrossRef]
  22. Zhang, Y.; Wu, J.; Xue, Y.; Wang, Z.; Yao, Y.; Yan, X.; Wang, H. Land subsidence and uplift due to long-term groundwater extraction and artificial recharge in Shanghai, China. Hydrogeol. J. 2015, 23, 1851–1866. [Google Scholar] [CrossRef]
  23. Shi, G.; Ma, P.; Hu, X.; Huang, B.; Lin, H. Surface response and subsurface features during the restriction of groundwater exploitation in Suzhou (China) inferred from decadal SAR interferometry. Remote Sens. Environ. 2021, 256, 112327. [Google Scholar] [CrossRef]
  24. Han, Y.; Zou, J.; Lu, Z.; Qu, F.; Kang, Y.; Li, J. Ground deformation of wuhan, china, revealed by multi-temporal insar analysis. Remote Sens. 2020, 12, 3788. [Google Scholar] [CrossRef]
  25. Li, G.; Zhao, C.; Wang, B.; Peng, M.; Bai, L. Evolution of spatiotemporal ground deformation over 30 years in Xi’an, China, with multi-sensor SAR interferometry. J. Hydrol. 2023, 616, 128764. [Google Scholar] [CrossRef]
  26. Amelung, F.; Galloway, D.L.; Bell, J.W.; Zebker, H.A.; Laczniak, R.J. Sensing the ups and downs of Las Vegas: InSAR reveals structural control of land subsidence and aquifer-system deformation. Geology 1999, 27, 483–486. [Google Scholar] [CrossRef]
  27. Castellazzi, P.; Longuevergne, L.; Martel, R.; Rivera, A.; Brouard, C.; Chaussard, E. Quantitative mapping of groundwater depletion at the water management scale using a combined GRACE/InSAR approach. Remote Sens. Environ. 2018, 205, 408–418. [Google Scholar] [CrossRef]
  28. Bell, J.W. Permanent scatterer InSAR reveals seasonal and long-term aquifer-system response to groundwater pumping and artificial recharge. Water Resour. Res. 2008, 44, W02407. [Google Scholar] [CrossRef] [Green Version]
  29. Chaussard, E.; Bürgmann, R.; Shirzaei, M.; Fielding, E.J.; Baker, B. Predictability of hydraulic head changes and characterization of aquifer-system and fault properties from InSAR-derived ground deformation. J. Geophys. Res. Solid Earth 2014, 119, 6572–6590. [Google Scholar] [CrossRef]
  30. Chaussard, E.; Bürgmann, R. Remote Sensing of Ground Deformation for Monitoring Groundwater Management Practices: Application to the Santa Clara Valley during the 2012–2015 California Drought: Groundwater Monitoring with InSAR. J. Geophys. Res. Solid Earth 2017, 122, 8566–8582. [Google Scholar] [CrossRef] [Green Version]
  31. Jiang, L.; Bai, L.; Zhao, Y.; Cao, G.; Wang, H.; Sun, Q. Combining InSAR and Hydraulic Head Measurements to Estimate Aquifer Parameters and Storage Variations of Confined Aquifer System in Cangzhou, North China Plain. Water Resour. Res. 2018, 54, 8234–8252. [Google Scholar] [CrossRef]
  32. Murray, K.D.; Lohman, R.B.; Kim, J.; Holt, W.E. An Alternative Approach for Constraining 3D-Displacements With InSAR, Applied to a Fault-Bounded Groundwater Entrainment Field in California. J. Geophys. Res. Solid Earth JGR 2021, 126, e2020JB021137. [Google Scholar] [CrossRef]
  33. Berardino, P.; Fornaro, G.; Lanari, R.; Sansosti, E. A New Algorithm for Surface Deformation Monitoring Based on Small Baseline Differential SAR Interferograms. IEEE Trans. Geosci. Remote Sens. 2002, 40, 2375–2383. [Google Scholar] [CrossRef] [Green Version]
  34. Hooper, A. A multi-temporal InSAR method incorporating both persistent scatterer and small baseline approaches. Geophys. Res. Lett. 2008, 35, 96–106. [Google Scholar] [CrossRef] [Green Version]
  35. Peng, M.; Zhao, C.; Zhang, Q.; Lu, Z.; Li, Z. Research on Spatiotemporal Land Deformation (2012–2018) over Xi’an, China, with Multi-Sensor SAR Datasets. Remote Sens. 2019, 11, 664. [Google Scholar] [CrossRef] [Green Version]
  36. Wright, T.J.; Parsons, B.E.; Lu, Z. Toward mapping surface deformation in three dimensions using InSAR. Geophys. Res. Lett. 2004, 31. [Google Scholar] [CrossRef] [Green Version]
  37. Hu, J.; Li, Z.W.; Ding, X.L.; Zhu, J.J.; Zhang, L.; Sun, Q. Resolving three-dimensional surface displacements from InSAR measurements: A review. Earth Sci. Rev. 2014, 133, 1–17. [Google Scholar] [CrossRef]
  38. Bouwer, H. Land Subsidence and Cracking Due to Ground-Water Depletion. Ground Water 1977, 15, 358–364. [Google Scholar] [CrossRef]
  39. Macdonald, D.H.; Skempton, A.W. The Allowable Settlements of Buildings. ICE Proc. Eng. Div. 1956, 5, 727–768. [Google Scholar]
  40. Mcdonnell, R.A.; Lloyd, C.; Burrough, P. Principles of Geographical Information Systems; Oxford University Press: Oxford, UK, 1998. [Google Scholar]
  41. Cigna, F.; Tapete, D. Present-day land subsidence rates, surface faulting hazard and risk in Mexico City with 2014–2020 Sentinel-1 IW InSAR. Remote Sens. Environ. 2021, 253, 112161. [Google Scholar] [CrossRef]
  42. Terzaghi, K. Principles of soil mechanics: IV Settlement and consolidation of clay. Eng. News Rec. 1925, 95, 874–878. [Google Scholar]
  43. Hu, X.; Bürgmann, R. Aquifer deformation and active faulting in Salt Lake Valley, Utah, USA. Earth Planet. Sci. Lett. 2020, 547, 116471. [Google Scholar] [CrossRef]
Figure 1. Overview of the research area. (a) Geological map of Xi’an, China, where tectonic faults and ground fissures are superimposed [25]. (b) Location of Xi’an in China. (c) Location of the research area and the SAR data coverage used in this study.
Remotesensing 15 03567 g001
Figure 2. Schematic diagram of the gradient calculation method.
Remotesensing 15 03567 g002
Figure 3. Flowchart of the data processing procedure (TSX: TerraSAR and S1: Sentinel-1).
Remotesensing 15 03567 g003
Figure 4. Temporal and perpendicular baseline combinations for the SAR datasets from the two SAR sensors used in this study: (a) TSX and (b) Sentinel-1A.
Remotesensing 15 03567 g004
Figure 5. The map of S1 mean deformation rate in the Xi’an region from 2015 to 2022.
Remotesensing 15 03567 g005
Figure 6. Maps of mean vertical deformation in Xi’an for different years: (a) 2016, (b) 2017, (c) 2018, (d) 2019, (e) 2020, and (f) 2021.
Remotesensing 15 03567 g006
Figure 7. Map of TerraSAR mean deformation rate in the Xi’an region from 2017 to 2019.
Remotesensing 15 03567 g007
Figure 8. Deformation time series at points P1–P3 from 2015 to 2022.
Remotesensing 15 03567 g008
Figure 9. Comparison of the InSAR measurements with the level measurements (a) in 2016 and (b) in 2020.
Remotesensing 15 03567 g009
Figure 10. Field survey results.
Remotesensing 15 03567 g010
Figure 11. Cross-comparison between S1 vertical deformation rate and TSX vertical deformation rate: (a) S1 vertical deformation rate, (b) TSX vertical deformation rate, and (c) cross−comparison results.
Remotesensing 15 03567 g011
Figure 12. Multi-dimensional deformation: (a) up deformation and (b) east deformation.
Remotesensing 15 03567 g012
Figure 13. Deformation rates along Xi’an subway lines. (a) Sentinel; (b) TerraSAR.
Remotesensing 15 03567 g013
Figure 14. Deformation rate profile of Line 5.
Remotesensing 15 03567 g014
Figure 15. Time series displacement of P1.
Remotesensing 15 03567 g015
Figure 16. Optical map: (a) 2017 and (b) 2022.
Remotesensing 15 03567 g016
Figure 17. (a) Cumulative subsidence map, (b) uplift, and (c) subsidence.
Remotesensing 15 03567 g017
Figure 18. Analysis of subsidence-induced ground fissure hazards in Xi’an City from 2015–2022 from S1 results: (a) angular distortions, (b) angular distortions in the YHP area, and (c) angular distortions in the DJP area.
Remotesensing 15 03567 g018
Figure 19. Analysis of subsidence-induced ground fissure hazards in Xi’an City from 2015–2022 from S1 results: derived classification of hazard levels.
Remotesensing 15 03567 g019
Figure 20. Prediction results of ground fissures (the red dashed line predicts a new ground fissure, and the red solid line shows an existing ground fissure).
Remotesensing 15 03567 g020
Figure 21. Comparison between the time series of vertical deformation and the time series of groundwater-level change at two water wells: (a) Well 2 and (b) Well 3.
Remotesensing 15 03567 g021
Figure 22. Correlation analysis between the times series of vertical deformation and groundwater-level change at two water wells: (a) Well 2 and (b) Well 3.
Remotesensing 15 03567 g022
Figure 23. (a) Groundwater-level change at Well 1 between 2000 and 2021 and (b) ground uplift at this location between 2015 and 2022 based on the S1 data.
Remotesensing 15 03567 g023
Table 1. Data of Sentinel-1 and TerraSAR.
SensorBandWavelength (cm)Incidence
Angle   ( ° )
Heading   ( ° ) TrackPolarizationPass
Direction
Number of ImagesDate Range
S1C5.639.3−12.984VVAscending18720 June 2015–
25 July 2022
TSXX3.128.6190.613HHDescending2512 May 2017–
16 April 2019
Table 2. Properties of the subway lines in the study area.
NameFirst
Opening
Date
Sentinel-1TerraSAR
Average
Deformation
Rate
(mm/yr)
Maximum
Deformation Rate
(mm/yr)
Average
Deformation Rate
(mm/yr)
Maximum Deformation Rate
(mm/yr)
Line 115 September 2013−2−9−4−11
Line 229 September 2006−3−30−4−32
Line 308 November 2016−2−24−2−15
Line 426 December 2018−1−14−3−14
Line 528 December 2020−4−33−3−21
Line 628 December 2020−2−14−1−9
Disclaimer/Publisher’s Note: The statements, opinions and data contained in all publications are solely those of the individual author(s) and contributor(s) and not of MDPI and/or the editor(s). MDPI and/or the editor(s) disclaim responsibility for any injury to people or property resulting from any ideas, methods, instructions or products referred to in the content.

