
Geographic-Information-System-Based Risk Assessment of Flooding in Changchun Urban Rail Transit System
Abstract
:1. Introduction
2. Methodology and Data Sources
2.1. Methodology
2.2. Data Sources
3. Overview of the Study Area
3.1. Physical Geography Overview
3.2. Socio-Economic Profile
4. Analysis of Indicators and Calculation of Weights
4.1. Analysis of Indicators
4.1.1. Hazard Indicators
- (1)
- Maximum daily rainfall: The maximum daily rainfall in Changchun is concentrated in the easternmost part of the city (Figure 3a). The maximum daily rainfall is closely related to the occurrence of flood events and the degree of impact on the metro system and can be directly correlated with the metro system. The design and construction process of the metro system needs to determine the maximum daily rainfall according to the local climatic conditions, which has a significant impact on the drainage system of the metro system. When flooding threatens the metro system, it needs to be quickly discharged through the drainage system [27]. If the maximum daily rainfall is too high, the drainage system of the subway system may not be able to bear the impact due to the affected capacity of the drainage system.
- (2)
- NDVI (normalized difference vegetation index): Changchun City has less vegetation cover in the urban area and a higher vegetation cover in the east (Figure 3b). A high vegetation cover reduces the runoff rate, slows down the water flow through vegetation absorption, and reduces the impact of flooding on the subway system. The root system of vegetation also stabilizes the soil, reduces soil erosion and sediment accumulation, and helps to keep the drainage system around the subway system open, which is the reason why we selected NDVI as the hazard index [28].
- (3)
- Average annual rainfall: Changchun City’s precipitation decreases from east to west [10]. Rainfall is one of the main causes of flooding in the subway (Figure 3c). The annual rainfall is a comprehensive consideration that reflects the overall rainfall in the Changchun area and is directly correlated with the flood risk.
- (4)
- Rainfall days (DR > 50 mm): Changchun has more rainfall days in the eastern part of the city (Figure 3d). The selection of this threshold is based on the understanding of the rainfall characteristics and drainage system capacity in the Changchun area, which can accurately determine the flood risk and provide the basis for early warning and decision making. This indicator is practical and operable. If there are too many days in which the rainfall is greater than 50 mm, it may lead to the overloading of the drainage system, making it unable to drain the rainwater from the metro system in time, thus leading to waterlogging [12].

4.1.2. Exposure Indicators
- (1)
- Population density: The population of Changchun is mainly concentrated in the western part of the main urban area and is sparser elsewhere (Figure 4a). Population density is one of the very important exposure indicators in metro flooding hazards, as it is directly related to the number of potentially affected people and areas. A high population density means that more people and buildings are distributed in the same area [29] and more people and buildings are likely to be affected in case of metro flooding. Population density, as an expositional indicator, can guide the planning and preventive measures of the Changchun metro system, especially in high population density areas; priority can be given to strengthening drainage systems and flood control facilities.
- (2)
- Elevation: The elevation of Changchun City is mainly concentrated in the east and south, and the rail transit system is built in the western part of the urban area, where the elevation is lower (Figure 4b). Elevation is an important factor in assessing the vulnerability of the metro system to flooding. The lower the elevation, the more vulnerable the metro system is to flooding, and vice versa [30]. By knowing the elevation information in the area where the Changchun rail transit system is located, potential inundation areas can be identified, and a basis can be provided for developing early warning systems and emergency response plans. Elevation information can also guide planning and improvement measures, especially in areas of high flood risk, where enhanced flood protection measures and improved drainage systems can be considered.
- (3)
- Slope: The slope is extracted from the elevation in the GIS, and the slope can affect the drainage performance of the subway platform or inter-station road (Figure 4c). If the slope of a subway platform or inter-station road is too small or lacks drainage facilities, it may lead to ponding and flooding when rainfall is high, thus affecting the operation of the subway system [31]. Slope, as an indicator of exposure, can also be used to assess the flood protection that the facility needs and to guide planning and improvement measures.
- (4)
- LULC (land use and land cover): Different land use types result in different runoff conditions due to ground cover, which affects the flood risk of the metro system (Figure 4d). If the land use type near the metro station is urban construction land and the surface cover is mainly made of cement, asphalt, and other concrete materials, it will lead to a large amount of runoff not being able to infiltrate into the soil after rainfall and form ponding water, increasing the risk of flooding. The surface cover conditions of different land use types can affect the ability of vertical infiltration [32]. In this paper, we classify artificial ground as very high exposure, water bodies as medium exposure, and forest land as very low exposure.
- (5)
- Main road density: The areas with a high road network density in Changchun are concentrated in the western part of the main urban area, and the distribution of underground transportation facilities such as the subway system is also relatively dense (Figure 4e). This means that the population density and building density may also be high [33], which may lead to areas around the metro system being prone to flooding, increasing the risk of flooding in the metro system. The main road density reflects the distribution and connectivity of urban roads, which not only provides information on the main paths of the flood flows, but is also closely related to the drainage system of the city.
- (6)
- River network density: Areas with a higher river network density have a higher likelihood of flooding (Figure 4f). When the area receives high rainfall or there is prolonged rainfall, the rivers around the metro system may rise, increasing the exposure of the metro system to flood risk. By analyzing the density of the river network, potential flood accumulation areas and flow paths can be identified to help assess the exposure of the Changchun metro system to flood events. Rivers in areas with a high river network density may interact with each other to form river systems. During high rainfall, the water flow in the river system may increase and be more difficult to control, posing a flood risk to the metro system [30].
- (7)
- Exit number: Metro stations with a large number of entrances and exits are usually located in areas with heavy traffic, dense surrounding buildings, and complex layers of underground pipes (Figure 4g). During rainfall, the drainage system is prone to failure and serious water accumulation on the ground, which directly affects the entrance and exit channels of the subway station and increases the subway stations’ exposure to flood risk. The exit number, selected as an indicator of exposure, can provide key information to help assess the flood risk of the Changchun rail transit system. The number of exits reflects the degree of exposure of the rail transit system to flood intrusion, potential inundation risk, evacuation difficulties, and the degree of association with the urban drainage system, which can help identify potential risk areas and improve emergency response capabilities.


4.1.3. Vulnerability Indicators
- (1)
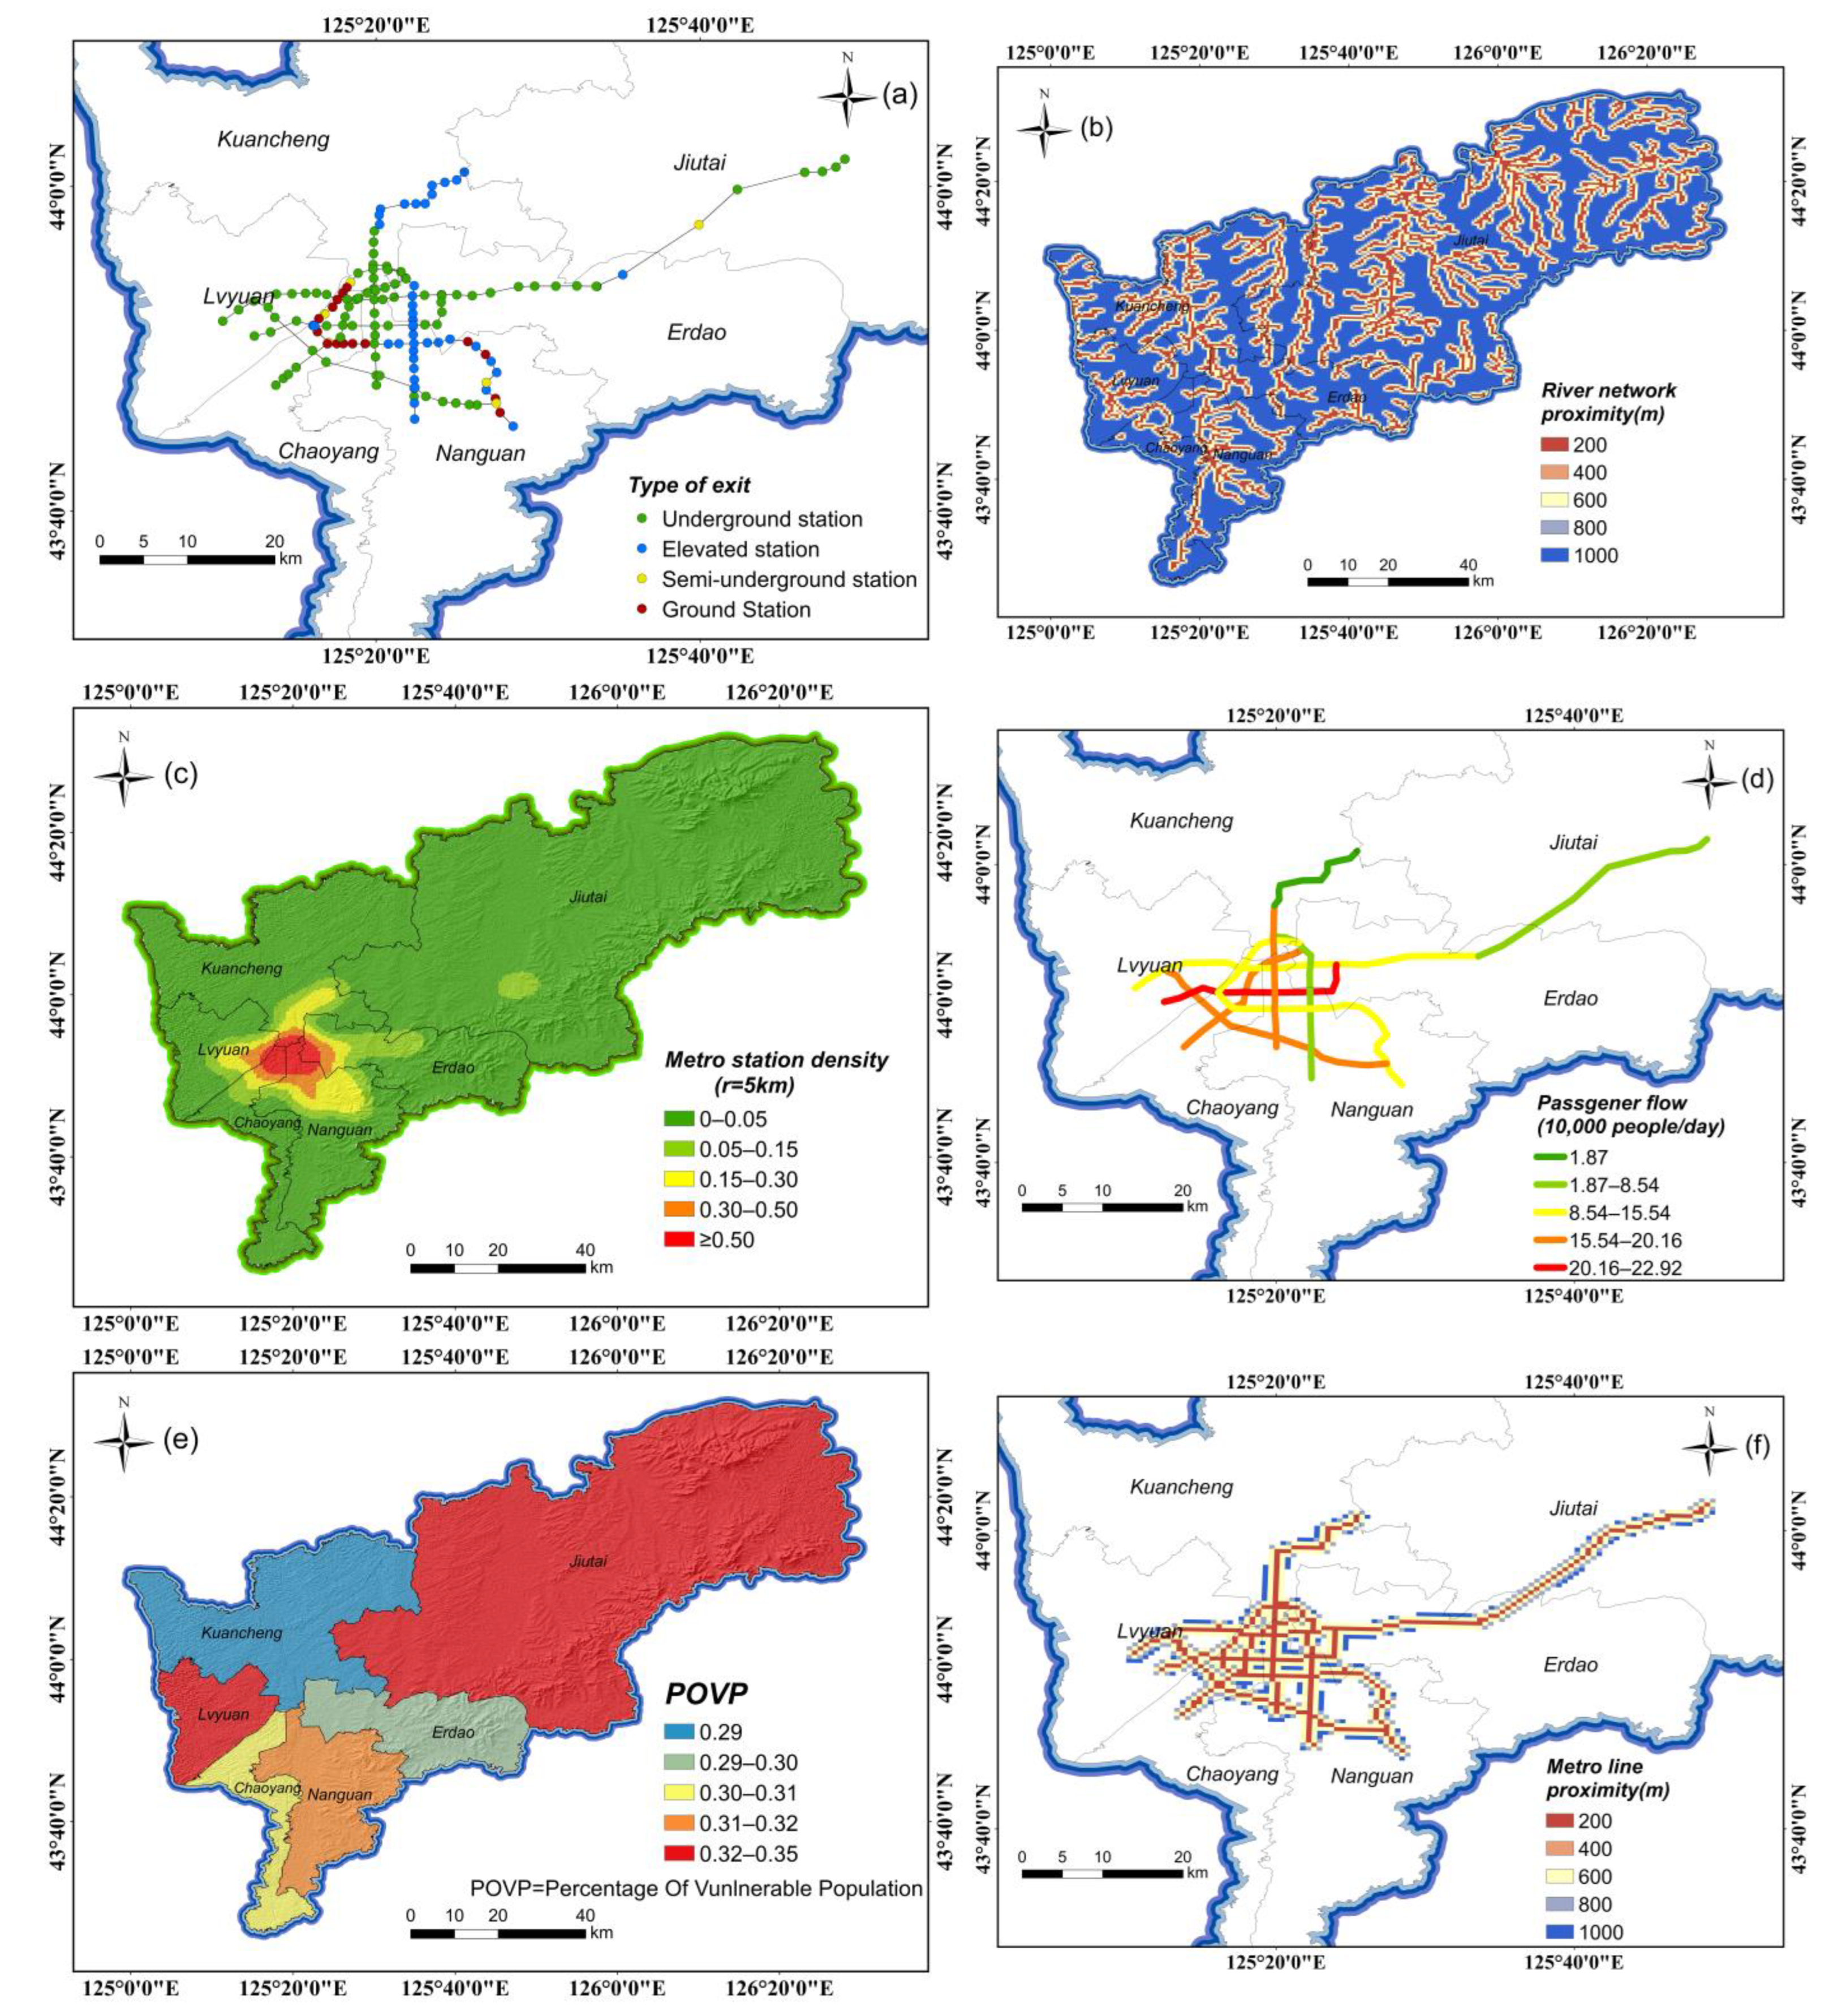
- Type of metro stations: After the field survey, the Changchun metro stations were divided into four categories, i.e., above ground, underground, semi-underground, and elevated stations (Figure 5a). Elevated stations are fully exposed and have the highest risk level, above-ground stations are second to elevated stations, and underground stations linked to underground shopping malls, train stations, and other structures have the lowest risk level.
- (2)
- River network proximity: We set the proximity of the river network as 200 m, 400 m, 600 m, 800 m, and 1000 m from the nearest river (Figure 5b). Generally, the closer the river, the higher the flood risk and vulnerability of the metro system, and vice versa. The river network proximity reflects the degree of flood threat to the metro station, as well as the potential inundation risk, differences in the geological conditions, and emergency evacuation.
- (3)
- Metro station density: The metro station density refers to the number of stations per unit area in the metro system, which is also an important factor in the metro flood risk assessment and has a certain influence on the outcomes of the vulnerability assessment (Figure 5c). Changchun metro stations are densely concentrated in the central city, and a higher metro station density means there are shorter distances between stations in the metro system, which means passengers can quickly reach any station in a short time. However, at the same time, a higher metro station density also means that in the case of flood events, the affected area is larger, the area of metro stations and the number of internal platforms inside stations are relatively high, and the cost of flood protection measures is also higher. This can increase the vulnerability of the metro system and lead to greater damage to the metro system [34]. We selected metro station density as a vulnerability indicator to reflect the connectivity, evacuation efficiency, flood resilience, and operational effectiveness of the metro system during flood events.
- (4)
- Passenger flow: Changchun rail transit lines 1, 2, and 5 are the backbone lines, while the other lines are secondary lines (Figure 5d). A higher passenger flow means a higher load on the metro system. In heavy rain, water and dirt will cause the metro system to fail or paralyze more easily, making the metro system more susceptible to flood risks and increasing the difficulty of coping with flooding. Moreover, changes in the passenger flow will also affect the implementation of the emergency plan for metro flooding, especially in the evacuation process, i.e., how to ensure the safe evacuation of the passengers. Under flooding circumstances, quick evacuation could become a difficult part of the emergency plan, and the increase in passenger flow will increase this difficulty [35]. By considering the passenger flow, the staffing pressure and response capacity of vulnerable stations in the Changchun subway system can be assessed, providing an important reference for the development of corresponding emergency plans and improvement measures.
- (5)
- Percentage of vulnerable population: The proportion of vulnerable population is larger in Green Park and Jiutai District (Figure 5e). The vulnerable population faces higher risks in the case of metro flooding, and it is likely to be difficult to secure help in time. Vulnerable populations have lower incomes and lack sufficient financial support to take safety precautions and receive timely emergency assistance. The economic losses and impacts during floods are greater, and the financial difficulties of recovery and reconstruction are more severe. Vulnerable people usually have fewer health and medical resources, and their ability to help themselves and help each other is weaker [36]. The percentage of vulnerable population was chosen as a vulnerability indicator to consider the distribution and vulnerability of special groups in the metro system.
- (6)
- Metro line proximity: Areas that are closer to metro lines are generally considered to have a higher vulnerability in metro flood risk assessments because they will be more directly and severely affected by flooding, and the metro lines will be more easily damaged (Figure 5f). In addition, if the areas closer to the metro lines are densely built, it may cause the accumulation of flood water in these buildings, increasing the risk of disaster and exacerbating vulnerability. Areas at a greater distance from the subway lines may also be affected by flood events, but their risk level is generally considered relatively low in the assessment due to their distance from the subway lines. The choice of metro line proximity as a vulnerability indicator helps to assess the vulnerability of the metro system and its surrounding areas to flood events.
- (7)
- Metro line density: We generated the Changchun rail transit line density by using the subway line density in GIS with a search radius of 1 km (Figure 5g). The densest concentration of rail transit in Changchun is in the central city. Areas with a higher metro line density are generally considered to have a higher vulnerability in the metro flood risk assessment because when flood events occur, more metro tunnels and stations may be inundated and damaged, and metro services may be interrupted for longer periods of time, resulting in more significant impacts on the city and passengers. On the other hand, cities or regions with lower metro line densities may not be susceptible to flood risk in the metro flood risk assessment, as their vulnerability ratings are relatively low due to the smaller size of the metro.


4.1.4. Emergency Response and Recovery Capability Indicators
- (1)
- GDP: The GDP, as an important economic indicator, is good for enhancing the disaster prevention and mitigation capacity of metro flooding [37], strengthening the construction of public facilities and urban planning, and providing a good post-disaster reconstruction capacity afterward (Figure 6a). The choice of using the GDP as an emergency response and recovery capability indicator helps us to assess the economic resource input, post-disaster recovery capacity, and social welfare protection level of the area where the Changchun rail transit system is located.
- (2)
- Distance to main road: The distance to main roads refers to the distance from a location to the nearest major road. In the metro flood risk assessment, the distance to the main road has a certain influence on the disaster prevention and mitigation capacity (Figure 6b). In the event of flooding, the main road may be submerged, or traffic disruption may occur, thus affecting rescue and evacuation. When the distance from the main road is far, it may take longer and cost more for people to reach safety, which may affect the efficiency and timeliness of emergency evacuation. On the contrary, locations closer to the main roads may be more convenient and efficient for rescue and evacuation, allowing for a faster escape from flooded areas and reducing casualties. The choice of using the distance to main roads as an emergency response and recovery capability indicator helps us to assess the evacuation and rescue capability, material transportation, emergency services and support, and communication and liaison capability of the area where the Changchun metro system is located.
- (3)
- Education status: Education status refers to the proportion of a given population with different levels of education (Figure 6c). In the metro flood risk assessment, the level of education has a certain influence on the disaster prevention and mitigation ability. Personnel with higher education or professional training may be more advantageous in terms of disaster preparedness and response capabilities. Highly educated people may have higher scientific literacy and skills, be more knowledgeable about disaster warning information and response measures, and be able to take the right and effective measures to protect themselves and others. They are also likely to be more aware of disaster risks and be prepared to respond and mitigate possible consequences. In contrast, people with low levels of education may lack a proper understanding and assessment of disaster risks and lack the relevant knowledge and skills to respond to disasters. These people may perform wrong or unsafe actions or fail to understand or perceive risks when disasters occur, leading to increased losses [38]. In summary, the selection of education level as an emergency response and recovery capability indicator helps to assess the preparedness and action capacity of residents in the area where the Changchun rail transit system is located.
- (4)
- Density of drainage network: We define the drainage pipe network density as the length of regional pipes compared to the area of the upper region. The drainage pipe network density has an important impact on the metro flood risk assessment (Figure 6d). The higher the drainage network density, the better the metro system is able to handle and discharge the water flow in the face of flooding, and therefore, the flood risk assessment results will be more optimistic. In summary, using the drainage network density as an emergency response and recovery capability indicator can help us to assess the drainage capacity of the area where the metro system is located and its ability to cope with flood risks, and provide an important basis for flood resistance measures and emergency planning of the metro system to ensure the safe operation of the metro system and the safety of the passengers.

4.2. Calculation of Weights
4.2.1. Using the AHP Hierarchical Analysis Method to Calculate the Subjective Weights
- (1)
- Establish the hierarchy: Hierarchize the decision problem and construct a hierarchy consisting of decision level, criterion level, indicator level, and sub-indicator level.
- (2)
- Quantify the hierarchy: In this paper, each element in the indicator layer is ranked according to the input provided by five experts from the disaster research team of Northeast Normal University, and their relative importance is compared using numbers from 1 to 9, where 1 represents equal importance and 9 represents extreme importance.
- (3)
- Calculation of weights: The weights are calculated using the mathematical model of the hierarchical analysis method. The calculation process involves calculating the feature vector of each level and the weight of each element.
- (4)
- Consistency test: The maximum eigenvalue λmax of the matrix is obtained, while the corresponding eigenvectors are obtained, and the consistency of the judgment matrix is verified according to Equations (1) and (2), in Table 2.
- (5)
- Comprehensive analysis: The obtained weights are used for the comprehensive analysis to find the optimal solution or decision.
4.2.2. Improvement of Entropy Weight Method to Calculate Objective Weights
- (1)
- Construct the original index data matrix. Assuming that there are m samples to be evaluated and n evaluation indicators, the original indicator data matrix is formed as follows [41]:where denotes the value of the i-th sample and the j-th evaluation index.
- (2)
- Data processing: In order to eliminate the influence of different levels on the evaluation results, the indicators are normalized, and the single standardized data are calculated using the following formula:
- (3)
- Calculate the share of the ith sample in the total value of the indicator for the jth indicator as follows:
- (4)
- Calculate the entropy value of the jth indicator as follows:where constants , k > 0.
- (5)
- Calculate the improved entropy value as follows:
- (6)
- Calculate the coefficient of variation of the jth indicator dj. The entropy method assigns weights to each indicator based on the degree of difference in the sign value of each indicator so as to derive the corresponding weight of each indicator, . The larger it is, the greater the importance of the indicator, as calculated using the following formula:
- (7)
- Calculate the objective weights as follows:
4.2.3. Calculating the Combined Weights
5. Modeling of Flood Risk along Rail Transit Systems
5.1. Guideline Layer Modeling of Flood Risk along Rail Transit Systems
5.2. Modeling of Flood Risk Index along the Metro System
6. Results and Analysis
6.1. Hazard, Exposure, Vulnerability, and Emergency Response and Recovery Capability Level Maps
6.2. Regional Flood Risk and Its Validation
6.2.1. Regional Flood Risk
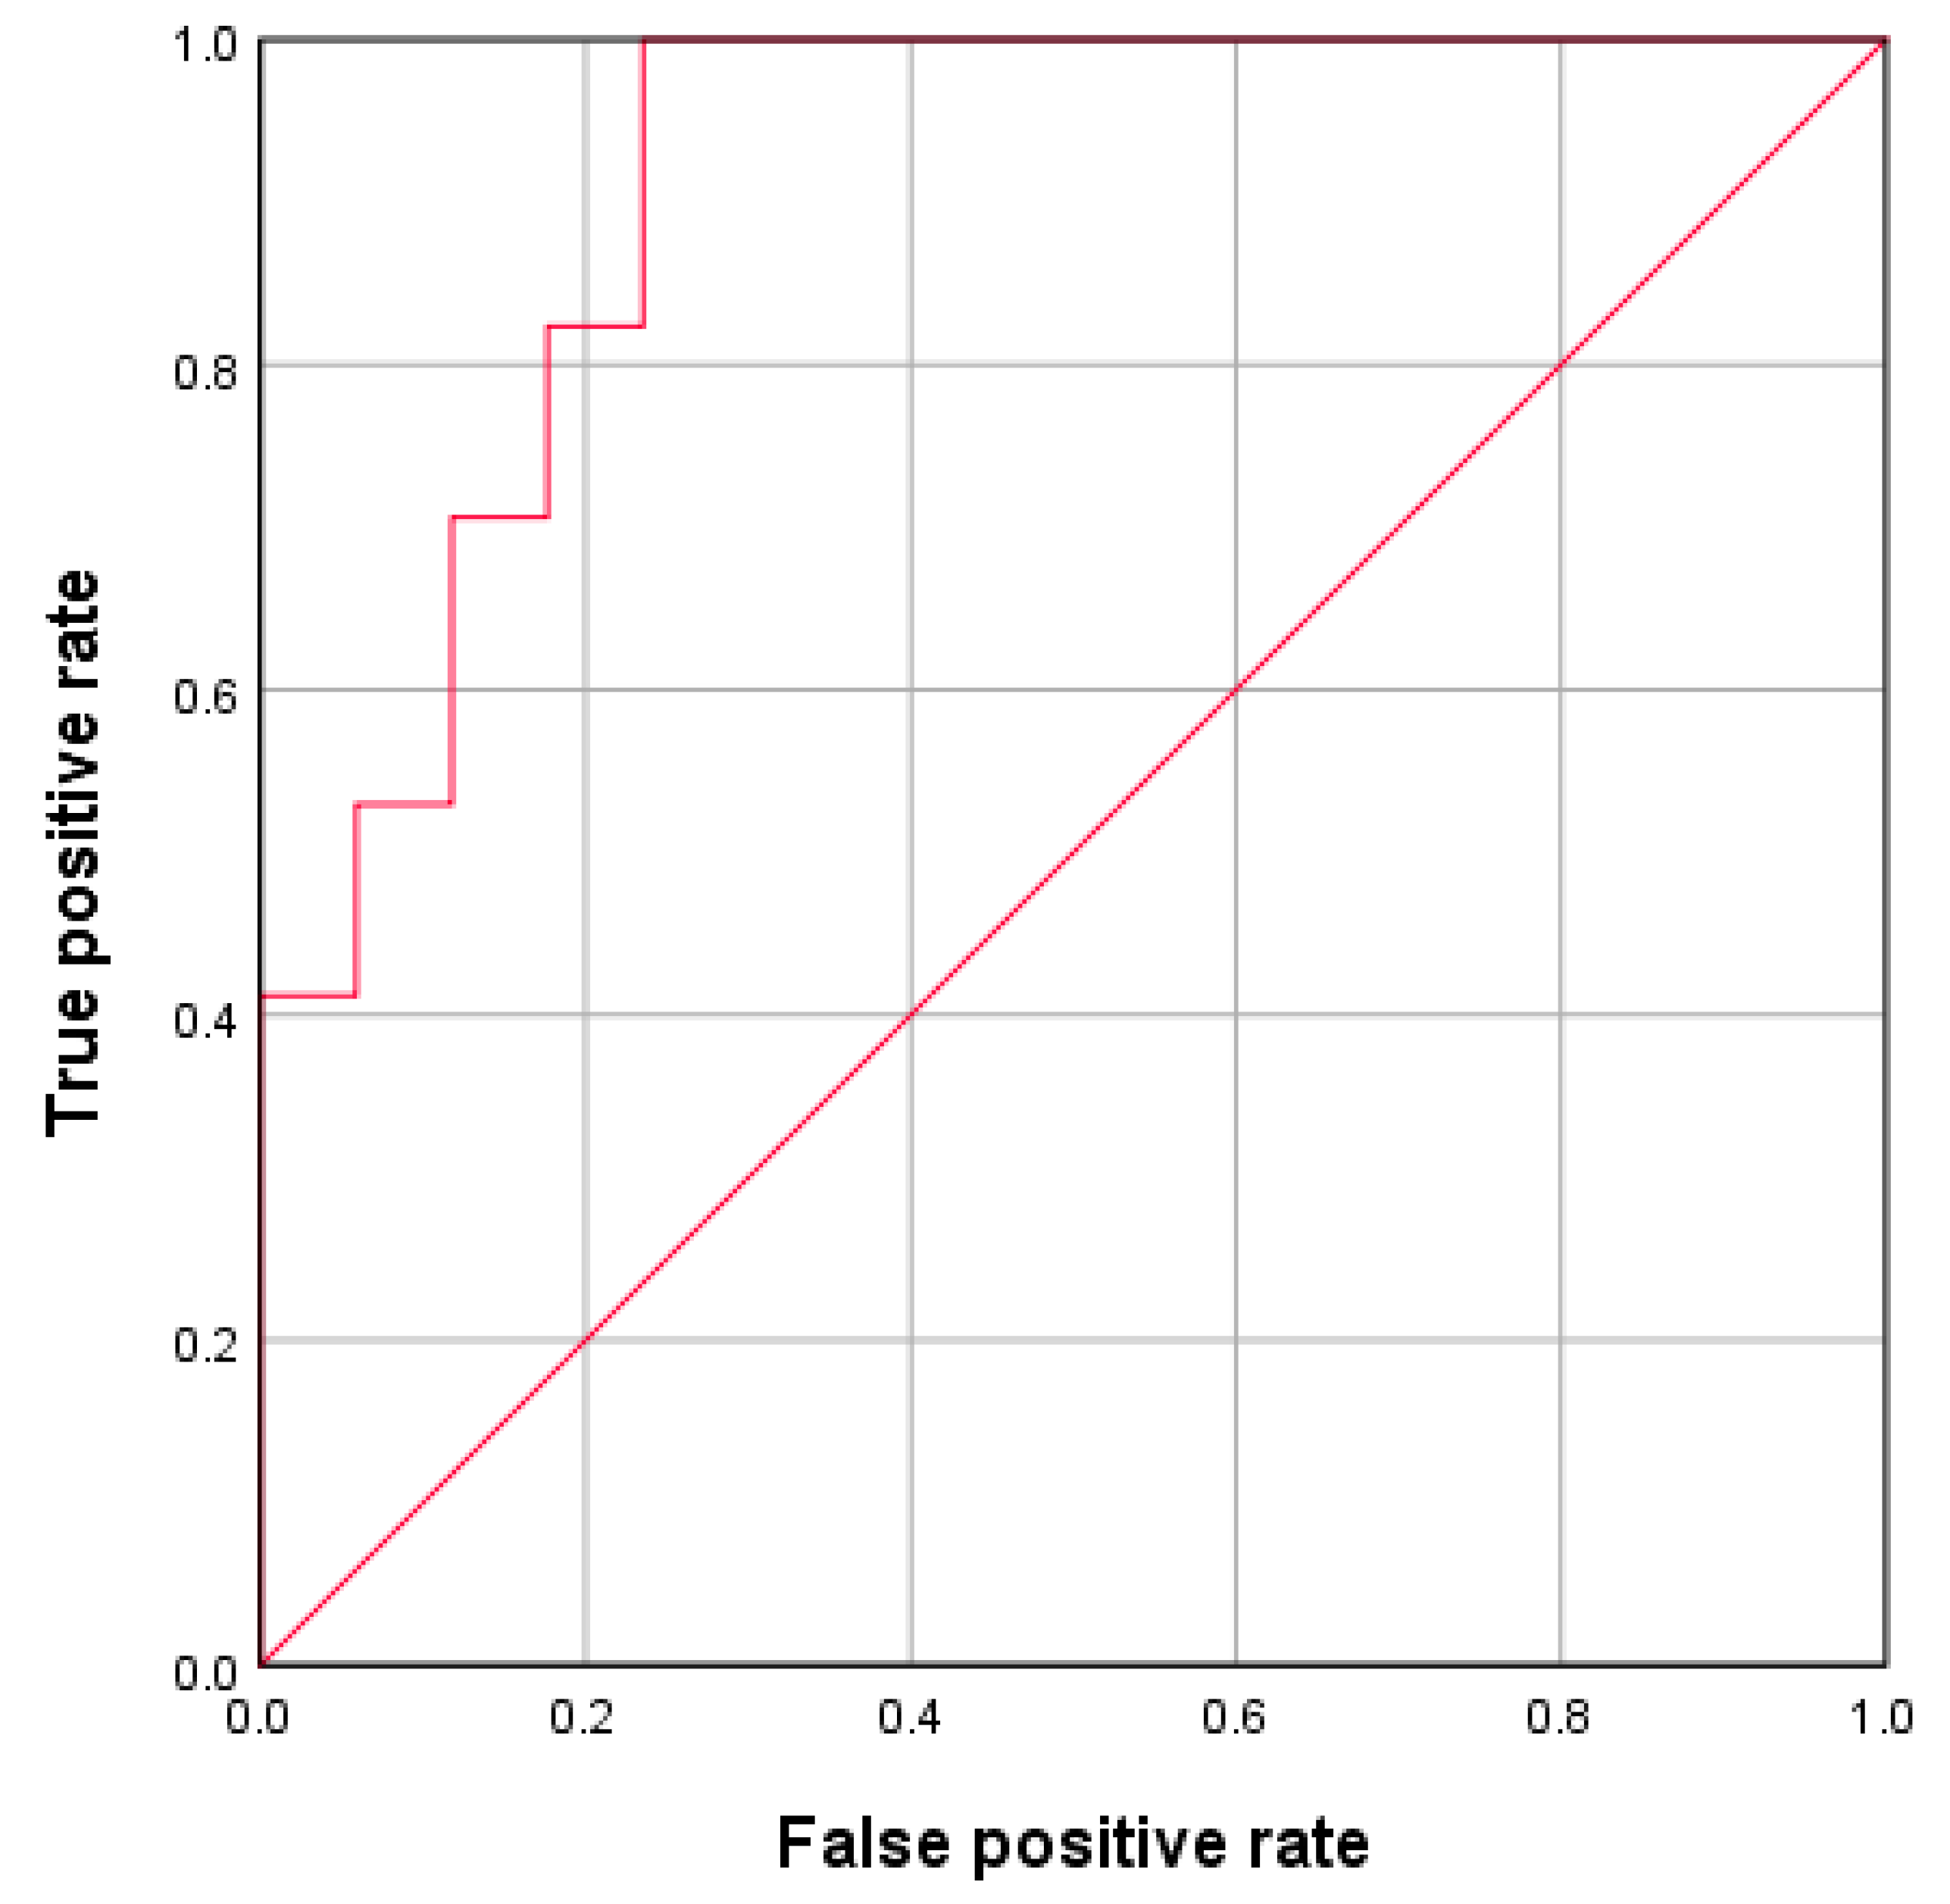
6.2.2. Validation
6.3. Flood Risk of Rail Transit Systems and Its Validation
6.3.1. Flood Risk of Rail Transit System
6.3.2. Validation
7. Discussion
8. Conclusions
- (1)
- The flood risk of Changchun’s rail transit system is decreasing from the central urban area to the surrounding areas, reflecting a dispersion from the center to the outside. The rail transit located in the central urban area has a higher risk level, and the lines that are under construction need to be prepared in advance for prevention, while those that are already built need more human and material resources for protection.
- (2)
- The very-high-risk and high-risk areas of the Changchun rail transit system account for 15% and 16.2%, respectively. Both of these two risk categories account for a total of 31.2% of the total area, most of which is located in the central urban area. A large area of rail transit is at a higher risk of flooding and needs to be paid attention to in order to prevent flooding in the future.
- (3)
- In this paper, we proposed an MCDA method based on GIS combined with the AHP and improved entropy weight methods using the following four factors of disaster for the first time: hazard, exposure, vulnerability, and emergency response and recovery capability. Based on this integrated approach, we established a risk assessment system containing 22 indicators from disaster formation theory. Because the indicator system established by this method is complete and integrates several aspects, it can be quickly applied to different cities and facilitated for other urban researchers.
Author Contributions
Funding
Data Availability Statement
Conflicts of Interest
References
- Lyu, H.-M.; Sun, W.-J.; Shen, S.-L.; Arulrajah, A. Flood risk assessment in metro systems of mega-cities using a GIS-based modeling approach. Sci. Total Environ. 2018, 626, 1012–1025. [Google Scholar] [CrossRef] [PubMed]
- Wang, G.; Liu, Y.; Hu, Z.; Zhang, G.; Liu, J.; Lyu, Y.; Gu, Y.; Huang, X.; Zhang, Q.; Liu, L. Flood Risk Assessment of Subway Systems in Metropolitan Areas under Land Subsidence Scenario: A Case Study of Beijing. Remote Sens. 2021, 13, 637. [Google Scholar] [CrossRef]
- Lyu, H.-M.; Shen, S.-L.; Zhou, A.; Yang, J. Perspectives for flood risk assessment and management for mega-city metro system. Tunn. Undergr. Space Technol. 2019, 84, 31–44. [Google Scholar] [CrossRef]
- Chen, Y.-R.; Yeh, C.-H.; Yu, B. Integrated application of the analytic hierarchy process and the geographic information system for flood risk assessment and flood plain management in Taiwan. Nat. Hazards 2011, 59, 1261–1276. [Google Scholar] [CrossRef] [Green Version]
- Wang, G.; Liu, L.; Shi, P.; Zhang, G.; Liu, J. Flood Risk Assessment of Metro System Using Improved Trapezoidal Fuzzy AHP: A Case Study of Guangzhou. Remote Sens. 2021, 13, 5154. [Google Scholar] [CrossRef]
- Mercado, J.M.R.; Kawamura, A.; Amaguchi, H. Interrelationships of the barriers to integrated flood risk management adaptation in Metro Manila, Philippines. Int. J. Disaster Risk Reduct. 2020, 49, 101683. [Google Scholar] [CrossRef]
- Liu, W.; Zhao, T.; Zhou, W.; Tang, J. Safety risk factors of metro tunnel construction in China: An integrated study with EFA and SEM. Saf. Sci. 2018, 105, 98–113. [Google Scholar] [CrossRef]
- Duan, C.; Zhang, J.; Chen, Y.; Lang, Q.; Zhang, Y.; Wu, C.; Zhang, Z. Comprehensive Risk Assessment of Urban Waterlogging Disaster Based on MCDA-GIS Integration: The Case Study of Changchun, China. Remote Sens. 2022, 14, 3101. [Google Scholar] [CrossRef]
- Wagenaar, D.; Dahm, R.; Diermanse, F.; Dias, W.; Dissanayake, D.; Vajja, H.; Gehrels, J.; Bouwer, L. Evaluating adaptation measures for reducing flood risk: A case study in the city of Colombo, Sri Lanka. Int. J. Disaster Risk Reduct. 2019, 37, 101162. [Google Scholar] [CrossRef]
- Jongman, B. Effective adaptation to rising flood risk. Nat. Commun. 2018, 9, 1986. [Google Scholar] [CrossRef] [Green Version]
- Bracken, L.J.; Oughton, E.A.; Donaldson, A.; Cook, B.; Forrester, J.; Spray, C.; Cinderby, S.; Passmore, D.; Bissett, N. Flood risk management, an approach to managing cross-border hazards. Nat. Hazards 2016, 82, 217–240. [Google Scholar] [CrossRef] [Green Version]
- Muis, S.; Güneralp, B.; Jongman, B.; Aerts, J.C.; Ward, P.J. Flood risk and adaptation strategies under climate change and urban expansion: A probabilistic analysis using global data. Sci. Total Environ. 2015, 538, 445–457. [Google Scholar] [CrossRef]
- Sharifan, R.; Roshan, A.; Aflatoni, M.; Jahedi, A.; Zolghadr, M. Uncertainty and Sensitivity Analysis of SWMM Model in Computation of Manhole Water Depth and Subcatchment Peak Flood. Procedia Soc. Behav. Sci. 2010, 2, 7739–7740. [Google Scholar] [CrossRef] [Green Version]
- Bisht, D.S.; Chatterjee, C.; Kalakoti, S.; Upadhyay, P.; Sahoo, M.; Panda, A. Modeling urban floods and drainage using SWMM and MIKE URBAN: A case study. Nat. Hazards 2016, 84, 749–776. [Google Scholar] [CrossRef]
- Ekmekcioğlu, Ö.; Koc, K.; Özger, M. Stakeholder perceptions in flood risk assessment: A hybrid fuzzy AHP-TOPSIS approach for Istanbul, Turkey. Int. J. Disaster Risk Reduct. 2021, 60, 102327. [Google Scholar] [CrossRef]
- Eini, M.; Kaboli, H.S.; Rashidian, M.; Hedayat, H. Hazard and vulnerability in urban flood risk mapping: Machine learning techniques and considering the role of urban districts. Int. J. Disaster Risk Reduct. 2020, 50, 101687. [Google Scholar] [CrossRef]
- Fu, X.; Luan, Q.; Wang, H.; Liu, J.; Gao, X. Application Research of SWMM in the Simulation of Large-Scale Urban Rain Flood Process—A Case Study of Yizhuang District, China. Environ. Earth Sci. 2019, 251–260. [Google Scholar] [CrossRef]
- Wu, Y.; Zhong, P.-A.; Zhang, Y.; Xu, B.; Ma, B.; Yan, K. Integrated flood risk assessment and zonation method: A case study in Huaihe River basin, China. Nat. Hazards 2015, 78, 635–651. [Google Scholar] [CrossRef]
- Luu, C.; von Meding, J.; Mojtahedi, M. Analyzing Vietnam’s national disaster loss database for flood risk assessment using multiple linear regression-TOPSIS. Int. J. Disaster Risk Reduct. 2019, 40, 101153. [Google Scholar] [CrossRef]
- Wu, J.; Chen, X.; Lu, J. Assessment of long and short-term flood risk using the multi-criteria analysis model with the AHP-Entropy method in Poyang Lake basin. Int. J. Disaster Risk Reduct. 2022, 75, 102968. [Google Scholar] [CrossRef]
- Herath, S.; Dutta, D. Modeling of urban flooding including underground space. In Proceedings of the Second International Conference of Asia-Pacific Hydrology and Water Resources Association, Tokyo, Japan, 5 July 2004; pp. 55–63. [Google Scholar]
- Hashimoto, H.; Park, K. Two-dimensional urban flood simulation: Fukuoka flood disaster in 1999. WIT Trans. Ecol. Environ. 2008, 118, 59–67. [Google Scholar]
- Aoki, Y.; Yoshizawa, A.; Taminato, T. Anti-inundation measures for underground stations of Tokyo Metro. Procedia Eng. 2016, 165, 2–10. [Google Scholar] [CrossRef]
- Ghosh, A.; Kar, S.K. Application of analytical hierarchy process (AHP) for flood risk assessment: A case study in Malda district of West Bengal, India. Nat. Hazards 2018, 94, 349–368. [Google Scholar] [CrossRef]
- Yilmaz, O.S.; Akyuz, D.E.; Aksel, M.; Dikici, M.; Akgul, M.A.; Yagci, O.; Sanli, F.B.; Aksoy, H. Evaluation of pre-and post-fire flood risk by analytical hierarchy process method: A case study for the 2021 wildfires in Bodrum, Turkey. Landsc. Ecol. Eng. 2023, 19, 271–288. [Google Scholar] [CrossRef]
- Zhang, J.-Q.; Liang, J.-D.; Liu, X.-P.; Tong, Z.-J. GIS-Based Risk Assessment of Ecological Disasters in Jilin Province, Northeast China. Hum. Ecol. Risk Assess. 2009, 15, 727–745. [Google Scholar] [CrossRef]
- Dou, X.Y.; Song, J.X.; Wang, L.P.; Tang, B.; Xu, S.F.; Kong, F.H.; Jiang, X.H. Flood risk assessment and mapping based on a modified multi-parameter flood hazard index model in the Guanzhong Urban Area, China. Stoch. Environ. Res. Risk Assess. 2018, 32, 1131–1146. [Google Scholar] [CrossRef]
- Shrestha, R.; Di, L.; Yu, E.G.; Kang, L.; Shao, Y.-Z.; Bai, Y.-Q. Regression model to estimate flood impact on corn yield using MODIS NDVI and USDA cropland data layer. J. Integr. Agric. 2017, 16, 398–407. [Google Scholar] [CrossRef] [Green Version]
- Ha-Mim, N.M.; Rahman, M.A.; Hossain, M.Z.; Fariha, J.N.; Rahaman, K.R. Employing multi-criteria decision analysis and geospatial techniques to assess flood risks: A study of Barguna district in Bangladesh. Int. J. Disaster Risk Reduct. 2022, 77, 103081. [Google Scholar] [CrossRef]
- De Risi, R.; Jalayer, F.; De Paola, F.; Lindley, S. Delineation of flooding risk hotspots based on digital elevation model, calculated and historical flooding extents: The case of Ouagadougou. Stoch. Environ. Res. Risk Assess. 2018, 32, 1545–1559. [Google Scholar] [CrossRef] [Green Version]
- Li, K.; Wu, S.; Dai, E.; Xu, Z. Flood loss analysis and quantitative risk assessment in China. Nat. Hazards 2012, 63, 737–760. [Google Scholar] [CrossRef]
- Szwagrzyk, M.; Kaim, D.; Price, B.; Wypych, A.; Grabska, E.; Kozak, J. Impact of forecasted land use changes on flood risk in the Polish Carpathians. Nat. Hazards 2018, 94, 227–240. [Google Scholar] [CrossRef] [Green Version]
- Hu, S.; Cheng, X.; Zhou, D.; Zhang, H. GIS-based flood risk assessment in suburban areas: A case study of the Fangshan District, Beijing. Nat. Hazards 2017, 87, 1525–1543. [Google Scholar] [CrossRef]
- Azadpeyma, A.; Kashi, E. Level of Service Analysis for Metro Station with Transit Cooperative Research Program (TCRP) Manual: A Case Study—Shohada Station in Iran. Urban Rail Transit 2019, 5, 39–47. [Google Scholar] [CrossRef] [Green Version]
- Li, L.; Wang, Y.; Zhong, G.; Zhang, J.; Ran, B. Short-to-medium Term Passenger Flow Forecasting for Metro Stations using a Hybrid Model. KSCE J. Civ. Eng. 2018, 22, 1937–1945. [Google Scholar] [CrossRef]
- Balica, S.F.; Wright, N.G.; Van Der Meulen, F. A flood vulnerability index for coastal cities and its use in assessing climate change impacts. Nat. Hazards 2012, 64, 73–105. [Google Scholar] [CrossRef] [Green Version]
- Willner, S.N.; Otto, C.; Levermann, A. Global economic response to river floods. Nat. Clim. Chang. 2018, 8, 594–598. [Google Scholar] [CrossRef]
- Singkran, N.; Kandasamy, J. Developing a strategic flood risk management framework for Bangkok, Thailand. Nat. Hazards 2016, 84, 933–957. [Google Scholar] [CrossRef]
- Stefanidis, S.; Stathis, D. Assessment of flood hazard based on natural and anthropogenic factors using analytic hierarchy process (AHP). Nat. Hazards 2013, 68, 569–585. [Google Scholar] [CrossRef]
- Dong, Q.; Cooper, O. An orders-of-magnitude AHP supply chain risk assessment framework. Int. J. Prod. Econ. 2016, 182, 144–156. [Google Scholar] [CrossRef]
- Xu, H.; Ma, C.; Lian, J.; Xu, K.; Chaima, E. Urban flooding risk assessment based on an integrated k-means cluster algorithm and improved entropy weight method in the region of Haikou, China. J. Hydrol. 2018, 563, 975–986. [Google Scholar] [CrossRef]


| Parameters | Data Types | Source |
|---|---|---|
| Elevation | ASTER GDEM 30 m × 30 m | www.gscloud.cn (accessed on 1 September 2022) |
| Slope | ASTER GDEM 30 m × 30 m | www.gscloud.cn (accessed on 1 September 2022) |
| Average annual rainfall | Raster data | China Meteorological Administration |
| Rainfall days (DR > 50 mm) | Raster data | China Meteorological Administration |
| Maximum daily rainfall | Raster data | China Meteorological Administration |
| NDVI | Landsat 8 OLI/TIRS | https://www.databox.store (accessed on 3 October 2022) |
| LULC | Landsat 8 OLI/TIRS | https://www.databox.store (accessed on 13 October 2022) |
| Changchun river network | Vector data | www.gscloud.cn (accessed on 5 November 2022) |
| Main road network | Vector data | www.gscloud.cn (accessed on 8 November 2022) |
| Population density | Raster data 2020 | UN world population density |
| Road network density | Raster data | Changchun Statistical Yearbook |
| River network density | Raster data | Changchun Statistical Yearbook |
| Type of exit | Vector data | Gaode Map |
| Number of exits | Vector data | Gaode Map |
| Percentage of vulnerable population | Attribute data 2022 | Changchun Statistical Yearbook |
| Education status | Raster data 2023 | Changchun Statistical Yearbook |
| Density of metro stations | Raster data 2023 | Gaode Map |
| GDP | Raster data 2022 | https://www.databox.store (accessed on 3 January 2023) |
| Metro line | Vector data | Gaode Map |
| Passenger flow | 10,000 people | Jilin Province Zhengyuan Company environmental assessment book |
| River network proximity | Raster data | www.gscloud.cn (accessed on 14 March 2023) |
| Metro line proximity | Raster data | Gaode Map |
| Metro line density | Raster data | Gaode Map |
| n | 1 | 2 | 3 | 4 | 5 | 6 | 7 | 8 | 9 |
|---|---|---|---|---|---|---|---|---|---|
| RI | 0 | 0 | 0.58 | 0.90 | 1.12 | 1.24 | 1.32 | 1.41 | 1.45 |
| Criterion Layer | Criterion Layer Weights | Indicator Layer | Indicator Layer Weights |
|---|---|---|---|
| Hazard | 0.4668 | Average annual rainfall | 0.1025 |
| Maximum daily rainfall | 0.2597 | ||
| Rain days (DR > 50 mm) | 0.2854 | ||
| NDVI | 0.3523 | ||
| Exposure | 0.1603 | Number of exits | 0.2174 |
| Elevation | 0.1829 | ||
| Slope | 0.1683 | ||
| River network density | 0.0546 | ||
| Population density | 0.2 | ||
| Road network density | 0.0937 | ||
| LULC | 0.0831 | ||
| Vulnerability | 0.2776 | Percentage of vulnerable population | 0.0871 |
| River network proximity | 0.0763 | ||
| Type of exit | 0.2541 | ||
| Metro station density | 0.1431 | ||
| Passenger flow | 0.1875 | ||
| Metro line density | 0.1241 | ||
| Metro line proximity | 0.1277 | ||
| Emergency responseand recovery capability | 0.0953 | GDP | 0.2043 |
| Drainage pipe network density | 0.2687 | ||
| Education status | 0.3887 | ||
| Distance to main road | 0.1383 |
| AUC Value | 0.5–0.6 | 0.6–0.7 | 0.7–0.8 | 0.8–0.9 | 0.9–1.0 |
|---|---|---|---|---|---|
| Accuracy | Failed | Different | Normal | Good | Excellent |
Disclaimer/Publisher’s Note: The statements, opinions and data contained in all publications are solely those of the individual author(s) and contributor(s) and not of MDPI and/or the editor(s). MDPI and/or the editor(s) disclaim responsibility for any injury to people or property resulting from any ideas, methods, instructions or products referred to in the content. |
© 2023 by the authors. Licensee MDPI, Basel, Switzerland. This article is an open access article distributed under the terms and conditions of the Creative Commons Attribution (CC BY) license (https://creativecommons.org/licenses/by/4.0/).
Share and Cite
Liu, G.; Zhang, Y.; Zhang, J.; Lang, Q.; Chen, Y.; Wan, Z.; Liu, H. Geographic-Information-System-Based Risk Assessment of Flooding in Changchun Urban Rail Transit System. Remote Sens. 2023, 15, 3533. https://doi.org/10.3390/rs15143533
Liu G, Zhang Y, Zhang J, Lang Q, Chen Y, Wan Z, Liu H. Geographic-Information-System-Based Risk Assessment of Flooding in Changchun Urban Rail Transit System. Remote Sensing. 2023; 15(14):3533. https://doi.org/10.3390/rs15143533
Chicago/Turabian StyleLiu, Gexu, Yichen Zhang, Jiquan Zhang, Qiuling Lang, Yanan Chen, Ziyang Wan, and Huanan Liu. 2023. "Geographic-Information-System-Based Risk Assessment of Flooding in Changchun Urban Rail Transit System" Remote Sensing 15, no. 14: 3533. https://doi.org/10.3390/rs15143533