Article

SRTPN: Scale and Rotation Transform Prediction Net for Multimodal Remote Sensing Image Registration

1
School of Computer Science and Technology, Xidian University, Xi’an 710071, China
2
NavInfo Co., Ltd., Beijing 100028, China
3
Guangxi Key Laboratory of Trusted Software, Guilin University of Electronic Technology, Guilin 541004, China
*
Author to whom correspondence should be addressed.
Remote Sens. 2023, 15(14), 3469; https://doi.org/10.3390/rs15143469
Submission received: 29 May 2023 / Revised: 1 July 2023 / Accepted: 7 July 2023 / Published: 9 July 2023

Abstract

:
How to recover geometric transformations is one of the most challenging issues in image registration. To alleviate the effect of large geometric distortion in multimodal remote sensing image registration, a scale and rotate transform prediction net is proposed in this paper. First, to reduce the scale between the reference and sensed images, the image scale regression module is constructed via CNN feature extraction and FFT correlation, and the scale of sensed image can be recovered roughly. Second, the rotation estimate module is developed for predicting the rotation angles between the reference and the scale-recovered images. Finally, to obtain the accurate registration results, LoFTR is employed to match the geometric-recovered images. The proposed registration network was evaluated on GoogleEarth, HRMS, VIS-NIR and UAV datasets with contrast differences and geometric distortions. The experimental results show that the number of correct matches of our model reached 74.6%, and the RMSE of the registration results achieved 1.236, which is superior to the related methods.

1. Introduction

A multimodal image contains complementary information between modes, and its high-level task application must be accurately geometrically aligned. The joint analysis of multimodal remote sensing images is an effective way to achieve multi-directional, deep-level, and multi-granularity perception of the target scene, and the prerequisite and key step of its joint analysis is the precise registration of multimodal images. Multimodal remote sensing image registration is the process of spatially aligning and superimposing images of the same scene acquired by different sensors, at different times, in different orientations, or from different platforms [1,2]. This technology is a necessary prerequisite for multimodal image fusion [3,4], change detection [5,6], and cross-modal object detection and recognition [7,8,9], and directly affects the accuracy of subsequent deep information processing. However, differences in sensor imaging mechanisms and the complexity of the capture environment (climate, illumination, multi-platform, multi-orientation, multi-temporal) lead to large-scale geometric distortions and some structural changes between images, making it difficult for existing registration methods to meet the actual task requirements [10].
The challenges in multimodal remote sensing image registration are analyzed as follows:
(1)
There are large-scale geometric distortions in remote sensing images acquired from different orientations (viewing angles) or different platforms (airborne remote sensing, spaceborne remote sensing), which makes it extremely difficult to characterize geometrically invariant features.
(2)
There are some structural changes between images acquired by different time phases or different sensors, resulting in poor consistency based on feature representations such as shape, contour, and region, making it difficult to achieve accurate registration.
In view of the analysis above, the prediction of the transformation between two images is a crucial step in image registration. To deal with the challenges, this paper presents a scale and rotation transform prediction net for multimodal remote sensing image registration, which is effective for image registration with large geometric variations and significant contrast differences (Figure 1). The main contributions of our paper can be summarized as follows:
(1)
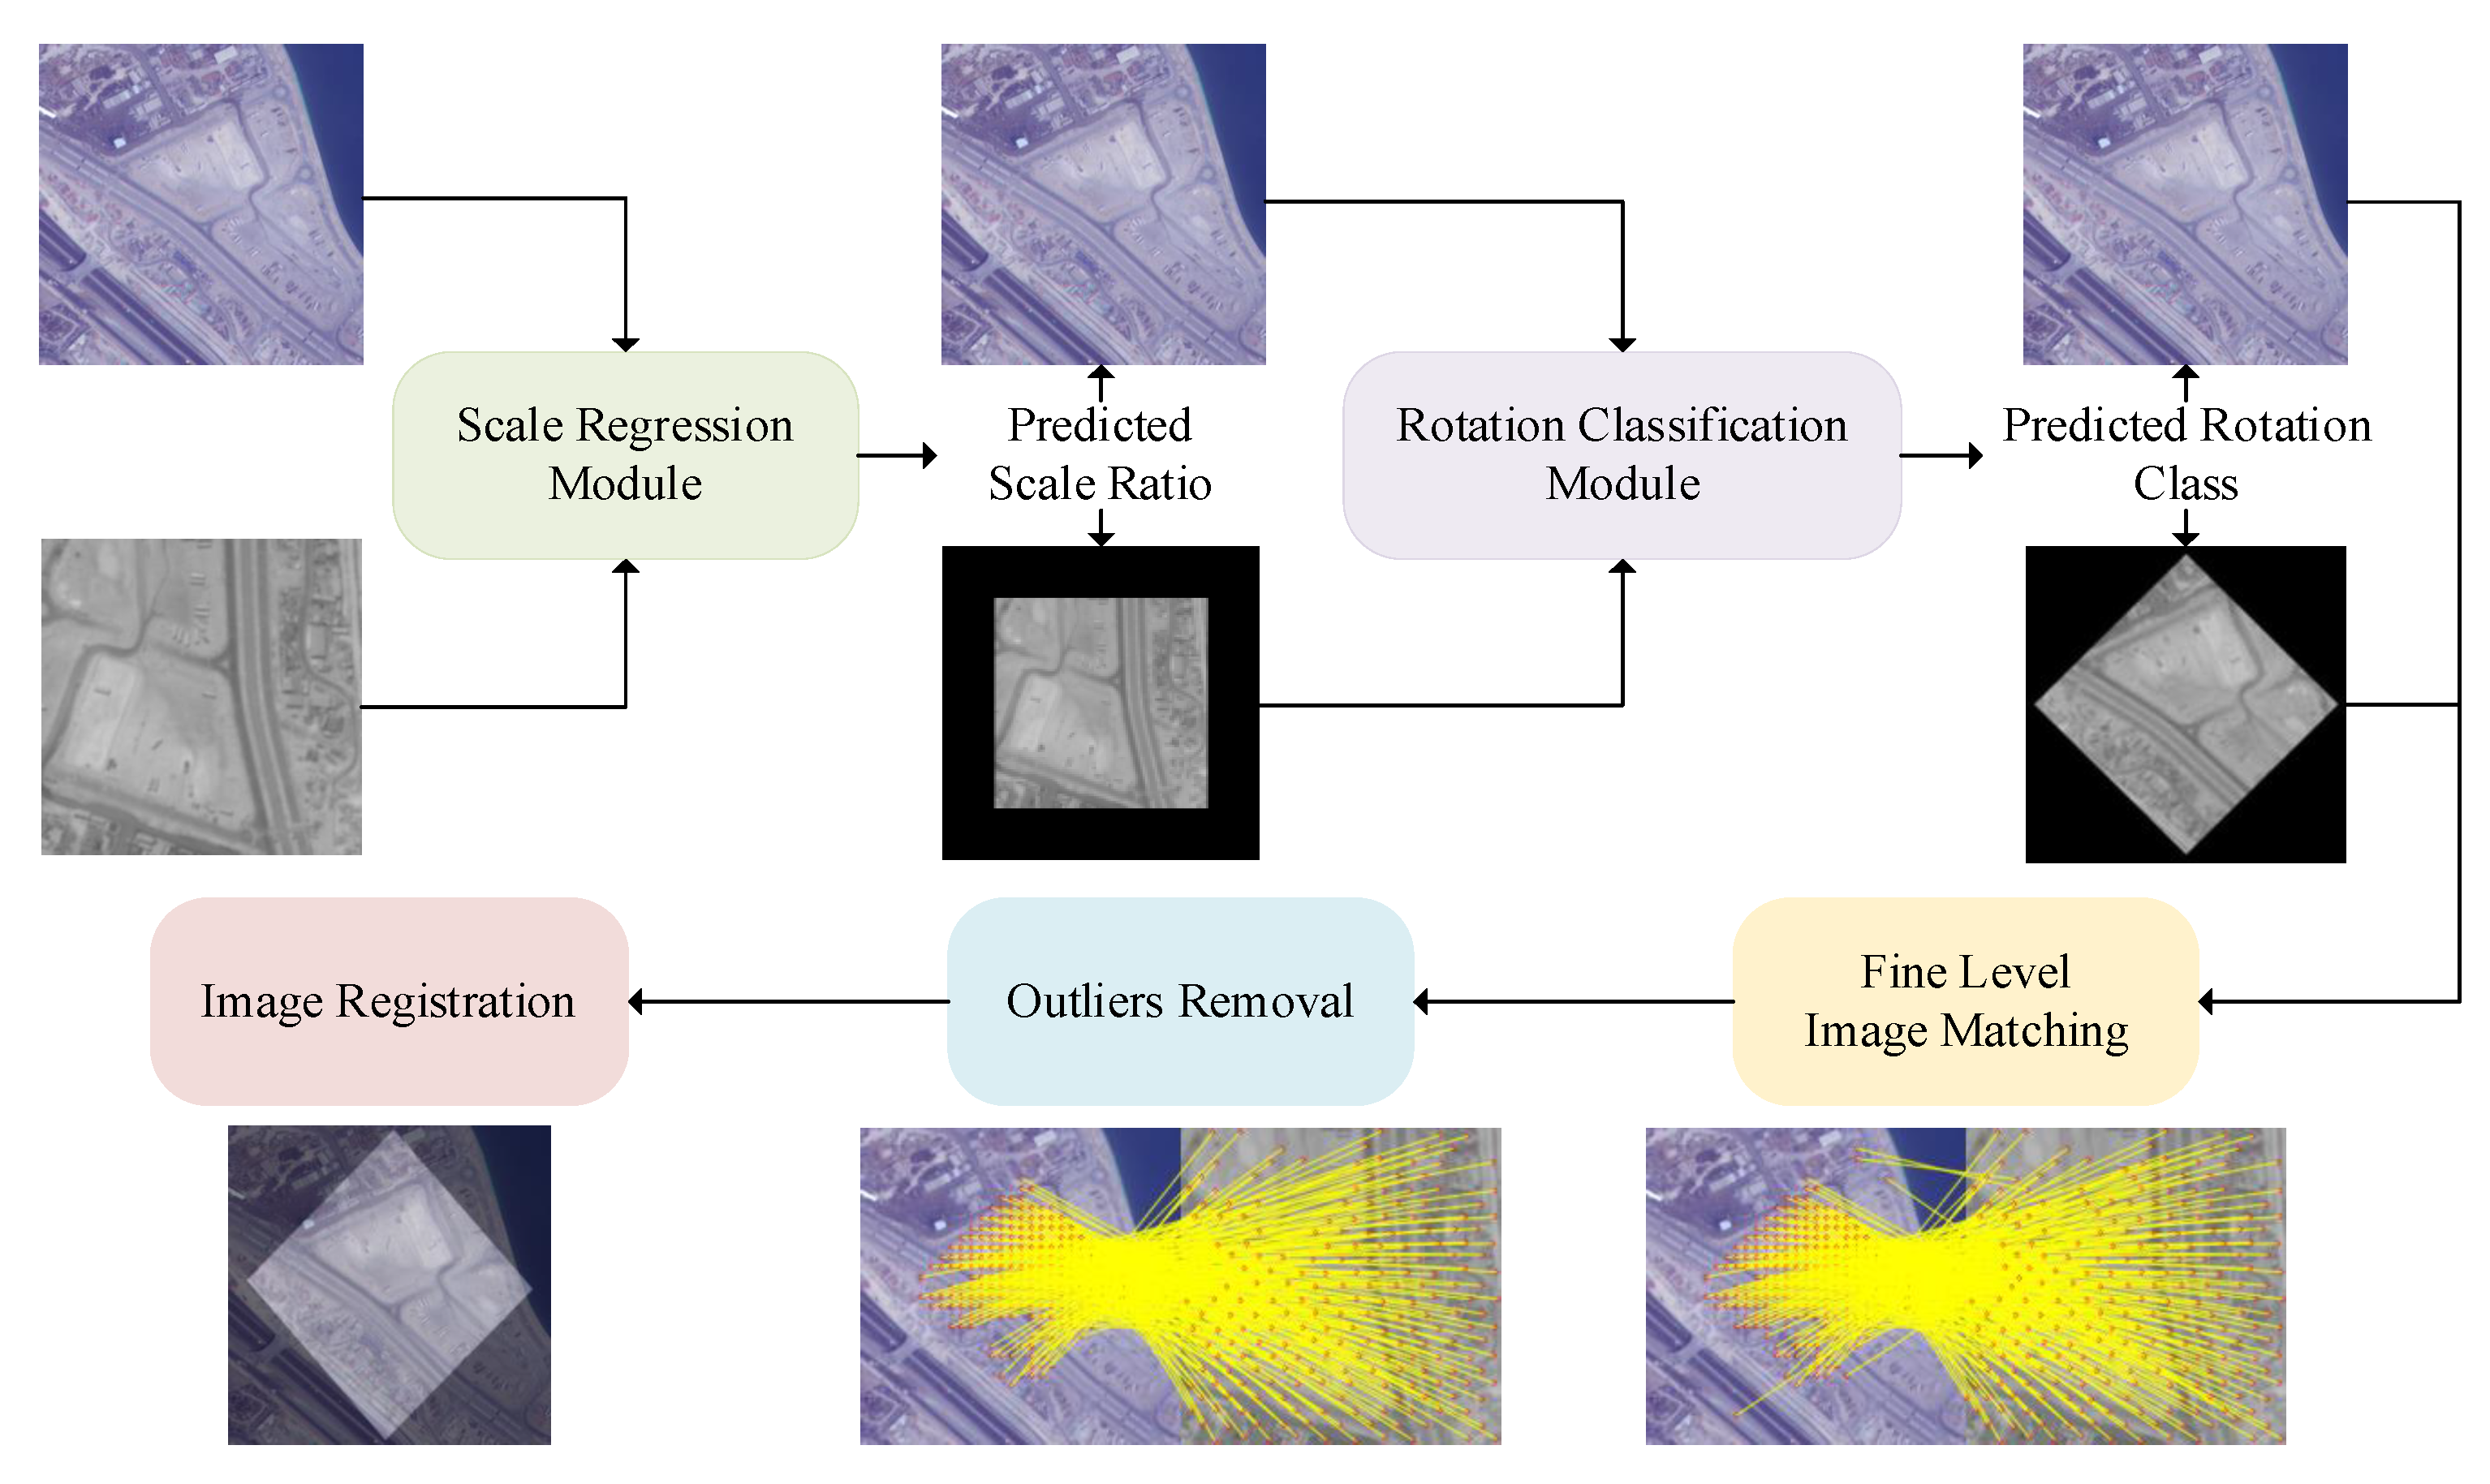
To alleviate large scale differences between the reference and sensed images, a scale regression module with CNN feature extraction and FFT correlation is constructed, which could roughly recover the scale difference of input image pairs.
(2)
To improve the robustness to rotational changes, a rotation classification module is designed after recovering the scale changes. Combination of the two modules could eliminate significant geometric differences between image pairs, which is essential for accurate image registration.
(3)
Plenty of comparative experimental results show that our method outperforms related methods in registration accuracy on GoogleEarth, HRMRS, VIS-NIR and UAV datasets.
The remainder of this paper is organized as follows: Section 2 introduces related work, focusing on previous classical and deep learning image registration methods. Section 3 describes the scale and rotation transformation prediction net in detail. The extensive experimental results and analysis are given in Section 4. Finally, conclusions are drawn in Section 5.

2. Related Works

The existing image-registration methods mainly include two categories: traditional and deep learning methods. Traditional image-registration methods, such as SIFT [11], SURF, ORB, mainly include four steps: feature detection, feature description, feature matching, and outlier removal. A large number of methods have been proposed for the improvement of these classical algorithms. Above-mentioned traditional methods achieve good results in single-modal image registration. However, different imaging mechanisms of multimodal images lead to significant contrast differences and local structural changes, making the registration accuracy of traditional methods based on region representation, gradient distribution or structure representation low or even ineffective.
Compared with traditional registration methods, deep learning methods could automatically learn significant features via the suitable network and obtain the registration results. As a representative of feature extraction network, Key.Net [12] combines handcrafted and learned CNN filters within a shallow multi-scale architecture. The most representative detector-free method is Sparse NCNet [13], which simplifies the calculation on the basis of NCNet [14] and greatly improves the registration efficiency. DRC-Net [15], on the other hand, adopts a coarse-to-fine strategy to further improve the matching accuracy, and on whose basis, LoFTR [16] with superior matching effect and speed is developed. LoFTR outperforms SuperGlue [17] via adopting a coarse-to-fine matching strategy and employing self and cross attention layers in Transformer to obtain feature descriptors. However, LoFTR often fails in matching images with large scale and rotation changes. To enhance the robustness to rotation, SE2-LoFTR [18] further improves matching accuracy by combining LoFTR and rotation invariant CNN. Nevertheless, the performance degradation of SE2-LoFTR is serious when image pairs contain significant scale transformations. To address this issue, we propose the scale- and rotation-transformation prediction net to alleviate large geometric deformations of multimodal images.

3. Method

This section details the architecture of the proposal model (Figure 2). The construction of scale regression and rotation classification module are described in Section 3.1 and Section 3.2, respectively. The final registration network for multimodal remote sensing images is given in Section 3.3.

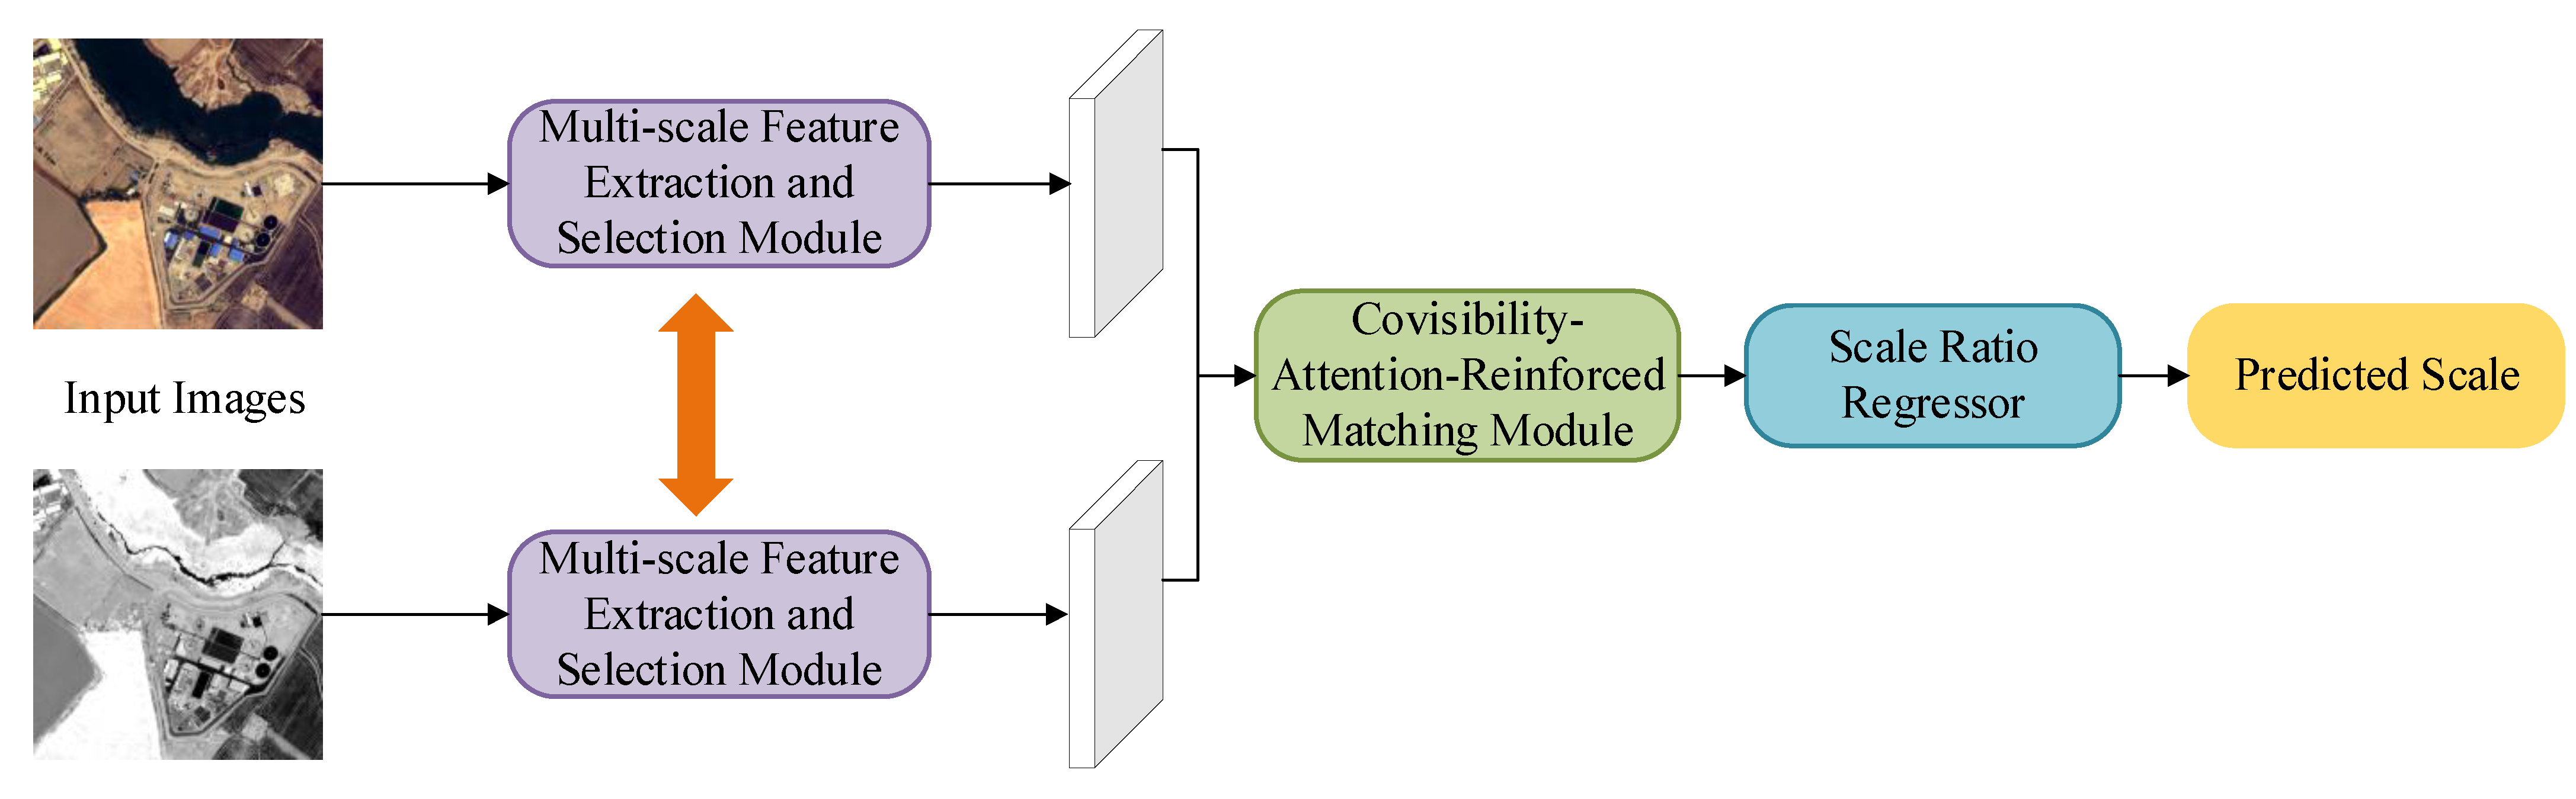
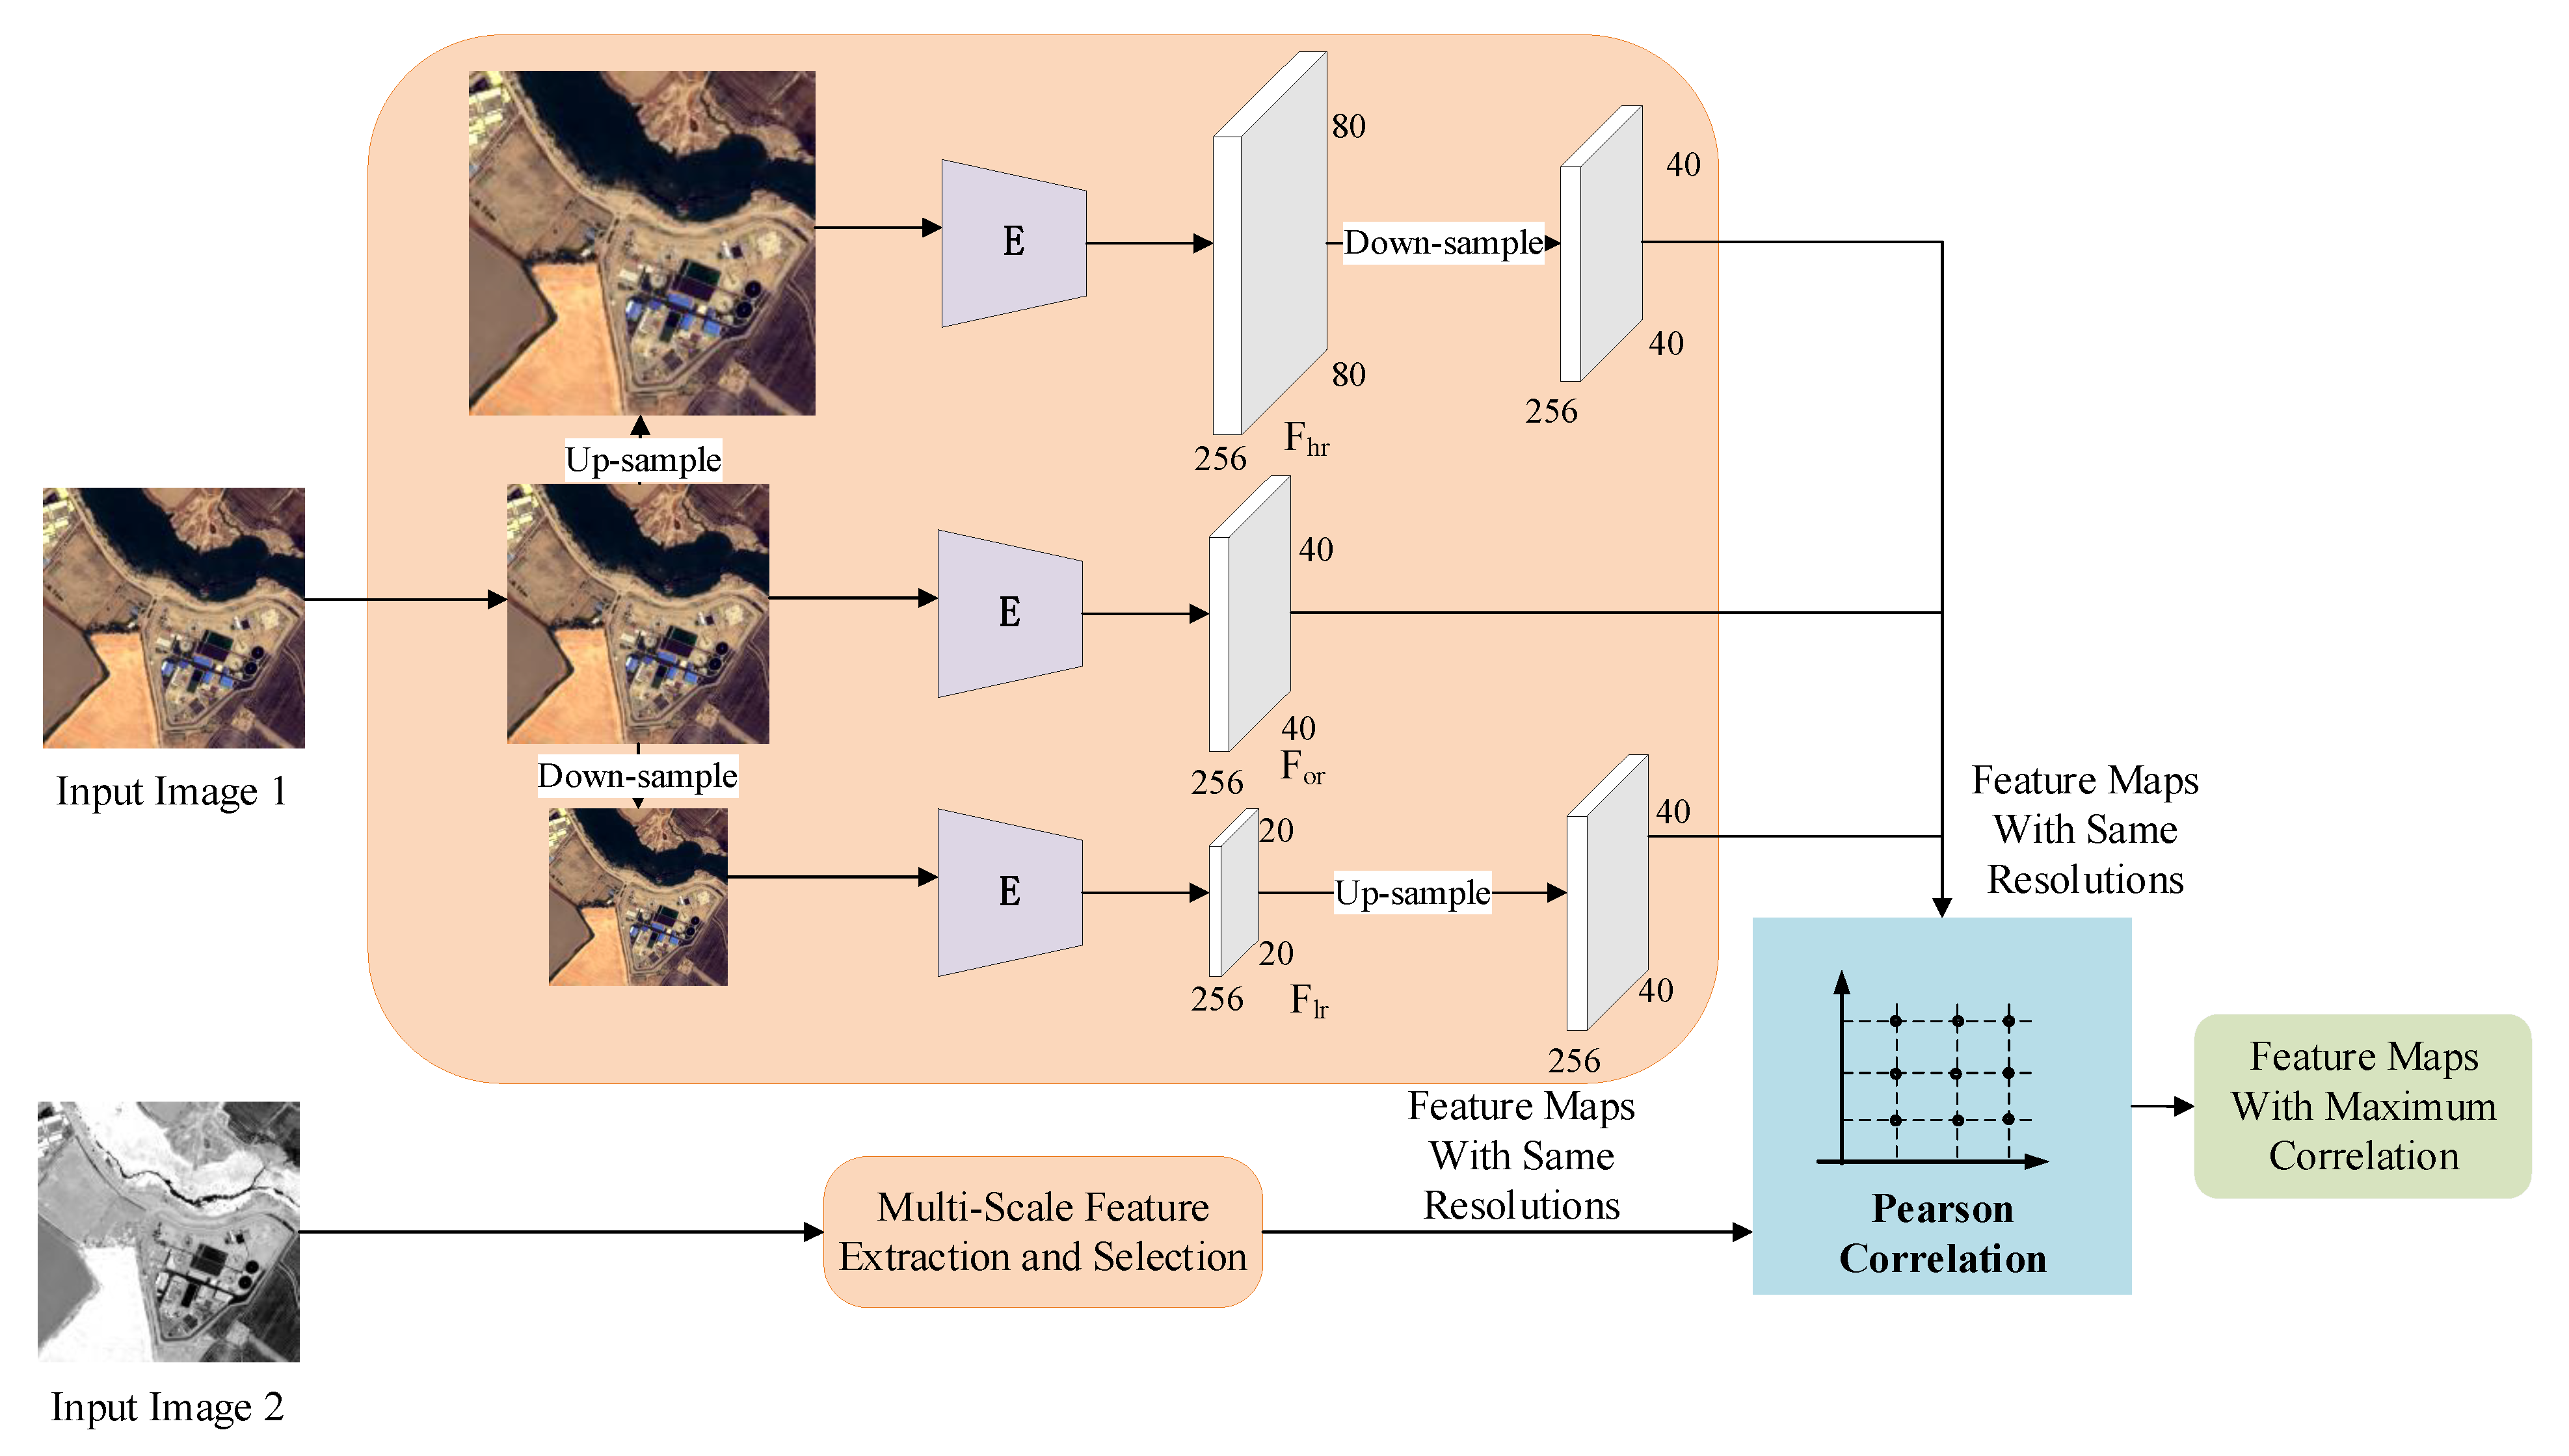
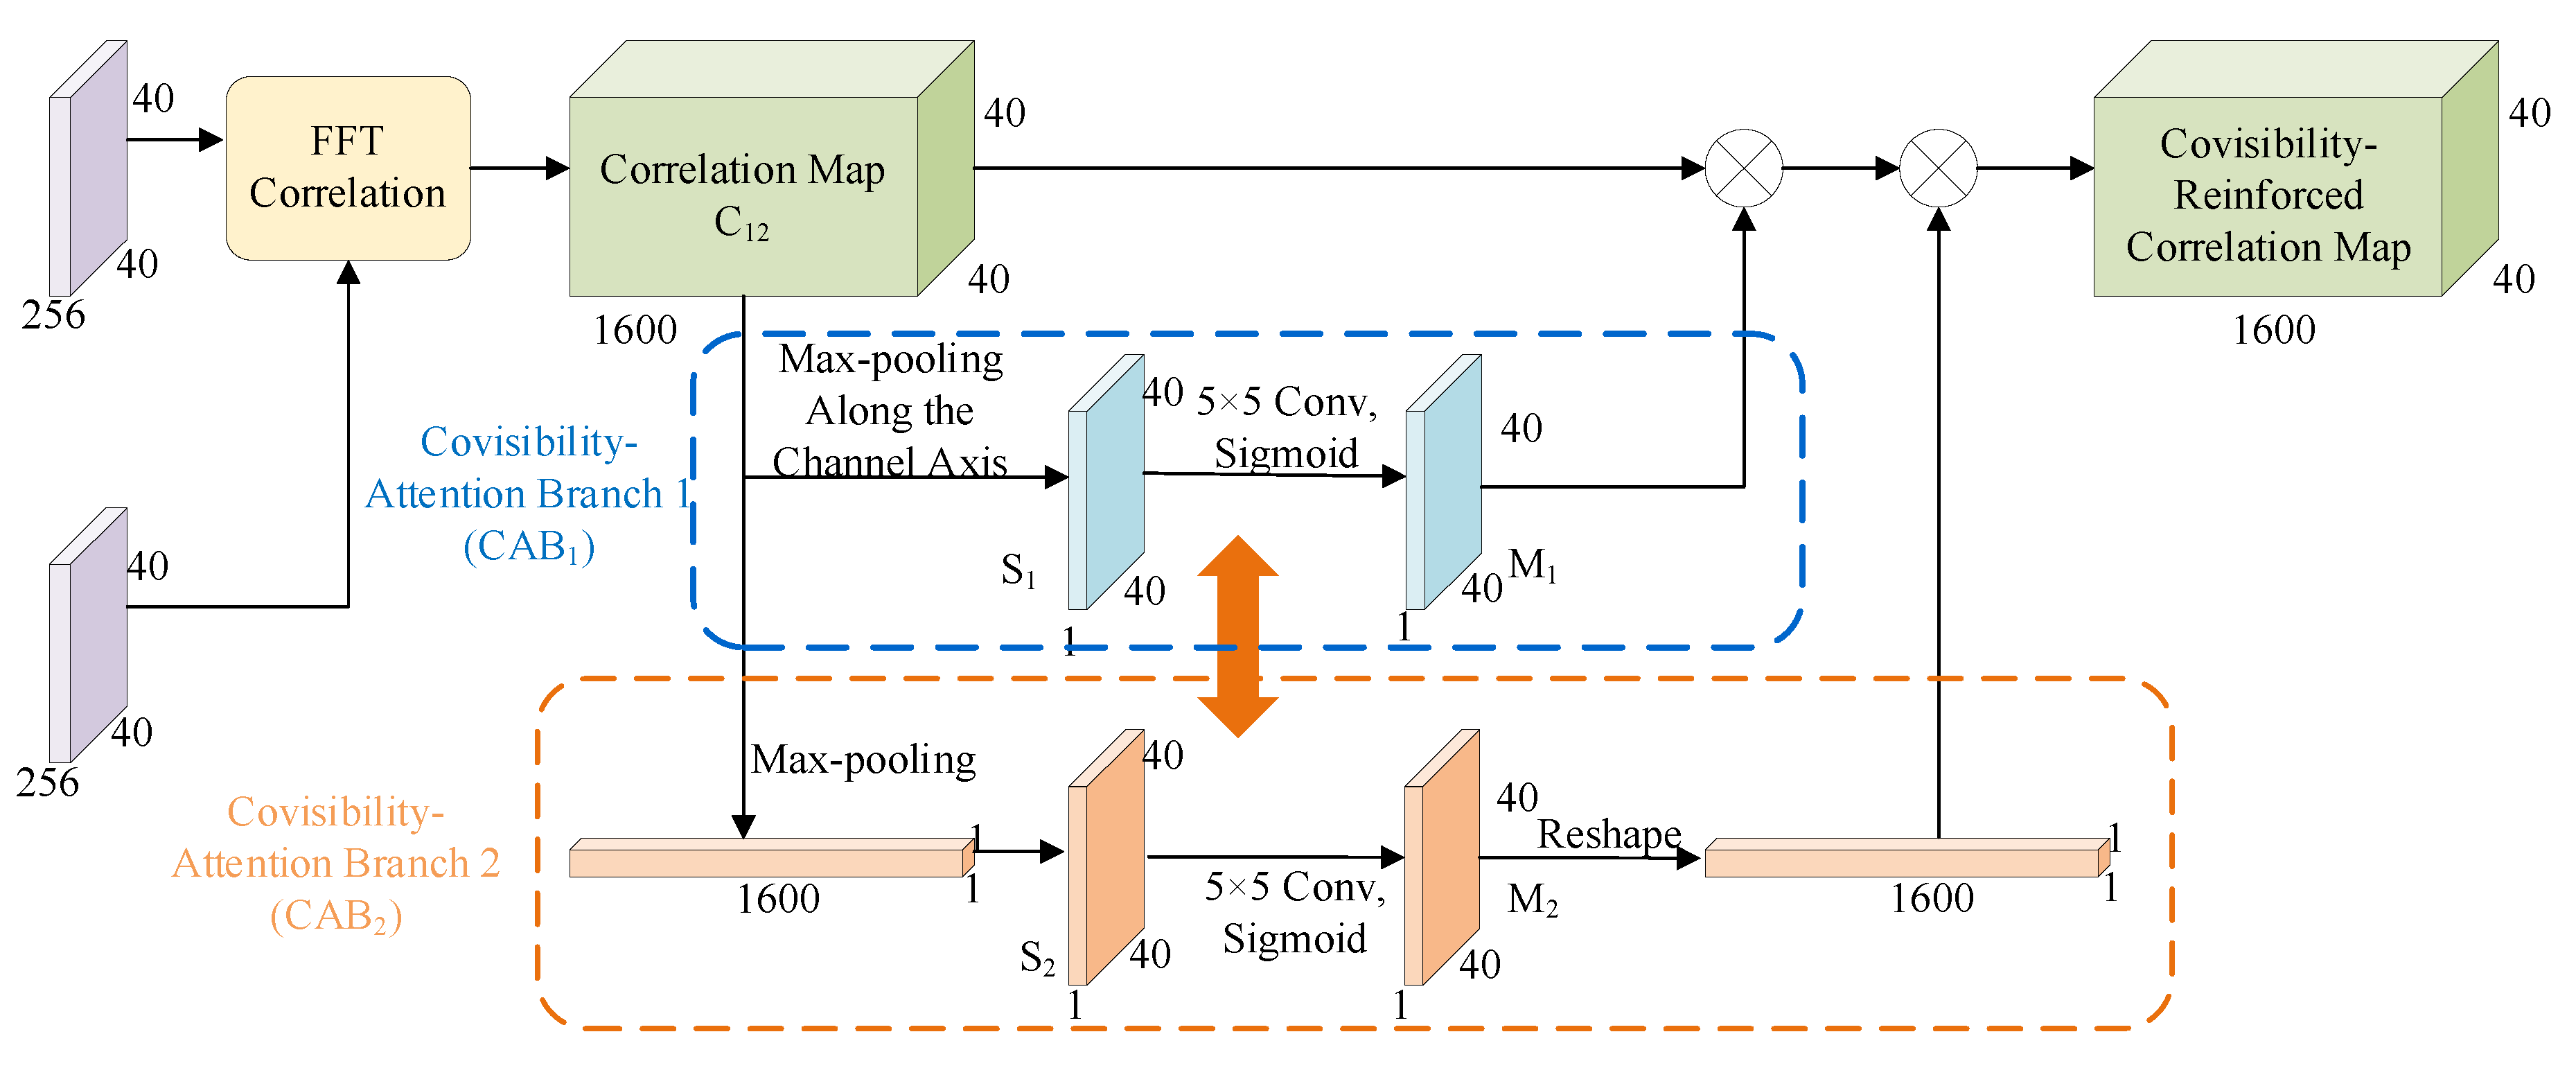
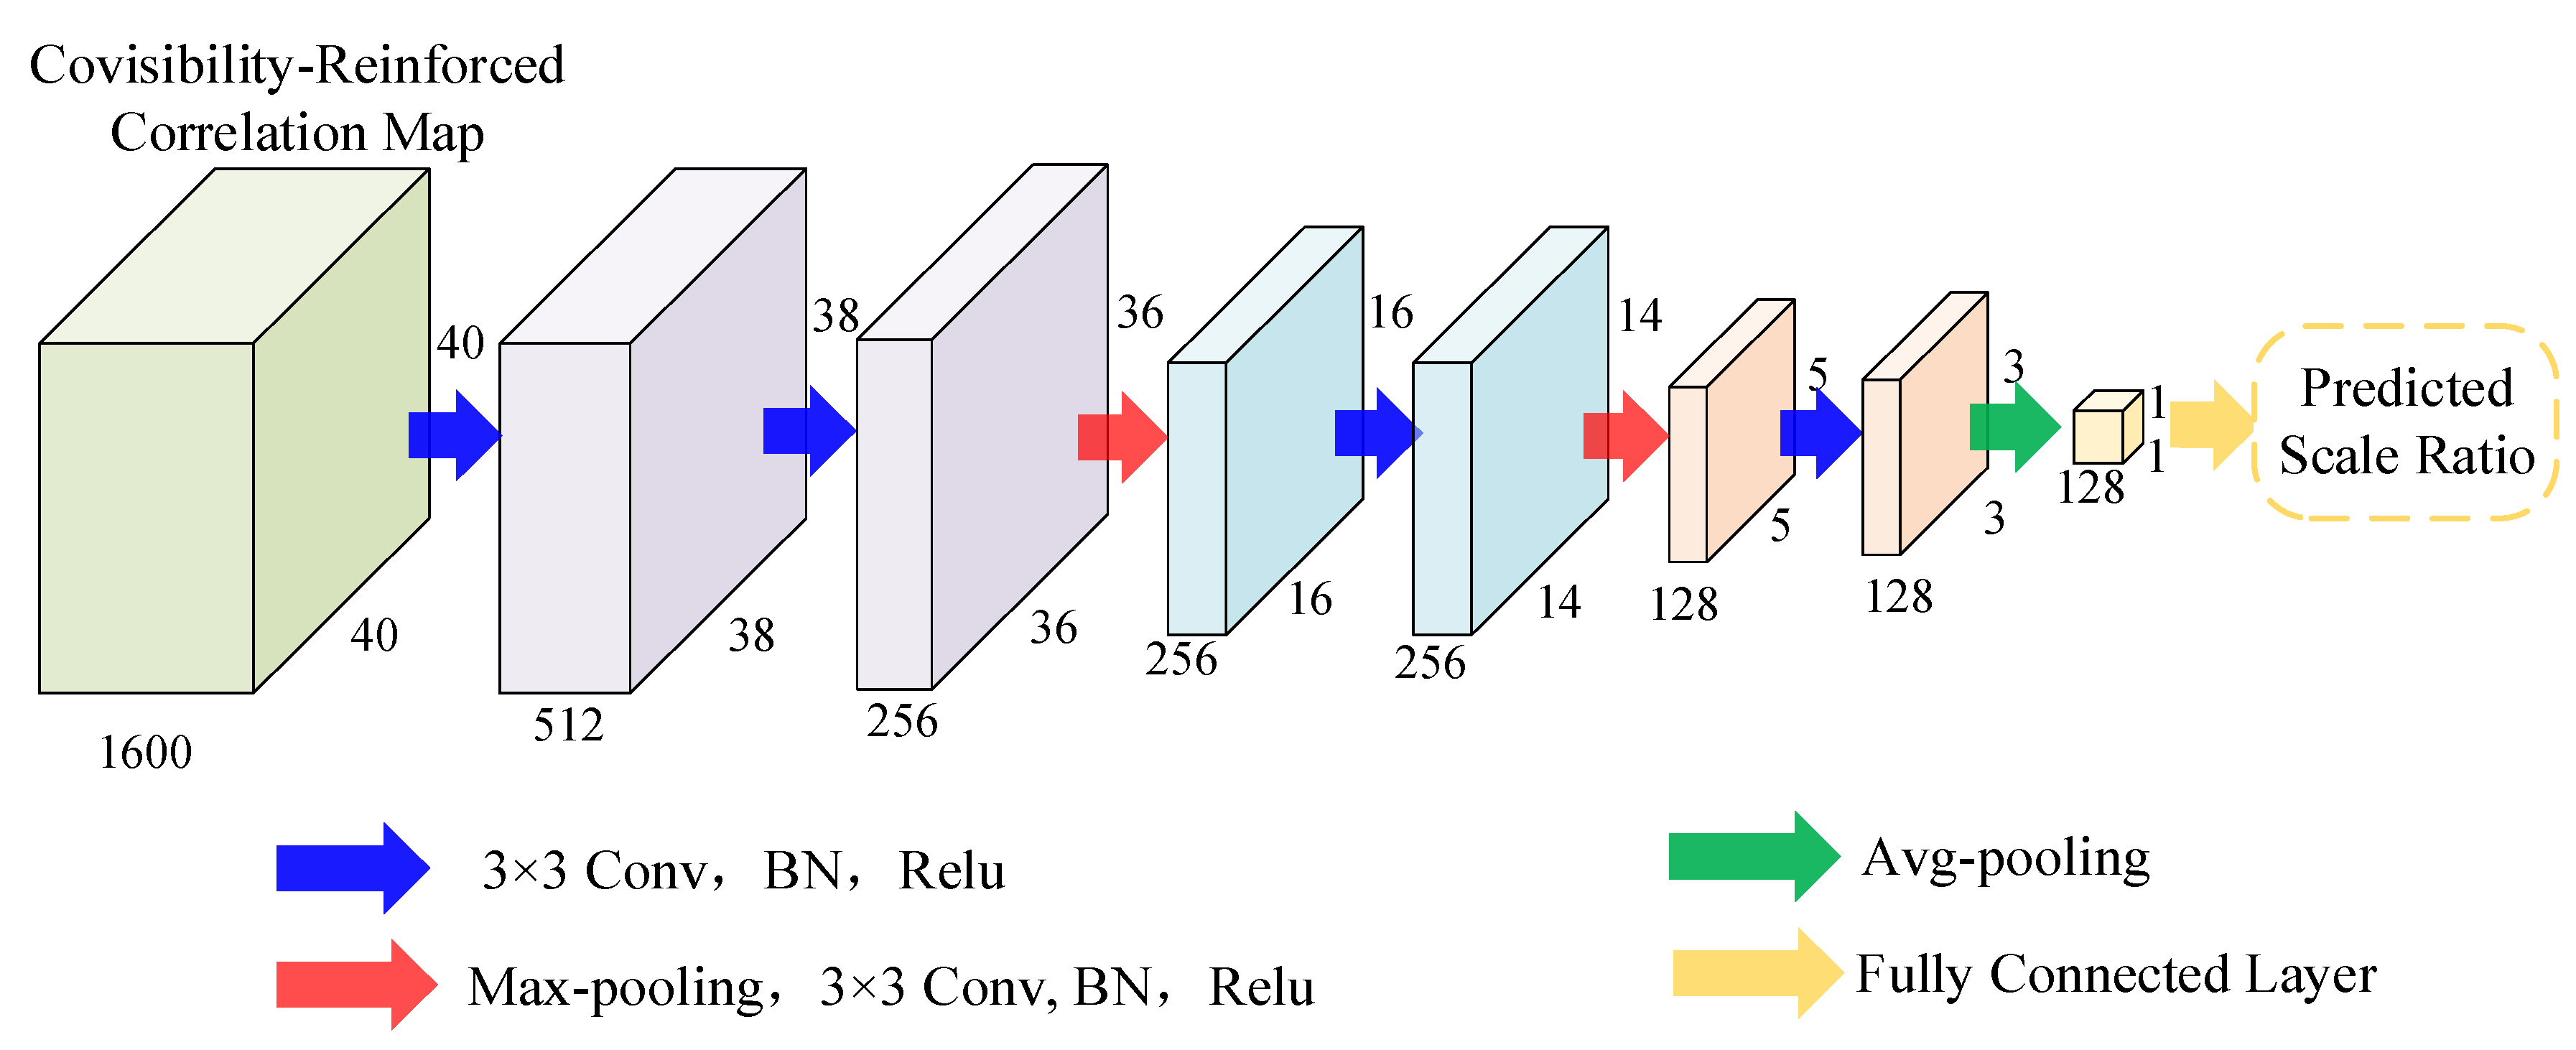
3.1. Scale Regression Module

3.1.1. Definitions

In this paper, we adopt the same definition proposed by Rau et at. [19]: when the number of visually overlapping pixels in the two input images is roughly the same, there is no scale difference between them. For a certain image pair, if the scale ratio of image I 1 and image I 2 is s , I 1 should be resized to s times its original size so that there is almost no difference in scale between the two images. The specific definition formula is denoted by σ ( , ) , as shown in:
σ ( I 1 , I 2 ) = s , σ ( I 2 , I 1 ) = 1 / s
It should be noted that the scale ratio definition is asymmetric.

3.1.2. Scale Estimation Network

Scale estimation network consists of three parts: the Multi-Scale Feature Extraction and Selection (MSFES), Covisibility-Attention-Reinforced Matching (CVARM) and Scale Ratio Regressor (SRR). The overall network model architecture is shown in Figure 3. First, MSFES is designed for finding the two feature maps with the greatest cross-scale correlation. Then, CVARM is adopted to find the overlapping area of the above feature maps, and finally the predicted scale ratio of the input images can be obtained through SRR. The construction details of each part are given as follows.
Multi-Scale Feature Extraction and Selection (MSFES). Details of MSFES are shown in Figure 4. The pre-trained ResNet18 model is employed as a backbone network to extract multi-scale dense feature maps of the input images. In this module, the input image and its up- and down-sampled pairs form a multi-scale image group for each input image, whose multi-scale feature maps are encoded by ResNet18 [20] on its image group. Then, all the feature maps of the two input images are normalized to the size of 40 × 40 × 256 . Finally, two feature maps with the largest Pearson correlation between the normalized feature maps are determined as the output of MSFES.
Covisibility-Attention-Reinforced Matching (CVARM). CVARM is necessary to avoid the influence of non-overlapping content in the image on the scale ratio estimation. This part learns from the CVARM module in ScaleNet, with the difference that we adopt FFT correlation to further improve the speed and accuracy of the calculation. The flowchart of CVARM module is displayed in Figure 5. Similar to [19,21,22], two dense feature maps F 1 and F 2 obtained by MSFES could generate an initial correlation matrix, which is calculated as follows:
C 12 ( i , j , k ) = F 1 ( i , j ) T F 2 ( i k , j k )
where ( i , j ) and ( i k , j k ) denote the individual feature locations in the feature maps, and k = h ( j k 1 ) + i k is an auxiliary index variable for ( i k , j k ) . Unlike to the previous methods, the Fast Fourier Transform (FFT) [23] is applied to speed up the calculation of the correlation matrix. As shown in (3), FFT converts time-domain calculations into frequency-domain calculations, which greatly improves the efficiency of calculation.
C 12 = 2 d 1 [ 2 d ( F 1 ) conj ( 2 d ( F 2 ) ) ]
where 2 d and 2 d 1 are 2D FFT and 2D inverse FFT, respectively, and conj ( ) indicates the conjugate operator.
Since the initial C 12 contains low correlation information from non-covisible regions in the input images, we design two Covisibility-Attention Branches C A B 1 and C A B 2 along different axis to preserve the features of more relevant covisible regions. C A B 1 is composed of a 5 × 5 convolution layer and a sigmoid function, whose input is the max-pooled similarity map of C 12 along the channel axis, and the output is a soft mask M 1 . Unlike C A B 1 , the input of C A B 2 is max-pooled similarity map of C 12 along spatial axis and reshaped. Finally, to emphasize corresponding regions and suppress distraction from non-covisible regions, the covisibility-reinforced correlation map (CRCM) is derived from multiplying C 12 by M 1 and M 2 .
Scale Ratio Regressor (SRR). After the calculation of CRCM, SRR is designed to predict the scale ratio. Specific structure of the regression network is shown in Figure 6, which is consisted of six 3 × 3 convolutional layers, three pooling layers and a fully connected layer. The scale ratio can be obtained through the regression network SRR with the input of CRCM.

3.1.3. Dual Consistent Loss

A dual consistency loss is employed to train the scale regression module, which combines the forward and backward processes, making the scale ratio prediction of two input images more accurate.
Without the loss of generality, the training set can be denoted by G { ( I i 1 , I i 2 , s i ) } i N , where I i 1 and I i 2 represents the input image pair and their ground truth scale ratio is s i . Dual loss l d and consistent loss l c can be expressed as follows:
l d = 1 2 N i = 1 N [ ( log 2 s ^ i s i ) 2 + ( log 2 s ^ i s i ) 2 ]
l c = 1 N i = 1 N ( log 2 s ^ i + log 2 s ^ i ) 2
where s ^ i represents for the predicted scale ratio of I i 1 and I i 2 , and s ^ i for the reverse input. Finally, the total loss of this module includes l d and l c , which are calculated by:
L = λ d l d + λ c l c
where λ d and λ c are the weights of l d and l c , respectively.
So far, the design of Scale Regression Module composed of MSFES, CVARM and SRR has been achieved. This module can directly obtain the scale ratio of the two input images, which can be applied to remove their scale changes.

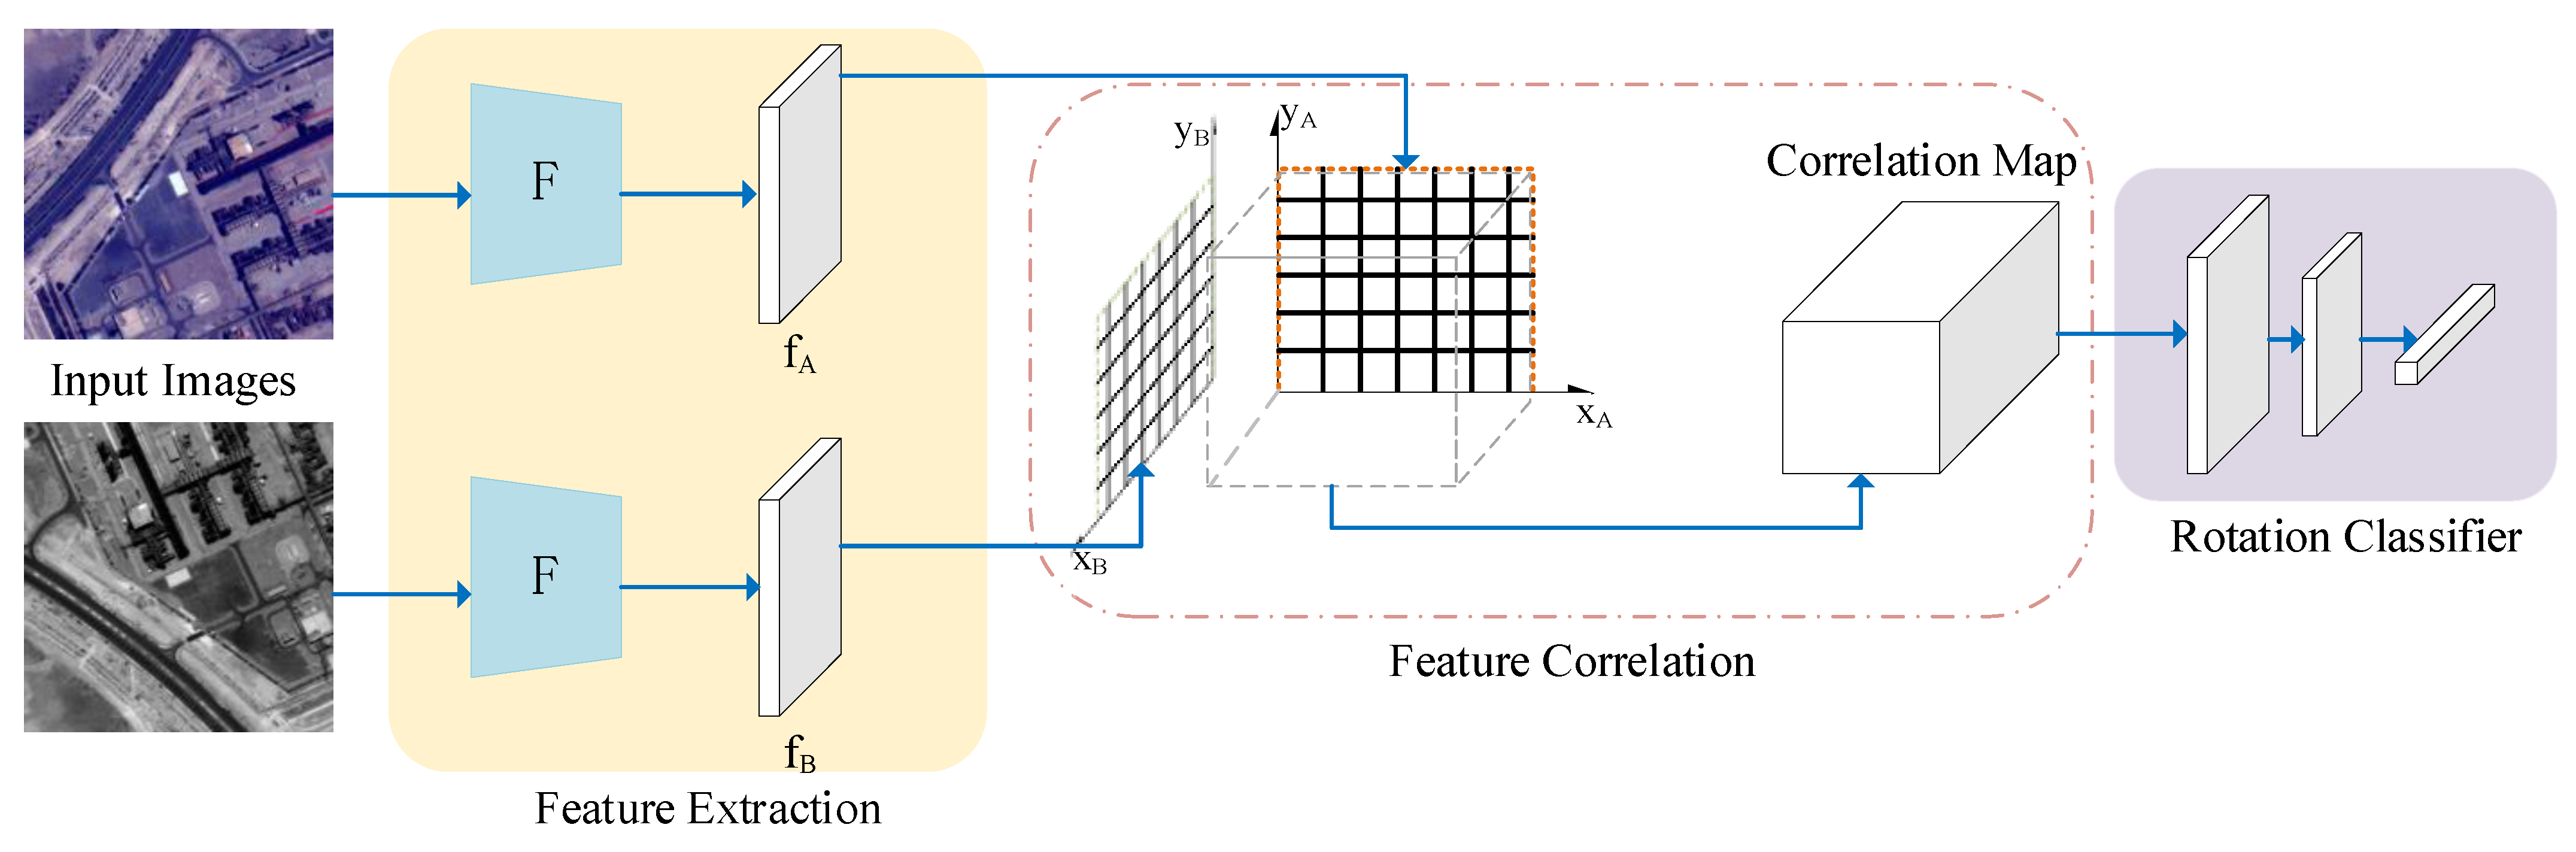
3.2. Rotation Classification Module

After the scale differences of the images have been eliminated, the most significant remaining geometric variation is rotation. In this section, a rotation classification network is designed to estimate the rotation variation of the images and to further alleviate the differences between the input images.
The rotation classification network has three components: Feature Extraction, Feature Correlation and Rotation Classifier. The overall structure of the network is given in Figure 7. First, corresponding feature maps of the two input images are obtained by ResNet101. Then, a correlation map is calculated from feature maps after L2 normalization. Finally, the correlation map is input into the rotation classifier to obtain the predicted rotation classification.
(1)
Feature Extraction. A pseudo Siamese neural network structure consisting of ResNet101 is utilized as the backbone of feature extraction, which could focus on the distinctive information of different modalities. Subsequently, the obtained features are L2-normalized to facilitate the following calculation of correlation matrix.
(2)
Feature Correlation. To measure the point-by-point correlation of two feature maps, this step calculates their correlation matrix, where each element represents similarity scores of the corresponding features. The details are consistent with (2) in Section 3.1.
(3)
Rotation Classifier. After the correlation matrix is given, we convert the rotation parameter regression problem into a rotation classification problem, which greatly simplifies the model training process. In this process, rotation parameters are divided into 8 categories in the range 0–360° at 30° intervals, which can be estimated by the rotation classifier containing two convolutional layers and one fully connected layer.
The cross-entropy loss function is very suitable for training deep learning networks for classification. Therefore, this function is adopted to train the rotation classification network, which is shown as follows:
L = 1 N i L i = 1 N i c = 1 M I i c log ( p i c )
where M is the number of categories, and M = 12 . I i c is an index function of sample i and class c .

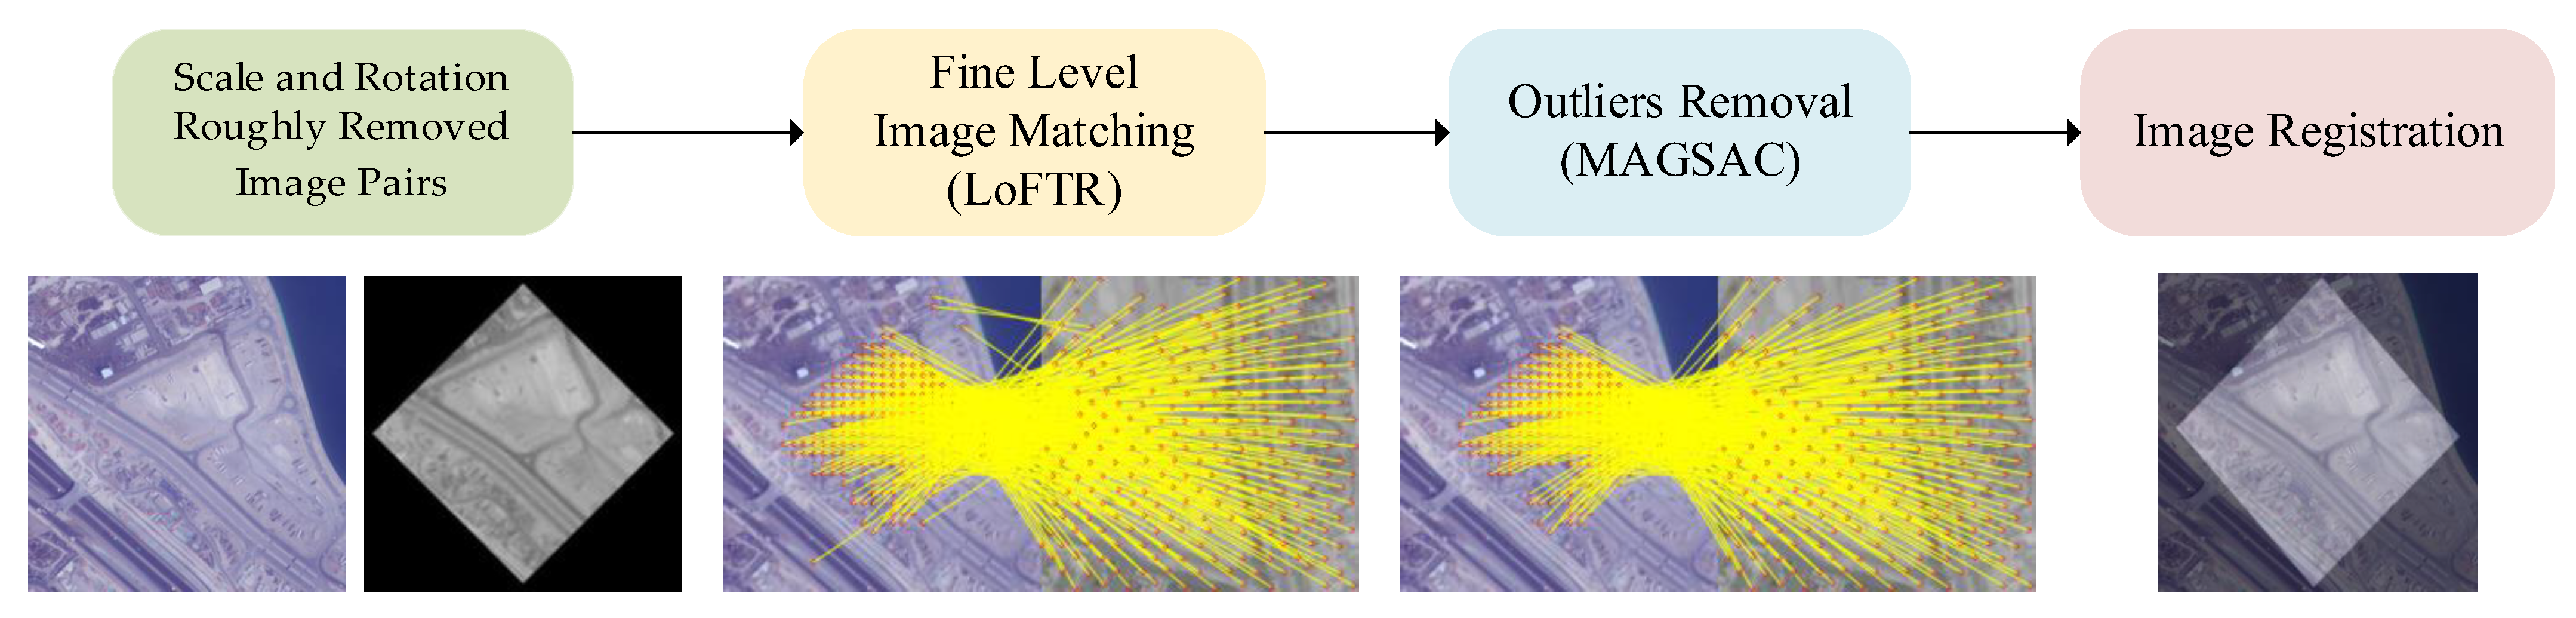
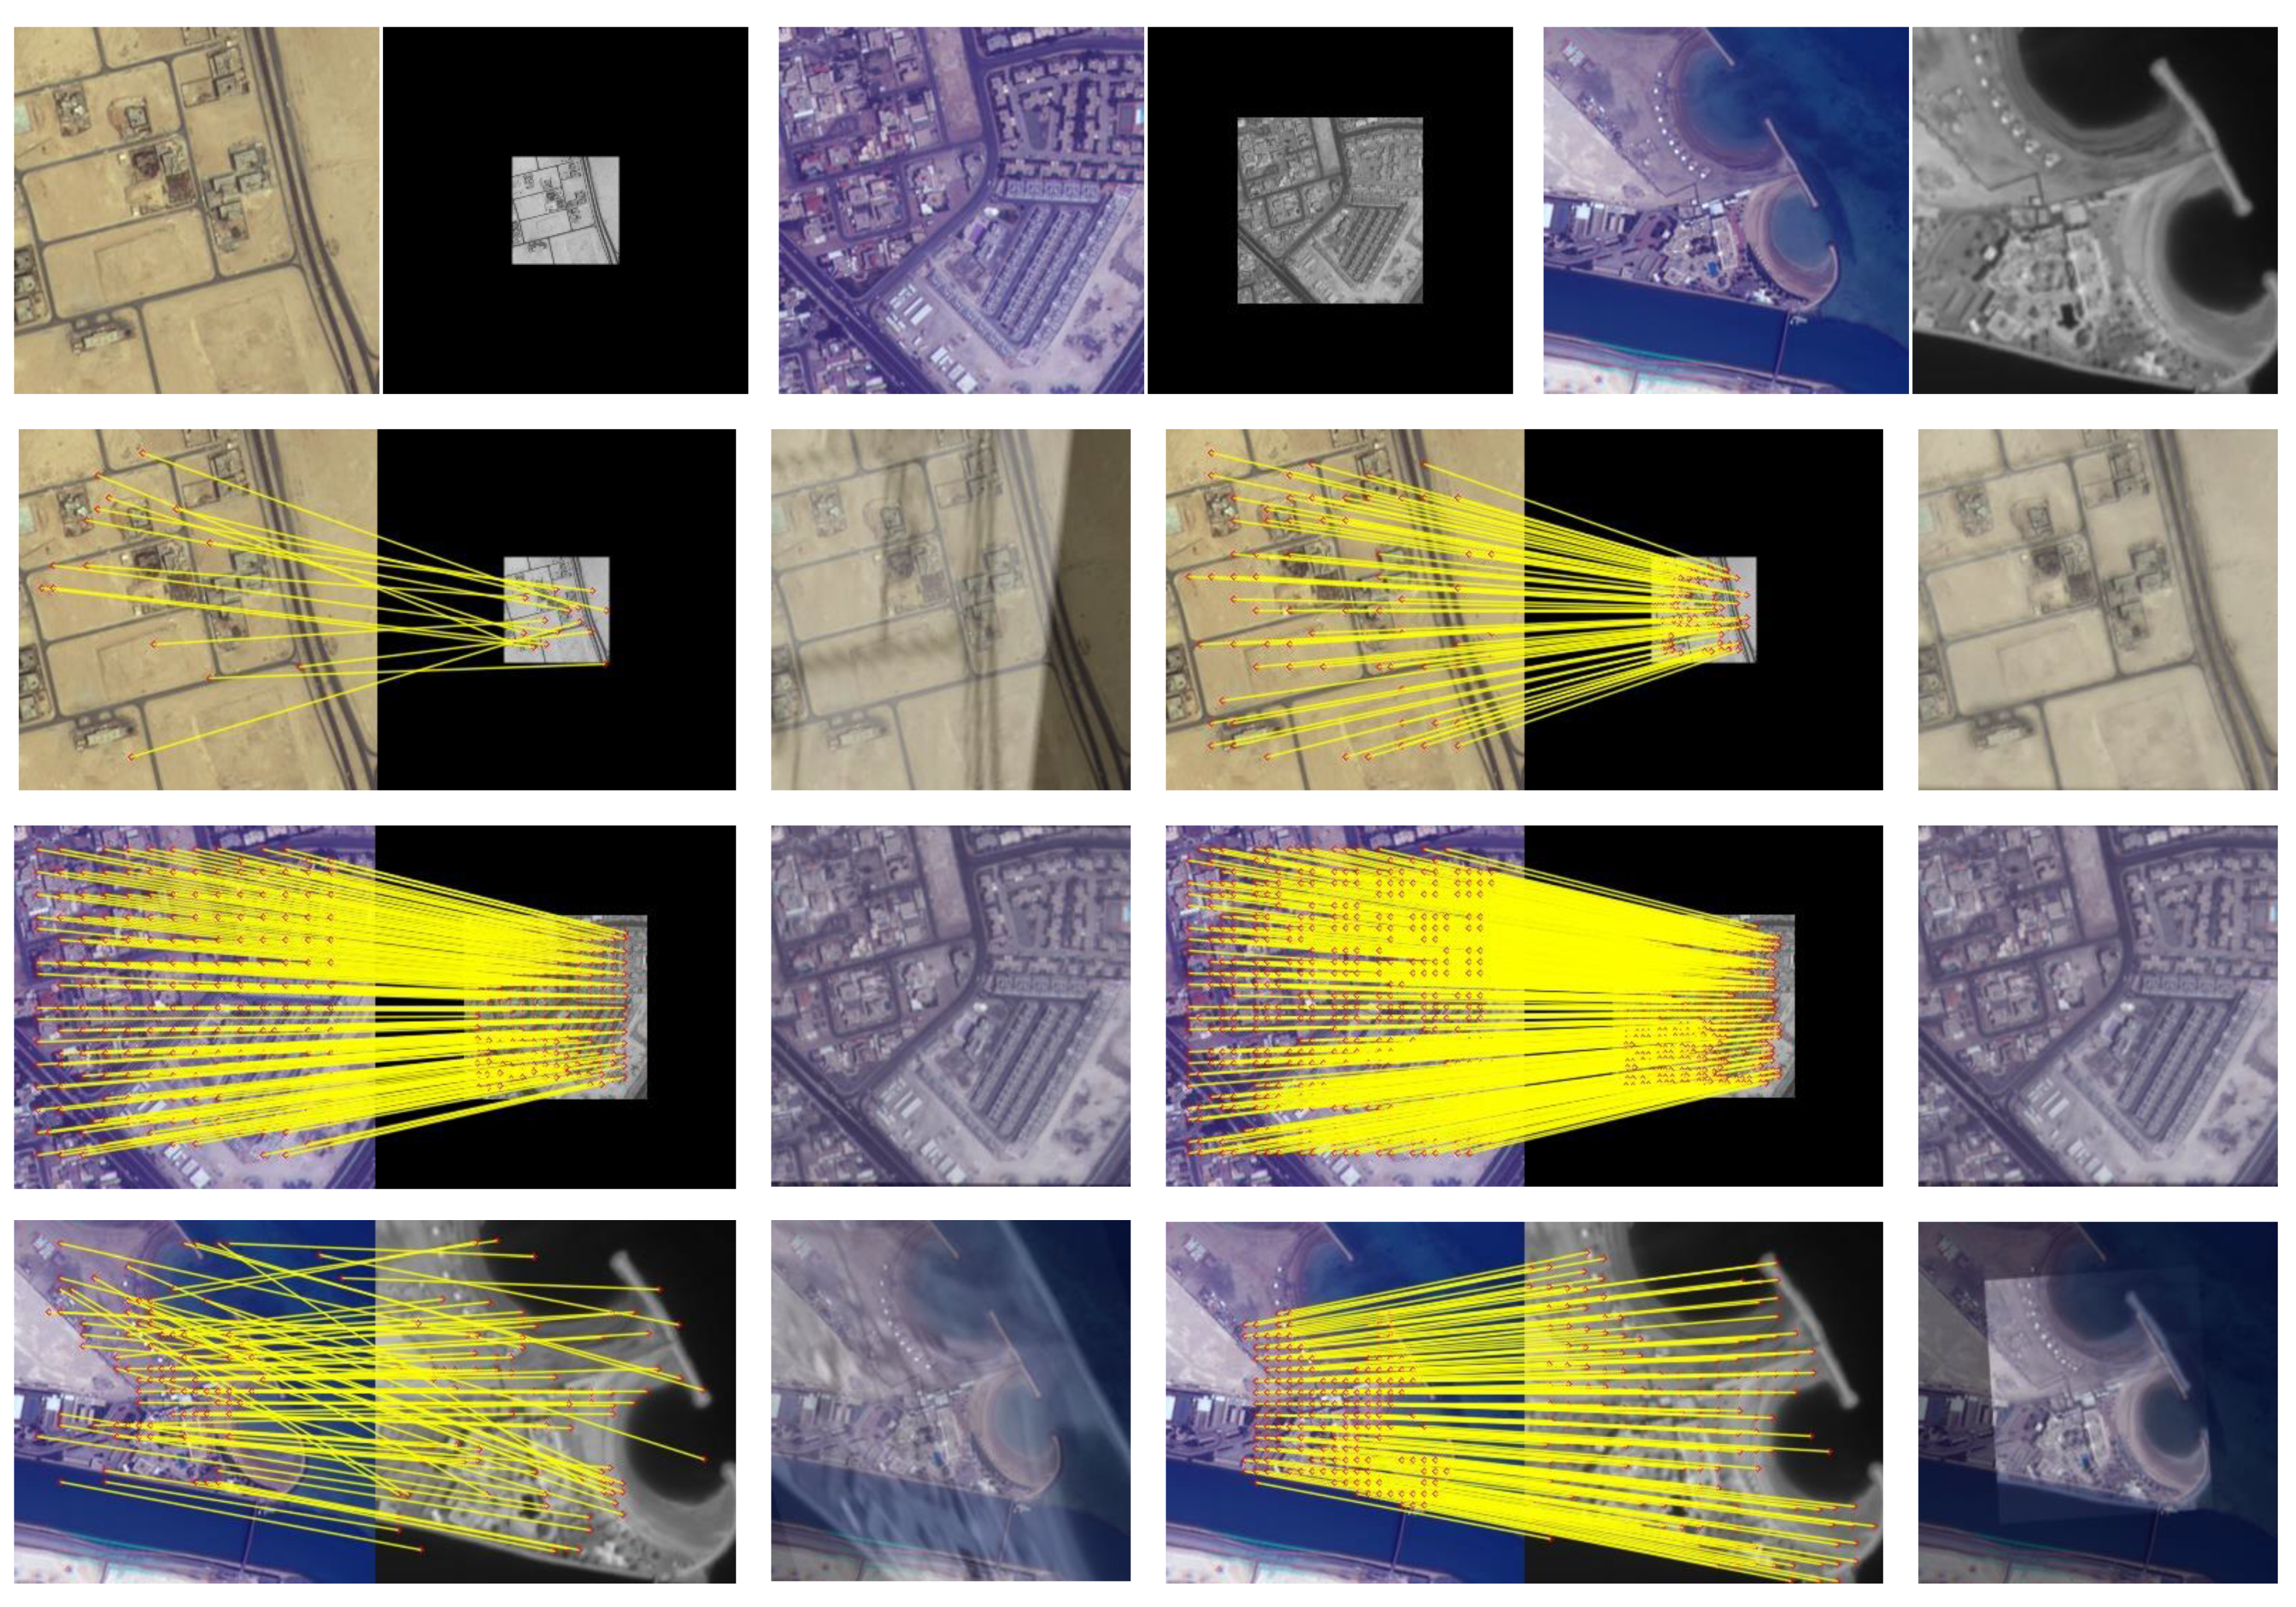
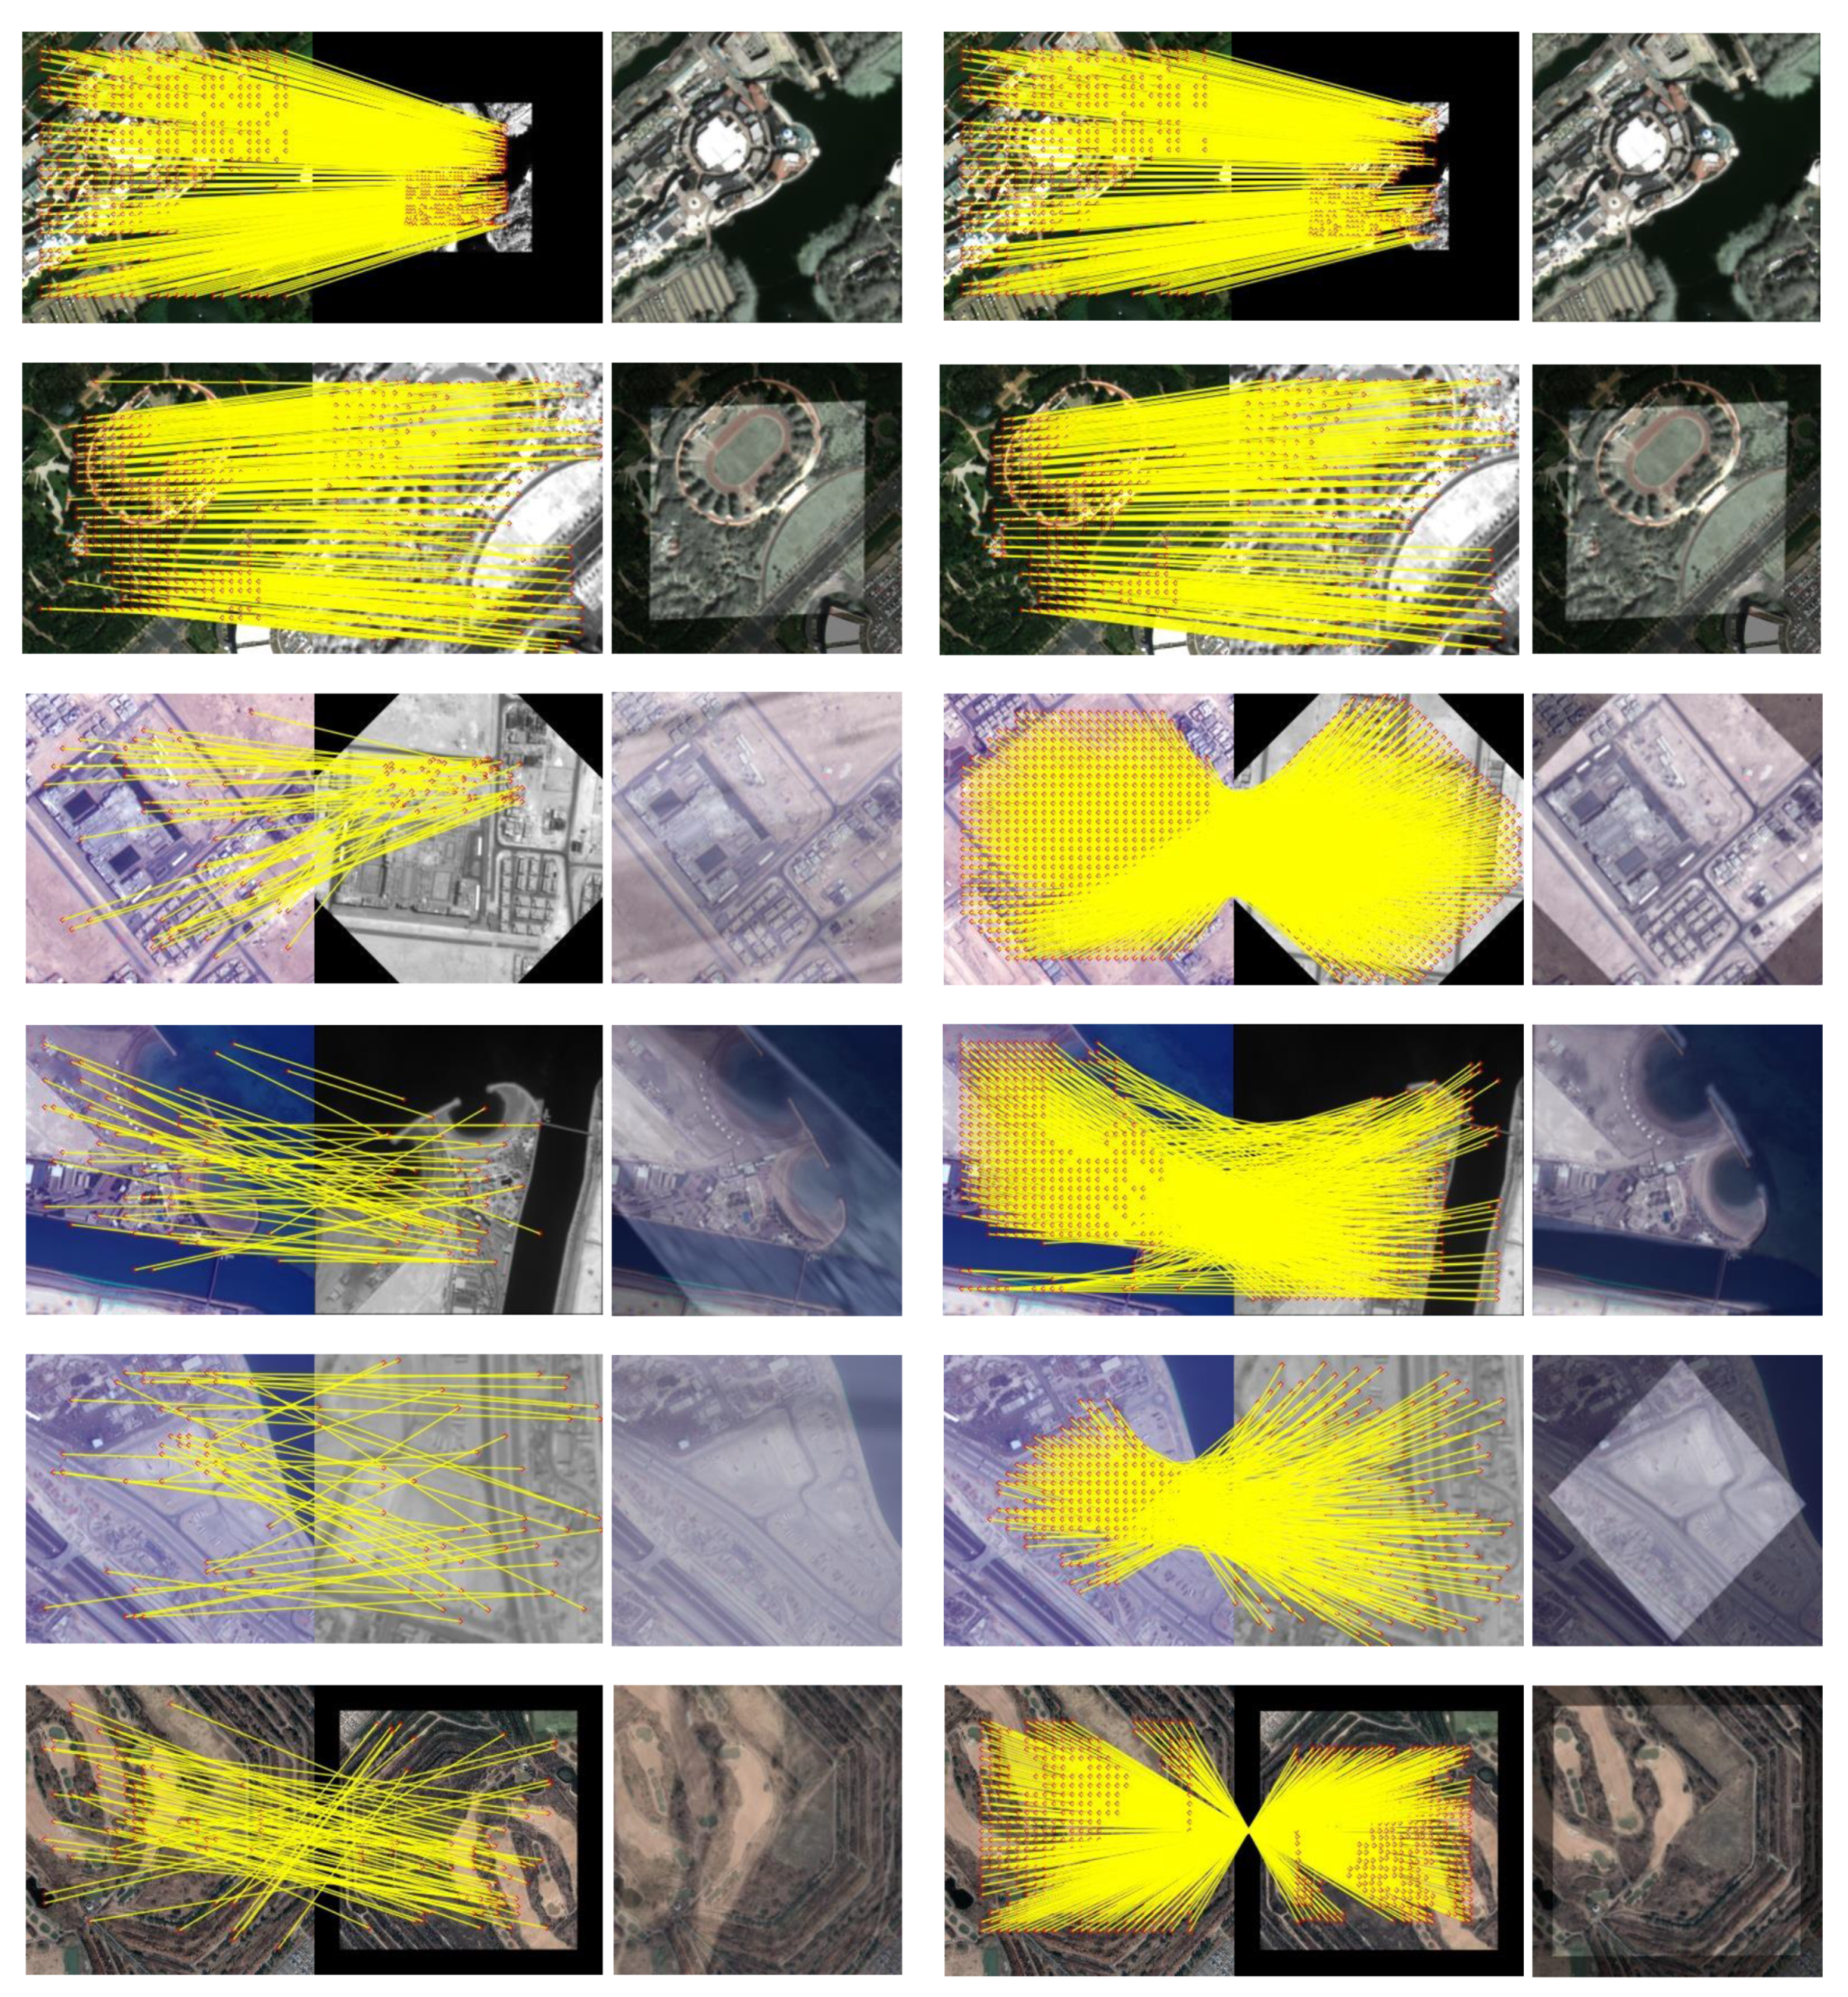
3.3. Fine-Level Image Matching and Registration

Section 3.1 and Section 3.2 predict the geometric transformation between the input images, and this section presents the fine level process of image matching and registration after the geometric distortion has been roughly removed.
The fine-level image matching and registration process is illustrated in Figure 8 and is implemented in the following steps:
(1)
Given the superior performance of LoFTR in local-image feature matching, it has been adopted for the feature extraction and matching of image pairs where geometric transformations have been eliminated.
(2)
To purify the match results, MAGSAC [24] is used to remove the outliers.
(3)
The image transform matrix H is calculated from the fine level matching pairs and the accurate image registration is achieved.

4. Experimental Results and Analysis

To validate the effectiveness of the proposed method, four multimodal remote sensing image datasets are applied for the evaluation and comparison experiments in this section. Datasets and experiment implementation details are given in Section 4.1. Subsequently, the robustness of the proposed method to geometric transformations under different scale and rotation conditions is tested in Section 4.2. In Section 4.3, the matching and registration results of the proposed method and ScaleNet are compared first. Then, the visualization results and quantitative comparison results of our method with CNNGeo [21], AffNet [25], Two-Stream Ensemble [26], and SE2-LoFTR [18] are analyzed.

4.1. Datasets and Experiment Implementation Details
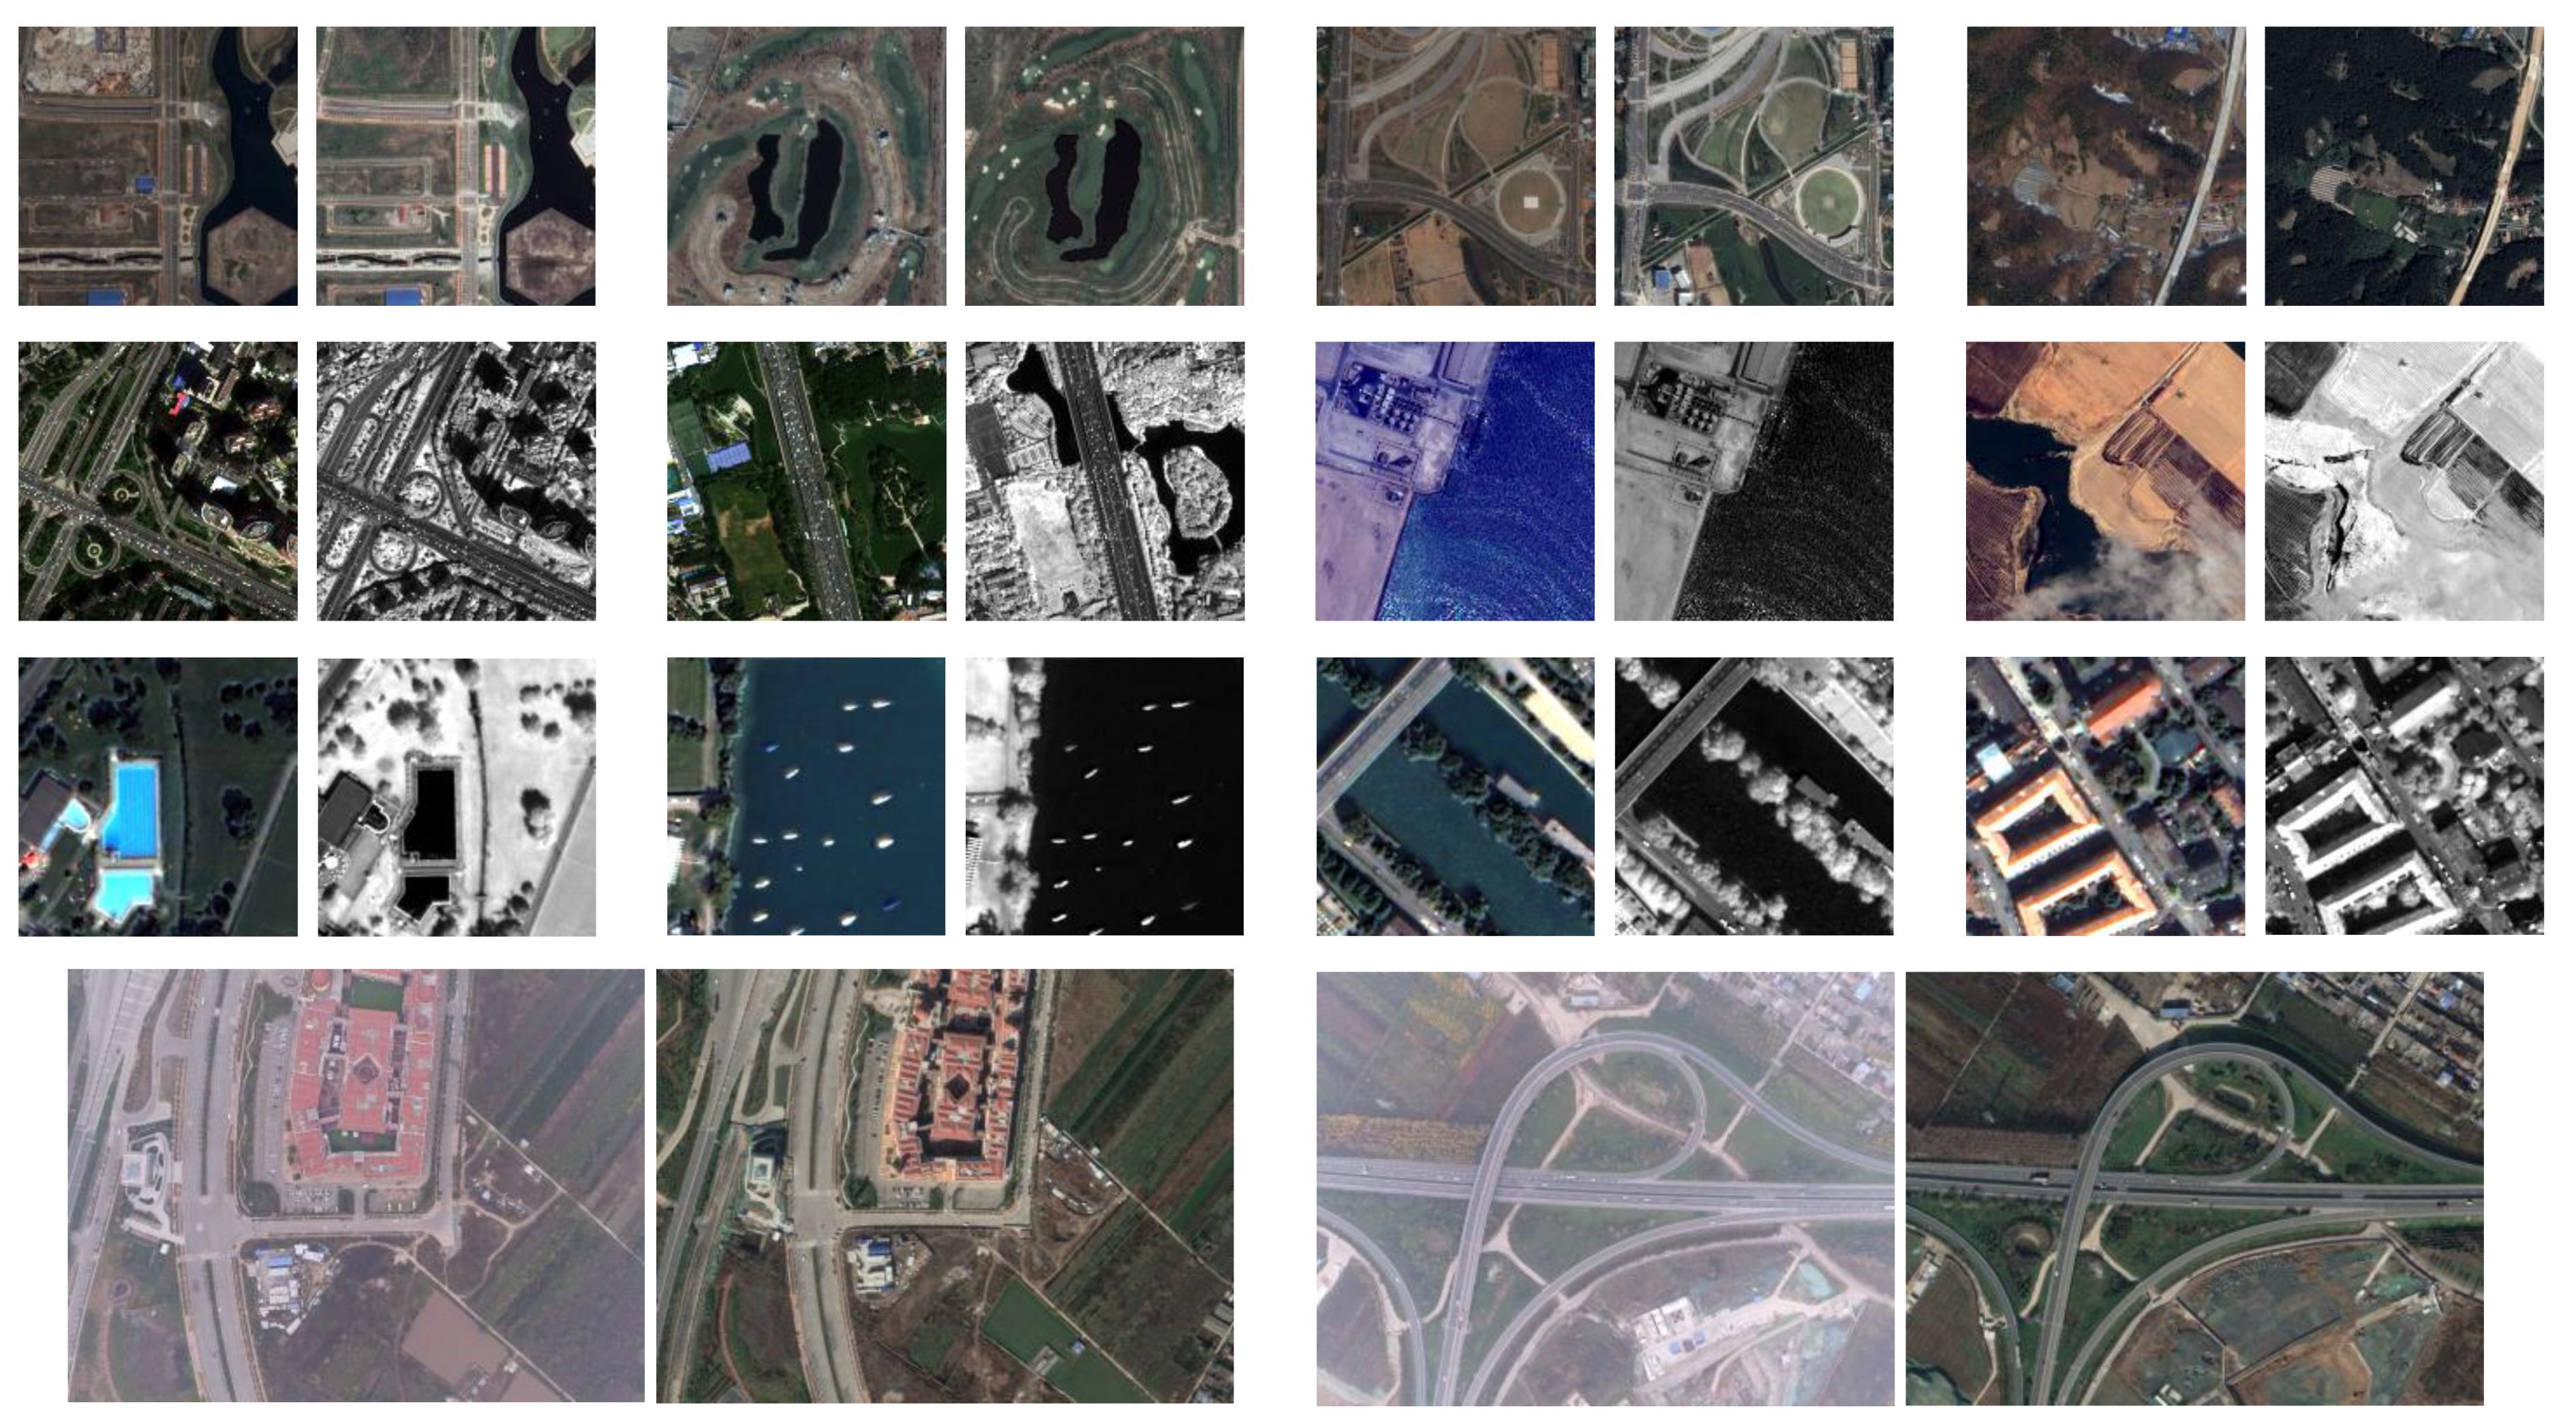
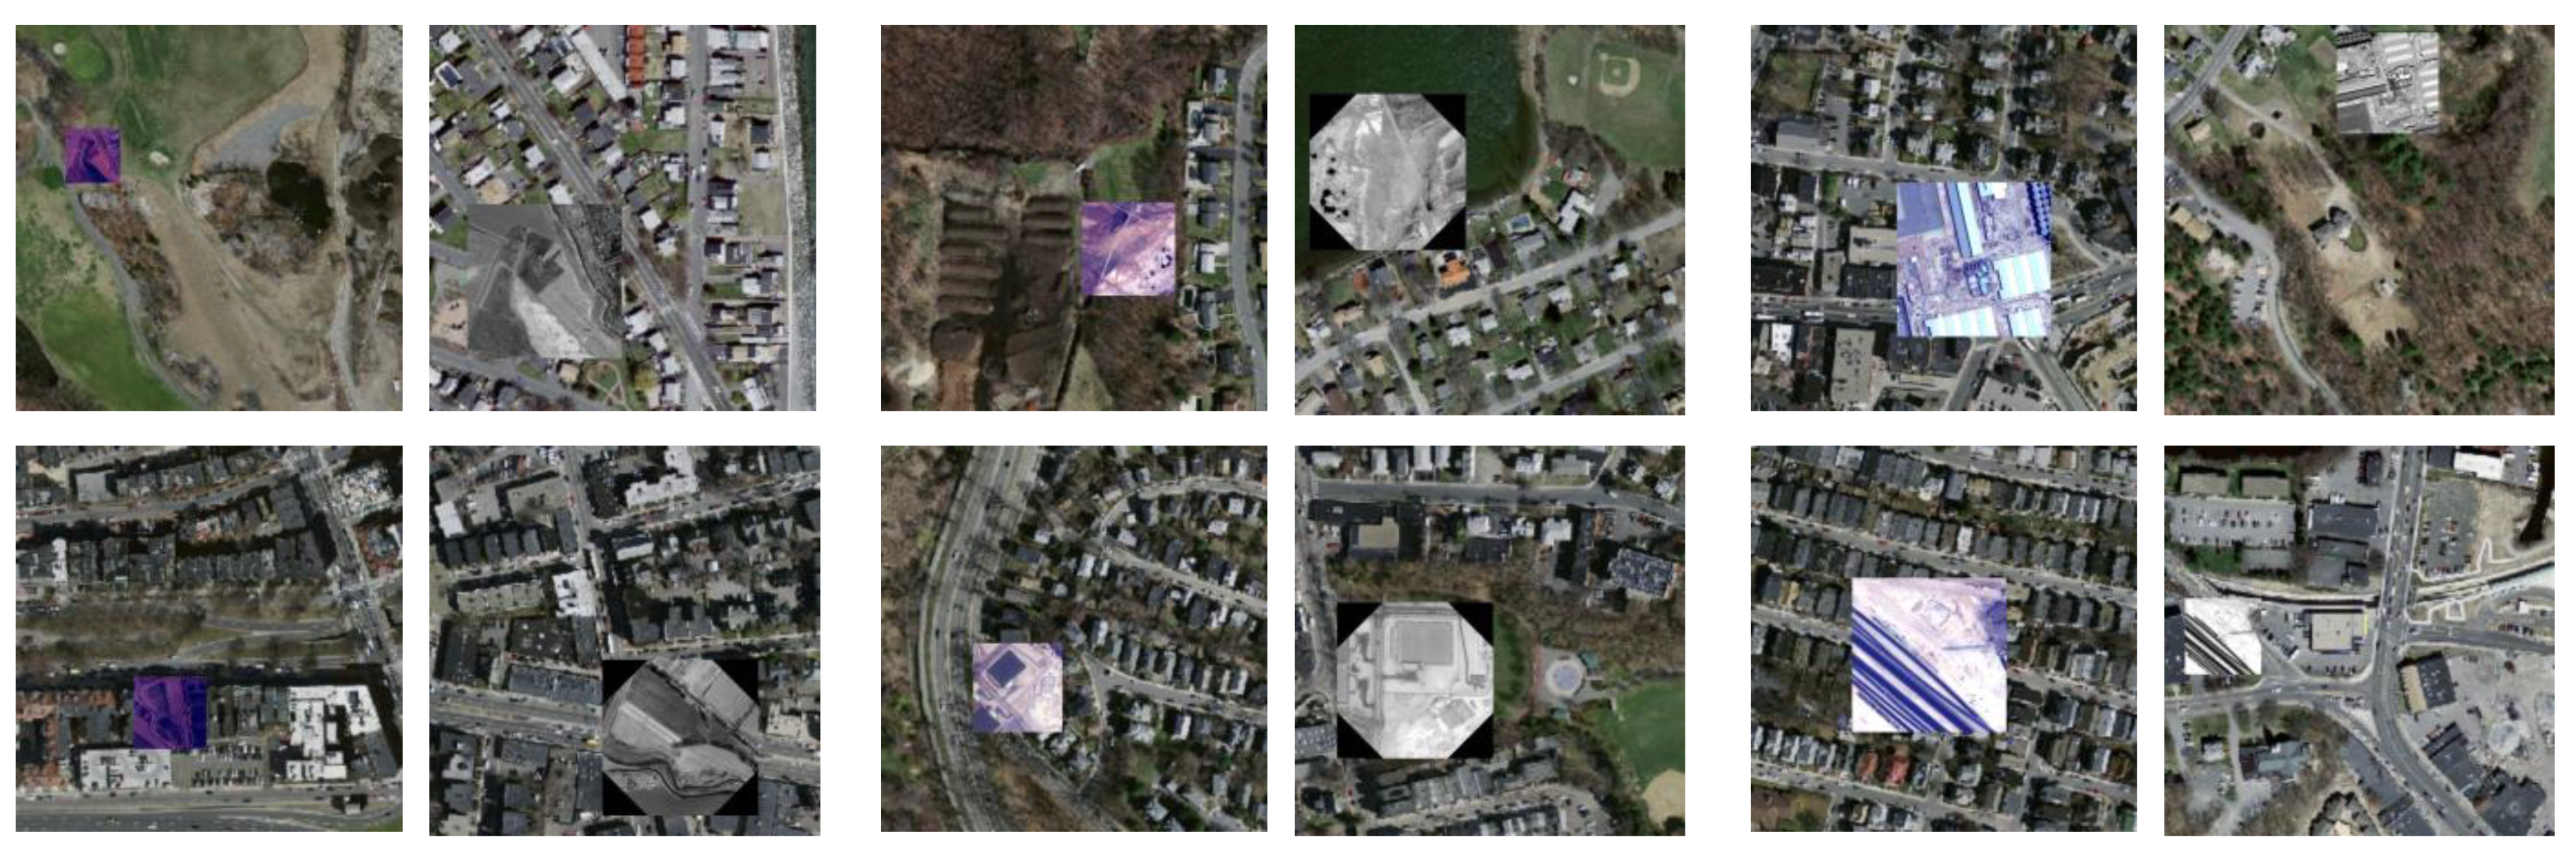
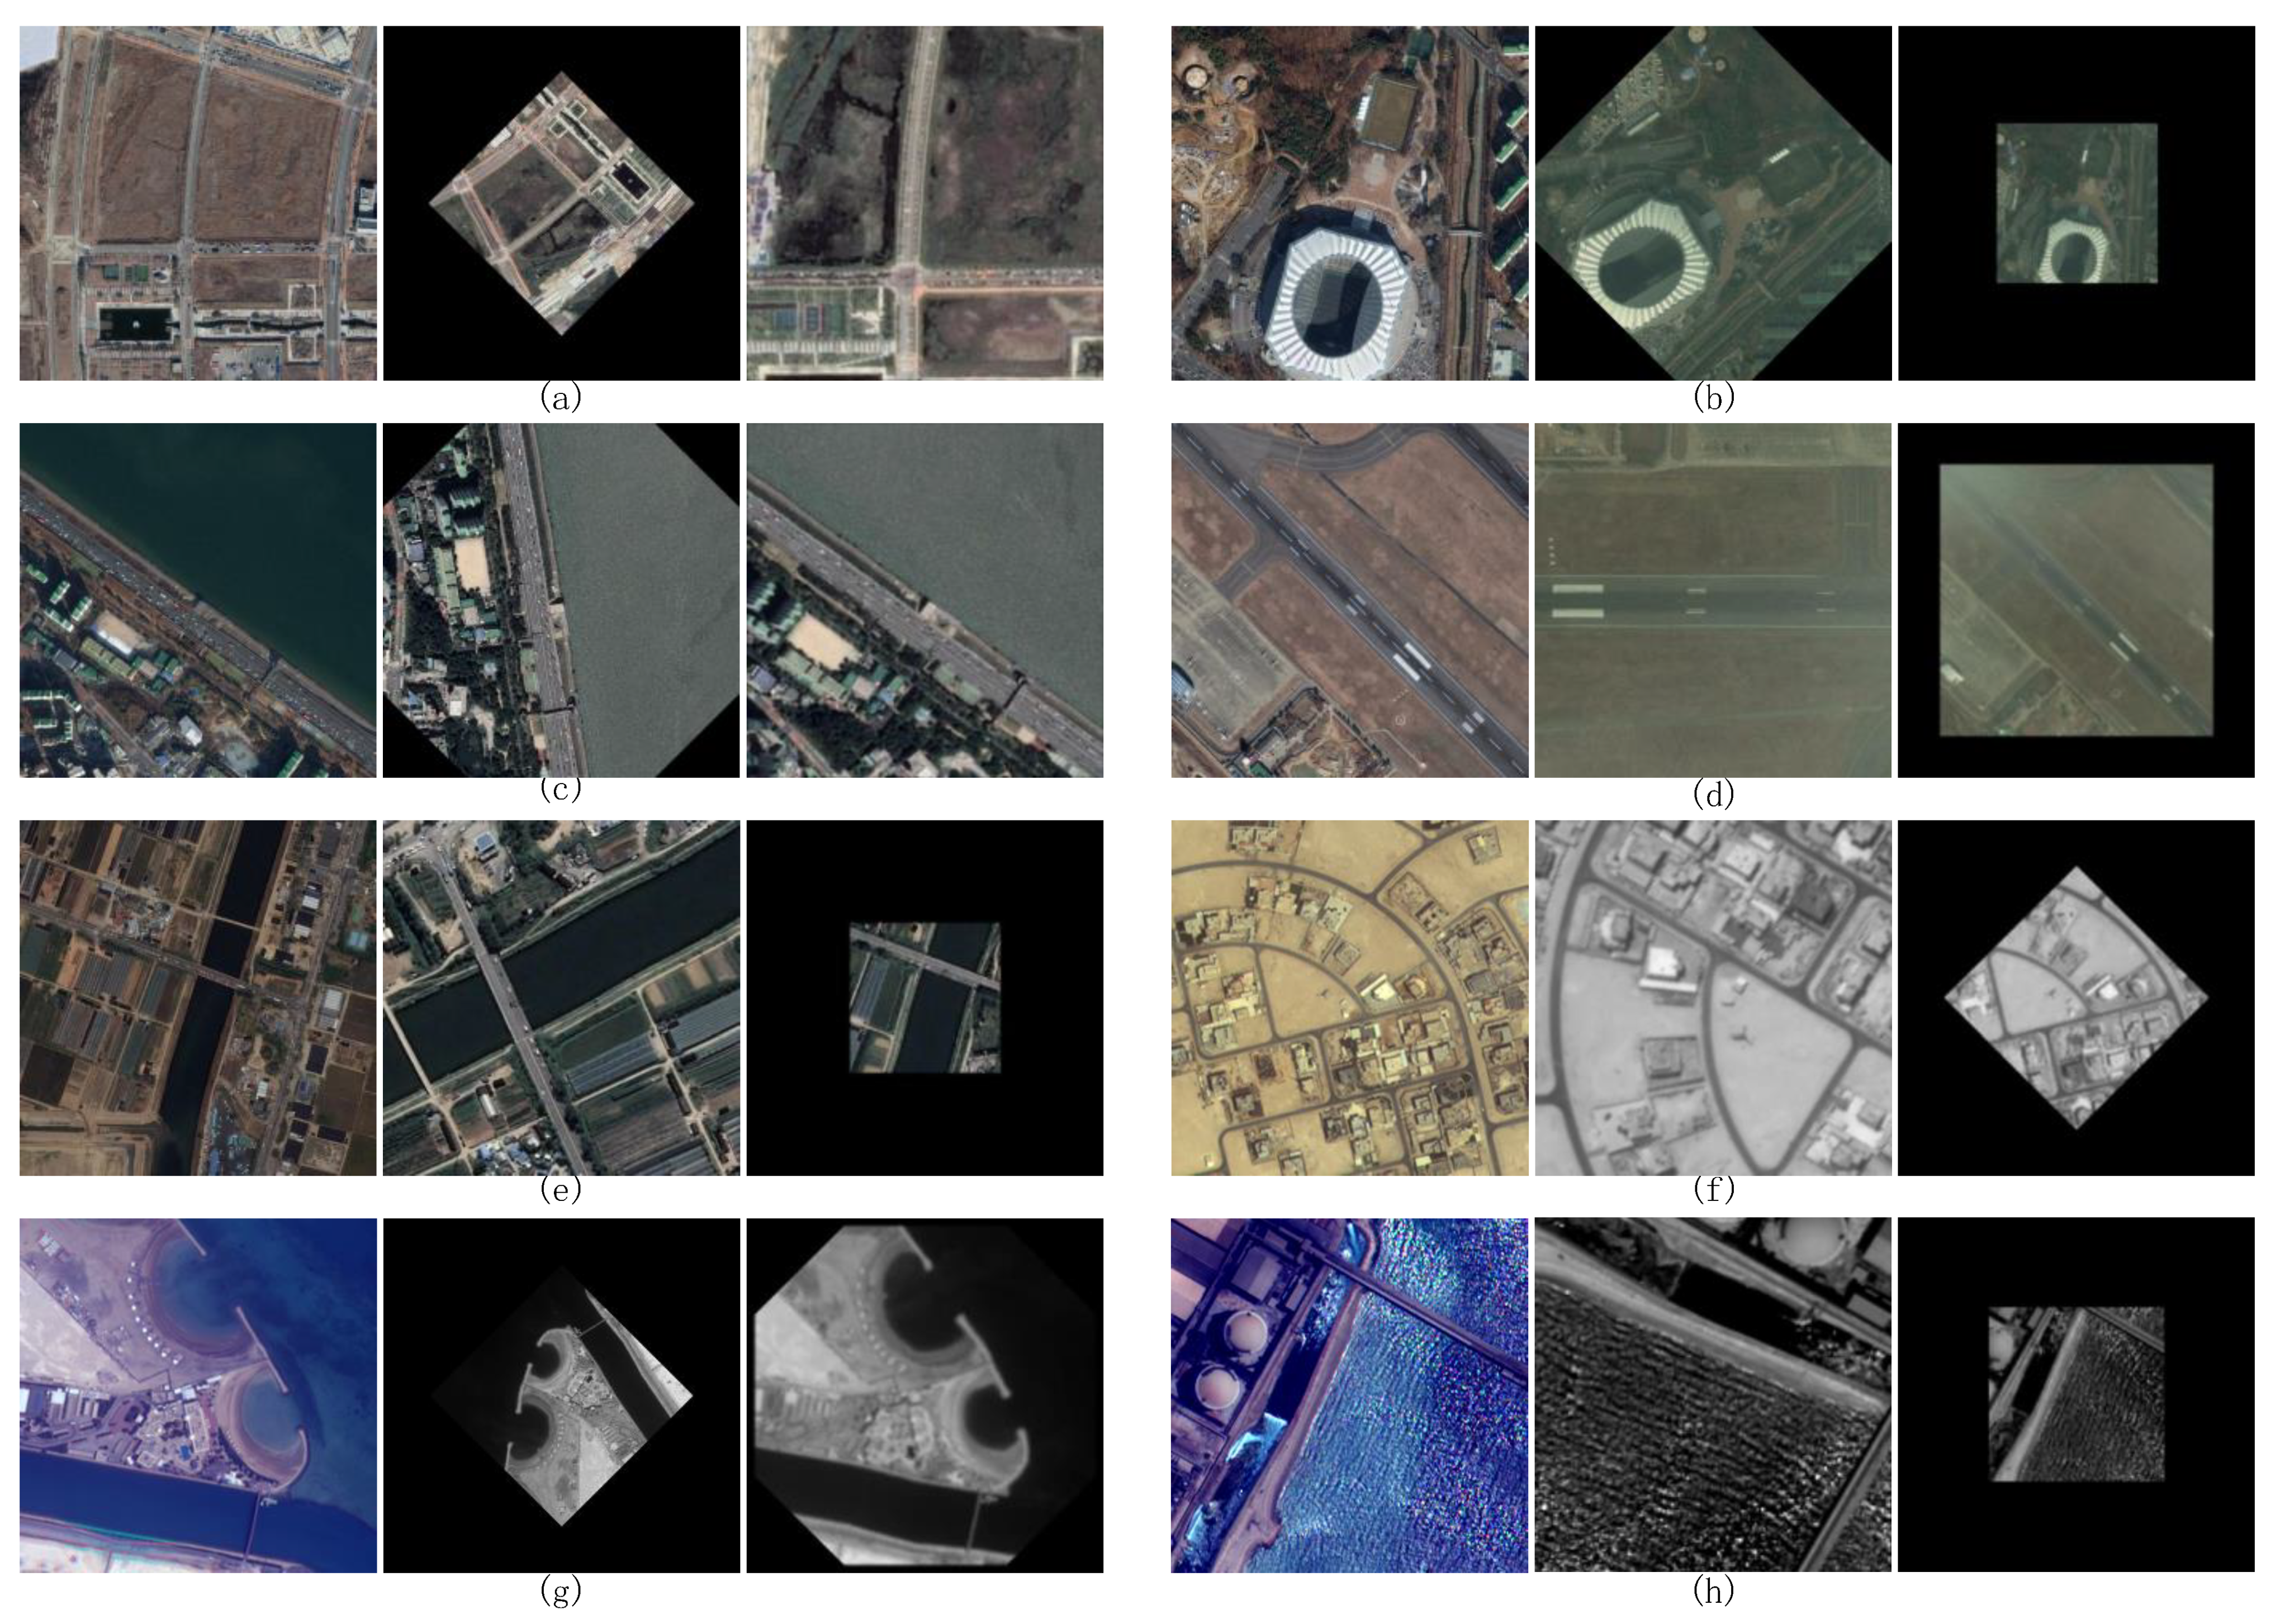
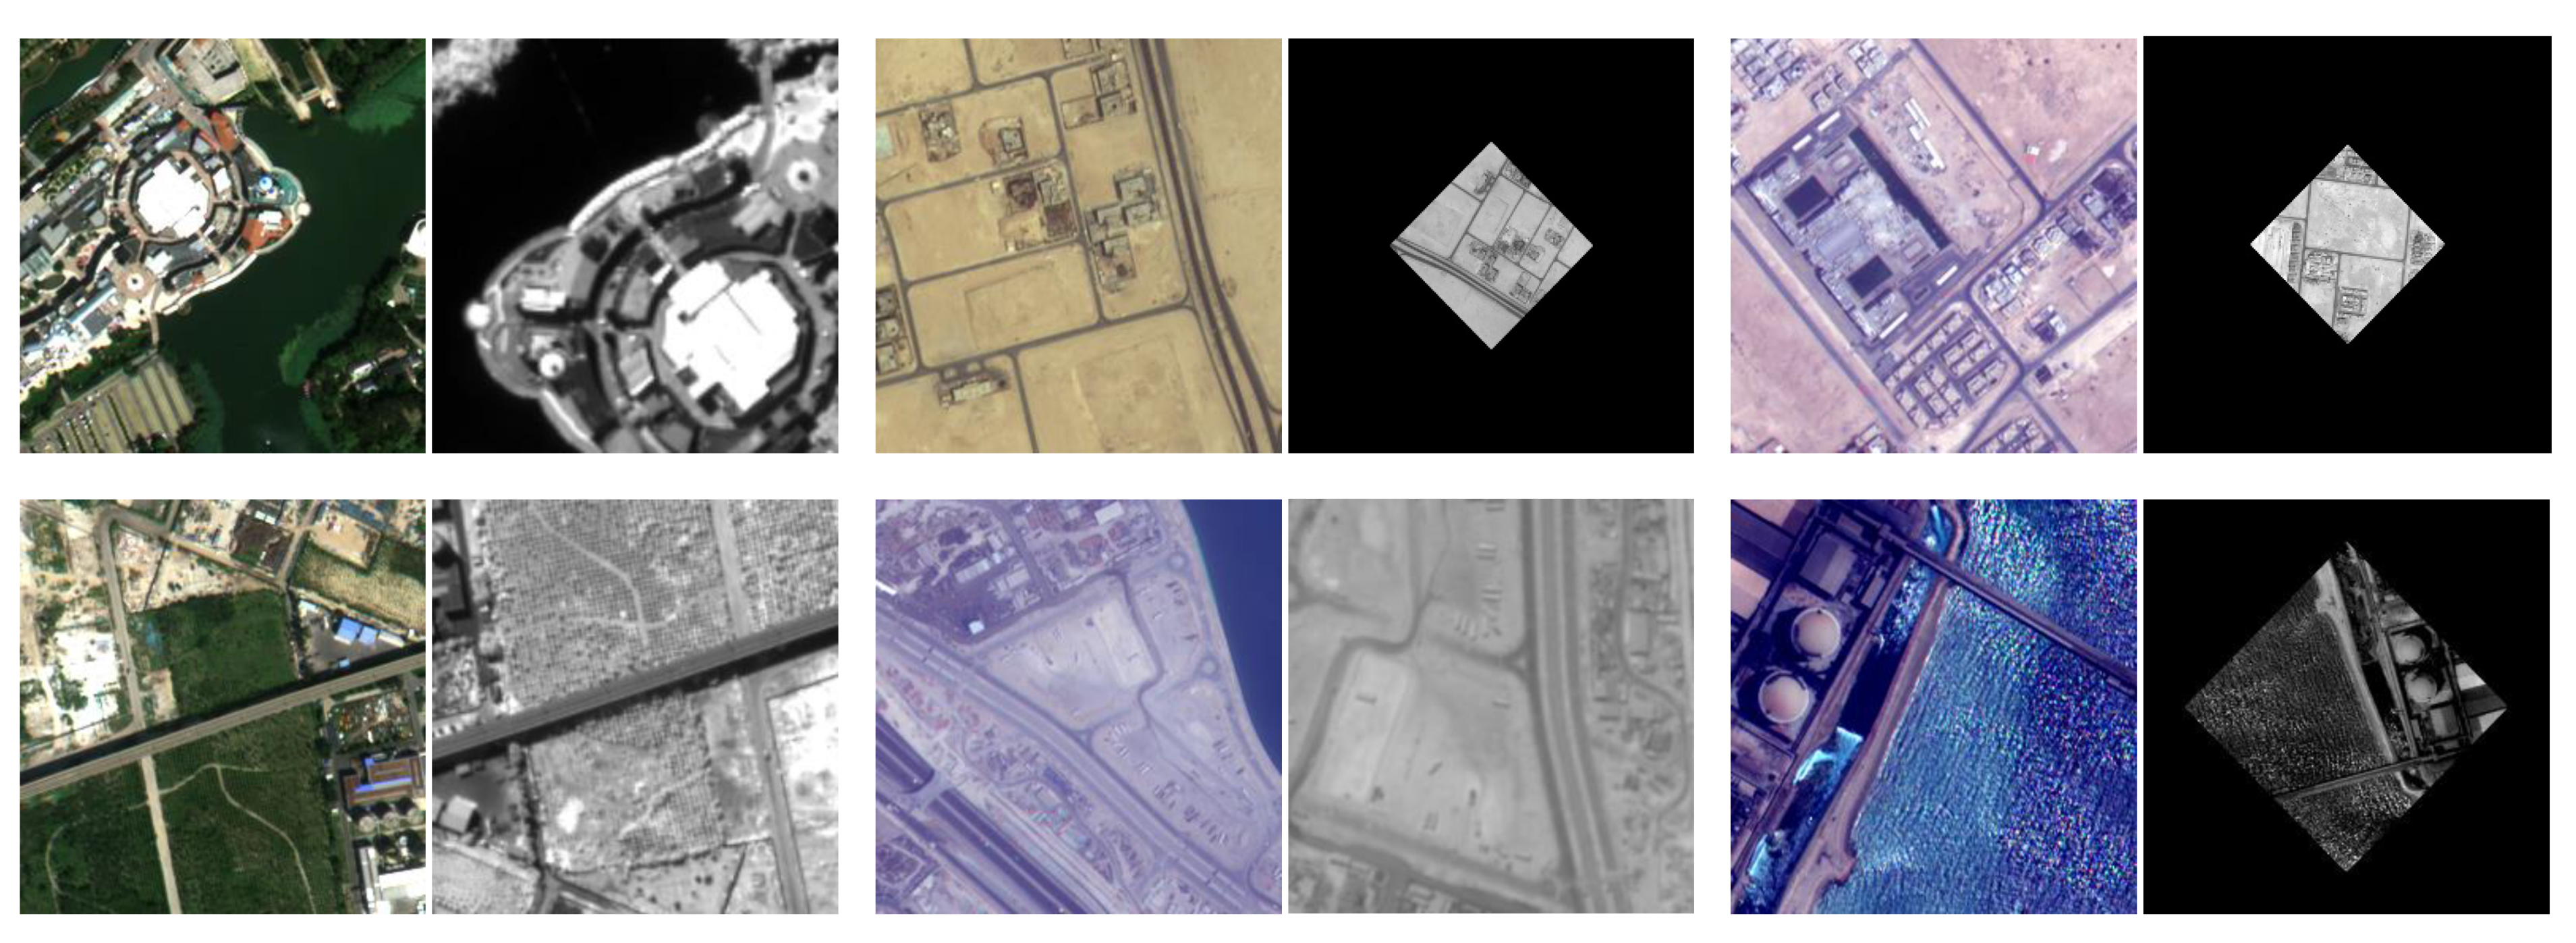
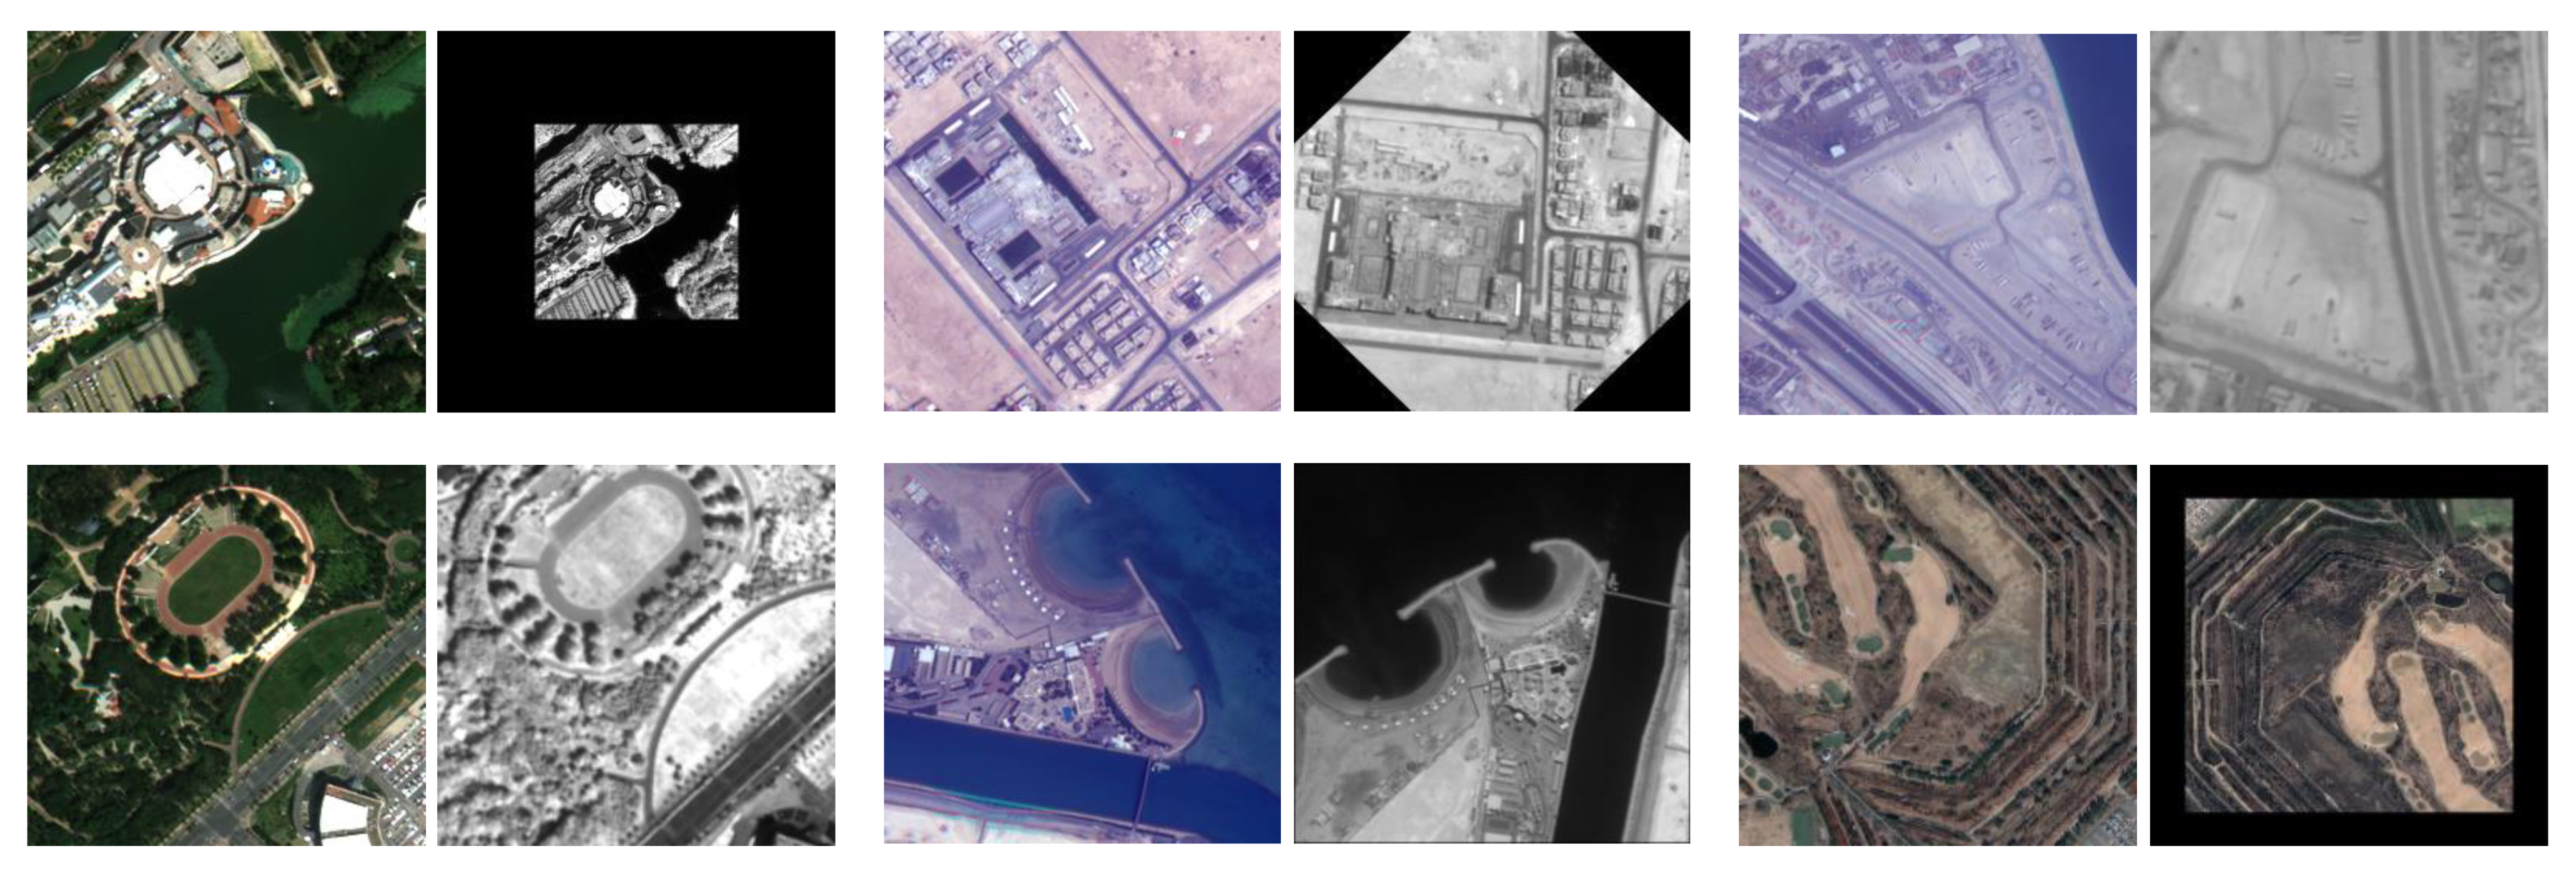
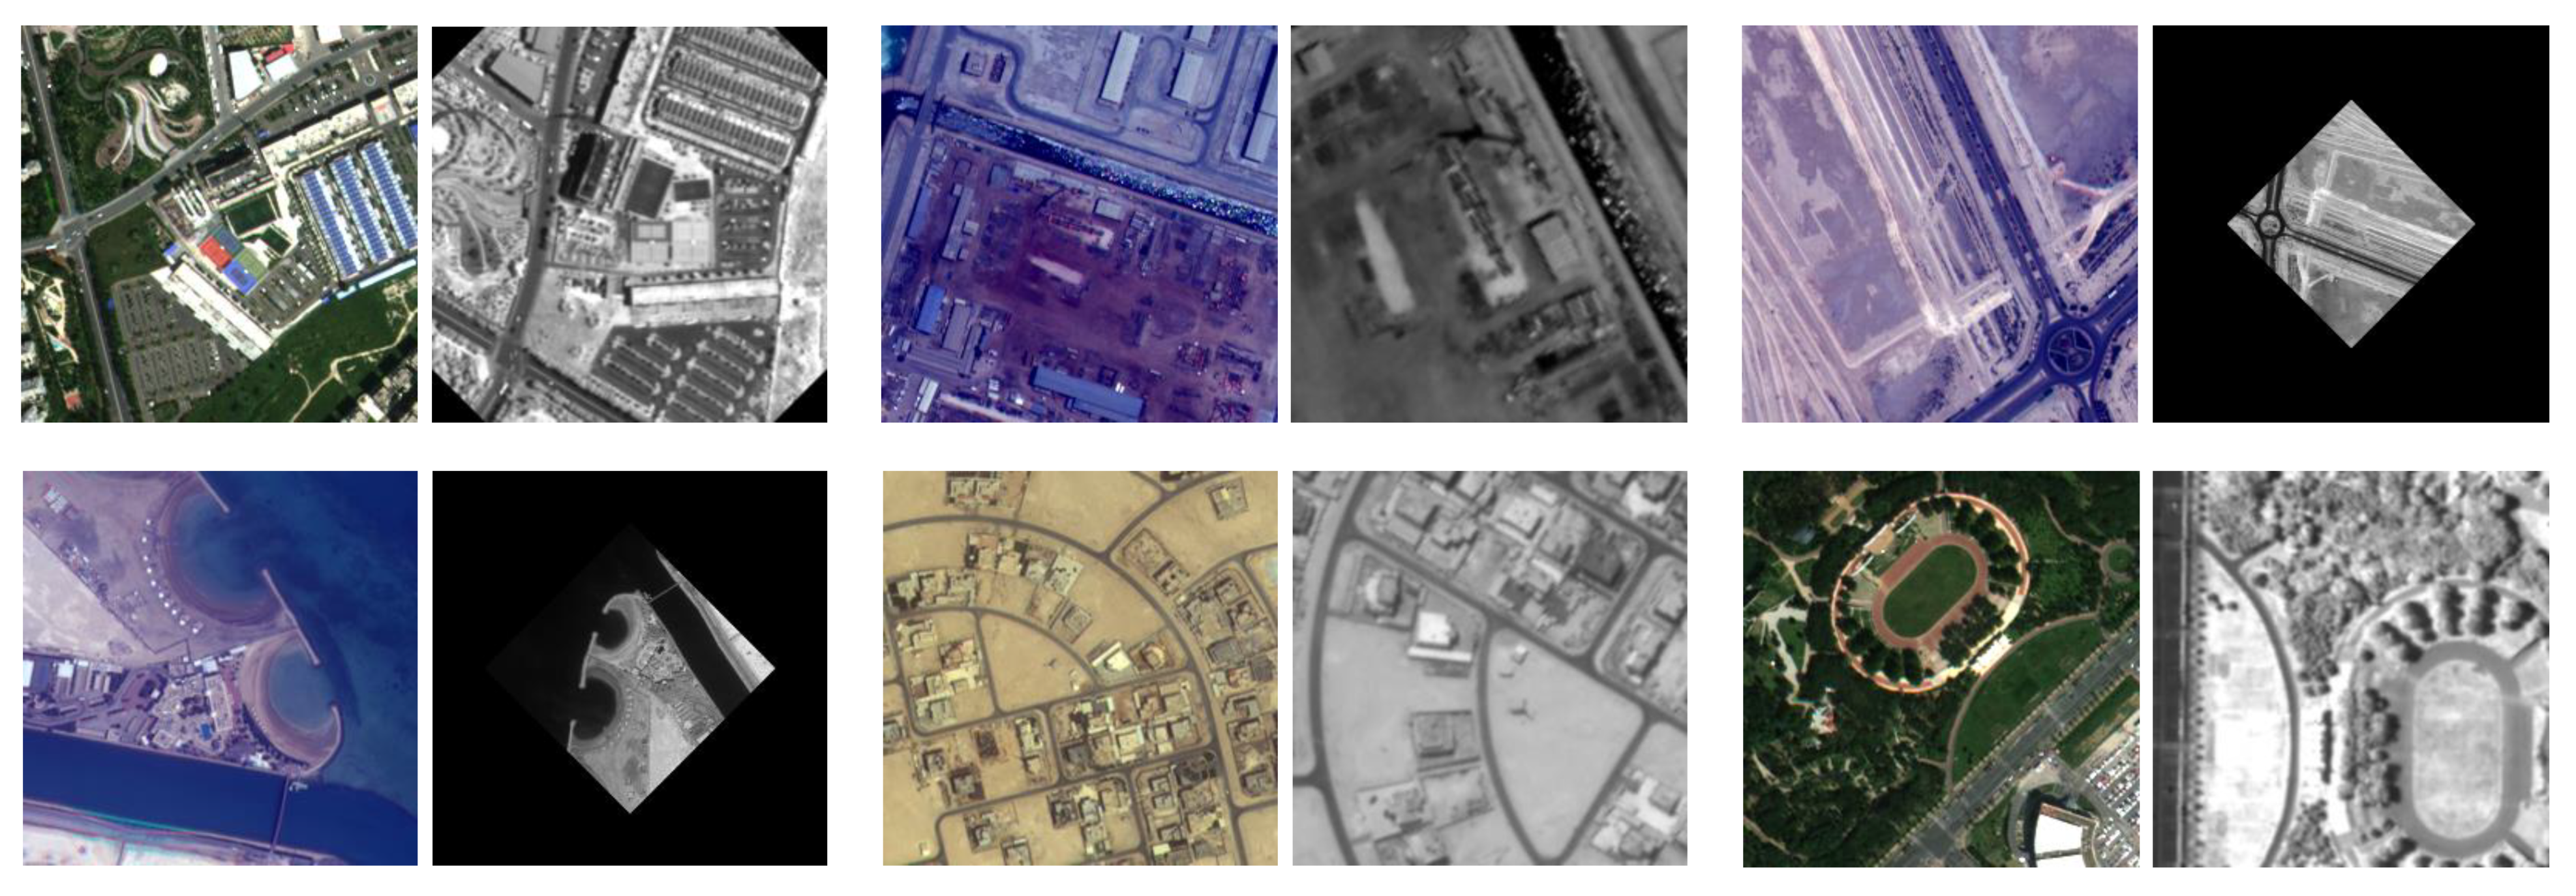
4.1.1. Datasets

Multimodal remote-sensing image datasets (Figure 9) employed in our comparative and evaluative experiments contains the following four groups:
(a)
Google Earth dataset [22]: The dataset contains 9042 image pairs with a size of 1080 × 1080 pixels, and each of them is collected at the same location but at different times. In the experiment of our network, 8000 image pairs are applied to train the rotate classification module, 900 pairs are applied to validation and 142 pairs are allocated to testing phases.
(b)
HRMS dataset: The High-Resolution Multimodal Satellite remote sensing dataset is captured by Gaofen-14 satellite, which contains 1730 multispectral and panchromatic remote sensing image pairs with a size of 256 × 256 pixels. In the experiment, 1500 pairs of images are applied to train of the scale regression module, 90 pairs are applied to validation and 140 pairs of images are assigned to the testing phases.
(c)
VIS-NIR dataset [27]: This dataset contains 319 pairs of visible and infrared image with a size of 256 × 256 pixels, which mainly includes urban, village and coastal scenes. The contrast difference is the main change between the original image pairs. This dataset is only adopted in the testing phase of comparative experiments.
(d)
UAV dataset: The UAV dataset works only in testing phase and involves 87 image pairs. The aerial images are captured by DJI X5 with a size of 1000 × 750 pixels. The referenced remote sensing images are captured from Google Earth with different resolutions ranging from 2209 × 1622 to 2794 × 2197 . Before the comparative experiments, the image pairs of UAV dataset are uniformly resized to 750 × 750 .
The four datasets mentioned above contain diverse data scenes, including cities, deserts, coasts, airports, etc. It should be noted that there is no geometric distortion in the original image pairs, but artificial scale and rotation transformations are added before training and testing.

4.1.2. Data Processing

In order to build the effective training dataset for the proposed method, we split the original images into 256 × 256 -size images. In the scale regression module, the scale ratio was set to s = 2 m , where m [ 0 , 3 ] . To enhance the predictive power of the scale ratio under rotation, the training set was added to the random rotation change along with the scale change. Finally, we selected different visible images from the VIS-NIR dataset as backgrounds for the training images to increase the robustness of the model. In total, 1590 training image pairs were used to train the scale regression module. Examples of the training image pairs are shown in Figure 10.
During the training process of the rotation classification module, we randomly selected an integer from [ 0 , 11 ] as the ground truth label n. The images in the HRMS dataset were then rotated by the angle of n × 30°.

4.1.3. Implementation Detail and Evaluation Metrics

All the experiments are implemented on an NVIDIA GeForce RTX 3080Ti GPU using Pytorch. The Adam optimizer is used to train the scale regression network and the rotation classification network. The settings of hyperparameters for the networks are shown in Table 1, which are obtained by optimizing the performance of the model on the validation set.
To quantitatively evaluate the matching and registration results, the number of correct matched point pairs (NCM) and root mean square error (RMSE) are adopted as performance measures. When the pixel error of a matched pair is less than 5, it is considered to be the correct matched pair. RMSE can be calculated as:
R M S E = 1 L i = 1 L ( p 1 i H ( p 2 i ) ) 2
where { p 1 i , p 2 i } ( i = 1 , 2 , , n ) indicates a matched point pair, and p 1 i and p 2 i are the feature point location coordinates extracted from input images, respectively. H is the transformation matrix estimated from the matched feature points. L represents the number of matched point pairs.

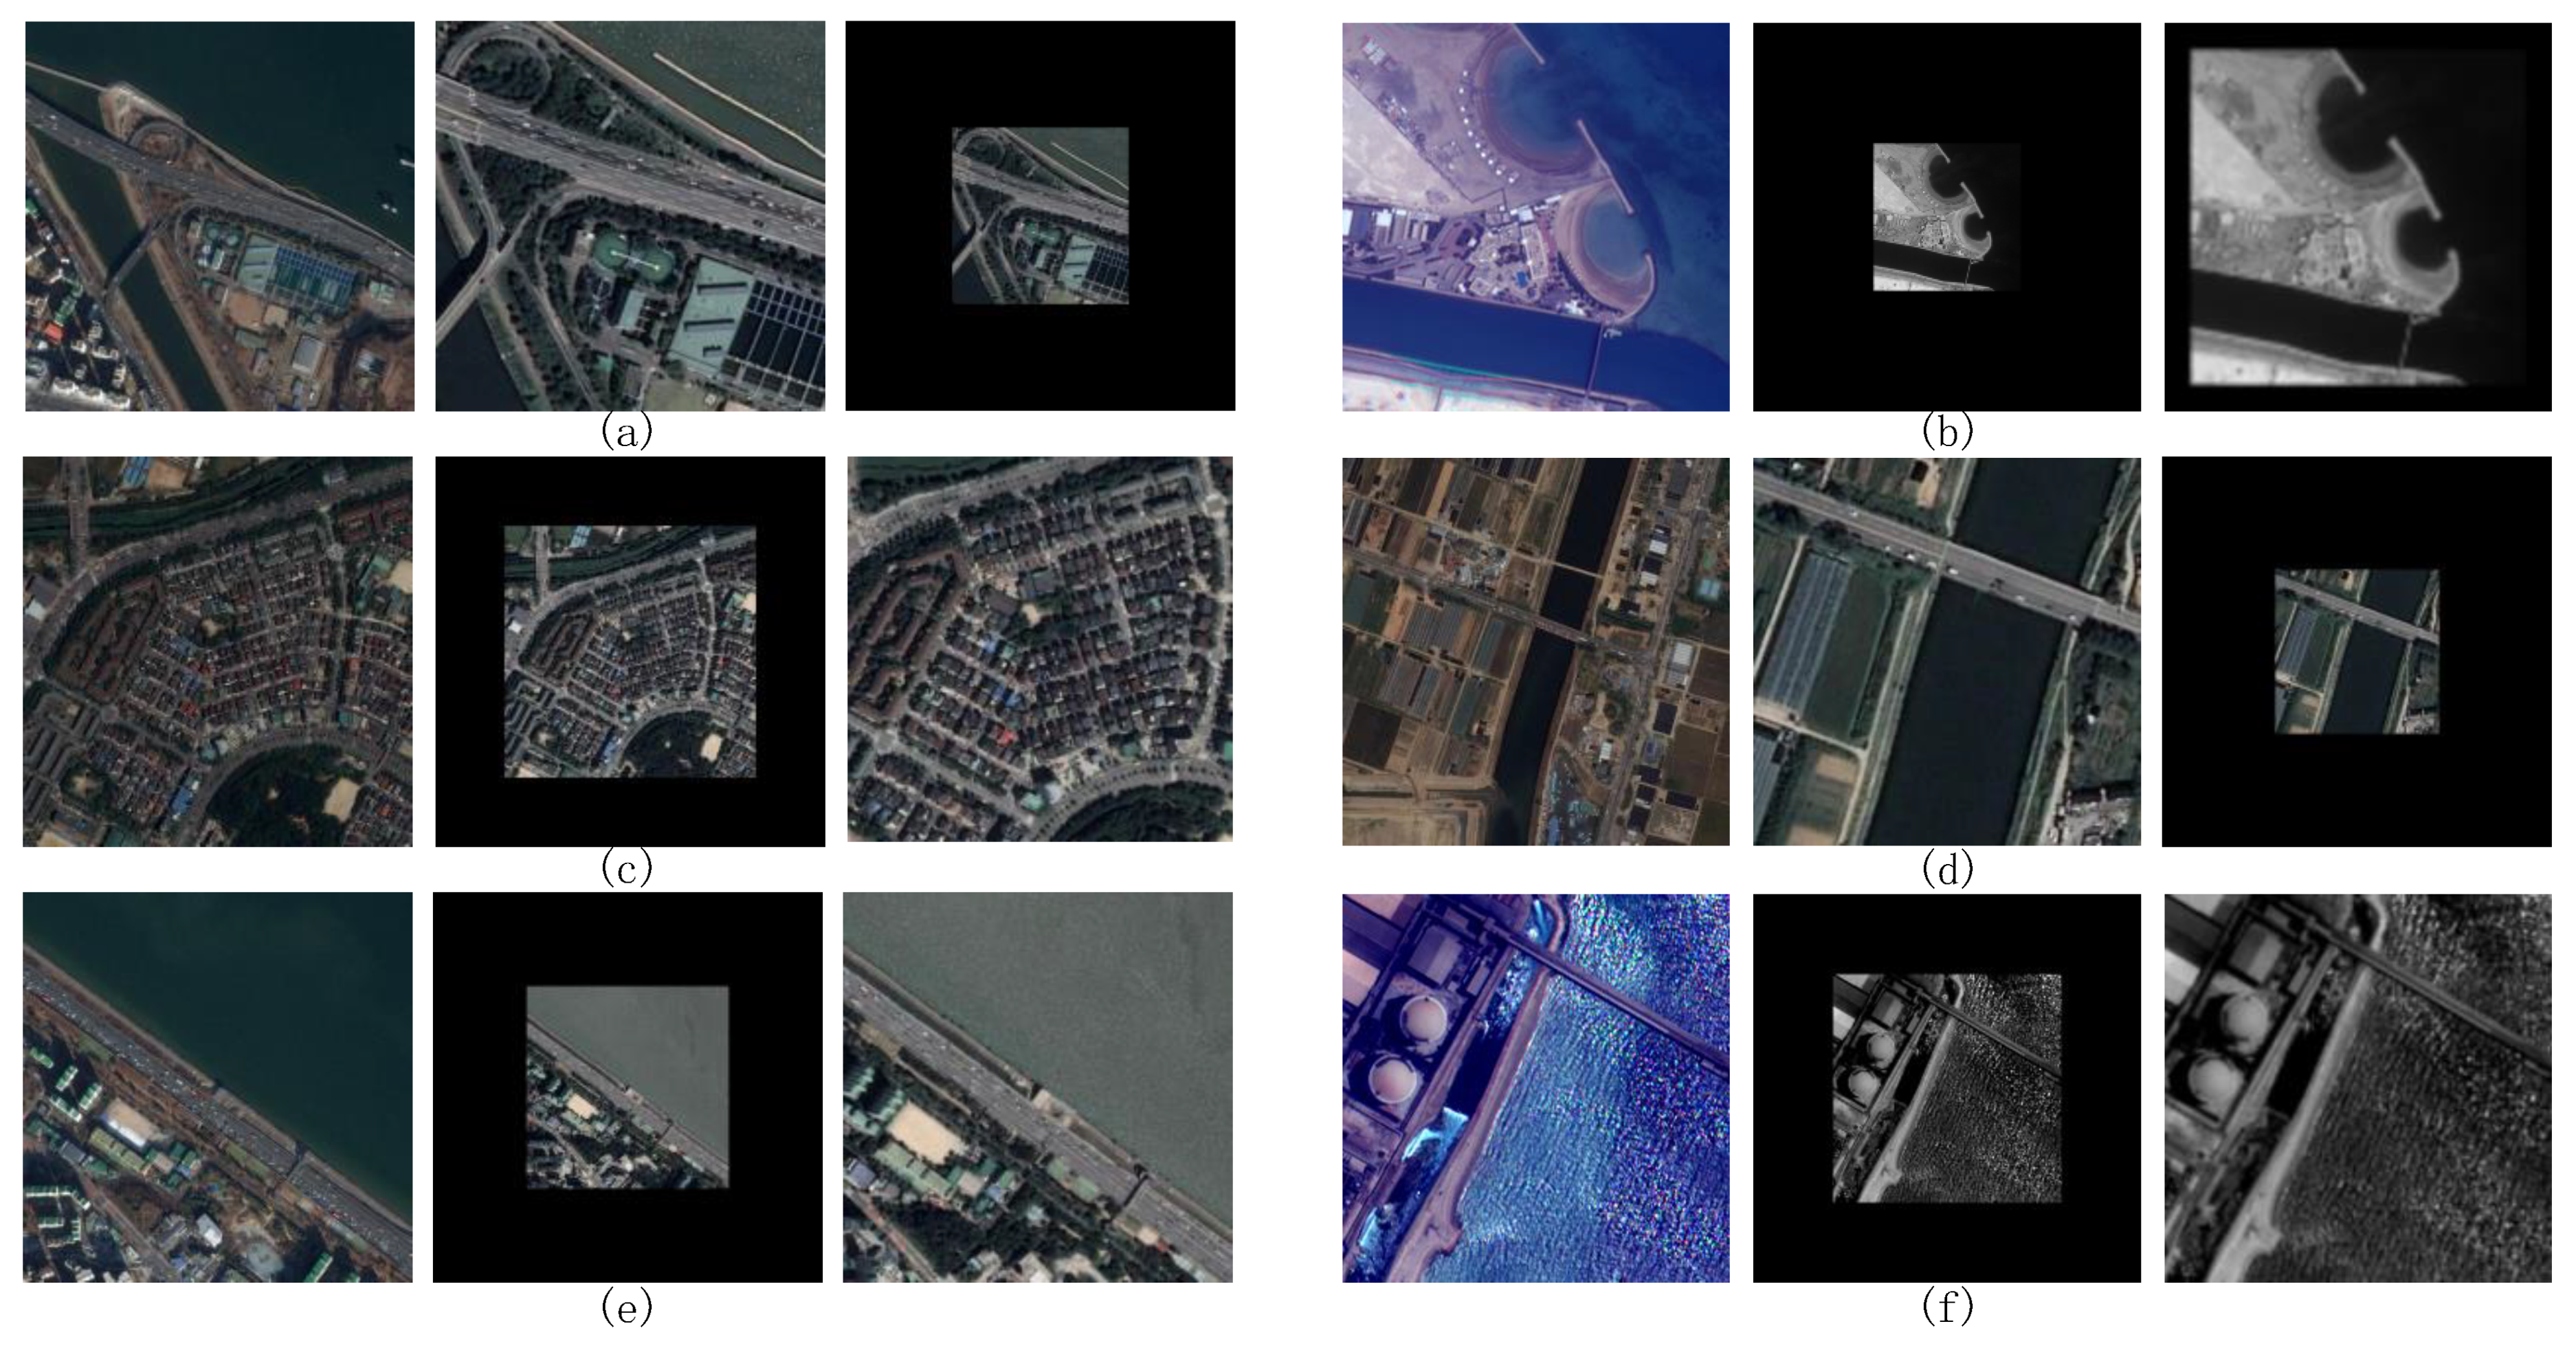
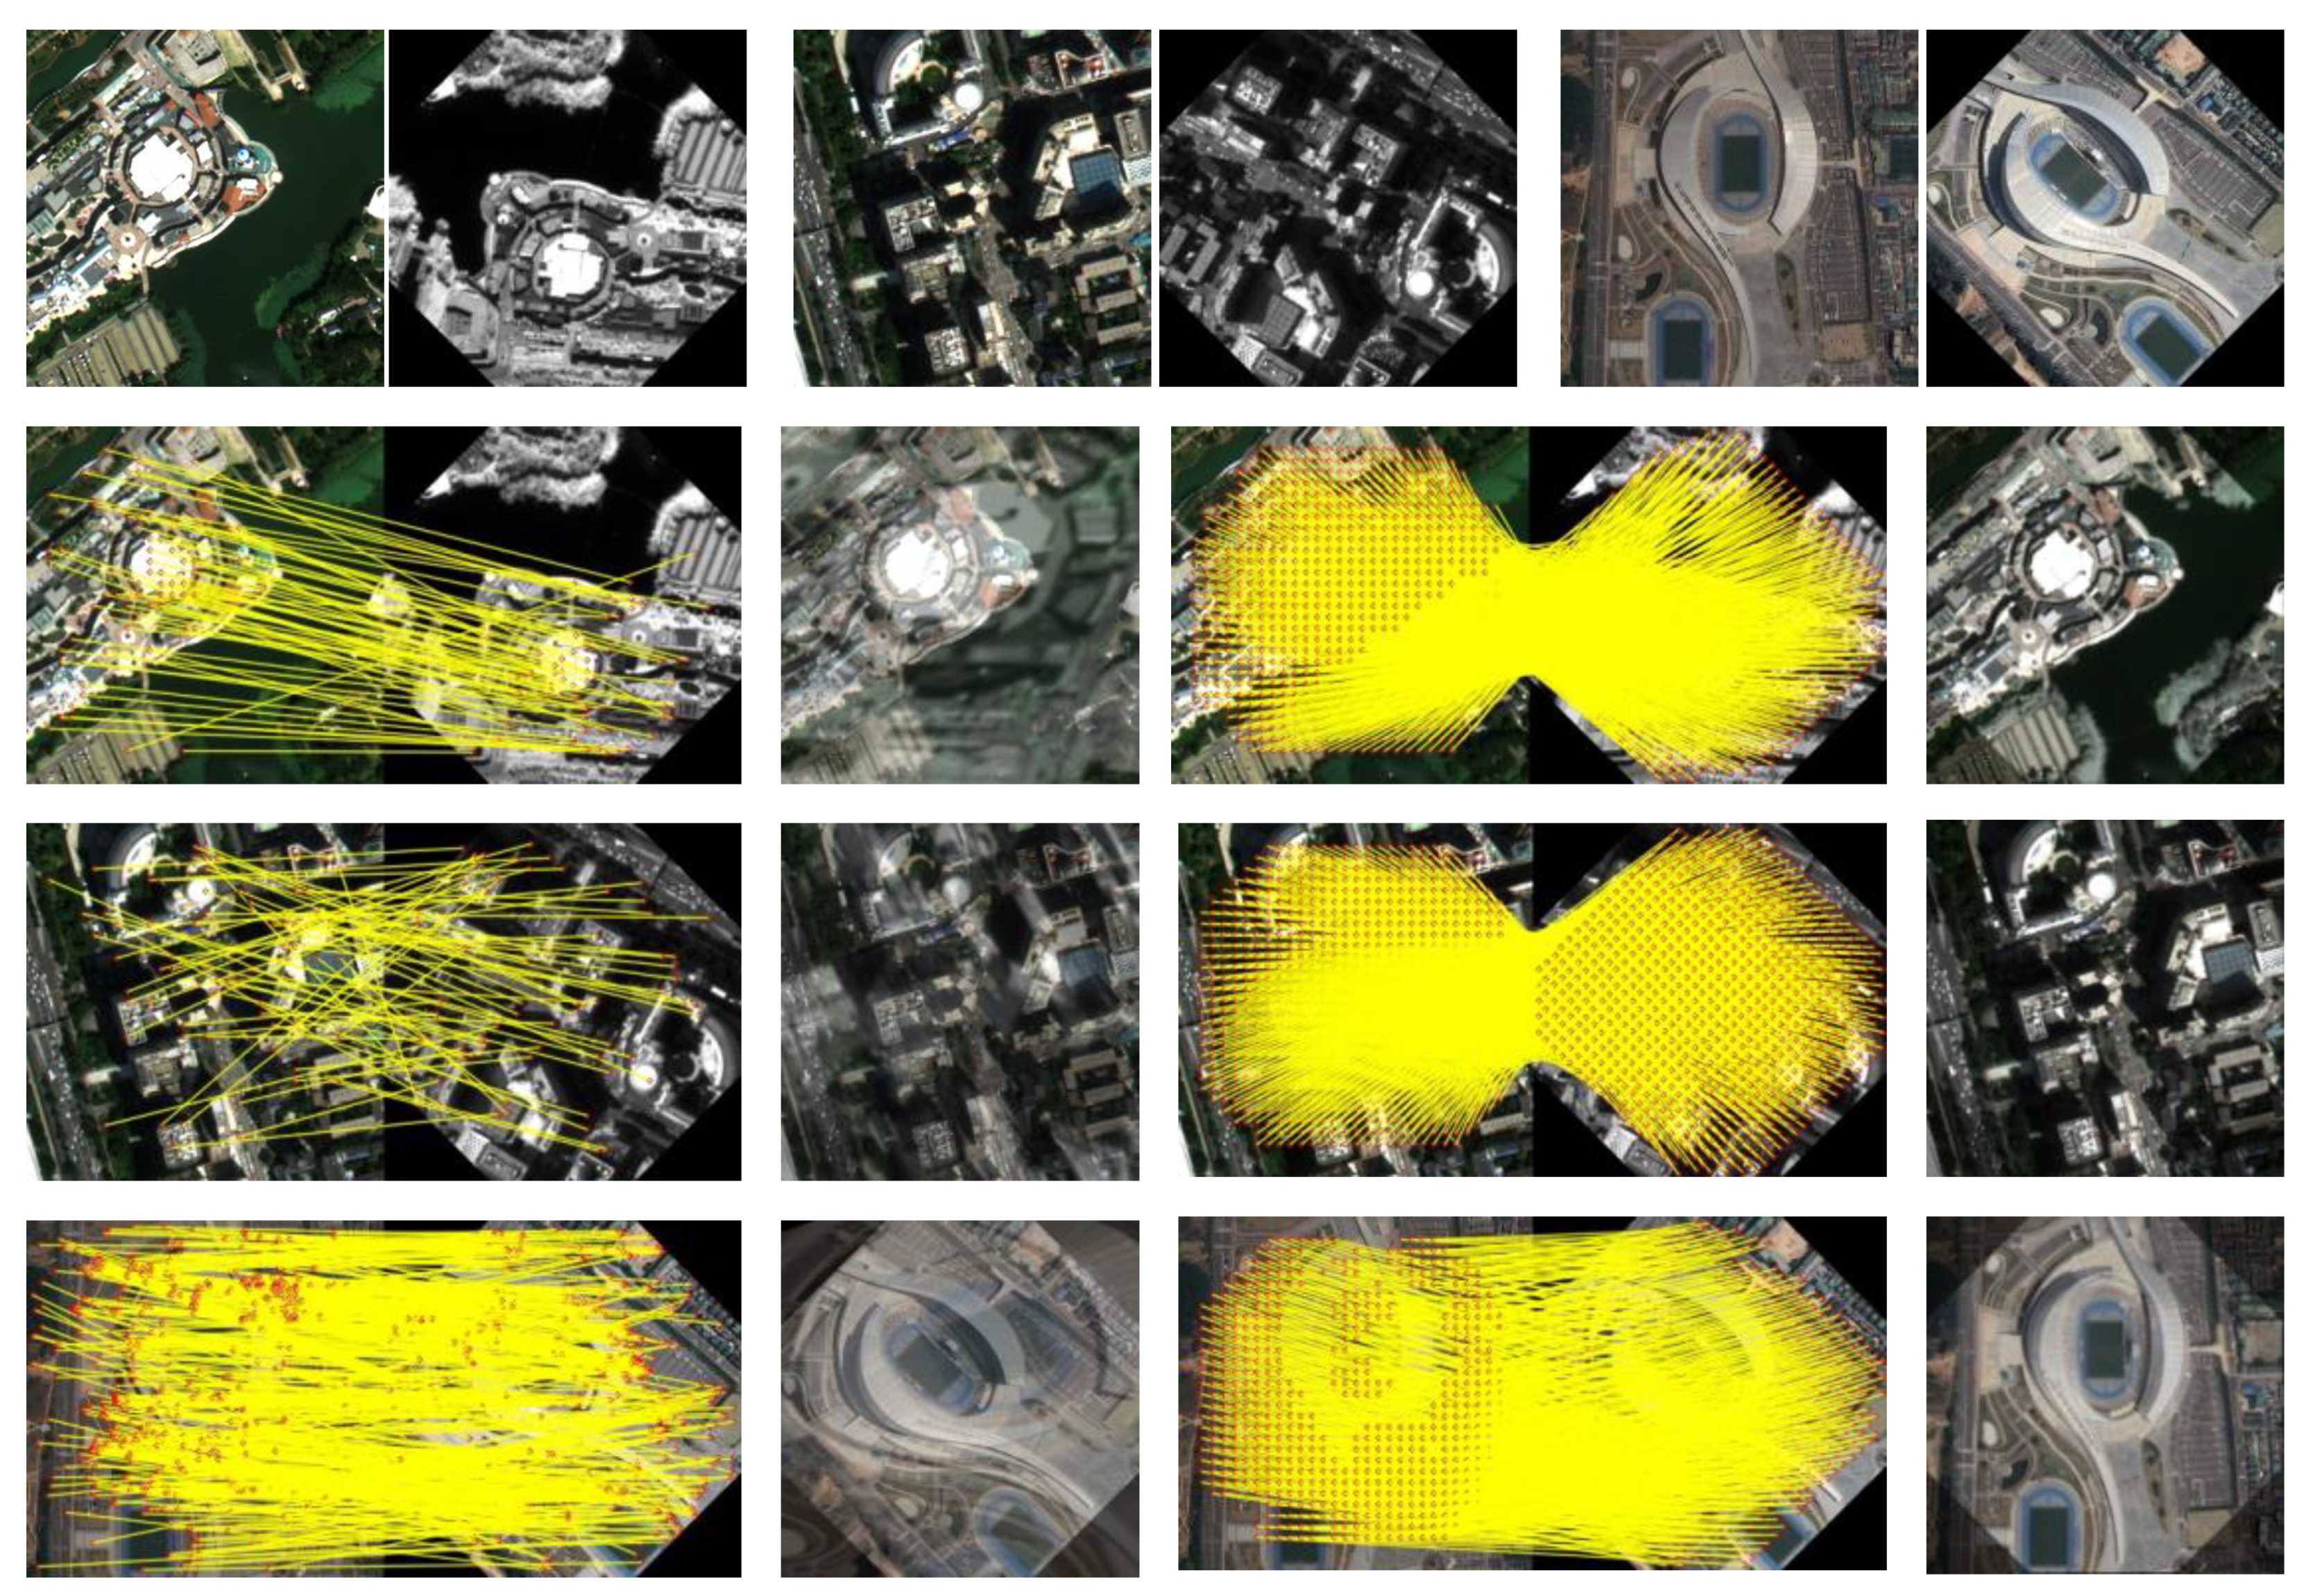
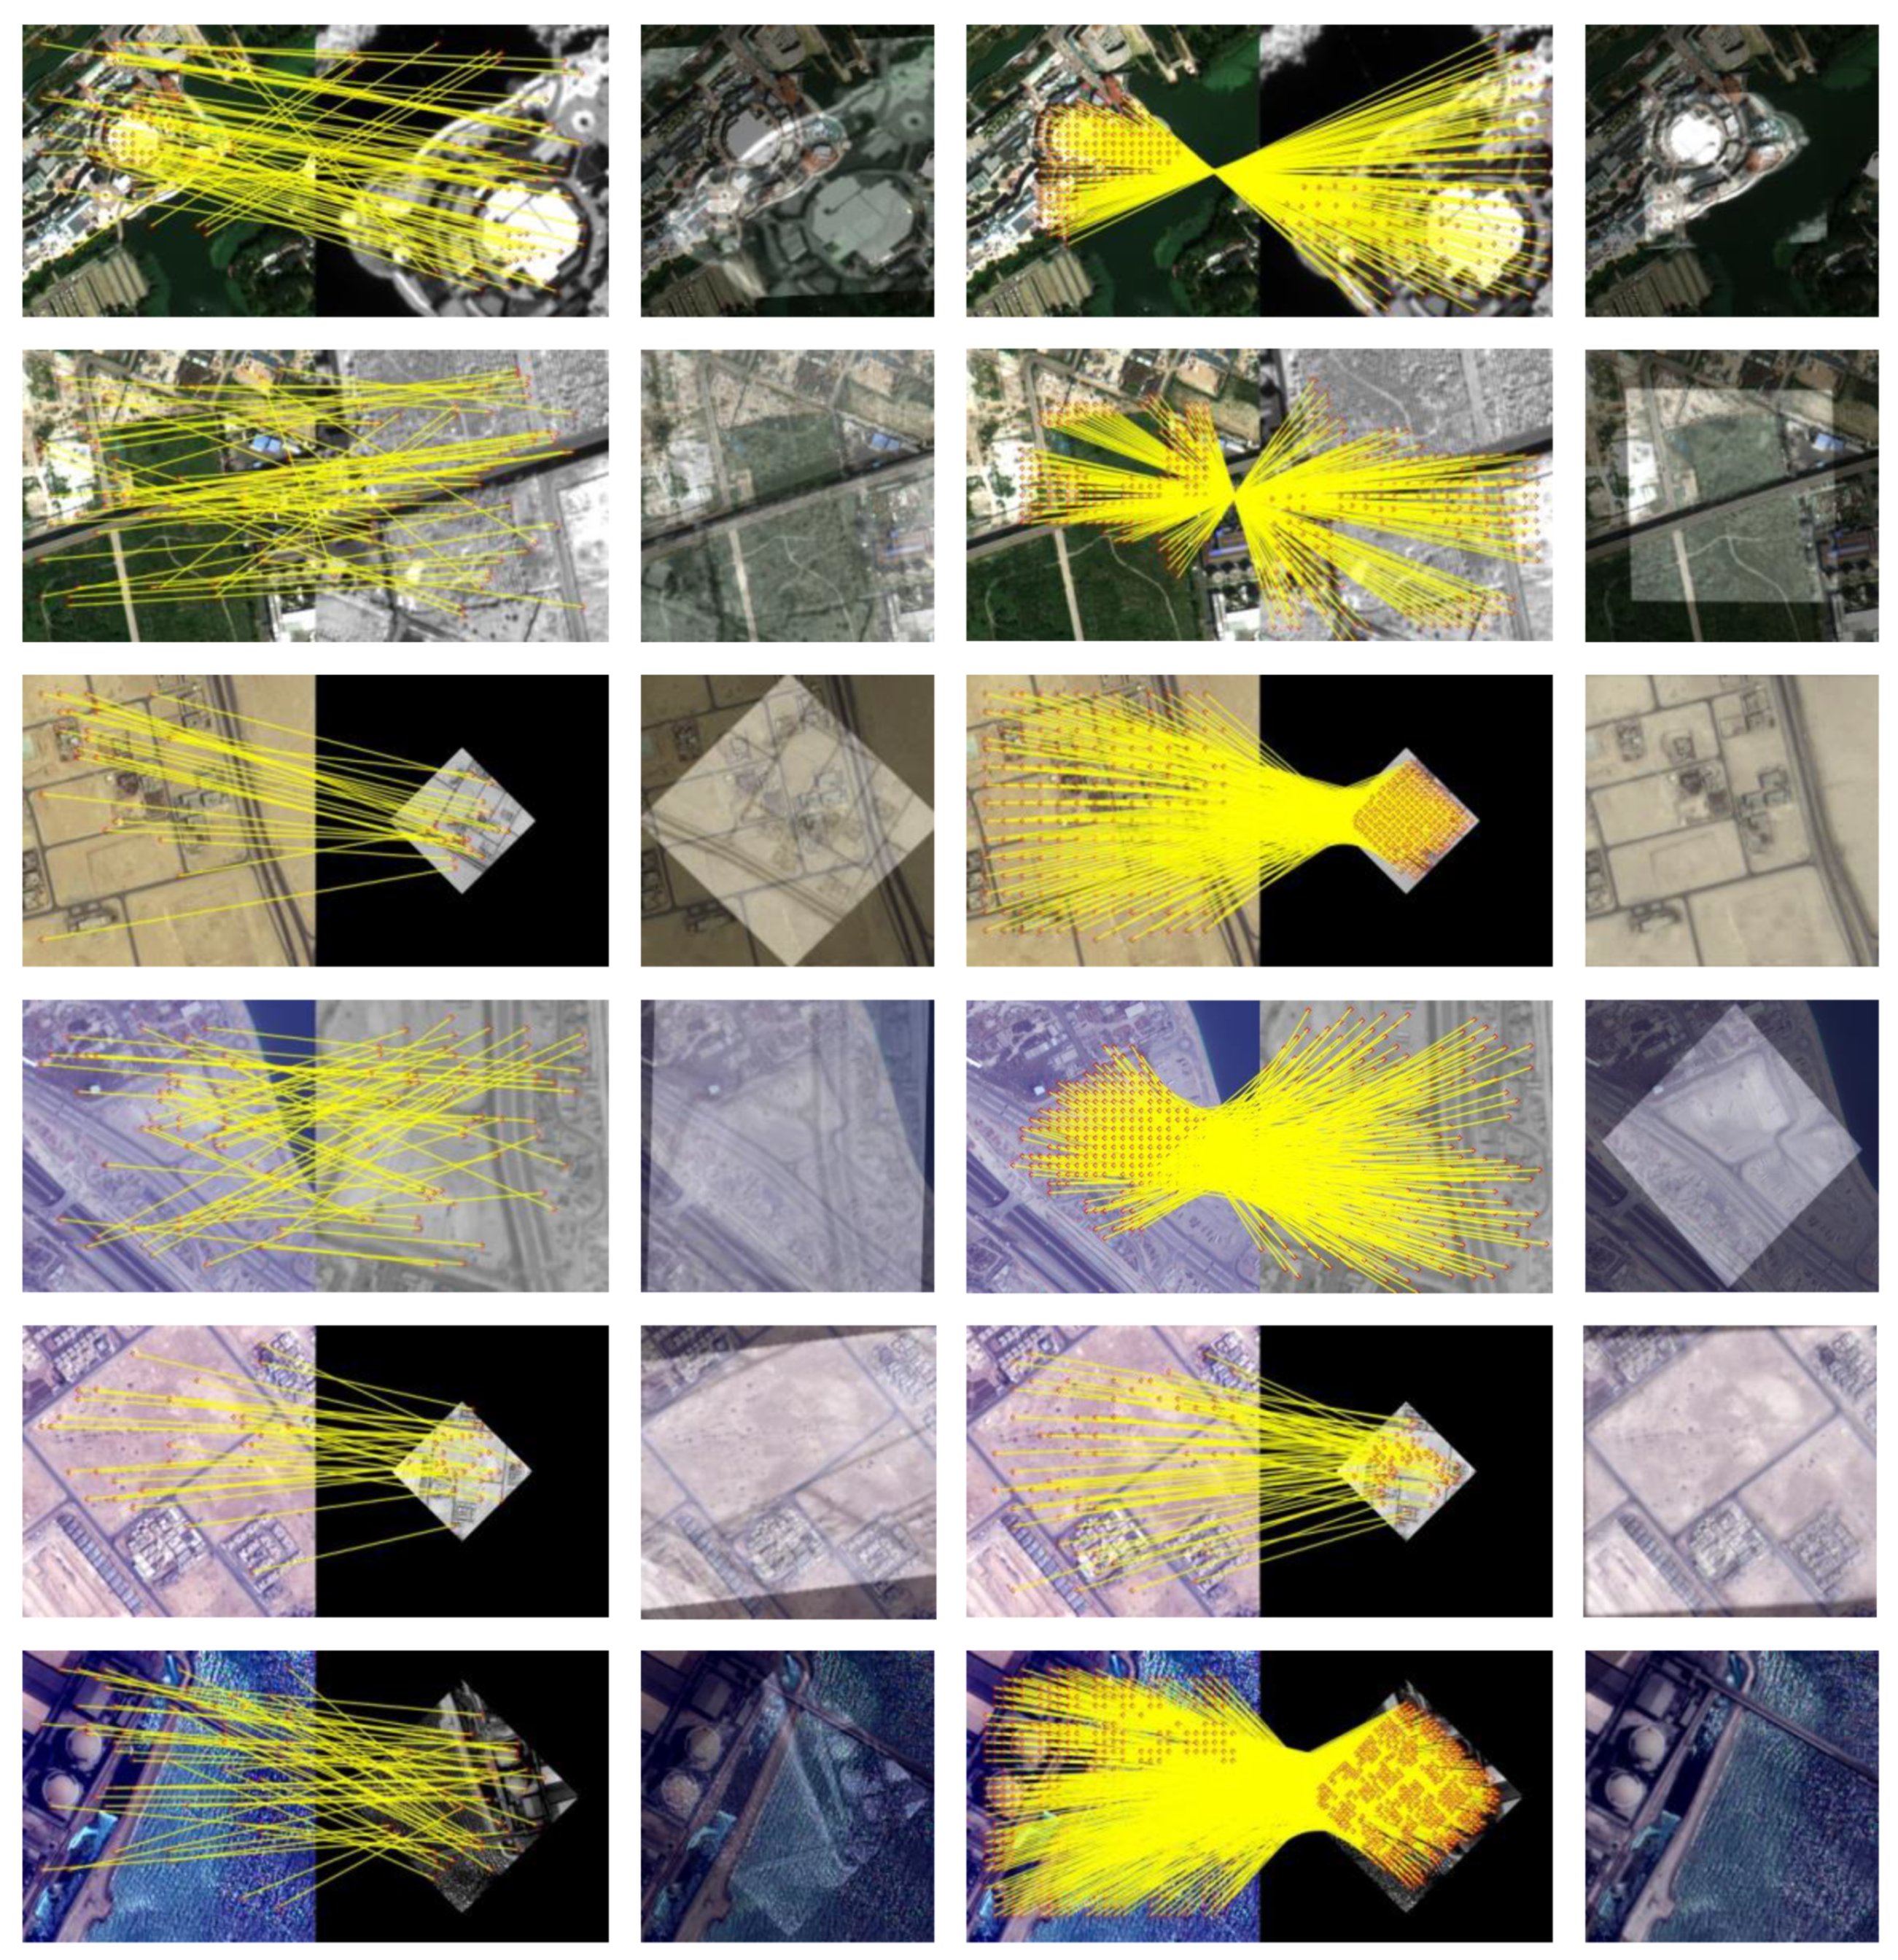
4.2. Geometric Deformation Resistance Experiments

To verify the robustness of geometric transformation of the proposed method, all of the four multimodal remote sensing datasets introduced in Section 4.1.1 are used in this section. Since scale and rotation changes are the most significant transformations between remote sensing images, the experiments in this section mainly focuses on the two geometric transformations.

4.2.1. Scale-Robustness Validation

In this part, 688 image pairs from the four test datasets with scale changes in the range of [ 2 m , 1 ) ( 1 , 2 m ] , m [ 0 , 3 ] are used for scale-robustness validation. Each image pair contains random scale changes; the average error ratio of the scale ratio is 19.66%. Both before and after scale recovery, we matched and registered them using LoFTR, the average NCM changed from 260 to 310, with an improvement of 19.23%, and the RMSE changed from 1.390 to 1.239, with a reduction of 10.86%. Figure 11 illustrates the recovered results of our method for scale changes. In each group, the left image is the reference image, the middle is the sensed image, and the right is the scale-recovered image. It can be seen that the scale recovery of our method works well for multimodal remote sensing images with different scales.
Sample-matching and registration results before and after scale recovery are given in Figure 12. Clearly, there are far more NCMs in the matching results after scale recovery than in the original results. Similarly, the accuracy of the registration results is higher than that of the original registration. In particular, the improvement in our method is more obvious in the first and third image pairs. As can be seen from the experimental results above, the scale changes can be recovered effectively by the proposed method.

4.2.2. Rotation Robustness Validation

In addition to scale changes, rotation changes often occur in multimodal remote sensing image registration. The main target of this section is verifying the rotation robustness of the proposed method. The test’s image pairs contain random rotation changes, and the average accuracy between the predicted categories and ground truth labels was 3.75%. Both with and without rotation recovery, the average NCM changed from 453 to 900, with an improvement of 49.67%, and the RMSE changed from 1.317 to 1.100, with a reduction of 15.84%. The recovered results of our method for image pairs with rotation changes are shown in Figure 13, which used eight groups of three images each. In each group, the left image is the reference image, the middle image is the sensed image, and the right image is the rotation-recovered image. The results show that our rotation-recovery method is effective for images under different rotation changes.
Figure 14 displays the sample results of matching and registration before and after rotation recovery. Obviously, the proposed method achieved more NCM and smaller RMSE of registration than the original LoFTR. According to the experimental results above, the rotation changes can be effectively recovered by the proposed method.

4.2.3. Scale and Rotation Robustness Validation

After testing the robustness of the proposed method separately for scale changes and rotation changes, we tested our method on the datasets containing 688 images with randomly scale and rotation changes. The geometric distortion between image pairs can be removed roughly through scale regression and rotation classification module of the proposed method.
We compared the matching and registration results before and after geometric distortion was removed: the average NCM changed from 235 to 371, with an improvement of 36.66%, and the RMSE changed from 1.490 to 1.249, with a reduction of 16.17%. The recovered results of our method for changes in scale and rotation are given in Figure 15, which has eight groups of three images each. In each group, from left to right are the reference image, the sensed image, and the recovered image. Apparently, our method is effective in recovering multimodal remote sensing images with different geometric distortions.
Samples of the input images are shown in Figure 16, and their matching and registration results are given in Figure 17. It is clear that there are far more NCMs using our method than LoFTR. Similarly, our method gained more accurate registration results than LoFTR. The experimental results above confirmed that the geometric distortions between the input image pairs can be recovered effectively by the proposed method.

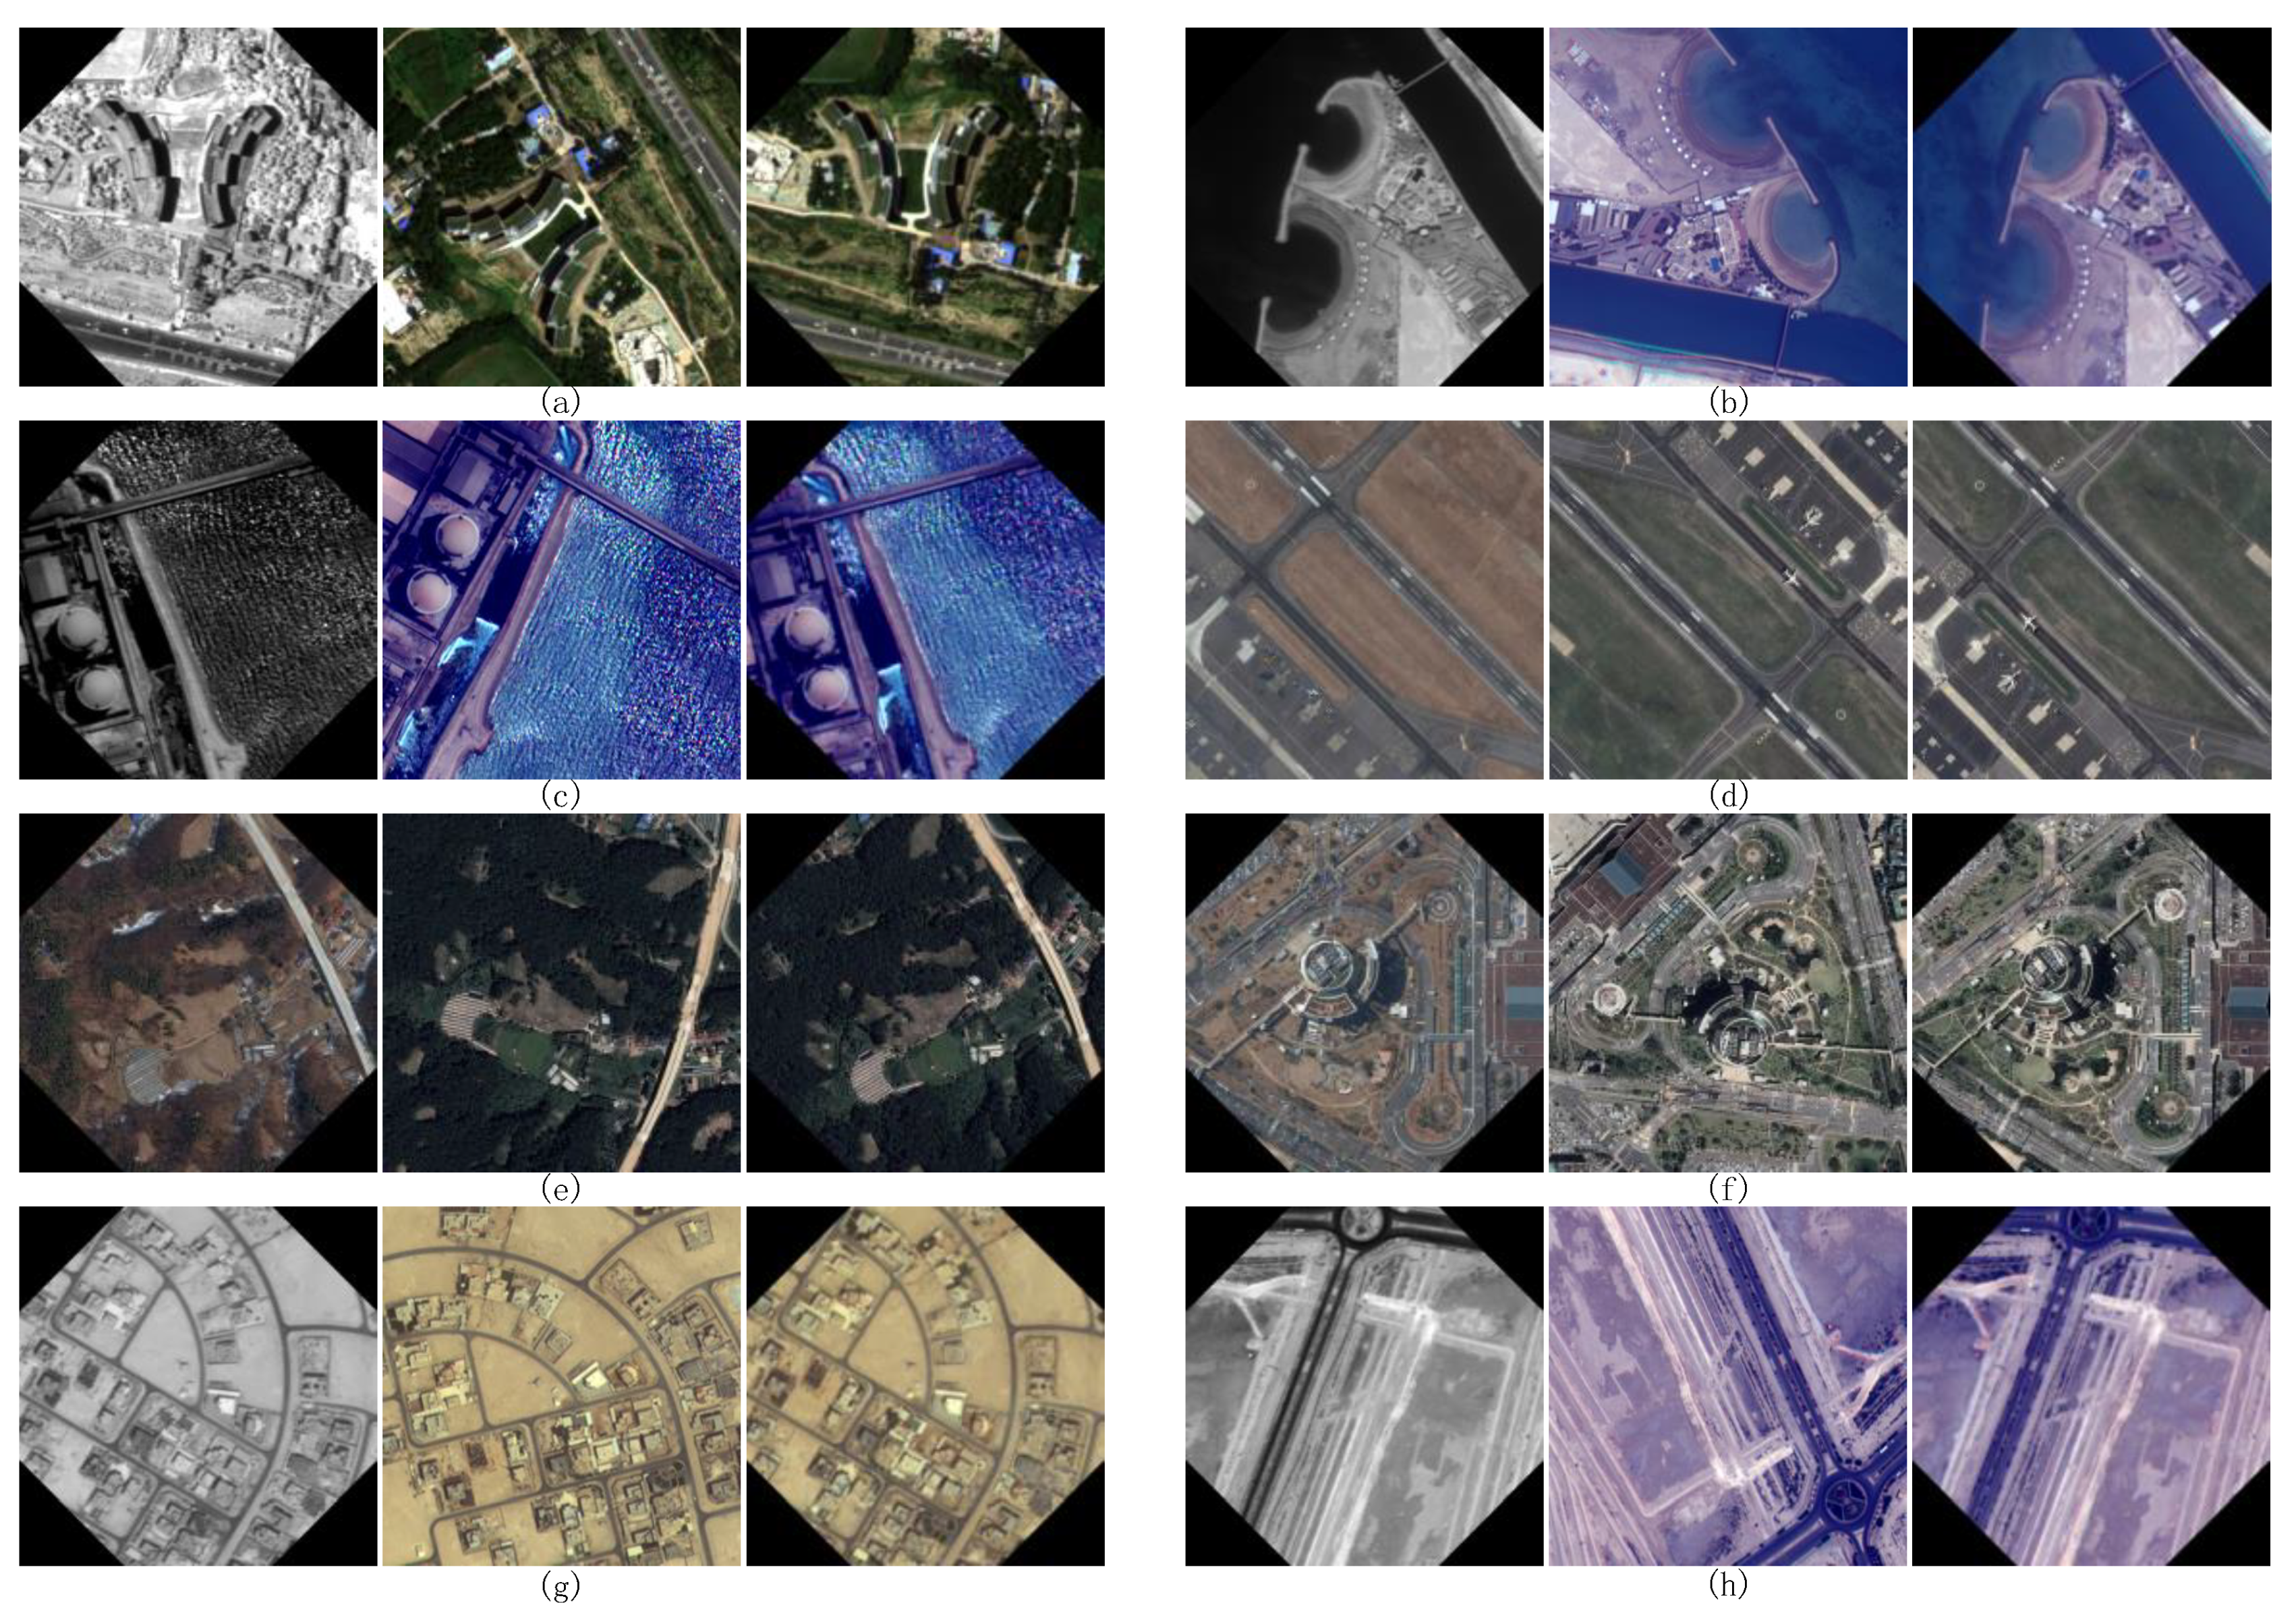
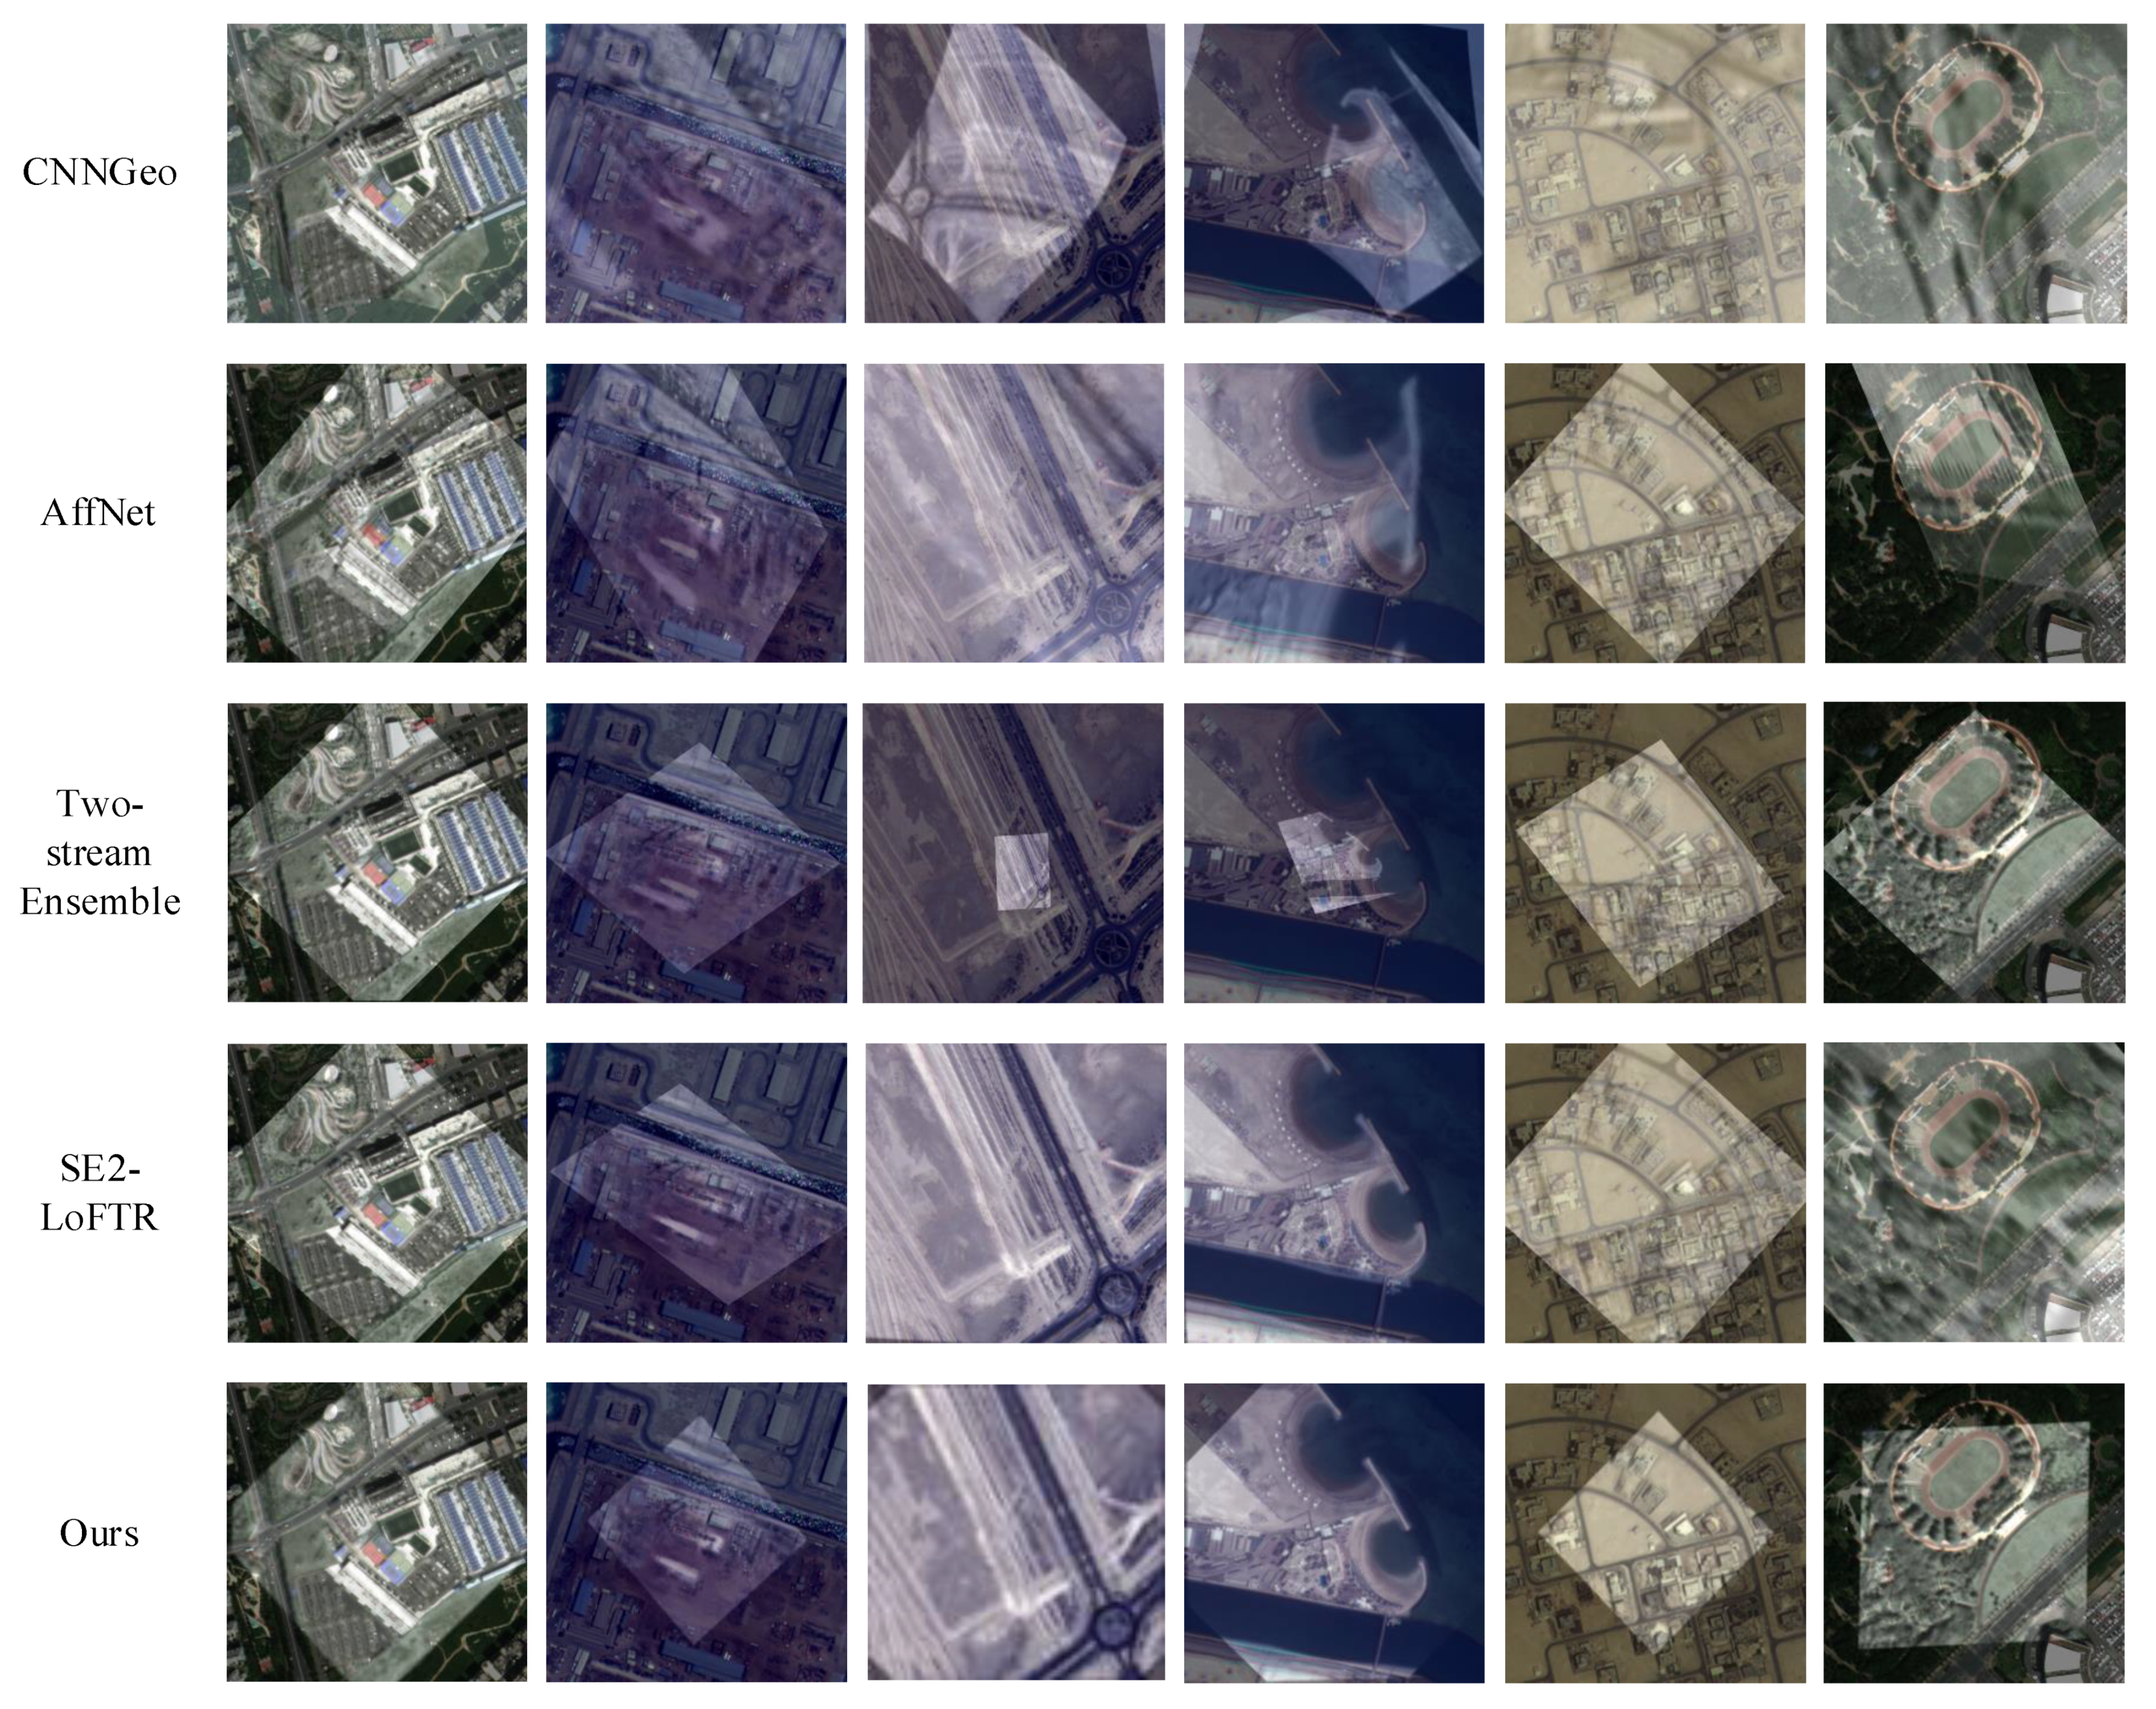
4.3. Comparative Experiments

4.3.1. Comparison Result with ScaleNet

To confirm the advantage of the proposed method over ScaleNet, the visualization matching and registration results of ScaleNet + LoFTR and the proposed method are compared in this section.
For evaluating the registration performance, six representative image pairs with different transformations were chosen from the HRMS test set and shown in Figure 18. The image pairs from left to right columns mainly contain scale changes, rotation changes and both. The matching and registration results are given in Figure 19, the first two rows with scale changes only, which demonstrate that both methods achieved good matching and registration results. The two middle rows were obtained under rotation conditions only. It is clear that the proposed method is significantly better than the ScaleNet, which does not take rotation into consideration. The last two rows are with both scale and rotation changes. In this case, our method still gives good matching and registration results, while the ScaleNet fails to do this. From the visual comparative experimental examples, obviously, the proposed method can cope with complex geometric distortions better than ScaleNet.

4.3.2. Comparison Result with SOTA methods

We comprehensively evaluated the performance of our method, which was compared with CNNGeo [21], AffNet [25], Two-stream Ensemble [26], and SE2-LoFTR [18] on 688 image pairs with scale and rotation changes. The four methods compared are all superior deep learning methods for image matching and registration, among which CNNGeo is the first method that creatively applies convolutional neural networks to predict image transformations. AffNet learns content-consistent affine invariant regions in image pairs by CNN and spatial transformation networks, and different matching methods can be combined to achieve better results. The two-stream ensemble method adds a dual consistency constraint, which considers the differences between the predicted parameters from the forward and backward directions, while SE2-LoFTR combines the rotation invariant CNN with the original LoFTR and obtains better matching results.
Samples of image pairs in comparative experiments are shown in Figure 20, which contain mainly scale and rotation changes. The registration results of the five methods are given in Figure 21. The rows from top to bottom show the registration results of CNNGeo, AffNet, two-stream ensemble, SE2-LoFTR, and our method, respectively. As can be seen from the first row of the figure above, CNNGeo often fails in the case of large geometric distortions, making it difficult to register the input images stably. This may be due to the fact that CNNGeo only considers a small range of affine or thin-plate spline transformations and is powerless for larger ones. AffNet and Two-stream together could successfully deal with some images with geometric distortion, but even if they are roughly matched, ghosting may appear in the results due to insufficient precision. SE2-LoFTR shows a good performance on image pairs with rotation changes; however, its performance is significantly degraded in the case of both scale and rotation changes. Compared to the above methods, our method has an excellent performance in cases of geometric distortion.
Meanwhile, a quantitative analysis of the entire dataset was performed for the five methods. The validity of the registration is very important for practical applications and, therefore, the number of effective matching image pairs are given in Table 2. CNNGeo has the fewest matching pairs, and Two-Stream Ensemble and AffNet are moderate. The effective matching rates on the test set for SE2-LoFTR and our method were 67.15% and 74.56%, respectively, from which it can be concluded that the proposed method is the most adaptive to geometric distortions.
Table 3 shows the average NCMs of each comparison method on the four datasets. The average NCMs of our method on the four datasets are 161, 240, 252 and 73, respectively. They are approximately twice as high as those of SE2-LoFTR and four times as high as those of AffNet and Two-Stream together. The RMSE of the comparison methods on the four datasets is shown in Table 4. The corresponding average RMSE of the proposed method are 1.315, 1.086, 1.038 and 1.505, respectively. As can be seen, our method achieved the lowest RMSE on HRMS and VIS-NIR datasets. The average RMSE over the total four datasets using our method was less than that of CNNGeo, Two-Stream Ensemble and SE2-LoFTR. Compared to AffNet, the average RMSE of our method was slightly higher, but the average NCM was much higher. The average RMSE over all test datasets using our method was less than 1.25 pixels, which could meet the need for the matching and registration of multimodal remote sensing images.
SRTPN consists of four important modules: scale regression, rotation classification, fine level matching and outlier removal. Each of these modules has an impact on the registration result. Scale regression and rotation classification are the key steps of geometric recovery and the innovation of the proposed model. When there are only scale changes between images, the scale regression module plays a key role, and when there are only rotation changes, rotation classification plays a main role. If both types of changes exist, the two modules work together, so the degree of influence of the modules on the results depends on the type of geometric changes present between the images. The calculation of our method mainly consists of three parts: scale regression module, rotation classification module and fine-level image matching. We obtained the number of parameters (Param.) and the floating-point operations (FLOPs) of the SRTPN’s inference. For the two input images of 640 × 640 size, the parametric result of the scale regression module is 12.96 M and the FLOPS is 133.48 G, while the parametric result of the rotation classification module is 29.16 M and the FLOPS is 16.31 G. In addition, at the fine-level image-matching stage, Loftr was adopted, so the computational complexity of this step was the same as that of Loftr (Param. 11.56 M, FLOPs 354.42 G). The run time of the scale regression and rotation classification module for the two input images was less than 100 ms, and the run time of the entire registration process was less than 300 ms.

5. Conclusions

In this paper, a scale and rotation transformation-prediction network was developed for multimodal image registration with large geometric deformations. First, the scale ratio was estimated by a scale regression module and the rotation angle was predicted by a rotation classification module. Then, the fine-level image matching was performed on the rough-geometric-distortion recovered image pairs. Finally, the registration results were obtained via the transform estimated by matching results. The verification and comparative experimental results demonstrate that the proposed method achieved the best performance compared to the SOTA method, which confirms the effectiveness of our method.

Author Contributions

Conceptualization, X.L. and X.X.; methodology, X.L.; software, X.X.; validation, X.Z.; formal analysis, L.W.; writing—original draft preparation, X.X.; writing—review and editing, L.C. and R.L.; supervision, X.L.; funding acquisition, Q.M. All authors have read and agreed to the published version of the manuscript.

Funding

This research was funded by the Academy of Integrated Circuit Innovation of Xidian University in ChongQing Foundation (CQIRI-CXYHT-2021-06), Guangxi Key Laboratory of Trusted Software (No. KX202061), the Fundamental Research Funds for the Central Universities (No. 20199236855).

Data Availability Statement

Acknowledgments

We sincerely thank the authors of ScaleNet, LoFTR, CNNGeo, Two-Stream Ensemble, AffNet and SE2-LoFTR for providing their algorithm codes to facilitate the comparative experiments. We also thank the authors of COMIR and [22] for providing VIS-NIR and GoogleEarth datasets for the training and testing phases.

Conflicts of Interest

The authors declare no conflict of interest.

References

  1. Zitová, B.; Flusser, J. Image Registration Methods: A Survey. Image Vis. Comput. 2003, 21, 977–1000. [Google Scholar] [CrossRef] [Green Version]
  2. Jiang, X.; Ma, J.; Xiao, G.; Shao, Z.; Guo, X. A Review of Multimodal Image Matching: Methods and Applications. Inf. Fusion 2021, 73, 22–71. [Google Scholar] [CrossRef]
  3. Zhao, Z.; Bai, H.; Zhang, J.; Zhang, Y.; Xu, S.; Lin, Z.; Timofte, R.; Gool, L.V. CDDFuse: Correlation-Driven Dual-Branch Feature Decomposition for Multi-Modality Image Fusion. In Proceedings of the 2023 IEEE/CVF Conference on Computer Vision and Pattern Recognition (CVPR), Vancouver, BC, Canada, 18–22 June 2023; pp. 5906–5916. [Google Scholar]
  4. Bai, X.; Hu, Z.; Zhu, X.; Huang, Q.; Chen, Y.; Fu, H.; Tai, C.-L. TransFusion: Robust LiDAR-Camera Fusion for 3D Object Detection with Transformers. In Proceedings of the 2022 IEEE/CVF Conference on Computer Vision and Pattern Recognition (CVPR), New Orleans, LA, USA, 18–24 June 2022; pp. 1090–1099. [Google Scholar]
  5. Gedara Chaminda Bandara, W.; Gopalakrishnan Nair, N.; Patel, V.M. DDPM-CD: Remote Sensing Change Detection Using Denoising Diffusion Probabilistic Models. arXiv 2022, arXiv:2206.11892. [Google Scholar]
  6. Lin, M.; Yang, G.; Zhang, H. Transition Is a Process: Pair-to-Video Change Detection Networks for Very High Resolution Remote Sensing Images. IEEE Trans. Image Process. 2023, 32, 57–71. [Google Scholar] [CrossRef] [PubMed]
  7. Jiao, Y.; Jie, Z.; Chen, S.; Chen, J.; Ma, L.; Jiang, Y.-G. MSMDFusion: Fusing LiDAR and Camera at Multiple Scales with Multi-Depth Seeds for 3D Object Detection. In Proceedings of the 2023 IEEE/CVF Conference on Computer Vision and Pattern Recognition (CVPR), Vancouver, BC, Canada, 18–22 June 2023; pp. 21643–21652. [Google Scholar]
  8. Gupta, A.; Narayan, S.; Joseph, K.J.; Khan, S.; Khan, F.S.; Shah, M. OW-DETR: Open-World Detection Transformer. In Proceedings of the 2022 IEEE/CVF Conference on Computer Vision and Pattern Recognition (CVPR), New Orleans, LA, USA, 18–24 June 2022; pp. 9225–9234. [Google Scholar]
  9. Wang, C.-Y.; Bochkovskiy, A.; Liao, H.-Y.M. YOLOv7: Trainable Bag-of-Freebies Sets New State-of-the-Art for Real-Time Object Detectors. arXiv 2022, arXiv:2207.02696. [Google Scholar]
  10. Liu, X.; Xue, J.; Xu, X.; Lu, Z.; Liu, R.; Zhao, B.; Li, Y.; Miao, Q. Robust Multimodal Remote Sensing Image Registration Based on Local Statistical Frequency Information. Remote Sens. 2022, 14, 1051. [Google Scholar] [CrossRef]
  11. Lowe, D.G. Distinctive Image Features from Scale-Invariant Keypoints. Int. J. Comput. Vis. 2004, 60, 91–110. [Google Scholar] [CrossRef]
  12. Barroso-Laguna, A.; Mikolajczyk, K. Key. Net: Keypoint Detection by Handcrafted and Learned Cnn Filters Revisited. IEEE Trans. Pattern Anal. Mach. Intell. 2022, 45, 698–711. [Google Scholar] [CrossRef] [PubMed]
  13. Rocco, I.; Arandjelović, R.; Sivic, J. Efficient Neighbourhood Consensus Networks via Submanifold Sparse Convolutions. In Proceedings of the Computer Vision—ECCV 2020: 16th European Conference, Glasgow, UK, 23–28 August 2020; Proceedings, Part IX 16. Springer: Berlin/Heidelberg, Germany, 2020; pp. 605–621. [Google Scholar]
  14. Rocco, I.; Cimpoi, M.; Arandjelović, R.; Torii, A.; Pajdla, T.; Sivic, J. Neighbourhood Consensus Networks. Adv. Neural Inf. Process. Syst. 2018, 31. [Google Scholar]
  15. Li, X.; Han, K.; Li, S.; Prisacariu, V. Dual-Resolution Correspondence Networks. Adv. Neural Inf. Process. Syst. 2020, 33, 17346–17357. [Google Scholar]
  16. Sun, J.; Shen, Z.; Wang, Y.; Bao, H.; Zhou, X. LoFTR: Detector-Free Local Feature Matching with Transformers. In Proceedings of the 2021 IEEE/CVF Conference on Computer Vision and Pattern Recognition (CVPR), Online, 19–25 June 2021; pp. 8922–8931. [Google Scholar]
  17. Sarlin, P.-E.; DeTone, D.; Malisiewicz, T.; Rabinovich, A. SuperGlue: Learning Feature Matching with Graph Neural Networks. In Proceedings of the 2020 IEEE Conference on Computer Vision and Pattern Recognition (CVPR), Seattle, WA, USA, 13–19 June 2020; pp. 4938–4947. [Google Scholar]
  18. Bokman, G.; Kahl, F. A Case for Using Rotation Invariant Features in State of the Art Feature Matchers. In Proceedings of the 2022 IEEE/CVF Conference on Computer Vision and Pattern Recognition Workshops (CVPRW), New Orleans, LA, USA, 18–24 June 2022; pp. 5106–5115. [Google Scholar]
  19. Fu, Y.; Wu, Y. Scale-Net: Learning to Reduce Scale Differences for Large-Scale Invariant Image Matching. IEEE Trans. Circuits Syst. Video Technol. 2022, 33, 1335–1348. [Google Scholar] [CrossRef]
  20. He, K.; Zhang, X.; Ren, S.; Sun, J. Deep Residual Learning for Image Recognition. In Proceedings of the 2016 IEEE Conference on Computer Vision and Pattern Recognition (CVPR), Las Vegas, NV, USA, 27–30 June 2016; pp. 770–778. [Google Scholar]
  21. Rocco, I.; Arandjelovic, R.; Sivic, J. Convolutional Neural Network Architecture for Geometric Matching. In Proceedings of the 2017 IEEE Conference on Computer Vision and Pattern Recognition (CVPR), Honolulu, HI, USA, 21–26 July 2017; pp. 6148–6157. [Google Scholar]
  22. Kim, D.-G.; Nam, W.-J.; Lee, S.-W. A Robust Matching Network for Gradually Estimating Geometric Transformation on Remote Sensing Imagery. In Proceedings of the 2019 IEEE International Conference on Systems, Man and Cybernetics (SMC), Bari, Italy, 6–9 October 2019; pp. 3889–3894. [Google Scholar]
  23. Fang, Y.; Hu, J.; Du, C.; Liu, Z.; Zhang, L. SAR-Optical Image Matching by Integrating Siamese U-Net With FFT Correlation. IEEE Geosci. Remote Sens. Lett. 2022, 19, 1–5. [Google Scholar] [CrossRef]
  24. Barath, D.; Noskova, J.; Ivashechkin, M.; Matas, J. MAGSAC++, a Fast, Reliable and Accurate Robust Estimator. In Proceedings of the 2020 IEEE/CVF Conference on Computer Vision and Pattern Recognition (CVPR), Seattle, WA, USA, 13–19 June 2020; pp. 1301–1309. [Google Scholar]
  25. Mishkin, D.; Radenović, F.; Matas, J. Repeatability Is Not Enough: Learning Affine Regions via Discriminability. In Computer Vision—ECCV 2018; Ferrari, V., Hebert, M., Sminchisescu, C., Weiss, Y., Eds.; Lecture Notes in Computer Science; Springer International Publishing: Cham, Switzerland, 2018; Volume 11213, pp. 287–304. ISBN 978-3-030-01239-7. [Google Scholar]
  26. Park, J.-H.; Nam, W.-J.; Lee, S.-W. A Two-Stream Symmetric Network with Bidirectional Ensemble for Aerial Image Matching. Remote Sens. 2020, 12, 465. [Google Scholar] [CrossRef] [Green Version]
  27. Pielawski, N.; Wetzer, E.; Öfverstedt, J.; Lu, J.; Wählby, C.; Lindblad, J.; Sladoje, N. CoMIR: Contrastive Multimodal Image Representation for Registration. In Proceedings of the Advances in Neural Information Processing Systems, Virtual, 6–12 December 2020; Curran Associates, Inc.: Nice, France, 2020; Volume 33, pp. 18433–18444. [Google Scholar]
Figure 1. Matching and registration results of LoFTR and the proposed method.
Remotesensing 15 03469 g001
Figure 2. Overall flowchart of the proposed method.
Remotesensing 15 03469 g002
Figure 3. Overall architecture of scale estimation network.
Remotesensing 15 03469 g003
Figure 4. Multi-scale feature extraction and selection module.
Remotesensing 15 03469 g004
Figure 5. Flowchart of CVARM Module.
Remotesensing 15 03469 g005
Figure 6. Scale-ratio regressor module.
Remotesensing 15 03469 g006
Figure 7. Rotation transform classification prediction module.
Remotesensing 15 03469 g007
Figure 8. Overall flowchart of fine-level image matching and registration.
Remotesensing 15 03469 g008
Figure 9. Example multimodal remote sensing image dataset with Google Earth, HRMS, VIS-NIR and UAV datasets for each row from top to bottom of image, respectively.
Remotesensing 15 03469 g009
Figure 10. Examples of training image pairs in scale regression module.
Remotesensing 15 03469 g010
Figure 11. Examples of input images and corresponding intermediate results obtained by scale regression module. (af) are six groups of images, from left to right in each group, the images are the reference image, the sensed image, and the scale-recovered image, respectively.
Remotesensing 15 03469 g011
Figure 12. Comparative matching results and registration outcomes of our method. Images of the first row are input images with scale changes. Images of the following rows are the matching and registration results before (the two left columns) and after scale recovery (the two right columns).
Remotesensing 15 03469 g012
Figure 13. Examples of input images and corresponding intermediate results obtained by rotate classification module. (ah) are eight groups of images, from left to right in each group, the images are the reference image, the sensed image, and the rotation-recovered image, respectively.
Remotesensing 15 03469 g013
Figure 14. Comparative matching results and registration outcomes of our method. Images of the first row are input images with rotation changes. Images of the following rows are the matching and registration results before (the two left columns) and after scale recovery (the two right columns).
Remotesensing 15 03469 g014
Figure 15. Examples of input images and corresponding intermediate results obtained by scale regression module and rotation classification module. (ah) are eight groups of images, from left to right in each group, the images are the reference image, the sensed image, and the geometric-recovered image, respectively.
Remotesensing 15 03469 g015
Figure 16. Samples of input image pairs with scale and rotation changes.
Remotesensing 15 03469 g016
Figure 17. Comparative matching results and registration outcomes of our method. The rows from top to bottom are the matching and registration results of the original LoFTR (the two left columns), and ours (the two right columns).
Remotesensing 15 03469 g017
Figure 18. Examples of image pairs with scale changes for comparative experiments of ScaleNet and the proposed method.
Remotesensing 15 03469 g018
Figure 19. Examples of visual comparison results between ScaleNet and the proposed method.
Remotesensing 15 03469 g019
Figure 20. Examples of image pairs with scale and changes for comparative experiments of five related methods.
Remotesensing 15 03469 g020
Figure 21. Comparison of registration performance on six image pairs.
Remotesensing 15 03469 g021
Table 1. Training hyperparameters for scale regression network and rotation classification network.
NetworkLearning RateBatch SizeEpochs
Scale Regression Network3 × 10−4228
Rotation Classification Network4 × 10−4810
Table 2. Number of effective matching image pairs. (effective/total).
DatasetsCNNGeoAffNetTwo-Stream EnsembleSE2-LoFTROURS
Google Earth4/14285/14274/142105/142115/142
HRMS11/14095/14035/14078/14088/140
VIS-NIR20/319199/31996/319238/319255/319
UAV4/8730/8745/8741/8755/87
Table 3. Average NCM of the comparison methods on the four datasets.
DatasetsCNNGeoAffNetTwo-Stream EnsembleSE2-LoFTROURS
Google Earth7356760161
HRMS617958107240
VIS-NIR224961122262
UAV2822455173
Table 4. RMSE of the comparison methods on the four datasets.
DatasetsCNNGeoAffNetTwo-Stream EnsembleSE2-LoFTROURS
Google Earth1.6491.2581.6181.4911.315
HRMS1.6491.0931.5611.3901.086
VIS-NIR1.5841.0261.5721.3721.038
UAV1.5511.4511.5681.5141.505
AVG_RMSE1.6081.2071.5801.4391.236
Disclaimer/Publisher’s Note: The statements, opinions and data contained in all publications are solely those of the individual author(s) and contributor(s) and not of MDPI and/or the editor(s). MDPI and/or the editor(s) disclaim responsibility for any injury to people or property resulting from any ideas, methods, instructions or products referred to in the content.

