
Learning a Deep Attention Dilated Residual Convolutional Neural Network for Landslide Susceptibility Mapping in Hanzhong City, Shaanxi Province, China

 ,
,
Abstract
:
1. Introduction
2. Study Area and Data
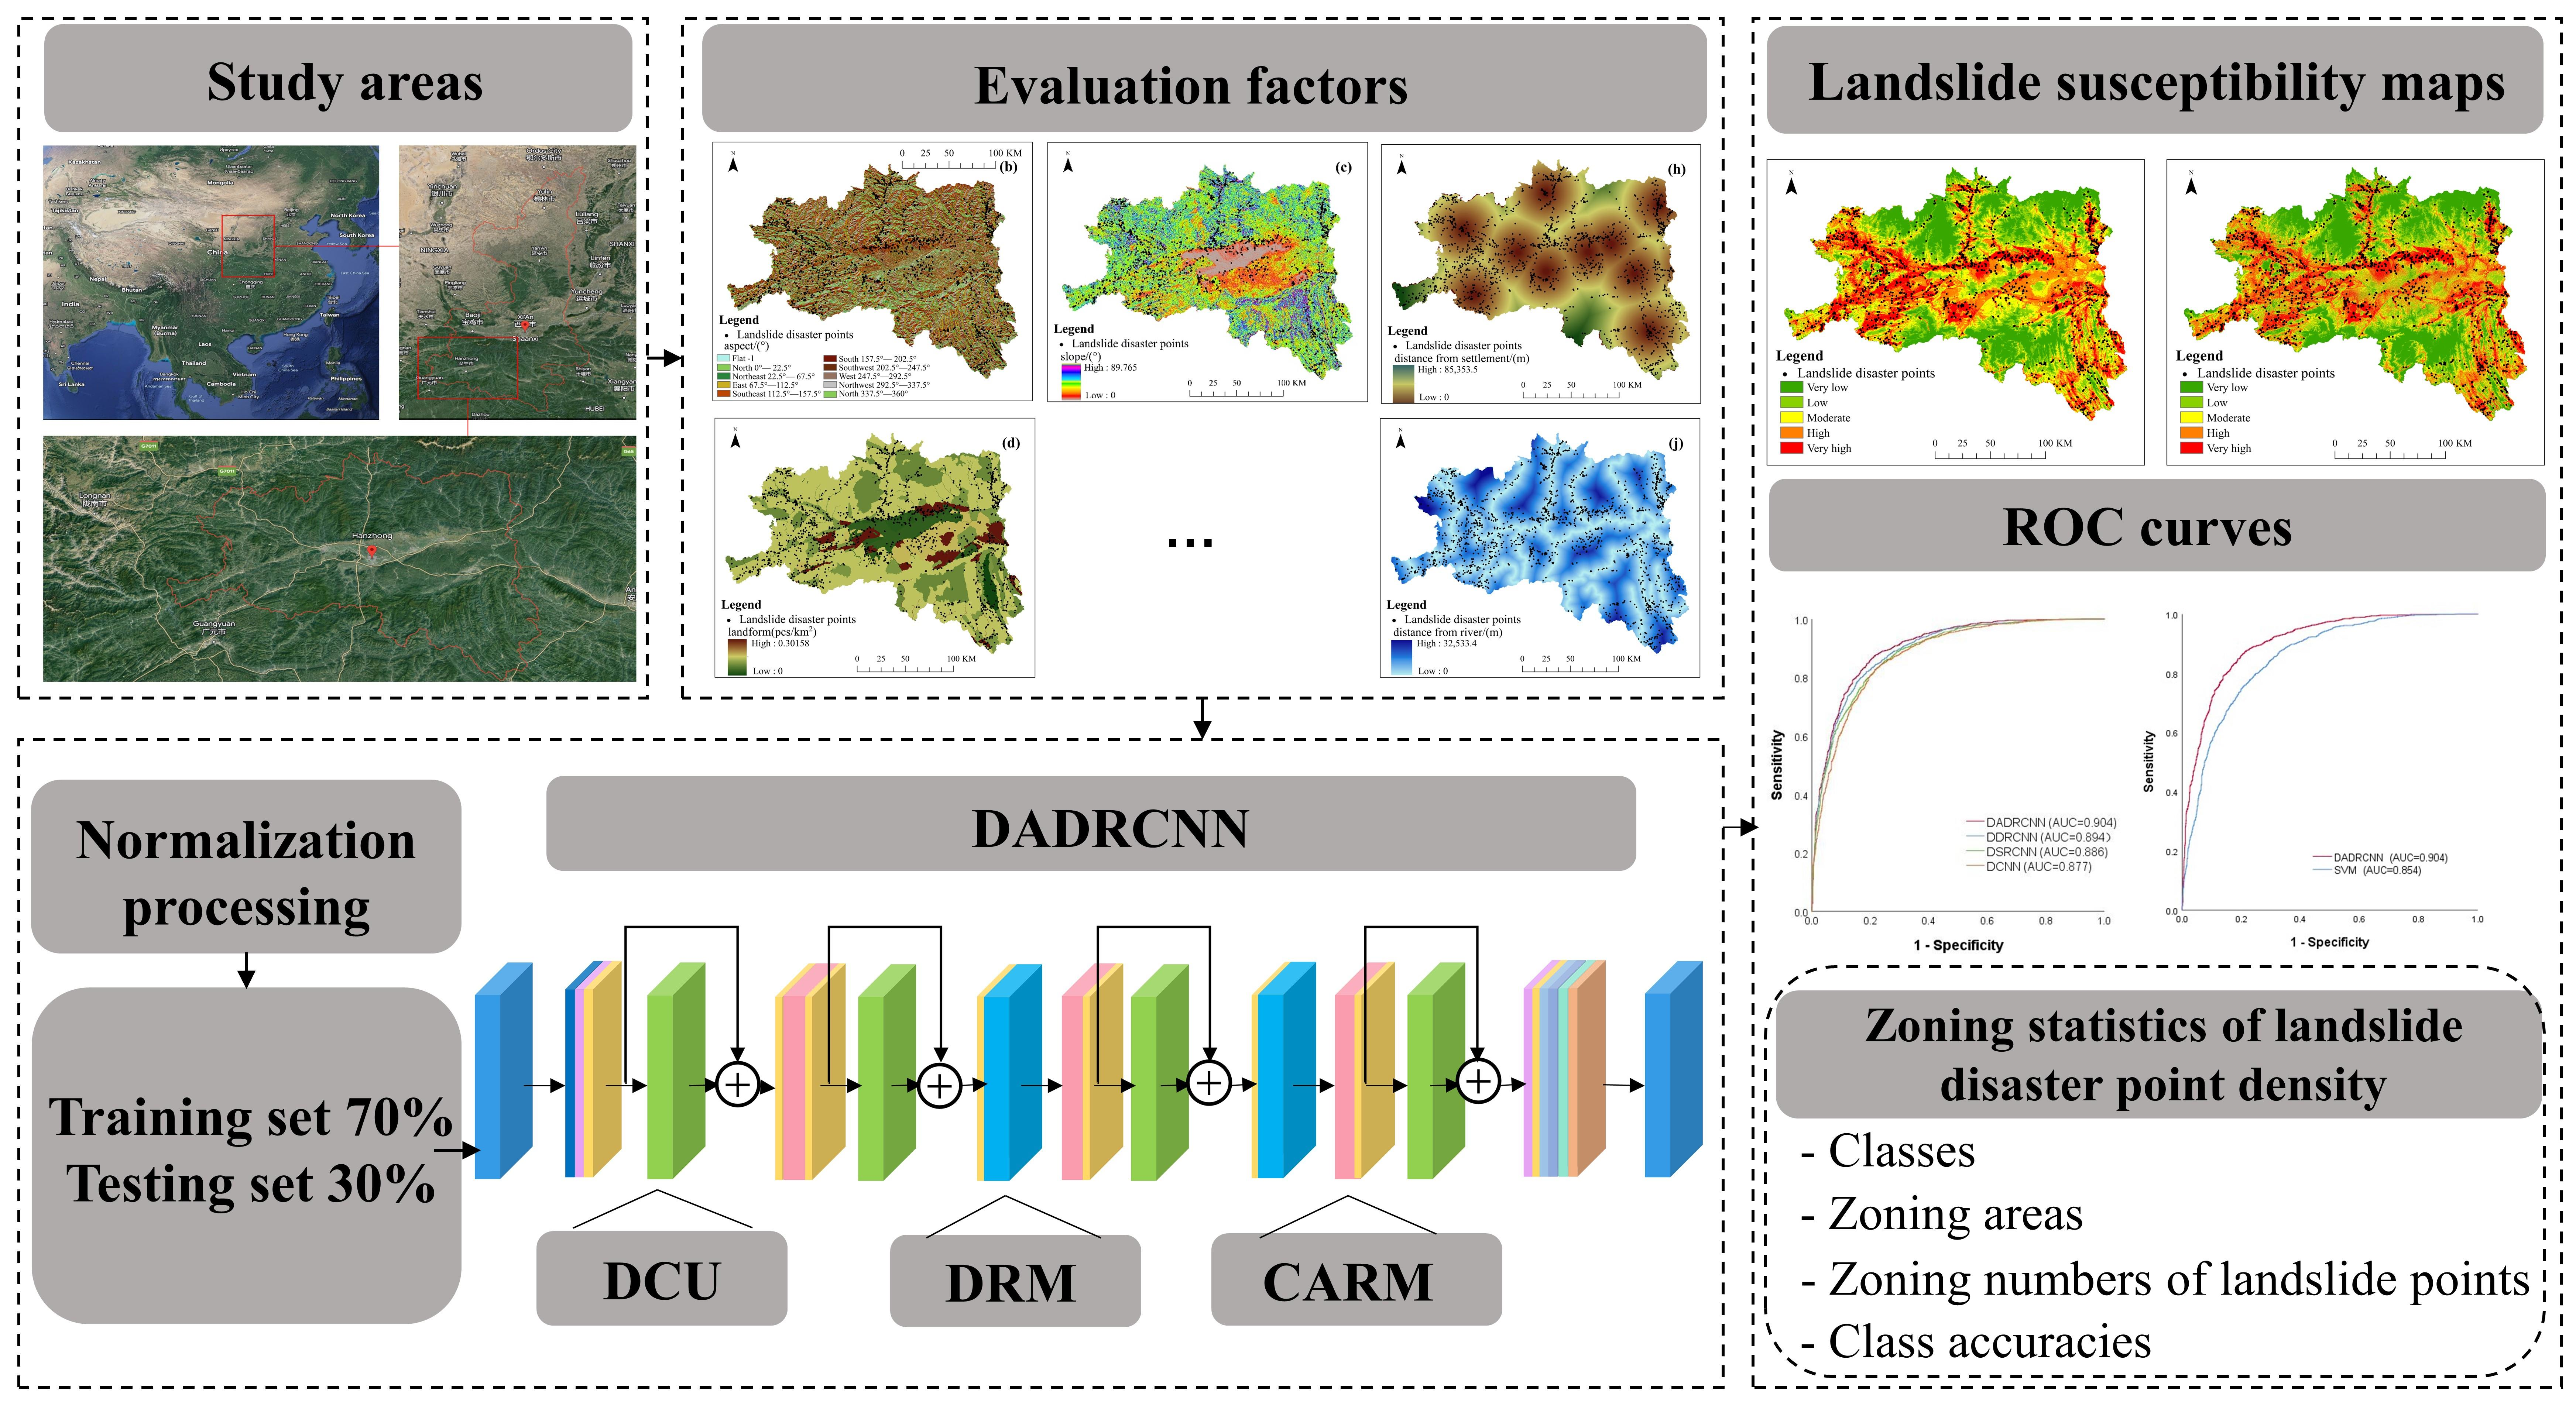
2.1. Study Area
2.2. Data Source
3. Methods
3.1. DADRCNN
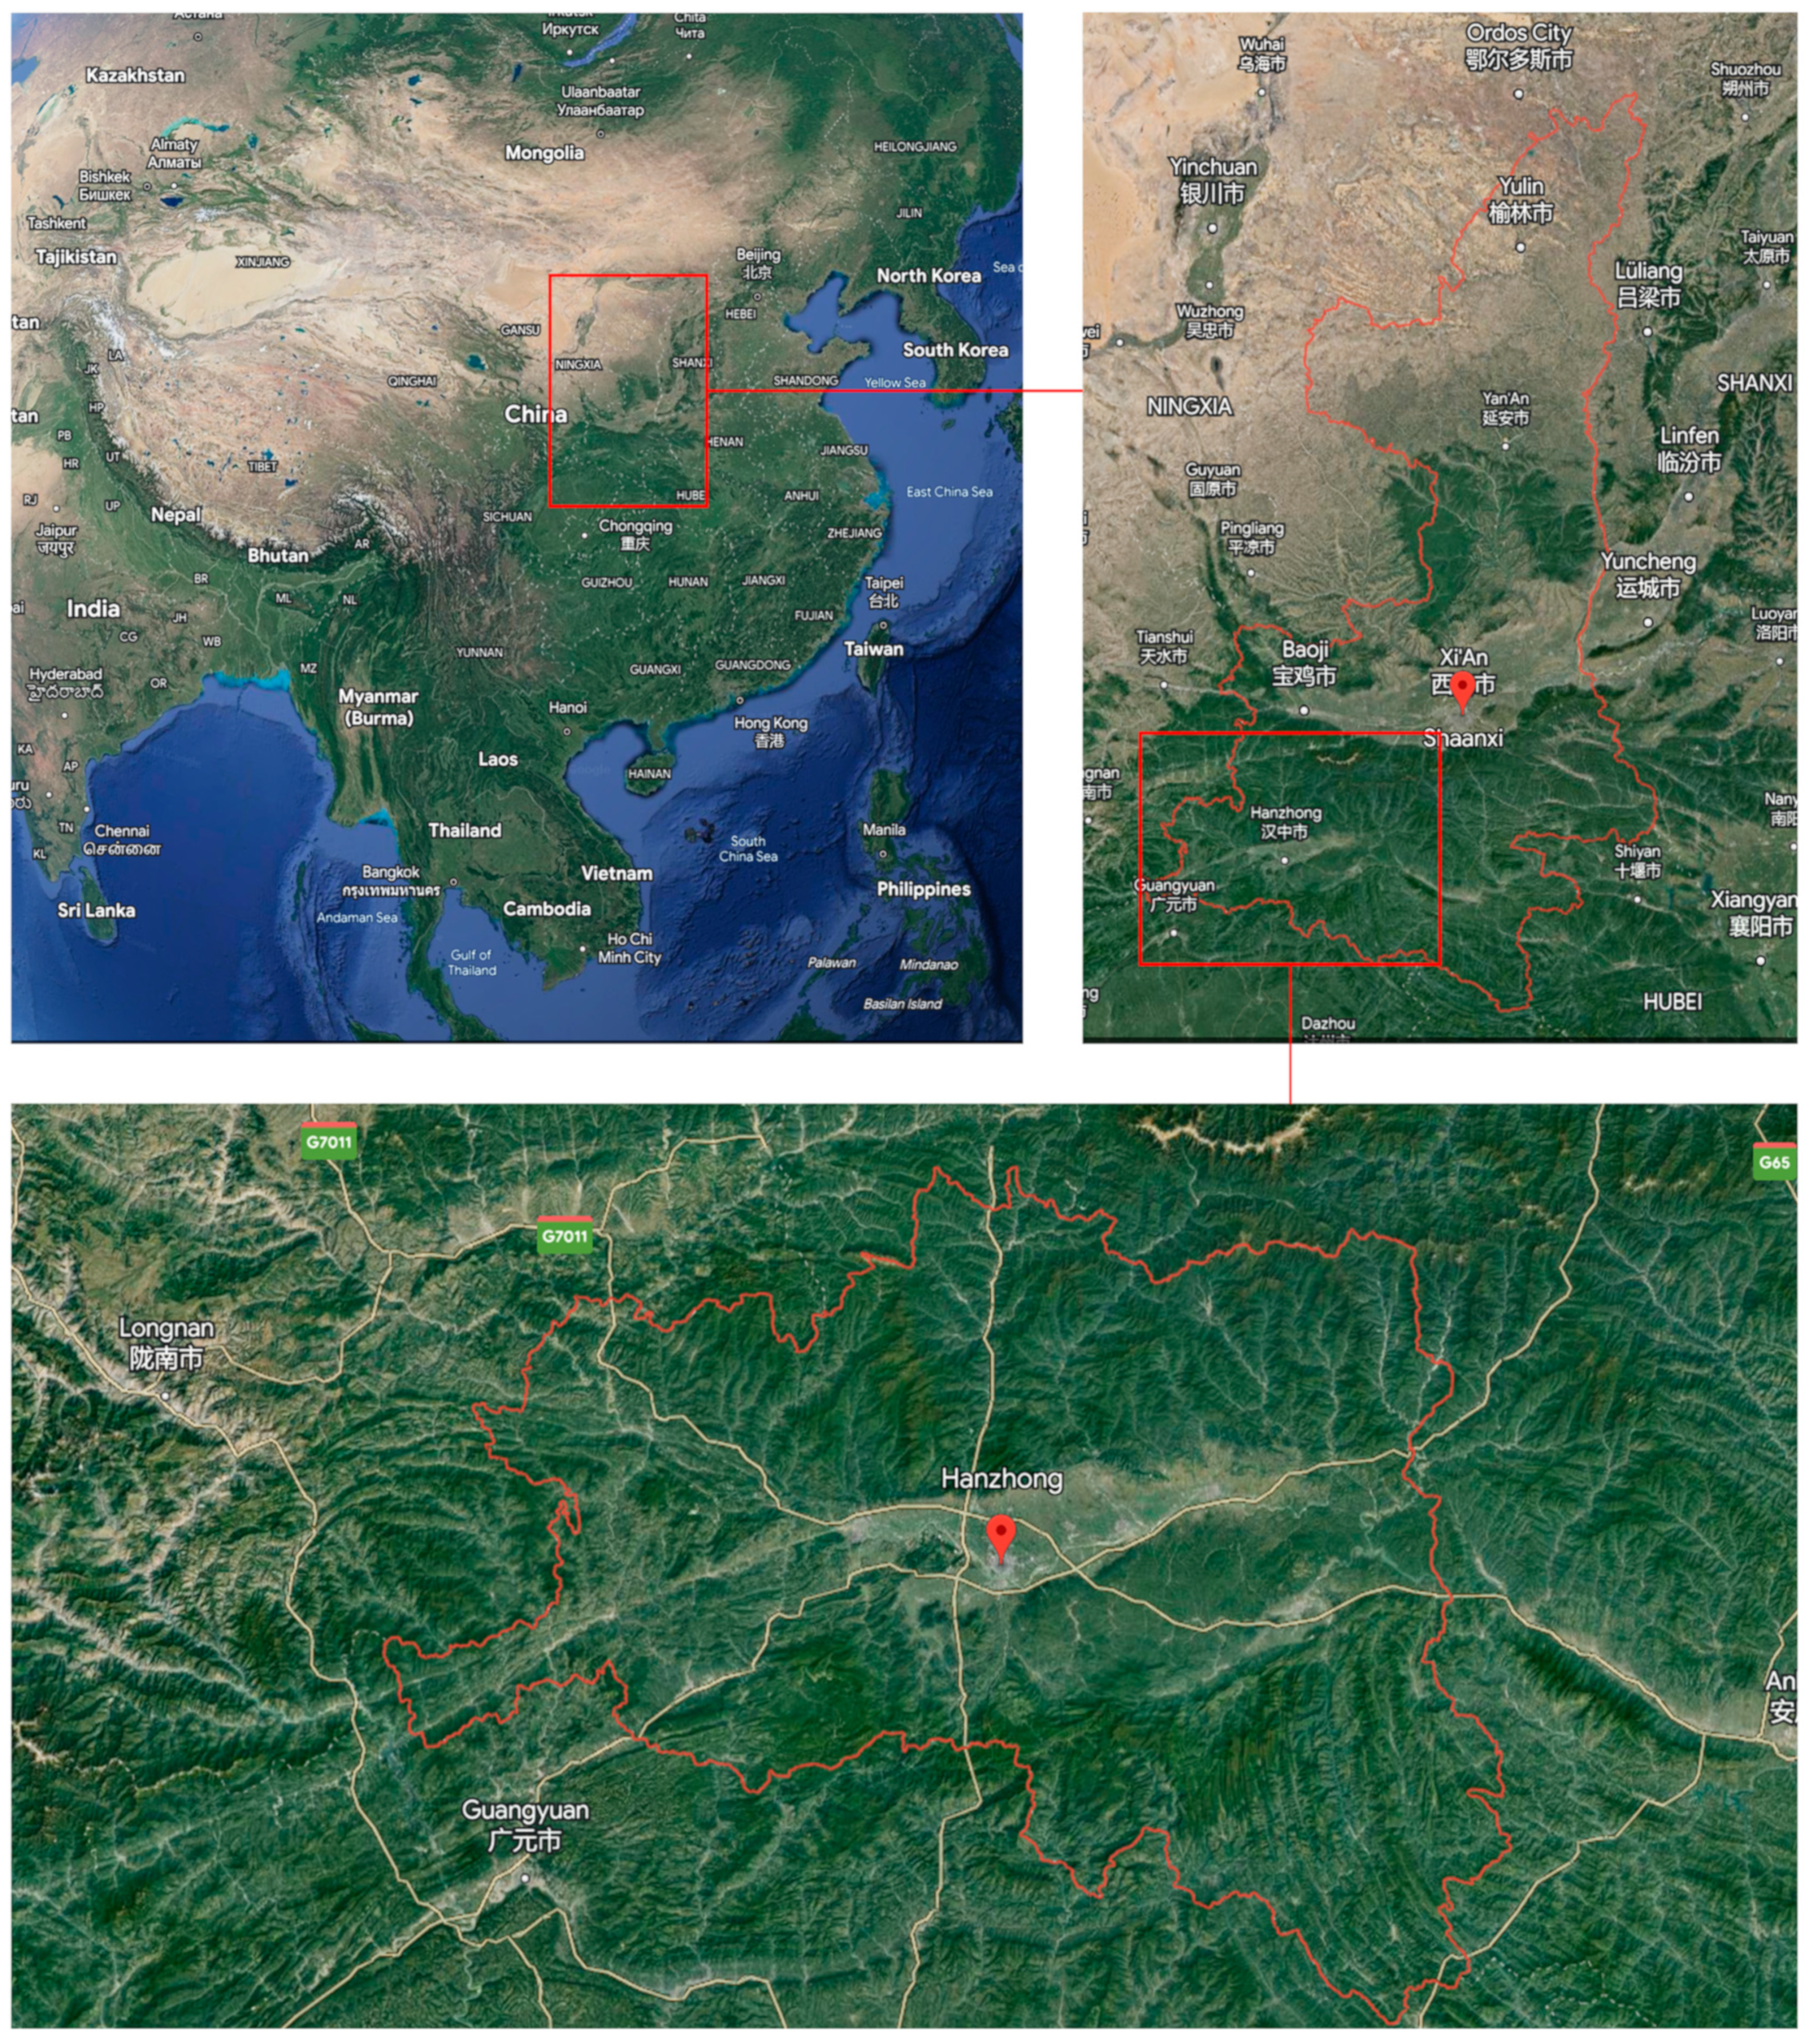
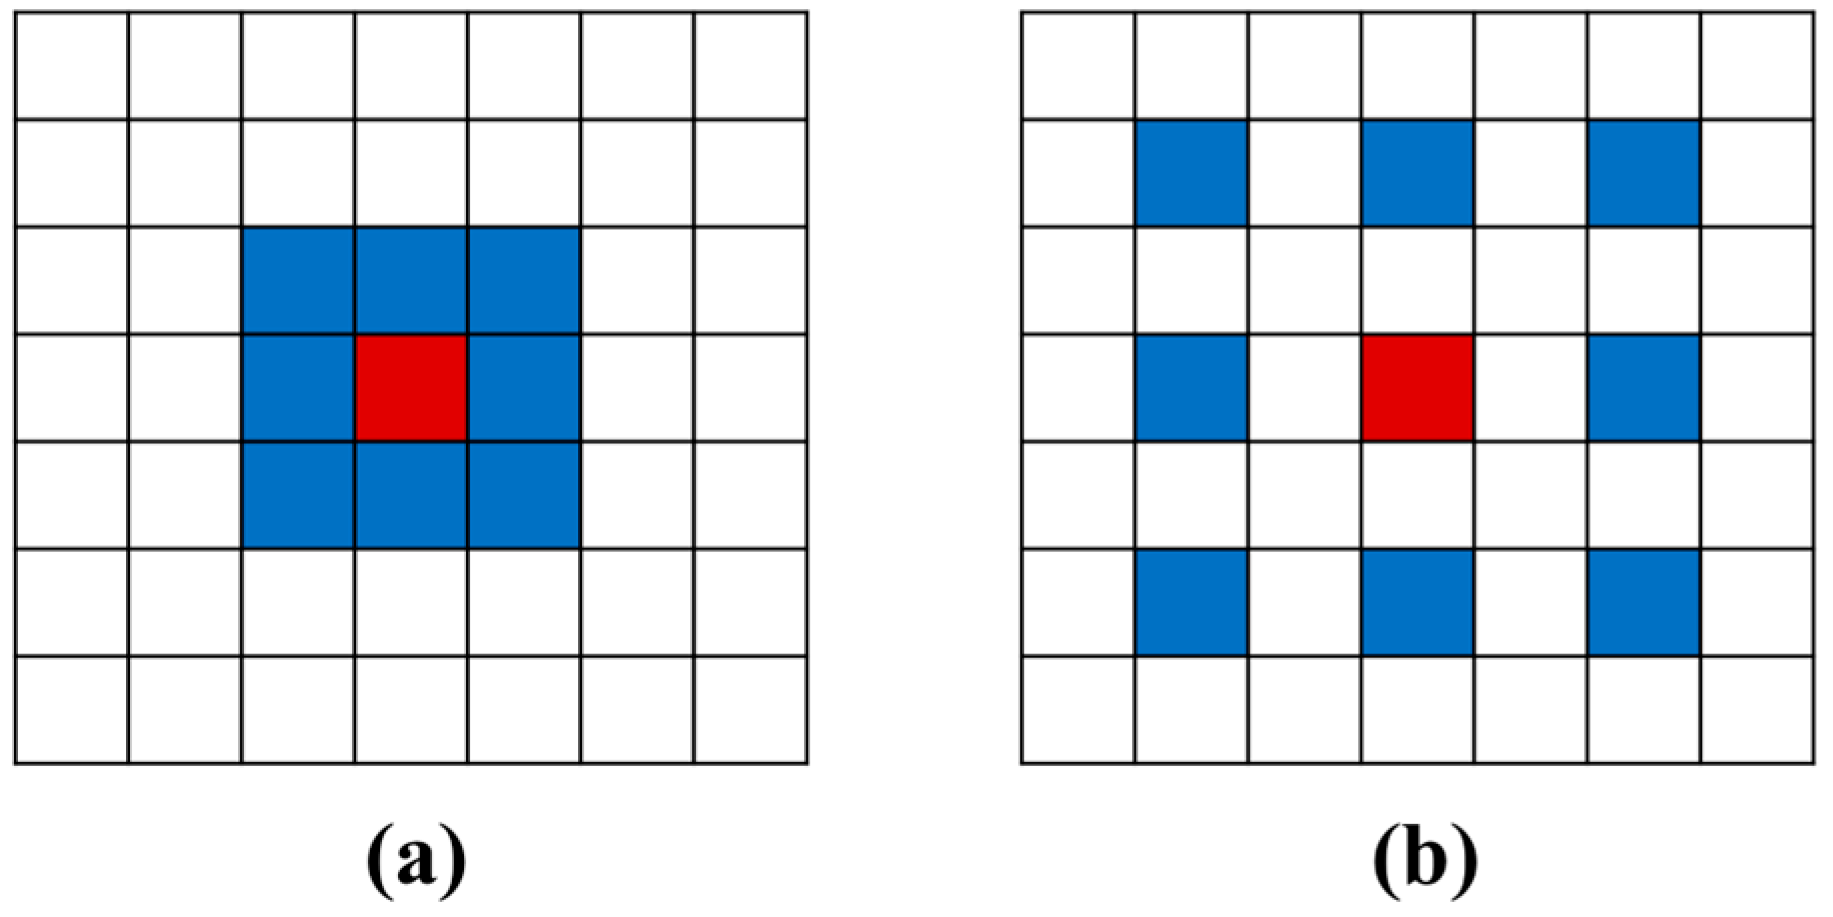
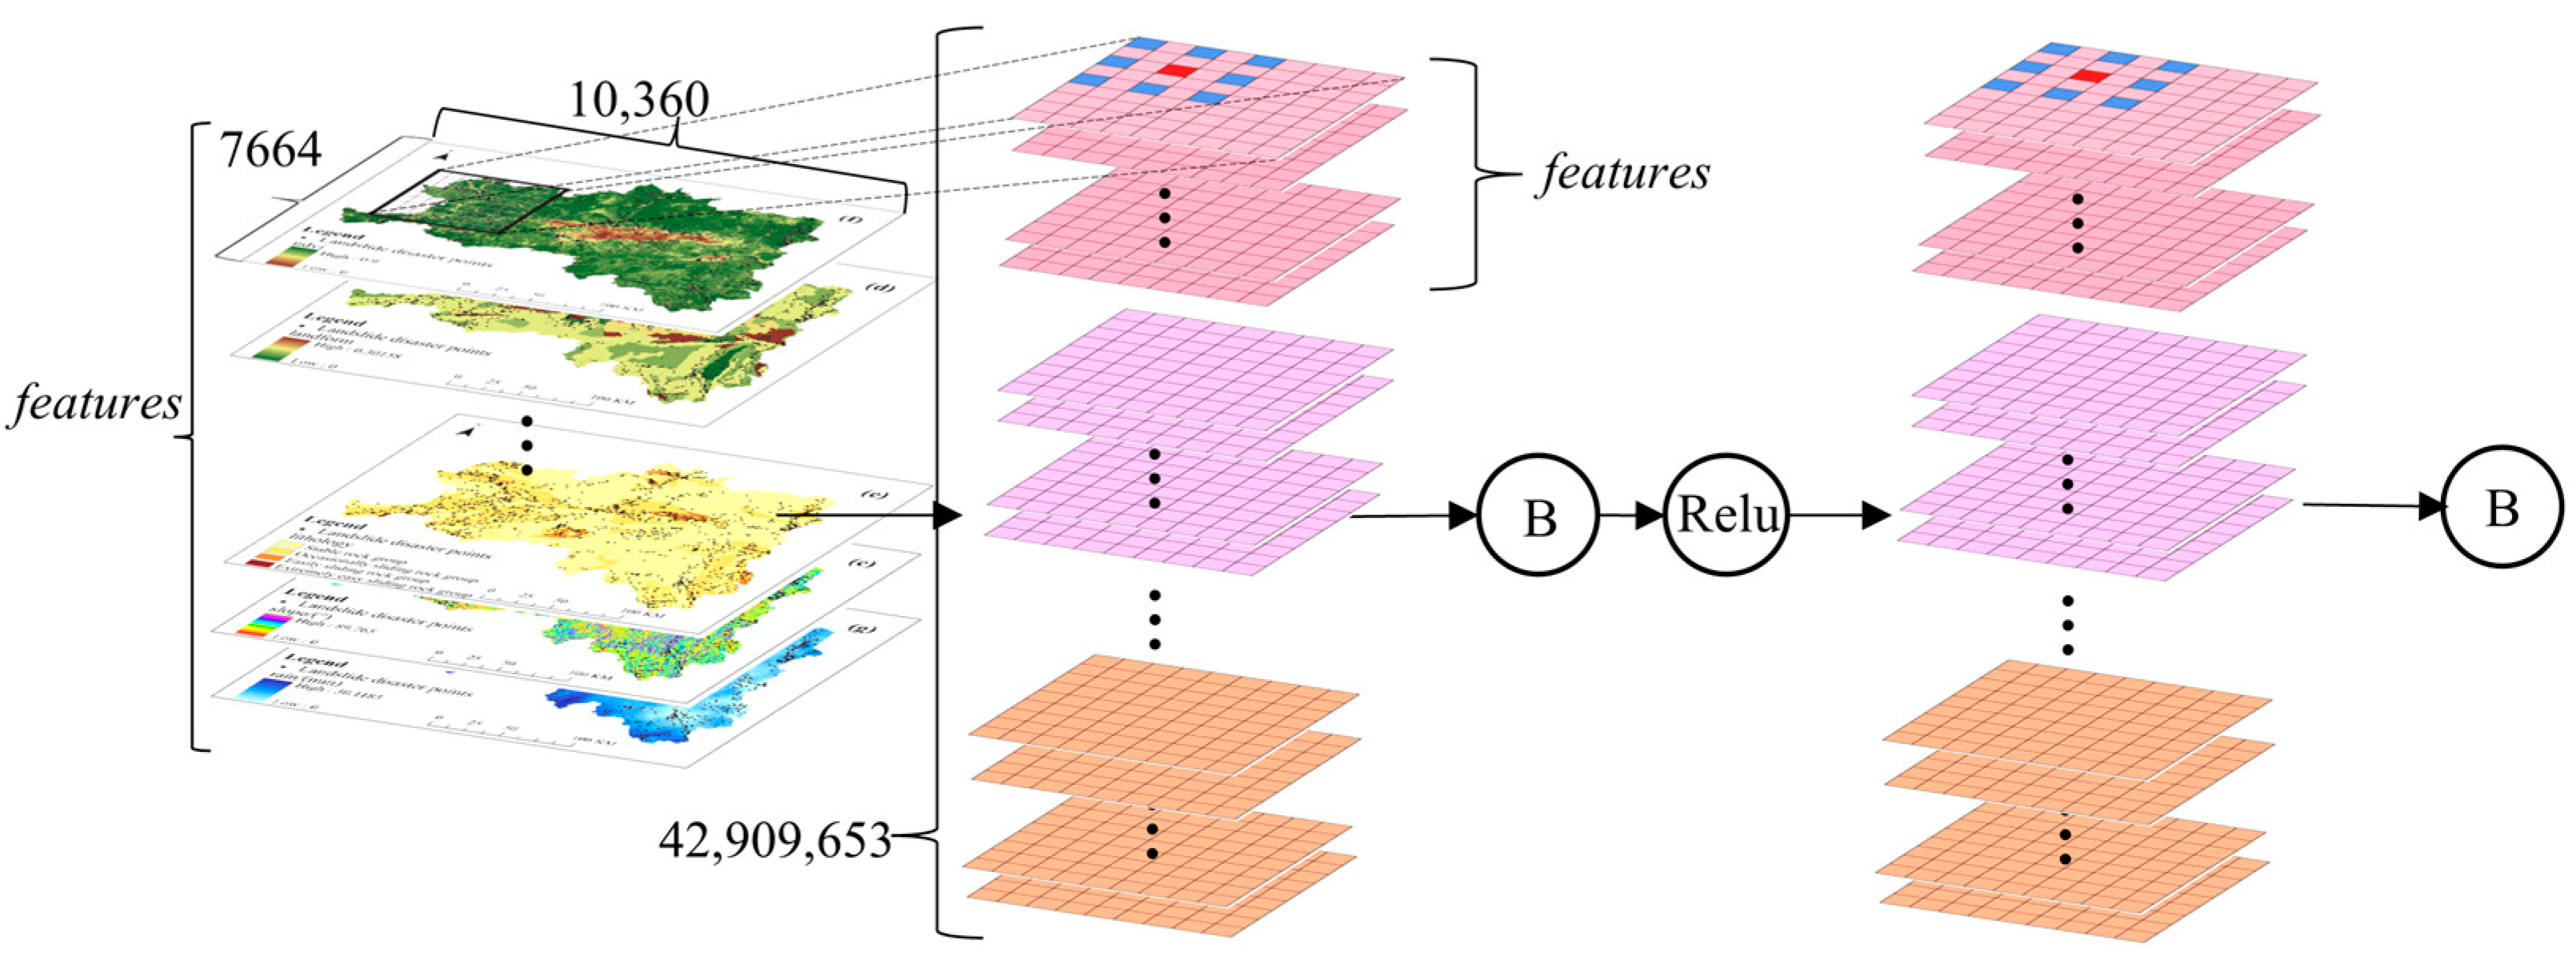
3.1.1. DCU
3.1.2. DRM
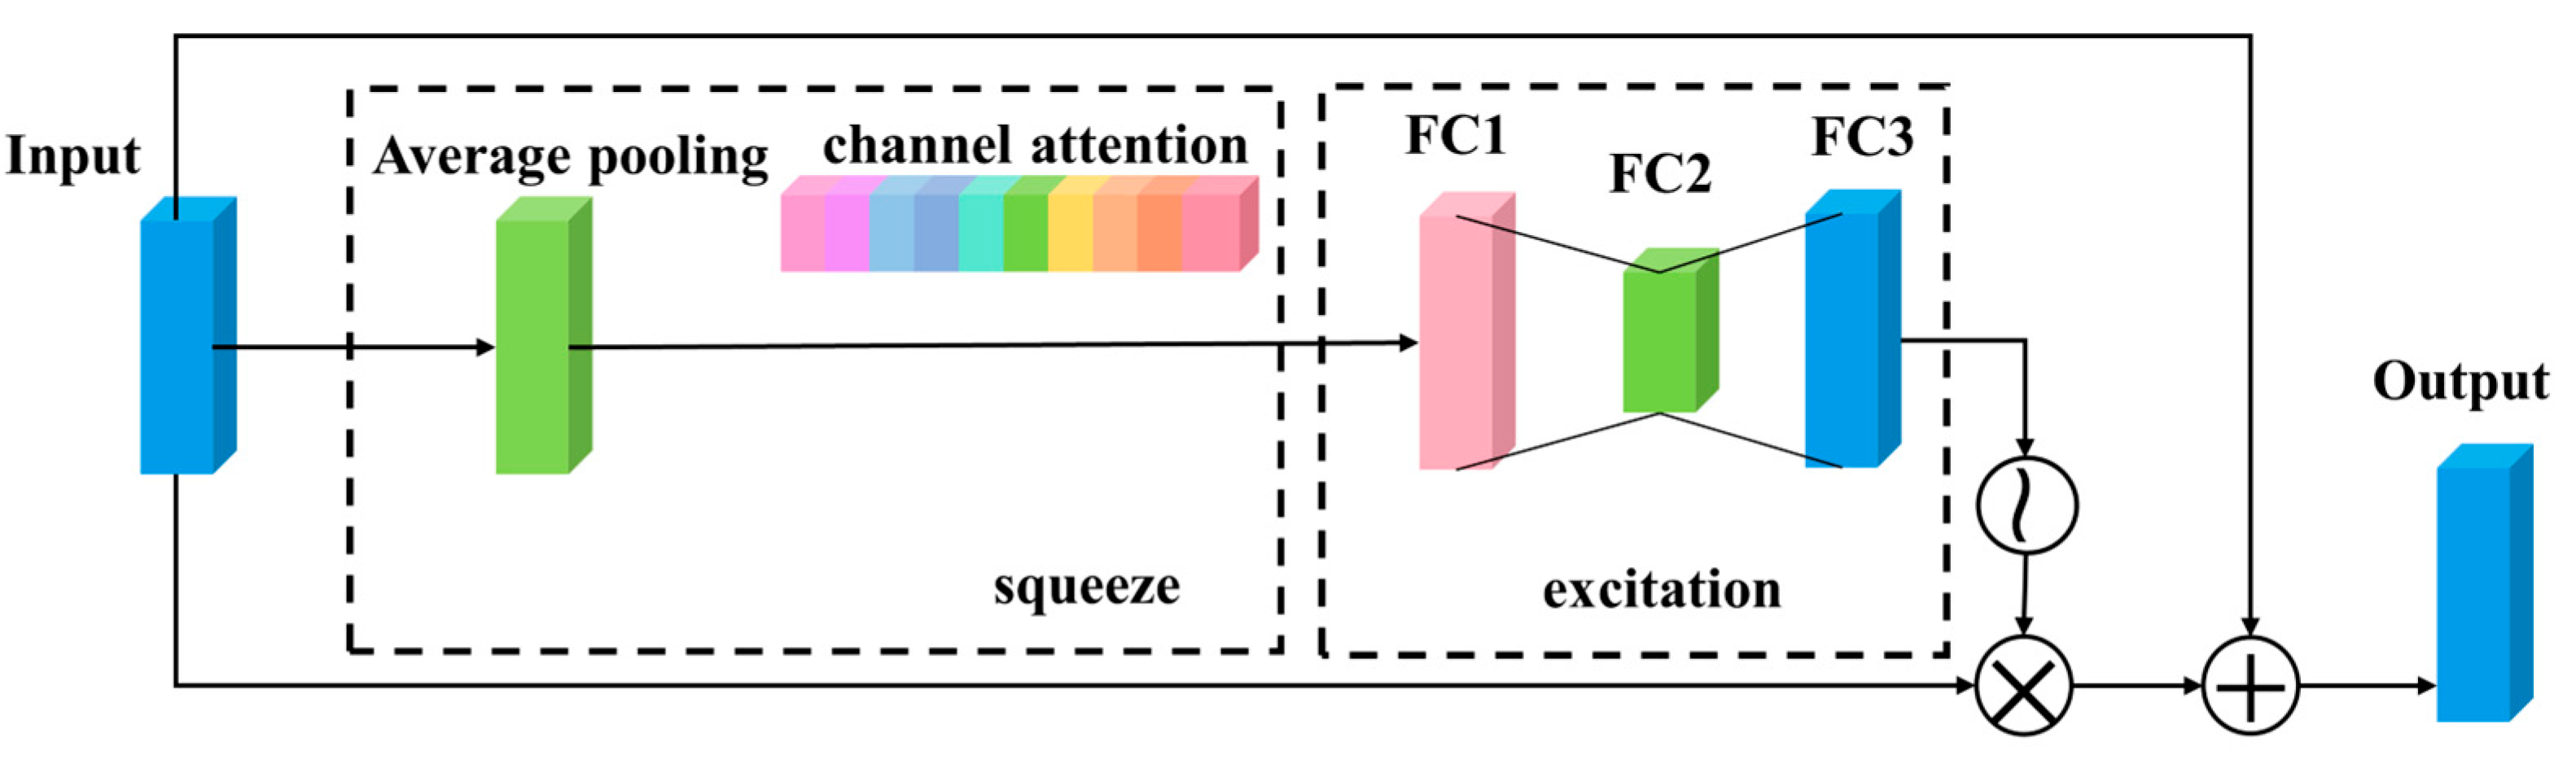
3.1.3. CARM
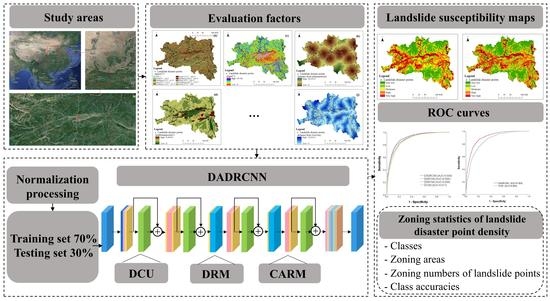
3.2. Research Flow of Landslide Susceptibility
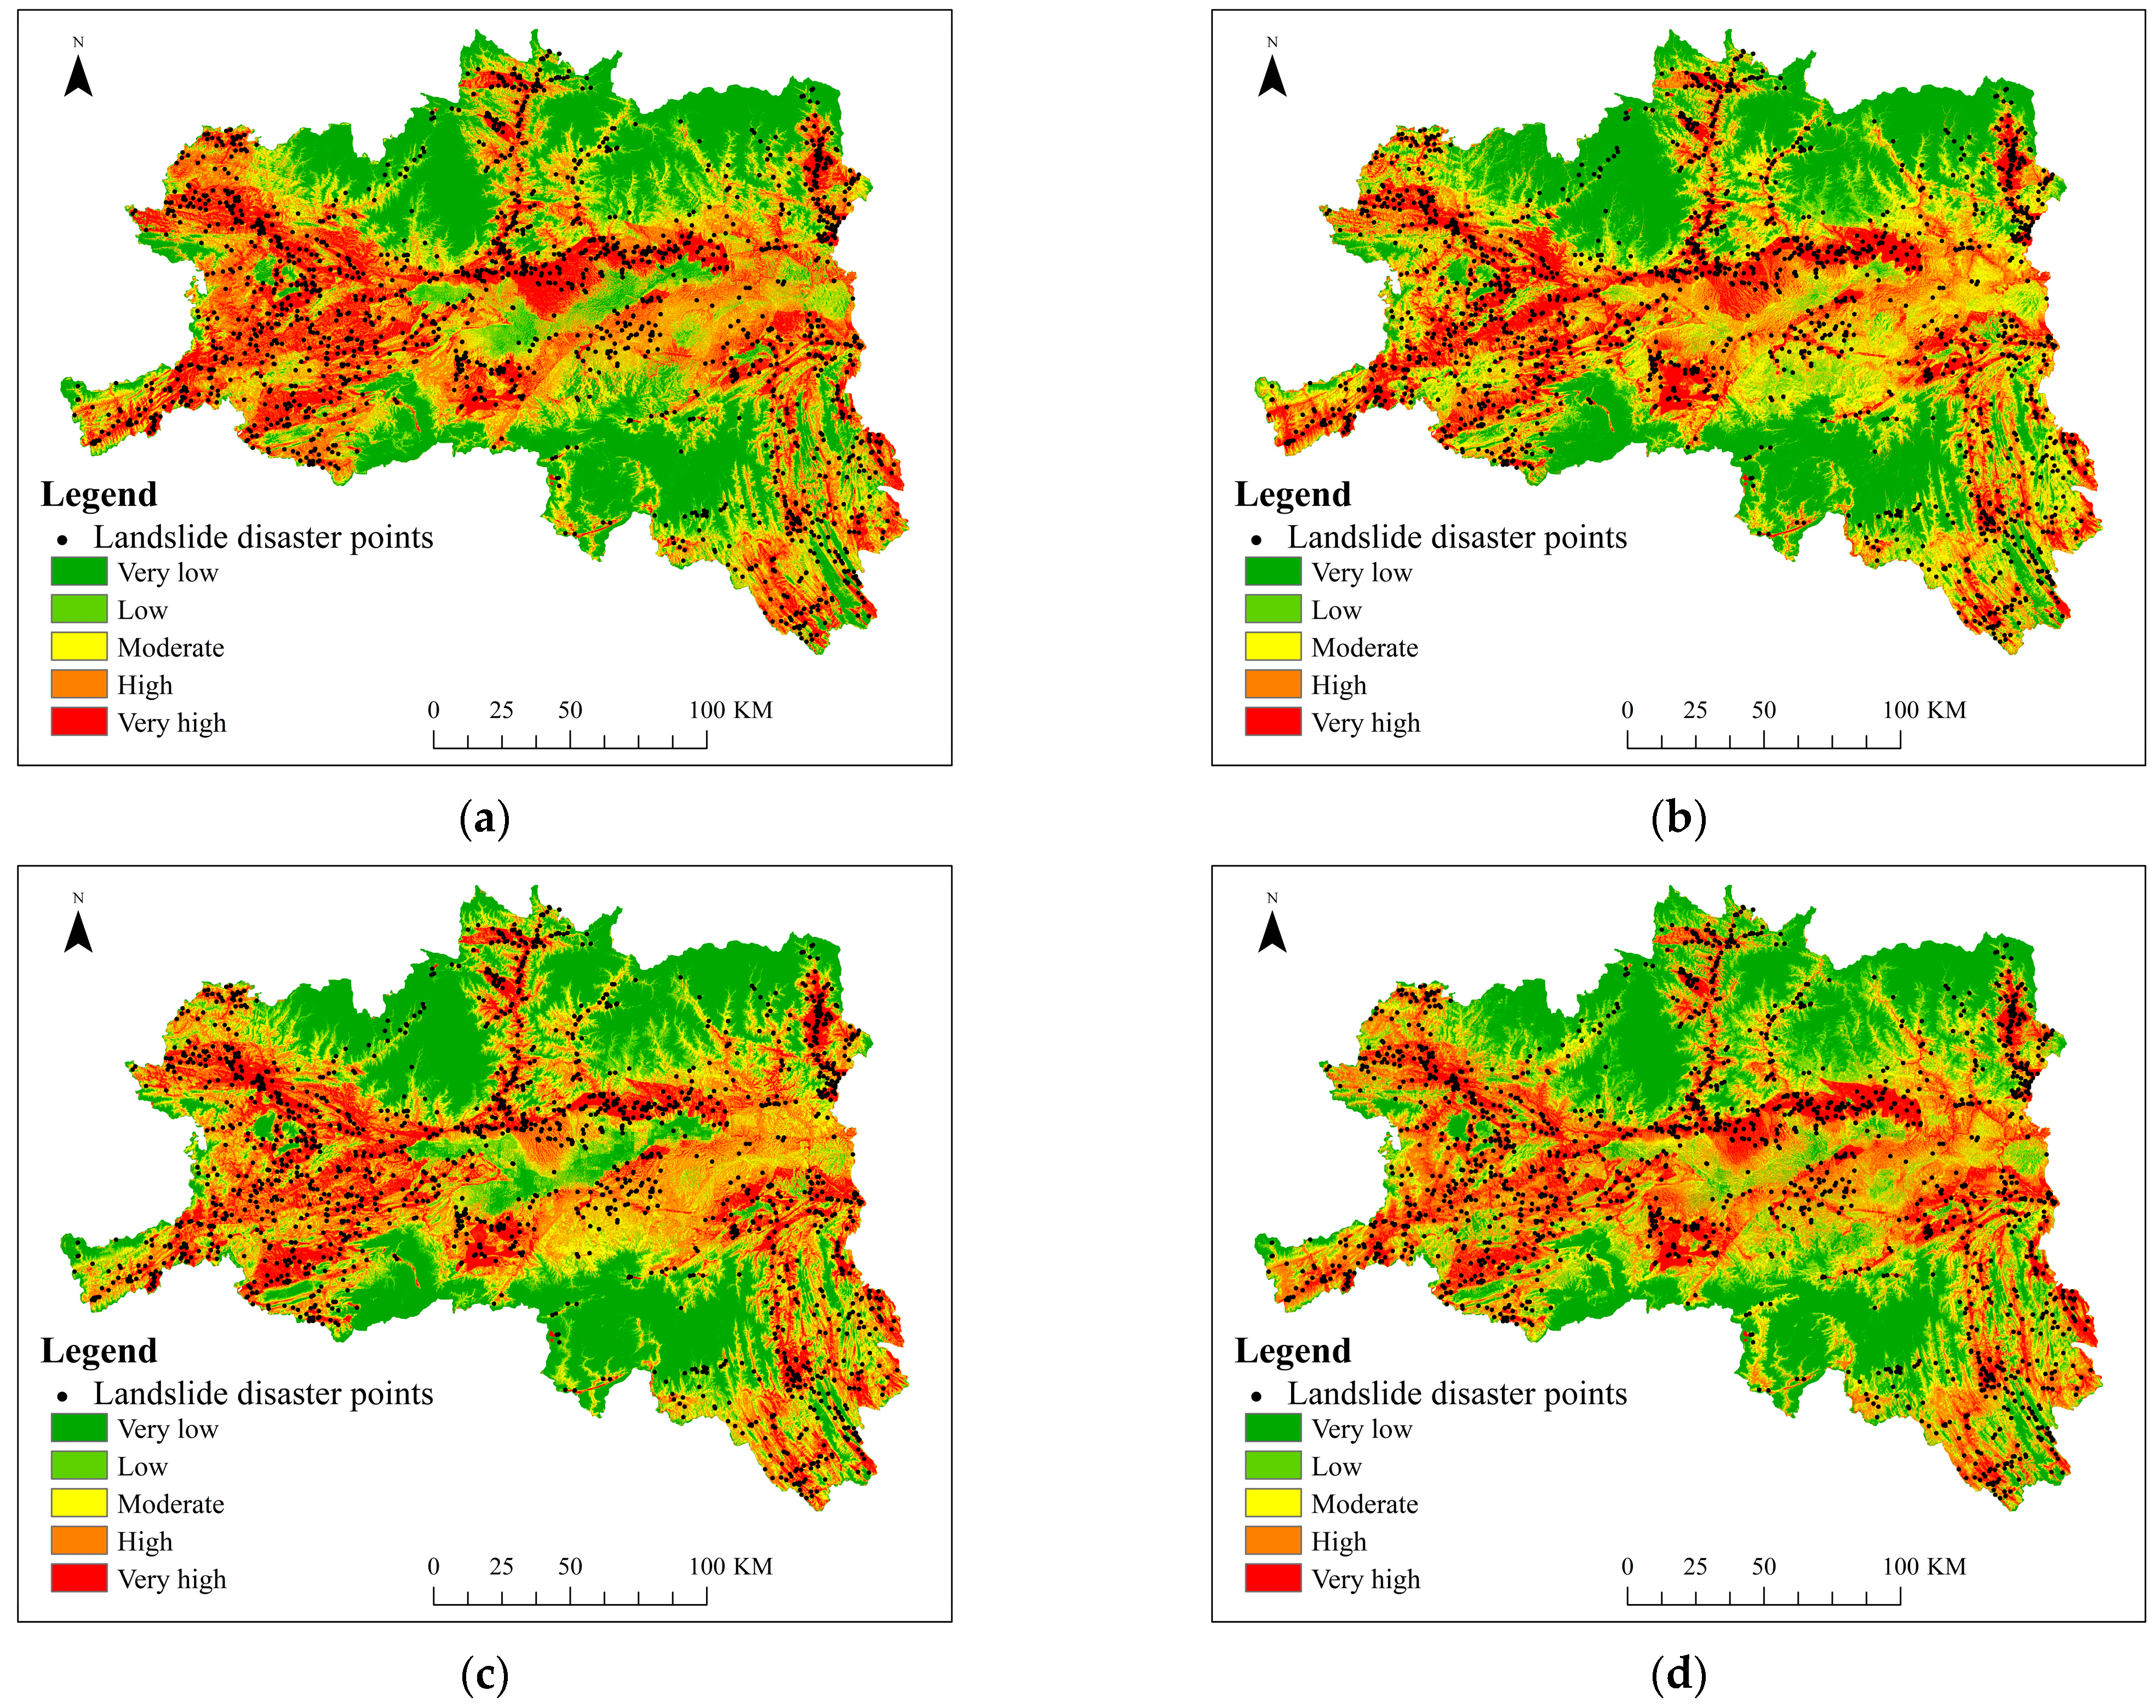
4. Results
4.1. Parameter Settings
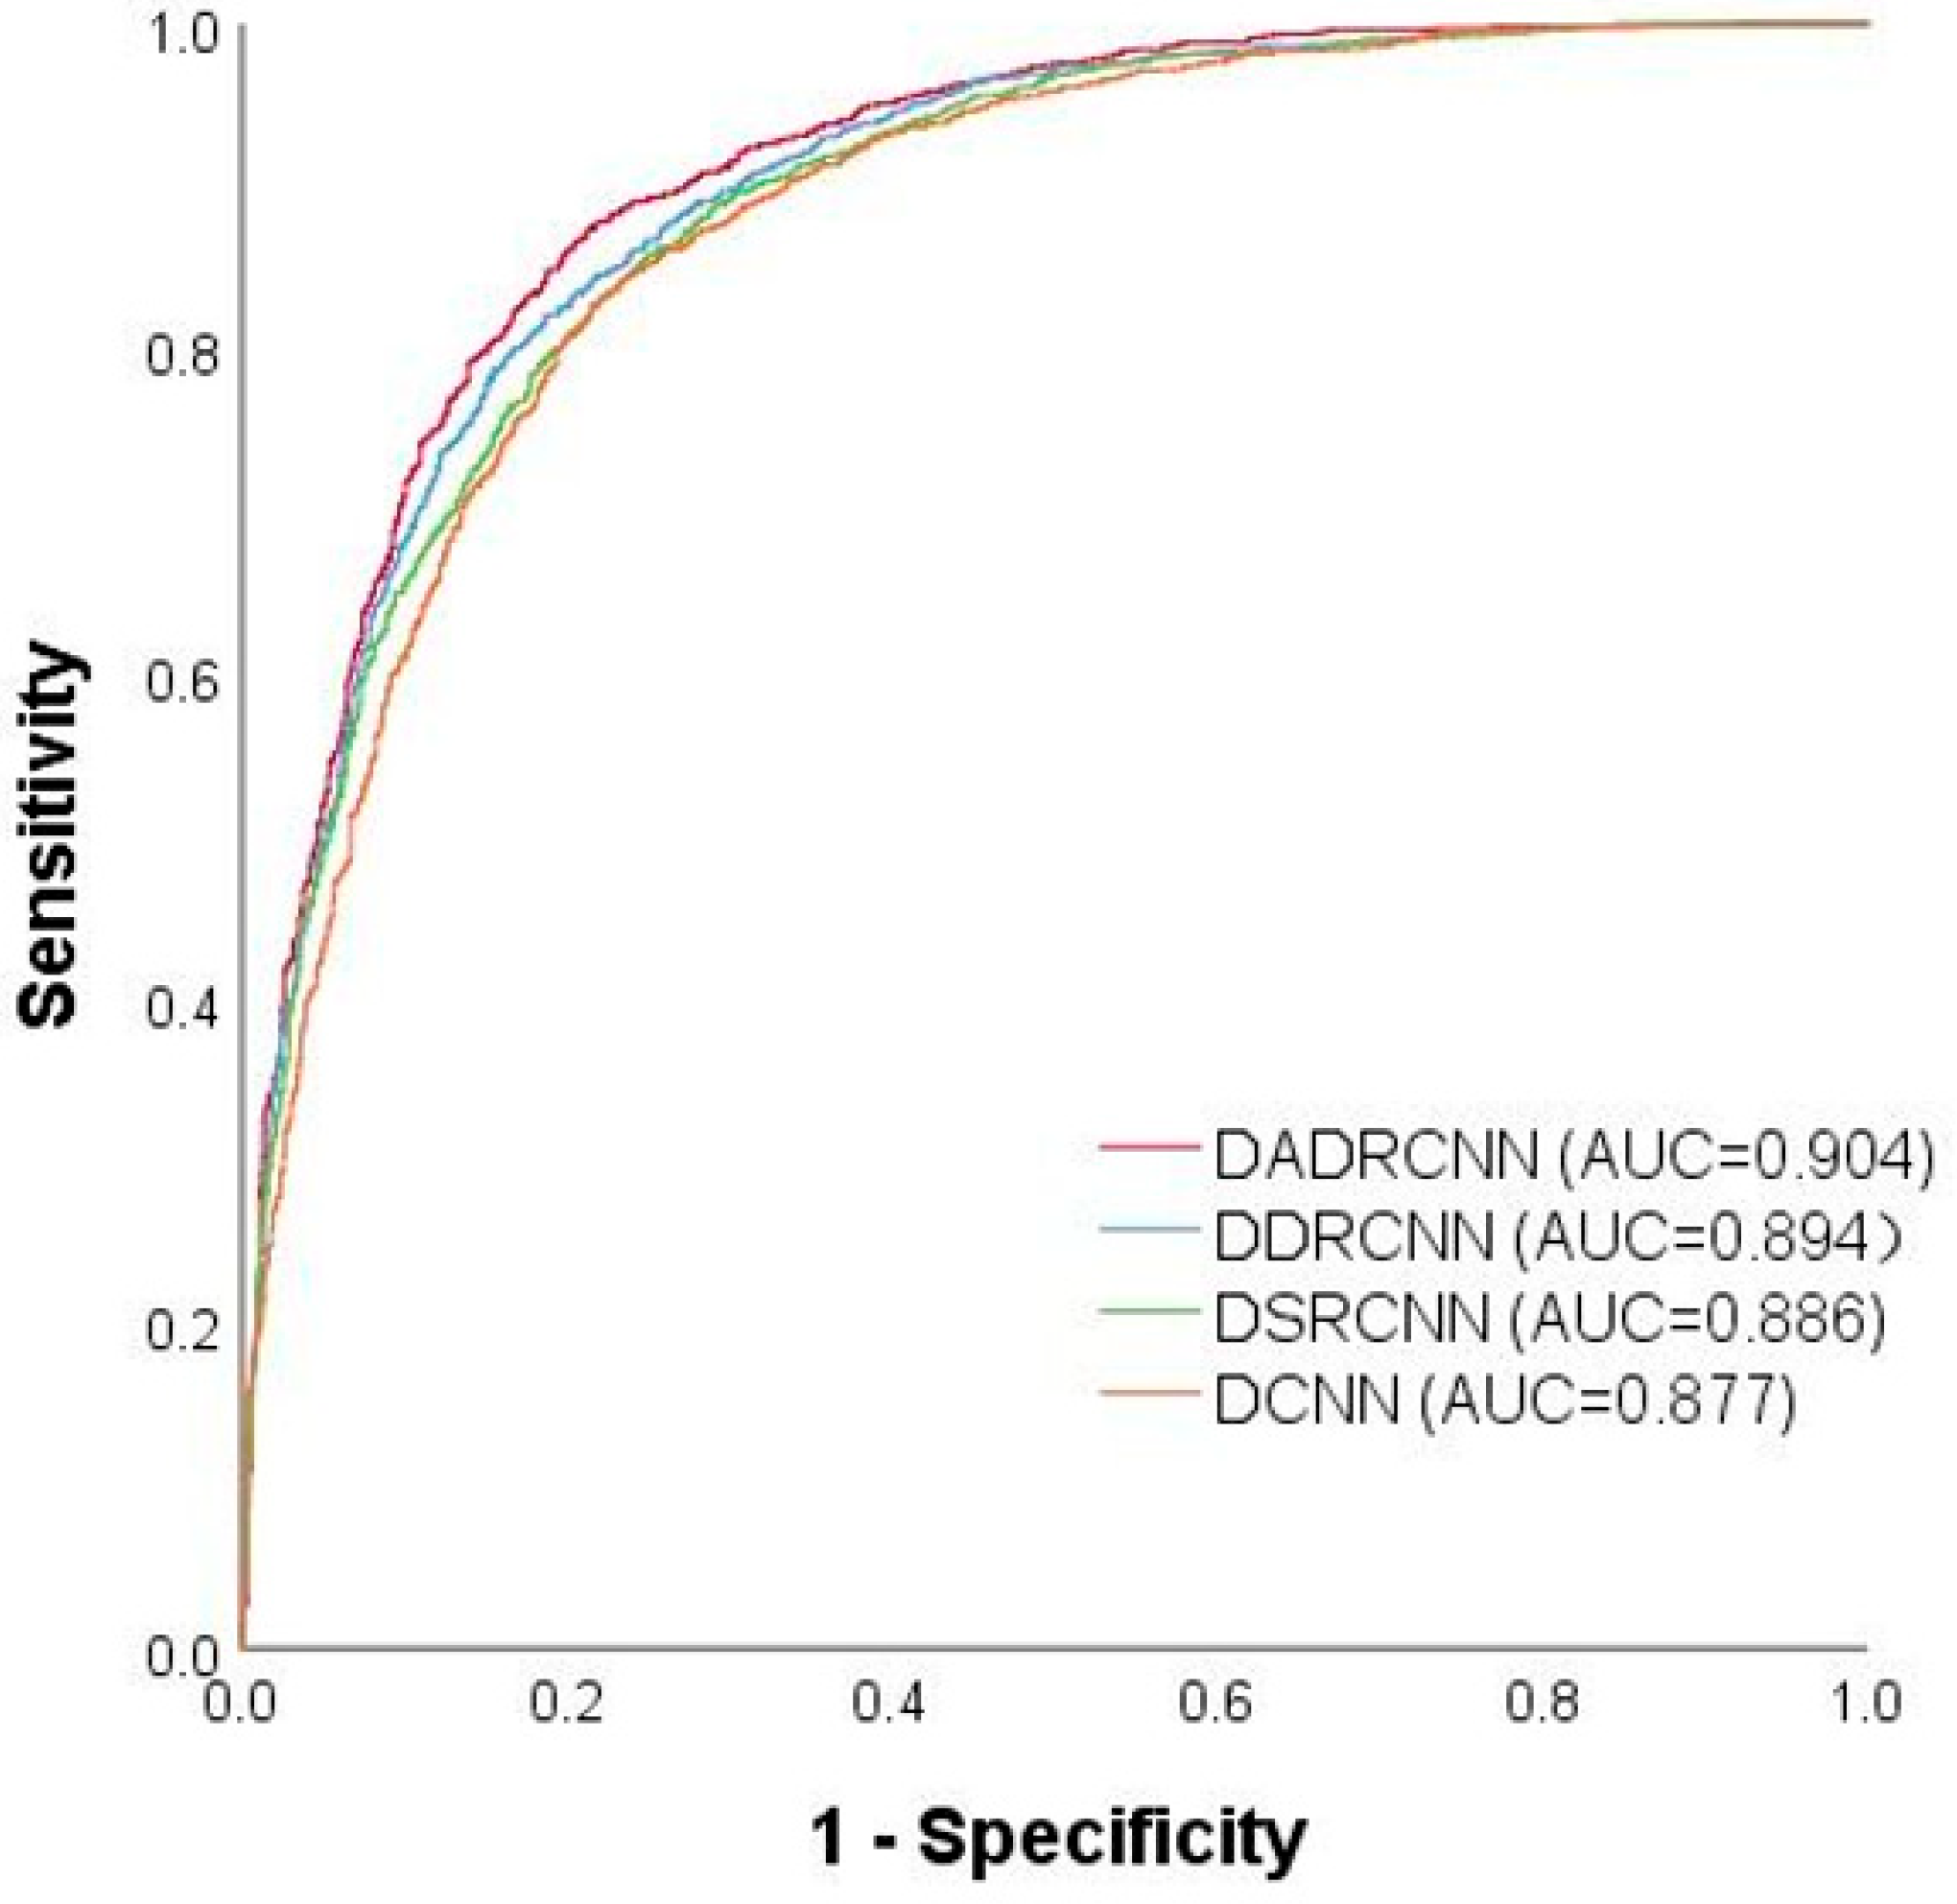
4.2. Evaluation Indicators
4.3. Results of Different Spatial Neighborhood Sizes
4.4. Ablation Experiment
4.5. Comparison with SVM
5. Discussion
5.1. Influence of Different Spatial Neighborhood Sizes
5.2. Characteristics of the DADRCNN Compared to DCNN, DSRCNN, and DDRCNN
5.3. Advantages of the DADRCNN Compared to SVM
6. Conclusions
Author Contributions
Funding
Data Availability Statement
Conflicts of Interest
References
- Yan, J. Uncertainty in Landslide Susceptibility Prediction Modeling: The Influence of Landslide Boundaries and Environmental Factor Errors. Master’s Thesis, Nanchang University, Nanchang, China, 2022. [Google Scholar]
- Xu, J.; Zhang, H.; Wen, H.; Sun, D. Study on the zoning of landslide susceptibility in Wushan County based on logistic regression. J. Chongqing Norm. Univ. (Nat. Sci. Ed.) 2021, 38, 48–56. [Google Scholar]
- Liu, Y.; Zhao, L.; Bao, A.; Li, J.; Yan, X. Chinese High-Resolution Satellite Data and GIS-Based Assessment of Landslide Susceptibility along Highway G30 in Guozigou Valley Using Logistic Regression and MaxEnt Model. Remote Sens. 2022, 14, 3620. [Google Scholar] [CrossRef]
- Liu, R.; Shi, X.; Sun, D.; Xu, J. Landslide susceptibility zoning in Wushan County based on GIS and random forest. J. Chongqing Norm. Univ. (Nat. Sci. Ed.) 2020, 37, 86–96. [Google Scholar]
- Wu, R.; Hu, X.; Mei, H.; He, J.; Yang, J. Spatial susceptibility assessment of landslides based on random forest: A case study of the Hubei section of the Three Gorges Reservoir area. Earth Sci. 2021, 46, 321–330. [Google Scholar]
- Kavzoglu, T.; Teke, A. Predictive Performances of ensemble machine learning algorithms in landslide susceptibility mapping using random forest, extreme gradient boosting (XGBoost) and natural gradient boosting (NGBoost). Arab. J. Sci. Eng. 2022, 47, 7367–7385. [Google Scholar] [CrossRef]
- Sun, D.; Ding, Y.; Zhang, J.; Wen, H.; Wang, Y.; Xu, J.; Zhou, X.; Liu, R. Essential insights into decision mechanism of landslide susceptibility mapping based on different machine learning models. Geocarto Int. 2022. [Google Scholar] [CrossRef]
- Zhice, F.; Yi, W.; Gonghao, D.; Ling, P. Landslide Susceptibility Mapping Using Rotation Forest Ensemble Technique with Different Decision Trees in the Three Gorges Reservoir Area, China. Remote Sens. 2021, 13, 238–259. [Google Scholar]
- Zhao, Q.; Chen, W.; Peng, C.; Wang, D.; Xue, W.; Bian, H. Modeling landslide susceptibility using an evidential belief function-based multiclass alternating decision tree and logistic model tree. Environ. Earth Sci. 2022, 81, 404–419. [Google Scholar] [CrossRef]
- Abedini, M.; Ghasemian, B.; Shirzadi, A.; Bui, D.T. A comparative study of support vector machine and logistic model tree classifiers for shallow landslide susceptibility modeling. Environ. Earth Sci. 2019, 78, 560. [Google Scholar] [CrossRef]
- Xu, S.; Liu, J.; Wang, X.; Zhang, Y.; Lin, R.; Zhang, M.; Liu, M.; Jiang, T. Support vector machine combined with entropy index for landslide hazard susceptibility assessment: A case study of Shaanxi Province. J. Wuhan Univ. (Inf. Sci. Ed.) 2020, 45, 1214–1222. [Google Scholar]
- Fang, Z.; Wang, Y.; Duan, H.; Niu, R.; Peng, L. Comparison of general kernel, multiple kernel, infinite ensemble and semi-supervised support vector machines for landslide susceptibility prediction. Stoch. Environ. Res. Risk Assess. 2022, 36, 3535–3556. [Google Scholar] [CrossRef]
- Wang, S.; Zhuang, J.; Zheng, J.; Mou, J.; Wang, Y.; Fu, Y. Assessment of landslide susceptibility along the Kangding-Litang section of CZ railway based on deep learning. J. Eng. Geol. 2022, 30, 908–919. [Google Scholar]
- Liu, R.; Yang, X.; Xu, C.; Wei, L.; Zeng, X. Comparative Study of Convolutional Neural Network and Conventional Machine Learning Methods for Landslide Susceptibility Mapping. Remote Sens. 2022, 14, 321. [Google Scholar] [CrossRef]
- Yi, Y.; Zhang, Z.; Zhang, W.; Jia, H.; Zhang, J. Landslide susceptibility mapping using multiscale sampling strategy and convolutional neural network: A case study in Jiuzhaigou region. Catena 2020, 195, 104851. [Google Scholar] [CrossRef]
- Jiang, Z.; Wang, M.; Liu, K. Comparisons of Convolutional Neural Network and Other Machine Learning Methods in Landslide Susceptibility Assessment: A Case Study in Pingwu. Remote Sens. 2023, 15, 798. [Google Scholar] [CrossRef]
- He, W.; Chen, G.; Zhao, J.; Lin, Y.; Qin, B.; Yao, W.; Cao, Q. Landslide susceptibility evaluation of machine learning based on information volume and frequency ratio: A case study of Weixin County, China. Sensors 2023, 23, 2549. [Google Scholar] [CrossRef]
- Nhu, V.-H.; Mohammadi, A.; Shahabi, H.; Ahmad, B.B.; Al-Ansari, N.; Shirzadi, A.; Clague, J.J.; Jaafari, A.; Chen, W.; Nguyen, H. Landslide susceptibility mapping using machine learning algorithms and remote sensing data in a tropical environment. Int. J. Environ. Res. Public Health 2020, 17, 4933. [Google Scholar] [CrossRef]
- Lin, R.; Liu, J.; Xu, S.; Liu, M.; Zhang, M.; Liang, E. Evaluation method of landslide susceptibility based on random forest weighted information. Sci. Surv. Mapp. 2020, 45, 131–138. [Google Scholar]
- Xia, D.; Tang, H.; Sun, S.; Tang, C.; Zhang, B. Landslide susceptibility mapping based on the germinal center optimization algorithm and support vector classification. Remote Sens. 2022, 14, 2707. [Google Scholar] [CrossRef]
- Zhang, C.; Xu, S.; Jiang, T.; Liu, J.; Liu, Z.; Luo, A.; Ma, Y. Integrating Normal Vector Features into an Atrous Convolution Residual Network for LiDAR Point Cloud Classification. Remote Sens. 2021, 13, 3427. [Google Scholar] [CrossRef]
- Shafique, D.; Akram, M.U.; Hassan, T.; Anwar, T.; Salam, A.A. Dilated Convolution and Residual Network based Convolutional Neural Network for Recognition of Disastrous Events. In Proceedings of the 2022 IEEE International Symposium on Robotic and Sensors Environments (ROSE), Abu Dhabi, United Arab Emirates, 14–15 November 2022; pp. 01–08. [Google Scholar]
- Li, X.; Li, F.; Fern, X.; Raich, R. Filter Shaping for Convolutional Neural Networks. In Proceedings of the International Conference on Learning Representations, Toulon, France, 24–26 April 2017. [Google Scholar]
- Li, H.; Gan, Y.; Wu, Y.; Guo, L. EAGNet: A method for automatic extraction of agricultural greenhouses from high spatial resolution remote sensing images based on hybrid multi-attention. Comput. Electron. Agric. 2022, 202, 107431. [Google Scholar] [CrossRef]
- Ioffe, S.; Szegedy, C. Batch normalization: Accelerating deep network training by reducing internal covariate shift. In Proceedings of the 32nd International Conference on Machine Learning, Lille, France, 6–11 July 2015; pp. 448–456. [Google Scholar]
- Feng, Q.; Chen, B.; Niu, B.; Ren, Y.; Wang, Y.; Liu, J. Remote sensing recognition of urban villages based on multiscale dilated convolutional neural networks. J. Agric. Mach. 2021, 52, 181–189. [Google Scholar]
- Liu, T.; Chen, T.; Niu, R.; Plaza, A. Landslide Detection Mapping Employing CNN, ResNet, and DenseNet in the Three Gorges Reservoir, China. IEEE J. Sel. Top. Appl. Earth Obs. Remote Sens. 2021, 14, 11417–11428. [Google Scholar] [CrossRef]
- He, K.; Zhang, X.; Ren, S.; Sun, J. Deep residual learning for image recognition. In Proceedings of the 2016 IEEE Conference on Computer Vision and Pattern Recognition (CVPR), Las Vegas, NV, USA, 27–30 June 2016; pp. 770–778. [Google Scholar]
- Wang, Z.; Xu, S.; Liu, J.; Wang, Y.; Ma, X.; Jiang, T.; He, X.; Han, Z. A Combination of Deep Autoencoder and Multi-Scale Residual Network for Landslide Susceptibility Evaluation. Remote Sens. 2023, 15, 653. [Google Scholar] [CrossRef]
- Ji, S.; Yu, D.; Shen, C.; Li, W.; Xu, Q. Landslide detection from an open satellite imagery and digital elevation model dataset using attention boosted convolutional neural networks. Landslides 2020, 17, 1337–1352. [Google Scholar] [CrossRef]
- Dong, Z.; An, S.; Zhang, J.; Yu, J.; Li, J.; Xu, D. L-Unet: A Landslide Extraction Model Using Multi-Scale Feature Fusion and Attention Mechanism. Remote Sens. 2022, 14, 2552. [Google Scholar] [CrossRef]
- Chen, W.; He, J.; Liu, G. Hyperspectral Image Classification Based on Convolutional Neural Network with Attention Mechanism. Adv. Laser Optoelectron. 2022, 59, 172–179. [Google Scholar]
- Skourt, B.A.; El Hassani, A.; Majda, A. Mixed-pooling-dropout for convolutional neural network regularization. J. King Saud Univ-Comput. Inf. Sci. 2022, 34, 4756–4762. [Google Scholar] [CrossRef]
- Tekin, S.; Çan, T. Slide type landslide susceptibility assessment of the Büyük Menderes watershed using artificial neural network method. Environ. Sci. Pollut. Res. 2022, 29, 47174–47188. [Google Scholar] [CrossRef]
- Wang, B.; Lin, Q.; Jiang, T.; Yin, H.; Zhou, J.; Sun, J.; Wang, D.; Dai, R. Evaluation of linear, nonlinear and ensemble machine learning models for landslide susceptibility assessment in Southwest China. Geocarto Int. 2022, 2152493. [Google Scholar] [CrossRef]


| Data | Source | Usage Description |
|---|---|---|
| Disaster points | Spatial Distribution Dataset of Geological Hazard Points (http://www.resdc.cn/data.aspx?DA-TAID=290, accessed in 2019) | Include seven major types of geological disaster points: collapse, subsidence, mudflows, ground settlement, ground fissures, landslides, slopes. |
| Lithology | Spatial Distribution Dataset of Geological Lithology in China (https://www.resdc.cn/data.aspx?DATAID=307, accessed in 2018) | Include over 8000 geological and lithological units nationwide. |
| NDVI | Spatial Distribution Dataset of annual NDVI in China (http://www.gisrs.cn/infofordata?id=05b59e69-ba30-4454-a9c0-67ca038fb9f3, accessed in 2018) | Generated using the maximum value synthesis method based on SPOT/VEGETATION NDVI satellite data. |
| Annual rainfall | Spatial Interpolation Dataset of Annual Precipitation in China since 1980 | Generated through spatial interpolation based on daily observation data from meteorological stations. |
| DEM | The First National Geographical Census | The resolution of DEM is 30 m 30 m, which is used to generate slope and aspect data. |
| Residential points | The First National Geographical Census | Formulate the statistical results for residential land and facility elements of 10 km × 10 km regular geographic grid units. |
| Road data | OpenStreetMap | Include national roads, provincial roads, township roads, county roads, highways, and railways. |
| River data | OpenStreetMap | OSM is an open-source map data community that provides data on roads, water systems, buildings, and other features. |
| Space Size | ||||
|---|---|---|---|---|
| 3 × 3 | 0.7052 | 0.7160 | 0.6802 | 0.6976 |
| 5 × 5 | 0.7457 | 0.7297 | 0.7803 | 0.7542 |
| 7 × 7 | 0.7505 | 0.7338 | 0.7861 | 0.7591 |
| 9 × 9 | 0.7524 | 0.7235 | 0.8170 | 0.7674 |
| 11 × 11 | 0.7351 | 0.7054 | 0.8073 | 0.7529 |
| Model | Class | Area (km2) | Landslide Point (pcs) | Class Accuracy (pcs/km2) |
|---|---|---|---|---|
| DCNN | Very low | 10,183.7646 | 27 | 0.003 |
| Low | 5354.8929 | 51 | 0.010 | |
| Moderate | 6540.3333 | 121 | 0.019 | |
| High | 9584.1846 | 506 | 0.053 | |
| Very high | 7017.5169 | 1024 | 0.146 | |
| DSRCNN | Very low | 10,442.5992 | 23 | 0.002 |
| Low | 5352.5862 | 47 | 0.009 | |
| Moderate | 8339.3487 | 185 | 0.022 | |
| High | 8108.6193 | 467 | 0.058 | |
| Very high | 6437.5389 | 1007 | 0.156 | |
| DDRCNN | Very low | 10,656.0567 | 23 | 0.002 |
| Low | 5464.872 | 34 | 0.006 | |
| Moderate | 6874.4295 | 151 | 0.022 | |
| High | 9516.5055 | 482 | 0.051 | |
| Very high | 6168.8286 | 1039 | 0.168 | |
| DADRCNN | Very low | 9952.3026 | 11 | 0.001 |
| Low | 6635.007 | 54 | 0.008 | |
| Moderate | 6722.901 | 125 | 0.019 | |
| High | 9336.555 | 510 | 0.055 | |
| Very high | 6033.9267 | 1029 | 0.171 |
| Model | Class | Area (km2) | Landslide Point (pcs) | Class Accuracy (pcs/km2) |
|---|---|---|---|---|
| SVM | Very low | 7663.4469 | 8 | 0.001 |
| Low | 7629.7275 | 67 | 0.009 | |
| Moderate | 7879.8537 | 174 | 0.022 | |
| High | 9535.1481 | 517 | 0.054 | |
| Very high | 5972.5161 | 963 | 0.161 | |
| DADRCNN | Very low | 9952.3026 | 11 | 0.001 |
| Low | 6635.007 | 54 | 0.008 | |
| Moderate | 6722.901 | 125 | 0.019 | |
| High | 9336.555 | 510 | 0.055 | |
| Very high | 6033.9267 | 1029 | 0.171 |
Disclaimer/Publisher’s Note: The statements, opinions and data contained in all publications are solely those of the individual author(s) and contributor(s) and not of MDPI and/or the editor(s). MDPI and/or the editor(s) disclaim responsibility for any injury to people or property resulting from any ideas, methods, instructions or products referred to in the content. |
© 2023 by the authors. Licensee MDPI, Basel, Switzerland. This article is an open access article distributed under the terms and conditions of the Creative Commons Attribution (CC BY) license (https://creativecommons.org/licenses/by/4.0/).
Share and Cite
Ma, Y.; Xu, S.; Jiang, T.; Wang, Z.; Wang, Y.; Liu, M.; Li, X.; Ma, X. Learning a Deep Attention Dilated Residual Convolutional Neural Network for Landslide Susceptibility Mapping in Hanzhong City, Shaanxi Province, China. Remote Sens. 2023, 15, 3296. https://doi.org/10.3390/rs15133296
Ma Y, Xu S, Jiang T, Wang Z, Wang Y, Liu M, Li X, Ma X. Learning a Deep Attention Dilated Residual Convolutional Neural Network for Landslide Susceptibility Mapping in Hanzhong City, Shaanxi Province, China. Remote Sensing. 2023; 15(13):3296. https://doi.org/10.3390/rs15133296
Chicago/Turabian StyleMa, Yu, Shenghua Xu, Tao Jiang, Zhuolu Wang, Yong Wang, Mengmeng Liu, Xiaoyan Li, and Xinrui Ma. 2023. "Learning a Deep Attention Dilated Residual Convolutional Neural Network for Landslide Susceptibility Mapping in Hanzhong City, Shaanxi Province, China" Remote Sensing 15, no. 13: 3296. https://doi.org/10.3390/rs15133296