Article

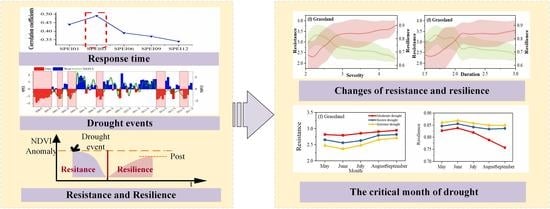
Changes in Vegetation Resistance and Resilience under Different Drought Disturbances Based on NDVI and SPEI Time Series Data in Jilin Province, China

1
College of Geographical Sciences, Shanxi Normal University, Taiyuan 030031, China
2
College of Land Science and Technology, China Agricultural University, Beijing 100083, China
3
Key Laboratory for Agricultural Land Quality Monitoring and Control, Ministry of Natural Resources, Beijing 100035, China
4
Land Consolidation and Rehabilitation Center, Ministry of Natural Resources of the People’s Republic of China, Beijing 100035, China
*
Author to whom correspondence should be addressed.
Remote Sens. 2023, 15(13), 3280; https://doi.org/10.3390/rs15133280
Submission received: 14 May 2023 / Revised: 16 June 2023 / Accepted: 23 June 2023 / Published: 26 June 2023

Abstract

:
Extreme drought is increasing in frequency and intensity in many regions globally. Understanding the changes in vegetation resistance and resilience under aggravated drought is essential for maintaining regional ecosystem stability. In this study, a drought event–vegetation response framework was developed to explore vegetation resistance and resilience changes. The normalized difference vegetation index (NDVI) was correlated with the standardized precipitation evapotranspiration index (SPEI) at multiple timescales to screen out the vegetation response time to drought. Then, the SPEI for the response time was detected using run theory to identify drought events during the period 2000–2017. Finally, drought-induced NDVI anomaly changes were identified using a sliding window to explore the changes in resistance and resilience to drought. This study focuses on Jilin province, China, which contains a famous environmentally vulnerable area. The results illustrate that the response time of vegetation to drought is 3 months. The northwest of Jilin province is considered to be drought-vulnerable because it has suffered the most drought events, i.e., 19–21 times, with severities in the range of 2.6–3.2 and durations in the range of 3.6–4.1 months. Grassland shows the weakest resistance and the strongest resilience, and tree cover shows the strongest resistance and the weakest resilience under severe drought disturbance among all vegetation. As the severity and duration of drought increase, the resistance decreases, and the resilience increases. During the growing season, the drought from May to July significantly impacts the vegetation resistance. Drought occurring from June to July has much less impact on resilience. Drought in August to September has less impact on resistance and a more significant impact on resilience. The results of this study may increase our knowledge regarding the response of vegetation to drought and guide ecosystem stability restoration.

Graphical Abstract

1. Introduction

The frequency and intensity of drought events have increased significantly in recent decades due to climate change and global warming. Moreover, the Intergovernmental Panel on Climate Change (IPCC) predicts that the frequency and intensity of drought events in the future will continue to increase. Drought threatens regional ecosystem stability in terms of functions and associated services, such as species diversity and the carbon cycle [1,2]. Extreme drought significantly reduces the productivity of vegetation and causes widespread vegetation die-off, increasing regional ecosystem degradation and desertification. It presents tremendous challenges to the stability and restoration of ecosystems [3,4,5]. The resistance and resilience of vegetation are fundamental driving forces in maintaining ecosystem stability [6,7]. Theoretical guidance for assessing ecological stability and ecological restoration is provided by monitoring vegetation changes during periods of drought.
Resistance reflects the persistence capacity of a system during a disturbance [8,9]. Resilience quantifies the post-disturbance recovery of an ecosystem property to the equilibrium state [10,11,12]. Moreover, resistance quantifies the direct impact of drought on ecosystem stability, focusing on the state of the ecosystem during drought disturbances. Resilience defines the state of ecosystem functions after a disturbance. Resistance and resilience consider the concurrent and delayed effects of drought on the ecosystem [6]. Ecosystems with higher stability have higher resistance and stronger resilience under drought disturbances [13]. Some studies have used two indicators to investigate ecosystem stability. In one study, the grassland aboveground net primary production (ANPP) was compared in drought and non-drought years, and it was found that the decline in resistance did not affect the rapid recovery of the grassland [14]. In another study, tree rings were used as indicators of tree response to drought to explore the resistance and resilience of different tree types [15,16]. Van et al., used the responses of experimental plant communities, which differ in behavior in response to a drought event, to disentangle the effects of diversity on resistance and resilience [17]. Vegetation growth indicators include aboveground biomass [18], biological abundance, and tree rings [19]. These studies are based on a small spatial scale and simulation of environmental disturbances via experimental operations. Nevertheless, it is difficult to quantify the resistance and resilience of vegetation on large spatial scales in natural conditions. The key to solving this problem is to obtain large-scale coverage of historical data that characterize drought and vegetation dynamics [20].
Time series data based on satellite remote sensing (RS) make it possible to infer resistance and resilience aspects with extensive coverage, long-term accumulation, and high temporal resolution [21]. There are two methods for evaluating ecological resilience based on remote sensing. One involves integrating multiple indicators to build a comprehensive evaluation model of resilience. Remote sensing provides some of the indicators in the integrated model [22,23]. For example, the resilience of forests is calculated via the sensitivity and adaptability of vegetation [24]. This approach can reflect the properties of vegetation in multiple dimensions. However, it is difficult to explain the performance of resilience in terms of the exact type of disturbance. Another method uses time series remote sensing to monitor vegetation dynamics, and compares the response process of vegetation to specific disturbance events before and after extreme events to construct a resilience evaluation framework [25,26]. For example, remote sensing can be used to obtain the resilience characteristics of vegetation under specific drought events, including recovery speed and recovery time. Compared with the previous method, this method can clearly reveal the interaction between drought and vegetation [27]. In general, previous studies have focused on resistance and resilience under a specific drought event [28]. In the context of the increasing frequency and severity of drought, global carbon trends, and decreasing vegetation productivity, it is still unclear whether and how the resistance and resilience of vegetation have changed. Therefore, the resistance and resilience changes of different ecosystems under drought disturbance could guide us in adopting different ecosystem management measures to cope with future drought events.
Consequently, the overall objective of this paper was to explore changes in resistance and resilience under drought events over 18 years (2000–2017). NDVI and SPEI time series data from 2000 to 2017 were adopted to characterize the drought events and the vegetation dynamic response, respectively, in Jilin province, China. The primary objectives of this study are (1) to determine the response time of vegetation to drought via correlation analysis between the time series NDVI and the multiple timescale SPEI; (2) to identify drought events using run theory during the period 2000–2017; (3) to quantify the resistance and resilience of vegetation after each drought event based on sliding-window detection. From the results of this study, comprehension of the regulation mechanism of drought over vegetation might be enhanced, which would provide support for regional ecosystem restoration and stability in drought-prone environments.

2. Materials

2.1. Study Area

Jilin province is located in northeast China, with an area of approximately 18.74 × 10⁴ km2, between 121°38′–131°19′E and 40°50′–46°19′N (Figure 1a). Jilin province is separated by the Black Mountains in the northwestern plains and other mountains in the southeastern plains. The study area has a temperate continental monsoon climate and is climatologically semi-arid, sub-humid, and humid (Figure 1c). From southeast to northwest, the annual total precipitation changes from 725 to 375 mm, and the annual mean temperature is 5.9 °C. The annual maximum temperature is 22 °C, and the annual minimum temperature is −19 °C. The annual actual evapotranspiration is distributed from northwest to southeast from 1200 mm to 1800 mm in open water [29]. There are many rivers in the central and southern regions (Figure 1c). The dominant vegetation types are crops, herbaceous plants, forests, and shrubs (Figure 1b). The growing season in Jilin province is from May to September [30]. The soil types in Baicheng and Songyuan are mainly calcareous soil, primordial soil, and saline-alkaline soil. Siping and Changchun are composed of semi-leached soil, and Baishan, Yanbian, and Tonghua are dominated by leached soil (Figure 1d).

2.2. Data Sources and Preprocessing

SPEI data for the period 2000–2017 were used to characterize the regional drought. Compared with the standardized precipitation index (SPI), which solely relies on precipitation, the SPEI reflects drought more comprehensively through precipitation and temperature [31]. The SPEI was calculated by estimating the “climate water balance”, which measures the deviation of precipitation and potential evapotranspiration. Then, the SPEI was adapted to a probability distribution to covert the origin values into comparable normalized units in space and time [24,32]. The potential evapotranspiration was determined using the land surface temperature via the Thornthwaite model [33]. The monthly precipitation and temperature raster data were retrieved from the National Qinghai-Tibet Plateau Science Data Center (http://data.tpdc.ac.cn/zh-hans/ (accessed on 30 September 2021)) for the years 2000 to 2017. The 1-, 3-, 6-, 9-, and 12-month SPEI was calculated using the “climate water balance” algorithm in R language. The 1-, 3-, 6-, 9-, and 12-month SPEI timescales were chosen in order to filter the response time. Different monthly SPEI values represent the accumulation of the water deficit and surplus for the previous several months [34,35]. Therefore, 1 month, 3~6 months, and 9~12 months were used to represent monthly, seasonal, and long-term drought, respectively [35]. The SPEI was aggregated at multiple timescales with 1 km spatial resolution and a monthly time step, which was used to determine the vegetation response time to water shortages and identify drought events.
The NDVI is strongly correlated with the leaf area index (LAI) and biomass of the vegetation, which symbolize the vegetation dynamics [36,37]. In this paper, the NDVI was generated from MOD09A1, the surface reflectance product with 500 m spatial resolution and temporal resolution of 8 days from the Moderate-resolution Imaging Spectroradiometer (MODIS) (https:/search.earthdata.nasa.gov/search (accessed on 15 September 2021)). The NDVI was calculated based on the near-infrared and red band using the Google Earth Engine (GEE) platform. Monthly NDVI was aggregated with the maximum value composite and resampled to 1 km to match the spatio-temporal resolution of the SPEI. The monthly NDVI was correlated with multi-scale SPEI analysis to determine the response time of vegetation to drought.
The anomaly of the NDVI is comparable data after removing the seasonal changes, which indicates the degree of deviation of the NDVI from the normal level in the same period. The seasonal change in the NDVI, due to phenology mask signals of resistance and resilience [22], makes it difficult to specify a constant as the normal level of vegetation. The average value of the NDVI during the same period over many years was taken as the normal level, while seasonal changes were removed to obtain the anomaly series. Therefore, all of the NDVI values in the study period are comparable. The NDVI anomaly [38], ΔNDVI (i, t), was calculated as:
N D V I ( i , t ) = N D V I ( i , t ) m e a n u m [ N D V I ( i , u ) ] s d u m [ N D V I ( i , u ) ]
where NDVI (i, t) is the NDVI of grid i at date t. m is a month of the year. m e a n u m [ N D V I ( i , u ) ] and s d u m [ N D V I ( i , u ) ] are the mean and standard deviation of the NDVI for grid i over all dates, u, across the entire period (2000–2017) falling within month m, respectively. The anomaly is dimensionless on a scale for which the interval is one standard deviation of the NDVI from grid i and month m during the drought. An anomaly of zero represents a baseline value indicating the growth level of vegetation in a typical environment without drought disturbance. A positive anomaly with an NDVI higher than the baseline indicates that the vegetation is growing better than normal, while a negative anomaly indicates worse growth than normal. The greater the absolute value of the anomaly, the farther the deviation from the baseline. The NDVI anomaly with a resolution of 8 days and 1 km during the period 2000–2017 was generated to calculate the resistance and resilience of vegetation under drought events.
According to the Food and Agriculture Organization (FAO) typology, the vegetation cover type data were obtained from European Space Agency Climate Change Initiative-Land Cover (ESA CCI-LC) products in 2015 with a 300 m spatial resolution. Most of the study area is covered by tree cover (40%), herbaceous plants (39%), and cropland (13%). Comparing the annual ESA CCI-LC maps, the vegetation area change from 2000 to 2015 is less than 10%. Therefore, the vegetation cover was assumed to basically remain constant during the study period. Two non-vegetation land cover classes, i.e., urban areas and water bodies, were omitted, as they show less correlation to drought events. The mosaic, tree, and herbaceous cover types were classed into tree and herbaceous areas according to areas comprising more than 50% in each pixel. The six remaining classes are listed in Figure 1b. The land cover was reprojected into Albers equal area projection with the ellipsoid WGS-84. In the southeast part of the study area, the land cover is dominated by tree cover, while cropland and herbaceous cover dominate in the northwest.

3. Methods

In this study, a drought event–vegetation response joint framework was proposed to explore changes in vegetation resistance and resilience to drought, as shown in Figure 2. The procedure is as follows: (a) determine the response time of vegetation to drought based on the SPEI and NDVI from 2000 to 2017; (b) identify drought events using run theory from the SPEI timescale corresponding to the response time; (c) quantify the resistance and resilience of vegetation to drought, with which the NDVI changes under drought events are retrieved from the sliding window detection.

3.1. Response Time of Vegetation to Drought

Pearson correlation analysis was used to determine the response time, equal to a month corresponding to the maximum correlation coefficient between the SPEI at diverse timescales and the monthly NDVI, as shown in Figure 2. The correlation analysis of the monthly NDVI and SPEI series in the i-th month of the year is as follows:
R j i = corr ( N D V I i , S P E I j i )   i = 5 , 6 9 ,   j = 1 , 3 , 6 , 9 , 12
where R is the correlation coefficient and j represents the diverse timescales. The NDVI reflects vegetation growth, and the SPEI at different timescales represents the drought caused by the deficit of water accumulation in different months. When the correlation between the two is higher, i.e., when the SPEI is smaller, the smaller the NDVI. This shows that the more serious the water deficit is at this scale, the worse the vegetation growth will be. This means that vegetation growth is more sensitive to drought at this scale. A higher value of R indicates that vegetation growth is more sensitive to drought, and vice versa. Eventually, the SPEI timescale with the maximum R was taken as the vegetation response time to drought. The significance of the correlation coefficient was tested using the t-test. Then, the correlation value with a significance level above 0.01 was retained for subsequent analysis. The response time implies the timescale at which vegetation is most sensitive to drought [20]. The SPEI at the response time was used as the data source to identify drought events that were most likely to affect vegetation growth.

3.2. Run Theory Identify Drought Events and Drought

Identifying drought events is a prerequisite for exploring the changes in vegetation resistance and resilience after drought events. Run theory was utilized to identify drought events that affect vegetation activity based on the SPEI timescale of the response time. Run theory was proposed by Yevjevich et al. [39] and is commonly used to extract drought events. According to run theory, a drought event is represented by a series of consecutive SPEI values that are less than a given threshold [40]. In this study, a drought event was defined as having a negative SPEI for at least three months, and the lowest SPEI value was less than −1 [41]. This definition includes the impact of the duration and severity of drought events on vegetation growth. For drought duration, low-intensity persistent water shortage inhibits the growth of vegetation. The physiological structure of vegetation is destroyed by severe and chronic water deficits. Gradually, the vegetation will lose activity further. Therefore, we considered the duration and severity of drought events from a vegetation stress perspective. The duration is the difference between the beginning and the end of the drought event, which was detected using run theory. The severity is the cumulative value of the SPEI during the drought event. The duration and severity of each drought event were used as variables to explore the resilience and resistance of vegetation after drought events.
To explore the spatial and temporal disturbance of the drought in the vegetation growing season, the monthly drought severity was classified into three categories based on the SPEI value, i.e., moderate drought, severe drought, and extreme drought [42], as shown in Table 1.

3.3. Quantifying Vegetation Resistance and Resilience Based on Sliding Window Detection

The change in the 8-day NDVI anomaly after a drought event was considered the response of vegetation to the drought event. Briefly, the NDVI anomaly sequence was searched using a sliding window from the start time of the drought event, which was identified using run theory until the start of the next drought event. The change in the NDVI anomaly during the search process was recorded as a response and was divided into drop and recovery processes according to the valley value to quantify the resistance and resilience.
The process was divided into a retrieving process and a quantifying process. The process details are as follows:
  • Time stamp: The start time of all drought events experienced for the NDVI anomaly sequence was marked as the beginning of each retrieve.
  • Retrieve changes: The NDVI anomaly sequence was retrieved using 3 sliding windows. Then, all negative values appearing in the window were recorded, including the NDVI anomaly value, the corresponding time, and the associated drought event. The sliding window continued to retrieve backward until the values in the window no longer changed. The recorded value of the NDVI anomaly was an NDVI change. These represented associated drought events including the severity and duration of the drought. Negative NDVI anomalies indicated a decline in vegetation vitality.
  • Iteration: A retrieval process was completed in step 2, and then the sliding window repeated step 2 until the sequence ended.
  • Screening: Those NDVI changes whose minimum value was less than two times the standard deviation (negative value) of the original NDVI anomaly sequence were retained as the NDVI response to drought. Otherwise, they were deleted as noise.
  • The minimum value of the response of the NDVI to drought was selected as the valley value, which was used to calculate the vegetation resistance.
Resistance was calculated as the immediate drop in the NDVI following the drought event [9,43].
Resistance = y y y v a l l e y
where y is the mean NDVI anomaly without drought events. yvalley is the valley value of a change in the NDVI (resistance and resilience process). The formula implies that the greater the drop in the NDVI, the weaker the resistance, and vice versa.
Resilience is the state of recovery of vegetation disturbed by drought back to a similar state before the disturbance. The formula is as follows:
Resilience = y p o s t y  
where ypost indicates the NDVI anomaly returning to a stable state after being disturbed. The resilience index converges to 1 for a full recovery.
Finally, a group including severity, duration, resistance, and resilience was formed under the drought event–vegetation response framework. Severity and duration are the characteristics of drought events suffered by vegetation. Resistance and resilience represent the response of vegetation under the disturbance of drought events and were used to explore the changes in vegetation resistance and resilience to drought in this study.
To explore the response of vegetation to drought, trajectory changes were plotted between the SPEI-03 and NDVI anomaly for sites covered by different vegetation types. The site information is shown in Table 2.

4. Results

4.1. Response Time of Vegetation to Drought

The spatial distribution of the correlation between NDVI and multi-scale SPEI is shown in Figure 3a. SPEI-01, SPEI-03, SPEI-06, SPEI-09, and SPEI-12 indicate the correlation between the NDVI and the SPEI at different timescales, i.e., 1 month, 3 months, 6 months, 9 months, and 12 months, respectively. A significant positive correlation was shown across the entire area for all timescales. Whatever the timescale, the spatial distribution of the correlation coefficient progressively decreased from northwest to southeast in Jilin province. The highest correlation was observed in Baicheng city and Songyuan city at 0.38–0.54; these areas were located in semi-arid regions. In addition, the amount of annual average evapotranspiration was four times the value of the precipitation, leading to severe drought. The correlation coefficient varied from 0.35 to 0.51 in the central Jilin province, including Changchun city, Siping city, Jilin city, and Liaoyuan city. The lowest correlation of 0.29–0.46 was identified in the southeast, including Tonghua city, Baishan city, and Yanbian Korean autonomous prefecture, where most areas belong to the humid region with abundant rainfall and snowmelt. The correlation between the SPEI and NDVI in the northwest part of the arid regions was higher than that in the southeast part of the humid regions. Therefore, in the northwest of the study area, the vegetation growth is more sensitive to drought and is restricted by drought.
The response time was determined by comparing the correlation coefficient density distribution on different timescales, as shown in Figure 3b. The mean r is the average value of the correlation coefficient at each time. The mean r exhibited an upward trend in SPEI-01, climbed up to a peak in SPEI-03, and tended to decrease in SPEI-12. The maximum of the mean r value was 0.49 for SPEI-03, which was 11.4%, 25.6%, 32.4%, and 44.1% higher than the values for SPEI-01 (0.44), SPEI-06 (0.39), SPEI-09 (0.37), and SPEI-12 (0.34), respectively. Therefore, the vegetation response time to drought is 3 months. Moreover, vegetation growth is more sensitive to the cumulative water status in the 3 months after the drought event.
The correlation coefficients of NDVI-SPEI among vegetation types are shown in Figure 4. For all vegetation types, the trend of the correlation coefficients increased and then decreased, climbing up to a peak for SPEI-03 at 0.5. The minimum value of r was 0.33 for SPEI-12. The r values of the cropland, herbaceous, mosaic natural vegetation, and grassland types were similar, and were higher than those of tree cover and shrub land. Vegetation was divided into weak and strong correlation groups based on the significant difference in r. A weak correlation group including tree cover and shrub land, in which the mean r was 0.35, exhibited that the sensitivity of vegetation to drought was lower than that of the other groups with values of 0.44, including cropland, herbaceous, mosaic natural vegetation, and grassland, whose growth was greatly affected by drought. In contrast, grassland growth was the most sensitive to drought, while tree cover growth was less susceptible to drought among all vegetation types.

4.2. Drought Events in Jilin Province from 2000 to 2017

4.2.1. Spatial Distribution of Drought Events

The drought events and characters including drought event frequency, duration, and severity were identified using run theory with SPEI-03, as shown in Figure 5. The number of drought events in the region ranged from 12 to 27 during the period 2000–2017, as shown in Figure 5a. The average duration of drought events was 1.5–3.8 months, and the severity varied from 2.0 to 4.8, as shown in Figure 5b,c. The number, duration, and severity of drought events were similar in spatial distribution, with higher values in the northwest and lower values in the southeast. Baicheng in the northwest experienced drought events 21 times, with the longest duration of 3.2 months and the worst drought with a severity of 4.1. There were 19 drought events, an average duration of 2.6 months, and an average severity of 3.6 in Songyuan. Areas with few drought events were located in the southeast, i.e., Baishan and Yanbian, with 13 and 17 events, respectively. Yanbian experienced the shortest duration of 1.9 months and the lowest drought with a severity of 2.3. Thus, Baicheng was the most vulnerable to drought in the Jilin province by suffering from much more severe, sustained, and frequent drought events. Songyuan is considered to be a drought-prone area next to Baicheng. Yanbian is the city or prefecture with slight, short-term, and occasional drought events.

4.2.2. Statistics of Drought Events in Vegetation

The characteristics of drought events among vegetation types are shown in Figure 6. This shows that the highest cumulative numbers of drought events from 2000 to 2017 were 19 in cropland, 17 in herbaceous and mosaic natural vegetation, and 15 in tree cover. The longest duration occurred in grassland at 2.7 months, followed by cropland at 2.6 months, shrubland at 2.5 months, herbaceous land at 2.3 months, and mosaic natural vegetation at 2.2 months in Figure 6b. The severity of drought for cropland, herbaceous land, and mosaic natural vegetation were 3.4, 3.3, and 3.2, respectively, while the severity for tree cover was 1.5 at the lowest value in Figure 6c. In summary, tree cover suffered the fewest drought events, the shortest duration, and the lowest severity. Therefore, tree cover was the least susceptible to drought, while cropland was the most susceptible to drought among all vegetation types.

4.3. Vegetation Resistance and Resilience under the Disturbance of Drought Events

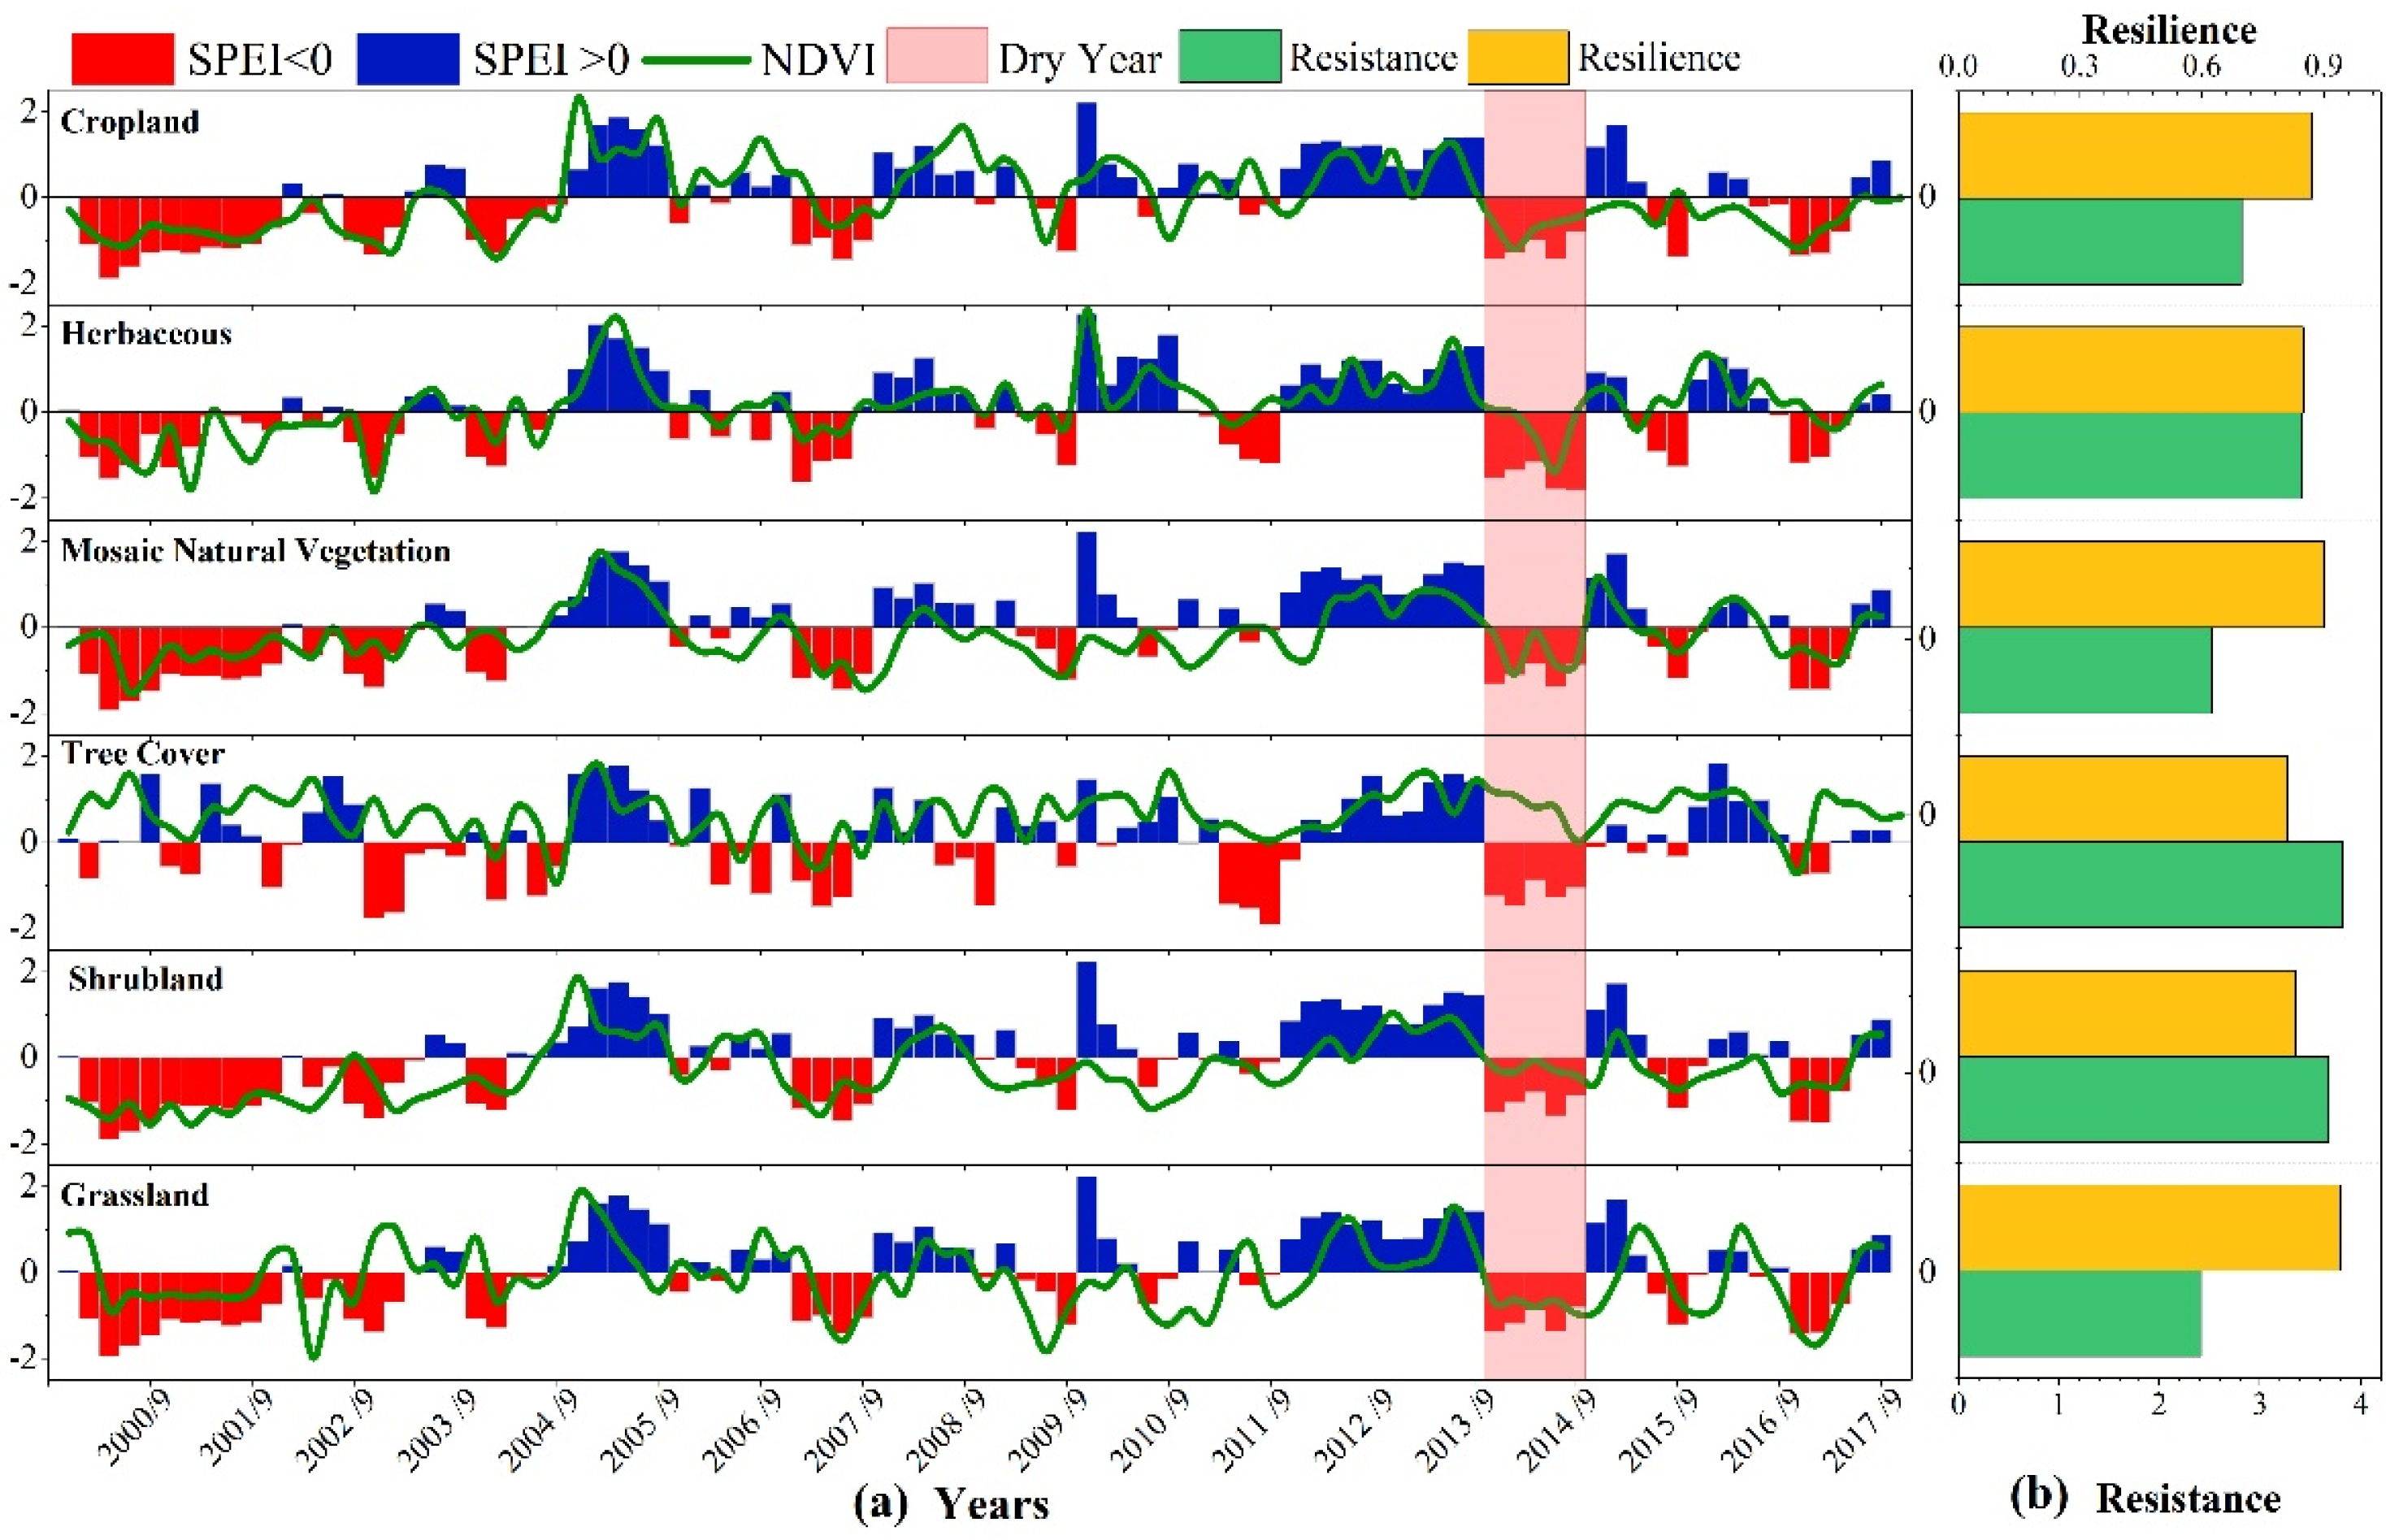
4.3.1. Differences in Vegetation Resistance and Resilience under Severe Drought Disturbance in 2014

The trajectory changes between SPEI-03 and the NDVI anomaly in sites covered by different vegetation types are shown in Figure 7a. The solid green line in Figure 7a is the standardized anomaly of the monthly NDVI. Vertical bars indicate the monthly SPEI, with a positive SPEI (blue) indicating a wet period and a negative SPEI (red) indicating a dry period. The figure shows that the NDVI anomaly decreased at the red SPEI and increased at the blue SPEI. The years of drought experienced by the sites (except for tree cover) were 2000–2002, 2004, 2007, 2014, and 2017, and the corresponding NDVI anomalies decreased at different magnitudes. This indicates that drought detected for SPEI-03 represents different degrees of restriction on vegetation growth. All sites experiencing drought events of the same degree were selected to explore the difference in vegetation resistance and resilience under the same drought disturbance. All vegetation experienced severe drought events (SPEI < −1.5) that lasted for 5 months in 2014. The resistance and resilience of vegetation under disturbance in 2014 are shown in Figure 7b. The highest resistance values were for tree cover at 3.82, shrub land at 3.68, herbaceous land at 3.42, cropland at 2.82, mosaic natural vegetation at 2.52, and grassland at 2.41. The highest resilience values were 0.94 for grassland, followed by 0.9 for mosaic natural vegetation, 0.87 for cropland, 0.85 for herbaceous land, 0.83 for shrub land, 0.81 for tree cover. In summary, tree cover showed the highest resistance and the worst resilience under severe drought disturbance, and grassland showed the lowest resistance and the greatest resilience.

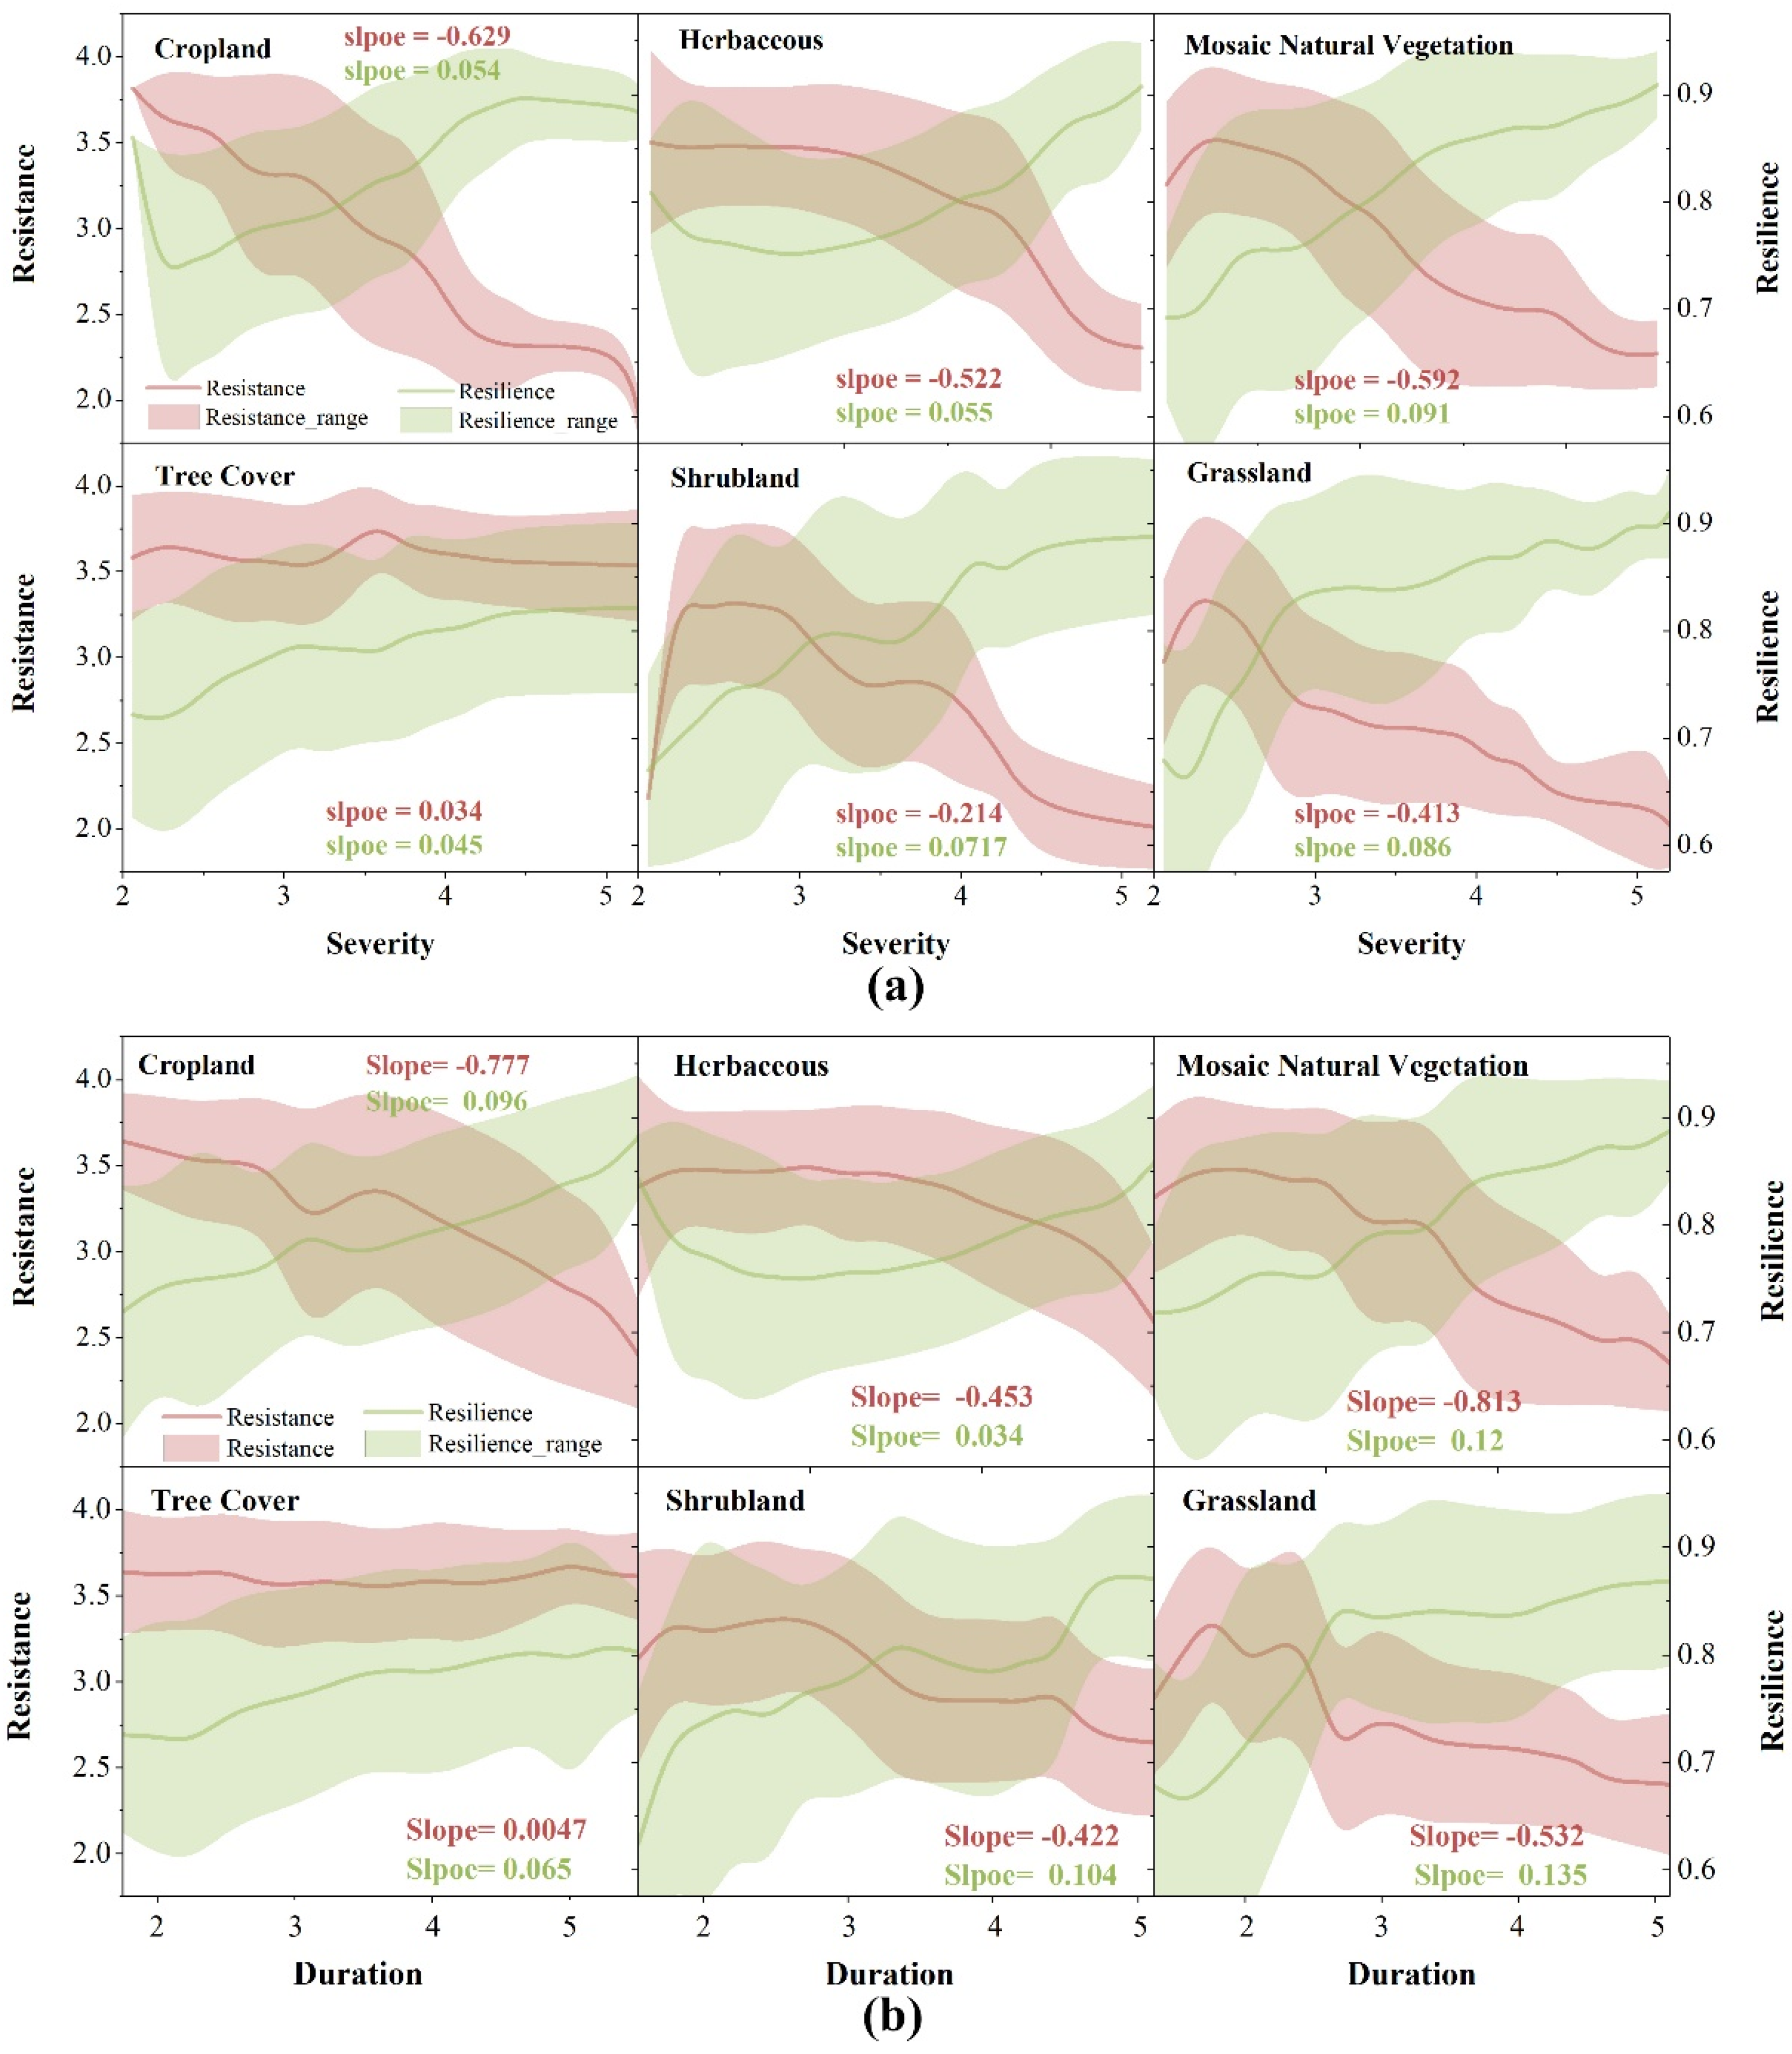
4.3.2. Changes in Vegetation Resistance and Resilience under Drought Events

After each drought event, changes in vegetation resistance and resilience under the severity of drought are shown in Figure 8a. As the drought severity was aggravated, the trend in resistance decreased with slope factors of −0.629, −0.522, −0.592, −0.214, and −0.413 for cropland, herbaceous land, mosaic natural vegetation, shrub land, and grassland, respectively. Among these, the resistance increased first and then decreased, peaking at severities of 2.12, 2.28, and 2.32, respectively, in mosaic natural vegetation, shrub land, and grassland. The severity corresponding to the peak indicated the most drought severity that the vegetation could tolerate and maintain normal growth. When the threshold was exceeded, the resistance gradually decreased. In contrast, the resistance of tree cover was rarely affected by the severity of drought, as indicated by the slope being 0.034, as shown by the tree cover in Figure 8a. Unlike the resistance, the resilience increased with the severity of drought for all vegetation types according to the resilience slope, which was greater than 0 in all vegetation types. Moreover, cropland, herbaceous land, and grassland decreased first and then increased. The drought severity corresponding to the valley point was 2.24, 2.68, and 2.15, respectively. Overall, as the severity of drought increased, the resistance decreased, while the resilience increased. The relationship between the resistance and the resilience was a trade-off for most vegetation types except tree cover. The resistance and resilience of tree cover remained relatively stable.
The effect of duration on vegetation resistance and resilience is shown in Figure 8b. The changes in resistance and resilience under the influence of duration were similar to the drought severity. As the drought duration increased, the general trend of resistance decreased. The resilience increased for most vegetation types except tree cover, while resistance and resilience both increased compared to the tree cover. Specifically, the resistance decreased monotonically in cropland. The resistance increased and then decreased for herbaceous land, mosaic natural vegetation, shrub land, and grassland. The turning points were 2.23, 1.92, 2.39, and 1.87, respectively, which suggest the maximum duration of drought for which vegetation can maintain normal growth. The resilience increased monotonically in cropland, mosaic natural vegetation, tree cover, and shrub land. The resilience decreased and then increased for herbaceous land and grassland. The turning points were 1.98 and 1.62, respectively. The turning points showed that the restoration of vegetation is the weakest during the drought state.

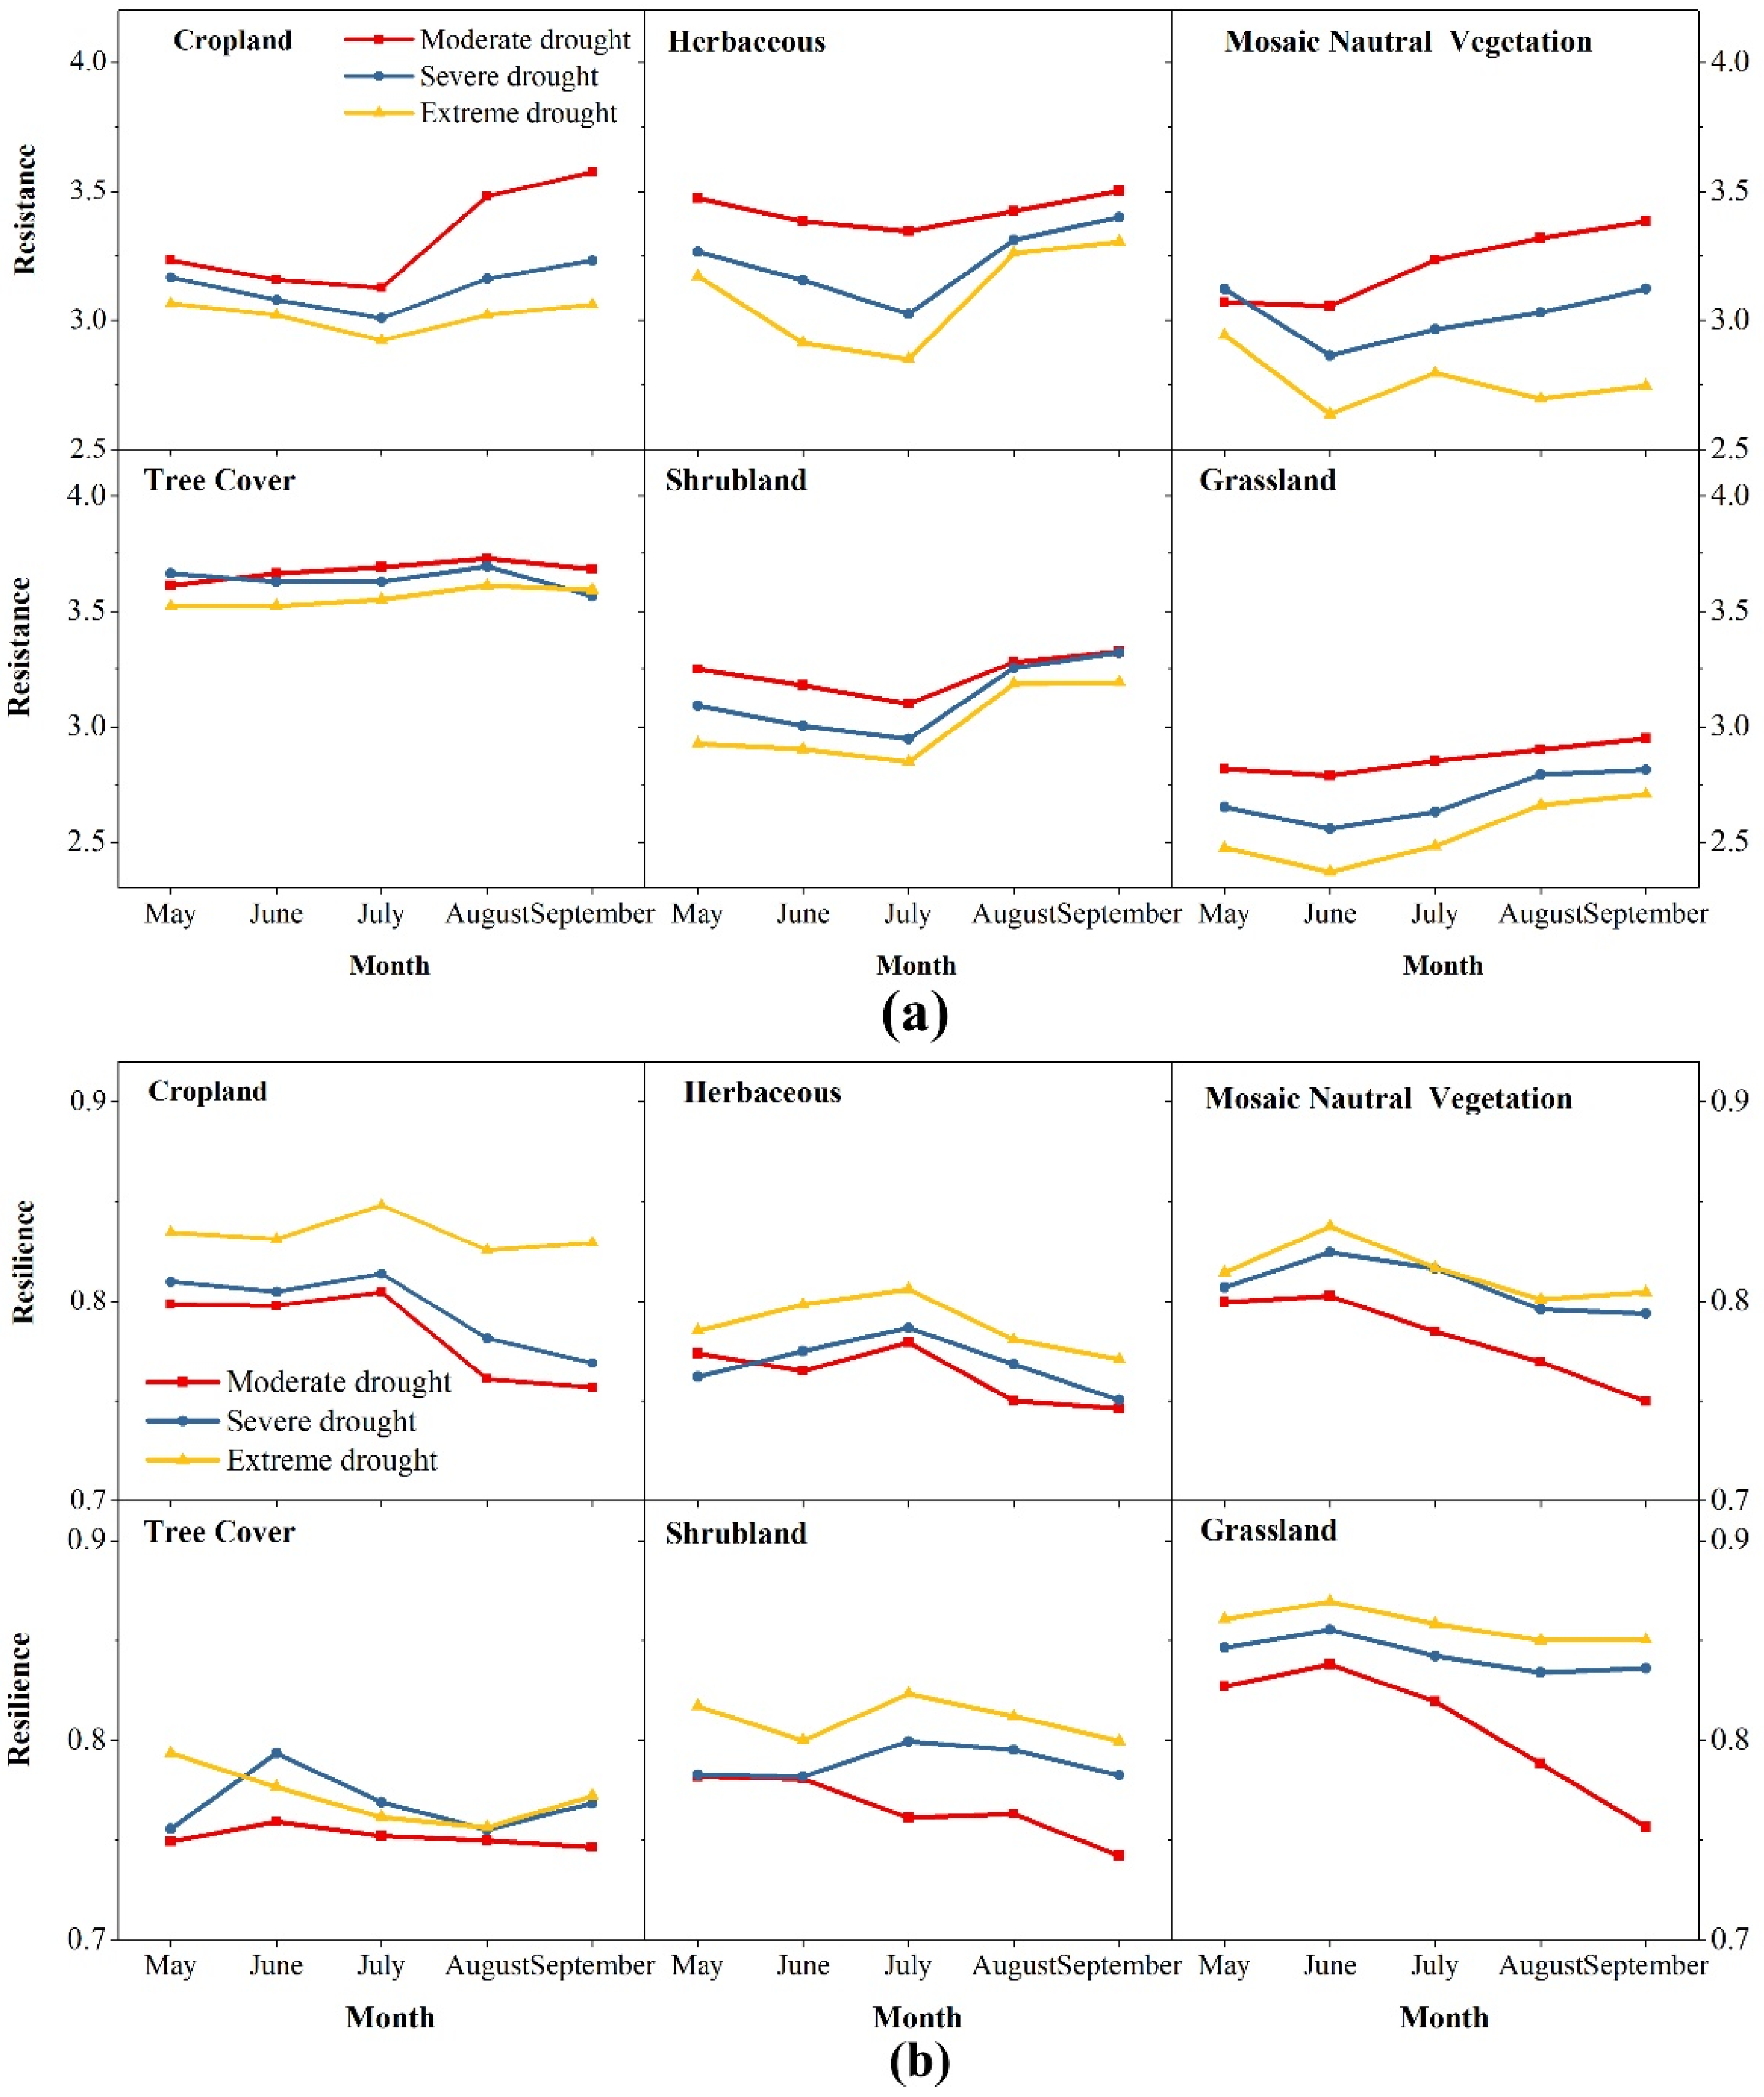
4.3.3. The Critical Month of Drought Affecting Resistance and Resilience

For the growing season, the resistance changes in the different vegetation types for 3 categories of drought severity are shown in Figure 9a. The resistance with moderate drought was the highest for all vegetation types, followed by severe drought, and the lowest was extreme drought. This demonstrates that the resistance decreased as the severity of drought intensified, which agrees with the results in Section 4.3.2. The tendency of resistance decreased first and then increased during the growing season for all vegetation types other than tree cover. No matter what kind of drought category occurred in July, the resistance was the lowest in cropland, herbaceous land, and shrub land, as illustrated by Figure 9a. The resistance was lowest for mosaic natural vegetation and grassland when the drought occurred in June. When the drought occurred in September, the resistance values of all vegetation types except tree cover were the largest. The highest was in August for tree cover, while the lowest was in May. For the different vegetation types, the months when resistance was most affected by drought were May for tree cover, June for mosaic natural vegetation and grassland, and July for cropland, herbaceous land, and shrub land. The months having the least impact on resistance were August for tree cover, and September for cropland, herbaceous land, mosaic natural vegetation, shrub land, and grassland.
The changes in resilience under drought severity during the growing season are shown in Figure 9b. No matter what kind of drought severity category, the resilience first increased and then decreased during the growing season. It showed an increase in resilience as the severity of drought intensified, which also agrees with the results in Section 4.3.2. When the drought occurred in July, the resilience was the highest for cropland and herbaceous land, while the highest value appeared in June for mosaic natural vegetation, tree cover, and grassland. The lowest resilience for the vegetation types other than tree cover was in September when the drought occurred, while the lowest for tree cover was in August. This suggests that compared with the drought in other months during the growing season, the months with the greatest impact on resilience were August for tree cover, and September for cropland, herbaceous land, mosaic natural vegetation, shrub land, and grassland. The months of drought occurrence with the least impact on resilience were July for cropland, herbaceous land, and shrub land, and June for mosaic natural vegetation, tree cover, and grassland.

5. Discussion

5.1. Differences in the Spatial Distribution of the Correlation between NDVI and SPEI

The vegetation growth in the northwest of Jilin province was more sensitive to drought than in the southeast. If a water deficit occurred, the vegetation growth in this area was more likely to be affected. In the study area, the distribution of precipitation and vegetation types might be the reason for this. From the southeast to the northwest, the annual precipitation decreases from 725 to 375 mm, and the annual evapotranspiration increases from 1200 mm to 1800 mm [44]. This leads to regional differences in the distribution of drought. Section 4.1 showed that closer to the northwest, the drought was more frequent, severe, and lasted longer [45]. Drought events often occurred in the northwest. This result is consistent with the research conclusion that the drier the area, the higher the correlation between SPEI and NDVI [46]. The results show that NDVI had the highest correlation with SPEI-03, implying that water accumulation at different timescales had different effects on vegetation growth, with the greatest effect occurring in the three months preceding growth. From the perspective of soil type, the soil texture of the calcareous soil and primordial soil in the northwest is coarser and less water-retaining than the semi-leached soil in the central region and the leached soil in the southeast [47]. Therefore, the loss of surface water by evaporation or infiltration in the northwest is more likely to cause drought than in the central and southeast regions. In terms of the distribution of vegetation types, Baicheng and Songyuan are dominated by mosaic natural vegetation and grassland. When the local surface water is insufficient, the plant growth will respond quickly to the shallow root system, which will eventually cause the vegetation growth to be more susceptible to the restriction of soil moisture [48]. In the central region of the study area, which is dominated by cropland, good water conditions for the growth of crops have been created by human activities such as irrigation and other field management measures [49,50]. The Changbai Mountains region, in the southeast of the study area, is dominated by tree cover, where the correlation between NDVI and SPEI was the lowest. In this region, water resources are sufficient. In addition to precipitation, in summer, the snow meltwater from the Changbai Mountain increases the regional water supply [51]. In addition, trees with more developed root systems can extend roots to the deep soil to absorb water. Therefore, in arid areas, vegetation growth has higher vulnerability and is restricted by water.

5.2. The Trade-Off Relationship between the Resistance and Resilience of Vegetation under Drought

When the severity or duration of drought increases, the vegetation resistance decreases. In this study, the resilience increased, as revealed in Section 4.3.2, which agreed with earlier studies [52,53]. Vegetation resistance to drought is achieved by increasing the water effective absorption and reducing water resource waste. With drought stress, vegetation obtains water by extending roots downward to absorb water from deeper soil. Otherwise, the stomata are closed to reduce the water loss caused by evapotranspiration, controlled by synthetic abscisic acid in the leaves [54]. The reason that vegetation resistance decreases with increasing severity is as follows: as the severity of drought intensifies, root cells shrink and even die due to lack of water, which hinders the process of vegetation water absorption. Excessive secretion of abscisic acid due to severe drought accelerates leaf shedding and interrupts the photosynthesis process for vegetation to create organic matter. Finally, the drought resistance of inactive vegetation will also decrease [55,56].
The mechanism of the decline in resistance caused by drought duration is different from the principle of severe aggravation of drought. Prolonged drought reduces the resistance of vegetation. Then, the long-term water shortage environment continues to shrink the stomata. The photosynthesis rate of vegetation declines, and the nutrients needed for the drought resistance process are insufficient, which leads to the decline of drought resistance [57]. When the severity and duration of drought events increase, vegetation resilience increases. The resilience stage of vegetation after drought mainly involves restoring the hydraulic conductivity of the xylem [58]. When soil moisture is restored, low transpiration reinjects water into the plug pipe to restore and make up the lost hydraulic conductivity. The blocked pipeline unit displays a greater recovery speed of the swelling pressure difference and a faster recovery speed of the vegetation hydraulic conductivity after encountering water. Otherwise, the more severe the drought experienced by the vegetation, the faster the growth rate and the stronger the photosynthetic capacity of the vegetation during the restoration stage to compensate for the damage caused by the drought. Finally, the resilience of the vegetation is stronger [59,60,61].

5.3. Merits and Limitations

In the developed framework depicted in Figure 2, the resistance and resilience of vegetation under drought stress were initially quantified by detecting the decrease and recovery of NDVI time series data. The SPEI timescale was selected, and the drought event was identified. Therefore, the process of vegetation change caused by drought events was simulated and compared with some earlier qualitative efforts. In addition, the stress-condition-response process of vegetation against drought was refined, while the change mechanisms of the different vegetation types under drought stress were revealed.
In this paper, the change in NDVI was detected after a drought event, which was regarded as the impact of drought on vegetation. However, other factors that caused NDVI changes were reduced due to the time correlation, which was challenging to eliminate. The distribution of vegetation types during the study period was assumed to be stable. Climate change and human activities change the distribution of vegetation [62], affecting the NDVI trajectory. In addition, other factors such as extreme climate, logging, and fires cause NDVI changes. In future studies, further research on the above issues is still needed.

6. Conclusions

In this paper, changes in the resistance and resilience of vegetation to drought events were explored during the period 2000–2017 in Jilin province, China, using a framework based on SPEI, NDVI, run theory, and sliding window detection. The results show that the 3-month SPEI of the multiscale SPEI from 1, 3, 6, and 9 months has the highest correlation to the NDVI at 0.44. This implies that water accumulation in the previous 3 months had the most significant impact on vegetation. Therefore, the 3-month SPEI is the best for determining the drought severity and duration suffered by the vegetation.
The northwest of Jilin province was revealed to be the most water-sensitive area with the highest correlation between NDVI and SPEI-03. Water resource management and supply are adopted to alleviate the regional seasonal drought.
The changes in resistance and resilience are consistent under drought severity and duration. Resistance gradually decreases as the severity and duration of the drought increase. Conversely, resilience increases under the same drought conditions. There is a trade-off between the resistance and resilience of vegetation in response to drought. The strongest and lowest resilience is found in tree cover, while the weakest and highest is in grassland. The lowest resistance is in June and July, indicating that the water supply in June and July is more critical for the average growth of vegetation than in September for all vegetation types in the study area. As the drought severity increases, the resistance of cultivated land decreases first and then increases. However, the resilience changes in the opposite direction. The resistance of cropland is the weakest in July, and the resilience is the strongest. Resistance and resilience have opposite performances in September. These results suggest that under the background of intensified and prolonged drought, the difference between resistance and resilience will be expressed among the various vegetation types in terms of the regional ecosystem stability.

Author Contributions

J.M. designed the study and participated in all the phases. C.Z. contributed to the direction of the ideas and helped with revisions. W.Y. provided guidance and improvement suggestions. S.L. and C.Y. made detailed revisions. C.C. and W.Y. helped with revisions. All authors have read and agreed to the published version of the manuscript.

Funding

This research was supported by the Ministry of Science and Technology of the People’s Republic of China. National Key R&D Program of China (No. 2022YFE0197300).

Data Availability Statement

Not applicable.

Acknowledgments

We are grateful for the research assistance from Dehai Zhu, Yongxia Yang, Jianyu Yang, Dongling Zhao, Xiaochuang Yao, Jinyou Li, Changzhi Wang, Zhengyu Liu, and Yuan Yao. The insightful and constructive comments of the anonymous reviewers are appreciated.

Conflicts of Interest

The authors declare no conflict of interest.

References

  1. Doughty, C.E.; Metcalfe, D.B.; Girardin, C.A.J.; Amézquita, F.F.; Cabrera, D.G.; Huasco, W.H.; Silva-Espejo, J.E.; Araujo-Murakami, A.; da Costa, M.C.; Rocha, W.; et al. Drought impact on forest carbon dynamics and fluxes in Amazonia. Nature 2015, 519, 78–82. [Google Scholar] [CrossRef] [PubMed] [Green Version]
  2. Han, D.; Wang, G.; Liu, T.; Xue, B.-L.; Kuczera, G.; Xu, X. Hydroclimatic response of evapotranspiration partitioning to prolonged droughts in semiarid grassland. J. Hydrol. 2018, 563, 766–777. [Google Scholar] [CrossRef]
  3. Greve, P.; Orlowsky, B.; Mueller, B.; Sheffield, J.; Reichstein, M.; Seneviratne, S.I. Global assessment of trends in wetting and drying over land. Nat. Geosci. 2014, 7, 716–721. [Google Scholar] [CrossRef]
  4. Liu, X.; Feng, X.; Ciais, P.; Fu, B.; Hu, B.; Sun, Z. GRACE satellite-based drought index indicating increased impact of drought over major basins in China during 2002–2017. Agric. For. Meteorol. 2020, 291, 108057. [Google Scholar] [CrossRef]
  5. Sinha, D.; Syed, T.H.; Famiglietti, J.S.; Reager, J.T.; Thomas, R.C. Characterizing drought in India using GRACE observations of terrestrial water storage deficit. J. Hydrometeorol. 2017, 18, 381–396. [Google Scholar] [CrossRef]
  6. Pennekamp, F.; Pontarp, M.; Tabi, A.; Altermatt, F.; Alther, R.; Choffat, Y.; Fronhofer, E.A.; Ganesanandamoorthy, P.; Garnier, A.; Griffiths, J.I. Biodiversity increases and decreases ecosystem stability. Nature 2018, 563, 109–112. [Google Scholar] [CrossRef] [Green Version]
  7. Schwalm, C.R.; Anderegg, W.R.; Michalak, A.M.; Fisher, J.B.; Biondi, F.; Koch, G.; Litvak, M.; Ogle, K.; Shaw, J.D.; Wolf, A. Global patterns of drought recovery. Nature 2017, 548, 202–205. [Google Scholar] [CrossRef]
  8. Nimmo, D.; Mac Nally, R.; Cunningham, S.C.; Haslem, A.; Bennett, A.F. Vive la résistance: Reviving resistance for 21st century conservation. Trends Ecol. Evol. 2015, 30, 516–523. [Google Scholar] [CrossRef]
  9. Pimm, S.L. The complexity and stability of ecosystems. Nature 1984, 307, 321–326. [Google Scholar] [CrossRef]
  10. Connell, J.H.; Sousa, W.P. On the evidence needed to judge ecological stability or persistence. Am. Nat. 1983, 121, 789–824. [Google Scholar] [CrossRef]
  11. Ingrisch, J.; Bahn, M. Towards a comparable quantification of resilience. Trends Ecol. Evol. 2018, 33, 251–259. [Google Scholar] [CrossRef] [PubMed]
  12. Meredith, H.R.; Andreani, V.; Ma, H.R.; Lopatkin, A.J.; Lee, A.J.; Anderson, D.J.; Batt, G.; You, L. Applying ecological resistance and resilience to dissect bacterial antibiotic responses. Sci. Adv. 2018, 4, eaau1873. [Google Scholar] [CrossRef] [PubMed] [Green Version]
  13. Gazol, A.; Camarero, J.J.; Vicente-Serrano, S.M.; Sánchez-Salguero, R.; Gutiérrez, E.; de Luis, M.; Sangüesa-Barreda, G.; Novak, K.; Rozas, V.; Tíscar, P.A. Forest resilience to drought varies across biomes. Glob. Chang. Biol. 2018, 24, 2143–2158. [Google Scholar] [CrossRef] [PubMed]
  14. Hoover, D.L.; Knapp, A.K.; Smith, M.D. Resistance and resilience of a grassland ecosystem to climate extremes. Ecology 2014, 95, 2646–2656. [Google Scholar] [CrossRef] [Green Version]
  15. Duncan, C.; Owen, H.J.; Thompson, J.R.; Koldewey, H.J.; Primavera, J.H.; Pettorelli, N. Satellite remote sensing to monitor mangrove forest resilience and resistance to sea level rise. Methods Ecol. Evol. 2018, 9, 1837–1852. [Google Scholar] [CrossRef] [Green Version]
  16. Vitasse, Y.; Bottero, A.; Cailleret, M.; Bigler, C.; Fonti, P.; Gessler, A.; Lévesque, M.; Rohner, B.; Weber, P.; Rigling, A. Contrasting resistance and resilience to extreme drought and late spring frost in five major European tree species. Glob. Chang. Biol. 2019, 25, 3781–3792. [Google Scholar] [CrossRef]
  17. Van Ruijven, J.; Berendse, F. Diversity enhances community recovery, but not resistance, after drought. J. Ecol. 2010, 98, 81–86. [Google Scholar] [CrossRef]
  18. Carlsson, M.; Merten, M.; Kayser, M.; Isselstein, J.; Wrage-Mönnig, N. Drought stress resistance and resilience of permanent grasslands are shaped by functional group composition and N fertilization. Agric. Ecosyst. Environ. 2017, 236, 52–60. [Google Scholar] [CrossRef]
  19. Merlin, M.; Perot, T.; Perret, S.; Korboulewsky, N.; Vallet, P. Effects of stand composition and tree size on resistance and resilience to drought in sessile oak and Scots pine. For. Ecol. Manag. 2015, 339, 22–33. [Google Scholar] [CrossRef] [Green Version]
  20. Vicente-Serrano, S.M.; Gouveia, C.; Camarero, J.J.; Beguería, S.; Trigo, R.; López-Moreno, J.I.; Azorín-Molina, C.; Pasho, E.; Lorenzo-Lacruz, J.; Revuelto, J. Response of vegetation to drought time-scales across global land biomes. Proc. Natl. Acad. Sci. USA 2013, 110, 52–57. [Google Scholar] [CrossRef] [Green Version]
  21. White, H.J.; Gaul, W.; Sadykova, D.; León-Sánchez, L.; Caplat, P.; Emmerson, M.C.; Yearsley, J.M. Quantifying large-scale ecosystem stability with remote sensing data. Remote Sens. Ecol. Conserv. 2020, 6, 354–365. [Google Scholar] [CrossRef] [PubMed] [Green Version]
  22. De Keersmaecker, W.; Lhermitte, S.; Tits, L.; Honnay, O.; Somers, B.; Coppin, P. A model quantifying global vegetation resistance and resilience to short-term climate anomalies and their relationship with vegetation cover. Glob. Ecol. Biogeogr. 2015, 24, 539–548. [Google Scholar] [CrossRef]
  23. Bao, Z.; Shifaw, E.; Deng, C.; Sha, J.; Li, X.; Hanchiso, T.; Yang, W. Remote sensing-based assessment of ecosystem health by optimizing vigor-organization-resilience model: A case study in Fuzhou City, China. Ecol. Inform. 2022, 72, 101889. [Google Scholar] [CrossRef]
  24. Huang, K.; Xia, J. High ecosystem stability of evergreen broadleaf forests under severe droughts. Glob. Chang. Biol. 2019, 25, 3494–3503. [Google Scholar] [CrossRef] [PubMed]
  25. Peng, L.; Wu, H.; Li, Z. Spatial–Temporal Evolutions of Ecological Environment Quality and Ecological Resilience Pattern in the Middle and Lower Reaches of the Yangtze River Economic Belt. Remote Sens. 2023, 15, 430. [Google Scholar] [CrossRef]
  26. Jiang, H.; Song, L.; Li, Y.; Ma, M.; Fan, L. Monitoring the Reduced Resilience of Forests in Southwest China Using Long-Term Remote Sensing Data. Remote Sens. 2021, 14, 32. [Google Scholar] [CrossRef]
  27. Zhumanova, M.; Mönnig, C.; Hergarten, C.; Darr, D.; Wrage-Mönnig, N. Assessment of vegetation degradation in mountainous pastures of the Western Tien-Shan, Kyrgyzstan, using eMODIS NDVI. Ecol. Indic. 2018, 95, 527–543. [Google Scholar] [CrossRef]
  28. Liu, F.; Liu, H.; Xu, C.; Zhu, X.; He, W.; Qi, Y. Remotely sensed birch forest resilience against climate change in the northern China forest-steppe ecotone. Ecol. Indic. 2021, 125, 107526. [Google Scholar] [CrossRef]
  29. Xu, Z.; Zhang, T.; Wang, S.; Wang, Z. Soil pH and C/N ratio determines spatial variations in soil microbial communities and enzymatic activities of the agricultural ecosystems in Northeast China: Jilin Province case. Appl. Soil Ecol. 2020, 155, 103629. [Google Scholar] [CrossRef]
  30. Yang, S.-j.; Li, X.-d.; Yan, S.-g. The study for the Spatial Distribution Pattern of NDVI in the Western of Jilin Province. IOP Conf. Ser. Earth Environ. Sci. 2018, 113, 012077. [Google Scholar] [CrossRef]
  31. Zarch, M.A.A.; Sivakumar, B.; Sharma, A. Droughts in a warming climate: A global assessment of Standardized precipitation index (SPI) and Reconnaissance drought index (RDI). J. Hydrol. 2015, 526, 183–195. [Google Scholar] [CrossRef]
  32. Ivits, E.; Horion, S.; Fensholt, R.; Cherlet, M. Drought footprint on E uropean ecosystems between 1999 and 2010 assessed by remotely sensed vegetation phenology and productivity. Glob. Chang. Biol. 2014, 20, 581–593. [Google Scholar] [CrossRef]
  33. Thornthwaite, C.W. An approach toward a rational classification of climate. Geogr. Rev. 1948, 38, 55–94. [Google Scholar] [CrossRef]
  34. Wang, D.; Hejazi, M.; Cai, X.; Valocchi, A.J. Climate change impact on meteorological, agricultural, and hydrological drought in central Illinois. Water Resour. Res. 2011, 47, W09527–W09540. [Google Scholar] [CrossRef] [Green Version]
  35. Wu, H.; Hayes, M.J.; Wilhite, D.A.; Svoboda, M.D. The effect of the length of record on the standardized precipitation index calculation. Int. J. Climatol. A J. R. Meteorol. Soc. 2005, 25, 505–520. [Google Scholar] [CrossRef] [Green Version]
  36. Kross, A.; McNairn, H.; Lapen, D.; Sunohara, M.; Champagne, C. Assessment of RapidEye vegetation indices for estimation of leaf area index and biomass in corn and soybean crops. Int. J. Appl. Earth Obs. Geoinf. 2015, 34, 235–248. [Google Scholar] [CrossRef] [Green Version]
  37. Yang, H.; Yang, X.; Heskel, M.; Sun, S.; Tang, J. Seasonal variations of leaf and canopy properties tracked by ground-based NDVI imagery in a temperate forest. Sci. Rep. 2017, 7, 1267. [Google Scholar] [CrossRef] [Green Version]
  38. Goetz, S.J.; Fiske, G.J.; Bunn, A.G. Using satellite time-series data sets to analyze fire disturbance and forest recovery across Canada. Remote Sens. Environ. 2006, 101, 352–365. [Google Scholar] [CrossRef]
  39. Yevjevich, V.M. Objective Approach to Definitions and Investigations of Continental Hydrologic Droughts; Colorado State University: Fort Collins, CO, USA, 1967. [Google Scholar]
  40. Wu, J.; Chen, X.; Yao, H.; Zhang, D. Multi-timescale assessment of propagation thresholds from meteorological to hydrological drought. Sci. Total Environ. 2021, 765, 144232. [Google Scholar] [CrossRef]
  41. McKee, T.B.; Doesken, N.J.; Kleist, J. The Relationship of Drought Frequency and Duration to Time Scales. In Proceedings of the 8th Conference on Applied Climatology, Anaheim, CA, USA, 17–22 January 1993; pp. 179–183. [Google Scholar]
  42. Guo, H.; Bao, A.; Liu, T.; Ndayisaba, F.; Jiang, L.; Kurban, A.; De Maeyer, P. Spatial and temporal characteristics of droughts in Central Asia during 1966–2015. Sci. Total Environ. 2018, 624, 1523–1538. [Google Scholar] [CrossRef]
  43. Tilman, D.; Downing, J.A. Biodiversity and stability in grasslands. Nature 1994, 367, 363–365. [Google Scholar] [CrossRef]
  44. Lin, X.S.; Tang, J.; Li, Z.Y.; Li, H.Y. Vegetation greenness modelling in response to interannual precipitation and temperature changes between 2001 and 2012 in Liao River Basin in Jilin Province, China. Springerplus 2016, 5, 1173. [Google Scholar] [CrossRef] [PubMed] [Green Version]
  45. Cao, Y.; Chen, S.; Wang, L.; Zhu, B.; Lu, T.; Yu, Y. An agricultural drought index for assessing droughts using a water balance method: A case study in Jilin Province, Northeast China. Remote Sens. 2019, 11, 1066. [Google Scholar] [CrossRef] [Green Version]
  46. Shi, S.; Yu, J.; Wang, F.; Wang, P.; Zhang, Y.; Jin, K. Quantitative contributions of climate change and human activities to vegetation changes over multiple time scales on the Loess Plateau. Sci. Total Environ. 2021, 755, 142419. [Google Scholar] [CrossRef] [PubMed]
  47. Shen, J.; Chen, Y.; Wang, Q.; Fu, H. Spatiotemporal Variation in Saline Soil Properties in the Seasonal Frozen Area of Northeast China: A Case Study in Western Jilin Province. Water 2023, 15, 1812. [Google Scholar] [CrossRef]
  48. Huntley, B.J. Soil, Water and Nutrients. In Ecology of Angola: Terrestrial Biomes and Ecoregions; Huntley, B.J., Ed.; Springer International Publishing: Cham, Switzerland, 2023; pp. 127–147. [Google Scholar] [CrossRef]
  49. Li, Q.S.; Willardson, L.S.; Deng, W.; Li, X.J.; Liu, C.J. Crop water deficit estimation and irrigation scheduling in western Jilin province, Northeast China. Agric. Water Manag. 2005, 71, 47–60. [Google Scholar] [CrossRef]
  50. Zheng, X.; Qin, L.; He, H. Impacts of Climatic and Agricultural Input Factors on the Water Footprint of Crop Production in Jilin Province, China. Sustainability 2020, 12, 6904. [Google Scholar] [CrossRef]
  51. Feng, M.; Zhang, W.; Zhang, S.; Sun, Z.; Li, Y.; Huang, Y.; Wang, W.; Qi, P.; Zou, Y.; Jiang, M. The role of snowmelt discharge to runoff of an alpine watershed: Evidence from water stable isotopes. J. Hydrol. 2022, 604, 127209. [Google Scholar] [CrossRef]
  52. Gazol, A.; Camarero, J.; Anderegg, W.; Vicente-Serrano, S. Impacts of droughts on the growth resilience of Northern Hemisphere forests. Glob. Ecol. Biogeogr. 2017, 26, 166–176. [Google Scholar] [CrossRef]
  53. Li, X.; Piao, S.; Wang, K.; Wang, X.; Wang, T.; Ciais, P.; Chen, A.; Lian, X.; Peng, S.; Peñuelas, J. Temporal trade-off between gymnosperm resistance and resilience increases forest sensitivity to extreme drought. Nat. Ecol. Evol. 2020, 4, 1075–1083. [Google Scholar] [CrossRef]
  54. Daszkowska-Golec, A.; Szarejko, I. Open or close the gate–stomata action under the control of phytohormones in drought stress conditions. Front. Plant Sci. 2013, 4, 138. [Google Scholar] [CrossRef] [PubMed] [Green Version]
  55. Gupta, A.; Rico-Medina, A.; Caño-Delgado, A.I. The physiology of plant responses to drought. Science 2020, 368, 266–269. [Google Scholar] [CrossRef] [PubMed]
  56. Sah, S.K.; Reddy, K.R.; Li, J. Abscisic acid and abiotic stress tolerance in crop plants. Front. Plant Sci. 2016, 7, 571. [Google Scholar] [CrossRef] [PubMed] [Green Version]
  57. Basu, S.; Ramegowda, V.; Kumar, A.; Pereira, A. Plant adaptation to drought stress. F1000Research 2016, 5, 318–388. [Google Scholar] [CrossRef] [PubMed]
  58. Sperry, J.S.; Love, D.M. What plant hydraulics can tell us about responses to climate-change droughts. New Phytol. 2015, 207, 14–27. [Google Scholar] [CrossRef] [PubMed]
  59. Hofer, D.; Suter, M.; Buchmann, N.; Lüscher, A. Nitrogen status of functionally different forage species explains resistance to severe drought and post-drought overcompensation. Agric. Ecosyst. Environ. 2017, 236, 312–322. [Google Scholar] [CrossRef]
  60. Xu, Z.; Zhou, G.; Shimizu, H. Are plant growth and photosynthesis limited by pre-drought following rewatering in grass? J. Exp. Bot. 2009, 60, 3737–3749. [Google Scholar] [CrossRef] [PubMed] [Green Version]
  61. Xu, Z.; Zhou, G.; Shimizu, H. Plant responses to drought and rewatering. Plant Signal. Behav. 2010, 5, 649–654. [Google Scholar] [CrossRef] [PubMed] [Green Version]
  62. Jiang, L.; Bao, A.; Guo, H.; Ndayisaba, F. Vegetation dynamics and responses to climate change and human activities in Central Asia. Sci. Total Environ. 2017, 599, 967–980. [Google Scholar] [CrossRef] [PubMed]
Figure 1. (a) Location map of Jilin Province in China. (b) Vegetation classification map. (c) Spatial distribution of mean annual precipitation. (d) Soil type distribution map.
Remotesensing 15 03280 g001
Figure 2. The schematic of quantifying vegetation resistance and resilience to drought is based on SPEI and NDVI time series data.
Remotesensing 15 03280 g002
Figure 3. (a) Spatial distribution of the maximum Pearson correlation coefficient between NDVI and SPEI during the period 2000–2017. Pixels have been masked with a significant correlation (p-value ≤ 0.01). (b) Density distribution plot of correlation coefficient on timescale.
Remotesensing 15 03280 g003
Figure 4. Correlation coefficients during multiple timescales among vegetation types.
Remotesensing 15 03280 g004
Figure 5. Spatial distribution of drought events during the period 2000–2017. (a) Number of drought events. (b) Duration of drought events. (c) Severity of drought events.
Remotesensing 15 03280 g005
Figure 6. Characteristics of drought events among vegetation types. (a) Number of drought events, (b) duration of drought events, and (c) severity of drought events.
Remotesensing 15 03280 g006
Figure 7. (a) On the left is the trajectory of the NDVI anomaly and SPEI at sites during the period 2000–2017. On the right is the NDVI (8 days) in 2014 and the NDVI under years without drought. (b) Bar graph showing the resistance and resilience of vegetation to severe drought in 2014.
Remotesensing 15 03280 g007
Figure 8. Response of resistance and resilience to (a) drought severity and (b) drought duration in vegetation types. The red area is the fluctuation range of resistance. The dark red line represents the average value. The green area is the fluctuation range of resilience. The dark green line is the average level.
Remotesensing 15 03280 g008
Figure 9. Variation in vegetation (a) resistance and (b) resilience under different drought categories occurring during the growth period from May to September.
Remotesensing 15 03280 g009
Table 1. Drought categories according to SPEI values.
SPEICategory
−1.5 to −1Moderate drought
−2 to −1.5Severe drought
−2 and lessExtreme drought
Table 2. Summary of location, elevation, and vegetation type at study sites.
VegetationLong. (°E)Lat. (°S)Elev. (m)
Cropland123°15′44°49′144
Herbaceous125°17′44°37′195
Mosaic natural vegetation122°18′44°47′170
Tree cover127°45′43°14′978
Shrubland123°55′45°46′125
Grassland123°17′45°15′140
Disclaimer/Publisher’s Note: The statements, opinions and data contained in all publications are solely those of the individual author(s) and contributor(s) and not of MDPI and/or the editor(s). MDPI and/or the editor(s) disclaim responsibility for any injury to people or property resulting from any ideas, methods, instructions or products referred to in the content.

