
Retrieving the Kinematic Process of Repeated-Mining-Induced Landslides by Fusing SAR/InSAR Displacement, Logistic Model, and Probability Integral Method
 , ,
, ,  ,
,
Abstract
:
1. Introduction
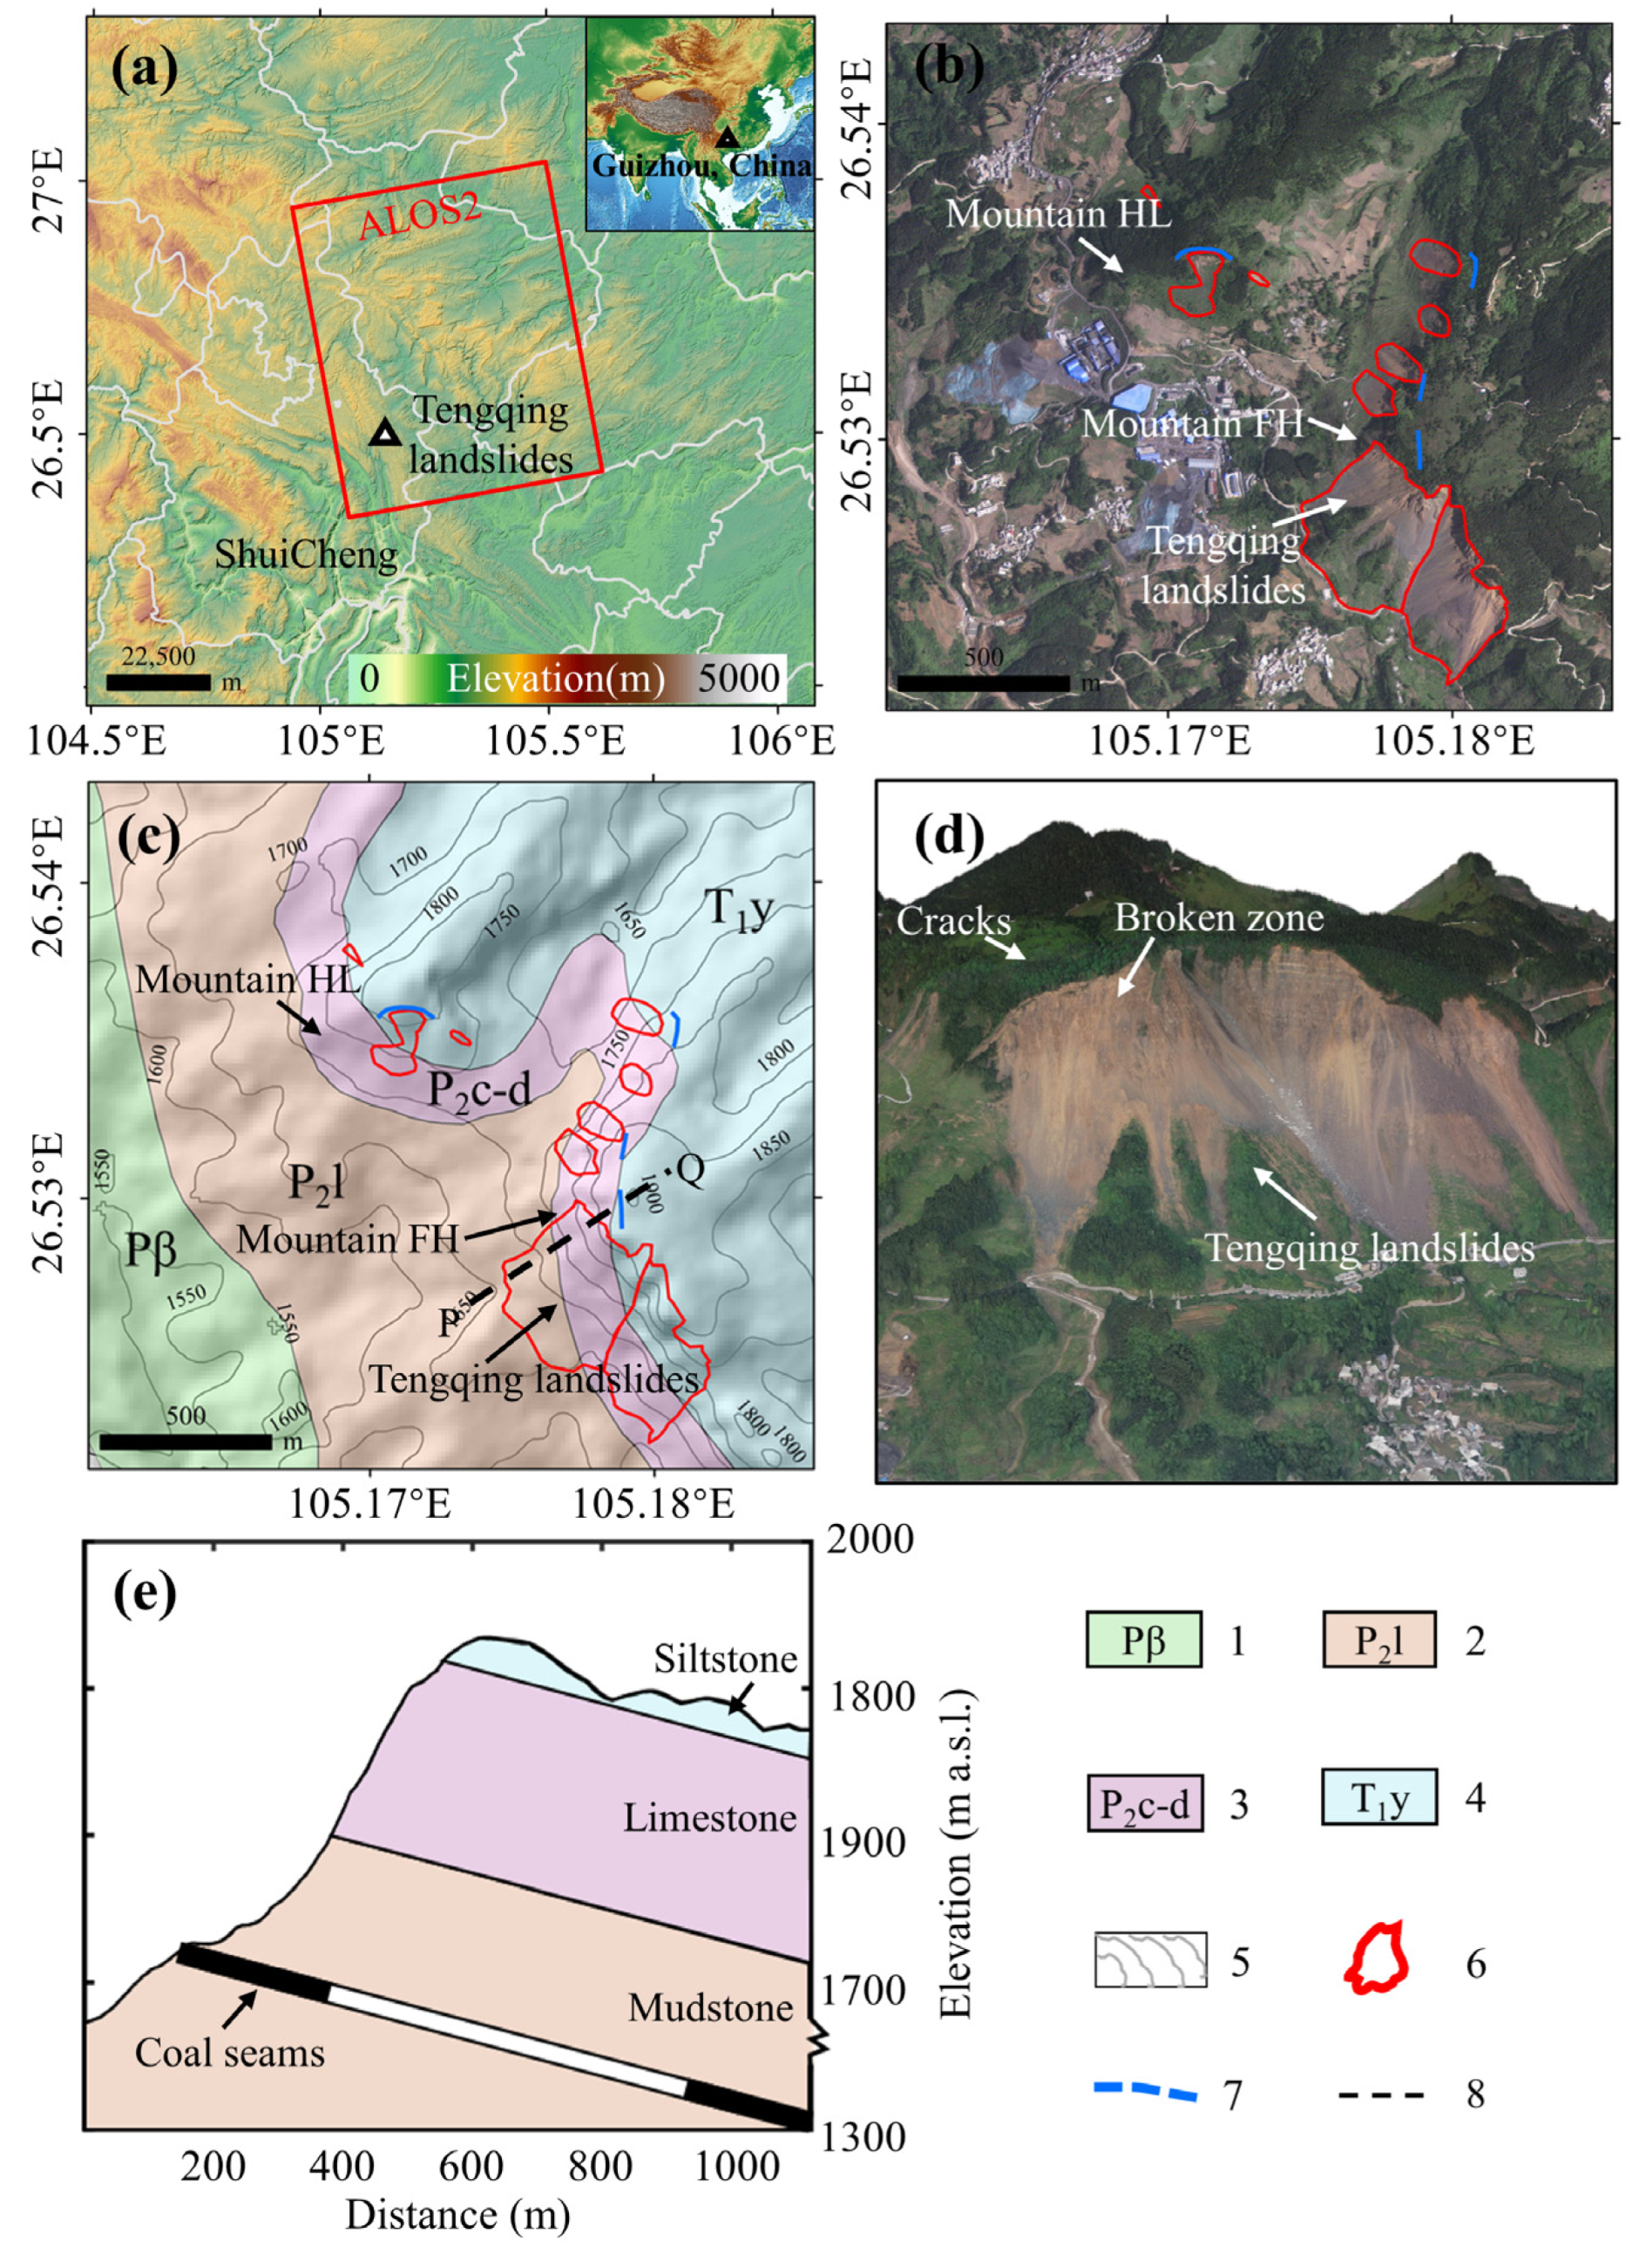
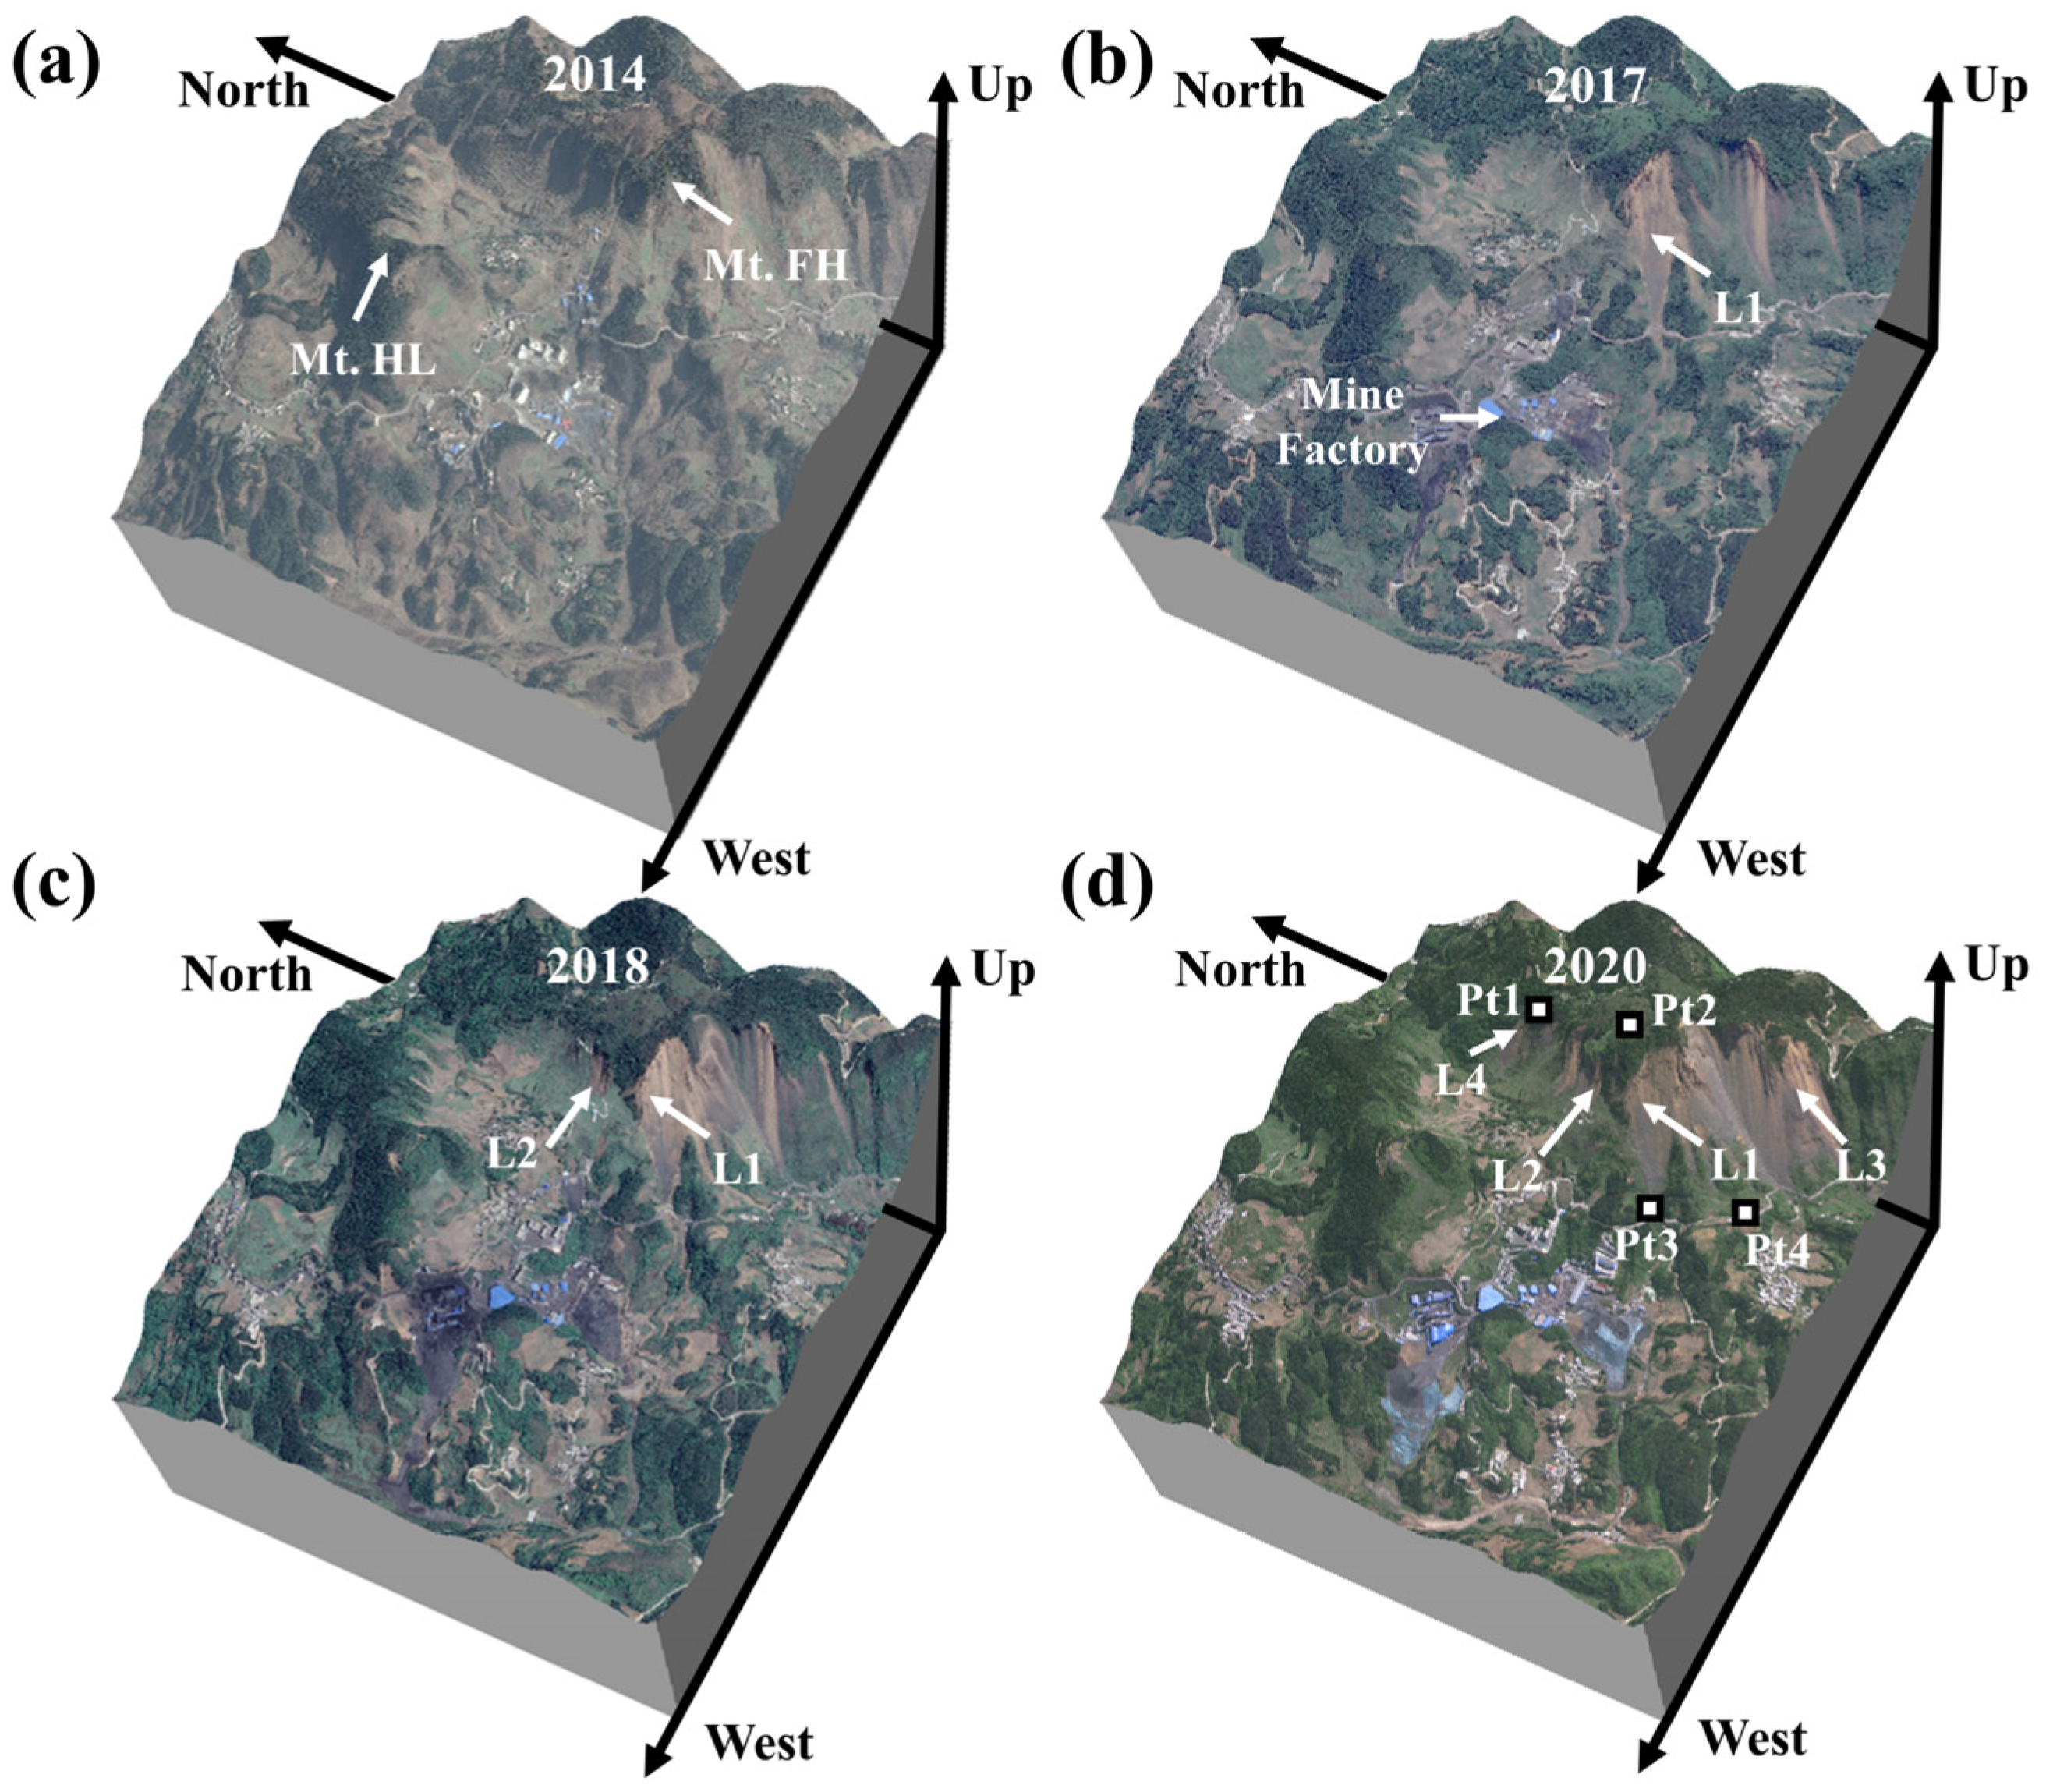
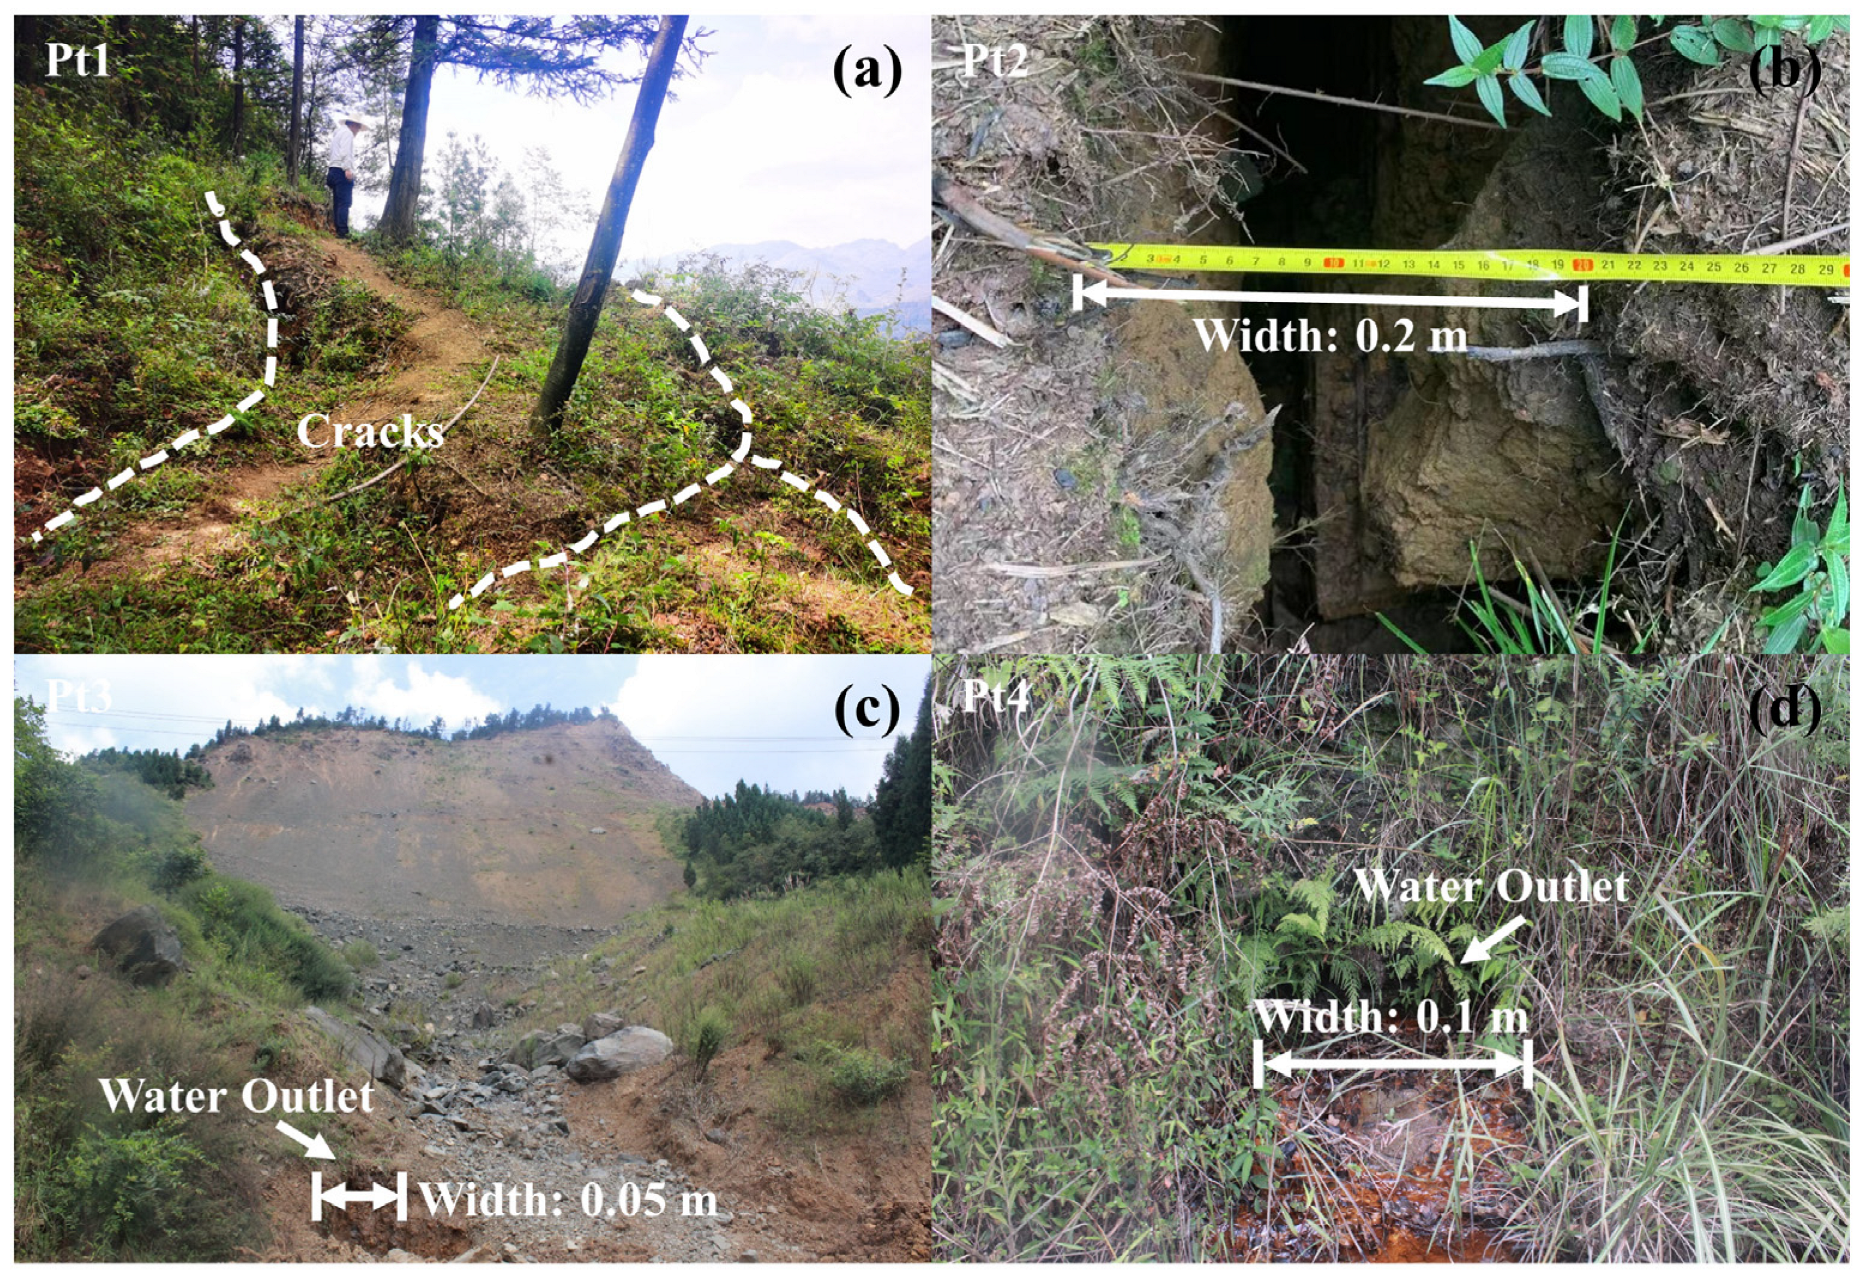
2. Study Area
3. Data and Methods
3.1. Data
3.2. Methods
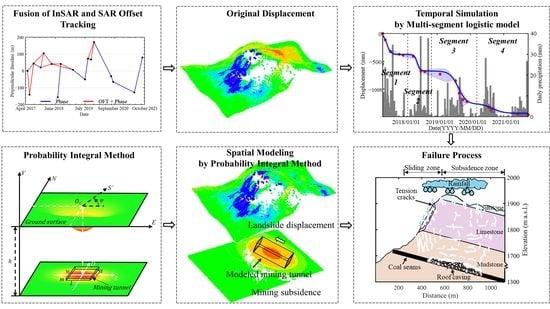
3.2.1. Coherence-Guide Fusion of InSAR and SAR Offset Tracking
3.2.2. Multiple-Segment Logistic Model
3.2.3. Probability Integral Method
4. Results
5. Discussion
5.1. The Temporal Simulation of the Deformation Process
5.2. The Spatial Separation of Mining and Landslide Deformation Field
5.3. The Formation Process of Mining-Induced Landslides
6. Conclusions
Author Contributions
Funding
Data Availability Statement
Acknowledgments
Conflicts of Interest
References
- Yin, Y.; Sun, P.; Zhang, M.; Li, B. Mechanism on Apparent Dip Sliding of Oblique Inclined Bedding Rockslide at Jiweishan, Chongqing, China. Landslides 2011, 8, 49–65. [Google Scholar] [CrossRef]
- Zhao, C.; Zhang, Q.; Yin, Y.; Lu, Z.; Yang, C.; Zhu, W.; Li, B. Pre-, Co-, and Post- Rockslide Analysis with ALOS/PALSAR Imagery: A Case Study of the Jiweishan Rockslide, China. Nat. Hazards Earth Syst. Sci. 2013, 13, 2851–2861. [Google Scholar] [CrossRef] [Green Version]
- Hibert, C.; Ekström, G.; Stark, C.P. Dynamics of the Bingham Canyon Mine Landslides from Seismic Signal Analysis. Geophys. Res. Lett. 2014, 41, 4535–4541. [Google Scholar] [CrossRef]
- Williams, C.; Ross, B.; Zebker, M.; Leighton, J.; Gaida, M.; Morkeh, J.; Robotham, M. Assessment of the Available Historic RADARSAT-2 Synthetic Aperture Radar Data Prior to the Manefay Slide at the Bingham Canyon Mine Using Modern InSAR Techniques. Rock. Mech. Rock. Eng. 2021, 54, 3469–3489. [Google Scholar] [CrossRef]
- Fan, X.; Xu, Q.; Scaringi, G.; Zheng, G.; Huang, R.; Dai, L.; Ju, Y. The “Long” Runout Rock Avalanche in Pusa, China, on August 28, 2017: A Preliminary Report. Landslides 2019, 16, 139–154. [Google Scholar] [CrossRef]
- Lin, Y.N.; Park, E.; Wang, Y.; Quek, Y.P.; Lim, J.; Alcantara, E.; Loc, H.H. The 2020 Hpakant Jade Mine Disaster, Myanmar: A Multi-Sensor Investigation for Slope Failure. ISPRS J. Photogramm. Remote Sens. 2021, 177, 291–305. [Google Scholar] [CrossRef]
- Hanssen, R.F. Radar Interferometry: Data Interpretation and Error Analysis (Remote Sens. and Digital Image Processing); Springer: Berlin/Heidelberg, Germany, 2001. [Google Scholar]
- Tomás, R.; Li, Z. Earth Observations for Geohazards: Present and Future Challenges. Remote Sens. 2017, 9, 194. [Google Scholar] [CrossRef] [Green Version]
- Ferretti, A.; Fumagalli, A.; Novali, F.; Prati, C.; Rocca, F.; Rucci, A. A New Algorithm for Processing Interferometric Data-Stacks: SqueeSAR. IEEE Trans. Geosci. Remote Sens. 2011, 49, 3460–3470. [Google Scholar] [CrossRef]
- Hooper, A. A Multi-Temporal InSAR Method Incorporating Both Persistent Scatterer and Small Baseline Approaches. Geophys. Res. Lett. 2008, 35, L16302. [Google Scholar] [CrossRef] [Green Version]
- Berardino, P.; Fornaro, G.; Lanari, R.; Sansosti, E. A New Algorithm for Surface Deformation Monitoring Based on Small Baseline Differential SAR Interferograms. IEEE Trans. Geosci. Remote Sens. 2002, 40, 2375–2383. [Google Scholar] [CrossRef] [Green Version]
- Dong, J.; Zhang, L.; Tang, M.; Liao, M.; Xu, Q.; Gong, J.; Ao, M. Mapping Landslide Surface Displacements with Time Series SAR Interferometry by Combining Persistent and Distributed Scatterers: A Case Study of Jiaju Landslide in Danba, China. Remote Sens. Environ. 2018, 205, 180–198. [Google Scholar] [CrossRef]
- Shi, X.; Jiang, L.; Jiang, H.; Wang, X.; Xu, J. Geohazards Analysis of the Litang–Batang Section of Sichuan–Tibet Railway Using SAR Interferometry. IEEE J. Sel. Top. Appl. Earth Obs. Remote Sens. 2021, 14, 11998–12006. [Google Scholar] [CrossRef]
- Modeste, G.; Doubre, C.; Masson, F. Time Evolution of Mining-Related Residual Subsidence Monitored over a 24-Year Period Using InSAR in Southern Alsace, France. Int. J. Appl. Earth Obs. Geoinf. 2021, 102, 102392. [Google Scholar] [CrossRef]
- Casagli, N.; Intrieri, E.; Tofani, V.; Gigli, G.; Raspini, F. Landslide Detection, Monitoring and Prediction with Remote-Sensing Techniques. Nat. Rev. Earth Environ. 2023, 4, 51–64. [Google Scholar] [CrossRef]
- Nefros, C.; Alatza, S.; Loupasakis, C.; Kontoes, C. Persistent Scatterer Interferometry (PSI) Technique for the Identification and Monitoring of Critical Landslide Areas in a Regional and Mountainous Road Network. Remote Sens. 2023, 15, 1550. [Google Scholar] [CrossRef]
- Hu, J.; Yu, Y.; Gui, R.; Zheng, W.; Guo, A. Spatial Distribution Analysis of Landslide Deformations and Land-Use Changes in the Three Gorges Reservoir Area by Using Interferometric and Polarimetric SAR. Remote Sens. 2023, 15, 2302. [Google Scholar] [CrossRef]
- Cai, J.; Liu, G.; Jia, H.; Zhang, B.; Wu, R.; Fu, Y.; Xiang, W.; Mao, W.; Wang, X.; Zhang, R. A New Algorithm for Landslide Dynamic Monitoring with High Temporal Resolution by Kalman Filter Integration of Multiplatform Time-Series InSAR Processing. Int. J. Appl. Earth Obs. Geoinf. 2022, 110, 102812. [Google Scholar] [CrossRef]
- Wang, B.; Zhao, C.; Zhang, Q.; Liu, X.; Lu, Z.; Liu, C.; Zhang, J. Sequential DS-ISBAS InSAR Deformation Parameter Dynamic Estimation and Quality Evaluation. Remote Sens. 2023, 15, 2097. [Google Scholar] [CrossRef]
- Baran, I.; Stewart, M.; Claessens, S. A New Functional Model for Determining Minimum and Maximum Detectable Deformation Gradient Resolved by Satellite Radar Interferometry. IEEE Trans. Geosci. Remote Sens. 2005, 43, 675–682. [Google Scholar] [CrossRef]
- Strozzi, T.; Luckman, A.; Murray, T.; Wegmuller, U.; Werner, C.L. Glacier Motion Estimation Using SAR Offset-Tracking Procedures. IEEE Trans. Geosci. Remote Sens. 2002, 40, 2384–2391. [Google Scholar] [CrossRef] [Green Version]
- Casu, F.; Manconi, A.; Pepe, A.; Lanari, R. Deformation Time-Series Generation in Areas Characterized by Large Displacement Dynamics: The SAR Amplitude Pixel-Offset SBAS Technique. IEEE Trans. Geosci. Remote Sens. 2011, 49, 2752–2763. [Google Scholar] [CrossRef]
- Zhao, C.; Lu, Z.; Zhang, Q. Time-Series Deformation Monitoring over Mining Regions with SAR Intensity-Based Offset Measurements. Remote Sens. Lett. 2013, 4, 436–445. [Google Scholar] [CrossRef]
- Fan, H.; Gao, X.; Yang, J.; Deng, K.; Yu, Y. Monitoring Mining Subsidence Using A Combination of Phase-Stacking and Offset-Tracking Methods. Remote Sens. 2015, 7, 9166–9183. [Google Scholar] [CrossRef] [Green Version]
- Wang, L.; Deng, K.; Zheng, M. Research on Ground Deformation Monitoring Method in Mining Areas Using the Probability Integral Model Fusion D-InSAR, Sub-Band InSAR and Offset-Tracking. Int. J. Appl. Earth Obs. Geoinf. 2020, 85, 101981. [Google Scholar] [CrossRef]
- Ghabraie, B.; Ren, G.; Barbato, J.; Smith, J.V. A Predictive Methodology for Multi-Seam Mining Induced Subsidence. Int. J. Rock. Mech. Min. Sci. 2017, 93, 280–294. [Google Scholar] [CrossRef]
- Yang, Z.; Zhao, Q.; Liu, X.; Yin, Z.; Zhao, Y.; Li, X. Experimental Study on the Movement and Failure Characteristics of Karst Mountain with Deep and Large Fissures Induced by Coal Seam Mining. Rock. Mech. Rock. Eng. 2022, 55, 4839–4867. [Google Scholar] [CrossRef]
- Fang, K.; Miao, M.; Tang, H.; Jia, S.; Dong, A.; An, P.; Zhang, B. Insights into the Deformation and Failure Characteristic of a Slope Due to Excavation through Multi-Field Monitoring: A Model Test. Acta Geotech. 2023, 18, 1001–1024. [Google Scholar] [CrossRef]
- Salmi, E.F.; Nazem, M.; Karakus, M. Numerical Analysis of a Large Landslide Induced by Coal Mining Subsidence. Eng. Geol. 2017, 217, 141–152. [Google Scholar] [CrossRef]
- Li, J.; Li, B.; He, K.; Gao, Y.; Wan, J.; Wu, W.; Zhang, H. Failure Mechanism Analysis of Mining-Induced Landslide Based on Geophysical Investigation and Numerical Modelling Using Distinct Element Method. Remote Sens. 2022, 14, 6071. [Google Scholar] [CrossRef]
- Jarosz, A.; Karmis, M.; Sroka, A. Subsidence Development with Time-Experiences from Longwall Operations in the Appalachian Coalfield. Int. J. Min. Geol. Eng. 1990, 8, 261–273. [Google Scholar] [CrossRef]
- Yang, Z.; Li, Z.; Zhu, J.; Yi, H.; Hu, J.; Feng, G. Deriving Dynamic Subsidence of Coal Mining Areas Using InSAR and Logistic Model. Remote Sens. 2017, 9, 125. [Google Scholar] [CrossRef] [Green Version]
- Yang, D.; Qiu, H.; Ma, S.; Liu, Z.; Du, C.; Zhu, Y.; Cao, M. Slow Surface Subsidence and Its Impact on Shallow Loess Landslides in a Coal Mining Area. CATENA 2022, 209, 105830. [Google Scholar] [CrossRef]
- Chen, H.; Zhao, C.; Li, B.; Gao, Y.; Chen, L.; Liu, D. Monitoring Spatiotemporal Evolution of Kaiyang Landslides Induced by Phosphate Mining Using Distributed Scatterers InSAR Technique. Landslides 2023, 20, 695–706. [Google Scholar] [CrossRef]
- Chen, L.; Zhao, C.; Li, B.; He, K.; Ren, C.; Liu, X.; Liu, D. Deformation Monitoring and Failure Mode Research of Mining-Induced Jianshanying Landslide in Karst Mountain Area, China with ALOS/PALSAR-2 Images. Landslides 2021, 18, 2739–2750. [Google Scholar] [CrossRef]
- Yan, W.; Chen, J.; Yang, W.; Liu, X.; Wang, W.; Zhang, W. On-Site Measurement on Surface Disturbance Law of Repeated Mining with High Relief Terrain. Sustainability 2022, 14, 3166. [Google Scholar] [CrossRef]
- Wang, N.; Zhong, Z.; Liu, X.; Gao, G. Failure Mechanism of Anti-Inclined Karst Slope Induced by Underground Multiseam Mining. Geofluids 2022, 2022, 1302861. [Google Scholar] [CrossRef]
- Lu, Z.; Dzurisin, D.; Biggs, J.; Wicks, C.; McNutt, S. Ground Surface Deformation Patterns, Magma Supply, and Magma Storage at Okmok Volcano, Alaska, from InSAR Analysis: 1. Intereruption Deformation, 1997–2008. J. Geophys. Res. 2010, 115, B00B02. [Google Scholar] [CrossRef] [Green Version]
- Wright, T.; Fielding, E.; Parsons, B. Triggered Slip: Observations of the 17 August 1999 Izmit (Turkey) Earthquake Using Radar Interferometry. Geophys. Res. Lett. 2001, 28, 1079–1082. [Google Scholar] [CrossRef]
- Kim, J.-W.; Lu, Z.; Degrandpre, K. Ongoing Deformation of Sinkholes in Wink, Texas, Observed by Time-Series Sentinel-1A SAR Interferometry (Preliminary Results). Remote Sens. 2016, 8, 313. [Google Scholar] [CrossRef] [Green Version]
- Litwiniszyn, J. The Theories and Model Research of Movements of Ground Masses. In Proceedings of the European Congress on Ground Movement, Leeds, UK, 9–12 April 1957; Volume 202, p. 209. [Google Scholar]
- Liu, B.; Liao, G. Basic Law of Surface Movement in Coal Mine; China Coal Industry Press: Beijing, China, 1965. [Google Scholar]
- Yang, Z.; Li, Z.; Zhu, J.; Yi, H.; Feng, G.; Hu, J.; Wu, L.; Preusse, A.; Wang, Y.; Papst, M. Locating and Defining Underground Goaf Caused by Coal Mining from Space-Borne SAR Interferometry. ISPRS J. Photogramm. Remote Sens. 2018, 135, 112–126. [Google Scholar] [CrossRef]
- Du, S.; Wang, Y.; Zheng, M.; Zhou, D.; Xia, Y. Goaf Locating Based on InSAR and Probability Integration Method. Remote Sens. 2019, 11, 812. [Google Scholar] [CrossRef] [Green Version]
- Scambos, T.A.; Dutkiewicz, M.J.; Wilson, J.C.; Bindschadler, R.A. Application of Image Cross-Correlation to the Measurement of Glacier Velocity Using Satellite Image Data. Remote Sens. Environ. 1992, 42, 177–186. [Google Scholar] [CrossRef]
- MathWorks Findpeaks Function Documentation. MATLAB Help Center, R2021b ed.; MathWorks: Natick, MA, USA, 2021. [Google Scholar]
- Schlögel, R.; Doubre, C.; Malet, J.P.; Masson, F. Landslide Deformation Monitoring with ALOS/PALSAR Imagery: A D-InSAR Geomorphological Interpretation Method. Geomorphology 2015, 231, 314–330. [Google Scholar] [CrossRef]
- Meng, Q.; Confuorto, P.; Peng, Y.; Raspini, F.; Bianchini, S.; Han, S.; Liu, H.; Casagli, N. Regional Recognition and Classification of Active Loess Landslides Using Two-Dimensional Deformation Derived from Sentinel-1 Interferometric Radar Data. Remote Sens. 2020, 12, 1541. [Google Scholar] [CrossRef]
- Liu, X.; Zhao, C.; Zhang, Q.; Yang, C.; Zhu, W. Heifangtai Loess Landslide Type and Failure Mode Analysis with Ascending and Descending Spot-Mode TerraSAR-X Datasets. Landslides 2020, 17, 205–215. [Google Scholar] [CrossRef] [Green Version]
- Chen, H.; Zhao, C.; Sun, R.; Chen, L.; Wang, B.; Li, B. Two-Dimensional Deformation Monitoring of Karst Landslides in Zongling, China, with Multi-Platform Distributed Scatterer InSAR Technique. Landslides 2022, 19, 1767–1777. [Google Scholar] [CrossRef]
- Xiong, S.; Shi, W.; Wang, Y.; Zhu, C.; Yu, X. Deformation and Failure Process of Slope Caused by Underground Mining: A Case Study of Pusa Collapse in Nayong County, Guizhou Province, China. Geofluids 2022, 2022, 1592703. [Google Scholar] [CrossRef]


| Points | Segments | ||||
|---|---|---|---|---|---|
| W0s1 | W0s2 | W0s3 | W0s4 | W0s5 | |
| P1 | −379 | −296 | −600 | −180 | 0 |
| P2 | 0 | −465 | −232 | −134 | −144 |
| P3 | 0 | −189 | −435 | −89 | 0 |
| P4 | −151 | −119 | −218 | −133 | 0 |
| Parameters | Length (m) | Width (m) | Depth (m) | Thickness (m) | Dip (°) | Rotation Angle (°) | Lon (°) | Lat (°) |
|---|---|---|---|---|---|---|---|---|
| Model | 413.6 | 141.5 | 542.9 | 1.1 | 15.1 | 95.7 | 105.177 | 26.534 |
Disclaimer/Publisher’s Note: The statements, opinions and data contained in all publications are solely those of the individual author(s) and contributor(s) and not of MDPI and/or the editor(s). MDPI and/or the editor(s) disclaim responsibility for any injury to people or property resulting from any ideas, methods, instructions or products referred to in the content. |
© 2023 by the authors. Licensee MDPI, Basel, Switzerland. This article is an open access article distributed under the terms and conditions of the Creative Commons Attribution (CC BY) license (https://creativecommons.org/licenses/by/4.0/).
Share and Cite
Chen, H.; Zhao, C.; Tomás, R.; Chen, L.; Yang, C.; Zhang, Y. Retrieving the Kinematic Process of Repeated-Mining-Induced Landslides by Fusing SAR/InSAR Displacement, Logistic Model, and Probability Integral Method. Remote Sens. 2023, 15, 3145. https://doi.org/10.3390/rs15123145
Chen H, Zhao C, Tomás R, Chen L, Yang C, Zhang Y. Retrieving the Kinematic Process of Repeated-Mining-Induced Landslides by Fusing SAR/InSAR Displacement, Logistic Model, and Probability Integral Method. Remote Sensing. 2023; 15(12):3145. https://doi.org/10.3390/rs15123145
Chicago/Turabian StyleChen, Hengyi, Chaoying Zhao, Roberto Tomás, Liquan Chen, Chengsheng Yang, and Yuning Zhang. 2023. "Retrieving the Kinematic Process of Repeated-Mining-Induced Landslides by Fusing SAR/InSAR Displacement, Logistic Model, and Probability Integral Method" Remote Sensing 15, no. 12: 3145. https://doi.org/10.3390/rs15123145