

Monitoring Urban Change in Conflict from the Perspective of Optical and SAR Satellites: The Case of Mariupol, a City in the Conflict between RUS and UKR
Abstract
:
1. Introduction
2. Study Area and Data
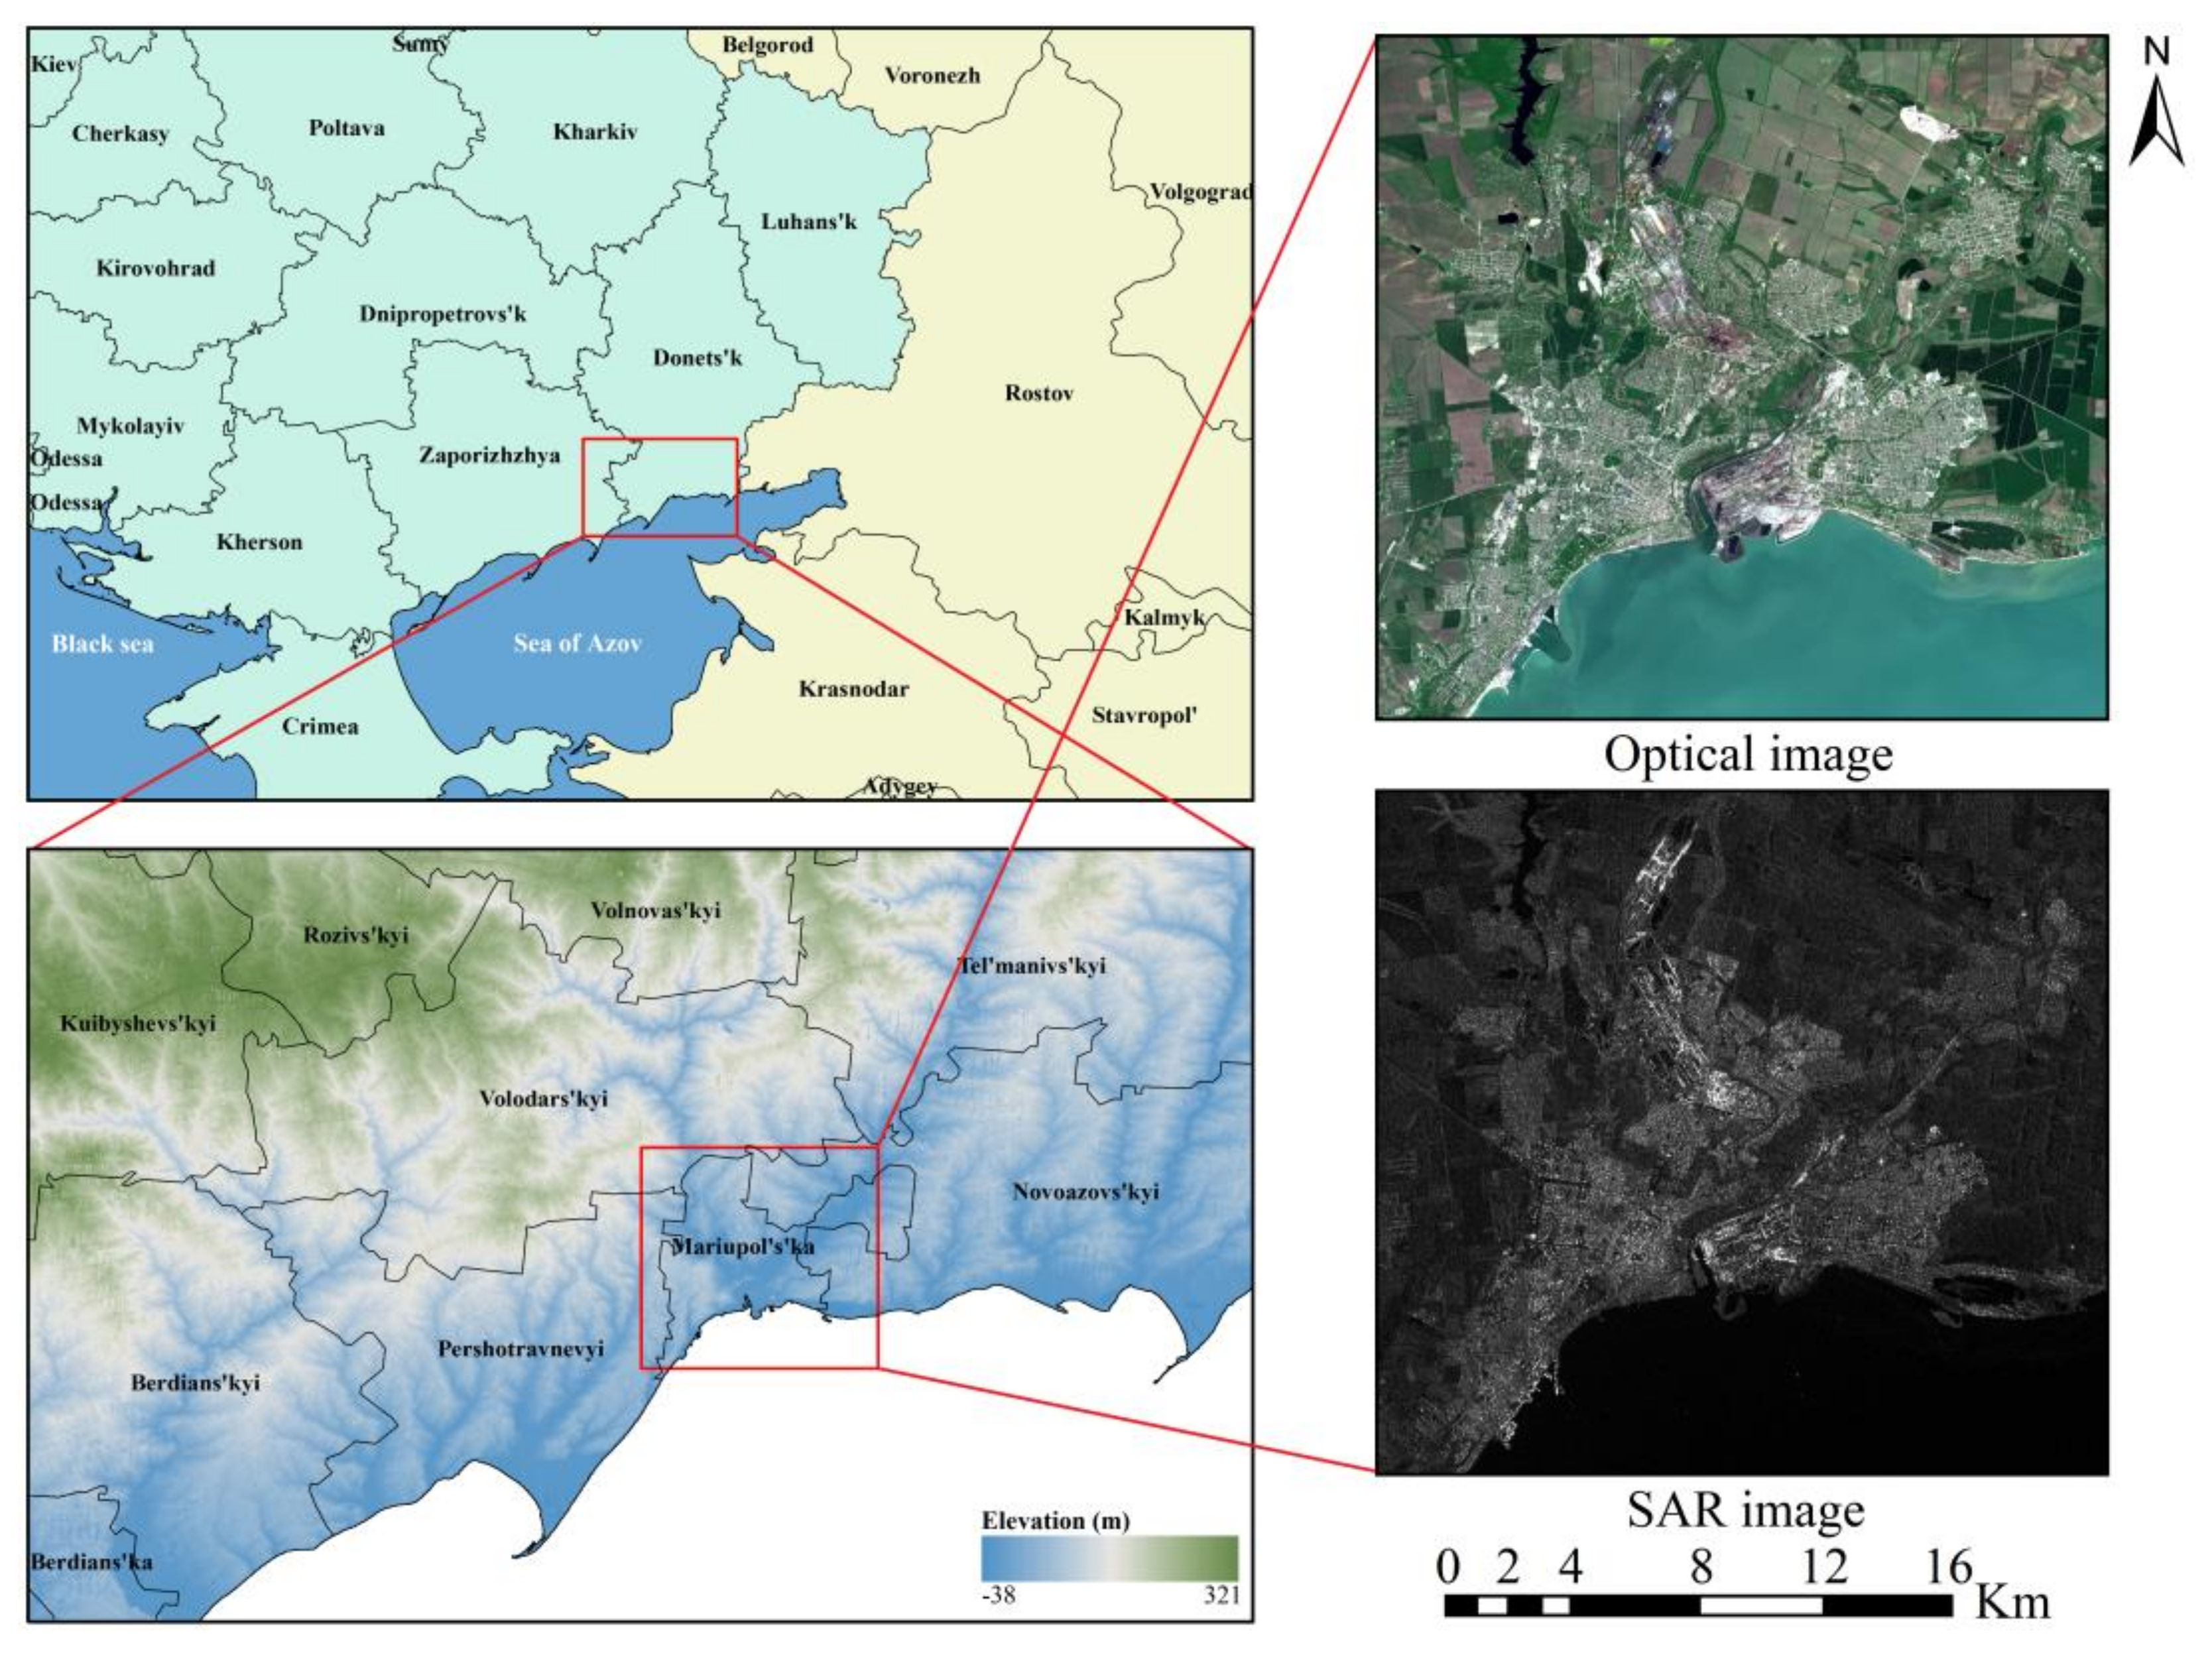
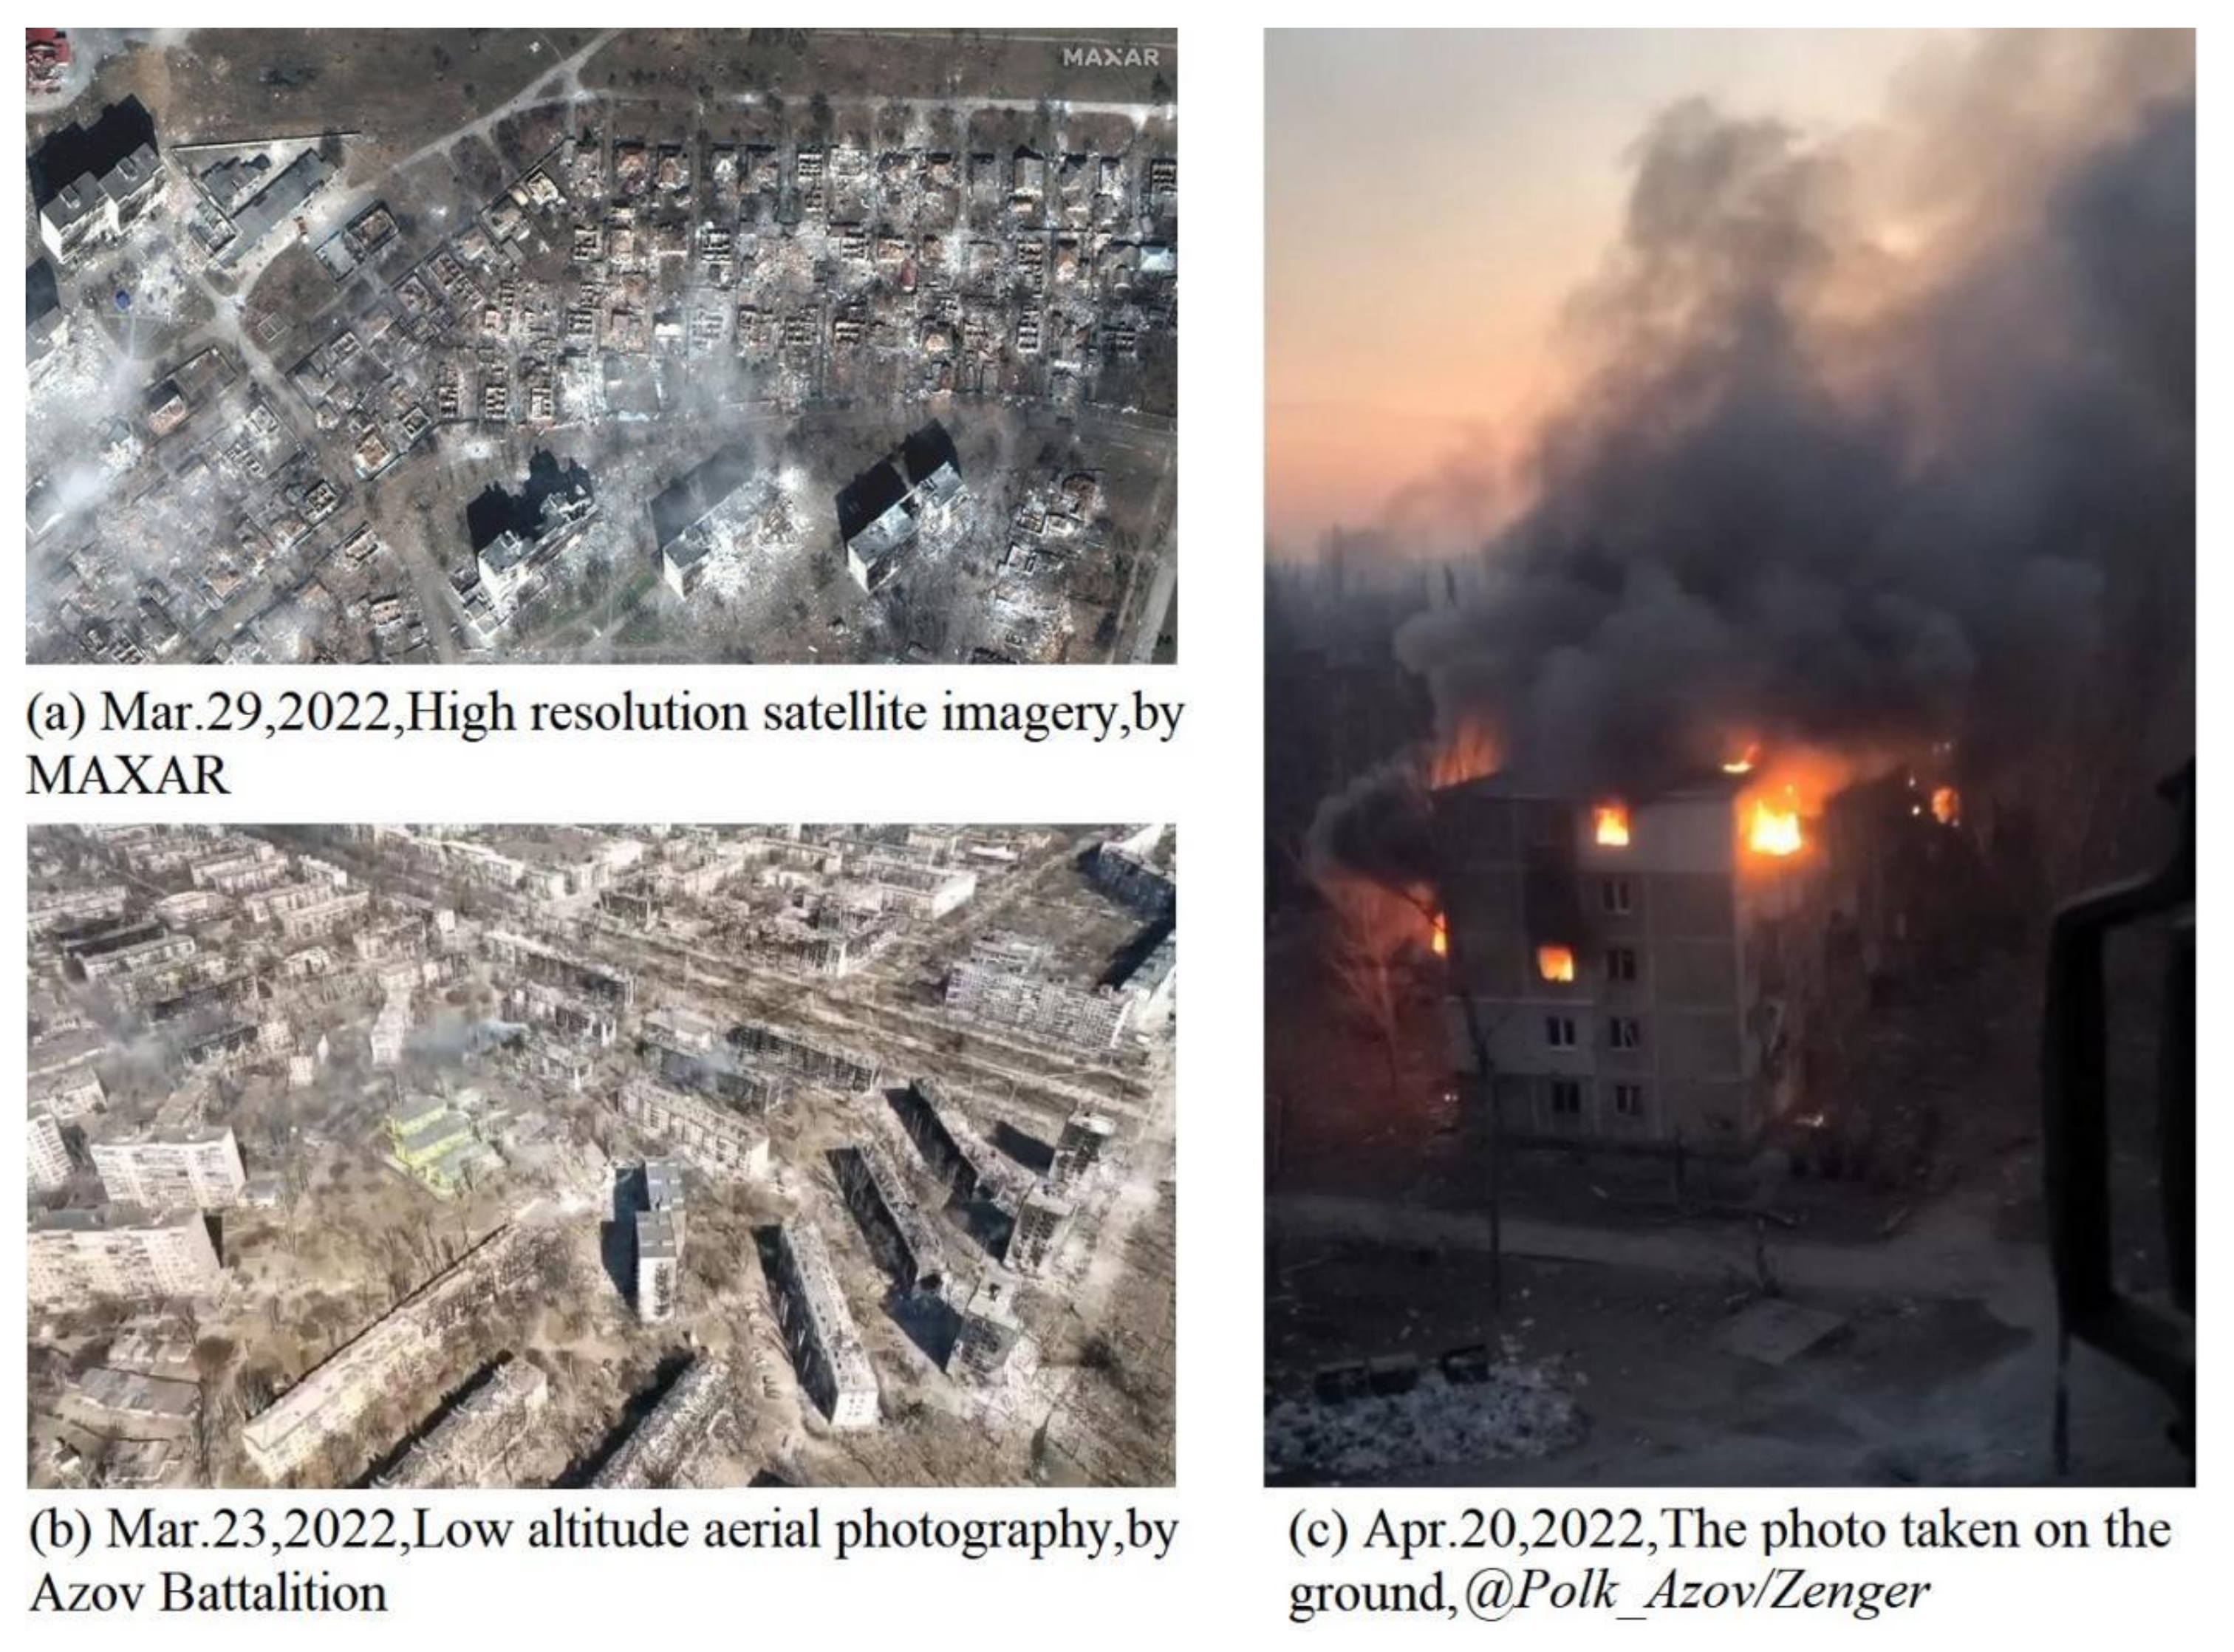
2.1. Study Area
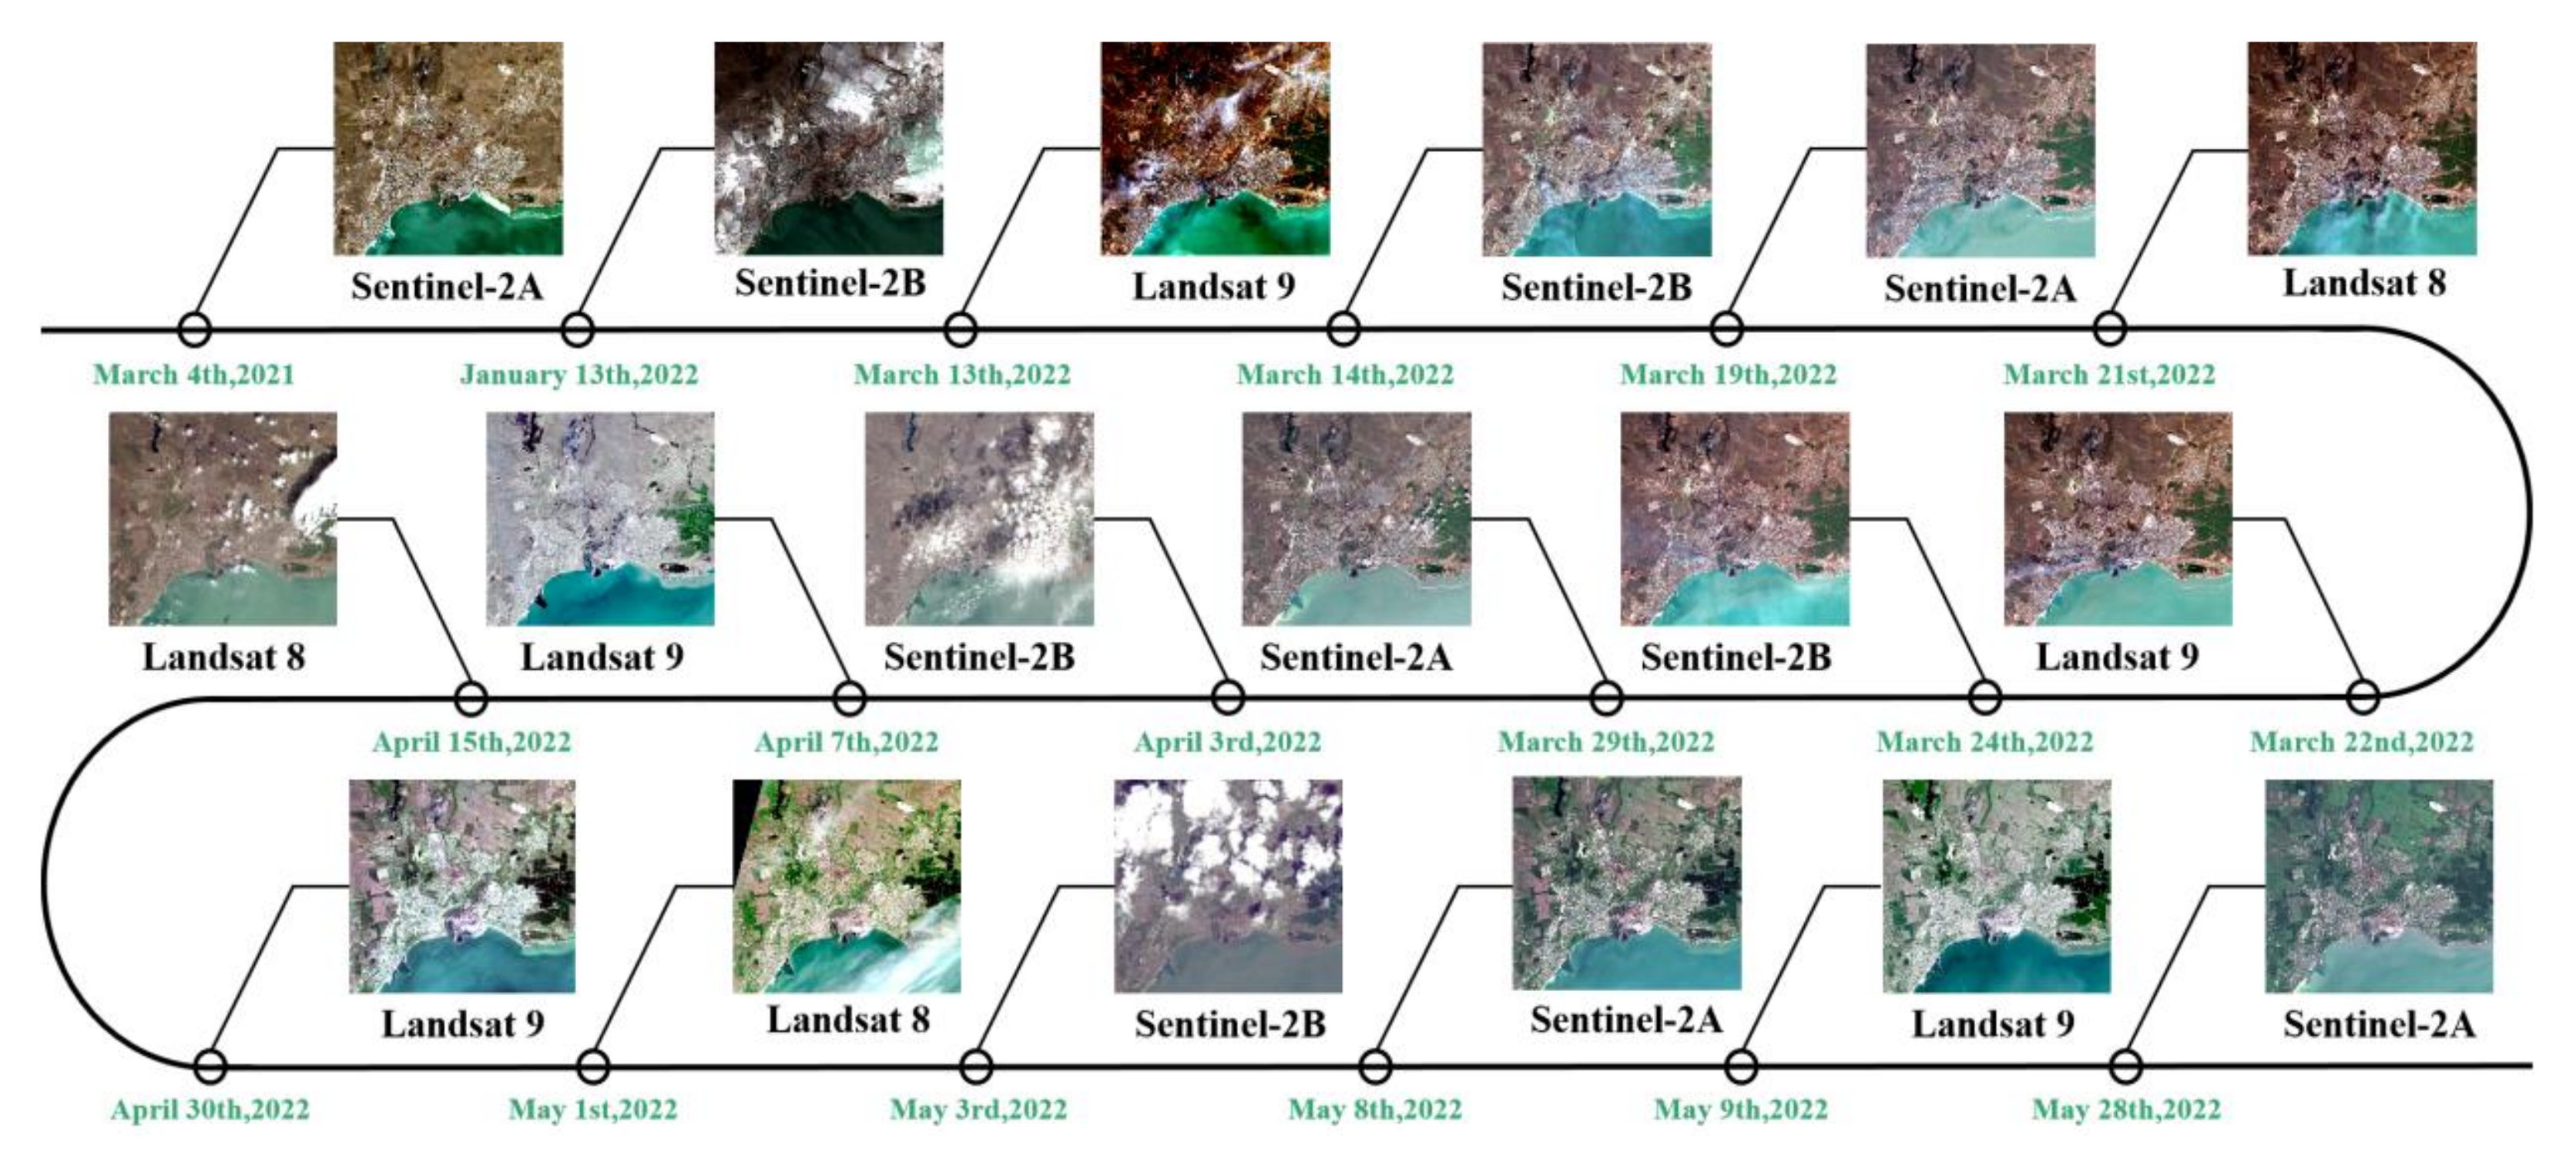
2.2. Data Source
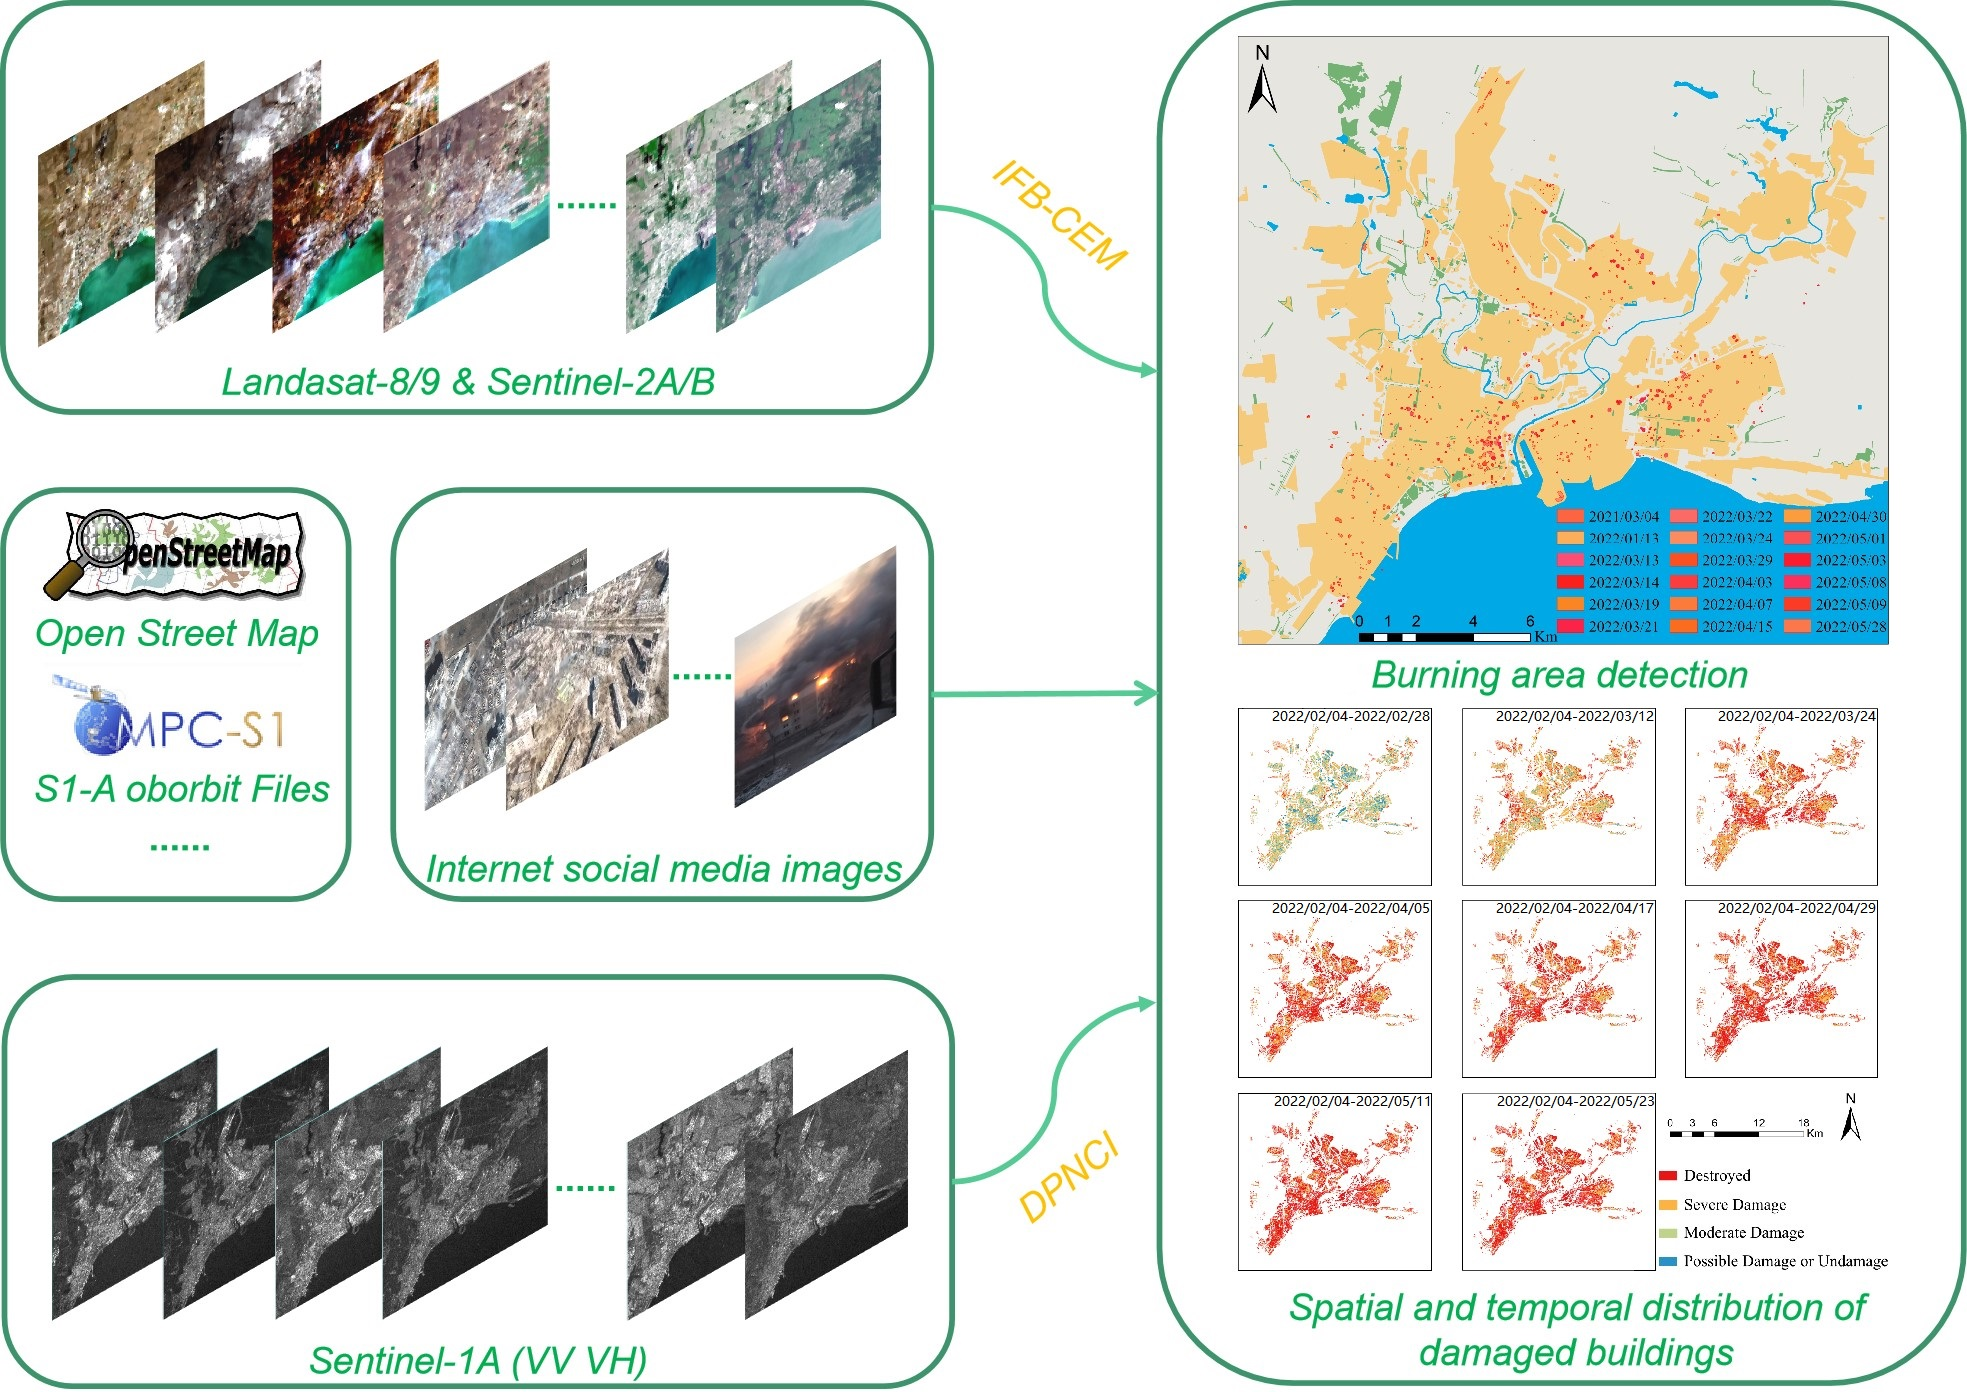
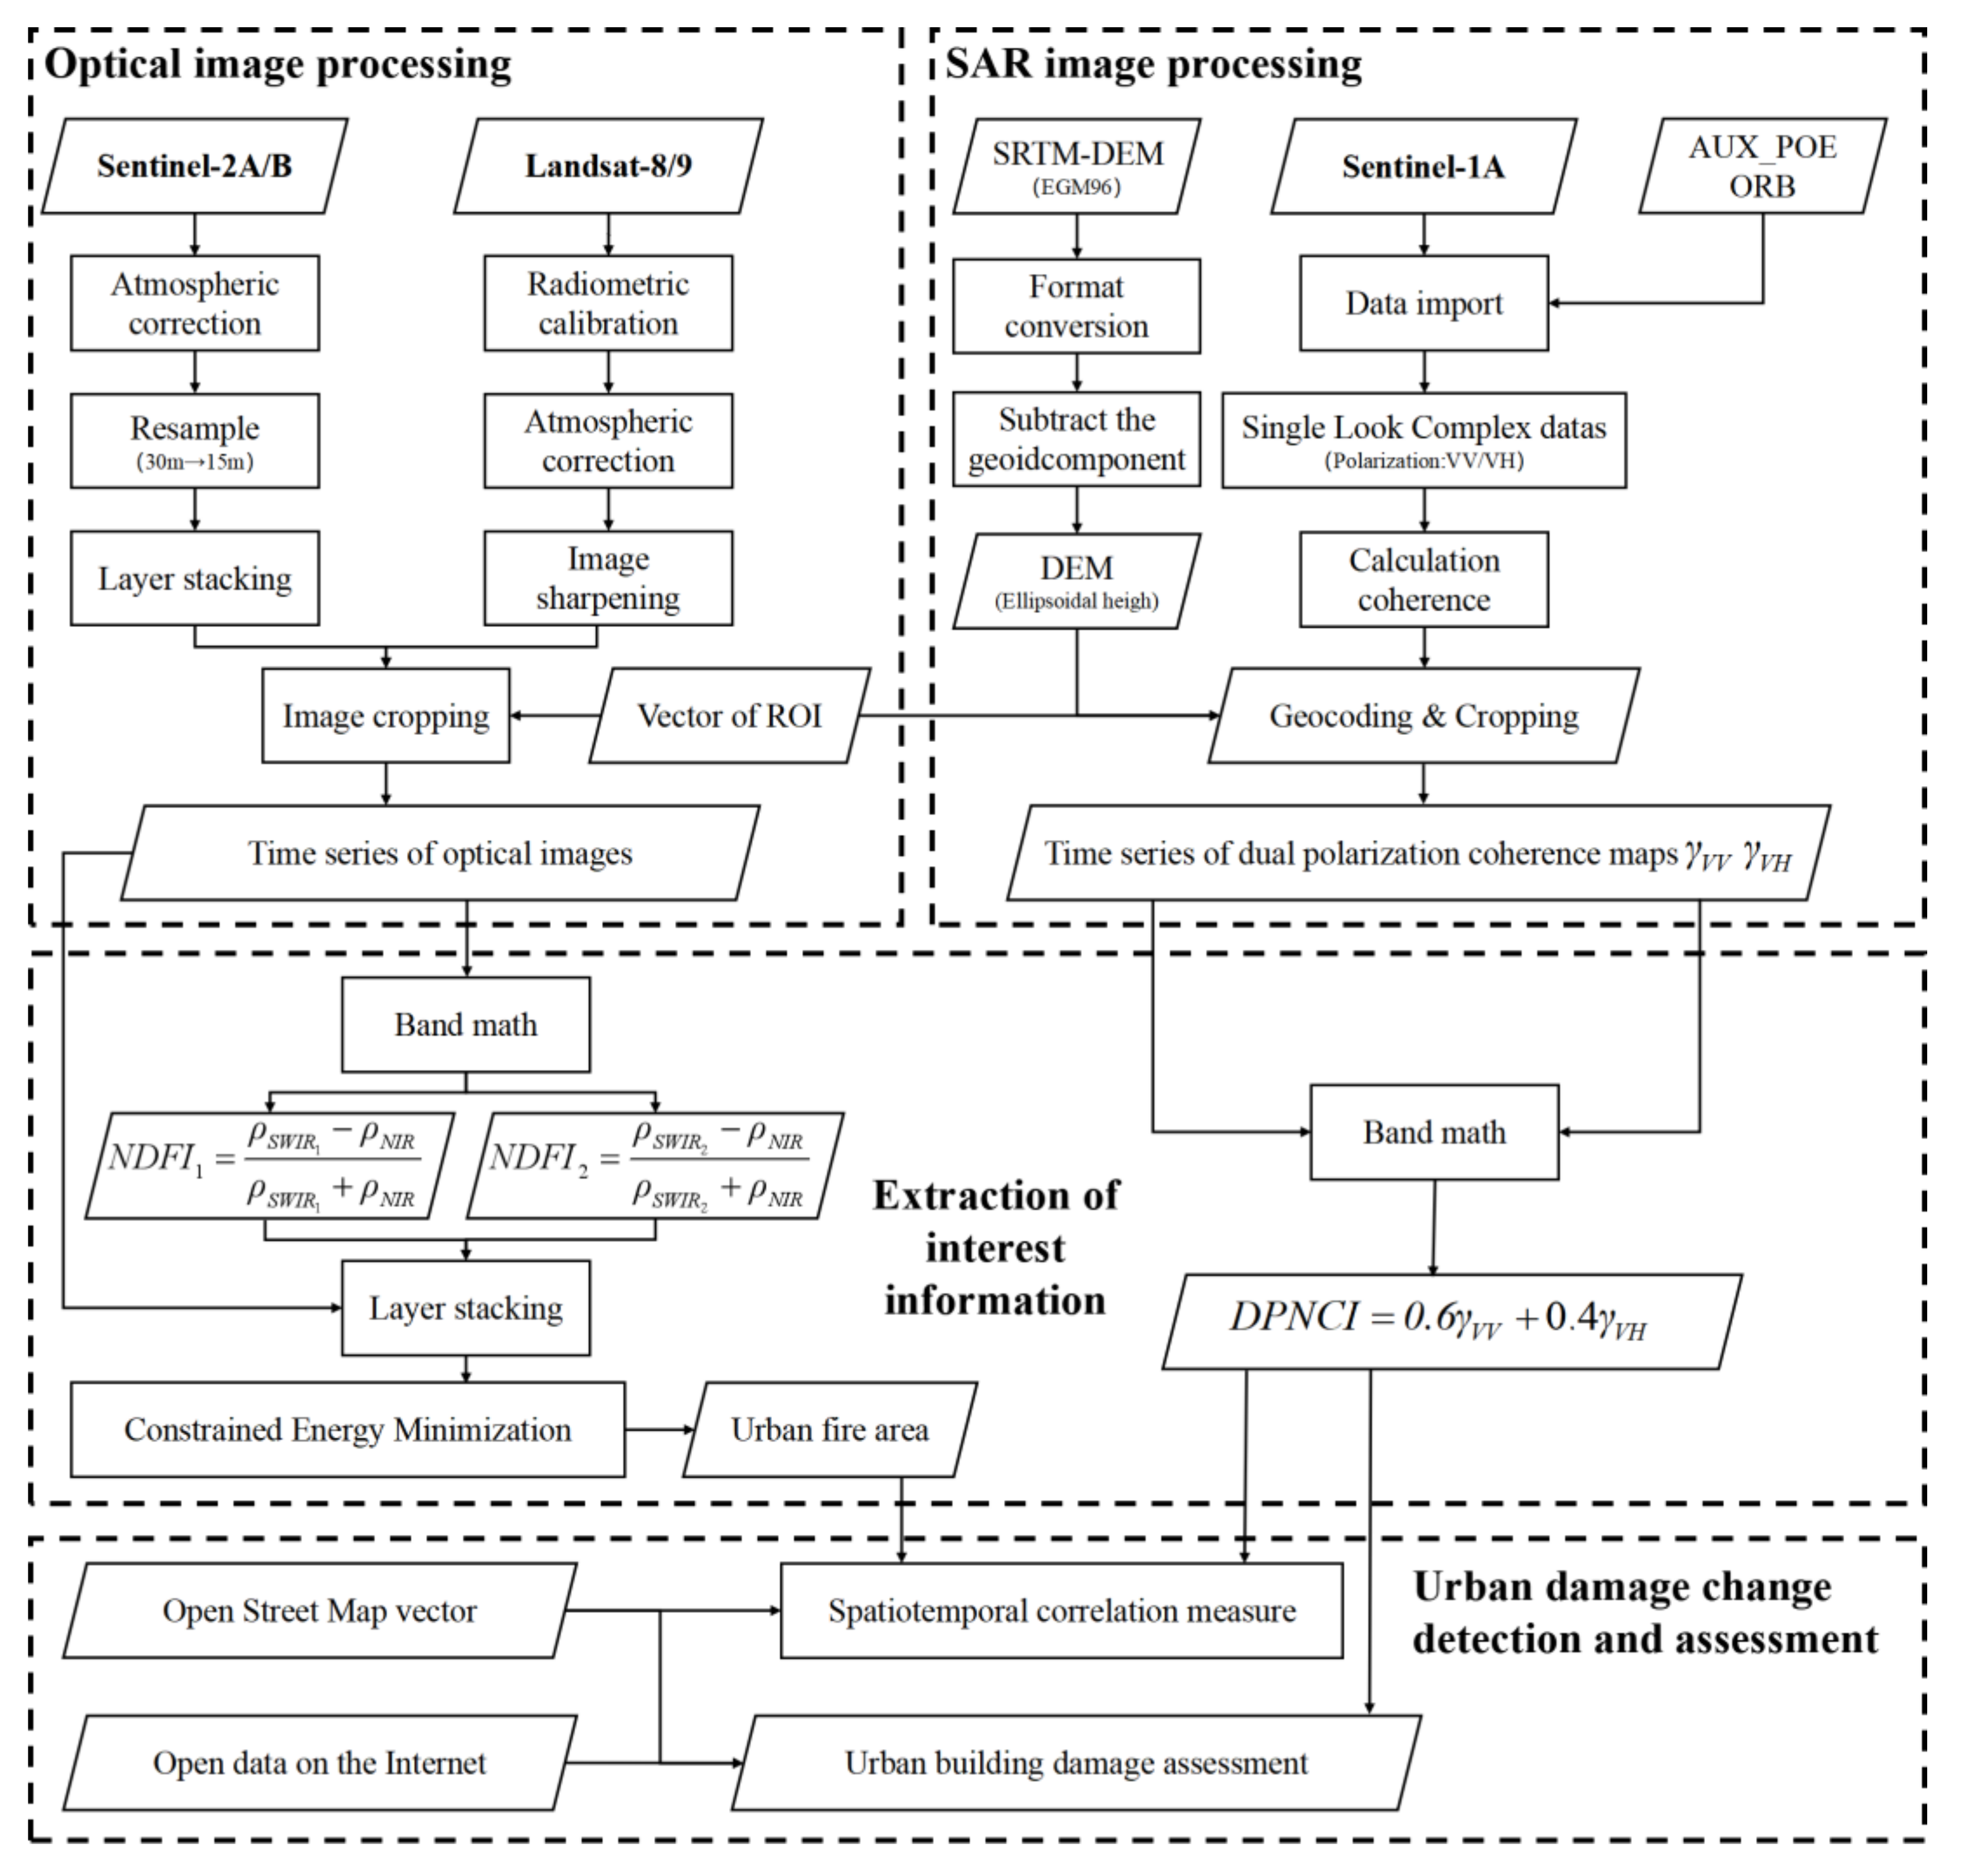
3. Method
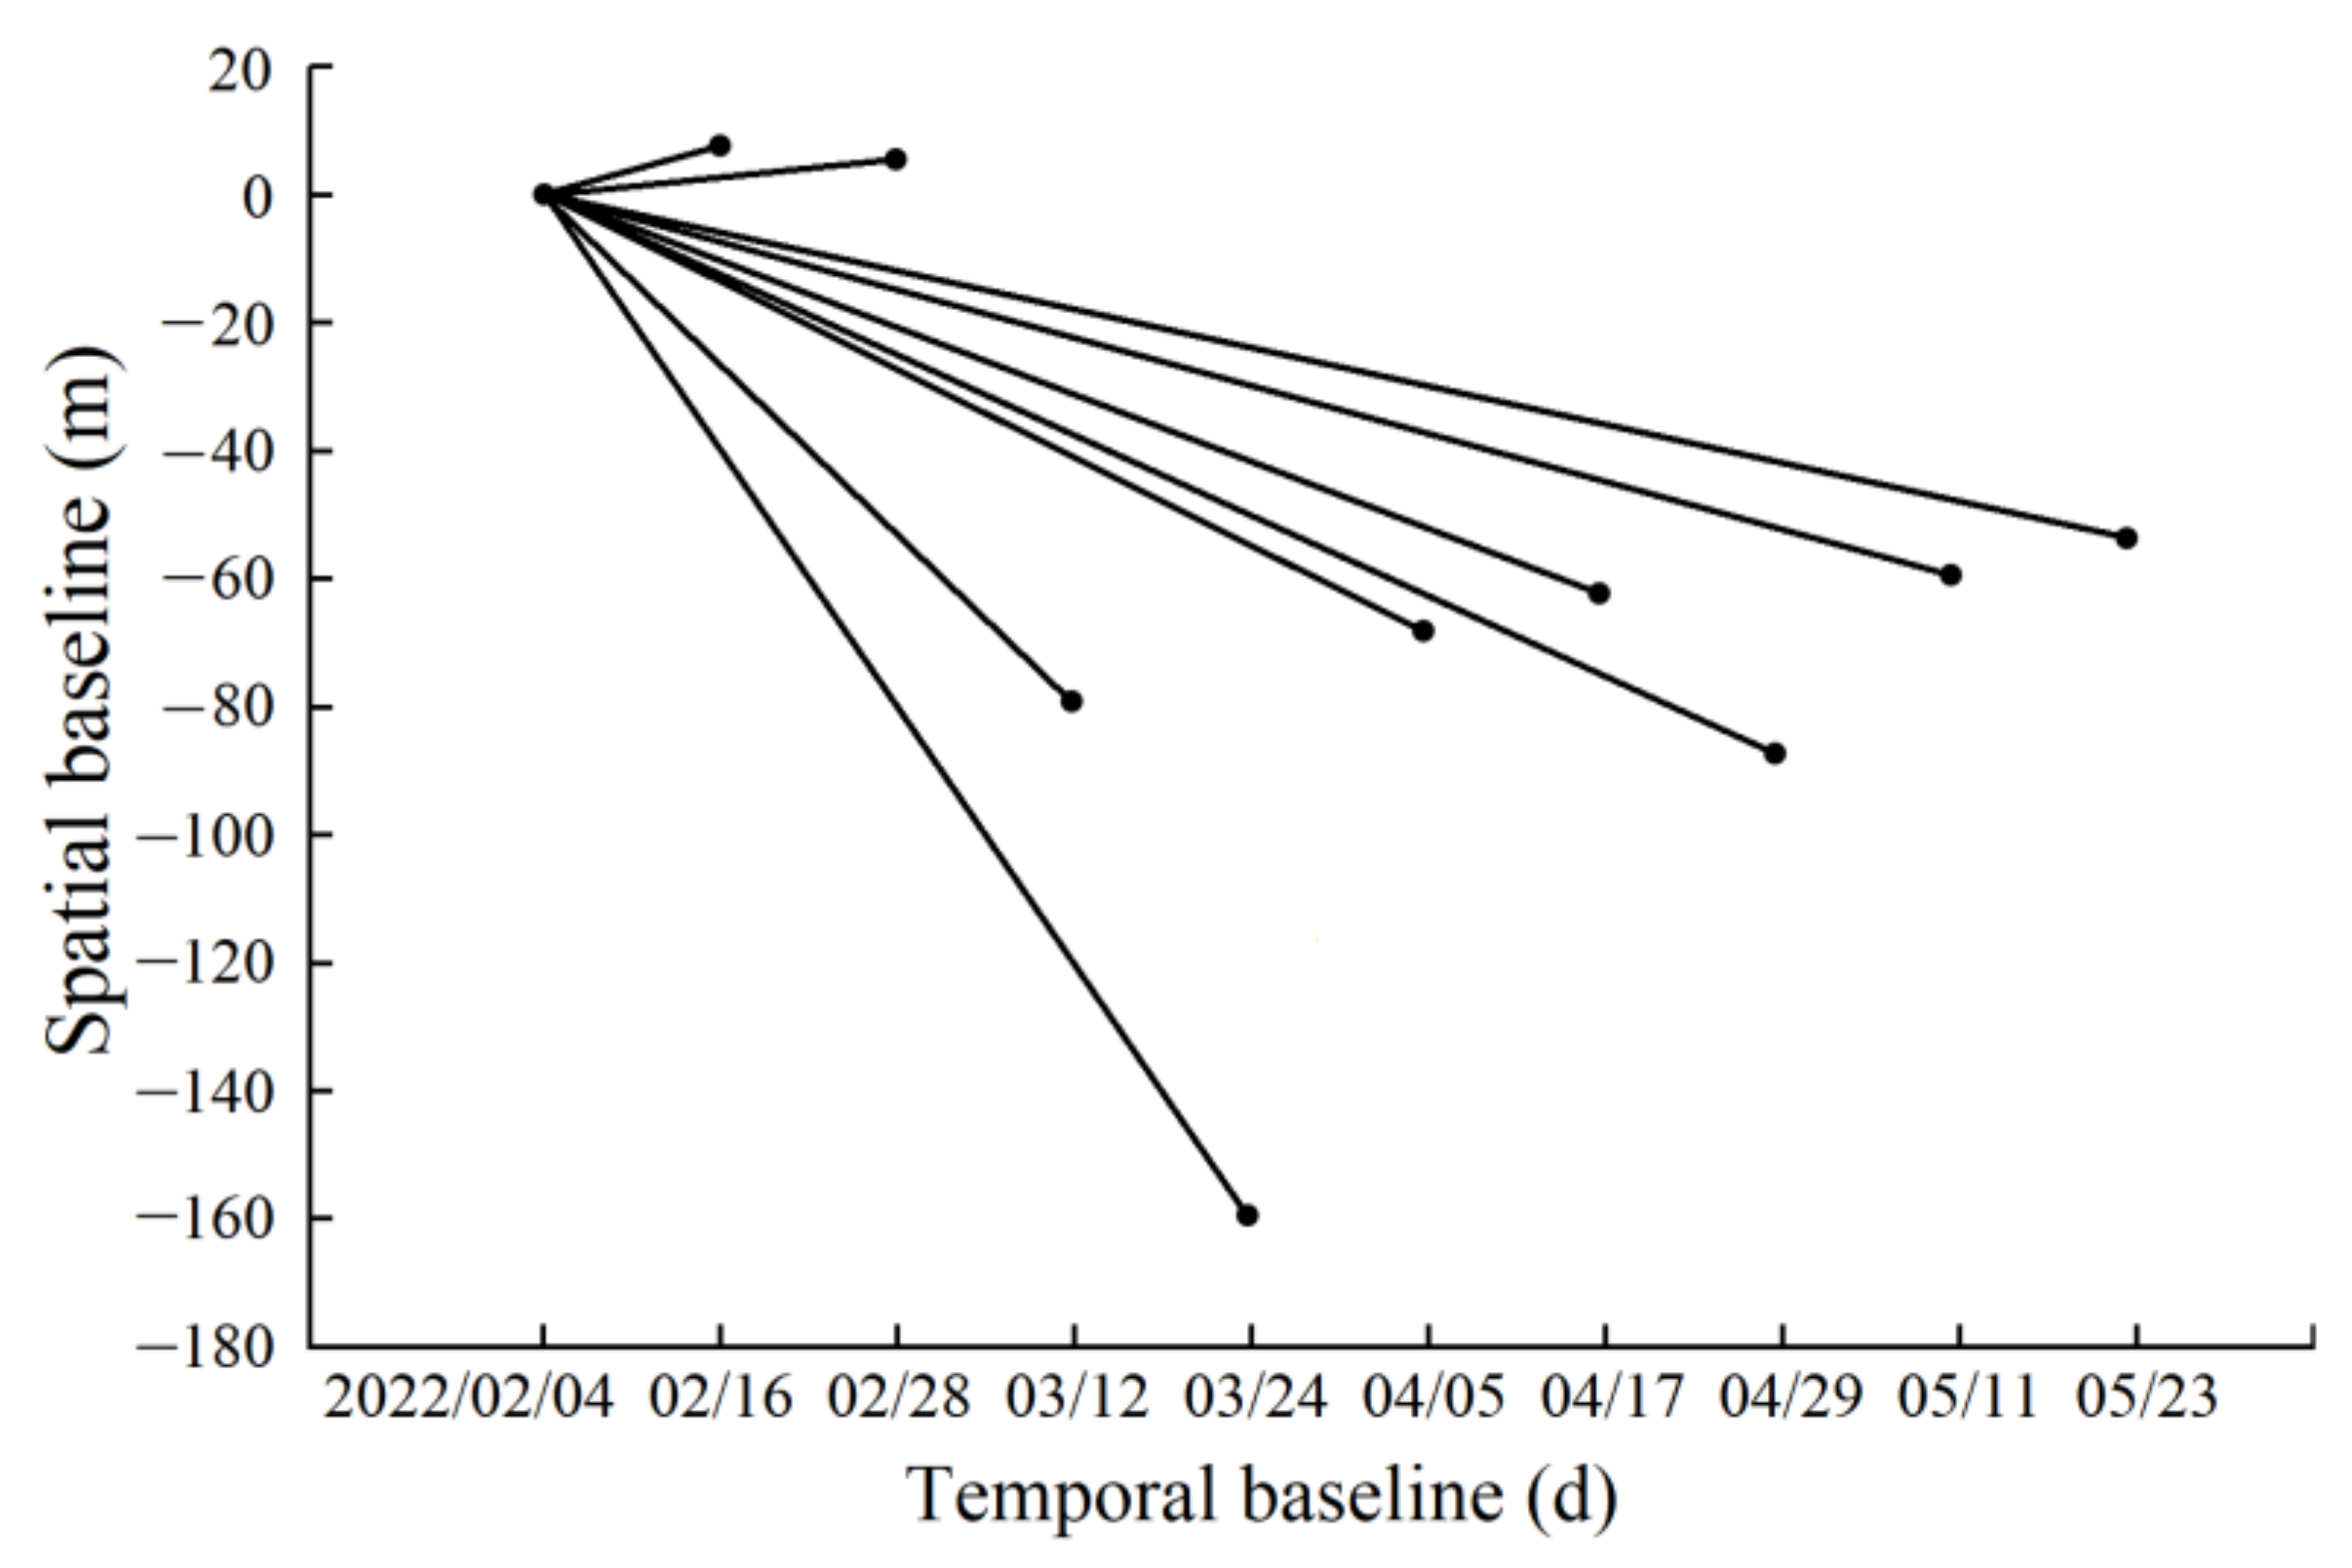
3.1. Preprocessing
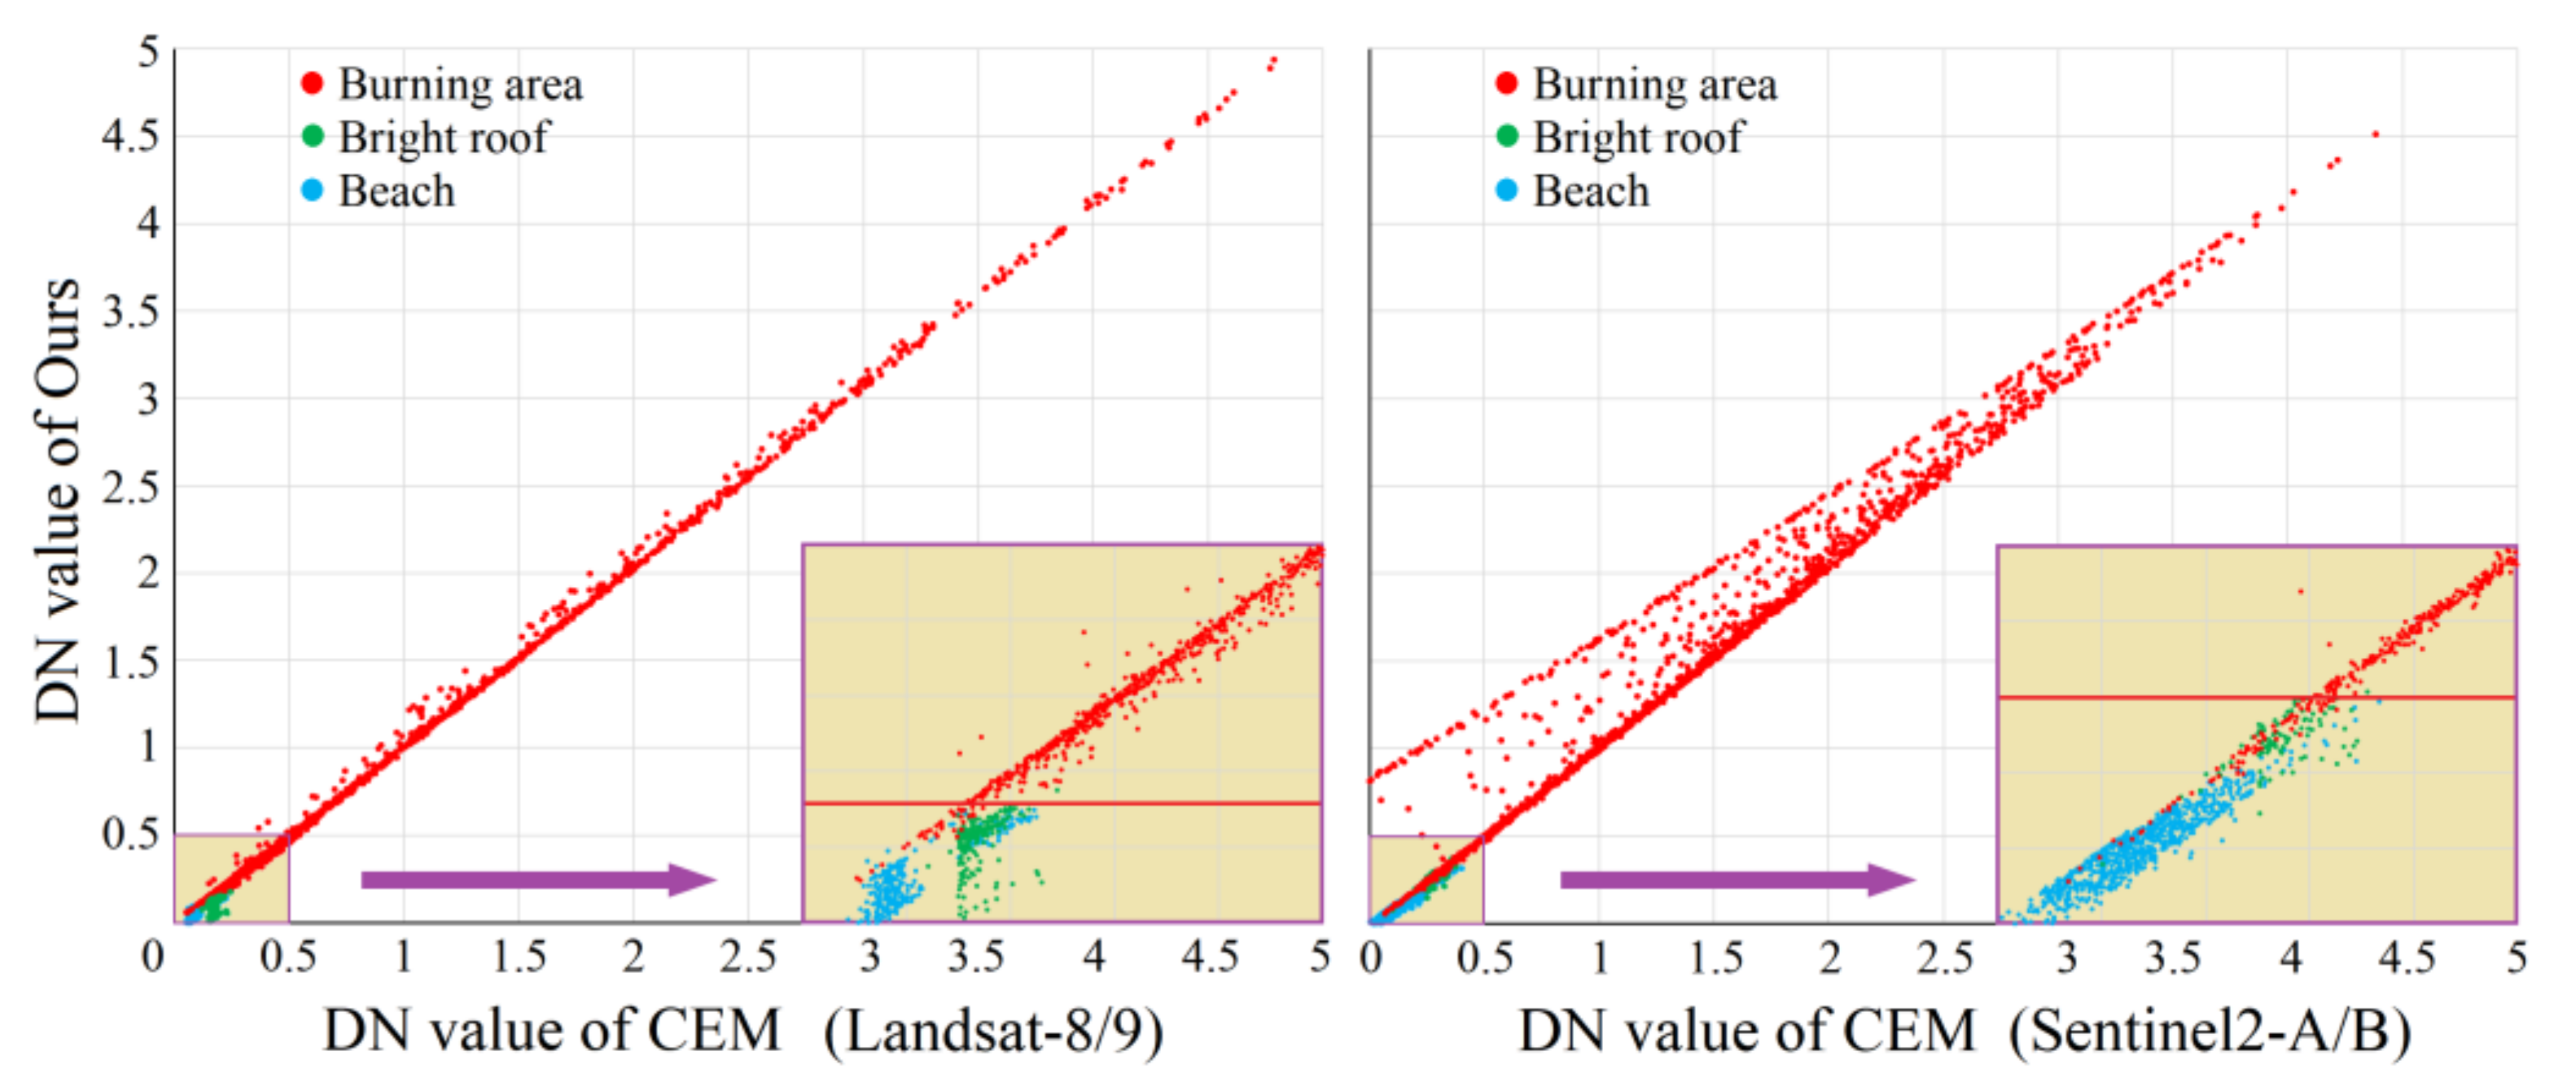
3.2. Constrained Energy Minimization Algorithm Incorporating the Feature Bands
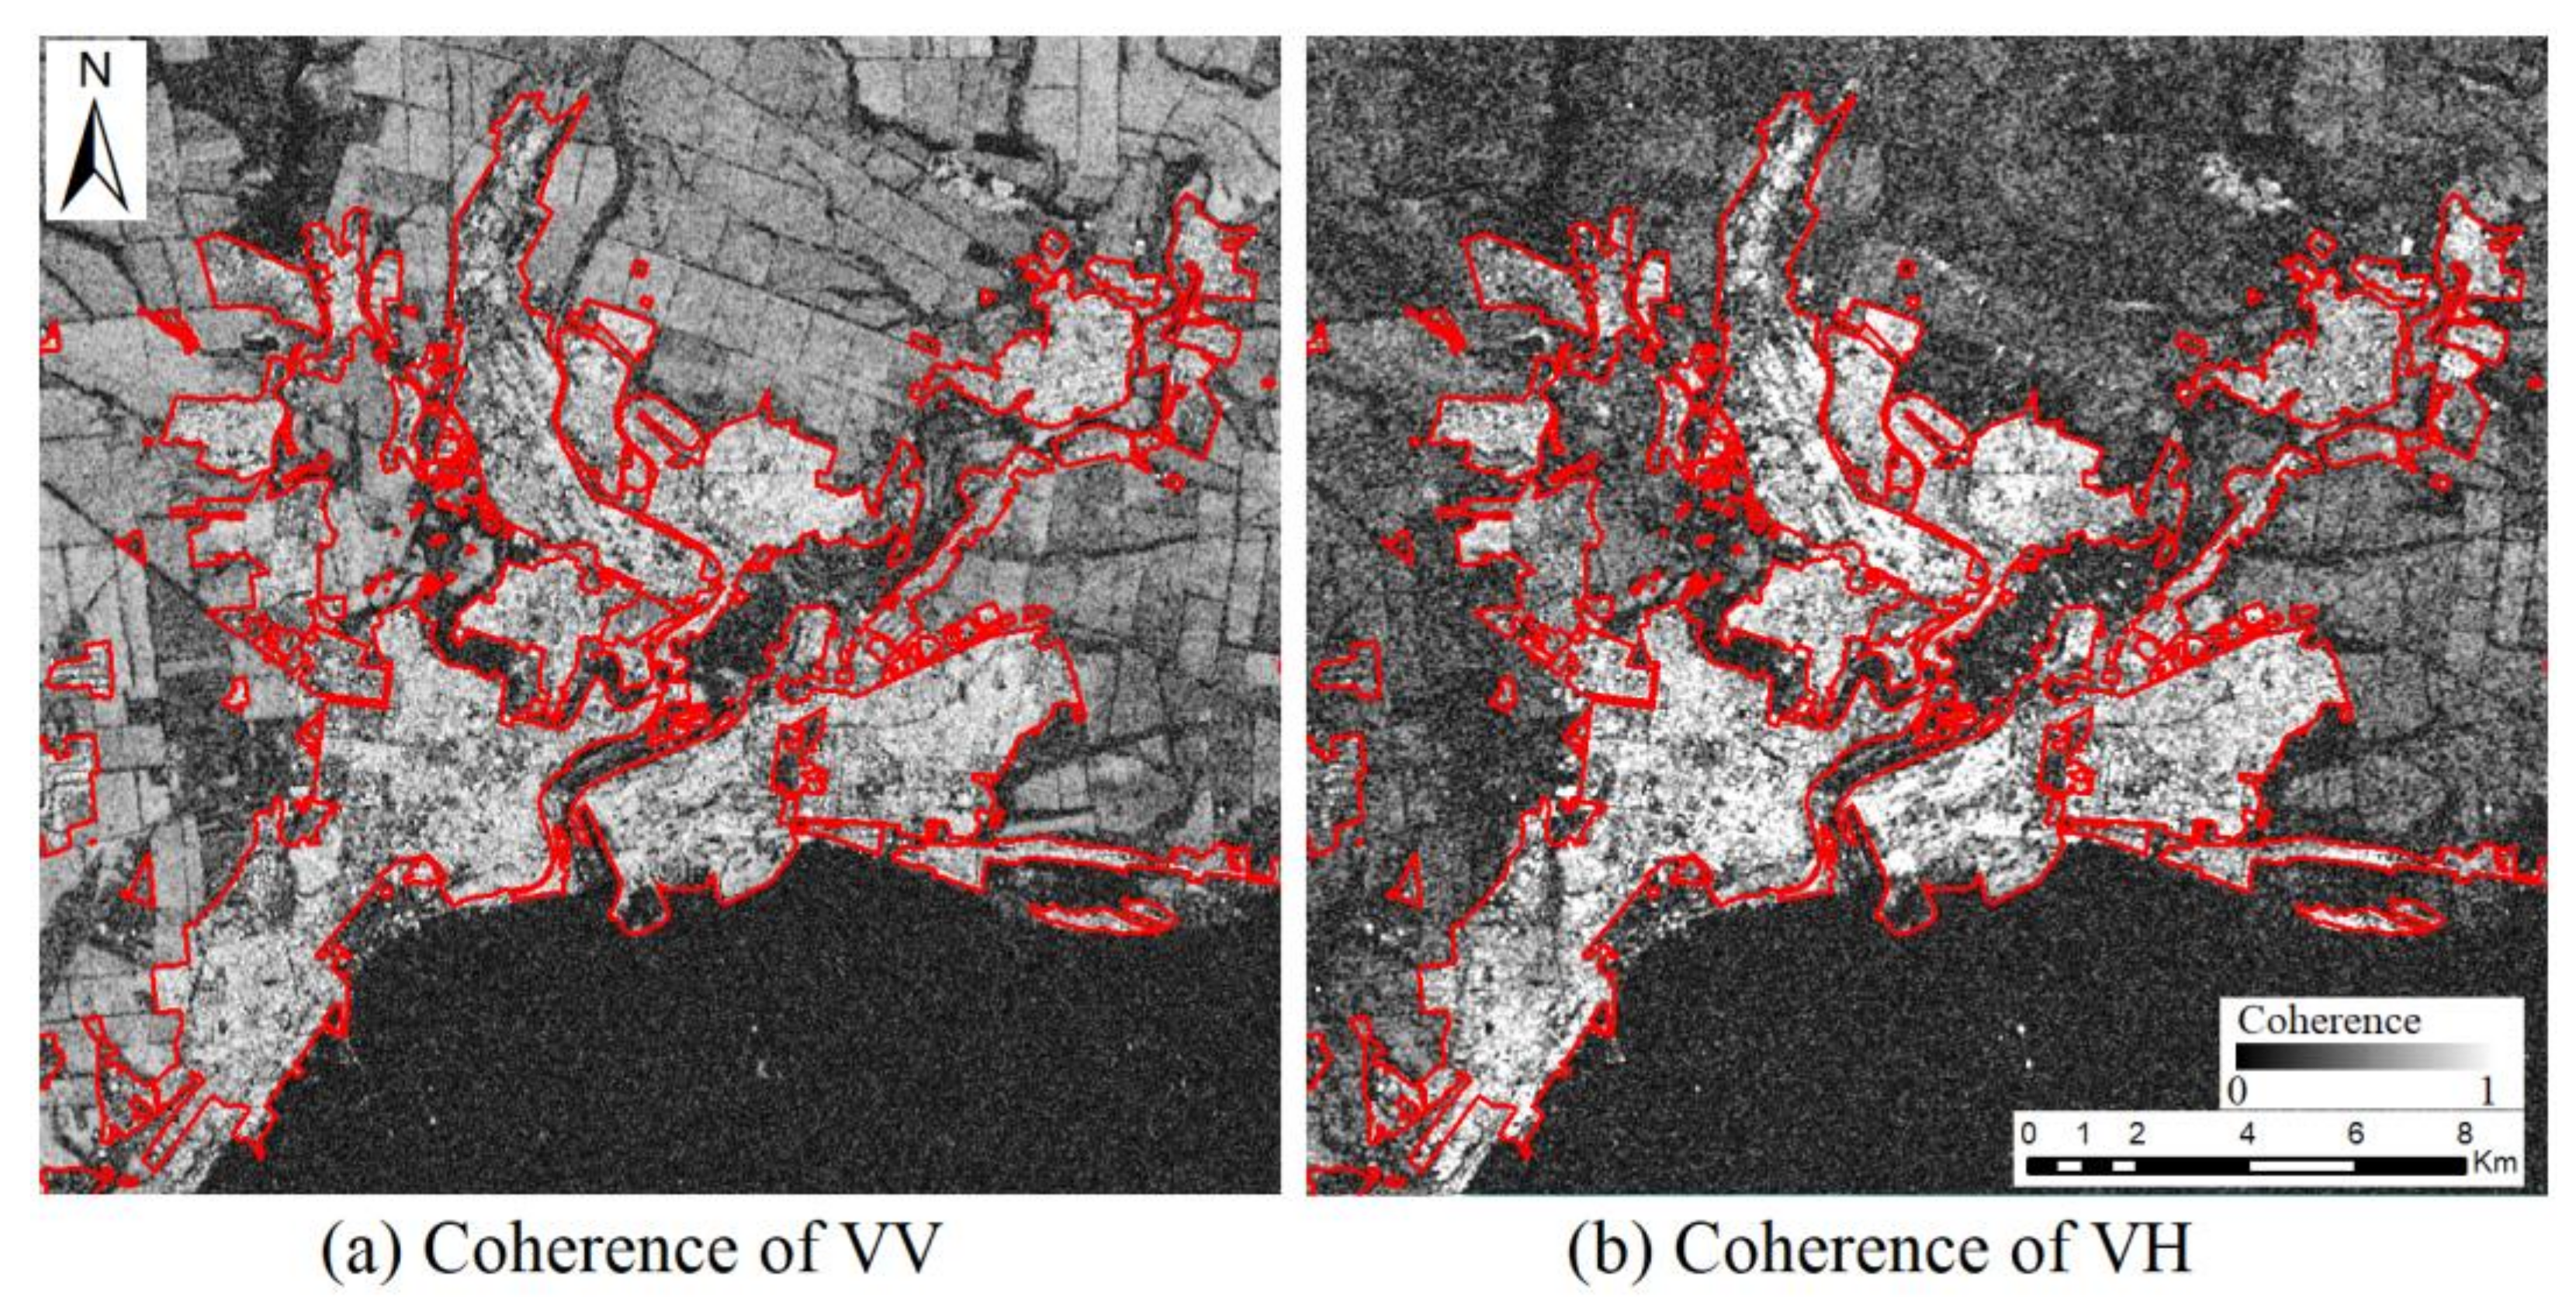
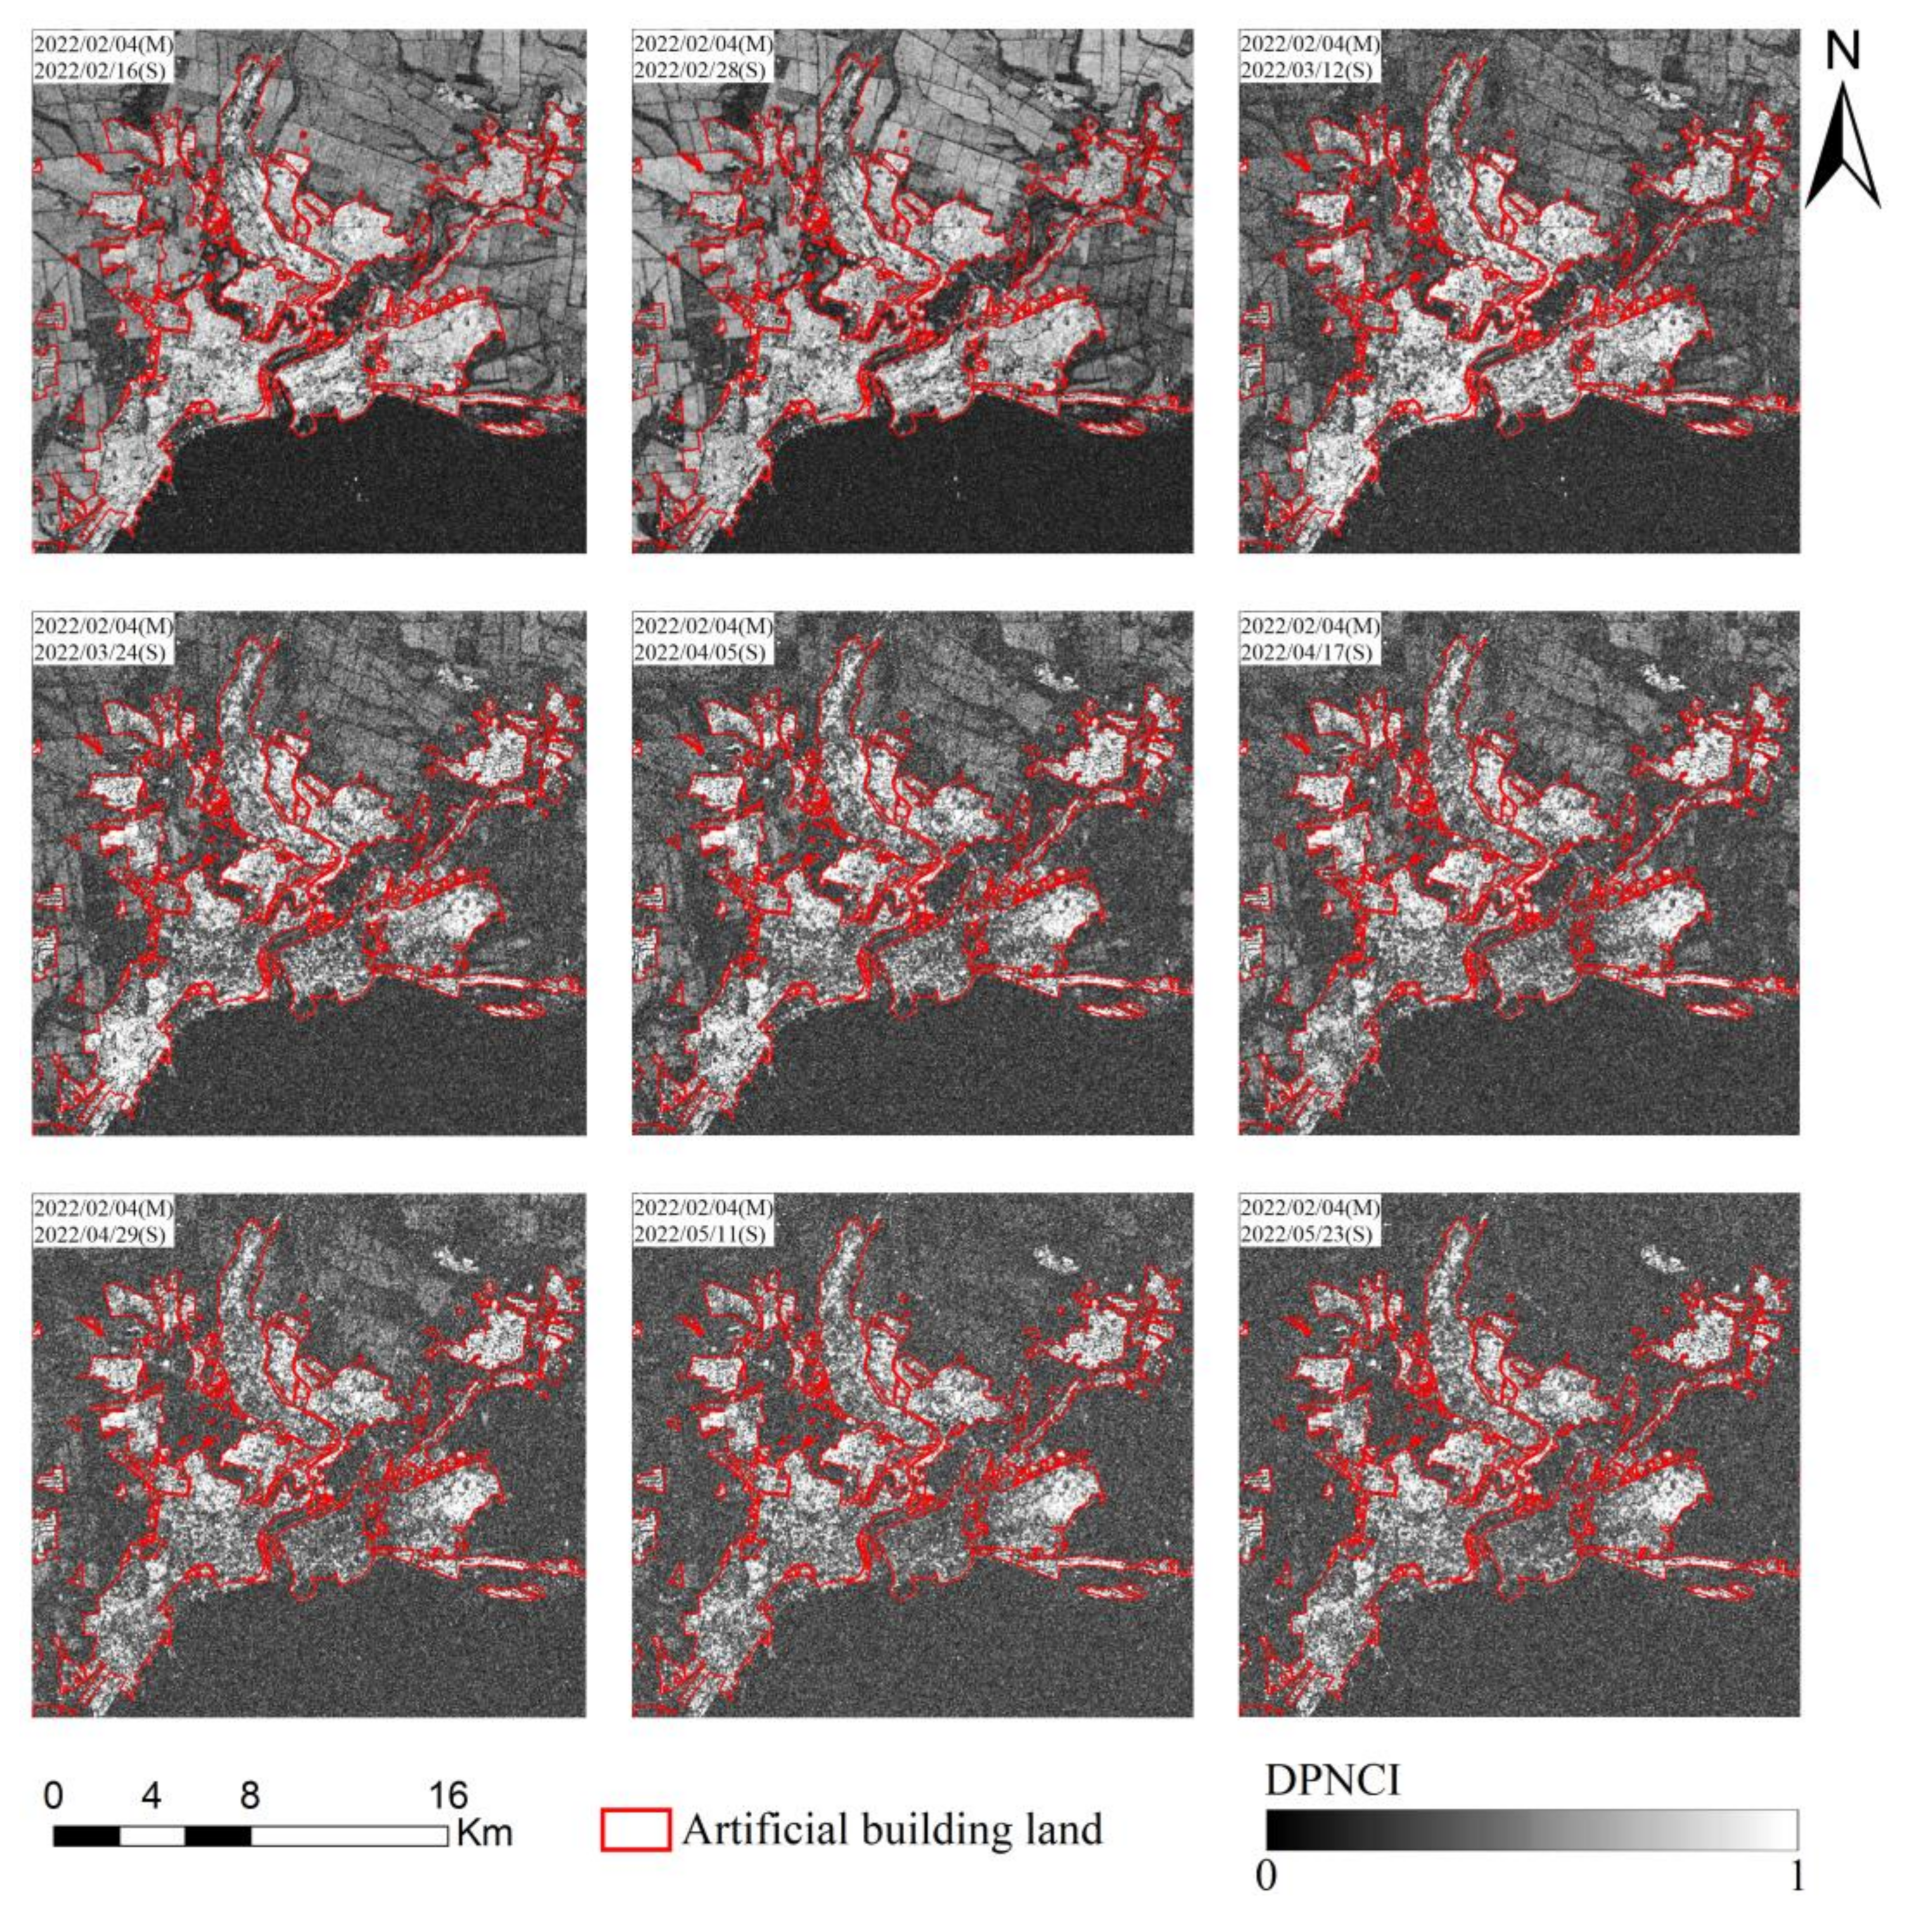
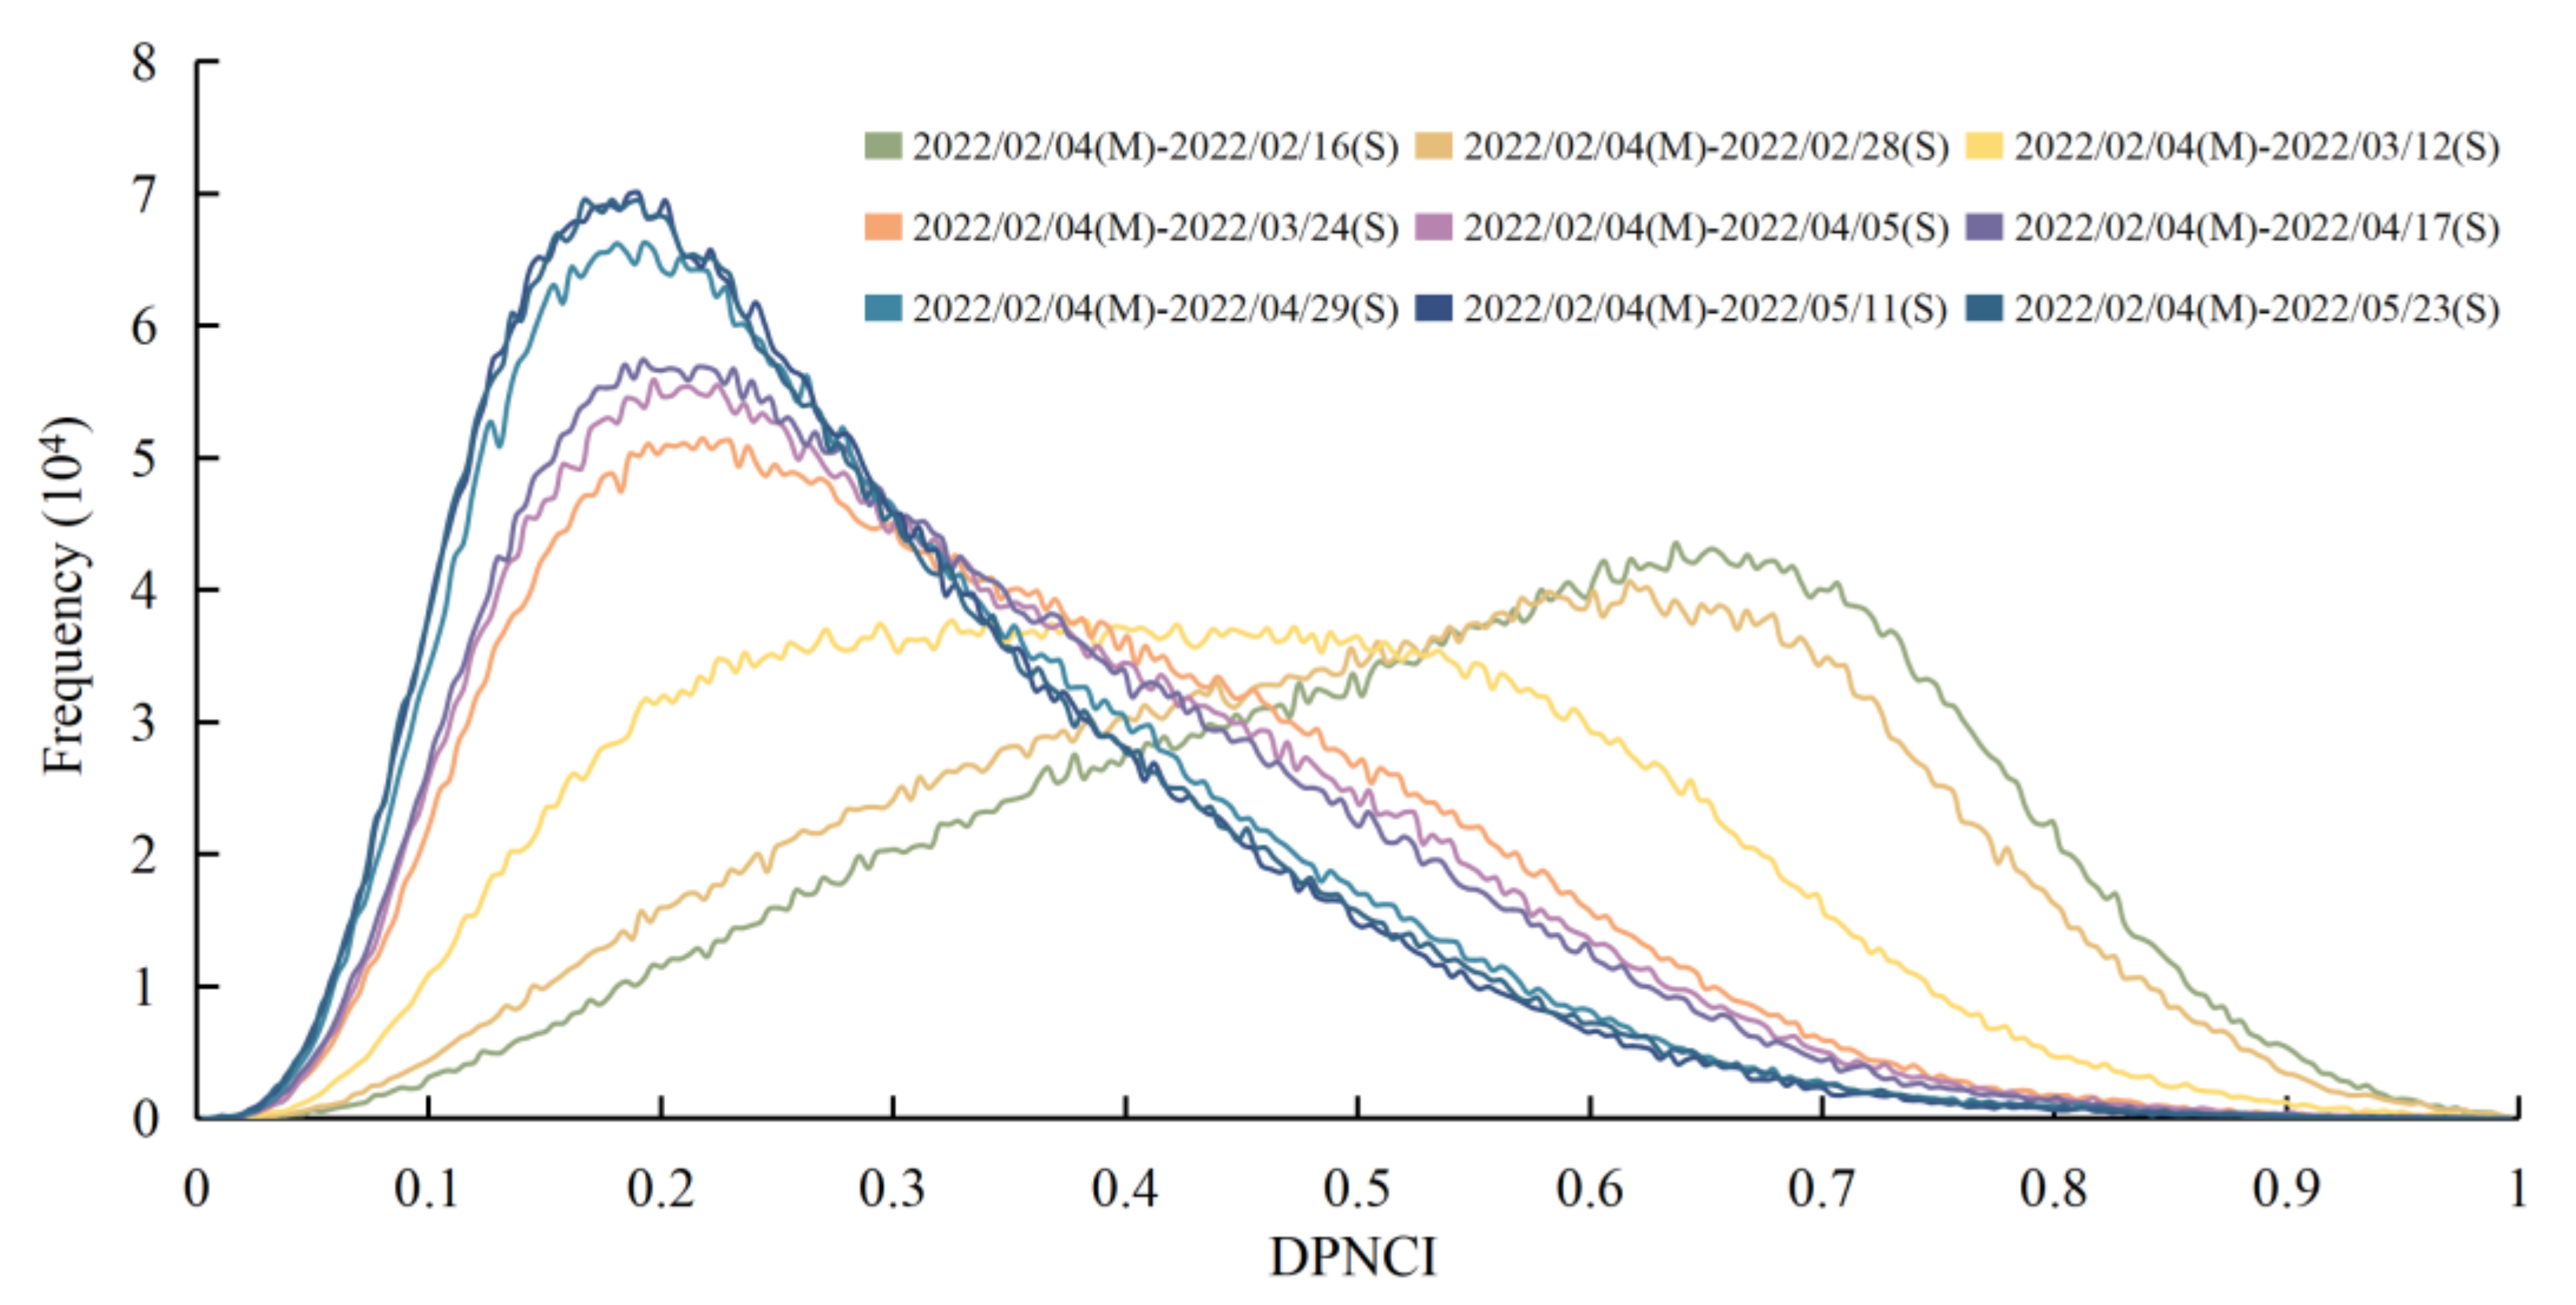
3.3. Dual Polarization Coherence Change Detection
4. Results and Analysis
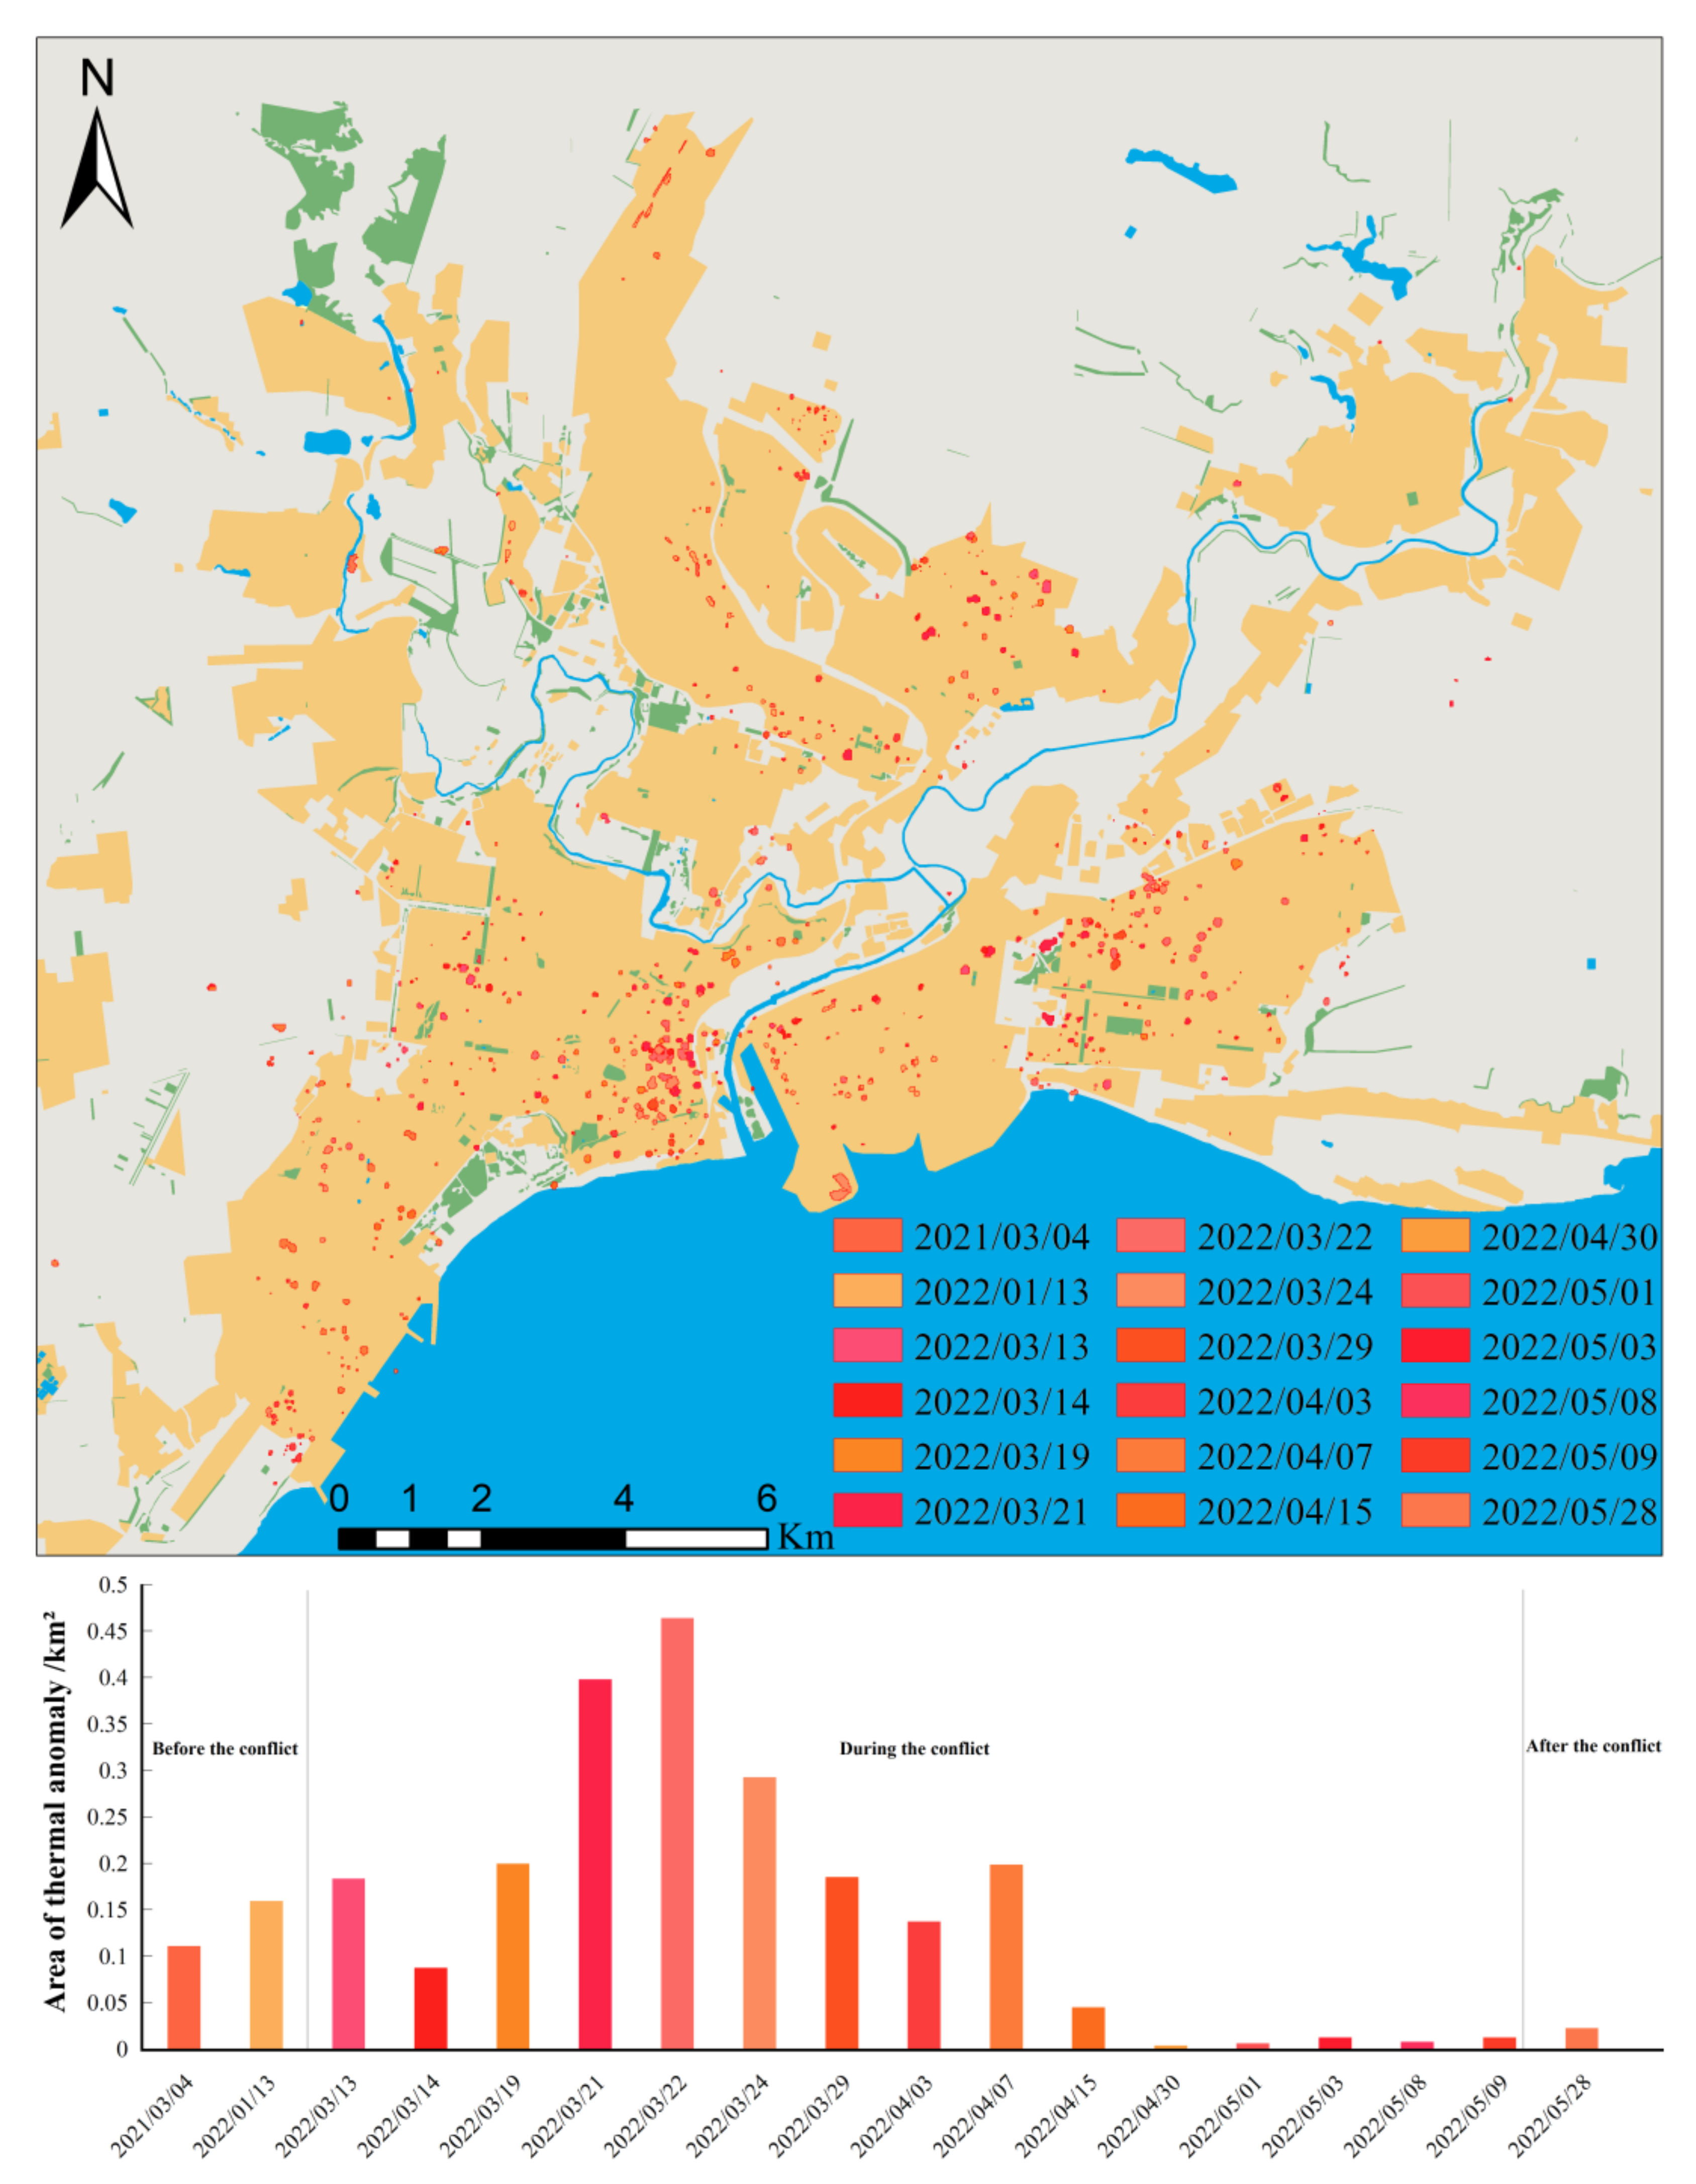
4.1. Urban Burning Area Detection
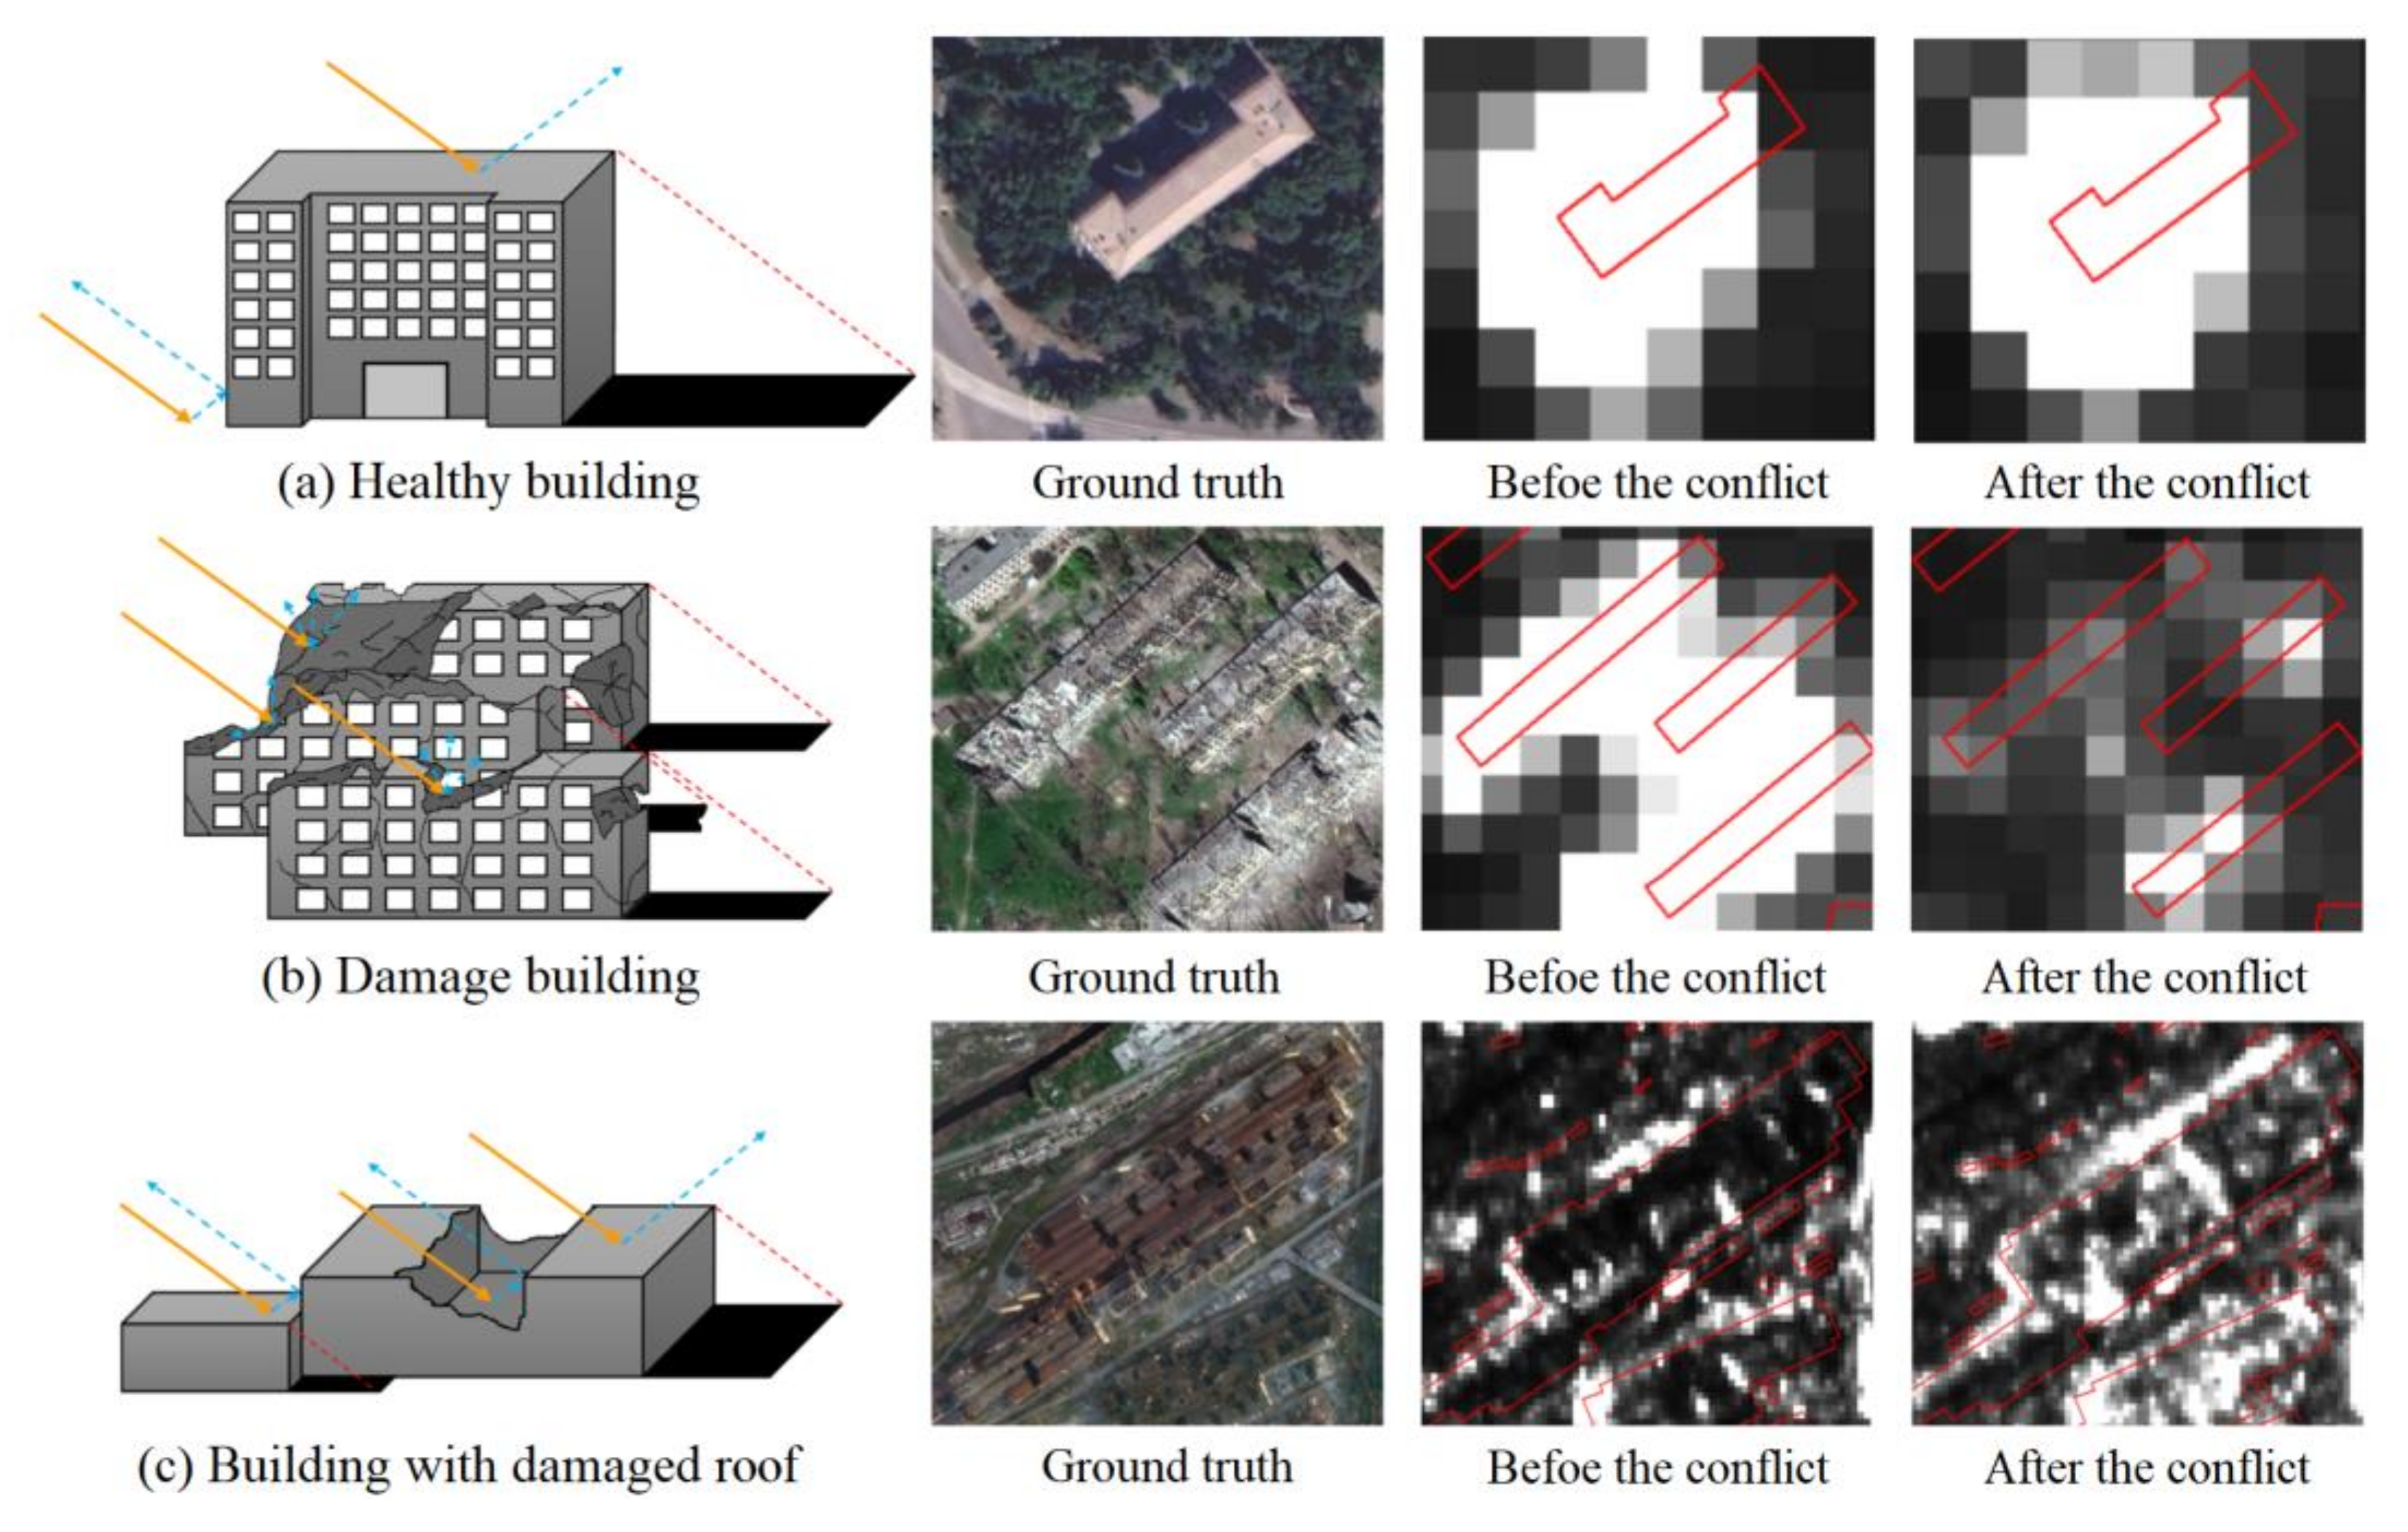
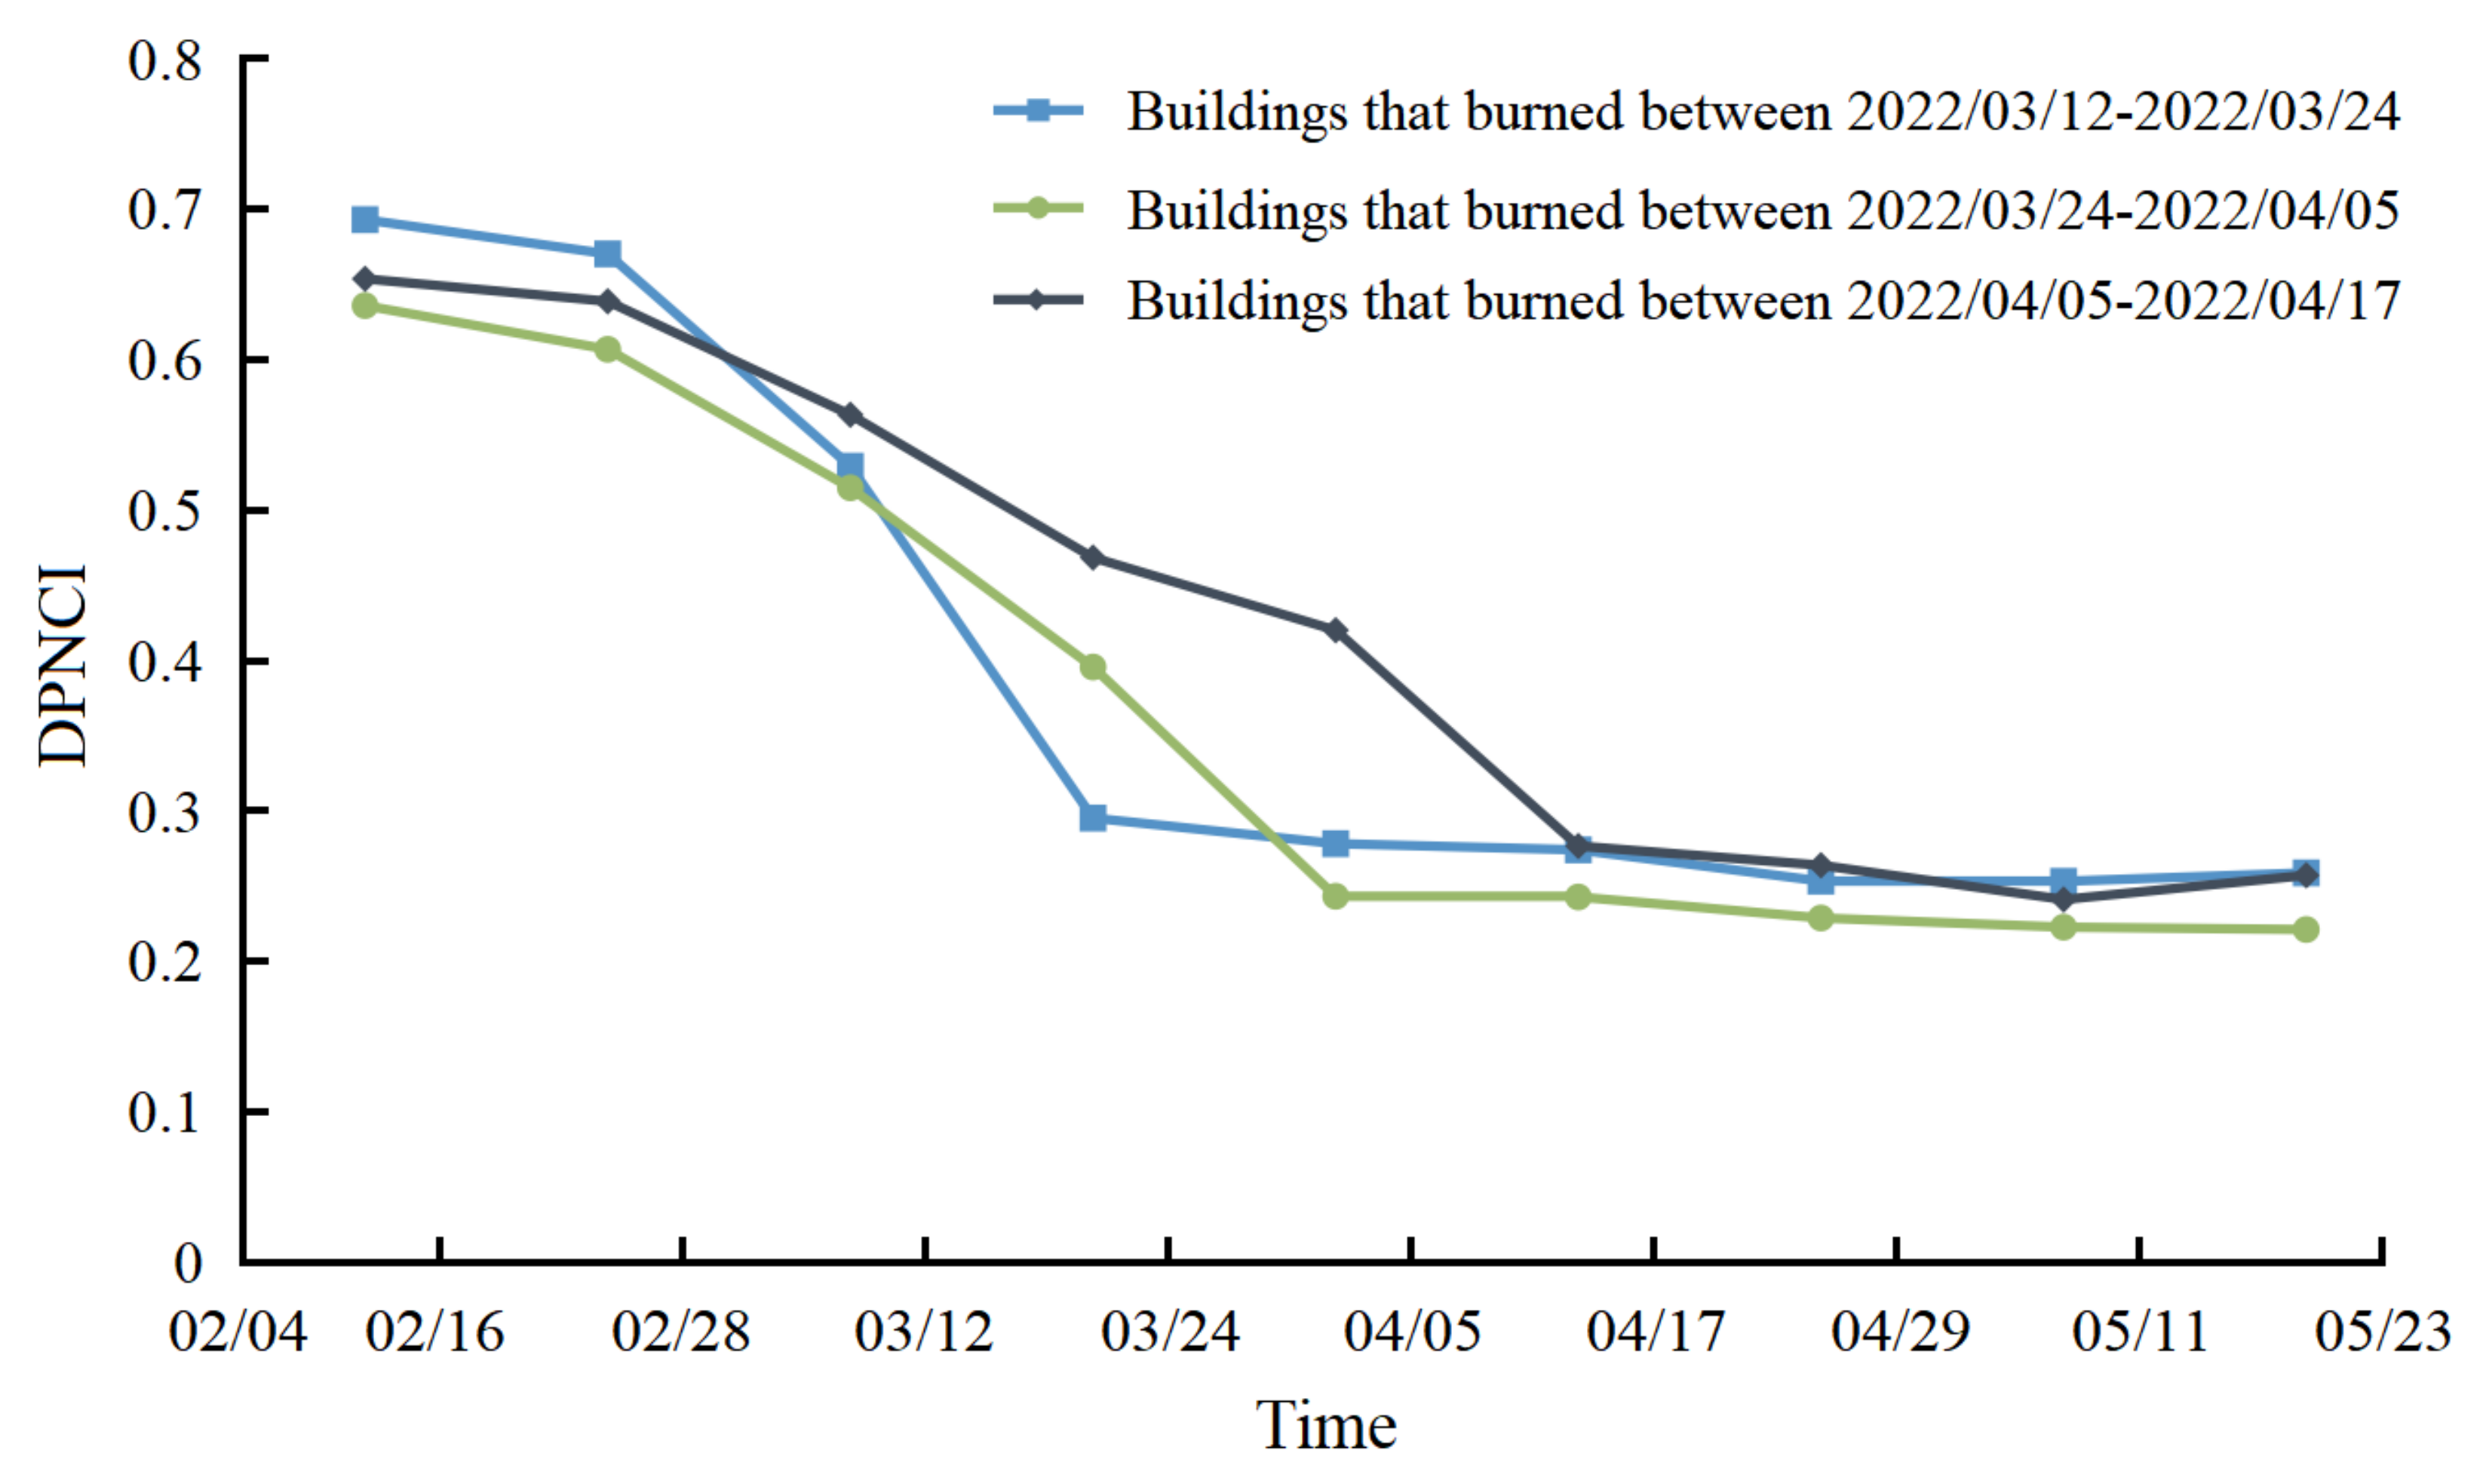
4.2. Change Detection of Destroyed Buildings
5. Discussion
6. Conclusions
Author Contributions
Funding
Data Availability Statement
Acknowledgments
Conflicts of Interest
References
- Serhii, A.S.; Vyshnevskyi, V.I.; Olena, P.B. The Use of Remote Sensing Data for Investigation of Environmental Consequences of Russia-Ukraine War. J. Landsc. Ecol. 2022, 15, 36. [Google Scholar] [CrossRef]
- ICRC. Urban Services during Protracted Armed Conflflict: A Call for a Better Approach to Assisting Affected People; International Committee of the Red Cross: Geneva, Switzerland, 2015. [Google Scholar]
- Lubin, A.; Saleem, A. Remote sensing-based mapping of the destruction to Aleppo during the Syrian Civil War between 2011 and 2017. Appl. Geogr. 2019, 108, 30. [Google Scholar] [CrossRef] [Green Version]
- Li, X.; Liu, S.; Jendryke, M.; Li, D.; Wu, C. Night-Time Light Dynamics during the Iraqi Civil War. Remote Sens. 2018, 10, 858. [Google Scholar] [CrossRef] [Green Version]
- Jiang, W.; He, G.; Long, T.; Liu, H. Ongoing Conflict Makes Yemen Dark: From the Perspective of Nighttime Light. Remote Sens. 2017, 9, 798. [Google Scholar] [CrossRef] [Green Version]
- Li, X.; Li, D.; Xu, H.; Wu, C. Intercalibration between DMSP/OLS and VIIRS night-time light images to evaluate city light dynamics of Syria’s major human settlement during Syrian Civil War. Int. J. Remote Sens. 2017, 38, 5934. [Google Scholar] [CrossRef]
- Human Rights Watch. Burma: 40 Rohingya Villages Burned Since October. Hum. Rights Watch. [WWW Document]. 2017. Available online: https://www.hrw.org/news/2017/12/17/burma-40-rohingya-villagesburned-october (accessed on 24 April 2023).
- Marx, A.; Windisch, R.; Kim, J.S. Detecting village burnings with high-cadence smallsats: A case-study in the Rakhine State of Myanmar. Remote Sens. Appl. Soc. Environ. 2019, 14, 119. [Google Scholar] [CrossRef]
- United Nations Satellite Centre UNOSAT|UNITAR. Available online: https://www.unitar.org/sustainable-development-goals/united-nations-satellite-centre-UNOSAT (accessed on 24 April 2023).
- Bromley, L. Relating violence to MODIS fire detections in Darfur, Sudan. Int. J. Remote Sens. 2010, 31, 2277. [Google Scholar] [CrossRef]
- Prins, E. Use of low cost Landsat ETM+ to spot burnt villages in Darfur, Sudan. Int. J. Remote Sens. 2008, 29, 1207. [Google Scholar] [CrossRef]
- Marx, A.J. Detecting urban destruction in Syria: A Landsat-based approach. Remote Sens. Appl. Soc. Environ. 2016, 4, 30–36. [Google Scholar] [CrossRef]
- Witmer, F.D.W.; O’Loughlin, J. Detecting the effects of wars in the Caucasus regions of Russia and Georgia using radiometrically normalized DMSP-OLS nighttime lights imagery. GIScience Remote Sens. 2011, 48, 478. [Google Scholar] [CrossRef]
- Li, X.; Li, D. Can night-time light images play a role in evaluating the Syrian Crisis. Int. J. Remote Sens. 2014, 35, 6648. [Google Scholar] [CrossRef]
- Li, X.; Xu, H.; Chen, X.; Li, C. Potential of NPP-VIIRS Nighttime Light Imagery for Modeling the Regional Economy of China. Remote Sens. 2013, 5, 3057–3081. [Google Scholar] [CrossRef] [Green Version]
- Li, L.-L.; Liang, P.; Jiang, S.; Chen, Z.-Q. Multi-Scale Dynamic Analysis of the Russian–Ukrainian Conflict from the Perspective of Night-Time Lights. Appl. Sci. 2022, 12, 12998. [Google Scholar] [CrossRef]
- Huang, C.; Hong, S.; Niu, X.; Wu, Q.; Zhong, Y.; Yang, H.; Zhang, H. Mapping of nighttime light trends and refugee population changes in Ukraine during the Russian–Ukrainian War. Front. Environ. Sci. 2022, 11, 33. [Google Scholar] [CrossRef]
- Yelistratova, L.O.; Apostolov, A.; Khodorovskyi, A.Y.; Khyzhniak, A.; Tomchenko, O.V.; Lialko, V.I. Use of Satellite Information for Evaluation of Socio-Economic Consequences of the War in Ukraine. Ukr. Geogr. J. 2022, 2, 11–18. [Google Scholar] [CrossRef]
- Li, J.; Zhou, L.; Ren, C.; Liu, L.; Zhang, D.; Ma, J.; Shi, Y. Spatiotemporal Inversion and Mechanism Analysis of Surface Subsidence in Shanghai Area Based on Time-Series InSAR. Appl. Sci. 2021, 11, 7460. [Google Scholar] [CrossRef]
- Aimaiti, Y.; Sanon, C.; Koch, M.; Baise, L.G.; Moaveni, B. War Related Building Damage Assessment in Kyiv, Ukraine, Using Sentinel-1 Radar and Sentinel-2 Optical Images. Remote Sens. 2022, 14, 6239. [Google Scholar] [CrossRef]
- Washaya, P.; Balz, T.; Mohamadi, B. Coherence Change-Detection with Sentinel-1 for Natural and Anthropogenic Disaster Monitoring in Urban Areas. Remote Sens. 2018, 10, 1026. [Google Scholar] [CrossRef] [Green Version]
- Boloorani, A.D.; Darvishi, M.; Weng, Q.; Liu, X. Post-War Urban Damage Mapping Using InSAR: The Case of Mosul City in Iraq. ISPRS Int. J. Geo-Inf. 2021, 10, 140. [Google Scholar] [CrossRef]
- Corey, S.; Jamon, V. Decentralized, nation-wide, high-frequency war damage mapping using InSAR time series data. In Proceedings of the AGU Fall Meeting 2022, Chicago, IL, USA, 12–16 December 2022. [Google Scholar]
- Chi, M.; Plaza, A.; Benediktsson, J.A.; Sun, Z.; Shen, J.; Zhu, Y. Big Data for Remote Sensing: Challenges and Opportunities. Proc. IEEE 2016, 104, 2207. [Google Scholar] [CrossRef]
- Campana, S.; Sordini, M.; Berlioz, S.; Vidale, M.; Al-Lyla, R.; Abbo al-Araj, A.; Bianchi, A. Remote sensing and ground survey of archaeological damage and destruction at Nineveh during the ISIS occupation. Antiquity 2022, 96, 436. [Google Scholar] [CrossRef]
- Ali, S.; Levin, N.; Crandall, D. Utilizing remote sensing and big data to quantify conflict intensity: The Arab Spring as a case study. Appl. Geogr. 2018, 94, 1–17. [Google Scholar] [CrossRef]
- Mariupol. Available online: https://en.wikipedia.org/wiki/Mariupol (accessed on 24 April 2023).
- CNN. CNN (Ukraine-Satellite-Images). 2022. Available online: https://edition.cnn.com/interactive/2022/03/world/ukraine-satellite-images/ (accessed on 24 April 2023).
- CNN. What Does Putin Want in Ukraine? The Conflict Explained. 2022. Available online: https://edition.cnn.com/2022/02/24/europe/ukraine-russia-conflict-explainer-2-cmd-intl/index.html (accessed on 24 April 2023).
- TASS (Military Operation in Ukraine). Putin Declares Beginning of Military Operation in Ukraine. 2022. Available online: https://tass.com/politics/1409329 (accessed on 24 April 2023).
- Neta, C. Crawford Reliable Death Tolls from the Ukraine War Are Hard to Come by—The Result of Undercounts and Manipulation. The Conversation, 4 April 2022. [Google Scholar]
- Copernicus Open Access Hub. Available online: https://scihub.copernicus.eu (accessed on 24 April 2023).
- USGS. EROS Archive—Sentinel-2|U.S Geological Survey. Available online: https://www.usgs.gov/centers/eros/science/usgseros-archive-sentinel-2?qt-science_center_objects=0#qt-science_center_objects (accessed on 13 February 2023).
- European Space Agency Sentinel-2 User Handbook. 2015. Available online: https://sentinels.copernicus.eu/web/sentinel/userguides/document-library/-/asset_publisher/xlslt4309D5h/content/sentinel-2-user-handbook (accessed on 13 February 2023).
- USGS EarthExplorer. Available online: http://earthexplorer.usgs.gov (accessed on 24 April 2023).
- Landsat 8 Data Users Handbook|U.S. Geological Survey. Available online: https://www.usgs.gov/landsat-missions/landsat-8-data-users-handbook (accessed on 13 February 2023).
- Maseka, J.G.; Wulder, M.A.; Markham, B.; McCorkel, J.; Crawford, C.J.; Storey, J.; Jenstrom, D.T. Landsat 9: Empowering open science and applications through continuity. Remote Sens. Environ. 2020, 248, 111968. [Google Scholar] [CrossRef]
- User Guides—Sentinel-1 SAR—Sentinel Online—Sentinel Online. Available online: https://sentinel.esa.int/web/sentinel/user-guides/sentinel-1-sar (accessed on 13 February 2023).
- Alaska Satellite Facility. Available online: https://search.asf.alaska.edu (accessed on 24 April 2023).
- Open Street Map. Available online: www.openstreetmap.org (accessed on 13 February 2023).
- Satellite Images Map of Mariupol (Mapping.jp). Available online: https://ukraine.mapping.jp/mariupol.html (accessed on 11 April 2023).
- Twitter Search Image “Mariupol”. Available online: https://twitter.com/search?q=mariupol&src=typed_query&f=image (accessed on 23 July 2022).
- Facebook Search “Mariupol”. Available online: https://m.facebook.com/profile.php?id=108052062548731 (accessed on 23 July 2022).
- Garcia, M.J.L.; Caselles, V. Mapping Burns and Natural Reforestation Using Thematic Mapper Data. Geocarto Int. 1991, 6, 31. [Google Scholar] [CrossRef]
- Key, C.; Benson, N. Landscape Assessment: Ground Measure of Severity, the Composite Burn Index; and Remote Sensing of Severity, the Normalized Burn Ratio. In FIREMON: Fire Effects Monitoring and Inventory System; USDA Forest Service, Rocky Mountain Research Station: Fort Collins, CO, USA, 2005; Volume 2004. [Google Scholar]
- Matsuoka, M.; Yamazaki, F. Use of Satellite SAR Intensity Imagery for Detecting Building Areas Damaged Due to Earthquakes. Earthq. Spectra 2004, 20, 975–994. [Google Scholar] [CrossRef]
- Takeuchi, S.; Suga, Y.; Yonezawa, C.; Chen, A.J. Detection of Urban Disaster Using InSAR: A Case Study for the 1999 Great Taiwan Earthquake. In Proceedings of the IEEE 2000 International Geoscience and Remote Sensing Symposium, Honolulu, HI, USA, 24–28 July 2000. [Google Scholar]
- Karimzadeh, S.; Mastuoka, M. Building Damage Assessment Using Multisensor Dual-Polarized Synthetic Aperture Radar Data for the 2016 M 6.2 Amatrice Earthquake, Italy. Remote Sens. 2017, 9, 330. [Google Scholar] [CrossRef] [Green Version]
- Yelistratova, L.A.; Apostolov, A.; Movchan, D.M. Using night illumination images based on remote sensing data for the socio-economic assessment of a besieged city (Mariupol City, (Ukraine) as an example). In Natural Resource Potential, Ecology, and Sustainable Development of Administrative Units of the Republic of Latvia and Ukraine Amidst EU Legislative Requirements; Baltija Publishing: Riga, Latvia, 2022; p. 82. [Google Scholar] [CrossRef]
- Hu, S.; Feng, M.; Nguyen, R.M.H.; Lee, G.H. CVM-Net: Cross-View Matching Network for Image-Based Ground-to-Aerial Geo-Localization. In Proceedings of the IEEE Computer Society Conference on Computer Vision and Pattern Recognition, Salt Lake City, UT, USA, 18–22 June 2018; pp. 7258–7267. [Google Scholar] [CrossRef]
- Damage Assessment Overview Map—Livoberezhnyi and Zhovtnevyi Districts, Mariupol City, Ukraine. Available online: http://unosat.org/products/3371 (accessed on 24 April 2023).


| CEM | IFB-CEM | |||||
|---|---|---|---|---|---|---|
| Recall | Precision | F1 Score | Recall | Precision | F1 Score | |
| 4 March 2021 | 0.959 | 0.839 | 0.895 | 0.980 | 0.959 | 0.969(↑0.074) |
| 13 January 2022 | 0.982 | 0.900 | 0.939 | 0.964 | 0.947 | 0.955(↑0.016) |
| 13 March 2022 | 0.981 | 0.912 | 0.945 | 0.943 | 0.963 | 0.953(↑0.008) |
| 14 March 2022 | 1.000 | 0.922 | 0.959 | 0.979 | 0.979 | 0.979(↑0.020) |
| 19 March 2022 | 0.972 | 0.886 | 0.927 | 0.956 | 0.959 | 0.957(↑0.030) |
| 21 March 2022 | 1.000 | 0.877 | 0.934 | 0.972 | 0.986 | 0.979(↑0.045) |
| 22 March 2022 | 0.965 | 0.933 | 0.949 | 0.948 | 0.976 | 0.962(↑0.013) |
| 24 March 2022 | 0.973 | 0.899 | 0.934 | 0.978 | 0.973 | 0.975(↑0.041) |
| 29 March 2022 | 0.986 | 0.907 | 0.944 | 0.986 | 0.986 | 0.986(↑0.042) |
| 3 April 2022 | 0.984 | 0.861 | 0.919 | 0.984 | 0.964 | 0.974(↑0.055) |
| 7 April 2022 | 1.000 | 0.807 | 0.893 | 1.000 | 0.979 | 0.989(↑0.096) |
| 15 April 2022 | 0.933 | 0.667 | 0.778 | 0.933 | 0.933 | 0.933(↑0.115) |
| 30 April 2022 | 1.000 | 0.333 | 0.500 | 1.000 | 0.667 | 0.800(↑0.300) |
| 1 May 2022 | 0.833 | 0.625 | 0.714 | 1.000 | 0.831 | 0.908(↑0.194) |
| 3 May 2022 | 1.000 | 0.667 | 0.800 | 0.883 | 0.883 | 0.883(↑0.083) |
| 8 May 2022 | 0.833 | 0.625 | 0.714 | 0.700 | 0.840 | 0.764(↑0.050) |
| 9 May 2022 | 0.667 | 0.571 | 0.615 | 0.533 | 0.815 | 0.645(↑0.030) |
| 28 May 2022 | 0.500 | 1.000 | 0.667 | 0.500 | 1.000 | 0.667(--) |
| Damaged Degree | Description | Example | DPNCI |
|---|---|---|---|
| Possible damaged or undamaged | The structure of the building is intact, and no obvious cracks or structural changes can be identified from the images. |  | 0.60–1.00 |
| Moderate damage | The structure of the building is relatively intact, with partially damaged to the top or sides and no apparent collapse. |  | 0.45–0.60 |
| Severe damage | The roof and facade of the building were badly hit, with extensive collapse, but parts of the wall structure remained. |  | 0.27–0.45 |
| Destroyed | The building was completely destroyed in a pile of rubble, making it difficult to see intact parts of the walls. |  | 0.00–0.27 |
Disclaimer/Publisher’s Note: The statements, opinions and data contained in all publications are solely those of the individual author(s) and contributor(s) and not of MDPI and/or the editor(s). MDPI and/or the editor(s) disclaim responsibility for any injury to people or property resulting from any ideas, methods, instructions or products referred to in the content. |
© 2023 by the authors. Licensee MDPI, Basel, Switzerland. This article is an open access article distributed under the terms and conditions of the Creative Commons Attribution (CC BY) license (https://creativecommons.org/licenses/by/4.0/).
Share and Cite
Huang, Q.; Jin, G.; Xiong, X.; Ye, H.; Xie, Y. Monitoring Urban Change in Conflict from the Perspective of Optical and SAR Satellites: The Case of Mariupol, a City in the Conflict between RUS and UKR. Remote Sens. 2023, 15, 3096. https://doi.org/10.3390/rs15123096
Huang Q, Jin G, Xiong X, Ye H, Xie Y. Monitoring Urban Change in Conflict from the Perspective of Optical and SAR Satellites: The Case of Mariupol, a City in the Conflict between RUS and UKR. Remote Sensing. 2023; 15(12):3096. https://doi.org/10.3390/rs15123096
Chicago/Turabian StyleHuang, Qihao, Guowang Jin, Xin Xiong, Hao Ye, and Yuzhi Xie. 2023. "Monitoring Urban Change in Conflict from the Perspective of Optical and SAR Satellites: The Case of Mariupol, a City in the Conflict between RUS and UKR" Remote Sensing 15, no. 12: 3096. https://doi.org/10.3390/rs15123096