Article

Spatial Simulation and Prediction of Land Use/Land Cover in the Transnational Ili-Balkhash Basin

1
College of Geography and Remote Sensing Science, Xinjiang University, Urumqi 830017, China
2
Xinjiang Key Laboratory of Oasis Ecology, Xinjiang University, Urumqi 830017, China
*
Author to whom correspondence should be addressed.
These authors contributed equally to this work.
Remote Sens. 2023, 15(12), 3059; https://doi.org/10.3390/rs15123059
Submission received: 16 May 2023 / Revised: 9 June 2023 / Accepted: 9 June 2023 / Published: 11 June 2023

Abstract

:
Exploring the future trends of land use/land cover (LULC) changes is significant for the sustainable development of a region. The simulation and prediction of LULC in a large-scale basin in an arid zone can help the future land management planning and rational allocation of resources in this ecologically fragile region. Using the whole Ili-Balkhash Basin as the study area, the patch-generating land use simulation (PLUS) model and a combination of PLUS and Markov predictions (PLUS–Markov) were used to simulate and predict land use in 2020 based on the assessment of the accuracy of LULC classification in the global dataset. The accuracy of simulations and predictions using the model were measured for LULC data covering different time periods. Model settings with better simulation results were selected for simulating and predicting possible future land use conditions in the basin. The future predictions for 2025 and 2030, which are based on historical land change characteristics, indicate that the overall future spatial pattern of LULC in the basin remains relatively stable in general without the influence of other external factors. Over the time scale of the future five years, the expansion of croplands and barren areas in the basin primarily stems from the loss of grasslands. Approximately 48% of the converted grassland areas are transformed into croplands, while around 40% are converted into barren areas. In the longer time scale of the future decade, the conversion of grasslands to croplands in the basin is also evident. However, the expansion phenomenon of urban and built-up lands at the expense of croplands is more significant, with approximately 774.2 km2 of croplands developing into urban and built-up lands. This work provides an effective new approach for simulating and predicting LULC in data-deficient basins at a large scale in arid regions, thereby establishing a foundation for future research on the impact of human activities on basin hydrology and related studies.

1. Introduction

LULC change directly reflects the impact of human activities on Earth’s surface, with significant implications for regional climate, hydrology, and human society [1,2]. The simulation of LULC change has become a crucial aspect of land use research [3,4]. Arid zone basin ecosystems are fragile and vulnerable to human activities [5]. Central Asia, being a typical arid zone, encompasses an extensive mountain–oasis–desert system. In recent years, the pursuit of economic development in Central Asia has caused extensive environmental damage, leading to ecological disasters and threatening environmental sustainability [6,7,8]. An important basin in Central Asia, the Ili-Balkhash Basin, is vast and contains the largest inland freshwater lake, Lake Balkhash [9]. In order to prevent the natural crises experienced in other parts of Central Asia from also taking place in the Ili-Balkhash Basin, the sustainable development of this basin has begun to gain global attention [10,11,12]. Simulating and predicting land use/land cover (LULC) in the Ili-Balkhash Basin can provide strong scientific support for resource development and future planning in the region.
The LULC model can simulate land use processes and predict future LULC conditions [13,14]. In recent years, many geographic models for LULC simulations have been proposed. One of the most popular and widely used land use change simulation models is the cellular automata (CA) model [9]. To model various land use processes and their interactions, several widely used CA aggregation models have been developed, including Logistic–CA, artificial neural networks–CA (ANN–CA), CA–Markov, and Future Land Use Simulation (FLUS) [15,16,17,18,19]. The FLUS model incorporates the influence of natural factors and is a top-down quantitative estimation method [20,21,22]. However, the previous models still have limitations in simulating different land class processes and capturing complex spatial interactions and internal mechanisms between individual land classes. To address this, hybrid models have been gradually proposed to better characterize and simulate the actual processes of land use change [23]. A patch-generating land use simulation (PLUS) model, developed based on the FLUS model, was introduced as a novel hybrid model [24]. The PLUS model combines top-down and bottom-up approaches, integrating a rule-mining framework and a multi-type random seed-based CA model [25]. This innovative approach overcomes the drawbacks of exponential growth in transformation types as categories increase [26,27]. The PLUS model is better than the previous models in terms of its historical land use change processes and landscape similarity as represented by landscape indicators and is more flexible for each type of LULC type [24,28]. The PLUS model achieves good simulation results in diverse areas [29,30,31,32]. However, its application in large-scale simulations of typical arid zones is limited. The Ili-Balkhash Basin exhibits significant variations in geomorphological and climatic characteristics [33]. The simulation of LULC in this basin using the PLUS model not only expands the model’s application scope but also provides ideas for simulating and predicting LULC in other large basins in arid regions.
The Ili-Balkhash Basin is a famous transboundary region in Central Asia. A large part of the basin is located in Kazakhstan, and a small part is located in China [34]. Geographic location, national differences, and acquisition costs have all contributed to the long-standing lack of uniform time series, high-resolution, and high-precision LULC data in the region. Previous studies on land use in the basin relied on low-resolution or localized LULC data [35,36,37,38]. Moreover, simulations and predictions taking in the entire basin as a whole are also rare [39]. The global dataset could provide low-cost, efficient, spatial and temporal high-resolution LULC data from various data sources [5]. These new high-resolution global LULC data introduce new opportunities for monitoring LULC in the Ili-Balkhash Basin [40,41,42]. Among these datasets, GLC_FCS30 and GlobeLand30 offer a long time series of high-resolution data, which has the advantage of facilitating spatial simulation and prediction based on historical LULC development status.
This work aims to obtain the potential future LULC changes and patterns in the entire Ili-Balkhash Basin based on the historical LULC development characteristics of the region. This work first validates the applicability of two global datasets (GLC_FCS30 and GlobeLand30) in the Ili-Balkhash Basin. Based on this validation, the PLUS model is utilized to simulate and predict the LULC (Land Use and Land Cover) condition of the basin by incorporating LULC data from different time periods and considering 12 driving factors. The dataset and parameters that yielded the best simulation results were selected from multiple perspectives. Finally, the results of future LULC (Land Use and Land Cover) predictions in the natural scenario of the Ili-Balkhash Basin were obtained, providing information on past, present, and future changes in human activities in the basin at the scale of nearly 30 years. The work provided credible results and parameters for land use simulations and predictions in this basin. These results can also be applied to other hydrological and climate models and future land use management programs in river basins.

2. Materials and Methods

2.1. Study Area

The Ili–Balkhash Basin (72°24′–85°E, 42°11′15″–49°48′N) is approximately 4.16 × 10⁵ km2 and is located in Central Asia, stretching across Xinjiang Province in China and southeastern Kazakhstan (Figure 1). The topography of the Ili–Balkhash Basin is very complex. It is high in the southeast and low in the northwest and includes alpine systems, low mountains, plains, and sandy areas bordering some of the lakes [43]. It is a multi-climate zone, containing cold humid, cold–temperate humid, and temperate sub-arid climate zones [44]. The Lake Balkhash region within the basin has abundant sunshine and heat resources, large temperature variability, high evaporation capacity, and scarce precipitation [45], while the Ili river valley has a relatively mild climate and abundant precipitation due to topographic factors [46].

2.2. Data Sources

The LULC data were obtained from the GLC_FCS30 product (https://data.casearth.cn, accessed on 30 November 2021 ) of the Institute of Space and Space Information Innovation, Chinese Academy of Sciences, and the GlobeLand30 product, an important achievement of the Global Land Cover Remote Sensing Mapping and Key Technology Research Project of China’s National High Technology Research and Development Program (863 Program) (http://www.globeland30.com/home_en.html, accessed on 30 November 2021). Based on the information requirements of the PLUS model and the actual developmental situation of the study area, and considering the principles of data availability, usability, and comprehensiveness, a total of 12 drivers (incorporating both natural and social aspects) were finally selected as the base data in the Land Use Expansion Analysis Strategy (LEAS) to obtain the land use development potential. The data sources of the 12 impact factors driving PLUS are shown in Table 1. The year 2020 was selected as the baseline for both simulation and projection. Therefore, the drivers were selected for 2020 and the most recent year possible. Road vector data were used to obtain raster images by calculating the Euclidean distance.
To facilitate the model runs and analysis, all data were resampled to a 100 m grid. The LULC data were projected uniformly and resampled to 100 m. The data for the selected drivers had a large spatial resolution because they were mostly global data. To ensure that the cropped driver data were not smaller than the study area, the driver data were first resampled to 30 m before cropping, and the cropped driver data were resampled to 100 m. To ensure that the pixel values of the raster images remained unchanged, the nearest neighbor method was consistently chosen for all resampling procedures. We unified the LULC data and driver data coordinate systems and row counts and converted LULC data to an unsigned format using the conversion module of the PLUS model. The final LULC data output by the model maintained a resolution of 100 m.

3. Methods

3.1. Global LULC Data Validation and Calibration Methods

Before conducting the simulation and data accuracy validation, the work classified the two types of LULC data into six first-level classes using the land use classification system of the Chinese Academy of Sciences. A confusion matrix was generated based on the sampling points and the overall accuracy (OA); then, user accuracy (UA) and producer accuracy (PA) were calculated to represent the accuracy of the data. The calculation formulas were as follows [47]:
O A = i = 1 r x i i n 2 × 100 %
U A = N · i = 1 r x i i i = 1 r ( x i + · x + i ) N 2 i = 1 r ( x i + · x + i )
P A = x i i x + i × 100 %
where xii is the number of correctly classified pixels of type i; n is the total number of pixels in the study area; xi+ is the total number of pixels of class i in the data to be validated; x+i is the total number of pixels of type i in the reference data; r denotes the number of rows in the confusion matrix; and N is the total number of sample points.
The selection of accurate validation samples is very important in land cover mapping. The potential of third-party assessment validation datasets in LULC accuracy assessment has been demonstrated [48]. In this work, three validation point datasets were selected to evaluate and compare the LULC data before and after correction. (1) The Tsinghua University Global Validation Point Dataset (hereafter referred to as FROM-GLC), which was originally designed to validate 30-m resolution global land cover maps in the Finer Resolution Observation and Monitoring of Global Land Cover project [49]. (2) Crowdsourced global dataset of land cover and land use reference data (hereafter referred to as Gwo-Wiki). This dataset includes reference data obtained from the Geo-Wiki crowdsourcing platform. These global datasets provide information on human impacts, land cover divergence, and land use [50]. Based on the study area and sample information, 273 sample points were obtained after excluding points with unclear feature classification. (3) Visual interpretation samples. The first two types of validation sample sets were used to compare global LULC products in the arid zone of northwest China. However, there are fewer sample points available in the Ili-Balkhash Basin [48]. As a result, visual interpretation samples were utilized as supplementary data to further assess the regional applicability of those two LULC products. The large coverage and high-resolution images provided by Google Earth and Sentinel-2 satellites became the main sources for visual interpretation. In the study area, 1092 random sampling points were generated, and 1040 visual interpretation samples were obtained by visual interpretation of Google Earth images supplemented with Sentinel-2 remote sensing images, excluding the points that were difficult to identify or that had uneven features.
Global-scale LULC datasets, while usually having high accuracy and universality, may still have room for improvement in applicability at the regional scale. Therefore, some correction of the LULC data was performed based on the results of the regional accuracy assessment. The correction process applied to the LULC data was mainly a reclassification or adjustment of the distribution range of a certain land class based on the actual image, the accuracy of the data when uncorrected, and the actual situation in the area. Based on the actual remote sensing image and calculation of uncorrected data accuracy, the 120th land class of GLC_FCS30 data for each year were classified as barren areas, and the GlobeLand30 2000 data were mosaicked using the barren areas map layer of GLC_FCS30 2000 data to optimize the GlobeLand30 dataset.

3.2. PLUS Model

The PLUS model is a new land use transformation rule mining framework proposed by Liang X et al. based on land use data from two periods, integrating a meta-cellular automaton (CA) based on multiple random seed (CARS) to dynamically simulate the evolution of multiple types of land use patches based on land use change and driver data [25,51]. The PLUS model uses a combination of top-down and bottom-up approaches for simulation. The total demand for land use change and the structure of land use are predicted as the key conditions for the CA model constraint or the termination of the model run, and the simulated land use demand quantity is constrained. In terms of spatial distribution, the development probability of land use types was generated using the random forest (RF) algorithm in combination with natural factors, the total probability was calculated, and then different land use types were assigned in their spatial locations with a high total probability under the constraint of quantity.
The spatial pattern of land use change in the Ili-Balkhash Basin was simulated using the PLUS model in two steps (Figure 2). First, the expansion in the land use change part of the land use data for two periods was extracted and sampled together with the corresponding drivers to generate the development probability for each land use type. Second, natural scenarios were set up with spatial and quantitative constraints, and spatial simulations of land use in the target year were obtained using the CARS model under the constraints of development probability and land use demand. The spatial constraint was bounded by the cost matrix of land use pairs. The quantity constraint was then bounded by the amount of land use in the target year or the future projections generated by the CA–Markov model. The neighborhood weights for individual land use type were used in the CARS model to calculate the total probability of the PLUS model for each type of land use.
The PLUS model is developed from the FLUS model and has a similar framework structure. Meanwhile, the natural environment of the Ili–Balkhash Basin has a certain degree of consistency with the whole of Central Asia. The FLUS model has been used in Central Asia with high-accuracy results. Given the similarities between the two aspects of the model and the natural environment, the previous FLUS simulation setup in Central Asia [52] was used to qualify the cost matrix and neighborhood weights for each land use type under the natural scenario in the study area. The cost matrix of land use pairs for the natural scenario is shown in Table 2. The CARS model was used to obtain spatial simulations of land use in the target year under the constraints of development probability and land use demand.
The random forest parameters in the Land Use Expansion Analysis Strategy (LEAS) module of the PLUS model are set with reference to the user manual of the PLUS model as follows: the decision tree is 20, the sampling rate is 0.01, and the number of features used to train the random forest is 12 (the same as the number of driving factors). The simulation accuracy was measured using the Kappa coefficient and FoM coefficient. A Kappa coefficient higher than 0.75 indicates that the simulation results are statistically more accurate. Larger values of the FoM coefficient theoretically prove that the simulation is better and more accurate, but most practical validations have shown that the results are generally lower than 0.3 [53].

4. Results

4.1. Global LULC Dataset Regional Accuracy

This work used two global LULC datasets to drive the PLUS model. Although the overall accuracy of the global dataset is high, it is still necessary to discuss its regional applicability on a regional scale. In this work, the regional accuracy of the uncorrected and corrected LULC data is validated. The results of this assessment were combined with the results of the simulation accuracy assessment of the PLUS model to select the most appropriate LULC data as the basis for the simulation of future LULC conditions in the study area.

4.1.1. Uncorrected Global LULC Data Accuracy Check

Figure 3, Figure 4 and Figure 5 show the results of the absolute accuracy evaluations for the two selected datasets based on three validation samples (C1–C6 for grasslands, croplands, urban and built-up lands, forests, water bodies, and barren areas, respectively). The results showed that the GlobeLand30 product had a higher OA than GLC_FCS30 for all three validation sample sets. In the assessment results based on the FROM-GLC validation sample (Figure 3), the GlobeLand30 data had an overall higher OA value of 52.38% or more for all years. The validation results for water bodies in both land use products had high PA values. The GlobeLand30 product had relatively low UA values for each year (less than 63%). The GlobeLand30 product had high PA and UA values for cropland, while the GLC_FCS30 product achieved a relatively high accuracy (UA value of 41.67%) for only the 2020 croplands. Both products had low PA and UA values for the other land classifications. The GlobeLand30 product had a similar level of classification capability for grasslands as the GLC_FCS30 product, with UA values of approximately 50% and PA values of more than 60%. In the results calculated for this validation sample, the PA and UA values for the barren areas of both products are relatively small. The PA value of barren area classification for the 2000 GLC_FCS30 product was slightly higher than that of the GlobeLand30 product. Due to the regional limitation, the number of urban and built-up land samples in the FROM-GLC validation sample was 0, and the number of forest samples was 5. Therefore, all assessment values of urban and built-up land and forests in both datasets were around zero.
In the evaluation results based on the crowdsourced land use (Geo-Wiki) validation sample (Figure 4), the OA value of the GlobeLand30 product is still higher than that of the GLC_FCS30 product, at over 41%. The GlobeLand30 product had a high classification accuracy for croplands, with PA and UA values above 77.78% and up to 91.67%. The PA and UA values for GLC_FCS30 croplands were relatively low, remaining at approximately 50%, and there were more misclassifications compared to the GlobeLand30 product. The other land use types of both products performed poorly in the assessment of this validation sample, with the PA values of water bodies near 50%. Both products have relatively small UA and PA values for forests, with the GLC_FCS30 product having a slightly higher UA value for forests than the GlobeLand30 product. Barren areas had slightly higher UA values for the GLC_FCS30 product than for the GlobeLand30 product in the 2000 results, but the opposite was observed in 2010. The crowdsourced land use validation sample had only one urban and built-up land sample point in the study area, and, therefore, the accuracy assessment values for both dataset classifications of urban and built-up land under this validation sample were extreme values.
In the evaluation results based on the visual interpretation validation sample (Figure 5), the GlobeLand30 dataset still showed significantly higher OA values than the GLC_FCS30 dataset, with OA values ranging from 60.19% to 64.33% in all years, and GLC_FCS30 data OA values ranging from 51.92% to 52.69%. The grasslands type of the GlobeLand30 data had better UA values (66.67%, 65.78%, 59.26%) and PA values (75.97%, 76.74%, 87.40%) in all years. Grasslands with GLC_FCS30 data also had relatively high UA (64.53%, 69.96%, 69.38%) and PA values (64.53%, 69.96%, 69.38%) compared to other land classes of the product. The GlobeLand30 product also produced a good classification of croplands with UA values of 64.44%, 67.5%, and 67.53% and PA values of 84.6%, 78.62%, and 76.36%, whereas the GLC_FCS30 product croplands types were all classified with relatively low PA and UA values. Both products had a high classification accuracy for water bodies, with UA values reaching more than 80%. Both products maintained a medium level of urban and built-up land assessment accuracy in each year. The UA values of urban and built-up land for the GLC_FCS30 product were higher than those of the GlobeLand30 product in 2020 and 2000, at 60%. The UA value of urban and built-up land for the GlobeLand30 2000 data was relatively high at 66%. Both products showed more limited PA and UA values for forests classified in the annual accuracy assessment, although the GlobeLand30 product showed significantly higher UA values for forests in each year. The PA values of barren areas for the GlobeLand30 product were higher than those of the GLC_FCS30 product in 2010. The UA and PA values of the GLC_FCS30 product were significantly higher than those of the GlobeLand30 product in 2020 and 2000, and the GLC_FCS30 PA value in 2010 was also higher than that of the GlobeLand30 product.

4.1.2. Corrected Global LULC Data Accuracy Check

The applicability of both global land use products in the Ili-Balkhash Basin still has room for improvement, so the dataset is adjusted and optimized to make it closer to the actual situation and provide a basis for subsequent explorations of model simulation accuracy. In the accuracy assessment, barren areas and grasslands are not the categories with the lowest accuracy values obtained, but they cover a large area in the study area. Therefore, these two land use types are primarily targeted for adjustments.
The CLC_FSC30 product classification of “shrubland” (category 120) does not specifically state the fractional vegetation coverage or canopy closure extent in the product description. Areas with low vegetation cover were subdivided in the product into categories 150, 152, and 153. The attributes of the 120 categories defined in the products are consistent with the meaning of the “shrubland” category in the classification criteria used in this work, and therefore they were classified in the “forest” category. The visual comparison of remote sensing images showed that when the shrubland classification of the GLC_FCS30 product was classified as forest, there were obvious differences between this category and the actual image (Figure 6). The shrubland classification of CLC_FSC30 is a sparse vegetation area covered by a large amount of sand with almost no vegetation distribution, which was similar to the barren areas category in arid areas. Therefore, in view of the actual situation, the CLC_FCS30 “shrubland” (category 120) was classified as “barren areas”. The comparison of the three validation samples shows that the correction operation effectively improves the overall accuracy of the product for each year (Table 3), with overall OA values of 50% or more.
As seen in actual images, the GlobeLand30 2000 data of grasslands and barren areas differ significantly from the actual conditions (Figure 7). Large barren areas were classified as grasslands, but overall, very little of the overall area was classified as barren areas. After various attempts to adjust the LULC category, the 2000 GLC_FCS30 product barren areas layer, with a relatively high absolute accuracy, was mosaicked with the 2000 GlobeLand30 LULC data to the corrected GlobeLand30 2000 LULC data. After this correction, the distribution of grassland and barren area patches tended to be normalized, and the corrected OA was improved (Table 4). The corrected GlobeLand30 OA was still slightly higher than that of the corrected GLC_FCS30 product.

4.2. Simulation Accuracy of the Global LULC Dataset PLUS Model before and after Correction

The land use data, parameters (constraint matrix and domain weights in the target year), and land use demand quantity for each year in the Ili–Balkhash Basin were imported into the PLUS model, and the land use status of the basin in 2020 was simulated based on the land use data for different years. The final simulation effect of the LULC dataset in the basin before and after the correction was obtained. The land use demand adopts the land use quantity from the actual LULC data in 2020 during the validation simulation phase and in the future prediction simulation phase using CA–Markov prediction (i.e., the Markov chain part of the PLUS–Markov future simulation). This work used three simulation periods with different time scales for both uncorrected and corrected data, and the year with the best simulation effect was selected as the base data for the study area’s future simulations.

4.2.1. Corrected Global LULC Data Accuracy Check

(1)
Uncorrected Global LULC Dataset PLUS Simulation
The production of the same global LULC dataset adopts the same classification criteria and algorithms. Although there are some differences from the actual situation in detail, the accuracy of LULC data of the same product in different years in the Ili-Balkhash Basin remains basically in a similar range. The trend of LULC variation in different years can reflect the actual LULC variation in the basin from a macroscopic perspective over a long time series. The consistency within the uncorrected LULC product with the product ensures that the PLUS model runs smoothly and that the data are not affected by subsequent human adjustments. In order to show more objectively the simulation and prediction effects of the PLUS model itself in the basin based on two global datasets and to discuss the applicability of the model, the uncorrected LULC data for each time period were input into the model for simulation and prediction. The effectiveness and accuracy of its simulation and prediction become one of the reference bases for model setting and data selection for LULC spatial simulation in the basin.
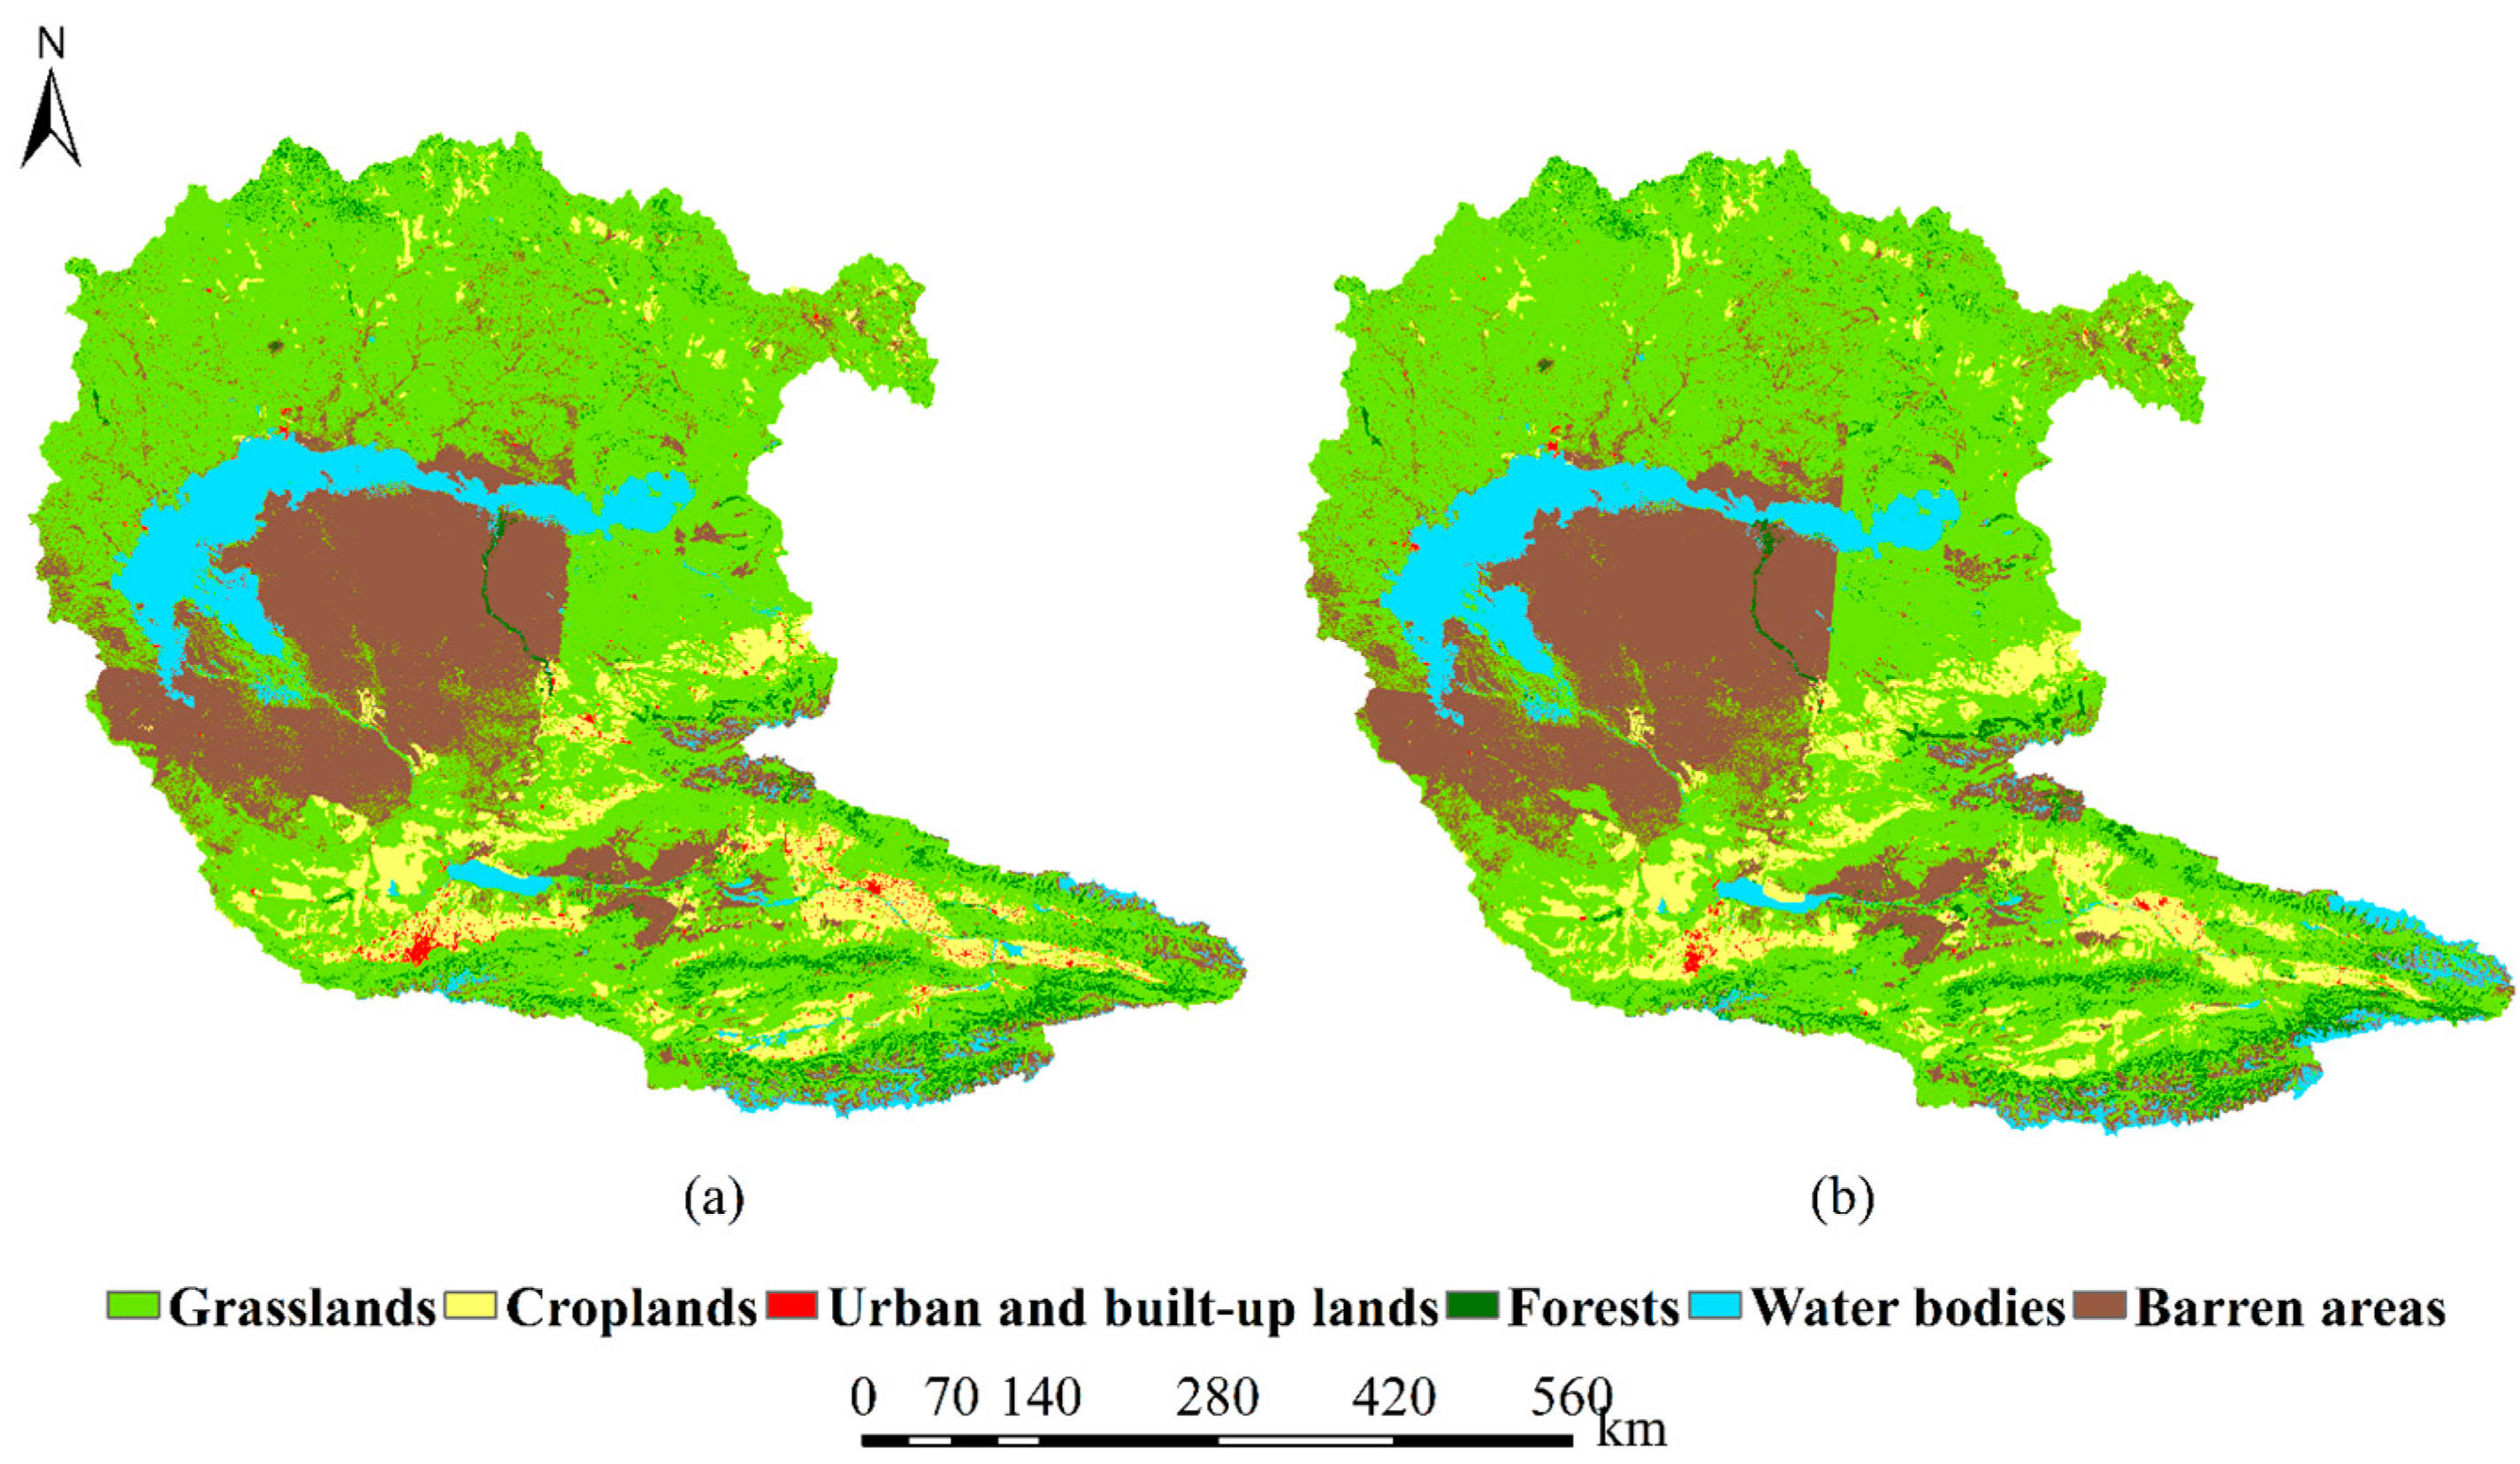
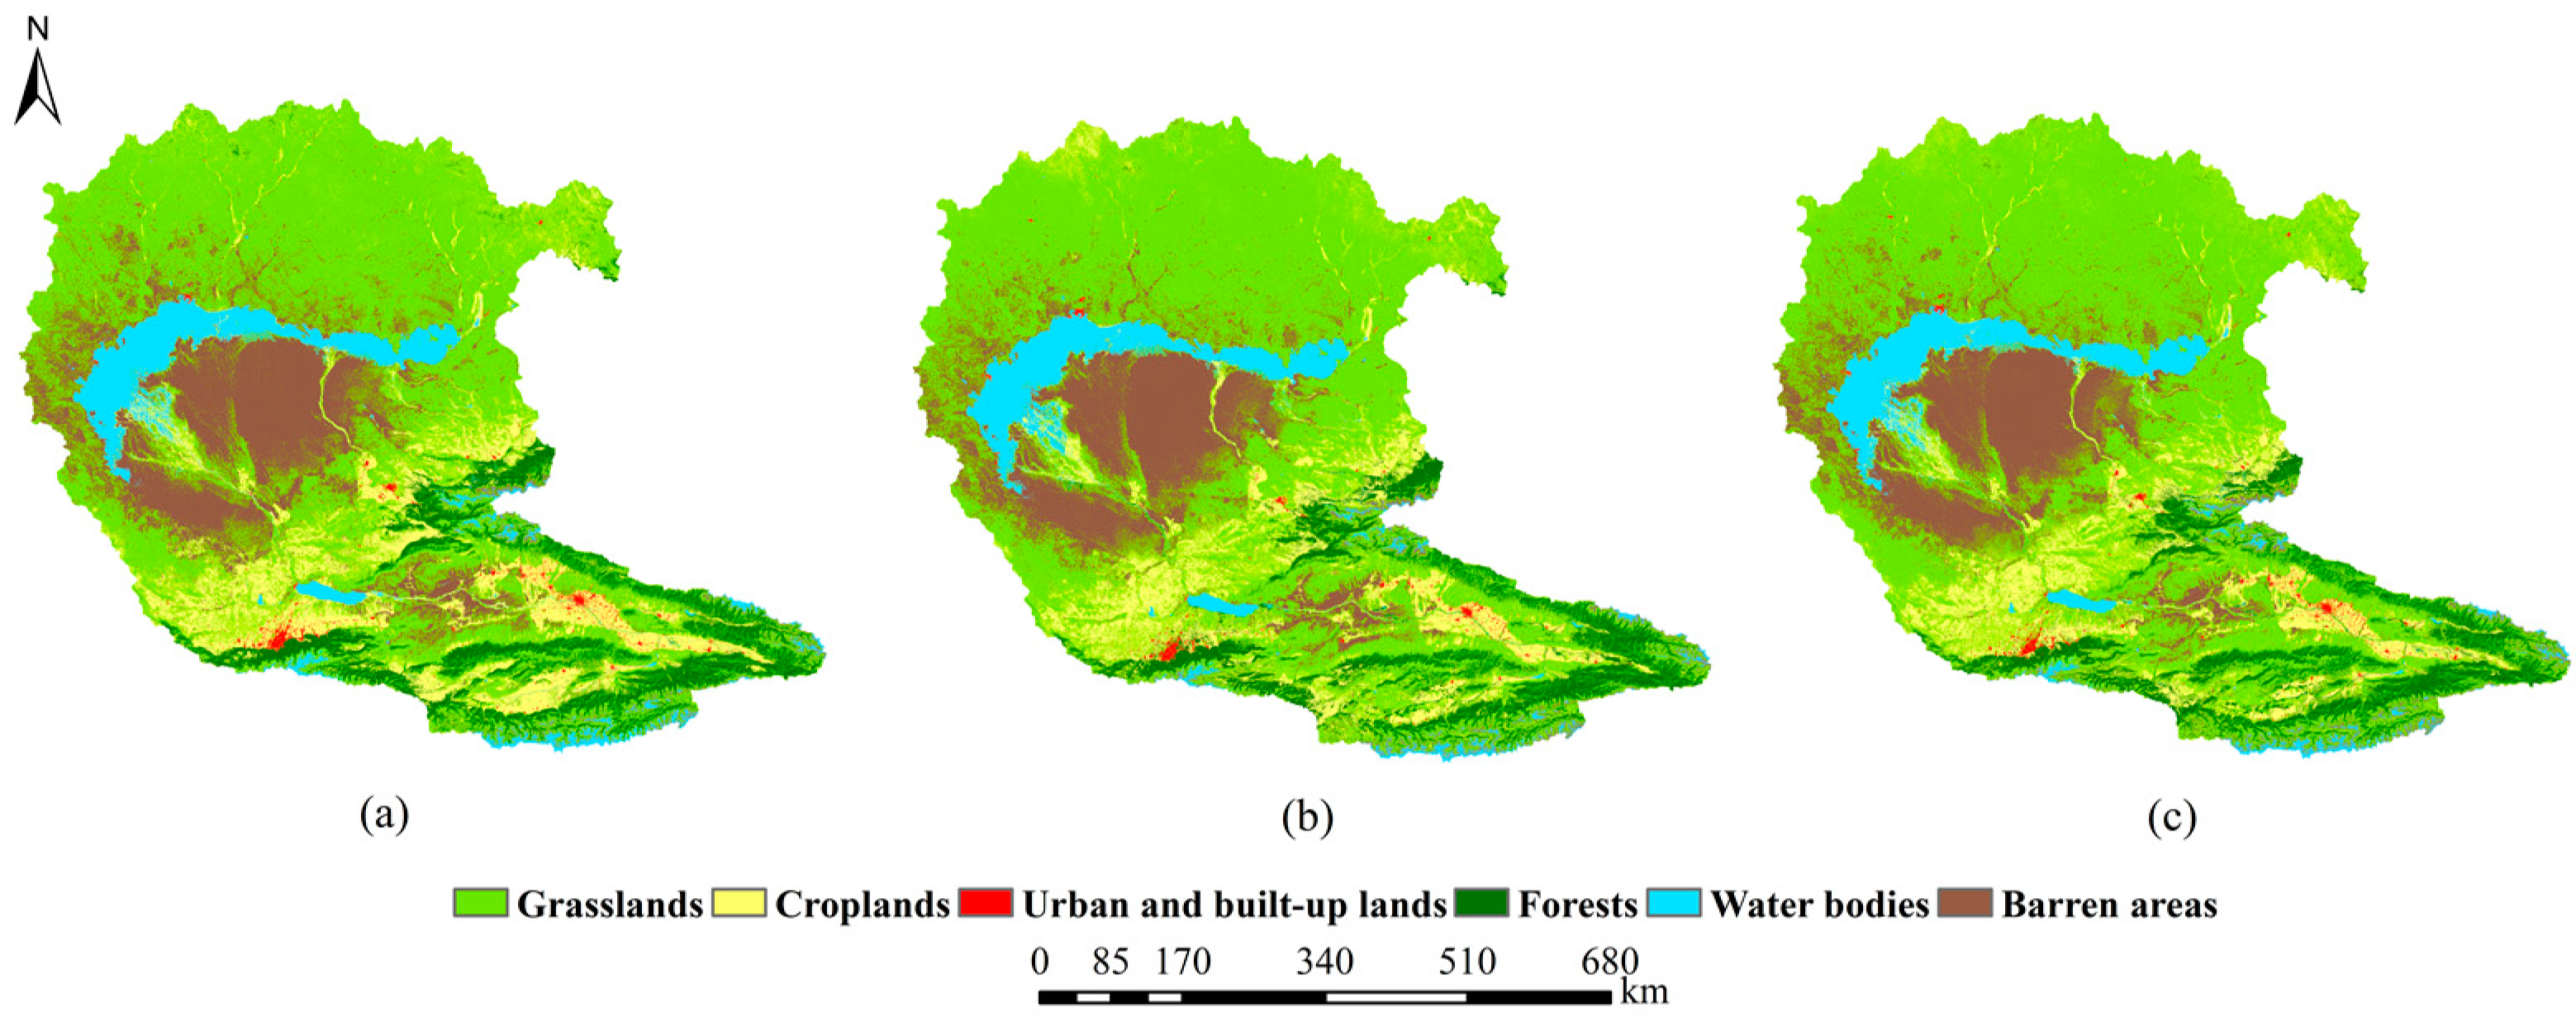
The actual land use quantity of GLC_FSC30 data in 2020 was used as the land use demand, and the simulation results were obtained by inputting land use data from different time periods and combining the parameters (Figure 8). The simulation results for different time periods using the GLC_FCS30 product had fewer changes in the various types of LULC patches compared with the target year (2020 GLC_FCS30). In the southern part of the Ili River valley, there were fewer patches of cropland and barren areas in the simulation results in each year than in the target year. Among the simulated land use classifications based on land use data at different time intervals, the simulation results for 2000–2020 (Figure 8b) were poor. The areas of urban and built-up land and croplands were smaller than in the target year, while the area of croplands in the northeastern part of the basin was excessive. The simulation of water bodies for western Lake Balkhash produced more barren area image elements compared to the target year. The simulation results based on data from 2010–2020 (Figure 8c) were relatively close to the actual data but had the same problems, only to a lesser extent. The distribution and sizes of various types of land uses, especially urban and built-up land, in the simulation results based on 2015–2020 data (Figure 8d) were closer to the actual data. The GLC_FCS30 data showed an interspersed distribution of image elements in each class, which was not homogeneous, and, therefore, there were more interspersed spots in each class in the simulation results.
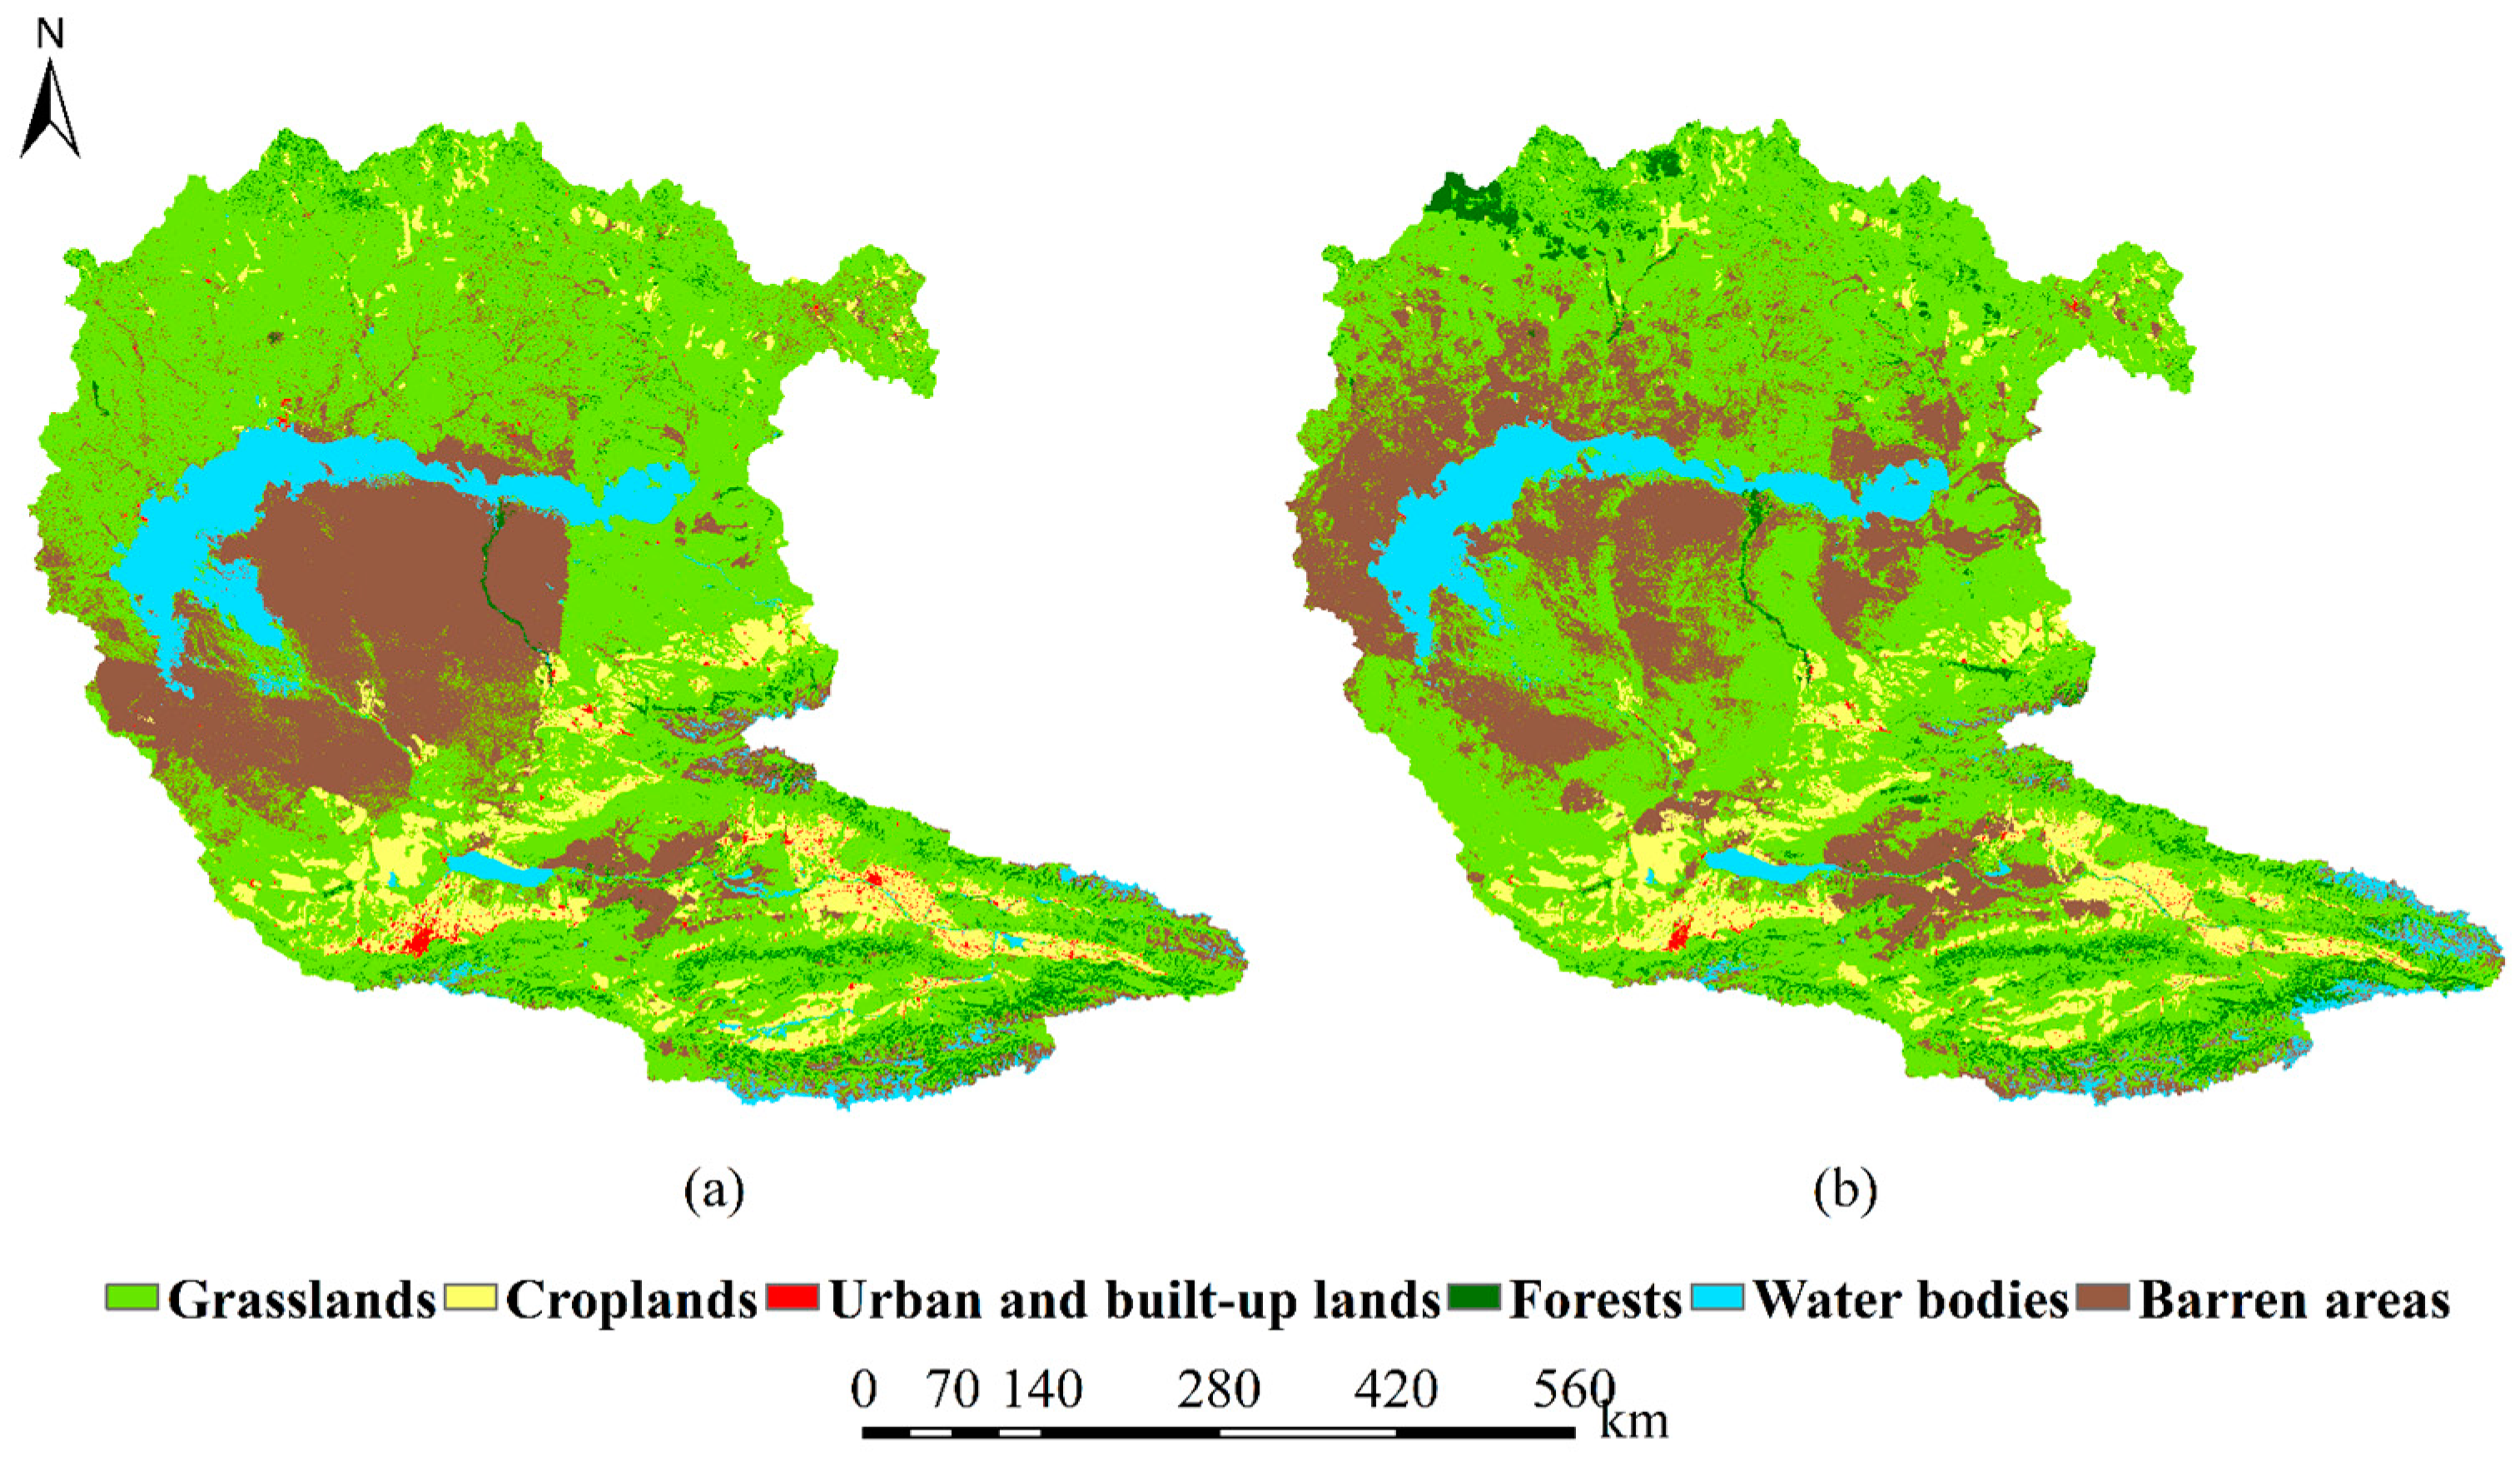
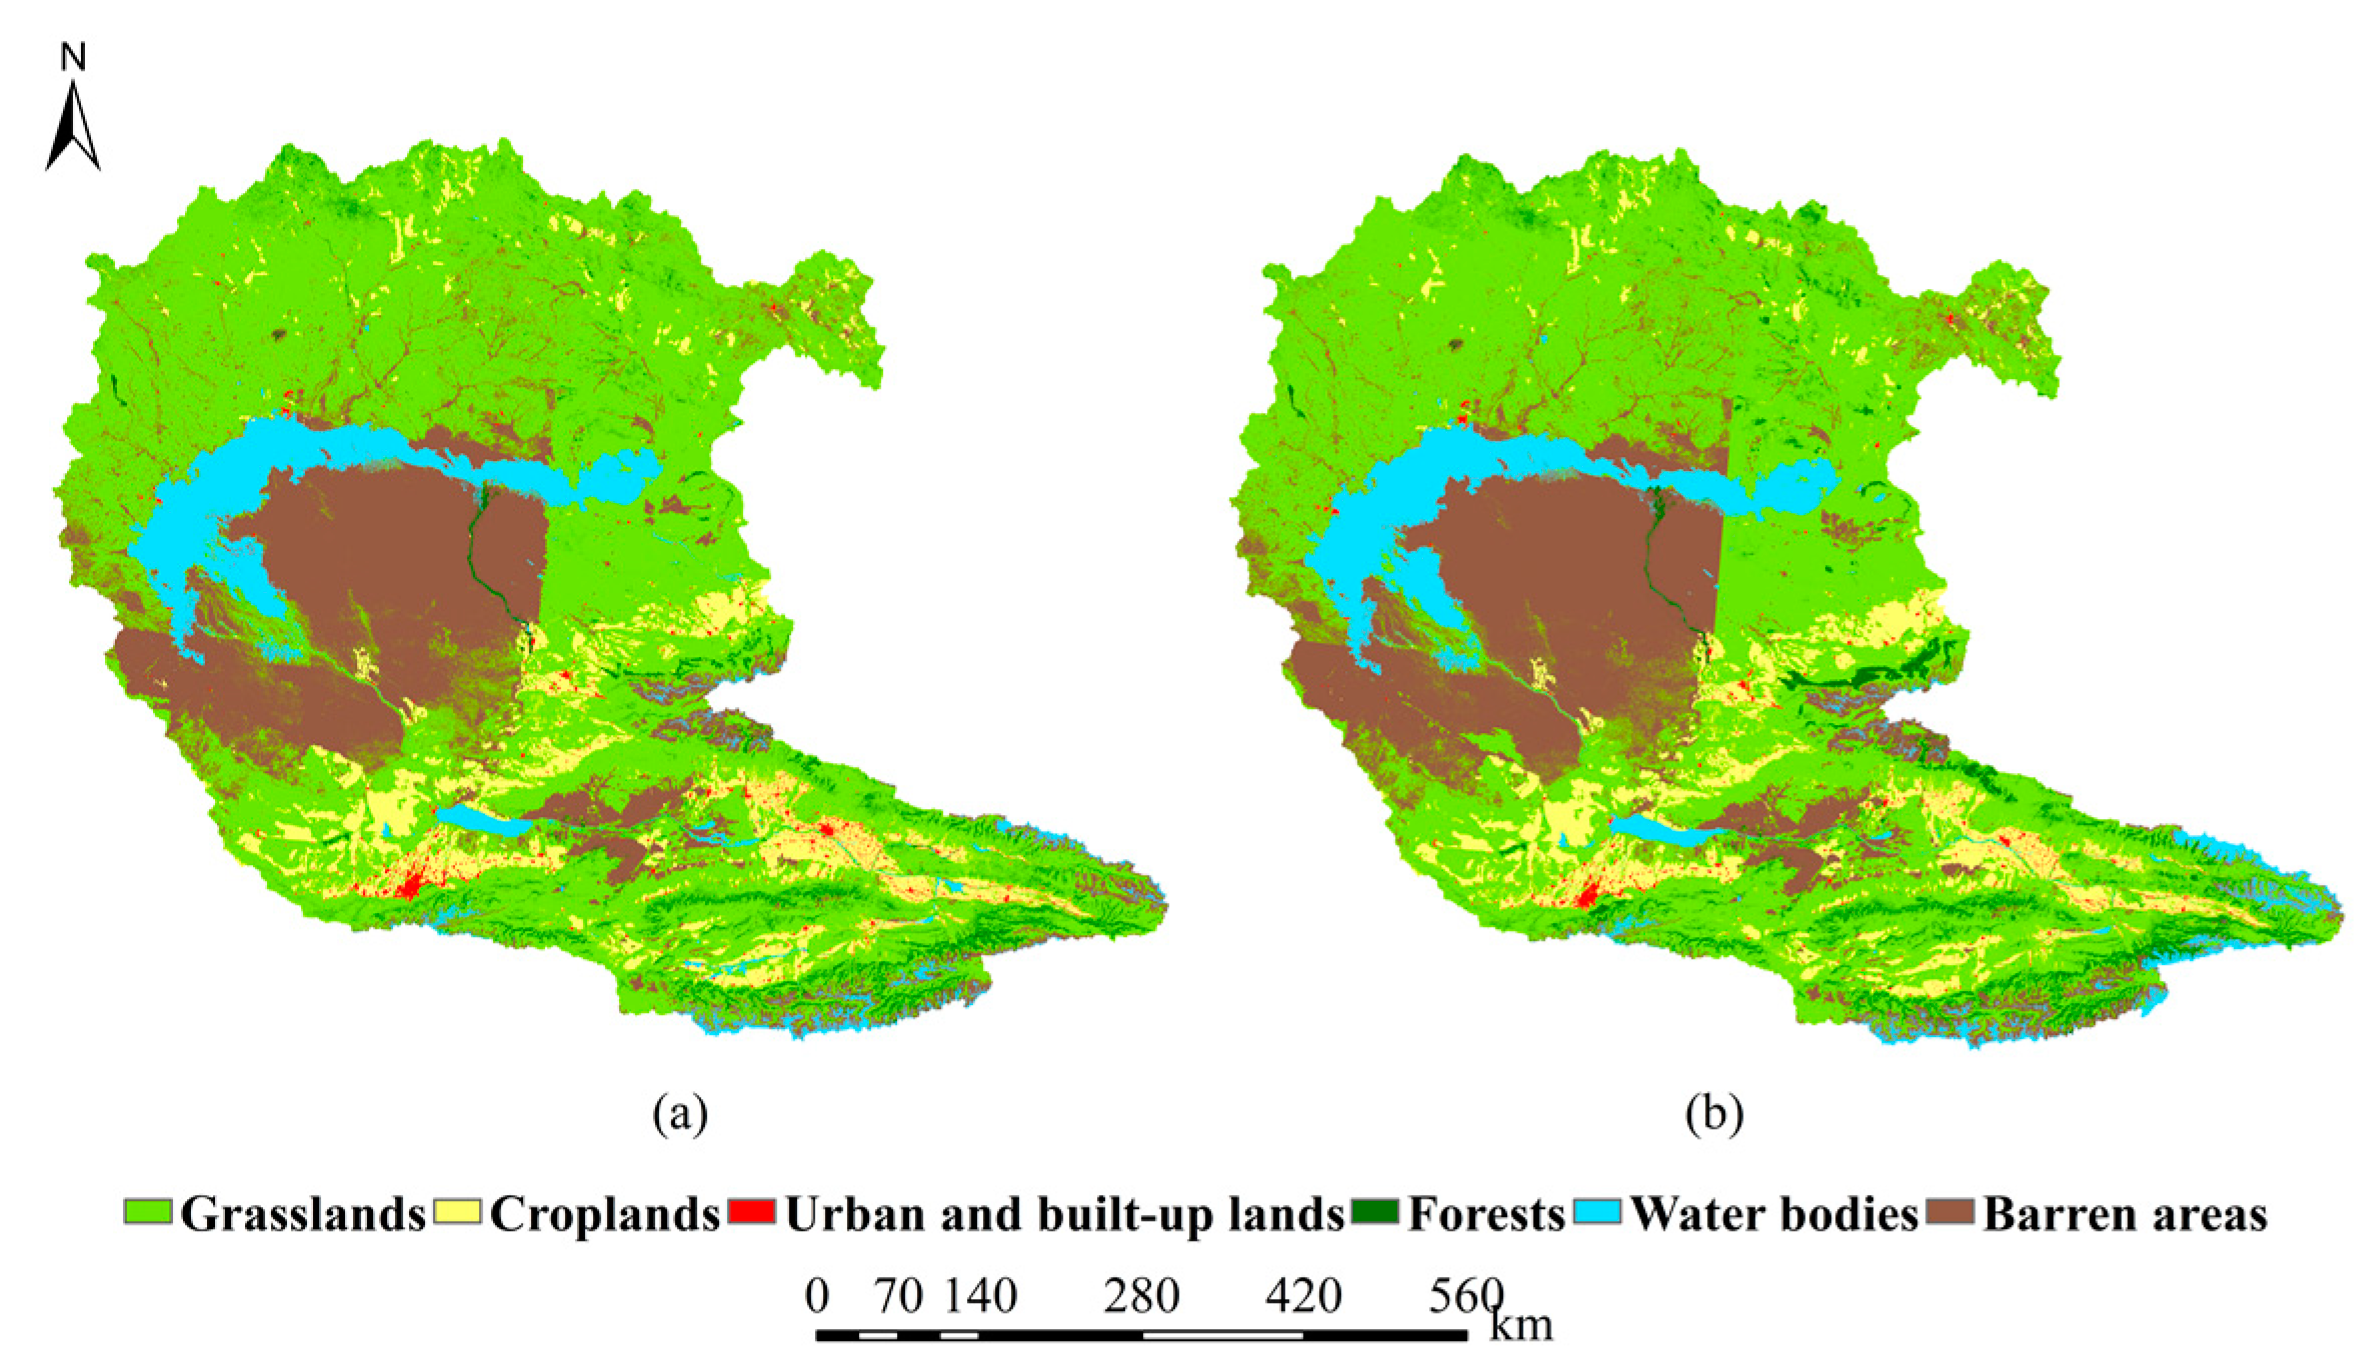
The uncorrected GlobeLand30 land use data for each year, the parameters (land use quantity, constraint matrix, and domain weights for the target year), and the land use demand were imported into the PLUS model to obtain the 2020 land use simulation results based on data for different year intervals (Figure 9). The simulation results for 2020 obtained using 2000 as the recent data had an oversized grassland area, which was obviously not consistent with the actual situation in the target year. Each LULC type in the simulation results based on 2010 data was almost consistent with the target year. The simulated area of urban and built-up land was slightly larger than that in the target year.
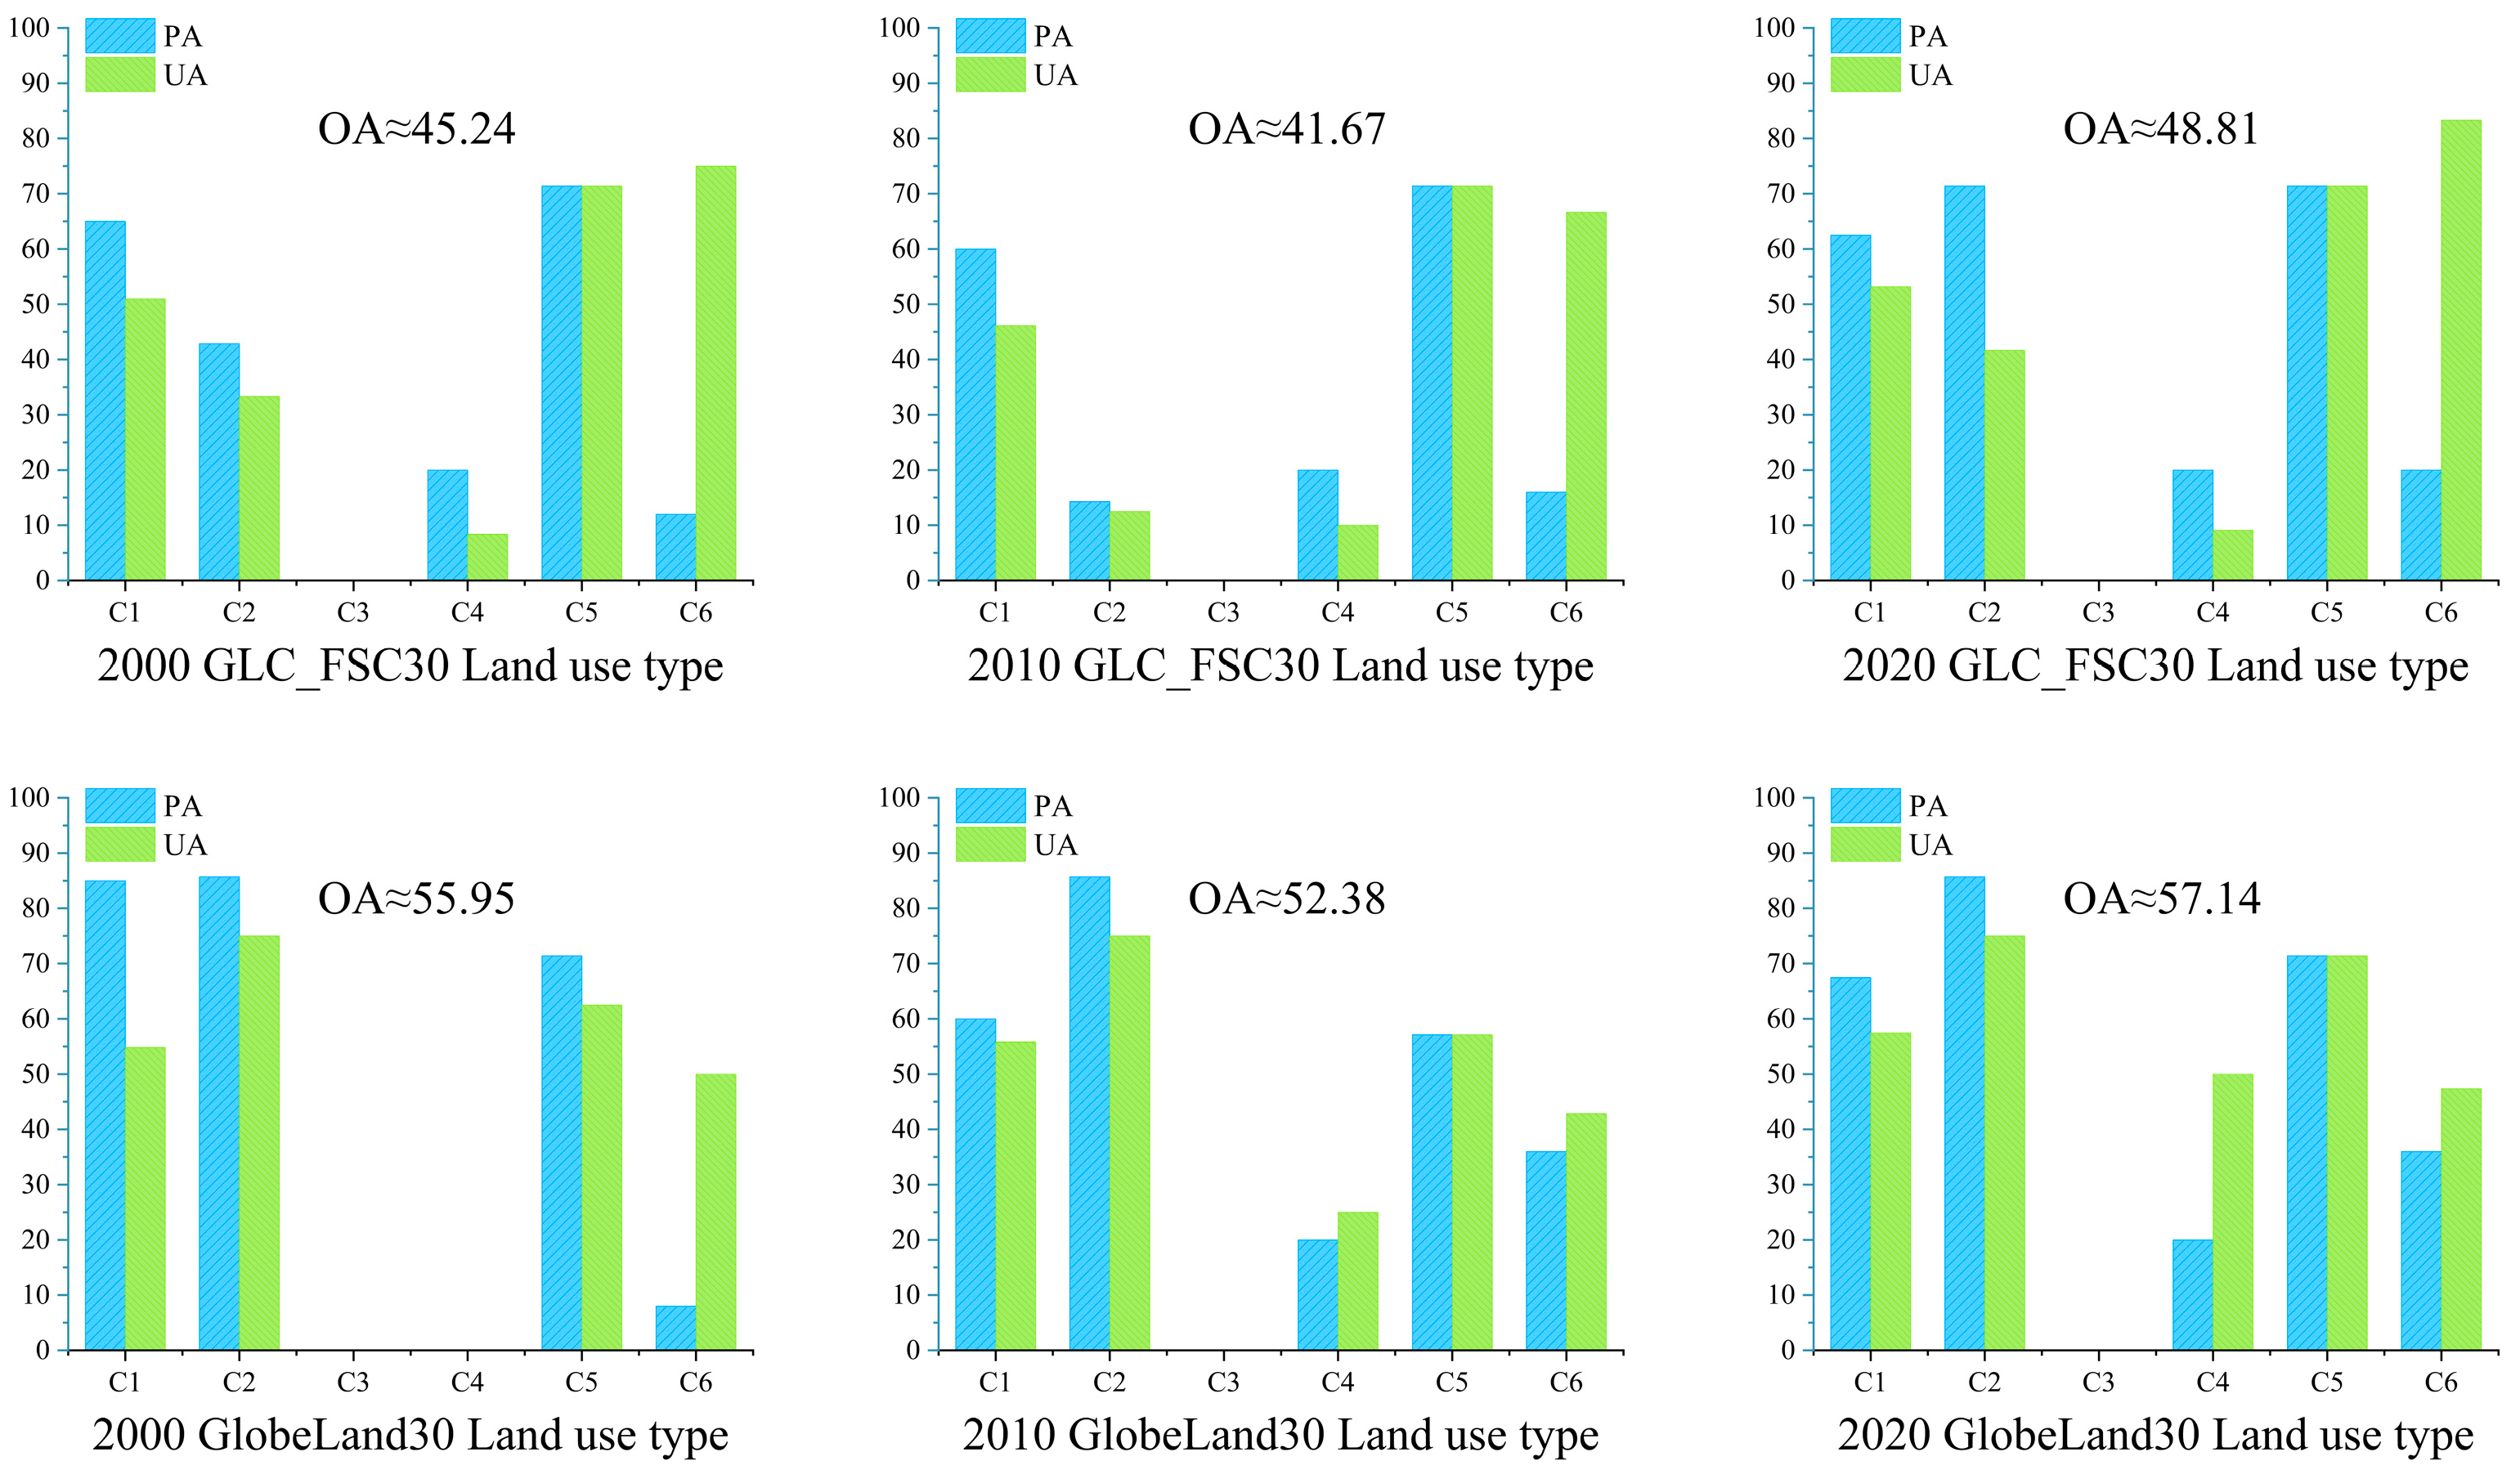
We used Kappa coefficients and FoM coefficients to quantitatively measure the accuracy of simulations with uncorrected GLC_FCS30 and GlobeLand30 data combined with the PLUS model (Table 5). When the PLUS model simulates the original 2020 GLC_FCS30 land use data, the simulation result based on 2015 data has the highest Kappa coefficient of more than 0.75 and a relatively high FoM coefficient of 0.074. The simulation result based on 2000 data has the lowest Kappa coefficient (0.69), but the FoM coefficient was the highest among the three simulations (0.083). GlobeLand30 simulations based on 2000 data are less accurate than those based on GLC_FCS30 data. GlobeLand30 simulations exhibit high Kappa coefficients (0.86) and FoM coefficients in simulations using data from the last decade (2010–2020), and the simulation results are nearly identical to those of the target year.
(2)
Uncorrected global LULC dataset PLUS–Markov chain forecasts
The land use demand quantity for future years had been obtained by forecasting, and, therefore, it was also necessary to explore the variation of simulation accuracy after forecasting. In this work, the land use demand quantity for future years was obtained through the already embedded CA–Markov chain forecasting module in the PLUS model. Historical land use data were combined with the CA-Markov chain 2020 projections to obtain the predicted figure utilization demand values for 2020 before making the actual projections. The value was input into the PLUS model for simulation to verify whether the PLUS simulation accuracy changed when combined with the forecast value. The simulation validation for the combined CA–Markov chain prediction used two periods of historical LULC data for the predictive and one period of existing LULC data for validation. Therefore, after taking 2020 as the validation data, the two-period land use data for the last 5 or 10 years were selected forward in time as the basis for the prediction.
The 2020 prediction obtained based on GLC_FCS30 land use data for different time periods was used as the land use demand, and the simulation results were obtained by combining the parameters (Figure 10). The simulation results differed only slightly from the simulations using the actual land use quantities in 2020 as the land use demand. There were problems with inaccurate cropland simulation in the southern Ili River Valley in China and smaller patches of urban and built-up land in the southern part of the basin. The prediction simulation results based on the predicted values derived from 2010–2015 were relatively accurate for croplands, and the remaining land categories also only differed slightly from the actual data.
The simulation results for 2020 based on the GlobeLand30 recent data combined with the predicted values obtained using the CA–Markov chain for the land use demand are shown in Figure 11. The simulation results based on land use data with a 10-year interval varied slightly from the GlobeLand30 2020 LULC status for urban and built-up land, while the simulations for the other land use types were similar to the GlobeLand30 2020 LULC status.
The accuracies of the uncorrected GLC_FSC30 and GlobeLand30 simulations are shown in Table 6. Compared to the results using the 2020 actual land use quantity as the land use demand with the 2020 data, the Kappa coefficients of the GLC_FSC30 predictions do not vary by more than 0.01. The GlobeLand30 data has the highest consistency (Kappa, 0.85) and the highest FoM coefficient (0.015), and the accuracy was not much different from the GlobeLand30 2010–2020 simulations without CA–Markov chain prediction.

4.2.2. Corrected Simulation and Prediction Accuracy of the Global LULC Dataset

(1)
Corrected Global LULC Dataset PLUS simulation
Both corrected datasets resulted in improved regional accuracy and produced results that were closer to the actual conditions of the Ili–Balkhash Basin than the uncorrected datasets. The corrected data may have different effects on the model simulation and prediction results. Therefore, the two corrected land use datasets were input into the PLUS model to further investigate the PLUS model simulation accuracy in the study area using the available data.
The corrected GLC_FCS30 simulation results with the actual land use demand quantity in 2020 used as the land use demand are shown in Figure 12. The simulation results for each year of data were similar to the 2020 LULC data, with almost no issue of excessively small urban and built-up land patches. However, there are still inaccuracies in simulating the croplands in the southern part of the Ili river valley. In the simulation results based on the 2000–2020 data the development of bare ground patches was still not consistent with the actual data, and the bare ground patches simulated based on the data for the last two decades still intruded too far into the area at the western end of Lake Balkhash. The simulation results based on the 2010–2020 and 2015–2020 data were in general agreement with the actual 2020 data.
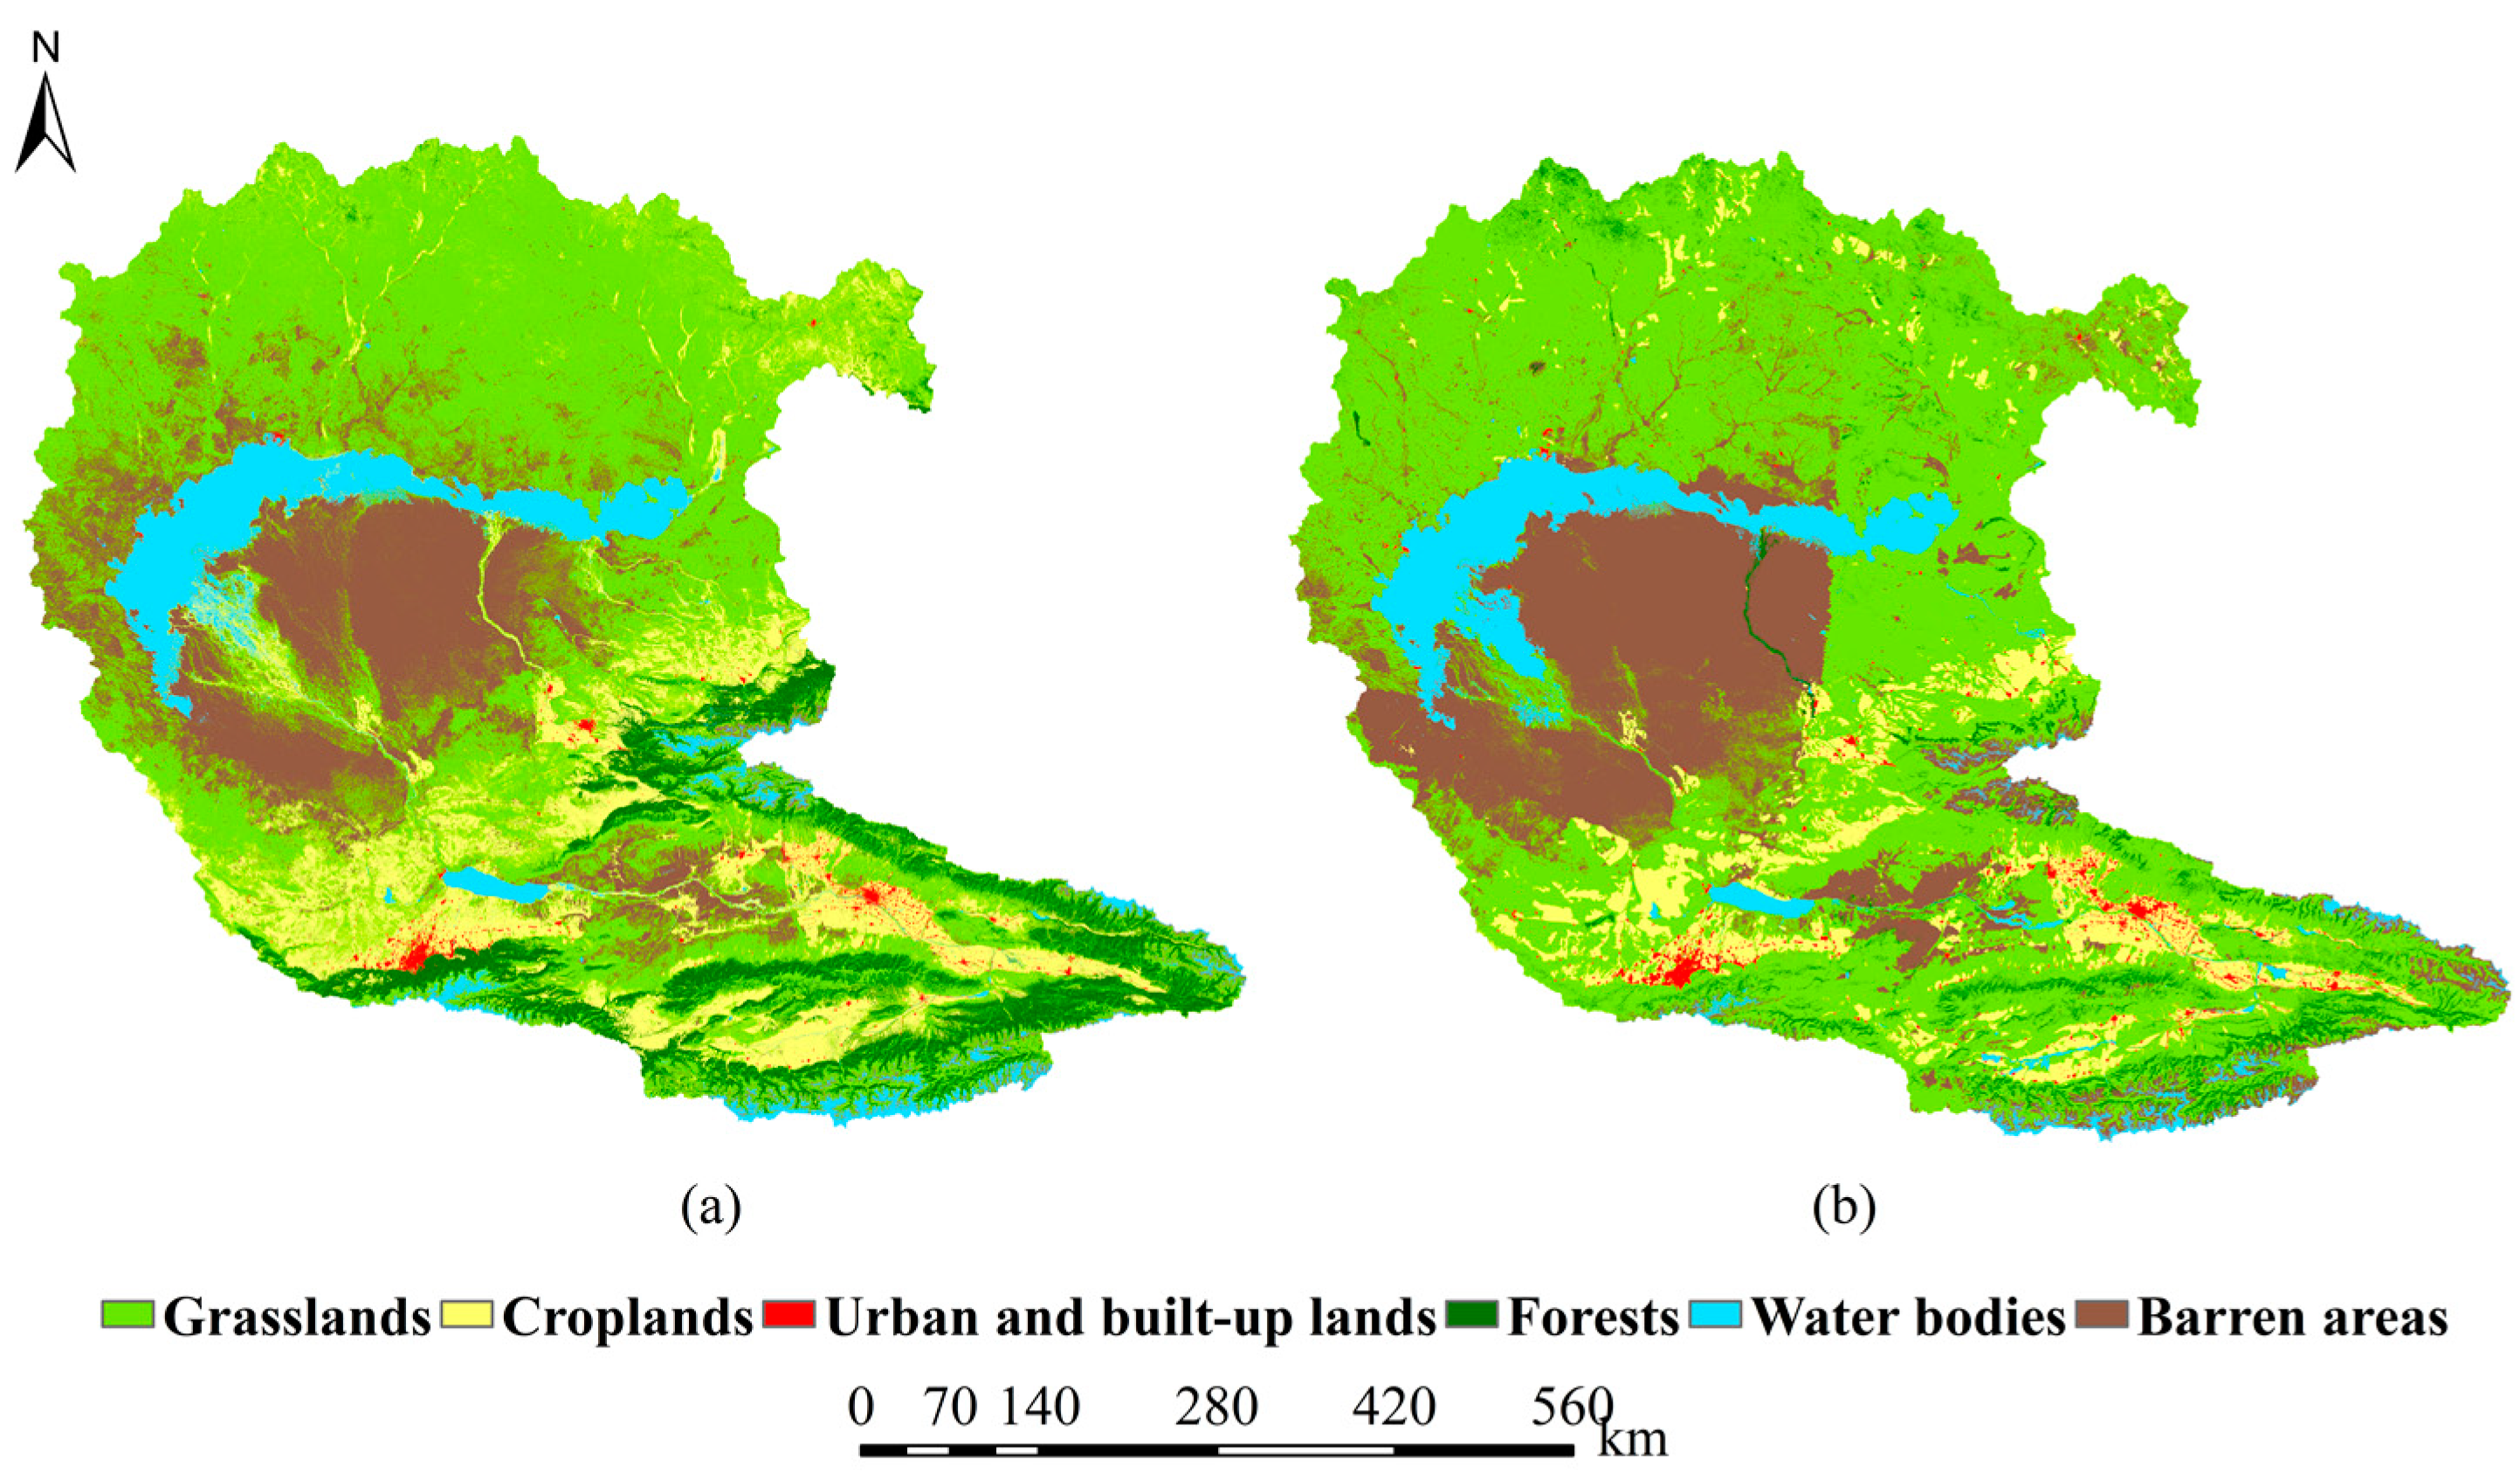
The simulation results based on the corrected GlobeLand30 data using the actual land use demand quantity in 2020 as the land use demand are shown in Figure 13. Because only the 2000 data were corrected, the corrected Globeland30 data only produced one phase of simulation results. In the simulation results for the corrected 2000–2020 data, the spatial distribution of barren areas and grasslands tended to be correct, but the barren area patches still differed significantly from the actual 2020 data, and there were obvious errors in their simulation. The simulated forests patches in the northwestern part of the basin developed abnormally, and the urban and built-up land areas were obviously smaller compared with the target year, while the simulation of cropland in the basin was neither too large nor too small, which was more consistent with the actual data.
The Kappa and FoM coefficient values of the two corrected global land use datasets simulated using the PLUS model are shown in Table 7. The Kappa coefficients of all three simulations for the corrected GLC_FCS30 data increased by approximately 0.2 to 0.3, and the FoM coefficients also increased to different degrees with values of approximately 0.1. Meanwhile, the Kappa coefficient of the simulation based on the last decade of data (2010–2020) reached more than 0.75, indicating high consistency. The Kappa coefficient of the present status simulation based on the 2015–2020 data exhibited the highest consistency at 0.79, while the FoM coefficient of this result was higher than that of the simulation based on the last decade of data (2010–2020).
The Kappa coefficient of the corrected GlobeLand30 2000–2020 simulations decreased by 0.12 compared to the uncorrected period, and the Kappa coefficient was only 0.58, which is less consistent with the target year. The FoM coefficient was 0.013, which is lower than those of the uncorrected data simulations. In contrast, the 2010–2020 data were not corrected, so only the simulation accuracy of the 2000–2020 time period changed after correction, and the simulations based on data from the last decade (2010–2020) still had the highest Kappa coefficients and relatively high FoM coefficients.
(2)
Corrected global LULC dataset PLUS–Markov chain forecasts
As in the previous Section 4.2.1. prat (2), the projected land use demand quantities for 2020 obtained by combining CA–Markov chain prediction based on land use data for different time periods and comparing them with the actual results for 2020 were used to measure the simulation accuracy. The corrected GLC_FCS30 data combined with CA–Markov chain predicted simulation results for 2020 are shown in Figure 14. The overall simulations for cropland and urban and built-up land areas in the southern part of the basin were still small. For forests, the predicted simulation results for 2020 based on the 2000–2010 data were closer to the actual situation. In contrast, the prediction simulation based on 2010–2015 data was closer to the reality for croplands, urban and built-up lands, and barren areas, with relatively good results.
The results of the corrected GlobeLand30 data combined with CA–Markov chain 2020 forecast simulations are shown in Figure 15. The simulation of urban and built-up lands in the Ili River Valley area was slightly smaller than the actual situation, and the simulations of the rest of the land types were almost identical to the actual situation.
The accuracies of the corrected prediction results for both data products combined with CA–Markov chain prediction are shown in Table 8. The Kappa coefficient of the corrected GLC_FCS30 prediction results based on 2010–2015 data improved to 0.77, and the FoM coefficient increased by 0.001 (0.008). The Kappa coefficient of the prediction results based on corrected GLC_FCS30 2000–2010 data remained unchanged, while the FoM coefficient improved. The corrected GlobeLand30 data had the highest Kappa coefficient of 0.84, which was slightly lower than the Kappa coefficient of 0.85 for the simulation with actual data used for the land use demand, but still has high consistency. Meanwhile, the FoM coefficient was higher, at 0.4, compared with the uncorrected prediction simulation results. This shows that the dataset accuracy improvement process also has a positive effect on the simulation accuracy. Moreover, both the PLUS model and the predicted simulation results after incorporating Markov chain prediction achieved high accuracy closer to the actual land use status.

4.3. Prediction

The PLUS model provides linear regression and Markov chain methods to predict the classification of future land use demands. The CA–Markov chain method was used in this study to generate the predictions. The simulation and prediction validation process based on uncorrected and corrected LULC data in this work has shown the ability of two global land use products combined with the PLUS model to simulate LULC in the Ili-Balkhash Basin. CA–Markov chain predictions require only two periods of data, and therefore we combined the modified GLC_FCS30 data for the last five years (2015–2020) and GlobeLand30 data for the last ten years (2010–2020) for the forecast. The selected LULC data for these two time periods achieved the best results and accuracy in the combined uncorrected and corrected simulation and prediction results. Therefore, it was used to predict the LULC development in the Ili-Balkhash Basin for the next five years and the next ten years under natural scenarios (Figure 16).
The 2025 prediction results for the corrected GLC_FCS30 data are shown in Figure 16a. The spatial pattern of land use has not changed significantly, and the grasslands category is distributed throughout the basin, with a large area of grasslands in the northern part of the basin. Barren areas are concentrated in the vicinity of Lake Balkhash, with a vast barren area south of the lake and in the Ili River Valley. Croplands are concentrated in the plain in the southeastern part of the basin and the vicinity of urban peripheries. Forests are distributed in the mountainous area in the southeastern part of the basin. The increases or decreases in various types of patches in the basins under the 2025 simulation are not significant. The land use transfer matrix (Table 9) indicates that grasslands have the largest transfer out with a reduction of 8478.34 km2, mostly to cropland and bare land with very small transfers to water bodies and urban and built-up lands. A small part of forest is converted to cropland. The expansion of croplands, covering an area of 4348.35 km2, represents the largest extent, with grasslands being the primary contributor to this expansion. Additionally, approximately 207.08 km2 of forests have been converted into croplands. Urban and built-up lands have experienced a transfer area of 20.84 km2, which accounts for less than 0.0001% of the total basin area and approximately 0.01% of the urban and built-up land area in 2020. Simultaneously, there is almost no conversion of urban and built-up lands to other land types. In general, urban and built-up lands experienced an overall increase in 2025, with a net addition of 15.47 km2. The increase in area was predominantly sourced from grasslands. There is a reciprocal transfer phenomenon between grasslands and water bodies. From 2020 to 2025, the transfer area from grasslands to water bodies is greater than the transfer area from water bodies to grasslands. The transfer area from water bodies to grasslands amounts to only 181.95 km2.
The GlobeLand30 prediction results for 2030 are shown in Figure 16b The spatial distribution of each LULC type does not change drastically compared with the 2025 forecast simulation result. There is a significant increase in the urban and built-up lands, concentrated in the southern part of the basin. There is also an expansion of urban and built-up lands and barren areas in the northeastern part of the basin. The forested area of the GlobeLand30 product is significantly lower than that of the uncorrected GLC_FCS30 data, so the simulation data still maintains a small forested area. The area transfer matrix (Table 10) for each category shows that all types of land use have been converted, but the transfer amounts are small. Grasslands still have the largest reduction, amounting to 1321.16 km2, mainly converted to croplands, barren areas, and forests. A total of 744 km2 of croplands were converted into urban and built-up lands, whereas a negligible conversion of urban and built-up lands (11.99 km2) occurred into croplands. However, the overall growth of urban and built-up lands remains significant in the 2030 prediction results, with a net increase of 781.62 km2. The extent of barren areas has increased, primarily sourced from grasslands. Additionally, this increase includes a conversion area of 110.96 km2 from water bodies to barren areas. Moreover, a small amount of forests have also been converted into croplands and urban and built-up lands. The reciprocal conversion phenomenon between grasslands and water bodies still exists, but the total area converted from land types other than grasslands to grasslands is only 58.02 km2.
In general, based on the transfer matrices calculated from the simulated results for the Ili-Balkhash Basin in 2025 and 2030, it can be observed that the transformations mainly occur between grasslands, barren areas, croplands, and urban and built-up lands, while the transformation areas of other land types remain relatively small. During the prediction process, there were no restrictions imposed on the reciprocal conversions between barren areas and most other land types. However, in both predicted years, there is an ongoing expansion observed in the extent of barren areas, indicating that under a natural scenario, the area of barren areas will persistently increase. Simultaneously, there is almost no conversion from other land types to grasslands. The area of grasslands significantly decreases in both predicted years compared to other land types, with only a minimal amount of water bodies converting to grasslands. Under the natural scenario without any external forces, there is significant growth in urban and built-up lands. In the simulation results for both time periods, croplands are primarily derived from a substantial conversion of grasslands. The increase in urban and built-up lands over the next ten years mainly originates from the conversion of grasslands, while over the next decade, it predominantly shows an expansion based on croplands. From a five year perspective, the growth of croplands and urban and built-up lands will be more pronounced. However, in the next ten year timeframe, the expansion and changes in urban and built-up lands will be more significant.

5. Discussion

In this work, LULC data with intervals of five and ten years combined with the PLUS model and CA–Markov chain prediction achieved simulation results almost identical to the actual data, and the PLUS model simulation effect based on 20 years of land use data was relatively low. Therefore, the corrected GLC_FCS30 data for the last five years and GlobeLand30 data for the last ten years were preferentially selected to predict the future land use changes of the Ili-Balkhash Basin for the next five and ten years under the natural scenario. These predictions provide a reference for the simulation and prediction of land use and other natural elements in a large transboundary basin and also provide a basis for future land use management.
In previous PLUS model simulations, the model achieved high simulation accuracy in large areas or arid regions such as the Sichuan–Yunnan ecological barrier, the Qinghai–Tibet Plateau, the Yellow River Basin, and Xinjiang, China, using recent land use data [54,55,56,57], which is consistent with the results obtained in the present work. In this work, only the simulation of the whole basin in the natural scenario was conducted. As a transboundary region, the development of LULC is influenced by natural factors as well as by the national conditions and policies of different countries. For example, after the collapse of the Soviet Union, Kazakhstan promoted the reclamation and development of agricultural land, and after 2000 there were spatial changes in croplands, but the total area was relatively stable and remained almost unchanged [58,59]. The Ili Valley region of China, meanwhile, has experienced extensive agricultural development over the past two decades, and cropland growth has been largely stable [41,60]. This situation may also have implications for simulations based on longer interval land use data under a natural scenario.
The small values of the FoM coefficients in this study may be due to the very stable LULC types in the basin. The area of LULC change for each land use in the Ili-Balkhash Basin was very small in relation to the overall area of the basin. For example, the amount of change in grassland using the GLobeLand30 product from 2010–2020 was about 1400 km2, which was only 0.33% of the total area of the basin. It is quite rare to simulate relatively small changes in various land use types over such a large area. This phenomenon may be due to the value of the FoM coefficient being proportional to the net land use change, which was very similar to the phenomenon reported in a study by Peng K et al. [61].
This work shows that the PLUS model combined with CA–Markov chain predictions can achieve high simulation accuracy, although with slight variations, and is suitable for future LULC simulations in the study area. PLUS–Markov chain prediction has been verified to achieve high simulation accuracy results [62], and there is much room for further in-depth research using this model.
The model simulation is only based on historical data and set parameters; combining more high-precision land use data may obtain more accurate results. Although the impact of model parameter settings on simulation accuracy is limited, the parameter settings are subjectively influenced, and the parameters and model can be further tuned in future studies to minimize the errors caused by parameter settings.

6. Conclusions

In this work, we first quantitatively evaluated and optimized the accuracy of two high-resolution global datasets in the Ili-Balkhash Basin and explored the simulation and prediction capabilities of the datasets combined with the PLUS model. Then, we selected actual land use data with a high degree of accuracy to obtain the best simulation results among the simulation and forecast validation results of multiple time periods to simulate and predict the possible land use developments in 2025 and 2030 under a natural development scenario. The conclusions are as follows.
(1)
This work provides new ideas for optimizing the use of two global LULC data products in the region. In the accuracy value calculation results, the absolute accuracy of GlobeLand30 products is generally higher than that of GLC_FCS30 products. After the correction process described in this work, the absolute accuracy of both products improved. The overall accuracy of the GlobeLand30 product is still higher after correction, and the OA value of the corrected GLC_FCS30 product also improved, which indicates the effective optimization of accuracy for both products.
(2)
The simulation and prediction effect of the PLUS model, based on LULC data from different time periods, has been validated in the Ili-Balkhash Basin. Among the simulation and prediction results based on LULC data for different time periods, GLC_FCS30 data for the past 5 years (2015–2020) and GlobeLand30 data for the past 10 years (2010–2020) performed better as input to the simulation and prediction before and after correction, relative to other periods. Collectively, the LULC data of these two time periods are advantageous for LULC simulations and predictions of different time spans in the Ili-Balkhash Basin, with the Kappa coefficients of 0.77 and 0.85 for simulations and predictions of the corrected data, respectively.
(3)
The prediction results show that under the natural scenario without other external forces, the area of future LULC changes in the Ili-Balkhash Basin remains small, and the spatial pattern of LULC does not change greatly. In 2025, the grassland area continued to decrease, with a conversion area of 8478.34 km2 into other land classes, while croplands and urban and barren areas expanded. In 2030, the grasslands also maintained the highest conversion area compared to other land types. The urban and built-up lands and barren areas showed an increase, while the total conversion area from other land types to urban and built-up lands reached 804.14 km2.
Regional policies can have a significant impact on LULC changes in a region. Despite the small area of human-influenced land in the Ili-Balkhash Basin, regional policies could still have an impact on the development trend of LULC in the basin. In this work, future LULC simulations in the Ili-Balkhash Basin were conducted only under a natural scenario. In the future, relevant scenarios can be established, and policy constraints and development maps can be input to further assess the impact of regional policies on the future LULC development in the basin.

Author Contributions

J.K.: Conceptualization, Methodology, Visualization, Validation, Formal Analysis, Writing—original draft preparation, Writing—review and editing. J.W.: Resources, Funding Acquisition, Supervision, Writing—review and editing, Project Administration. J.D.: Supervision, Writing—review and editing, Project Administration. X.G.: Writing—review and editing, Supervision, Resources. All authors have read and agreed to the published version of the manuscript.

Funding

This research is financially supported by the Key Program of the Joint Fund of the National Natural Science Foundation of China (U2003202) and the University Scientific Research Plan of the Education Department of Xinjian Uygur Autonomous Region (XJEDU2021Y009).

Data Availability Statement

Global land cover data were downloaded from http://globeland30.org (accessed on 30 November 2021).

Acknowledgments

We also thank the editor and the anonymous reviewers for the invaluable comments.

Conflicts of Interest

The authors declare that they have no known competing financial interests or personal relationships that could have appeared to influence the work reported in this paper.

References

  1. Li, Y.; Deng, J.; Zang, C.; Kong, M.; Zhao, J. Spatial and temporal evolution characteristics of water resources in the Hanjiang River Basin of China over 50 years under a changing environment. Front. Environ. Sci. 2022, 10, 1377. [Google Scholar] [CrossRef]
  2. Guo, H.; Li, B.; Hou, Y.; Sun, T. Cellular Automata Model and Multi-agent Model for the Simulation of Land Use Change: A Review. Prog. Geogr. 2011, 30, 1336–1344. [Google Scholar]
  3. NAquilué, N.; De Cáceres, M.; Fortin, M.-J.; Fall, A.; Brotons, L. A spatial allocation procedure to model land-use/land-cover changes: Accounting for occurrence and spread processes. Ecol. Model. 2017, 344, 73–86. [Google Scholar] [CrossRef]
  4. Xu, J.; Xiao, P. A Bibliometric Analysis on the Effects of Land Use Change on Ecosystem Services: Current Status, Progress, and Future Directions. Sustainability 2022, 14, 3079. [Google Scholar] [CrossRef]
  5. Li, S.; He, S.; Xu, Z.; Liu, Y.; von Bloh, W. Desertification process and its effects on vegetation carbon sources and sinks vary under different aridity stress in Central Asia during 1990–2020. Catena 2023, 221, 106767. [Google Scholar] [CrossRef]
  6. Yu, Y.; Chen, X.; Malik, I.; Wistuba, M.; Cao, Y.; Hou, D.; Ta, Z.; He, J.; Zhang, L.; Yu, R. Spatiotemporal changes in water, land use, and ecosystem services in Central Asia considering climate changes and human activities. J. Arid. Land. 2021, 13, 881–890. [Google Scholar] [CrossRef]
  7. Xia, Q.; Chen, Y.; Zhang, X.; Ding, J. Spatiotemporal Changes in Ecological Quality and Its Associated Driving Factors in Central Asia. Remote Sens. 2022, 14, 3500. [Google Scholar] [CrossRef]
  8. Chen, Y.; Li, Z.; Fang, G.; Li, W. Large Hydrological Processes Changes in the Transboundary Rivers of Central Asia. J. Geophys. Res.-Atmos. 2018, 123, 5059–5069. [Google Scholar] [CrossRef]
  9. Xie, L.; Wang, H.; Liu, S. The ecosystem service values simulation and driving force analysis based on land use/land cover: A case study in inland rivers in arid areas of the Aksu River Basin, China. Ecol. Indic. 2022, 138, 108828. [Google Scholar] [CrossRef]
  10. Huang, F.; Ochoa, C.G.; Jarvis, W.T.; Zhong, R.; Guo, L. Evolution of landscape pattern and the association with ecosystem services in the Ili-Balkhash Basin. Environ. Monit. Assess. 2022, 194, 171. [Google Scholar] [CrossRef]
  11. Jiang, L.; Bao, A.; Jiapaer, G.; Liu, R.; Yuan, Y.; Yu, T. Monitoring land degradation and assessing its drivers to support sustainable development goal 15.3 in Central Asia. Sci. Total Environ. 2022, 807, 150868. [Google Scholar] [CrossRef]
  12. Li, J.; Zhang, C.; Zhu, S. Relative contributions of climate and land-use change to ecosystem services in arid inland basins. J. Clean. Prod. 2021, 298, 126844. [Google Scholar] [CrossRef]
  13. Liu, J.; Zhang, L.; Zhang, Q. The Development Simulation of Urban Green Space System Layout Based on the Land Use Scenario: A Case Study of Xuchang City, China. Sustainability 2019, 12, 326. [Google Scholar] [CrossRef] [Green Version]
  14. Li, Y.; Duo, L.; Zhang, M.; Wu, Z.; Guan, Y. Assessment and Estimation of the Spatial and Temporal Evolution of Landscape Patterns and Their Impact on Habitat Quality in Nanchang, China. Land 2021, 10, 1073. [Google Scholar] [CrossRef]
  15. Liu, P.; Hu, Y.; Jia, W. Land use optimization research based on FLUS model and ecosystem services-setting Jinan City as an example. Urban Clim. 2021, 40, 100984. [Google Scholar] [CrossRef]
  16. Wang, H.; Guo, J.; Zhang, B.; Zeng, H. Simulating urban land growth by incorporating historical information into a cellular automata model. Landsc. Urban Plan. 2021, 214, 104168. [Google Scholar] [CrossRef]
  17. Saputra, M.H.; Lee, H.S. Prediction of Land Use and Land Cover Changes for North Sumatra, Indonesia, Using an Artificial-Neural-Network-Based Cellular Automaton. Sustainability 2019, 11, 3024. [Google Scholar] [CrossRef] [Green Version]
  18. Zhou, D.; Lin, Z.; Liu, L. Regional land salinization assessment and simulation through cellular automaton-Markov modeling and spatial pattern analysis. Sci. Total Environ. 2012, 439, 260–274. [Google Scholar] [CrossRef]
  19. Wang, Q.; Guan, Q.; Sun, Y.; Du, Q.; Xiao, X.; Luo, H.; Zhang, J.; Mi, J. Simulation of future land use/cover change (LUCC) in typical watersheds of arid regions under multiple scenarios. J. Environ. Manage. 2023, 335, 117543. [Google Scholar] [CrossRef]
  20. Liu, X.; Liang, X.; Li, X.; Xu, X.; Ou, J.; Chen, Y.; Li, S.; Wang, S.; Pei, F. A future land use simulation model (FLUS) for simulating multiple land use scenarios by coupling human and natural effects. Landsc. Urban Plan. 2017, 168, 94–116. [Google Scholar] [CrossRef]
  21. Lin, J.; He, P.; Yang, L.; He, X.; Lu, S.; Liu, D. Predicting future urban waterlogging-prone areas by coupling the maximum entropy and FLUS model. Sustain. Cities Soc. 2022, 80, 103812. [Google Scholar] [CrossRef]
  22. Zhang, Y.; Li, C.; Zhang, L.; Liu, J.; Li, R. Spatial Simulation of Land-Use Development of Feixi County, China, Based on Optimized Productive–Living–Ecological Functions. Sustainability 2022, 14, 6195. [Google Scholar] [CrossRef]
  23. Xie, L.; Wang, H.; Liu, S. Simulating the spatiotemporal variations of oasis rural settlements in the upper reaches of rivers of arid regions in Xinjiang, China. PLoS ONE 2022, 17, e0275241. [Google Scholar] [CrossRef]
  24. Liang, X.; Guan, Q.; Clarke, K.C.; Liu, S.; Wang, B.; Yao, Y. Understanding the drivers of sustainable land expansion using a patch-generating land use simulation (PLUS) model: A case study in Wuhan, China. Environ. Urban Syst. 2021, 85, 101569. [Google Scholar] [CrossRef]
  25. Zhao, K.; Li, J.; Ma, X.; Deng, C. The Effects of Land-Use and Climatic Changes on the Hydrological Environment in the Qinling Mountains of Shaanxi Province. Forests 2022, 13, 1776. [Google Scholar] [CrossRef]
  26. Deng, Z.; Quan, B. Intensity Characteristics and Multi-Scenario Projection of Land Use and Land Cover Change in Hengyang, China. Int. J. Environ. Res. Public Health 2022, 19, 8491. [Google Scholar] [CrossRef]
  27. Meng, R.; Cai, J.; Meng, Z.; Dang, X.; Han, Y. Spatio-Temporal Changes in Land Use and Habitat Quality of Hobq Desert along the Yellow River Section. Int. J. Environ. Res. Public Health 2023, 20, 3599. [Google Scholar] [CrossRef]
  28. Wang, J.; Zhang, J.; Xiong, N.; Liang, B.; Wang, Z.; Cressey, E.L. Spatial and Temporal Variation, Simulation and Prediction of Land Use in Ecological Conservation Area of Western Beijing. Remote Sens. 2022, 14, 1452. [Google Scholar] [CrossRef]
  29. Lin, Z.; Peng, S. Comparison of multimodel simulations of land use and land cover change considering integrated constraints- A case study of the Fuxian Lake basin. Ecol. Indic. 2022, 142, 109254. [Google Scholar] [CrossRef]
  30. Wang, Z.; Li, X.; Mao, Y.; Li, L.; Wang, X.; Lin, Q. Dynamic simulation of land use change and assessment of carbon storage based on climate change scenarios at the city level: A case study of Bortala, China. Ecol. Indic. 2022, 134, 108499. [Google Scholar] [CrossRef]
  31. Xu, F.; Li, P.; Chen, W.; He, S.; Li, F.; Mu, D.; Elumalai, V. Impacts of land use/land cover patterns on groundwater quality in the Guanzhong Basin of northwest China. Geocarto Int. 2022, 37, 16769–16785. [Google Scholar] [CrossRef]
  32. Wei, Q.; Abudureheman, M.; Halike, A.; Yao, K.; Yao, L.; Tang, H.; Tuheti, B. Temporal and spatial variation analysis of habitat quality on the PLUS-InVEST model for Ebinur Lake Basin, China. Ecol. Indic. 2022, 145, 109632. [Google Scholar] [CrossRef]
  33. Shen, B.; Wu, J.; Zhan, S.; Jin, M.; Saparov, A.S.; Abuduwaili, J. Spatial variations and controls on the hydrochemistry of surface waters across the Ili-Balkhash Basin, arid Central Asia. J. Hydrol. 2021, 600, 126565. [Google Scholar] [CrossRef]
  34. Duan, W.; Zou, S.; Chen, Y.; Nover, D.; Fang, G.; Wang, Y. Sustainable water management for cross-border resources: The Balkhash Lake Basin of Central Asia, 1931–2015. J. Clean. Prod. 2020, 263, 121614. [Google Scholar] [CrossRef]
  35. Liu, W.; Chen, C.; Luo, G.; He, H. Change processes and trends of land use/cover in the Balkhash Lake basin. Arid. Zone Res. 2021, 38, 1452–1463. [Google Scholar]
  36. Mo, G.; Liu, W. Research on the Temporal and Spatial Characteristics of Land Use/Cover and Coupling Analysis with Water Resources in Central Asia Based on Remote Sensing. Master’s Thesis, Guizhou University, Guiyang, China, 2021. [Google Scholar]
  37. Zhu, L.; Luo, G.; Chen, X.; Xu, W.; Fen, Y.; Zheng, Q.; Wang, J.; Zhou, D.; Yin, C. Detection of Land Use/Land Cover Change in the Middle and Lower Reaches of the Ili River, 1970–2007. Prog. Geogr. 2010, 29, 292–300. [Google Scholar]
  38. Wang, Y.; Ding, J.; Li, X.; Zhang, J.; Ma, G. Impact of LUCC on ecosystem services values in the Yili River Basin based on an intensity analysis model. Acta Ecol. Sin. 2022, 42, 3106–3118. [Google Scholar]
  39. Shi, M.; Wu, H.; Fan, X.; Jia, T.; Dong, T.; He, P.; Baqa, M.F. Trade-Offs and Synergies of Multiple Ecosystem Services for Different Land Use Scenarios in the Yili River Valley, China. Sustainability 2021, 13, 1577. [Google Scholar] [CrossRef]
  40. Yu, L.; Wang, J.; Gong, P. Improving 30m global land-cover map FROM-GLC with time series MODIS and auxiliary data sets: A segmentation-based approach. Int. J. Remote Sens. 2013, 34, 5851–5867. [Google Scholar] [CrossRef]
  41. Zhang, X.; Liu, L.; Chen, X.; Gao, Y.; Xie, S.; Mi, J. GLC_FCS30: Global land-cover product with fine classification system at 30m using time-series Landsat imagery. Earth Syst. Sci. Data 2021, 13, 2753–2776. [Google Scholar] [CrossRef]
  42. Jun, C.; Ban, Y.; Li, S. Open access to Earth land-cover map. Nature 2014, 514, 434. [Google Scholar] [CrossRef] [PubMed] [Green Version]
  43. Guo, L.; Xia, Z. Temperature and precipitation long-term trends and variations in the Ili-Balkhash Basin. Theor. Appl. Climatol. 2014, 115, 219–229. [Google Scholar] [CrossRef]
  44. Hao, H.; Zhang, F.; Zhao, X.; Kiu, Y.; Li, L. Spariontemporal Change of Water Storage and Its Influencing Factors in the Ii-Balkhash Basin based on GRACE Data. Remote Sens. Technol. Appl. 2017, 32, 883–892. [Google Scholar]
  45. Yang, D. Variation of water level in Balkhash Lake and its causes. Arid. Land Geogr. 1993, 16, 36–42. [Google Scholar]
  46. Liu, L.; Guan, J.; Mu, C.; Han, W.; Qiao, X.; Zheng, J. Spatio-temporal characteristics of vegetation net primary productivity in the lli River Basin from 2008 to 2018. Acta Ecol. 2022, 42, 4861–4871. [Google Scholar]
  47. Wang, J.; Yang, X.; Wang, Z.; Cheng, H.; Kang, J.; Tang, H.; Li, Y.; Bian, Z.; Bai, Z. Consistency Analysis and Accuracy Assessment of Three Global Ten-Meter Land Cover Products in Rocky Desertification Region—A Case Study of Southwest China. Acta Ecol. 2022, 11, 202. [Google Scholar] [CrossRef]
  48. Kang, J.; Yang, X.; Wang, Z.; Chen, H.; Wang, J.; Tang, H.; Li, Y.; Bian, Z.; Bai, Z. Comparison of Three Ten Meter Land Cover Products in a Drought Region: A Case Study in Northwestern China. Land 2022, 11, 427. [Google Scholar] [CrossRef]
  49. Zhao, Y.; Gong, P.; Yu, L.; Hu, L.; Li, X.; Li, C.; Zhang, H.; Zheng, Y.; Wang, J.; Zhao, Y.; et al. Towards A common validation sample set for global land cover mapping. Int. J. Remote Sens. 2014, 35, 4795–4814. [Google Scholar] [CrossRef]
  50. Fritz, S.; See, L.; Perger, C.; McCallum, I.; Schill, C.; Schepaschenko, D.; Duerauer, M.; Karner, M.; Dresel, C.; Laso-Bayas, J.-C.; et al. A global dataset of crowdsourced land cover and land use reference data. Sci. Data 2017, 4, 1–8. [Google Scholar] [CrossRef] [Green Version]
  51. Gao, L.; Tao, F.; Liu, R.; Wang, Z.; Leng, H.; Zhou, T. Multi-scenario simulation and ecological risk analysis of land use based on the PLUS model: A case study of Nanjing. Sustain. Cities Soc. 2022, 85, 104055. [Google Scholar] [CrossRef]
  52. Li, J.; Chen, X.; Kurban, A.; Van de Voorde, T.; De Maeyer, P.; Zhang, X. Coupled SSPs-RCPs scenarios to project the future dynamic variations of water-soil-carbon-biodiversity services in Central Asia. Ecol. Indic. 2021, 129, 107936. [Google Scholar] [CrossRef]
  53. Wang, B.; Liao, J.; Zhu, W.; Qiu, Q.; Wang, L.; Tang, L. The weight of neighborhood setting of the FLUS model based on a historical scenario: A case study of land use simulation of urban agglomeration of the Golden Triangle of Southerm Fujian in 2030. Acta Ecol. 2019, 39, 4284–4298. [Google Scholar]
  54. Li, C.; Wu, Y.; Gao, B.; Zheng, K.; Wu, Y.; Li, C. Multi-scenario simulation of ecosystem service value for optimization of land use in the Sichuan-Yunnan ecological barrier, China. Ecol. Indic. 2021, 132, 108328. [Google Scholar] [CrossRef]
  55. Li, M.; Liu, S.; Wang, F.; Liu, H.; Liu, Y.; Wang, Q. Cost-benefit analysis of ecological restoration based on land use scenario simulation and ecosystem service on the Qinghai-Tibet Plateau. Glob. Ecol. Conserv. 2022, 34, e02006. [Google Scholar] [CrossRef]
  56. Cheng, Y.; Song, W.; Yu, H.; Wei, X.; Sheng, S.; Liu, B.; Gao, H.; Li, J.; Cao, C.; Yang, D. Assessment and Prediction of Landscape Ecological Risk from Land Use Change in Xinjiang, China. Land 2023, 12, 895. [Google Scholar] [CrossRef]
  57. Yang, R.; Chen, H.; Chen, S.; Ye, Y. Spatiotemporal evolution and prediction of land use/land cover changes and ecosystem service variation in the Yellow River Basin, China. Glob. Ecol. Conserv. 2022, 34, e02006. [Google Scholar] [CrossRef]
  58. Yuan, J.; Chen, J.; Sciusco, P.; Kolluru, V.; Saraf, S.; John, R.; Ochirbat, B. Land Use Hotspots of the Two Largest Landlocked Countries: Kazakhstan and Mongolia. Remote Sens. 2022, 14, 1805. [Google Scholar] [CrossRef]
  59. Zhang, F.; Zeng, B.; Cao, Y.; Li, F.; Yang, Z.; Qi, J. Human activities have markedly altered the pattern and trend of net primary production in the Ili River basin of Northwest China under current climate change. Land Degrad. Dev. 2022, 33, 2585–2595. [Google Scholar] [CrossRef]
  60. Xue, J.; Wang, Y.; Teng, H.; Wang, N.; Li, D.; Peng, J.; Biswas, A.; Shi, Z. Dynamics of vegetation greenness and its response to climate change in Xinjiang over the past two decades. Remote Sens. 2021, 13, 4063. [Google Scholar] [CrossRef]
  61. Peng, K.; Jiang, W.; Deng, Y.; Liu, Y.; Wu, Z.; Chen, Z. Simulating wetland changes under different scenarios based on integrating the random forest and CLUE-S models: A case study of Wuhan Urban Agglomeration. Ecol. Indic. 2020, 117, 106671. [Google Scholar] [CrossRef]
  62. Wang, L.; Zhou, S.; Ouyang, S. The spatial prediction and optimization of production-living-ecological space based on Markov–PLUS model: A case study of Yunnan Province. Open Geosci. 2022, 14, 481–493. [Google Scholar] [CrossRef]
Figure 1. Geographical location of the Ili–Balkhash Basin.
Remotesensing 15 03059 g001
Figure 2. Land use simulation framework.
Remotesensing 15 03059 g002
Figure 3. Absolute accuracy of GLC_FCS30 and GlobeLand30 datasets based on FROM-GLC validation samples.
Remotesensing 15 03059 g003
Figure 4. Absolute accuracy of GLC_FCS30 and GlobeLand30 datasets based on Geo-WiKi validation samples.
Remotesensing 15 03059 g004
Figure 5. Absolute accuracy of GLC_FCS30 and GlobeLand30 datasets based on visual interpretation validation samples.
Remotesensing 15 03059 g005
Figure 6. Local comparison of GLC_FCS30 2000 data and actual image (true color).
Remotesensing 15 03059 g006
Figure 7. Local comparison of GlobeLand30 2000 data and actual image (true color).
Remotesensing 15 03059 g007
Figure 8. The patch-generating land use simulation (PLUS) model simulation results for uncorrected GLC_FCS30 data; (a) actual land use data for GLC_FCS30 2020 without correction; (b) simulation results based on uncorrected 2000–2020 data; (c) simulation results based on uncorrected 2010–2020 data; (d) simulation results based on uncorrected 2015–2020 data.
Remotesensing 15 03059 g008
Figure 9. PLUS model simulation results for uncorrected GlobeLand30 data; (a) uncorrected GlobeLand30 2020 actual land use data; (b) simulation results based on uncorrected 2000–2020 data; (c) simulation results based on uncorrected 2010–2020 data.
Remotesensing 15 03059 g009
Figure 10. Simulation results of uncorrected GLC_FCS30 data combined with cellular automaton (CA)–Markov chain prediction; (a) Uncorrected GLC_FCS30 2020 actual data; (b) Simulation results of the 2020 prediction obtained from uncorrected 2000–2010 data combined with CA–Markov chain prediction; (c) Simulation results of the 2020 prediction obtained from uncorrected 2010–2015 data combined with CA–Markov chain prediction.
Remotesensing 15 03059 g010
Figure 11. Simulation results of the uncorrected GlobeLand30 data combined with cellular automaton (CA)–Markov chain prediction; (a) GlobeLand30 2020 actual land use data; (b) Simulation results for the 2020 prediction obtained from uncorrected 2000–2010 data combined with CA–Markov chain prediction.
Remotesensing 15 03059 g011
Figure 12. The patch-generating land use simulation (PLUS) model simulation results of the corrected GLC_FCS30 data; (a) corrected GlobeLand30 2020 actual land use data; (b) corrected 2000–2020 simulation results; (c) corrected 2010–2020 simulation results; (d) corrected 2015–2020 simulation results.
Remotesensing 15 03059 g012
Figure 13. PLUS model simulation results of the corrected GlobeLand30 data; (a) actual land use data; (b) corrected 2000–2020 simulation results.
Remotesensing 15 03059 g013
Figure 14. Simulation results of the corrected GLC_FCS30 data combined with cellular automaton (CA)–Markov chain prediction; (a) Corrected GLC_FCS30 2020 actual data; (b) Simulation results for the 2020 prediction obtained from corrected 2000–2010 data combined with CA–Markov chain prediction; (c) Simulation results for the 2020 prediction obtained from corrected 2010–2015 data combined with CA–Markov chain prediction.
Remotesensing 15 03059 g014
Figure 15. Simulation results of the corrected GlobeLand30 data combined with CA–Markov chain predictions; (a) Corrected GlobeLand30 2020 actual data; (b) Simulation results for the 2020 prediction obtained from corrected 2000–2010 data combined with CA–Markov chain prediction.
Remotesensing 15 03059 g015
Figure 16. Corrected GLC_FCS30 and GlobeLand30 future prediction results; (a) Prediction results for the next five years obtained based on the corrected GLC_FCS30; (b) Prediction results for the next ten years obtained based on the GlebeLand30.
Remotesensing 15 03059 g016
Table 1. Driver data and sources.
Driving FactorSourcesTime of DataSpatial ResolutionData Access Time
Natural factorTemperatureERA5 Climate Reanalysis Data (https://cds.climate.copernicus.eu/)20200.1°April 2022
PrecipitationClimatic Research Unit (CRU TS) (https://crudata.uea.ac.uk/cru/data/hrg/)January 2020–December 20200.5°March 2021
DEM, SlopeGeospatial Data Cloud (https://www.gscloud.cn/)/30 mNovember 2021
Soil DataHarmonized World Soil Database (HWSD) (http://www.fao.org/soils-portal/soil-survey/soil-maps-and-databases/harmonized-world-soil-database-v12/en/)/1 kmDecember 2021
Socioeconomic factorsPopulationWorldPop (https://www.worldpop.org/)20201 kmMarch 2022
GDPNational Earth System Science Data Center (http://loess.geodata.cn/index.html)201530 arcsecMarch 2022
Roads, Railways, and HighwaysOpenStreetMap (https://www.openstreetmap.org/)/Vector graphicFebruary 2022
Table 2. Cost matrix of land use pairs.
Cost Matrix of Land Use Pairs
Land Use TypesGrasslandsCroplandsUrban and Built-Up LandsForestsWater BodiesBarren Areas
Grasslands111111
Croplands011111
Urban and built-up lands111101
Forests011101
Water bodies111111
Barren areas111101
Table 3. GLC_FCS30 uncorrected and corrected accuracy.
OA (%)
FROM-GLCGeo-WikiVisual Interpretation
Uncorrected GLC_FCS30Corrected GLC_FCS30Uncorrected GLC_FCS30Corrected GLC_FCS30GLC_FCS30Corrected GLC_FCS30
200045.24 48.81 37.36 41.03 51.92 57.02
201041.67 45.24 38.83 41.76 53.94 59.23
202048.81 52.38 39.19 42.49 52.69 57.88
Table 4. GlobeLand30 corrected accuracy.
OA (%)
FROM-GLCGeo-WikiVisual Interpretation
Uncorrected GlobeLand30Corrected GLC_FCS30Uncorrected GlobeLand30Corrected GLC_FCS30Uncorrected GlobeLand30Corrected GLC_FCS30
200055.95 61.90 41.76 44.32 60.19 62.50
Table 5. The patch-generating land use simulation (PLUS) model simulation accuracy for the two uncorrected global land use datasets.
GLC_FCS30GlobeLand30
KappaFoMKappaFoM
2000–20200.69 0.083 0.63 0.019
2010–20200.72 0.071 0.86 0.035
2015–20200.75 0.074 //
Table 6. Simulation accuracies of the two uncorrected global land use datasets combined with cellular automaton (CA)–Markov chain prediction.
Corrected GLC_FCS30Corrected GlobeLand30
KappaFoMKappaFoM
2000–2010_Markov20200.73 0.008 0.85 0.015
2010–2015_Markov20200.75 0.007 //
Table 7. The patch-generating land use simulation (PLUS) model simulation accuracy for two global land use datasets after correction.
Corrected GLC_FCS30Corrected GlobeLand30
KappaFoMKappaFoM
2000–20200.71 0.124 0.51 0.013
2010–20200.75 0.101 0.86 0.035
2015–20200.77 0.008 //
Table 8. Simulation accuracy of the two corrected global land use datasets combined with CA–Markov chain prediction.
Corrected GLC_FCS30Corrected GlobeLand30
KappaFoMKappaFoM
2000–2010_Markov20200.73 0.008 0.85 0.015
2010–2015_Markov20200.75 0.007 //
Table 9. Land use area transfer matrix for 2020–2025 (km2).
Land Use TypesGrasslandsCroplandsUrban and Built-Up LandsForestsWater BodiesBarren AreasTotal
Grasslands217,015.784141.2732.010875.723429.34225,494.12
Croplands054,452.68000054,452.68
Urban and built-up lands20.8402193.820002214.66
Forests0207.080.133,823.2800.0334,030.49
Water bodies181.9504.2028,810.55028,996.7
Barren areas0000074,385.6874,385.68
Total217,218.5758,801.032230.1333,823.2829,686.2777,815.05419,574.33
Table 10. Land use area transfer matrix for 2020–2030 (km2).
Land Use TypesGrasslandsCroplandsUrban and Built-Up LandsForestsWater BodiesBarren AreasTotal
Grasslands248,881.37670.9746.64241.2990.28271.98250,202.53
Croplands032,938.23744.26.9143.25033,732.59
Urban and built-up lands3.2656.932906.210.37002966.77
Forests011.994.0212,050.2606.4912,072.76
Water bodies54.7626.829.286.5429,441.27100.9629,639.63
Barren areas0000090,970.5390,970.53
Total248,939.3933,704.943710.3512,305.3729,574.891,349.96419,584.81
Disclaimer/Publisher’s Note: The statements, opinions and data contained in all publications are solely those of the individual author(s) and contributor(s) and not of MDPI and/or the editor(s). MDPI and/or the editor(s) disclaim responsibility for any injury to people or property resulting from any ideas, methods, instructions or products referred to in the content.

