Article

Impacts of Climate Change and Human Activities on Plant Species α-Diversity across the Tibetan Grasslands

Lhasa Plateau Ecosystem Research Station, Key Laboratory of Ecosystem Network Observation and Modeling, Institute of Geographic Sciences and Natural Resources Research, Chinese Academy of Sciences, Beijing 100101, China
*
Author to whom correspondence should be addressed.
Remote Sens. 2023, 15(11), 2947; https://doi.org/10.3390/rs15112947
Submission received: 21 April 2023 / Revised: 1 June 2023 / Accepted: 2 June 2023 / Published: 5 June 2023

Abstract

:
Plant species α-diversity is closely correlated with ecosystem structures and functions. However, whether climate change and human activities will reduce plant species α-diversity remains controversial. In this study, potential (i.e., potential species richness: SRp, Shannonp, Simpsonp and Pieloup) and actual plant species α-diversity (i.e., actual species richness: SRa, Shannona, Simpsona and Pieloua) during 2000–2020 were quantified based on random forests in grasslands on the Tibetan Plateau. Overall, climate change had positive influences on potential plant species α-diversity across all the grassland systems. However, more than one-third areas showed decreasing trends for potential plant species α-diversity. Climate change increased the SRp at rates of 0.0060 and 0.0025 yr−1 in alpine steppes and alpine meadows, respectively. Temperature change predominated the variations of Shannonp and Simpsonp, and radiation change predominated the variations of SRp and Pieloup. Geography position, local temperature, precipitation and radiation conditions regulated the impacts of climate change on potential species α-diversity. On average, human activities caused 1% plant species loss but elevated the Shannon, Simpson and Pielou by 26%, 4% and 5%, respectively. There were 46.51%, 81.08%, 61.26% and 61.10% areas showing positive effects of human activities on plant species richness, Shannon, Simpson and Pielou, respectively. There were less than 48% areas showing increasing trends of human activities’ impacts on plant species α-diversity. Human activities increased plant species richness by 2% in alpine meadows but decreased plant species richness by 1% in alpine steppes. Accordingly, both the impacts of climate change and human activities on plant species α-diversity were not always negative and varied with space and grassland types. The study warned that both climate change and human activities may not cause as much species loss as expected. This study also cautioned that the impacts of radiation change on plant species α-diversity should be at least put on the same level as the impacts of climate warming and precipitation change on plant α-diversity.

1. Introduction

Plant species α-diversity, as key components of biodiversity, is affected by both climate change and human activities [1,2,3,4], which in turn results in positive or negative feedback to the structure and function of ecological systems (e.g., forage nutrition quality and production, soil microbial diversity) at multiple spatial and temporal scales [5,6]. A large number of studies have been carried out to examine the impacts of climate change and human activities (e.g., nitrogen addition, grazing) on plant species α-diversity [3,4,7,8,9,10,11]. Such studies can better provide services for conservating plant species α-diversity under the background of global change and improving the positive feedback strength of plant species α-diversity on the structure and function of ecosystems and even the high-quality development of human beings [12,13]. However, there are still two issues are needed to be resolved. Firstly, it is widely accepted that climate change has and will continue to affect plant species α-diversity by affecting light, water and soil nutrition availability [14,15], whereas there is still debate about whether climate change will necessarily lead to a decrease in plant species α-diversity [14,16,17]. Secondly, it is widely accepted that human activities have and will continue to alter the impacts of climate change on plant species α-diversity [10,15]. However, there is still debate about whether human activities can dampen or strengthen climate change effects on plant species α-diversity [17,18]. Therefore, it is needed for further studies.
Plant species α-diversity of grassland ecological systems are the key and main resources of plant diversity on the Tibetan Plateau, which is an important alpine, sensitive and fragile region under global change scenes [19,20]. With such knowledge, a large number of studies have been carried out to investigate the impact of global change on plant species α-diversity [10,21,22]. However, besides the issues mentioned above, there are still two issues are needed to be resolved. Firstly, at present, the responses of plant species α-diversity to climate change and/or human activities have only been explored at transect or single-site scales [23,24,25]. No studies have examined the impacts of human activities and climate change on plant α-diversity across the Tibetan grassland ecosystems. Secondly, there are actually multiple grassland types (e.g., alpine meadow-steppe, lowland meadow and montane meadow) on the Tibetan Plateau. However, on the one hand, most earlier studies have examined the response of plant species α-diversity to global change only in a specific type of grassland ecosystem [26,27] and mainly in alpine meadows rather than other grassland ecological systems [11,19,28]. On the other hand, a few studies have tried to compare the different responses of plant species α-diversity to global change among various types of grassland ecosystems [18,29], but these studies are mainly dependent on comparing the impacts of global change on plant α-diversity among alpine meadows, alpine steppes and/or alpine desert-steppes [29]. Therefore, further studies are needed to better serve the protection of plant species α-diversity across the Tibetan grassland ecosystems.
The response of plant species α-diversity to human activities and climate change in 2000–2020 was investigated across the Tibetan grasslands in this study. Previous studies have pointed out that both climate change and human activities cannot always cause biodiversity loss [10,16,19,30], and their effects on biodiversity vary among different grassland types [11,19,31]. The hypothesis of this study was to examine whether the findings from previous studies are still valid/true across the Tibetan grasslands.

2. Materials and Methods

2.1. Data

The study area was the whole alpine grassland region of the Tibetan Plateau. The time span was 2000–2020. Plant species richness, Shannon, Simpson and Pielou dataset (1 km × 1 km) were obtained based on the constructed random forest models by an earlier study [32]. These constructed random forest models had relatively high accuracies (RMSE was no more than 1.58; relative bias was within ±4.49%) [32]. The annual climate data (i.e., AP: annual precipitation, AT: annual temperature, ARad: annual radiation) and maximum normalized difference vegetation index (NDVImax) were obtained from the interpolated monthly climate data and MOD13A3 normalized difference vegetation index, respectively. Mean AP (MAP), AT (MAT), ARad (MARad) and NDVImax (MNDVImax) were referred to mean climate conditions and NDVImax conditions in 2000–2020. Three variables related to geography position (i.e., longitude, latitude and elevation) were also used in this study. The spatial resolution of all the data were 1 km × 1 km. The potential species richness, Shannon, Simpson and Pielou was labelled by SRp, Shannonp, Simpsonp and Pieloup, respectively. The actual species richness, Shannon, Simpson and Pielou was labelled by SRa, Shannona, Simpsona and Pieloua, respectively.

2.2. Statistical Analyses

Referred to previous studies [33], we calculated the ratio of SRa to SRp (RSR), Shannona to Shannonp (RShannon), Simpsona to Simpsonp (RSimpson) and Pieloua to Pieloup (RPielou). The RSR, RShannon, RSimpson and RPielou were used to reflect the human activities’ effects on plant α-diversity. If RSR, RShannon, RSimpson and RPielou values were equal to 1, human activities had no effects on plant α-diversity. If RSR, RShannon, RSimpson and RPielou values were greater than 1, human activities had positive effects on plant α-diversity. If RSR, RShannon, RSimpson and RPielou values were lower than 1, human activities had negative effects on plant α-diversity. Referred to previous studies [33], the sens.slope function of the trend package was used to obtain the change rate of SRp (slope_SRp), Shannonp (slope_Shannonp), Simpsonp (slope_Simpsonp), Pieloup (slope_Pieloup), SRa (slope_SRa), Shannona (slope_Shannona), Simpsona (slope_Simpsona), Pieloua (slope_Pieloua), RSR (slope_RSR), RShannon (slope_RShannon), RSimpson (slope_RSimpson), RPielou (slope_RPielou), AP (slope_AP), AT (slope_AT), ARad (slope_ARad) and NDVImax (slope_NDVImax). The correlations of slope_SRp, slope_Shannonp, slope_Simpsonp, slope_Pieloup, slope_SRa, slope_Shannona, slope_Simpsona and slope_Pieloua with longitude, latitude, elevation, MAP, MAT, MARad, slope_AP, slope_AT and slope_ARad were performed. The correlations of slope_SRa, slope_Shannona, slope_Simpsona and slope_Pieloua with MNDVImax and slope_NDVImax were performed. The correlations of RSR, RShannon, RSimpson, RPielou, slope_RSR, slope_RShannon, slope_RSimpson and slope_RPielou with longitude, latitude, elevation, MAP, MAT, MARad, MNDVImax, slope_AP, slope_AT, slope_ARad and slope_NDVImax were performed. All the analyses were based on R4.2.1.

3. Results

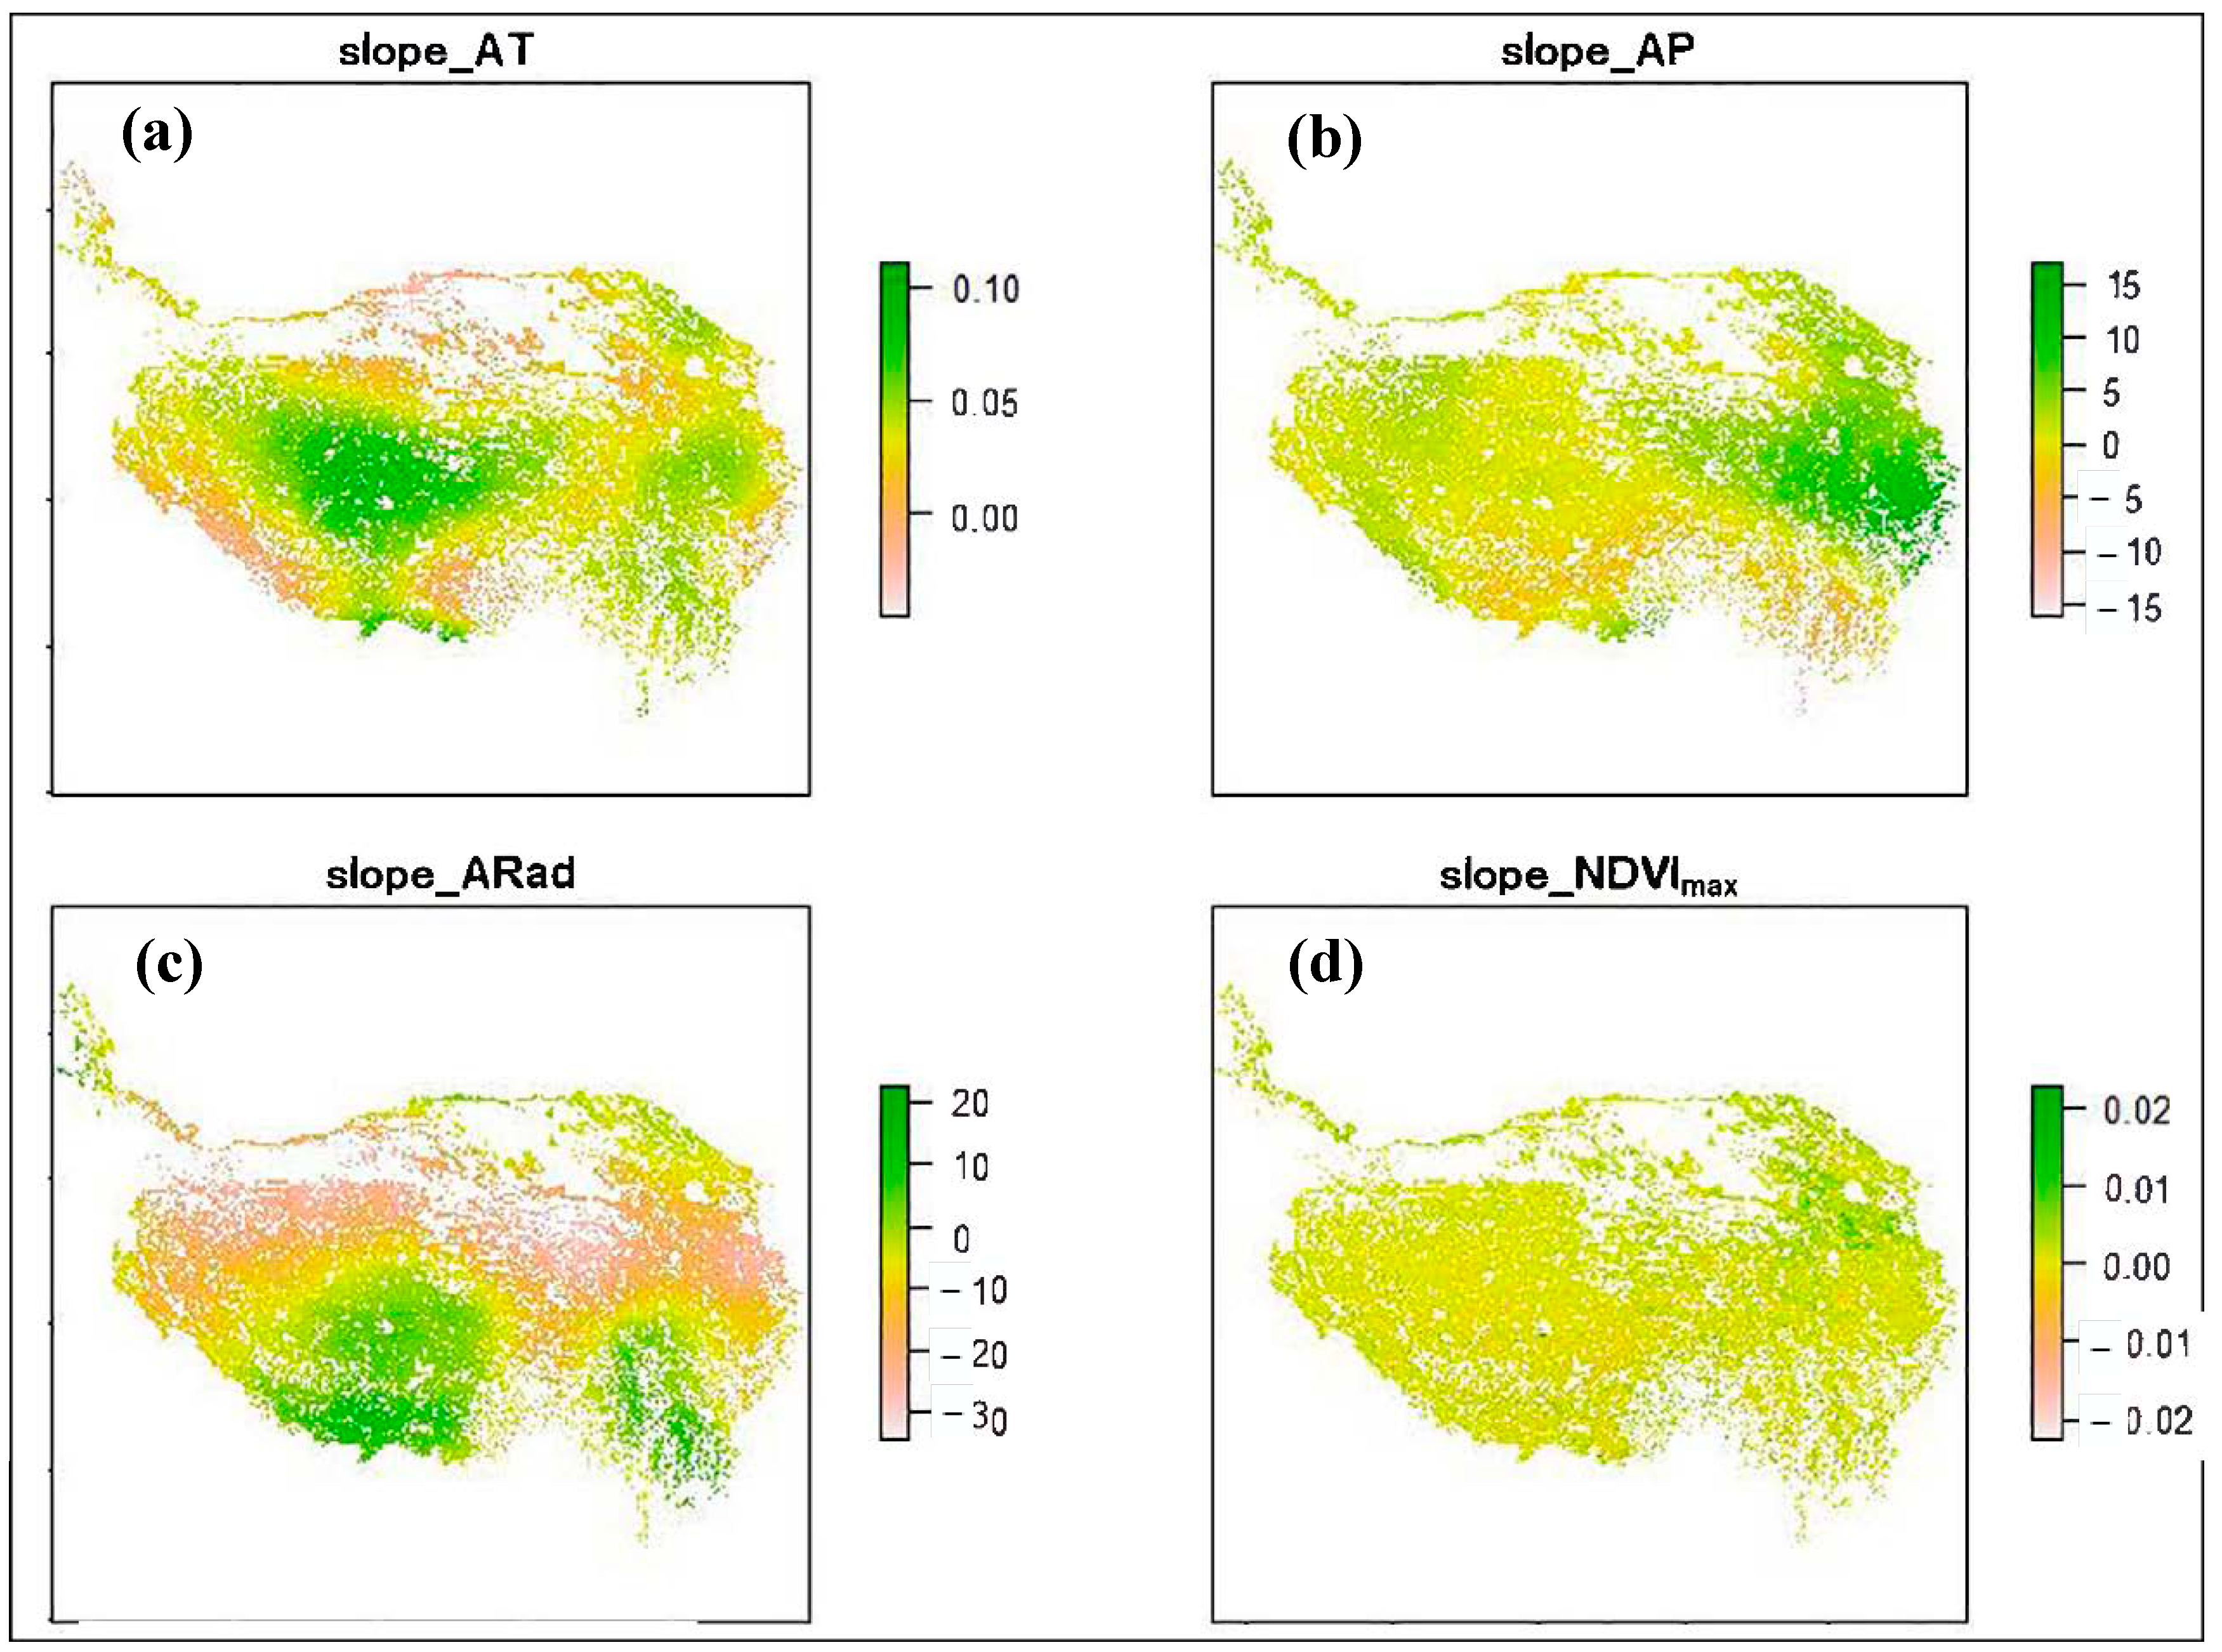
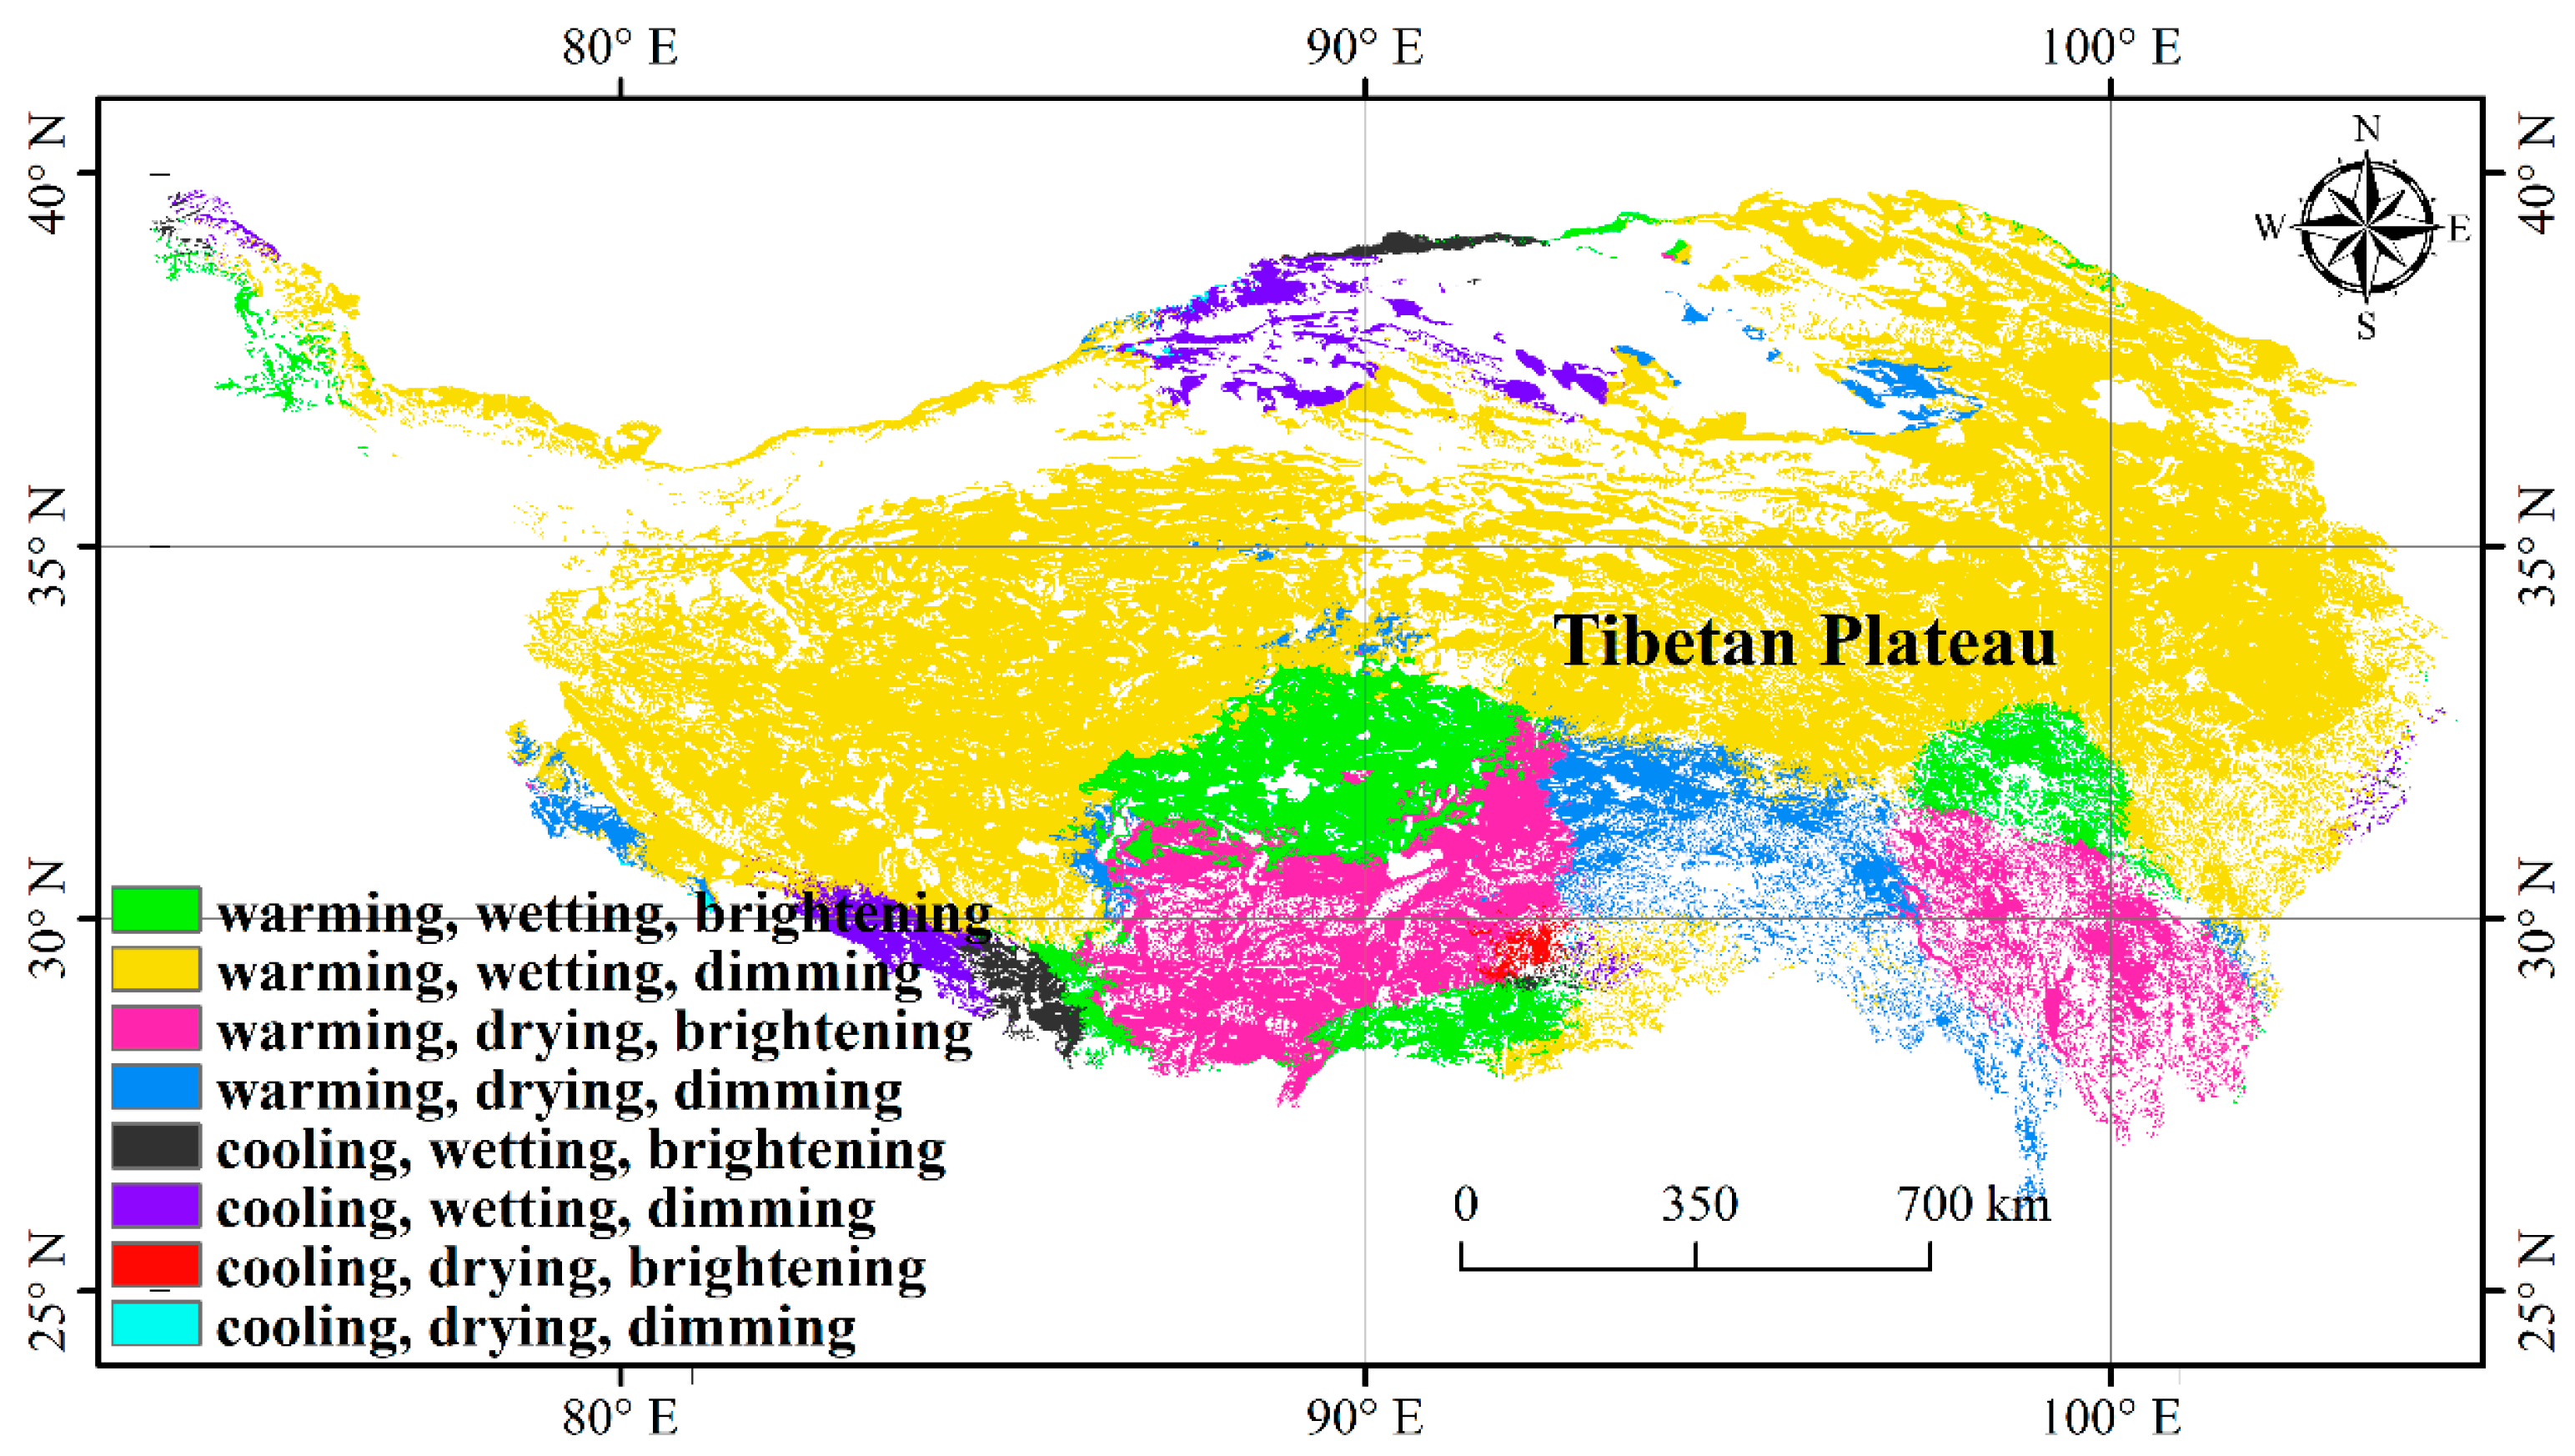
3.1. Climate Change and NDVImax Change

The spatial average slope_AT, slope_AP, slope_ARad and slope_NDVImax values were 0.04 °C yr−1, 2.27 mm yr−1, −8.19 MJ m−2 yr−1 and 0.00 yr−1, respectively (Figure A1). 10.36%, 65.86%, 13.11%, 6.04%, 1.19%, 3.09%, 0.28% and 0.07% areas showed the trend of warming-wetting-brightening, warming-wetting-dimming, warming-drying-brightening, warming-drying-dimming, cooling-wetting-brightening, cooling-wetting-dimming, cooling-drying-brightening and cooling-drying-dimming, respectively (Figure A2).

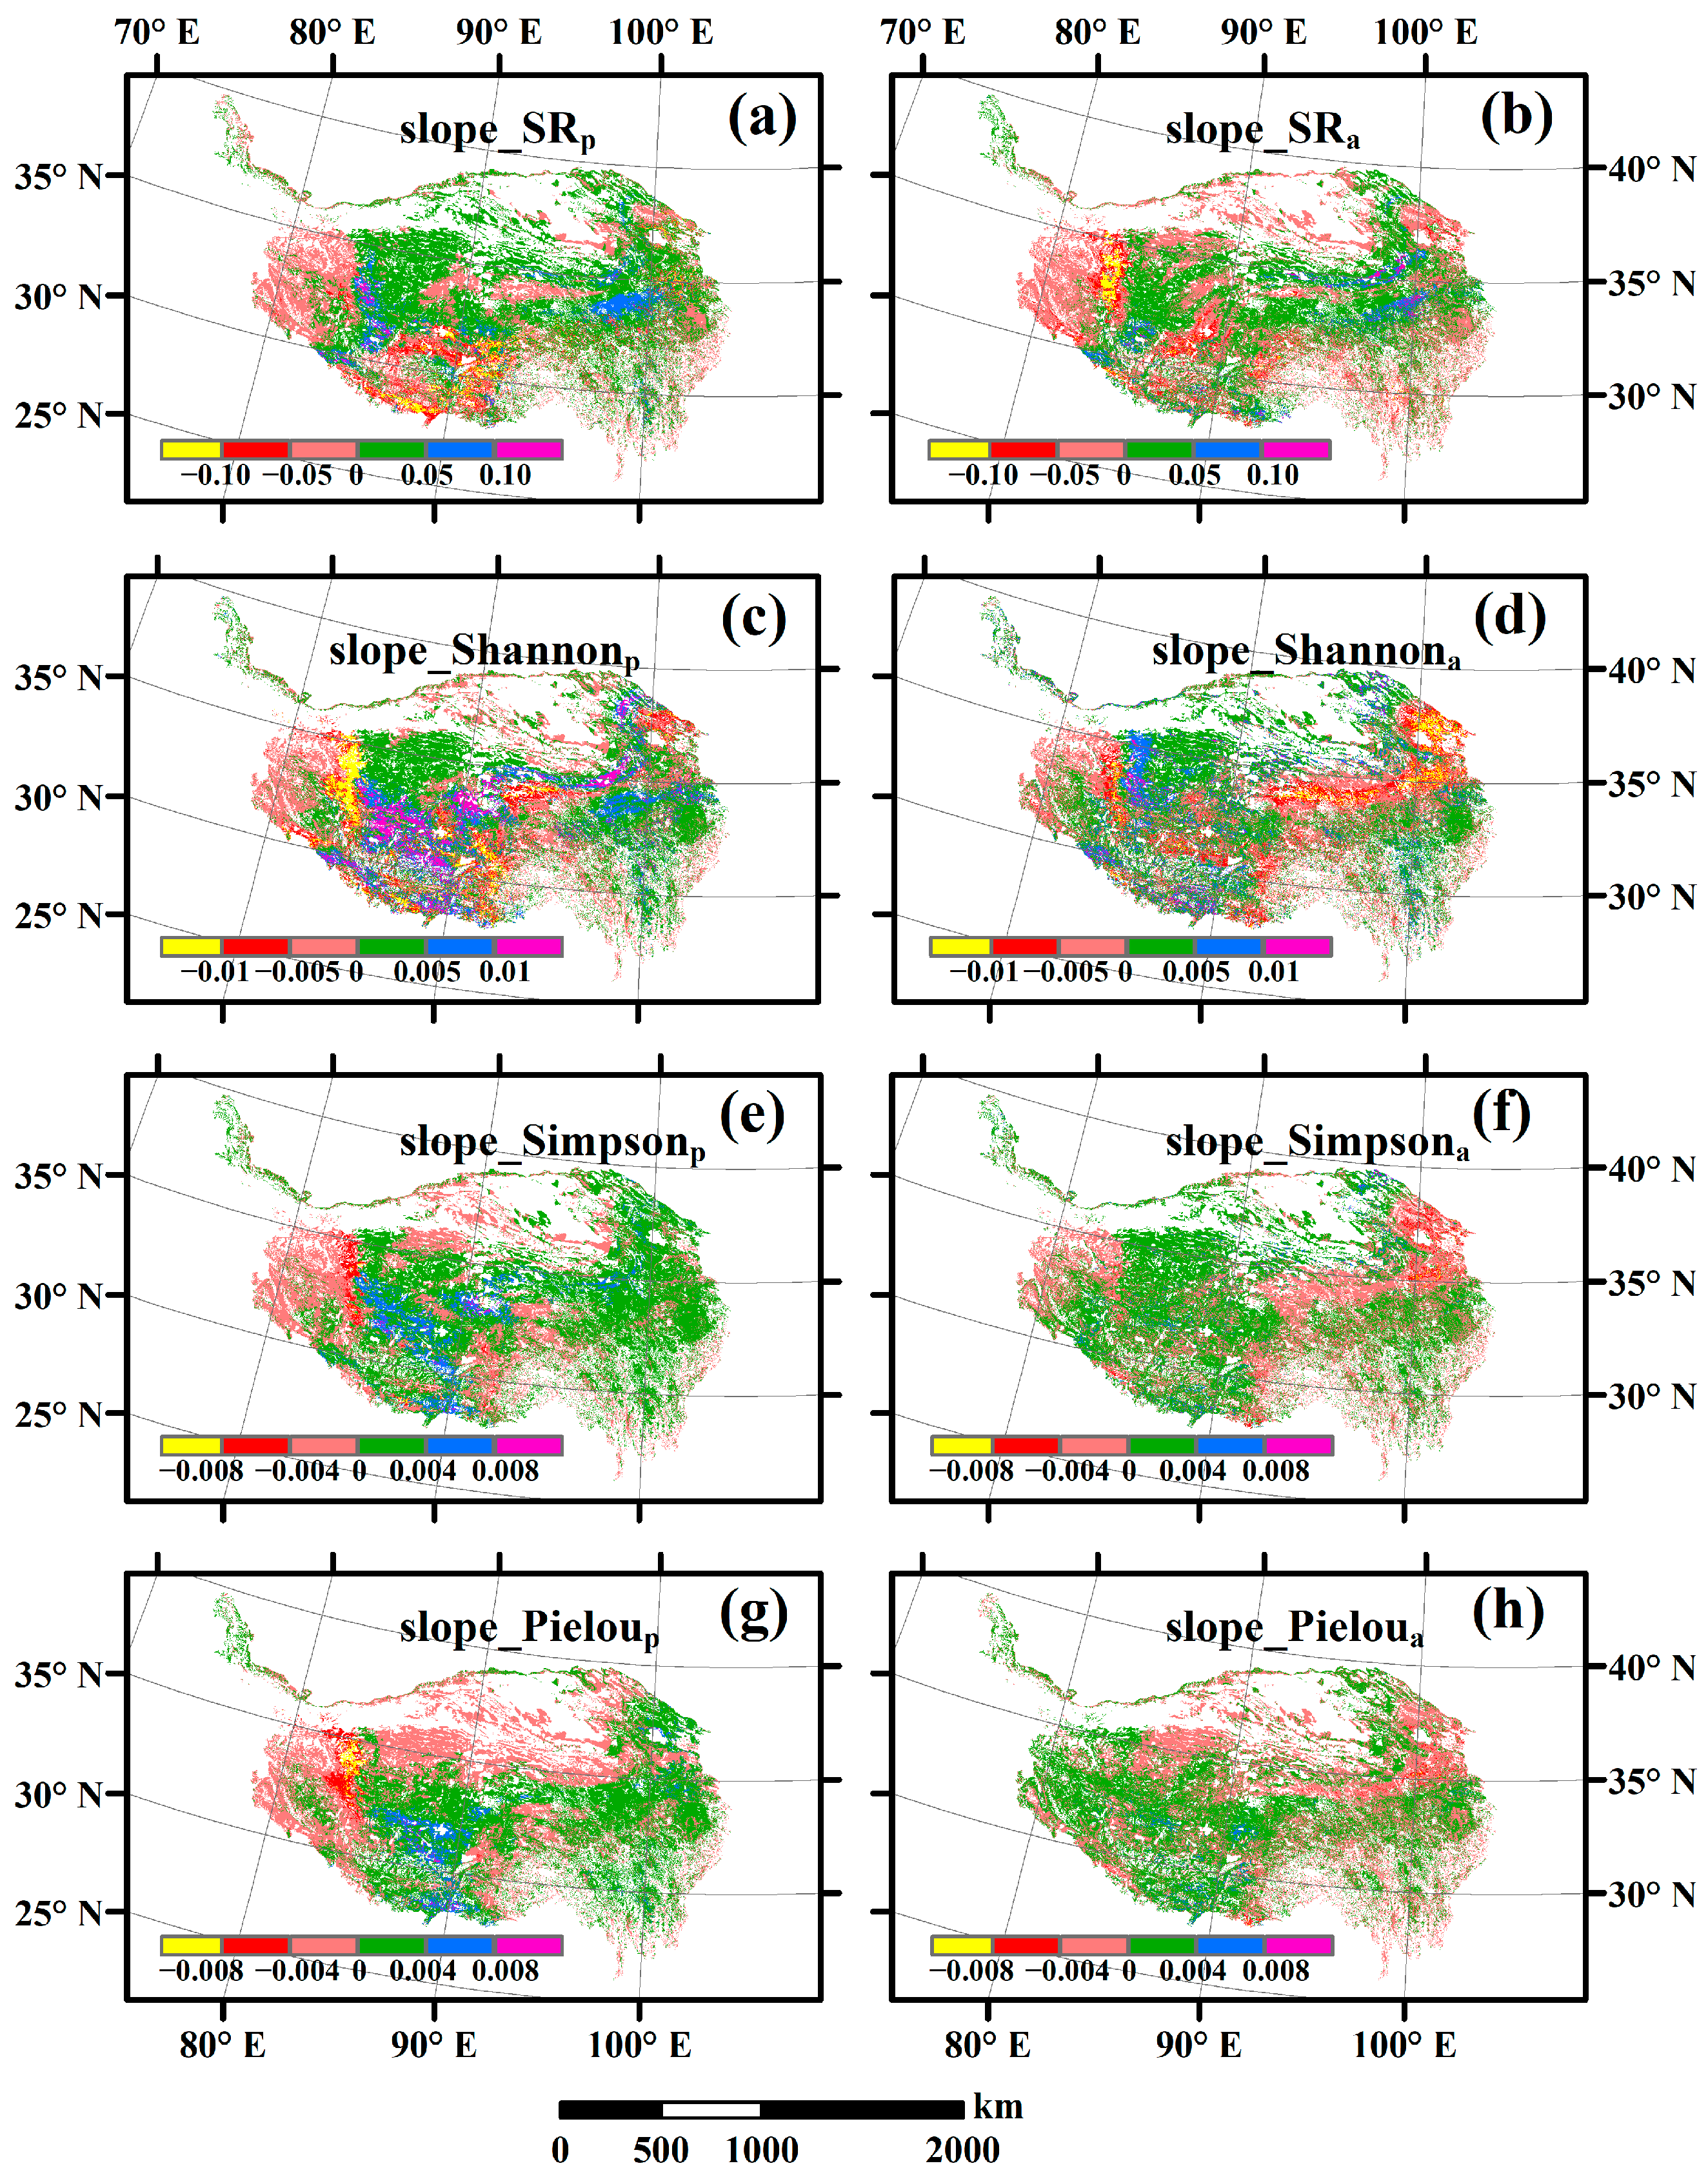
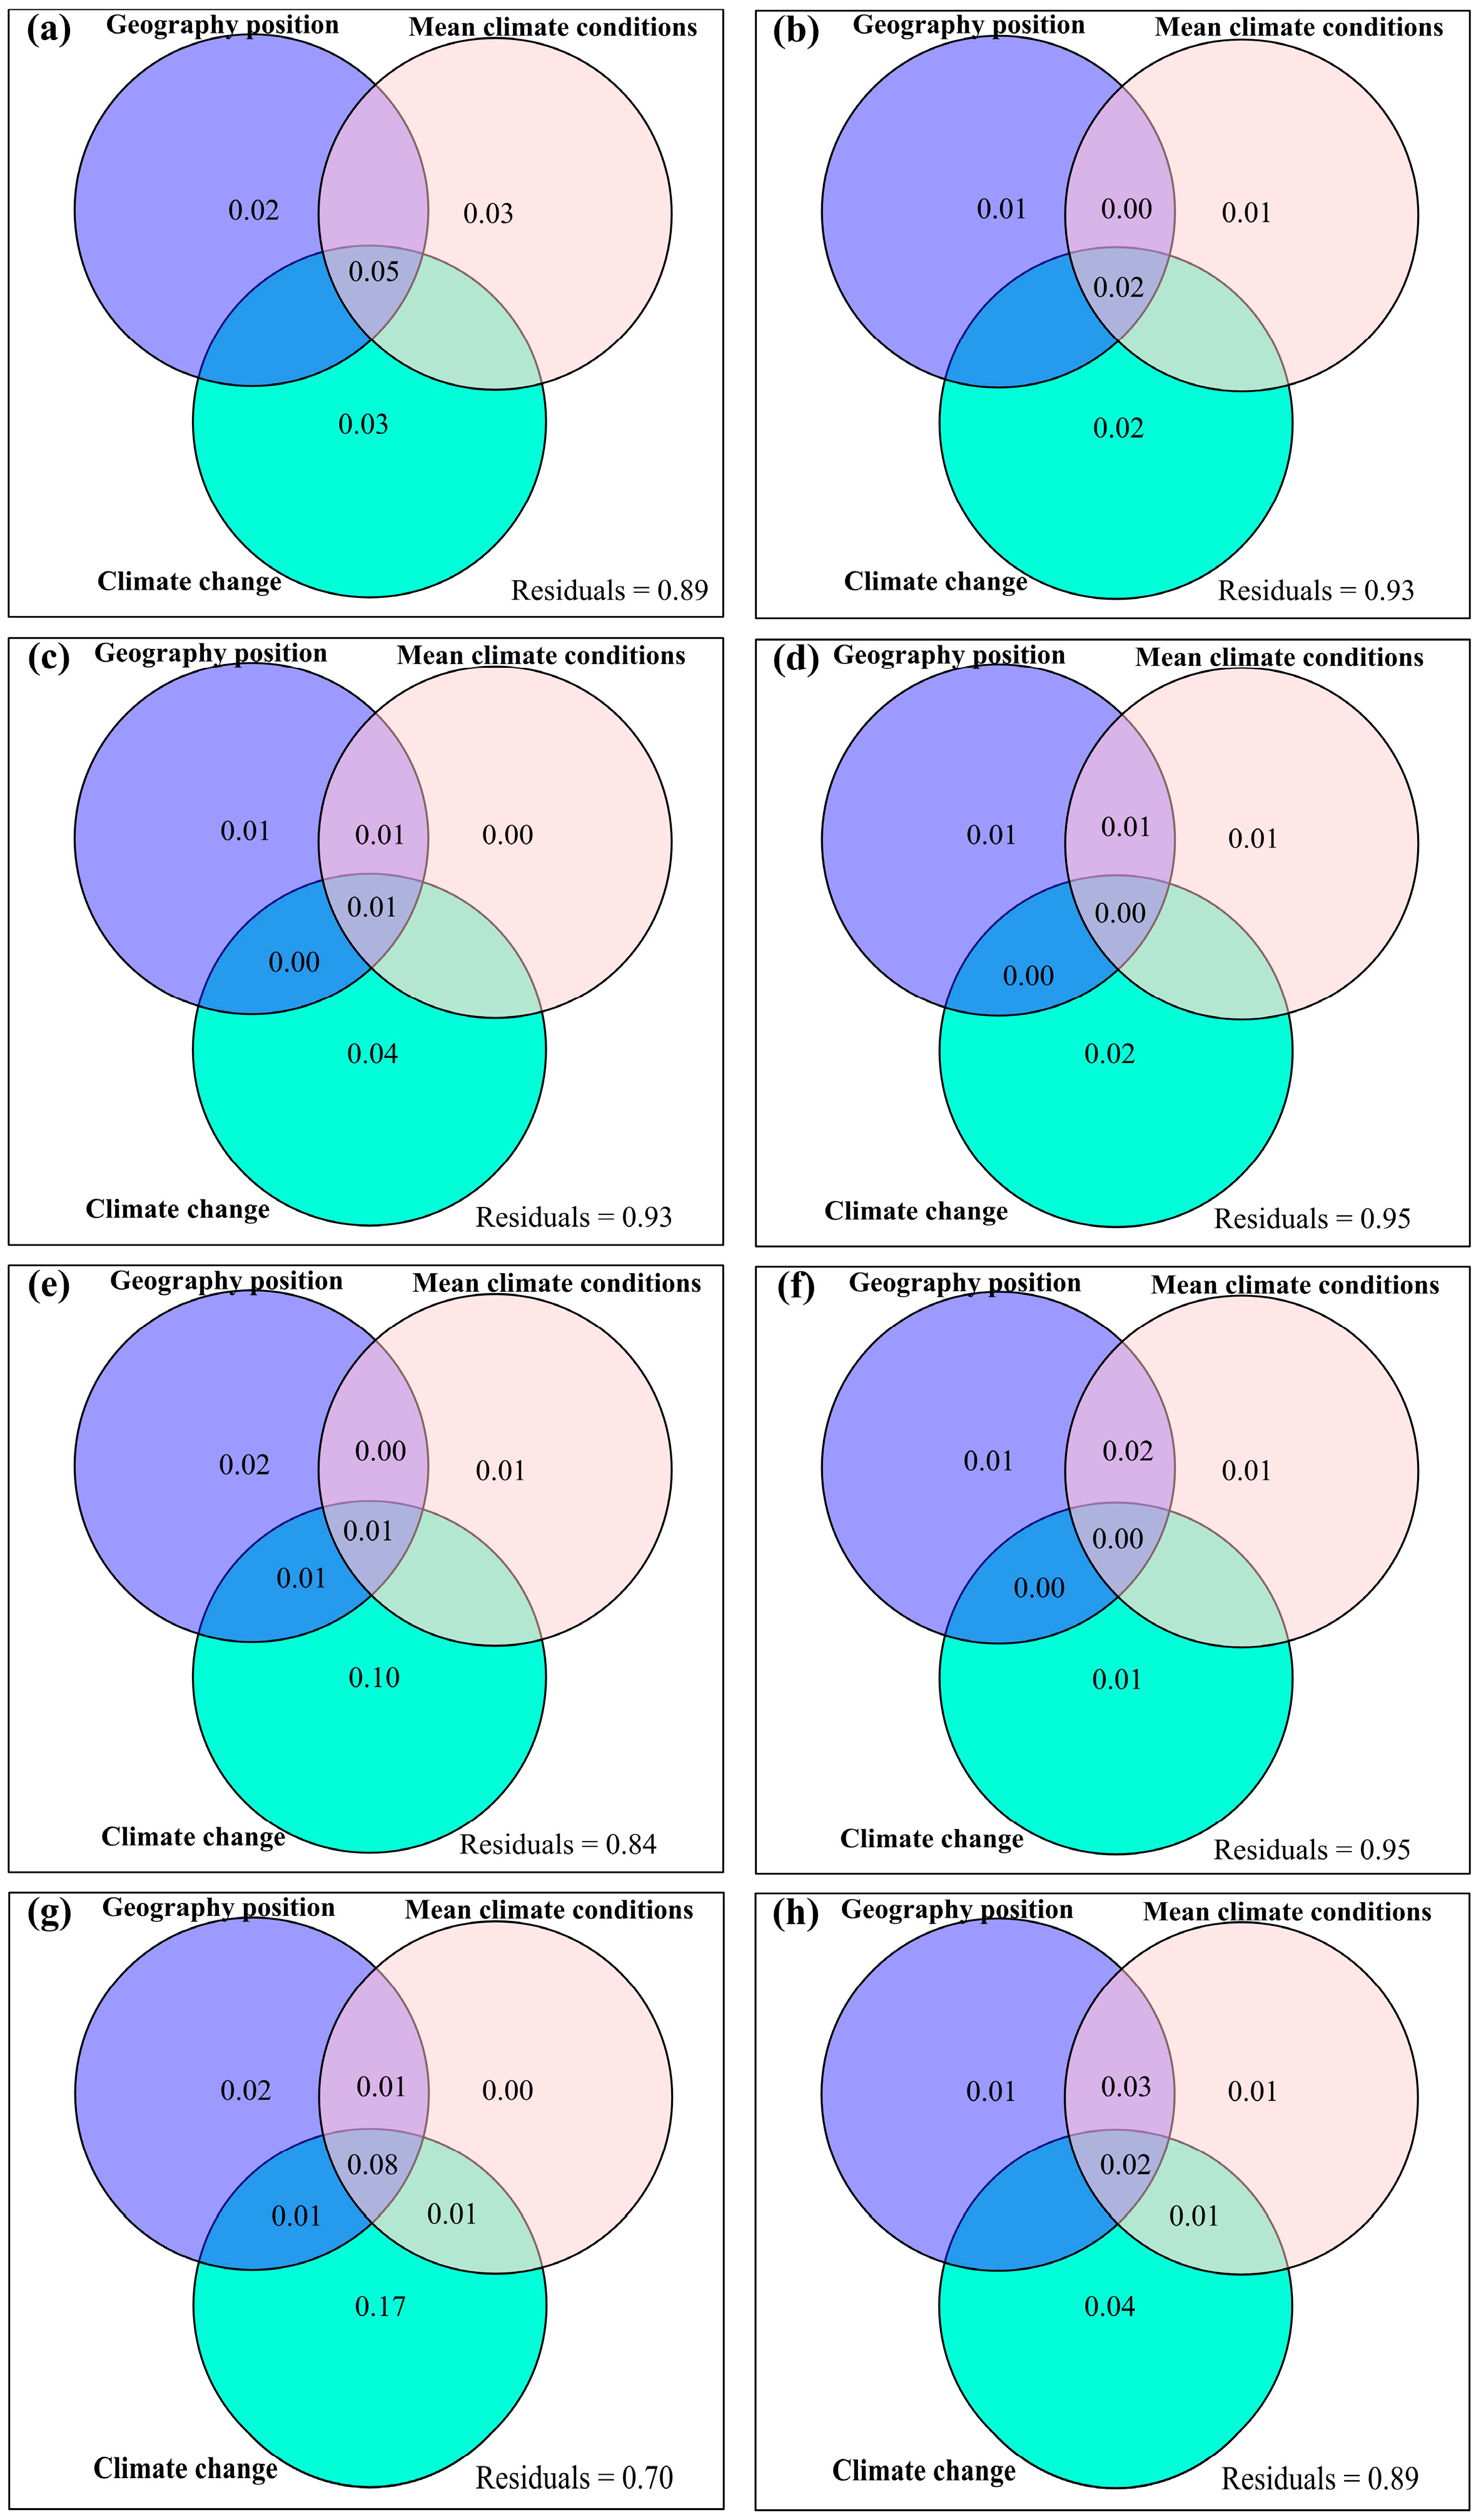
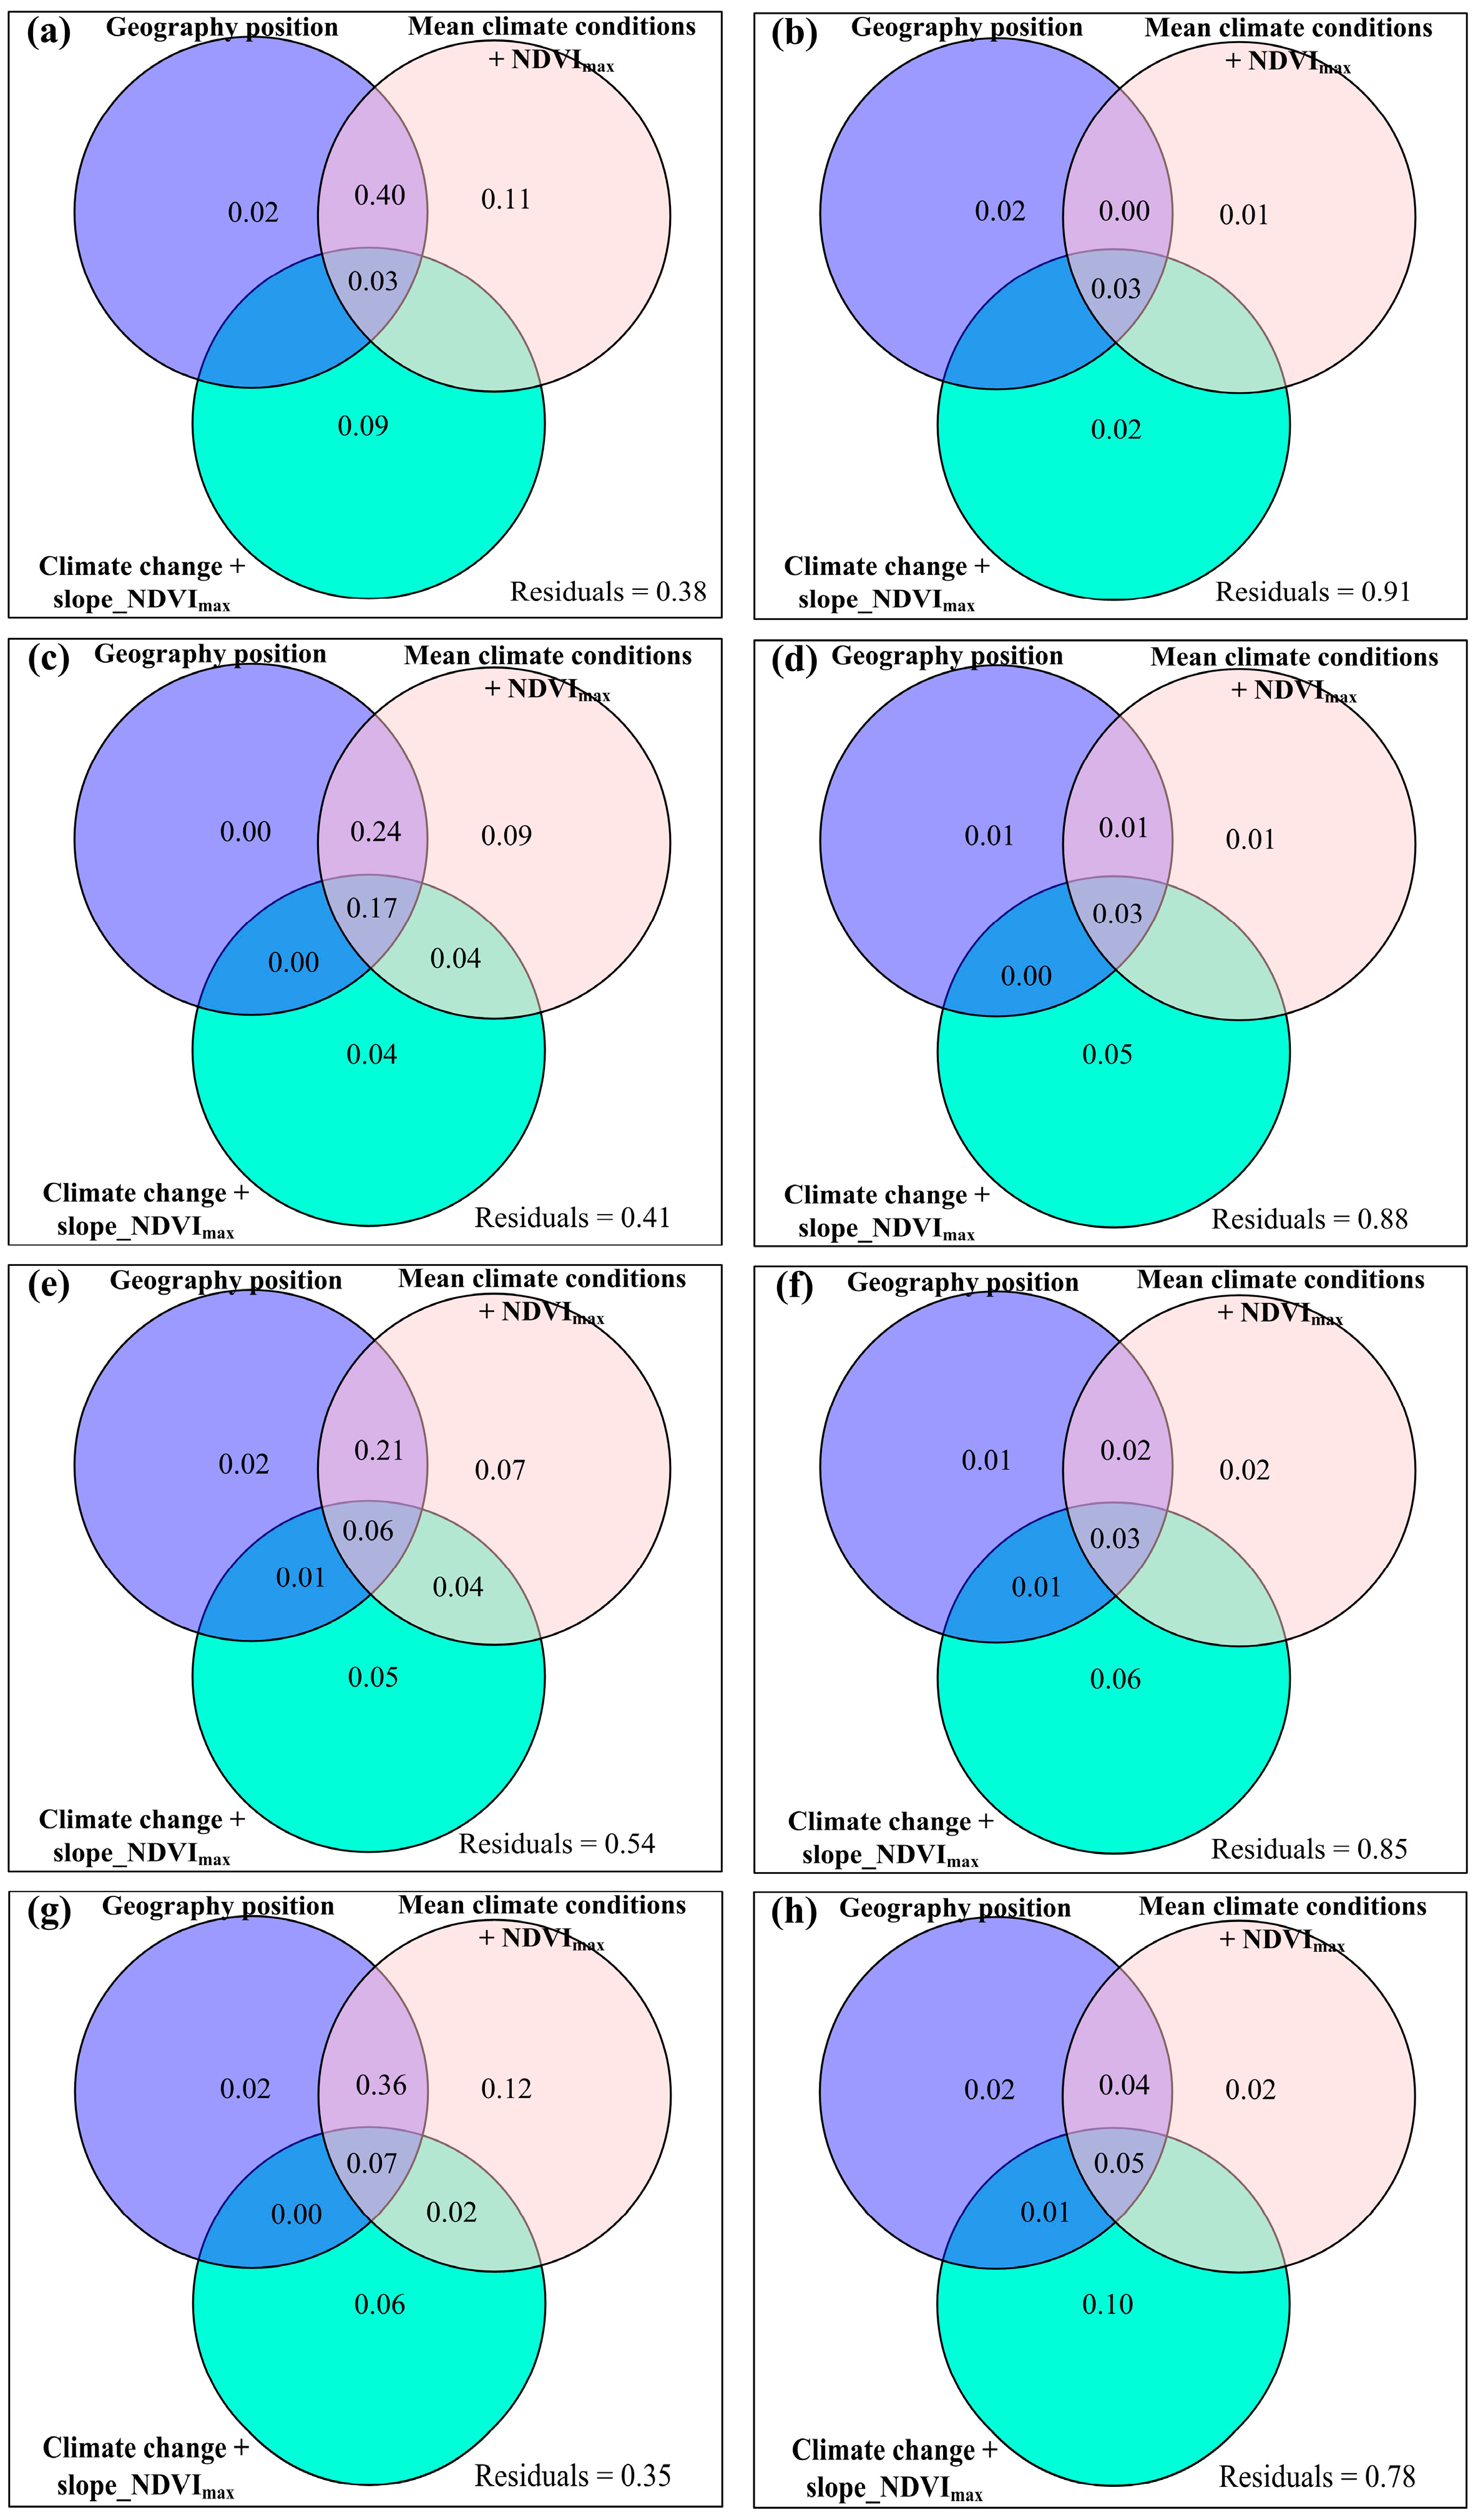
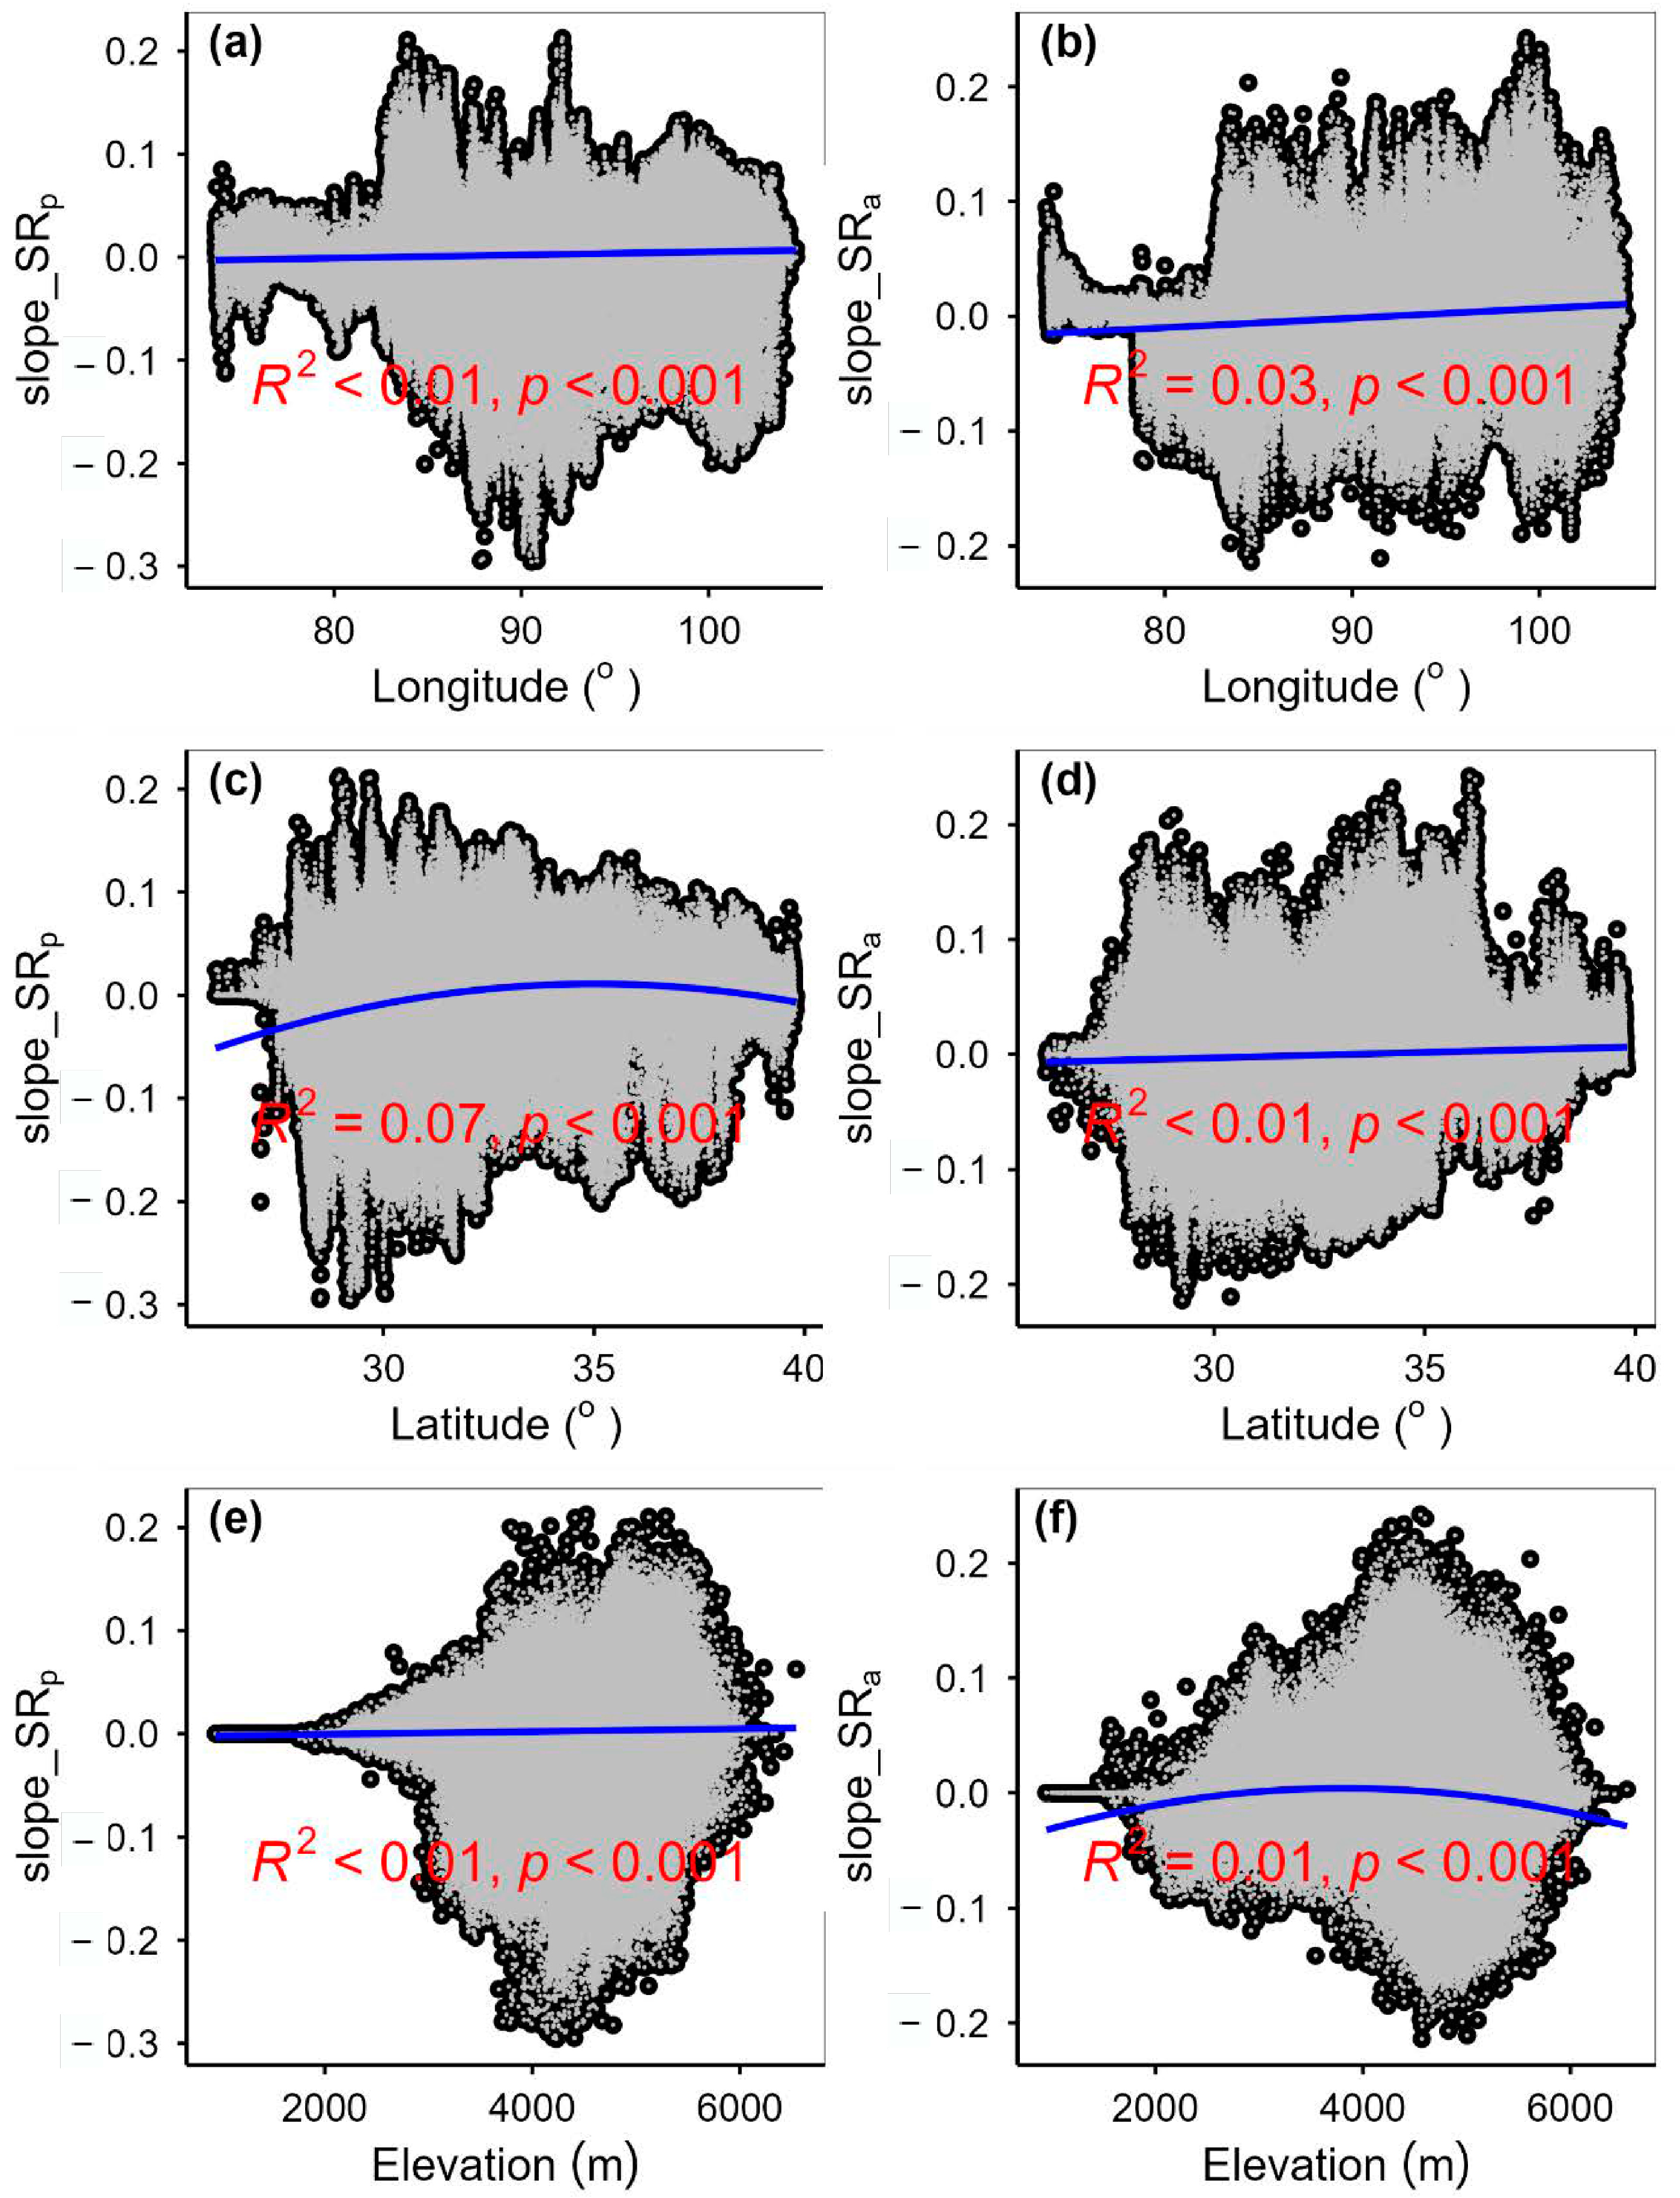
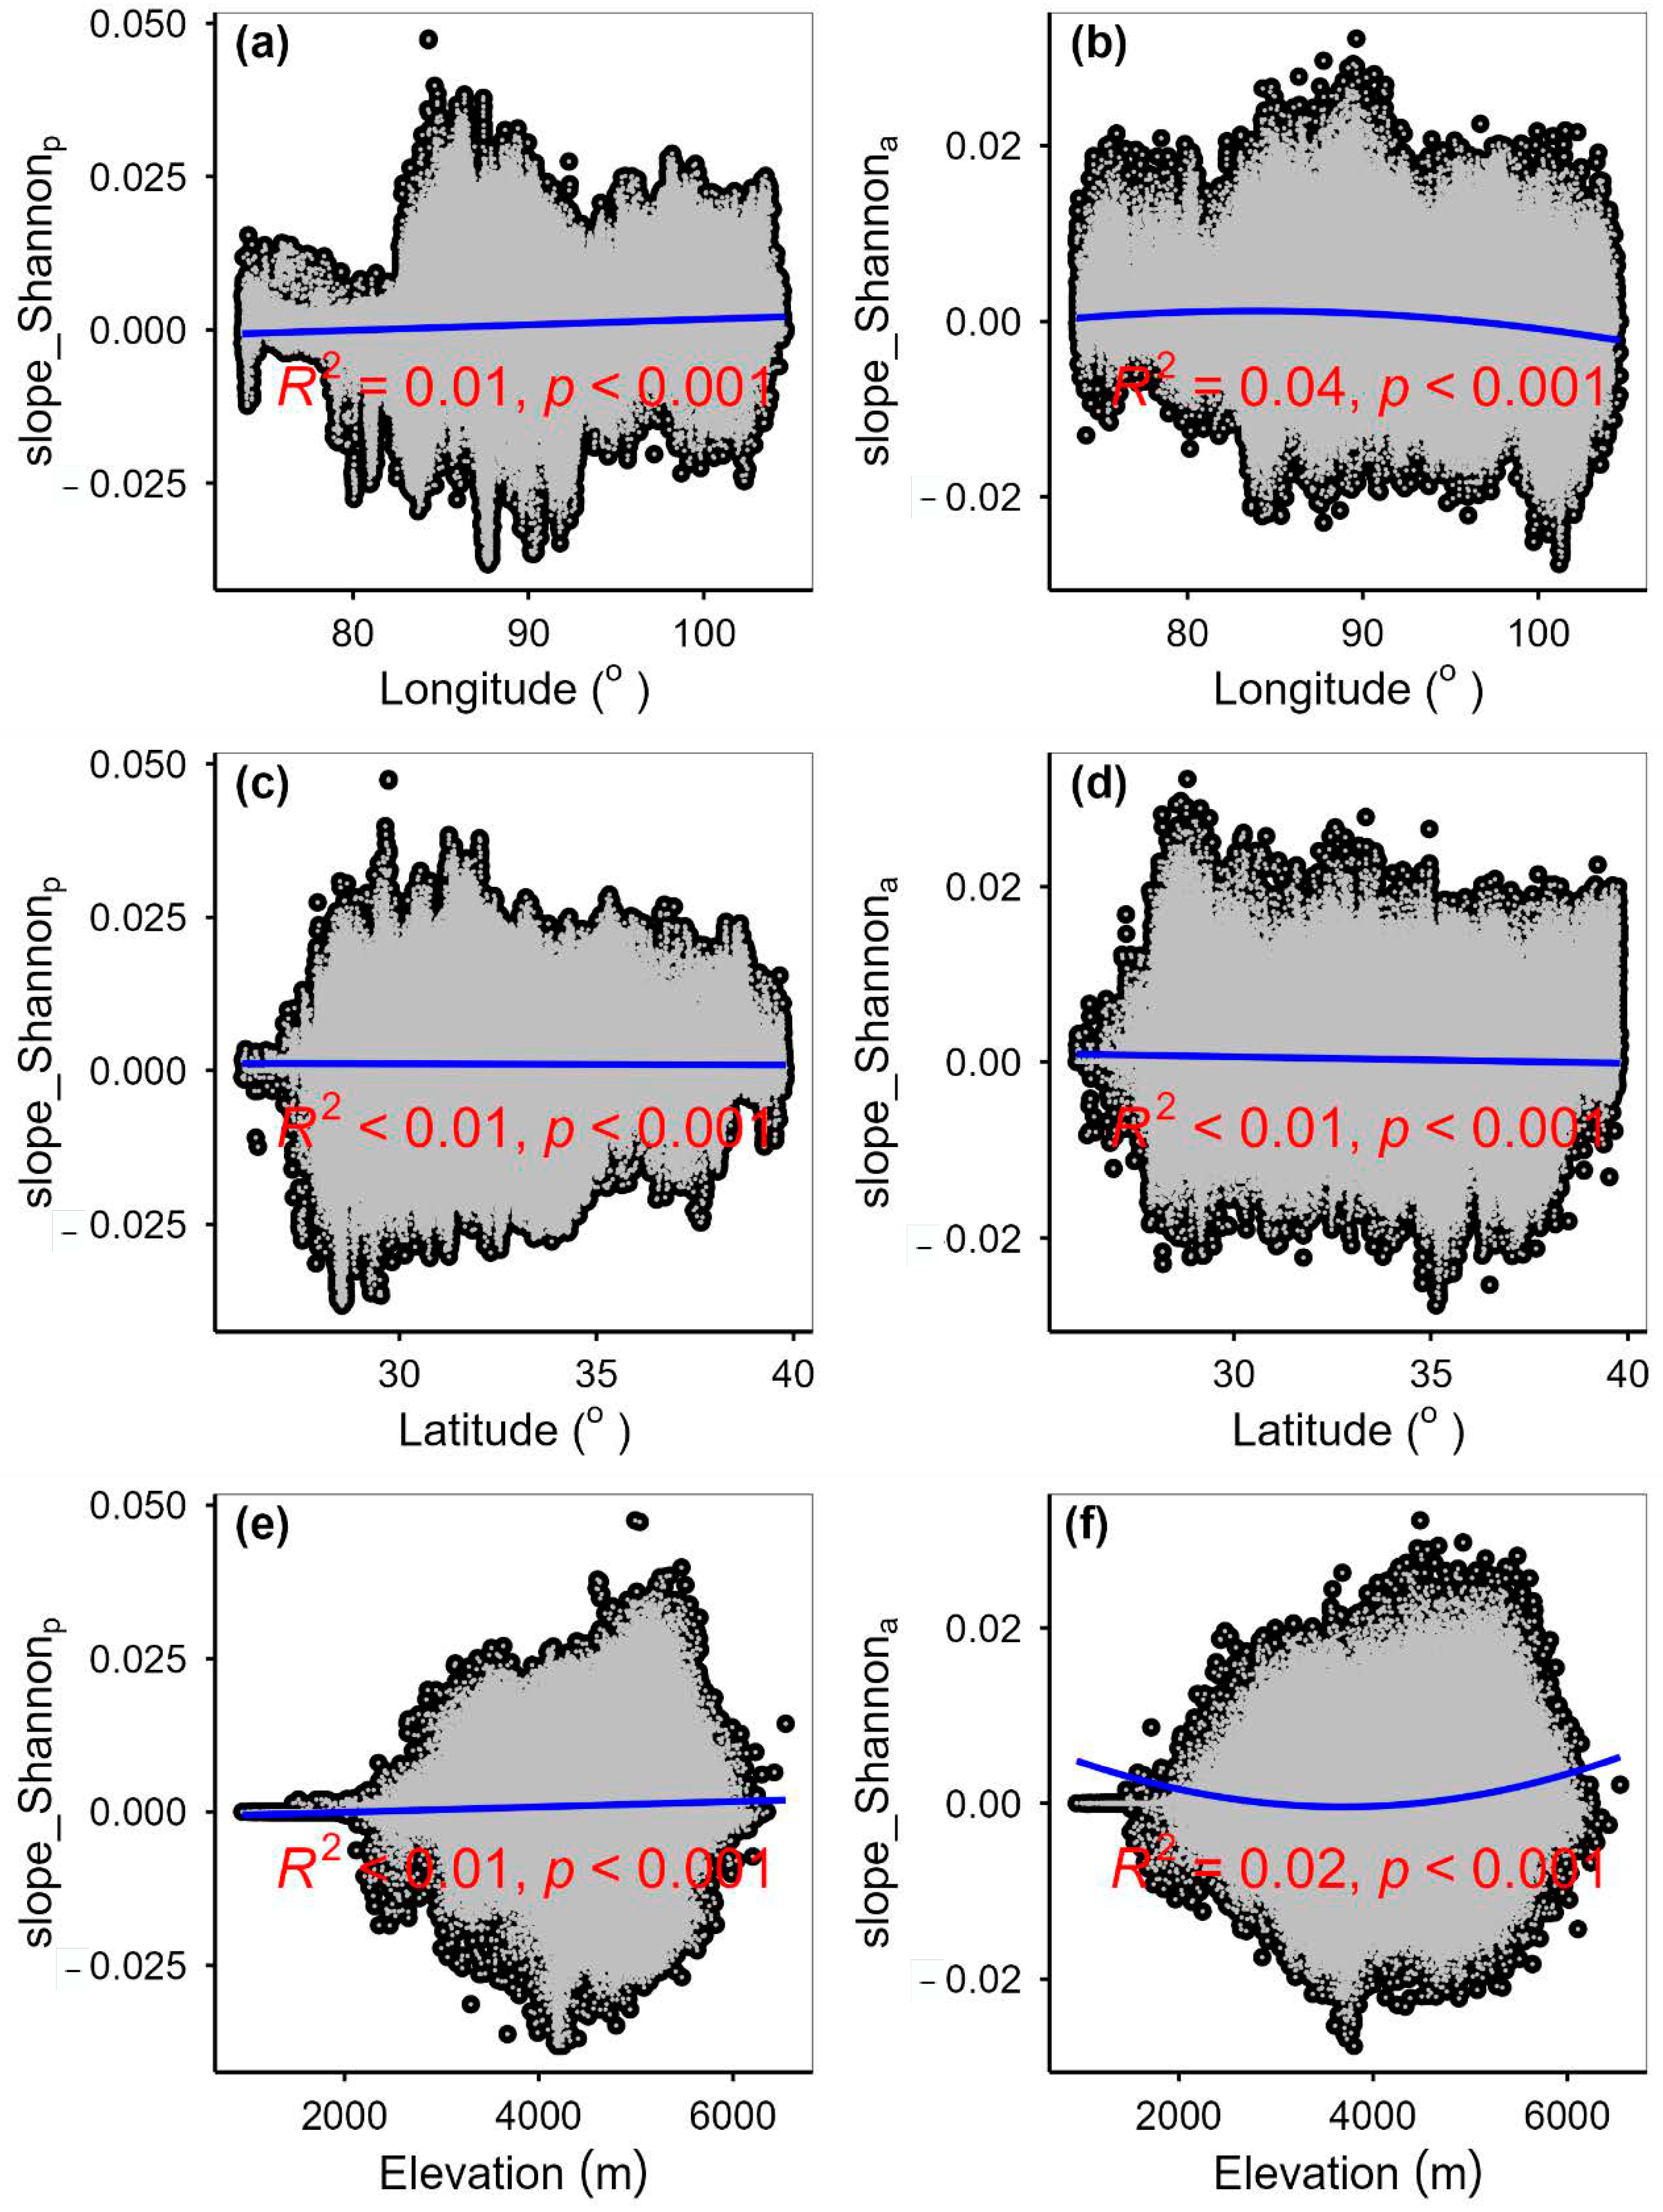
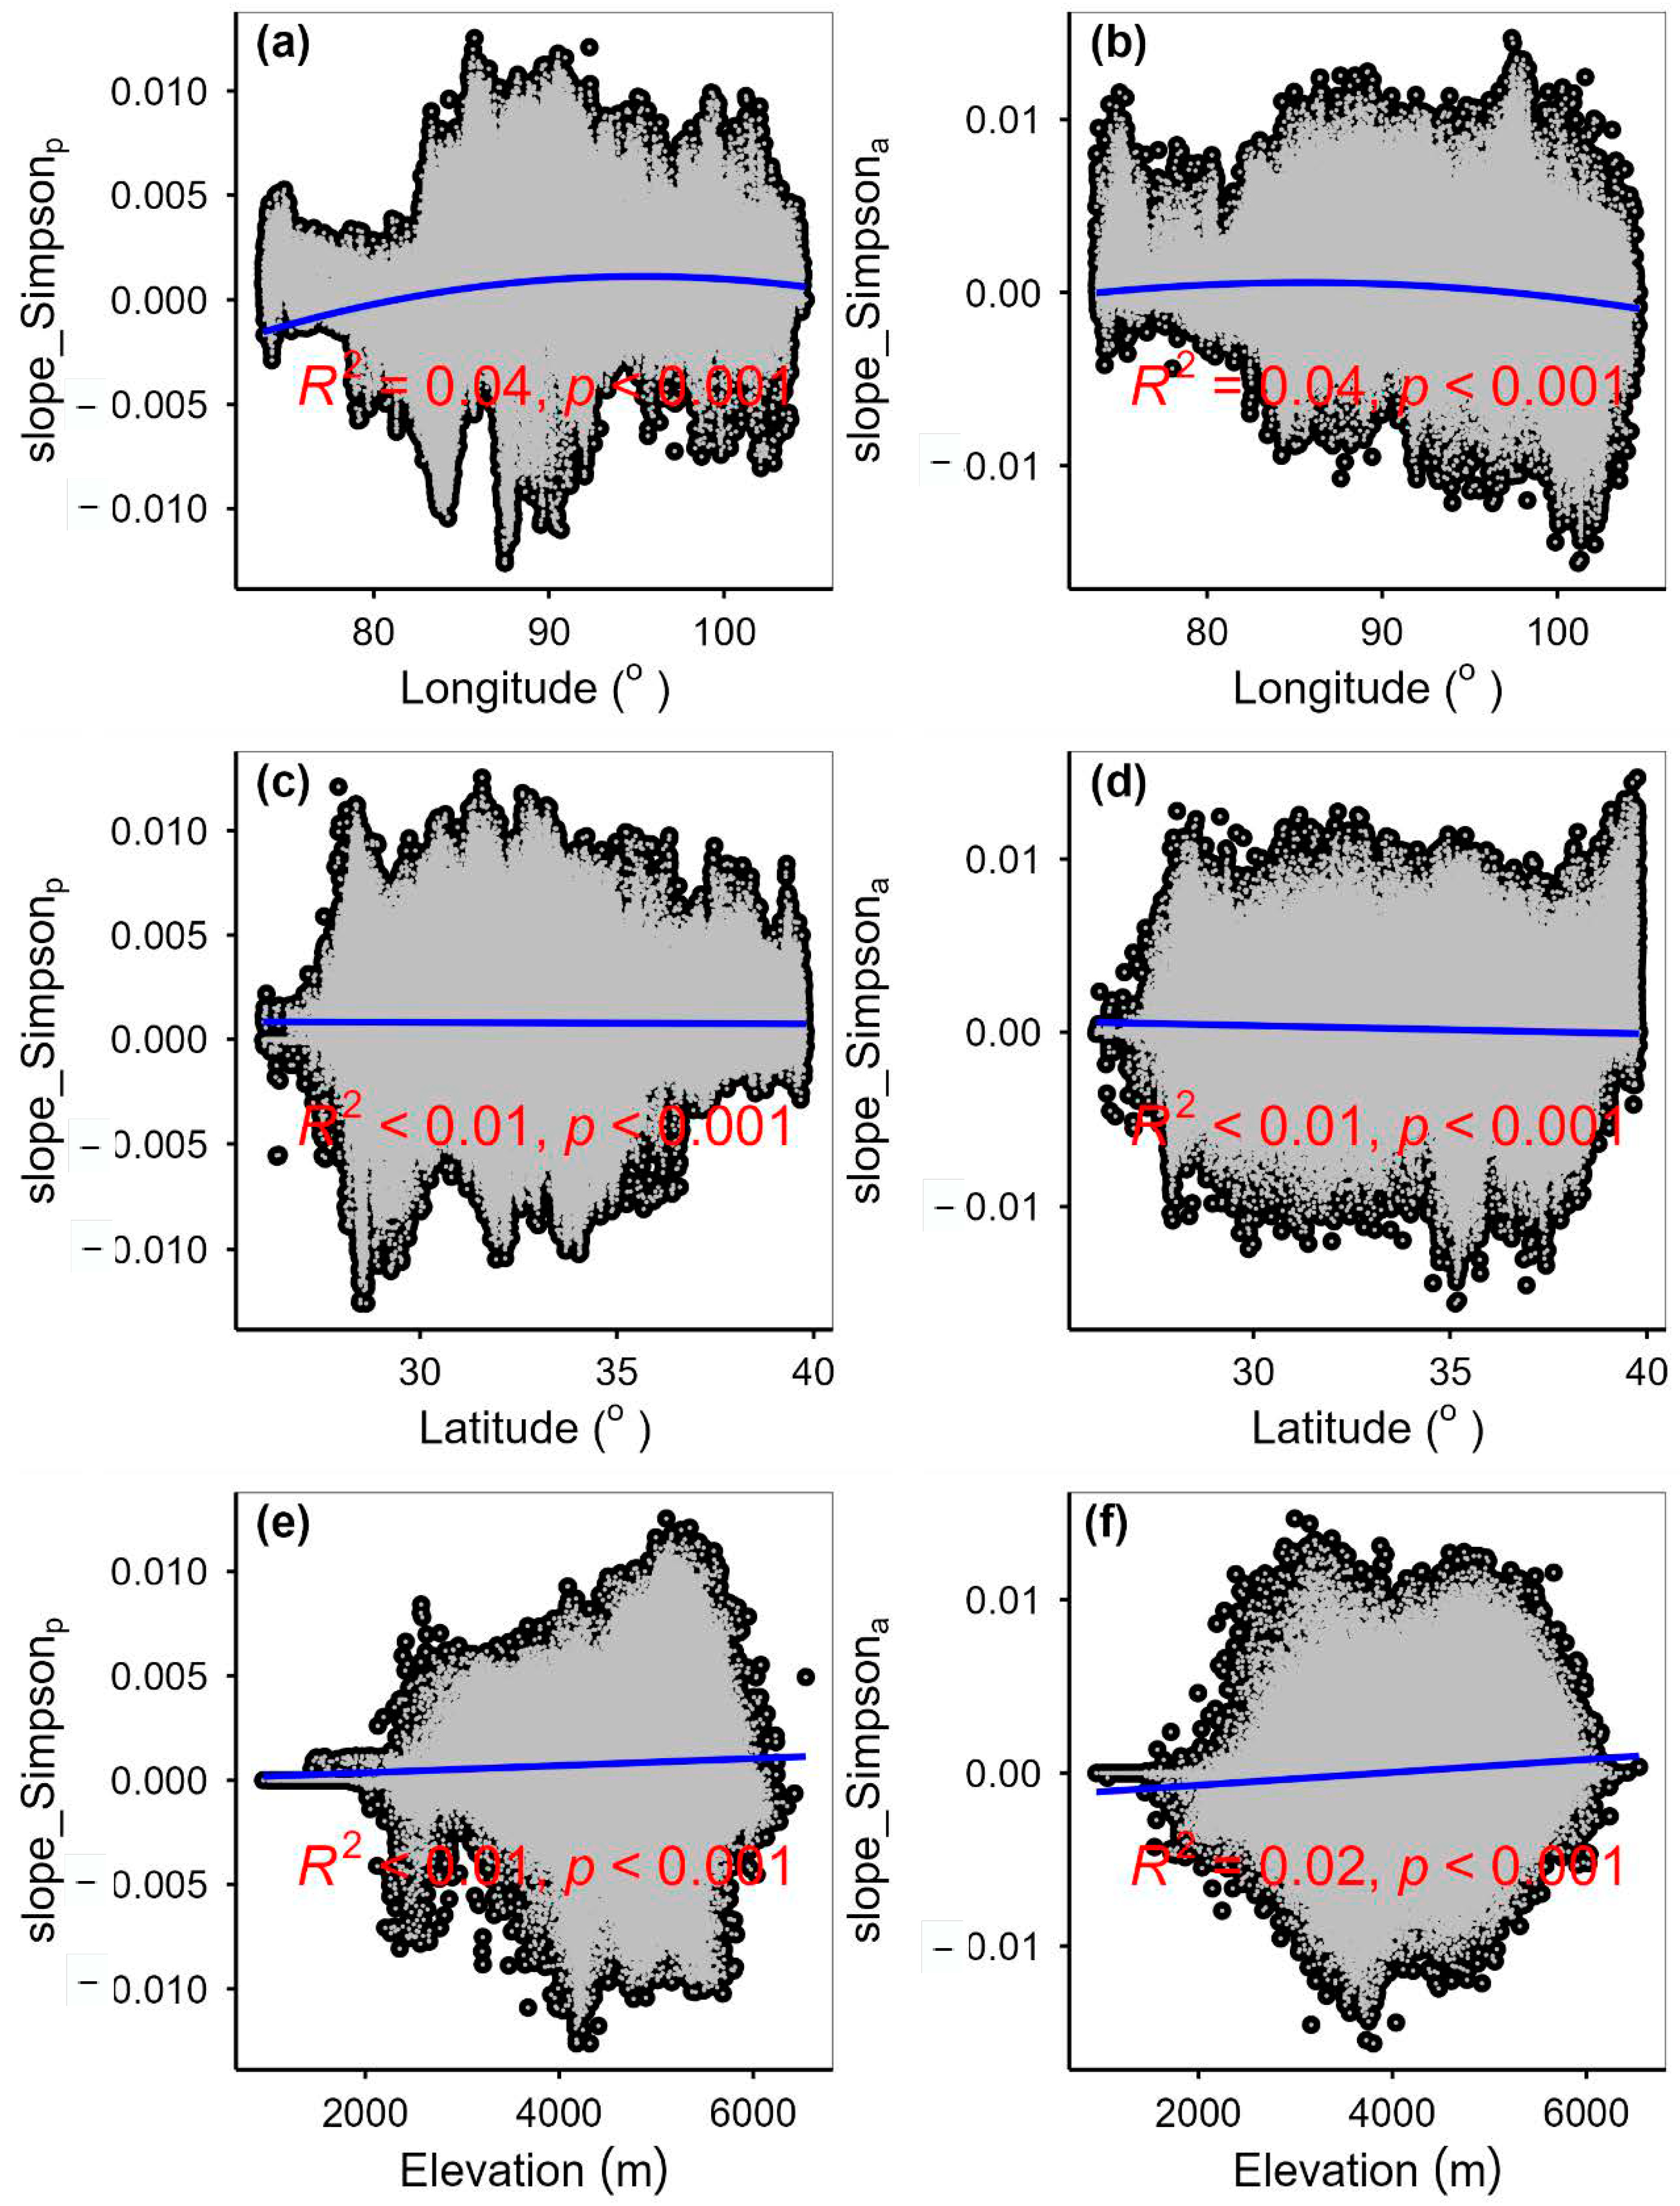
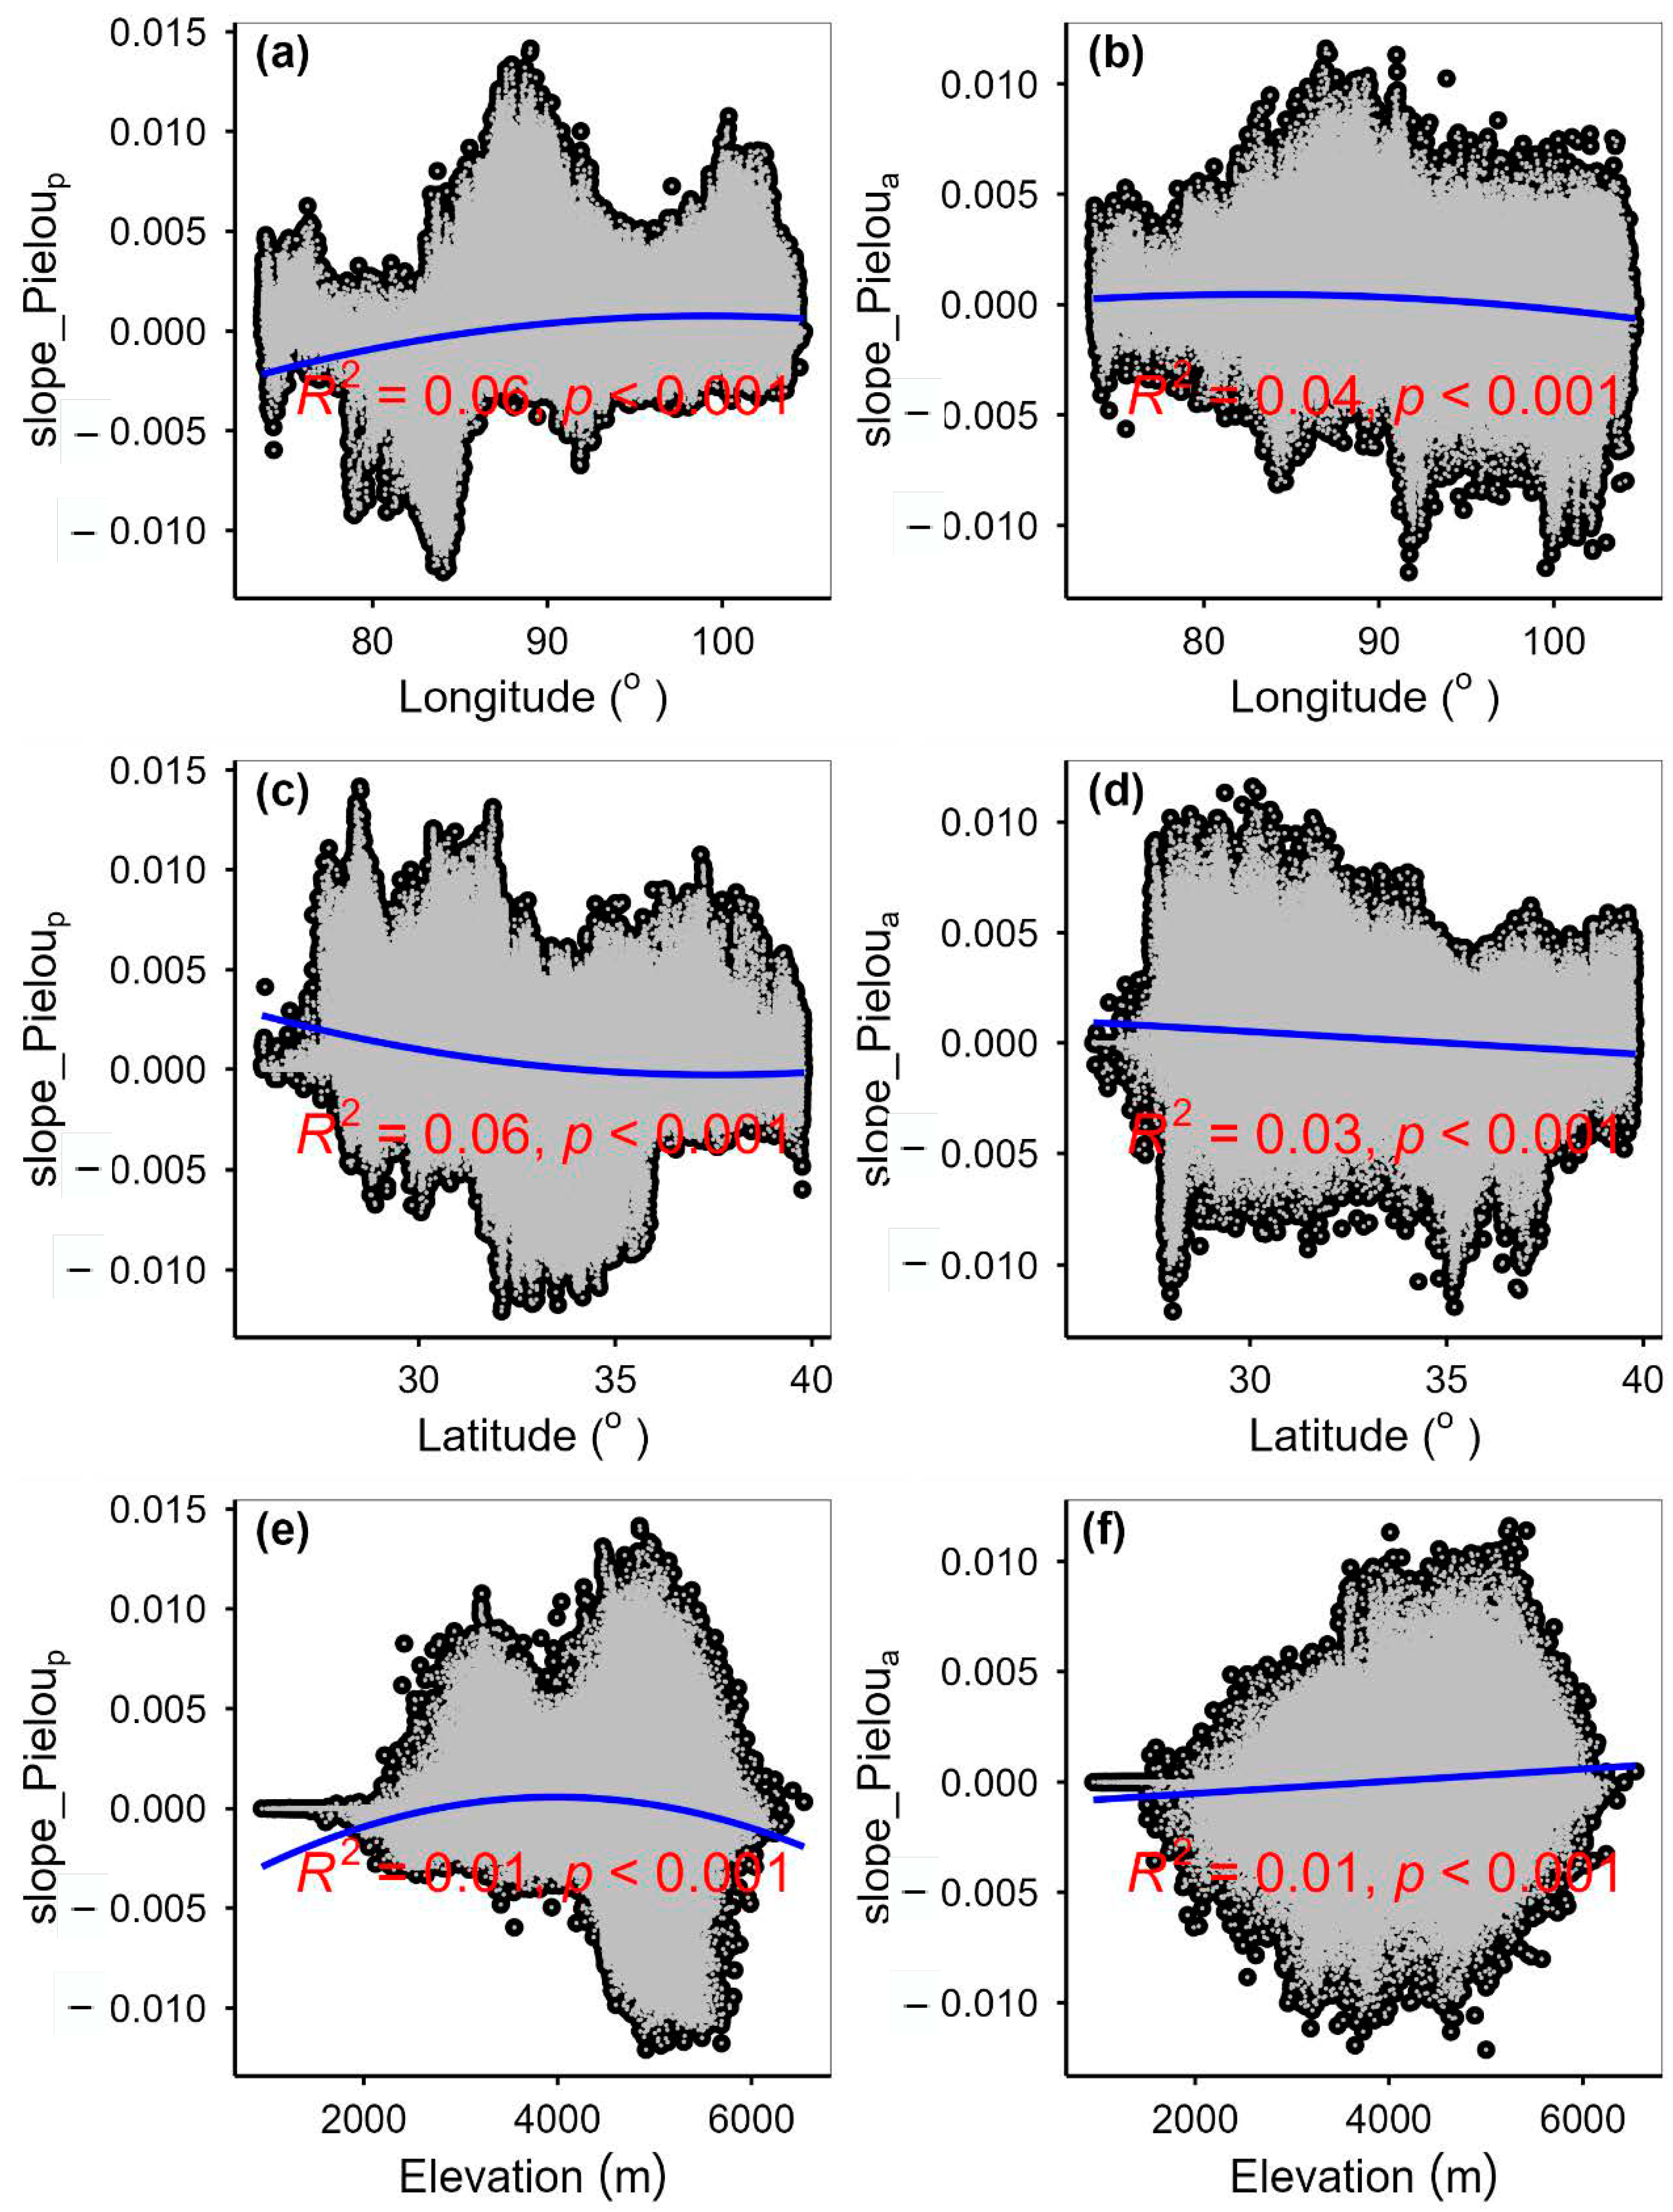
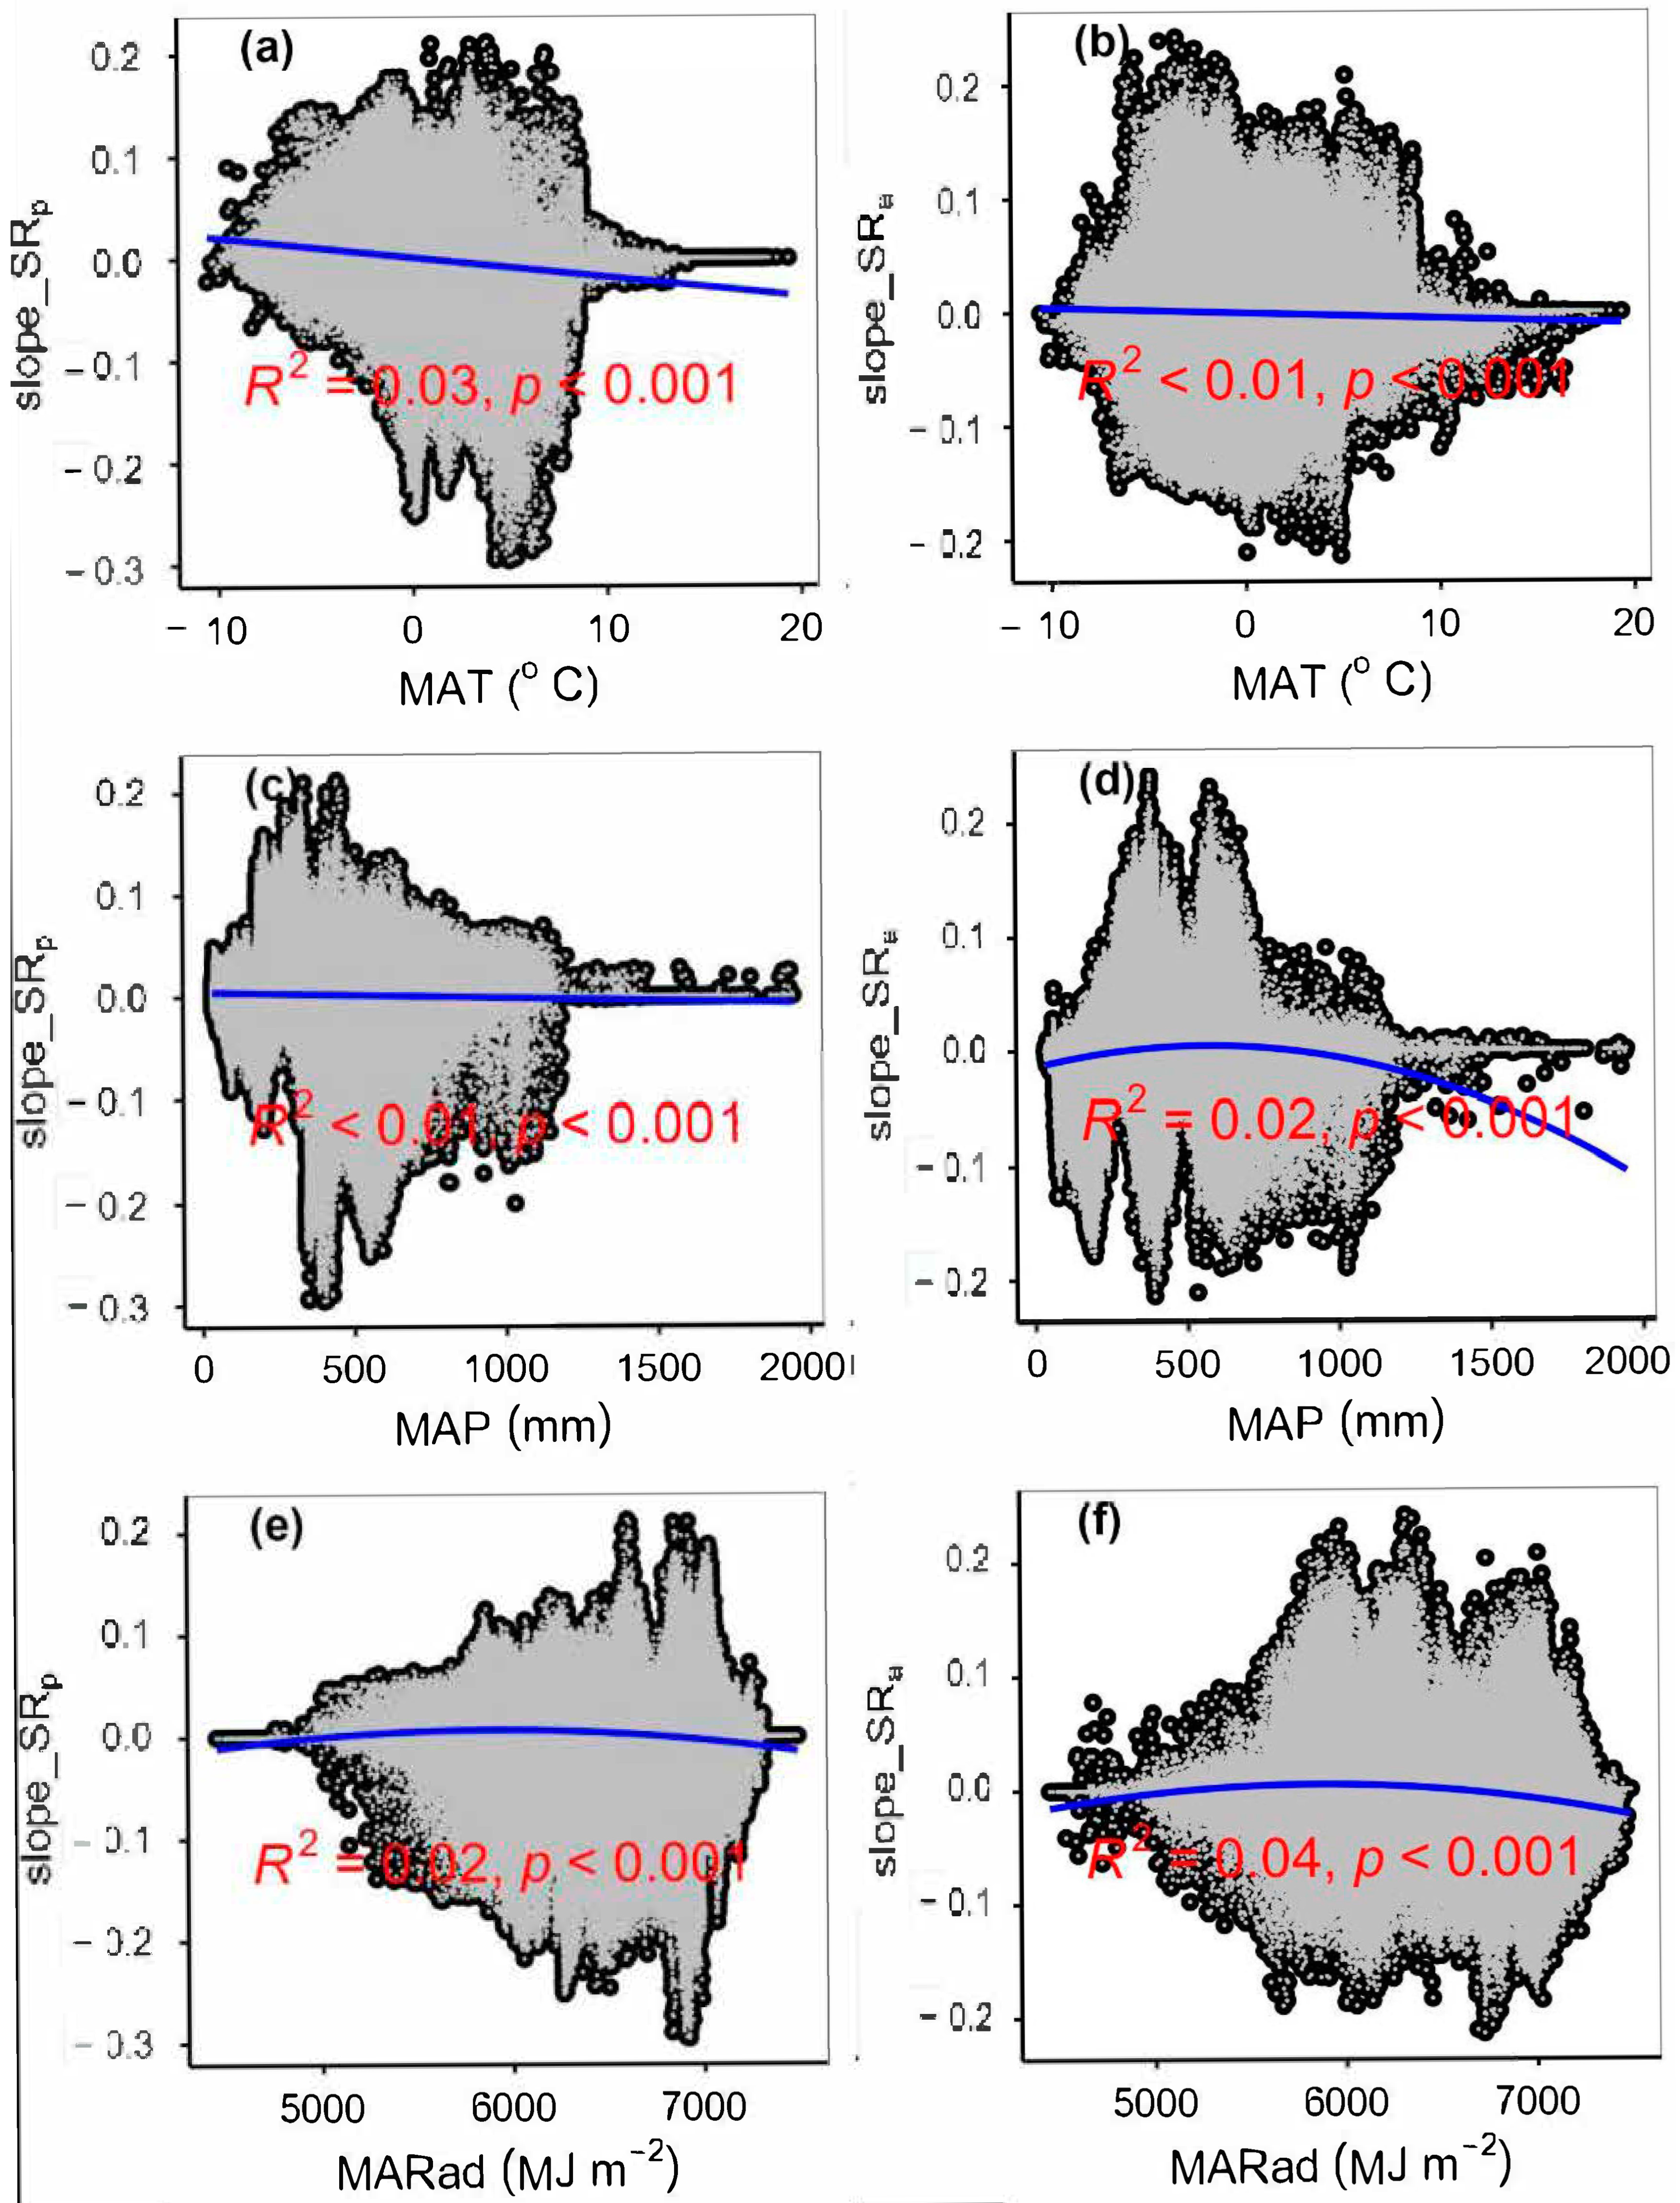
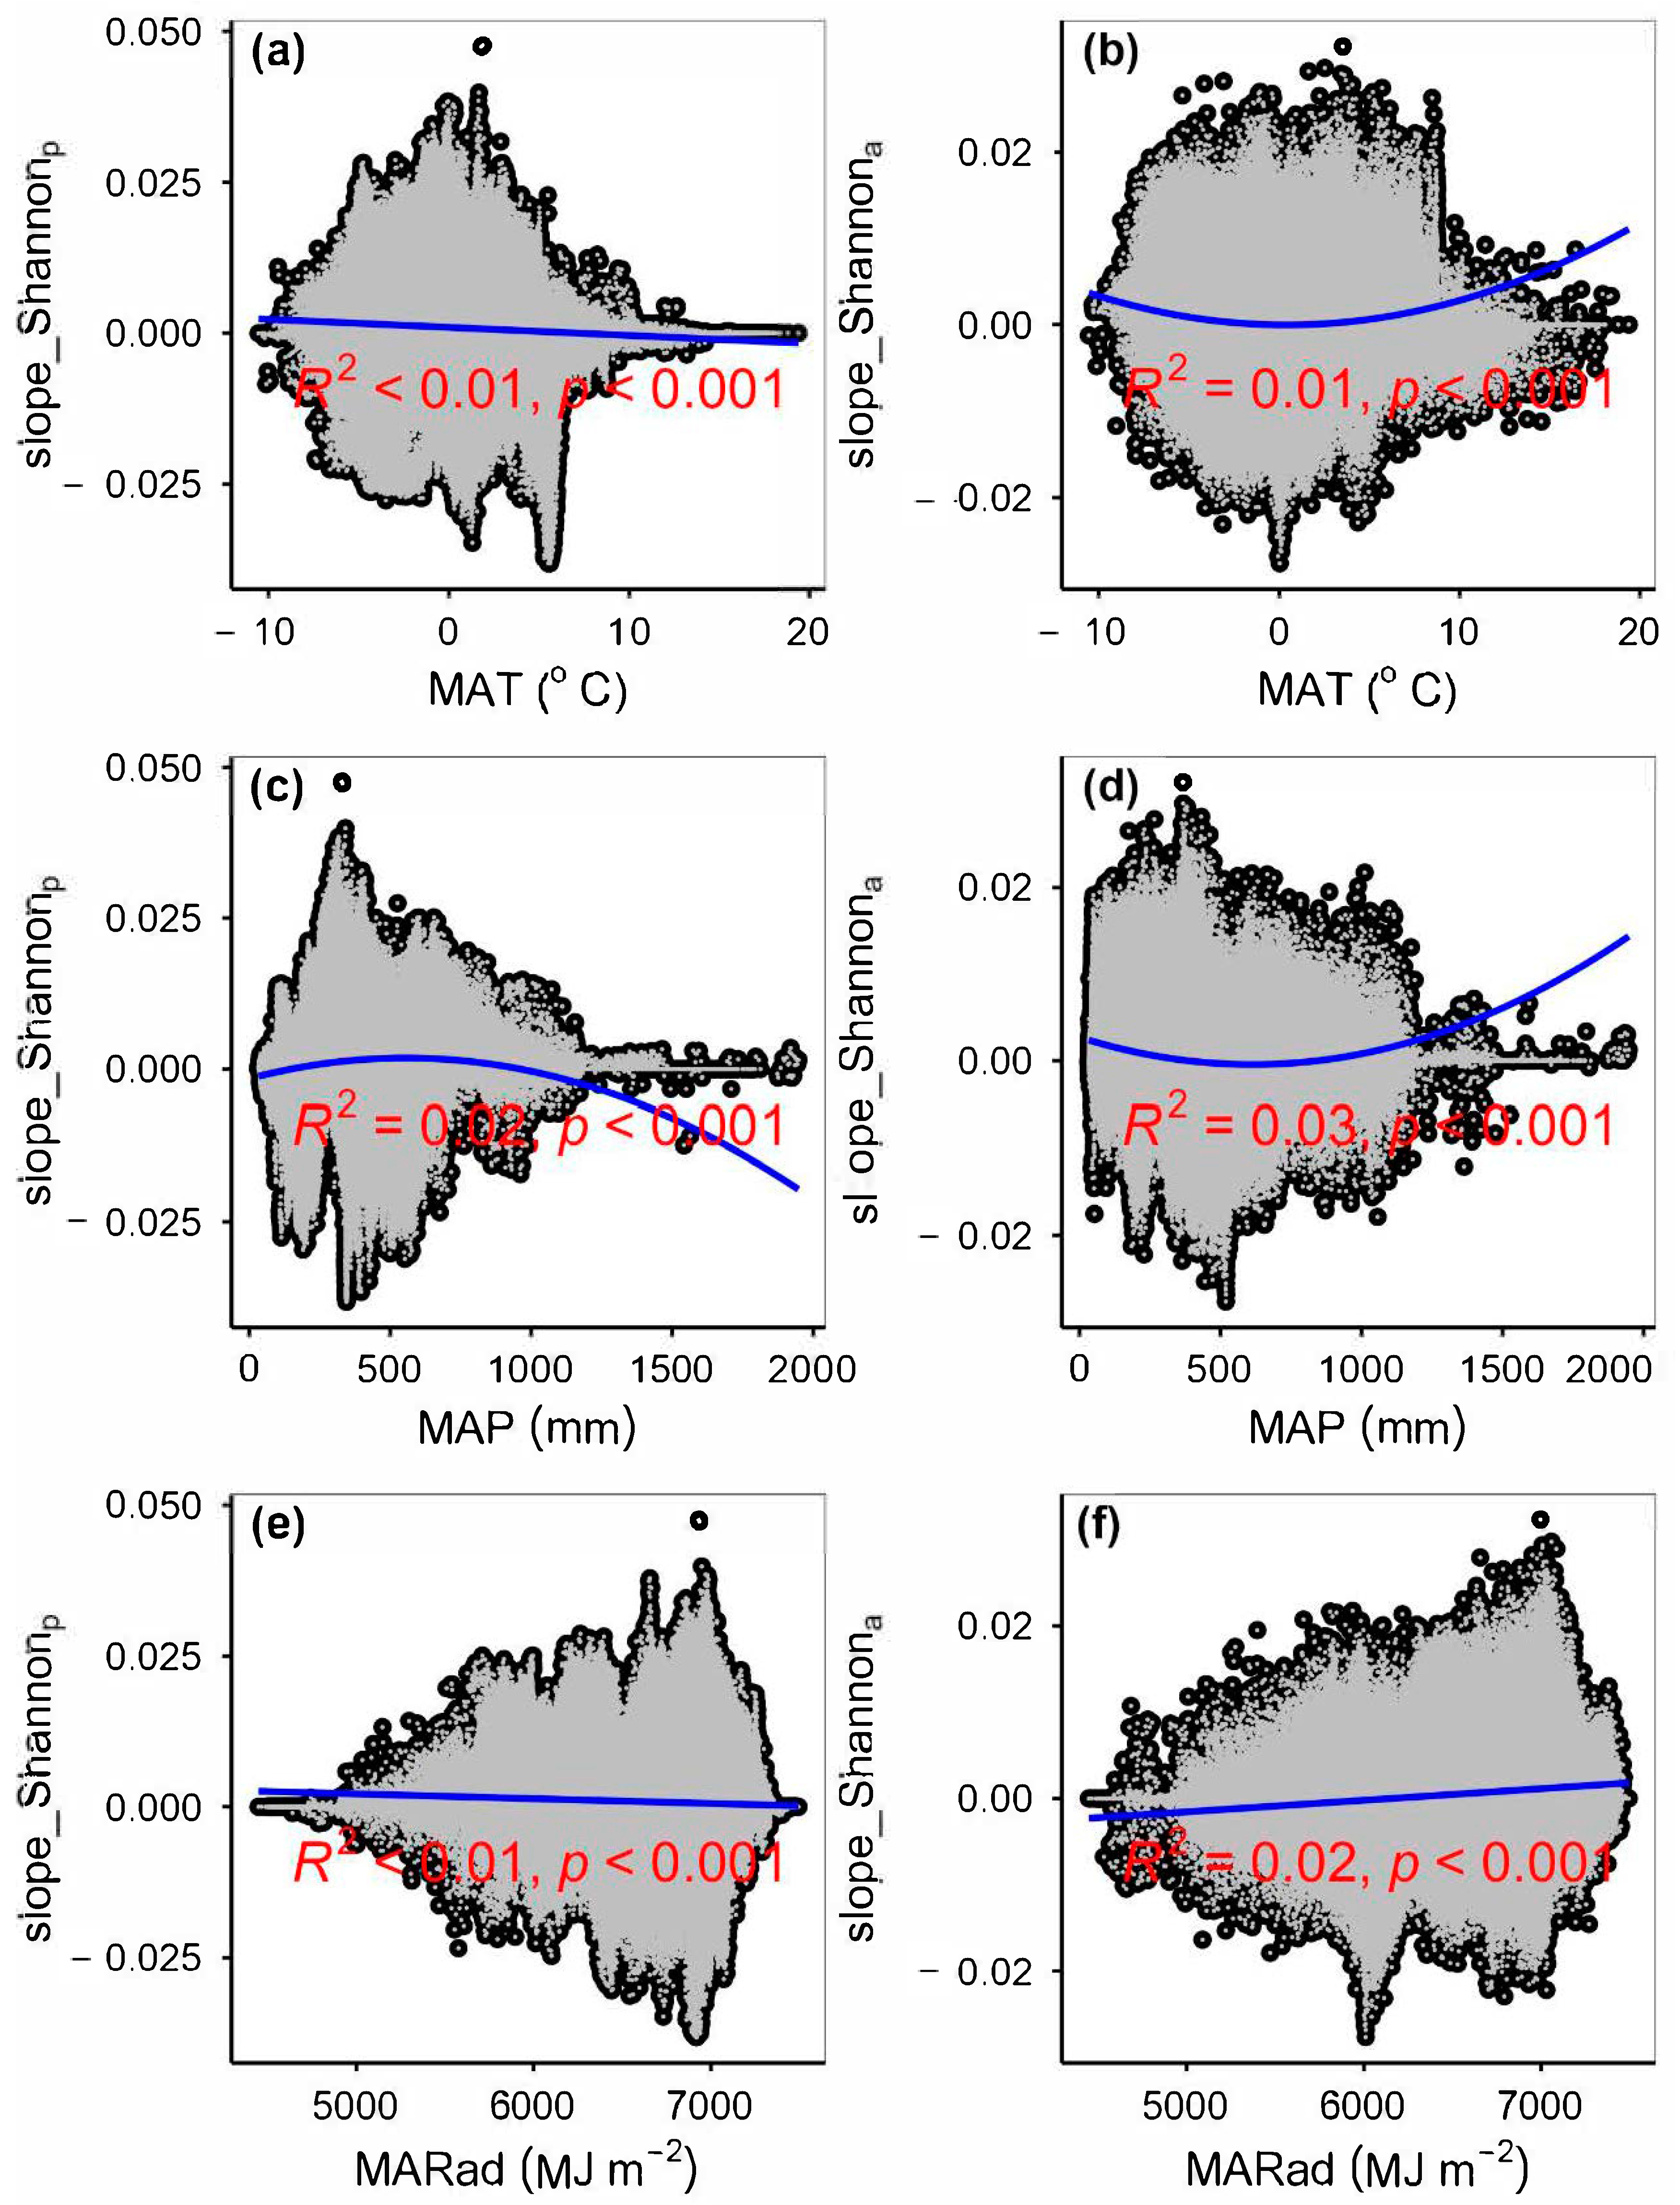
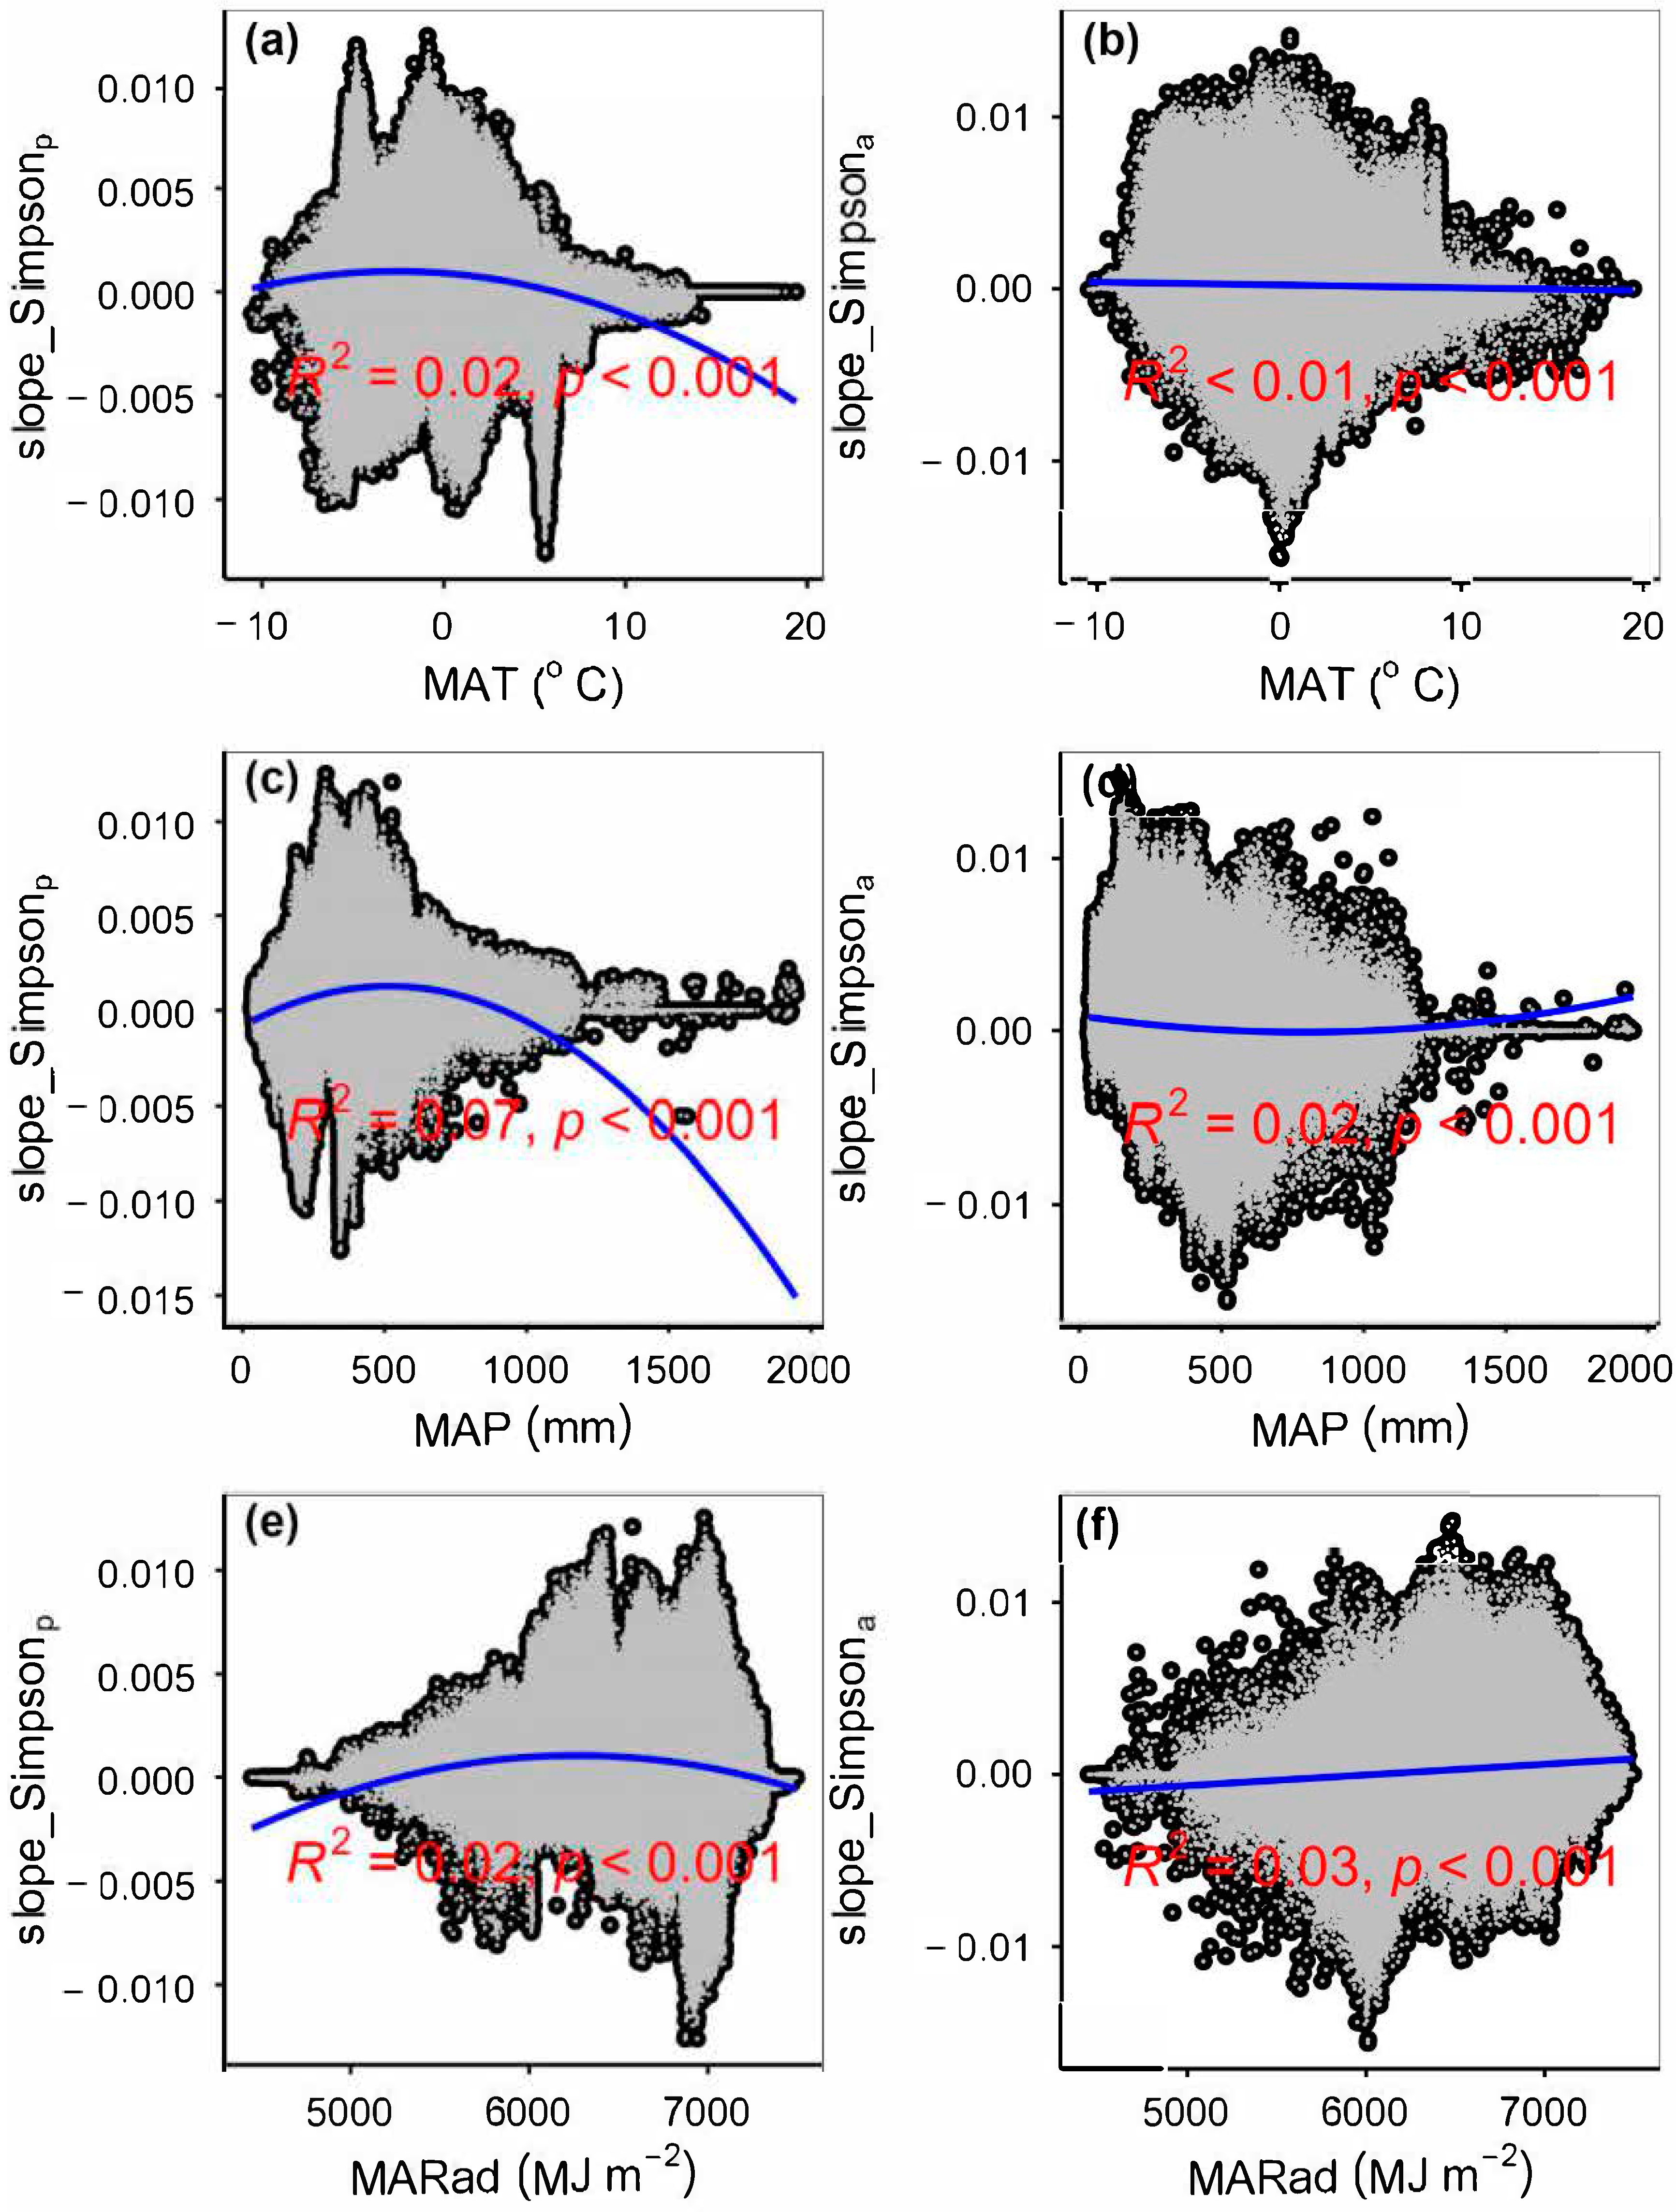
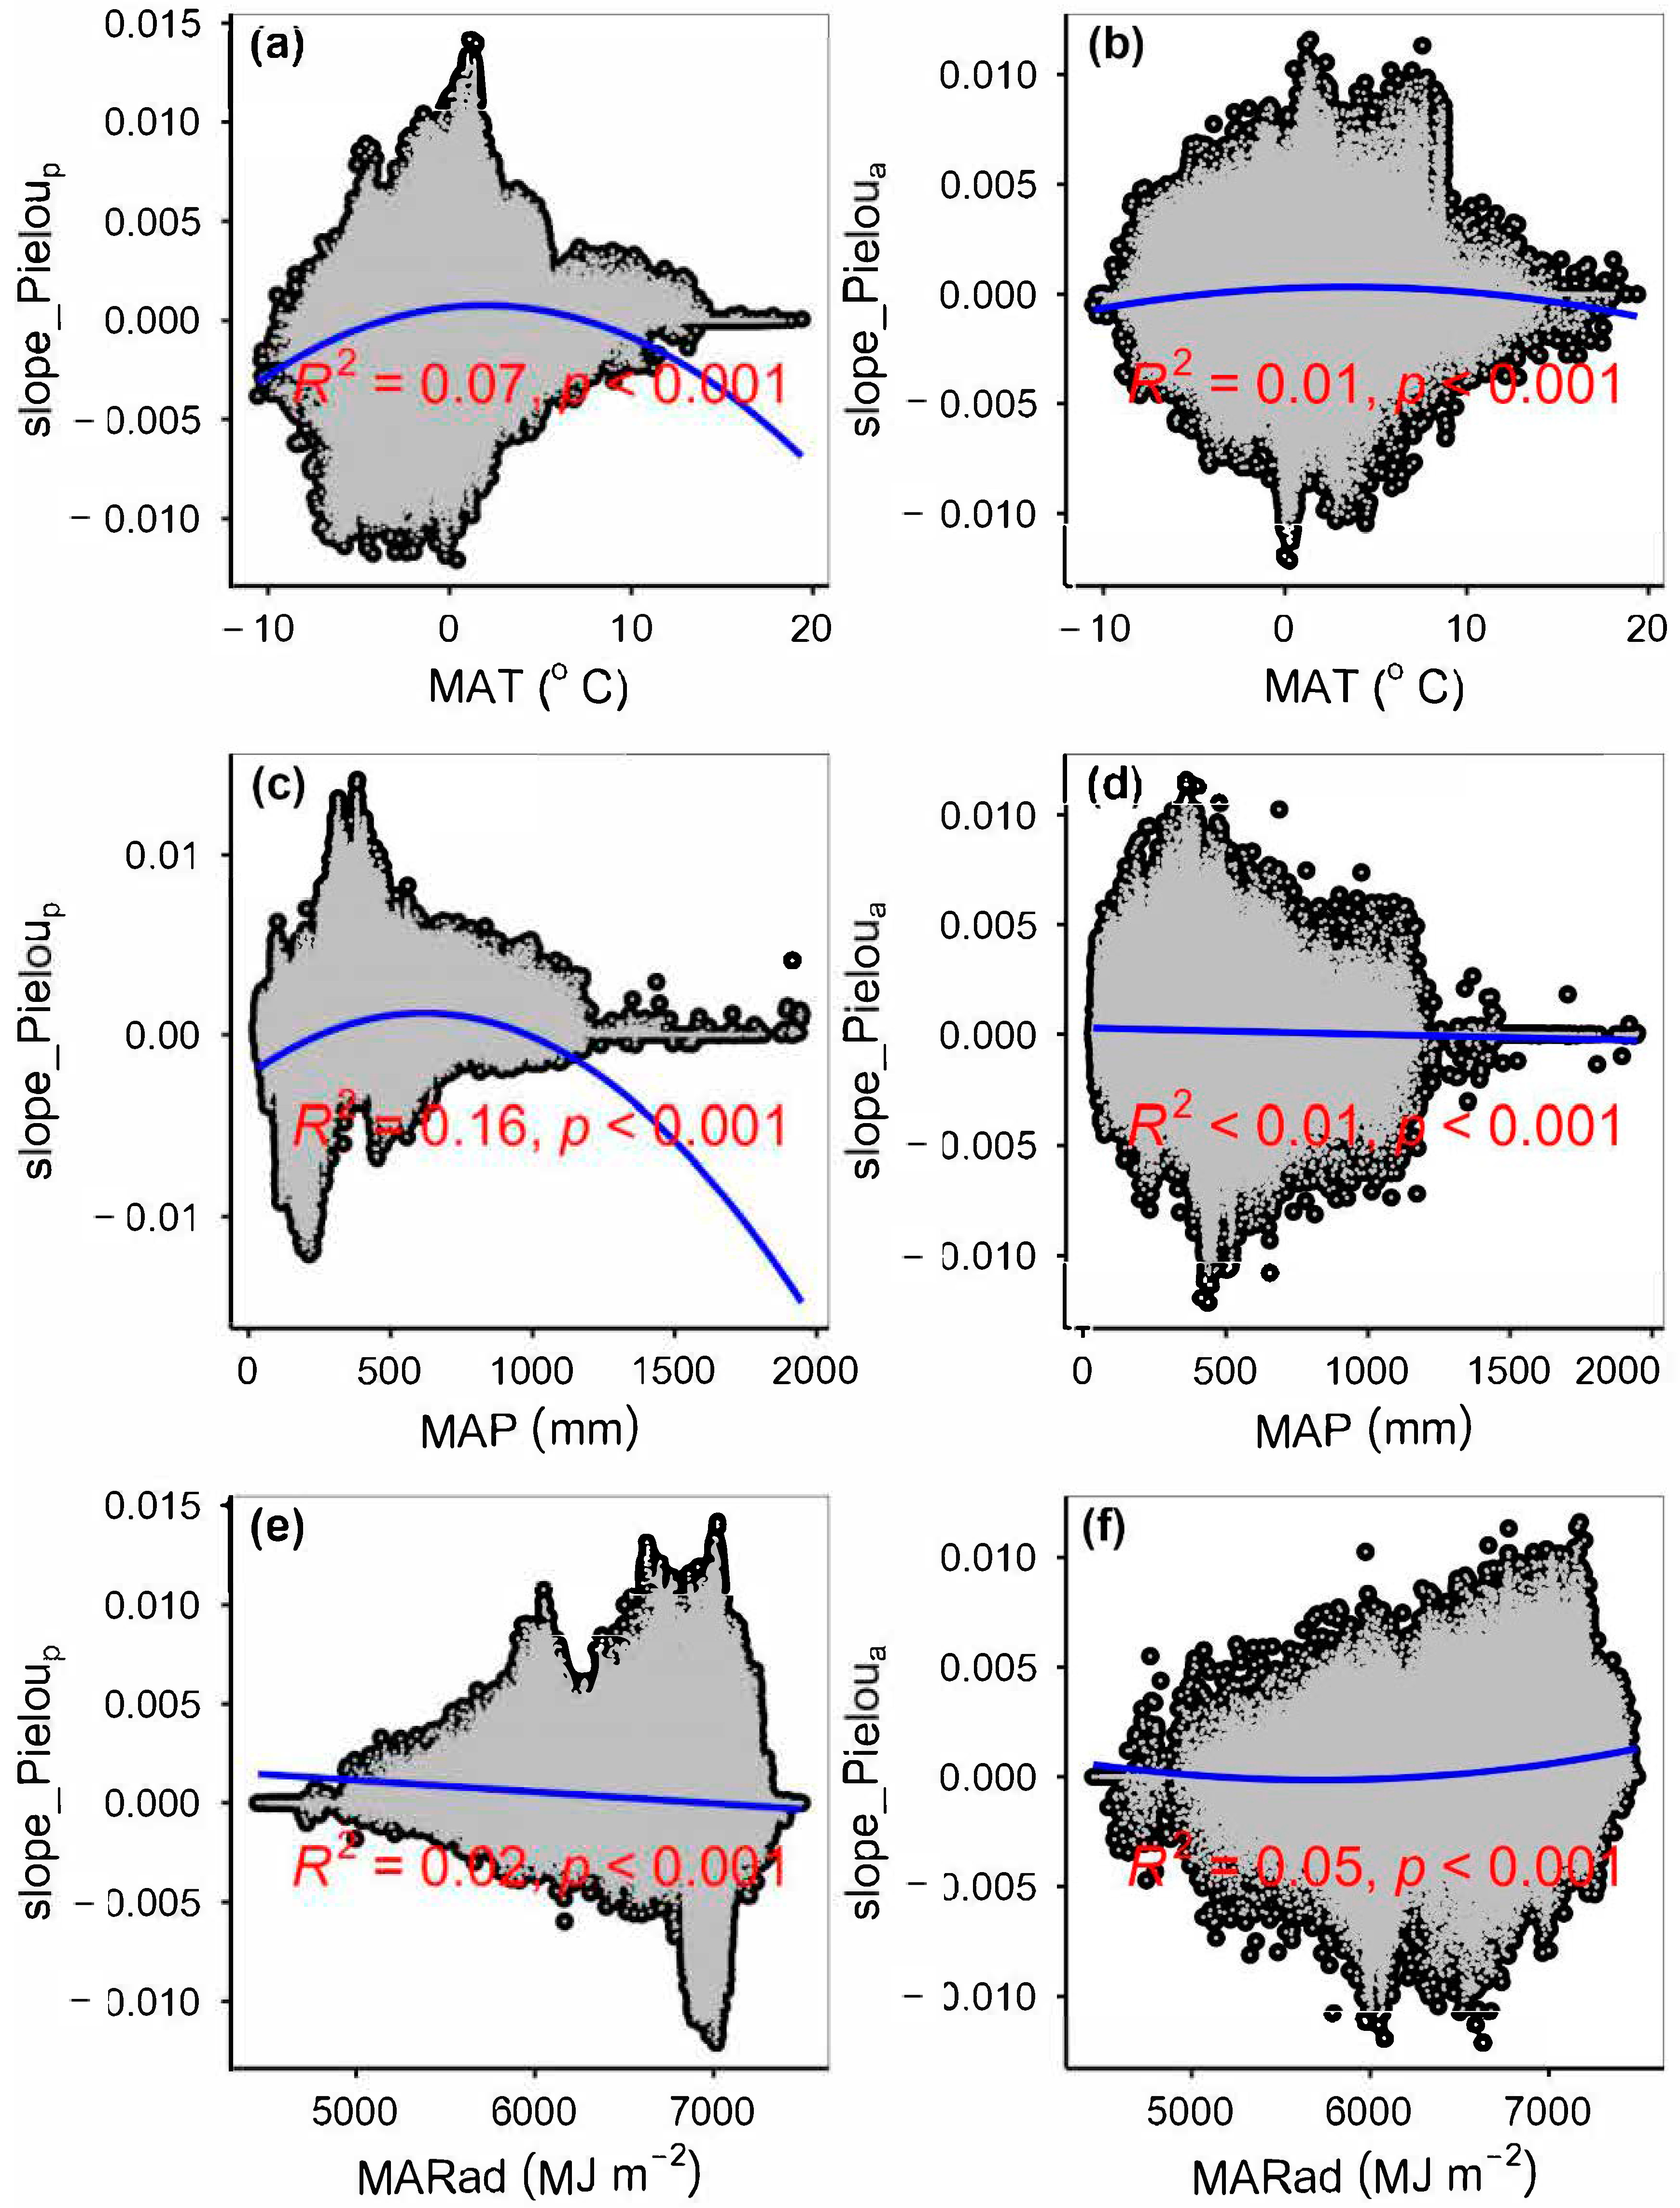
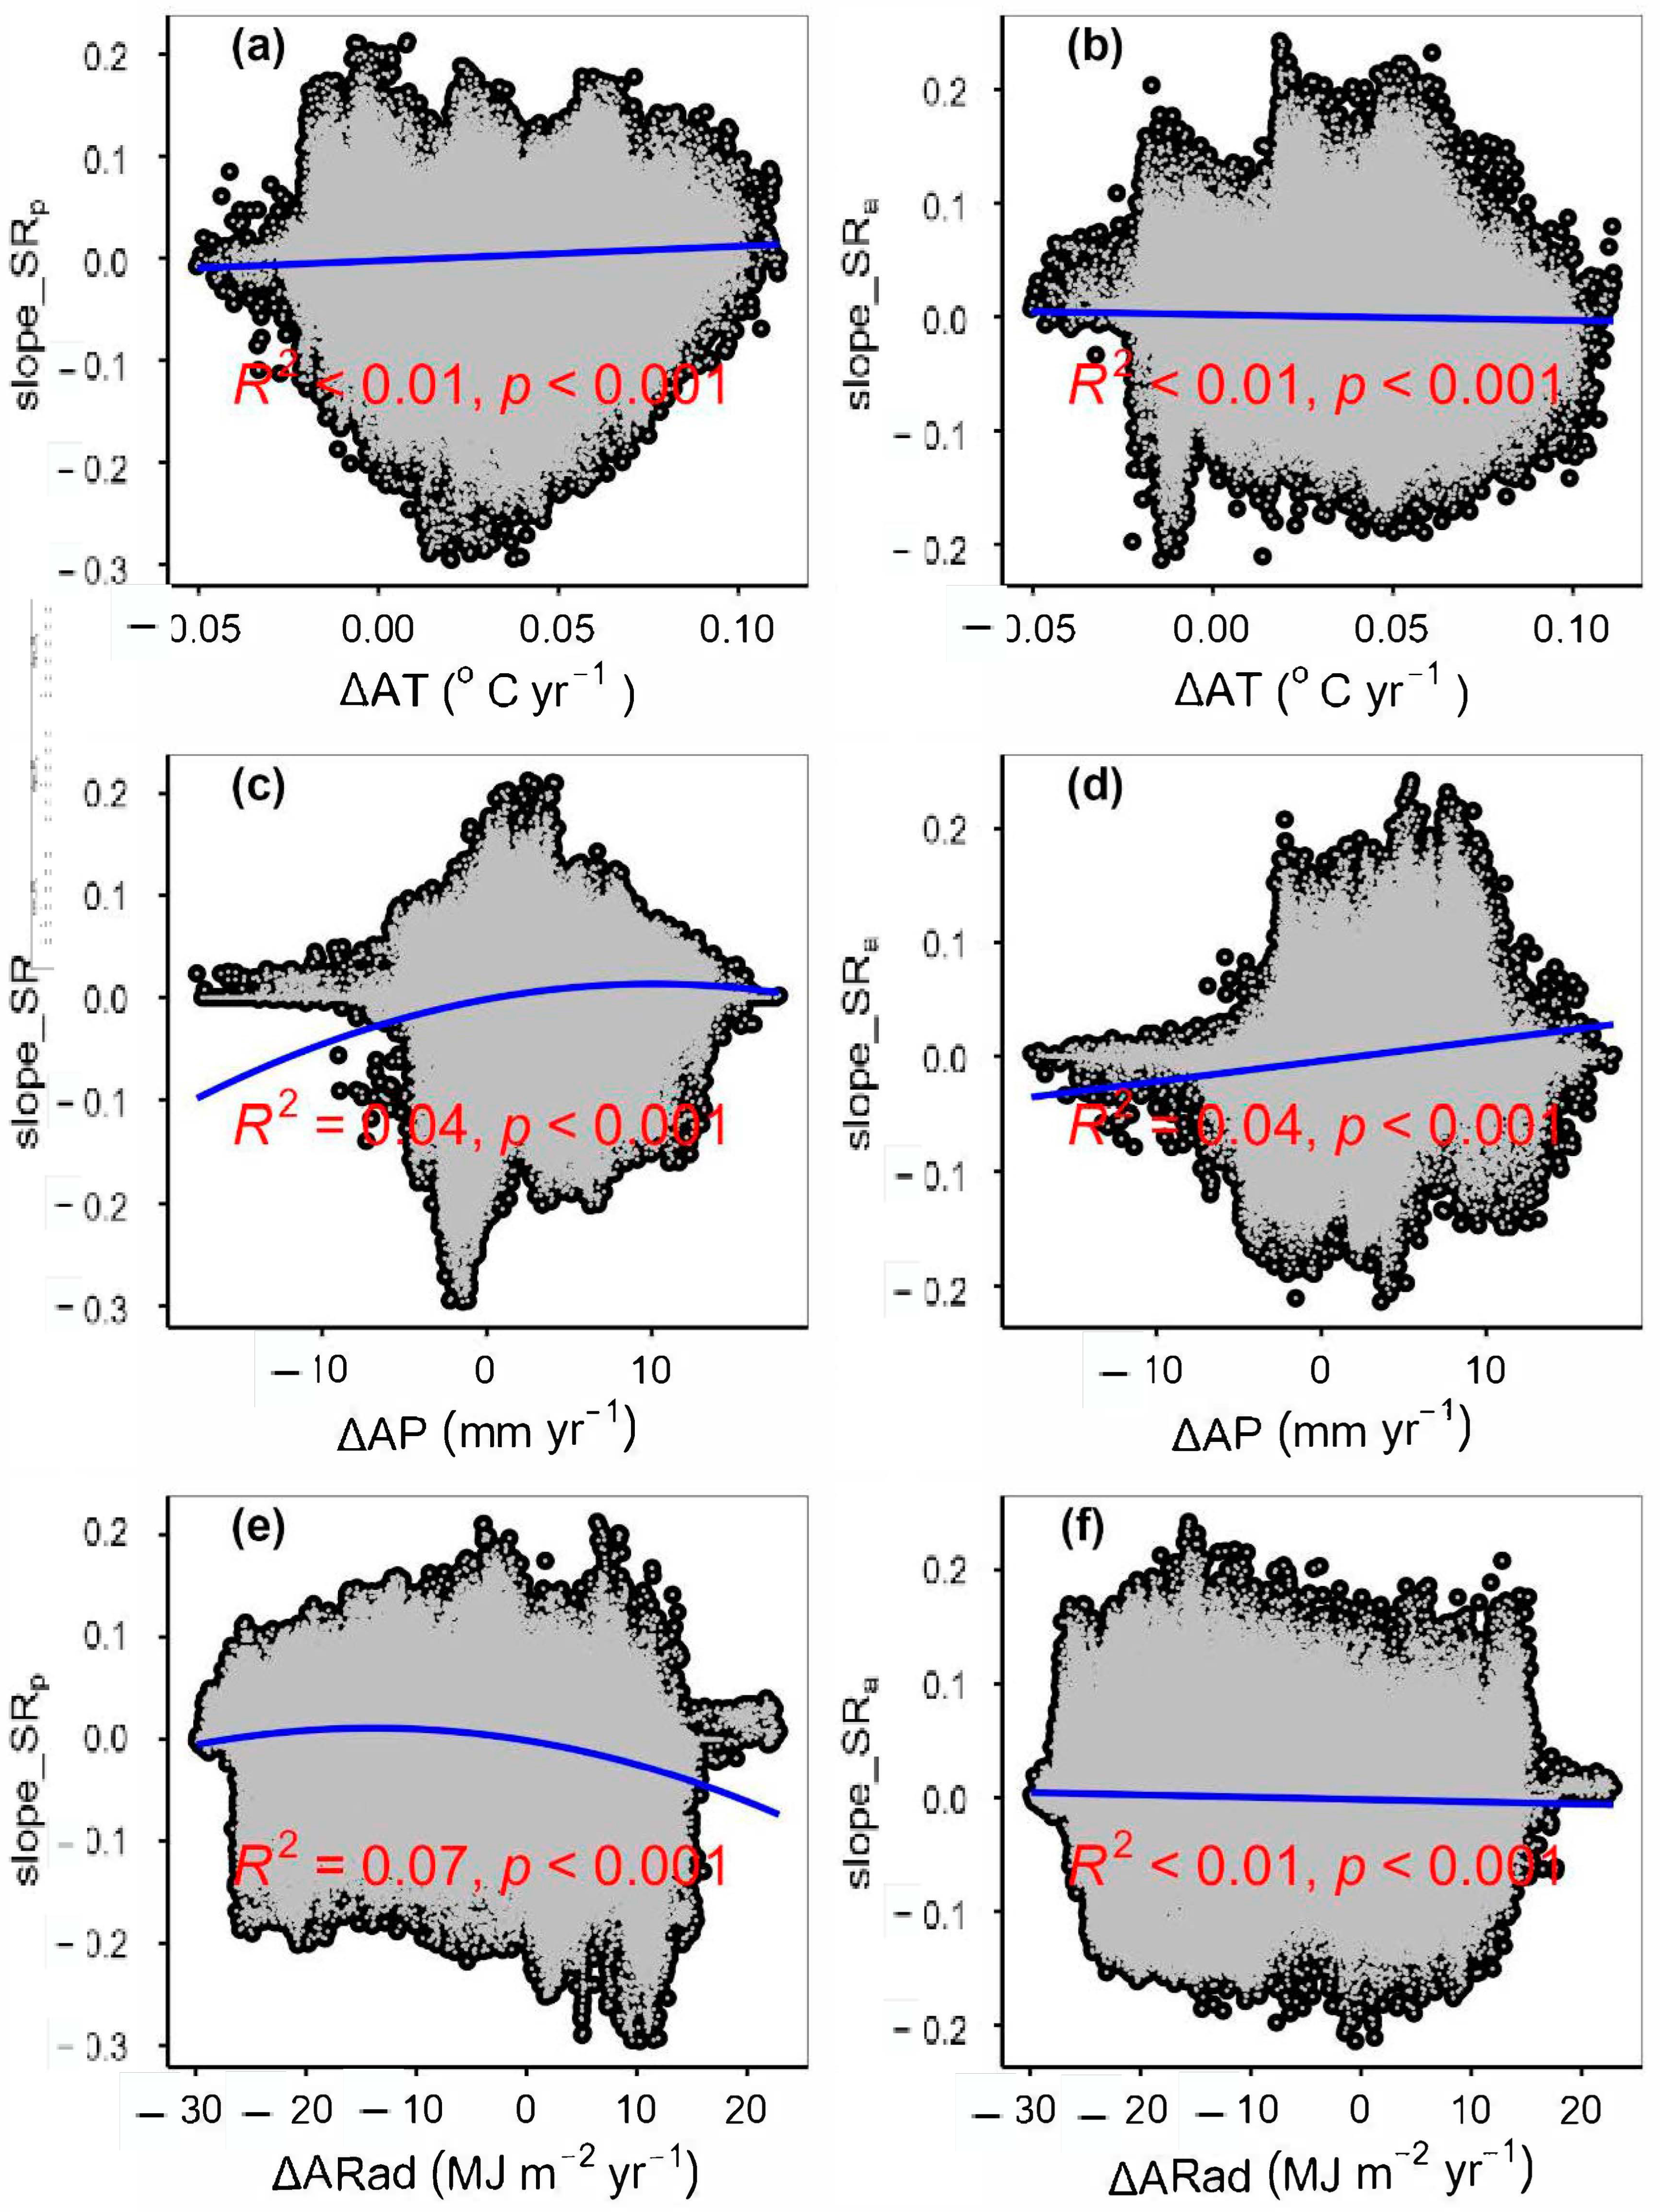
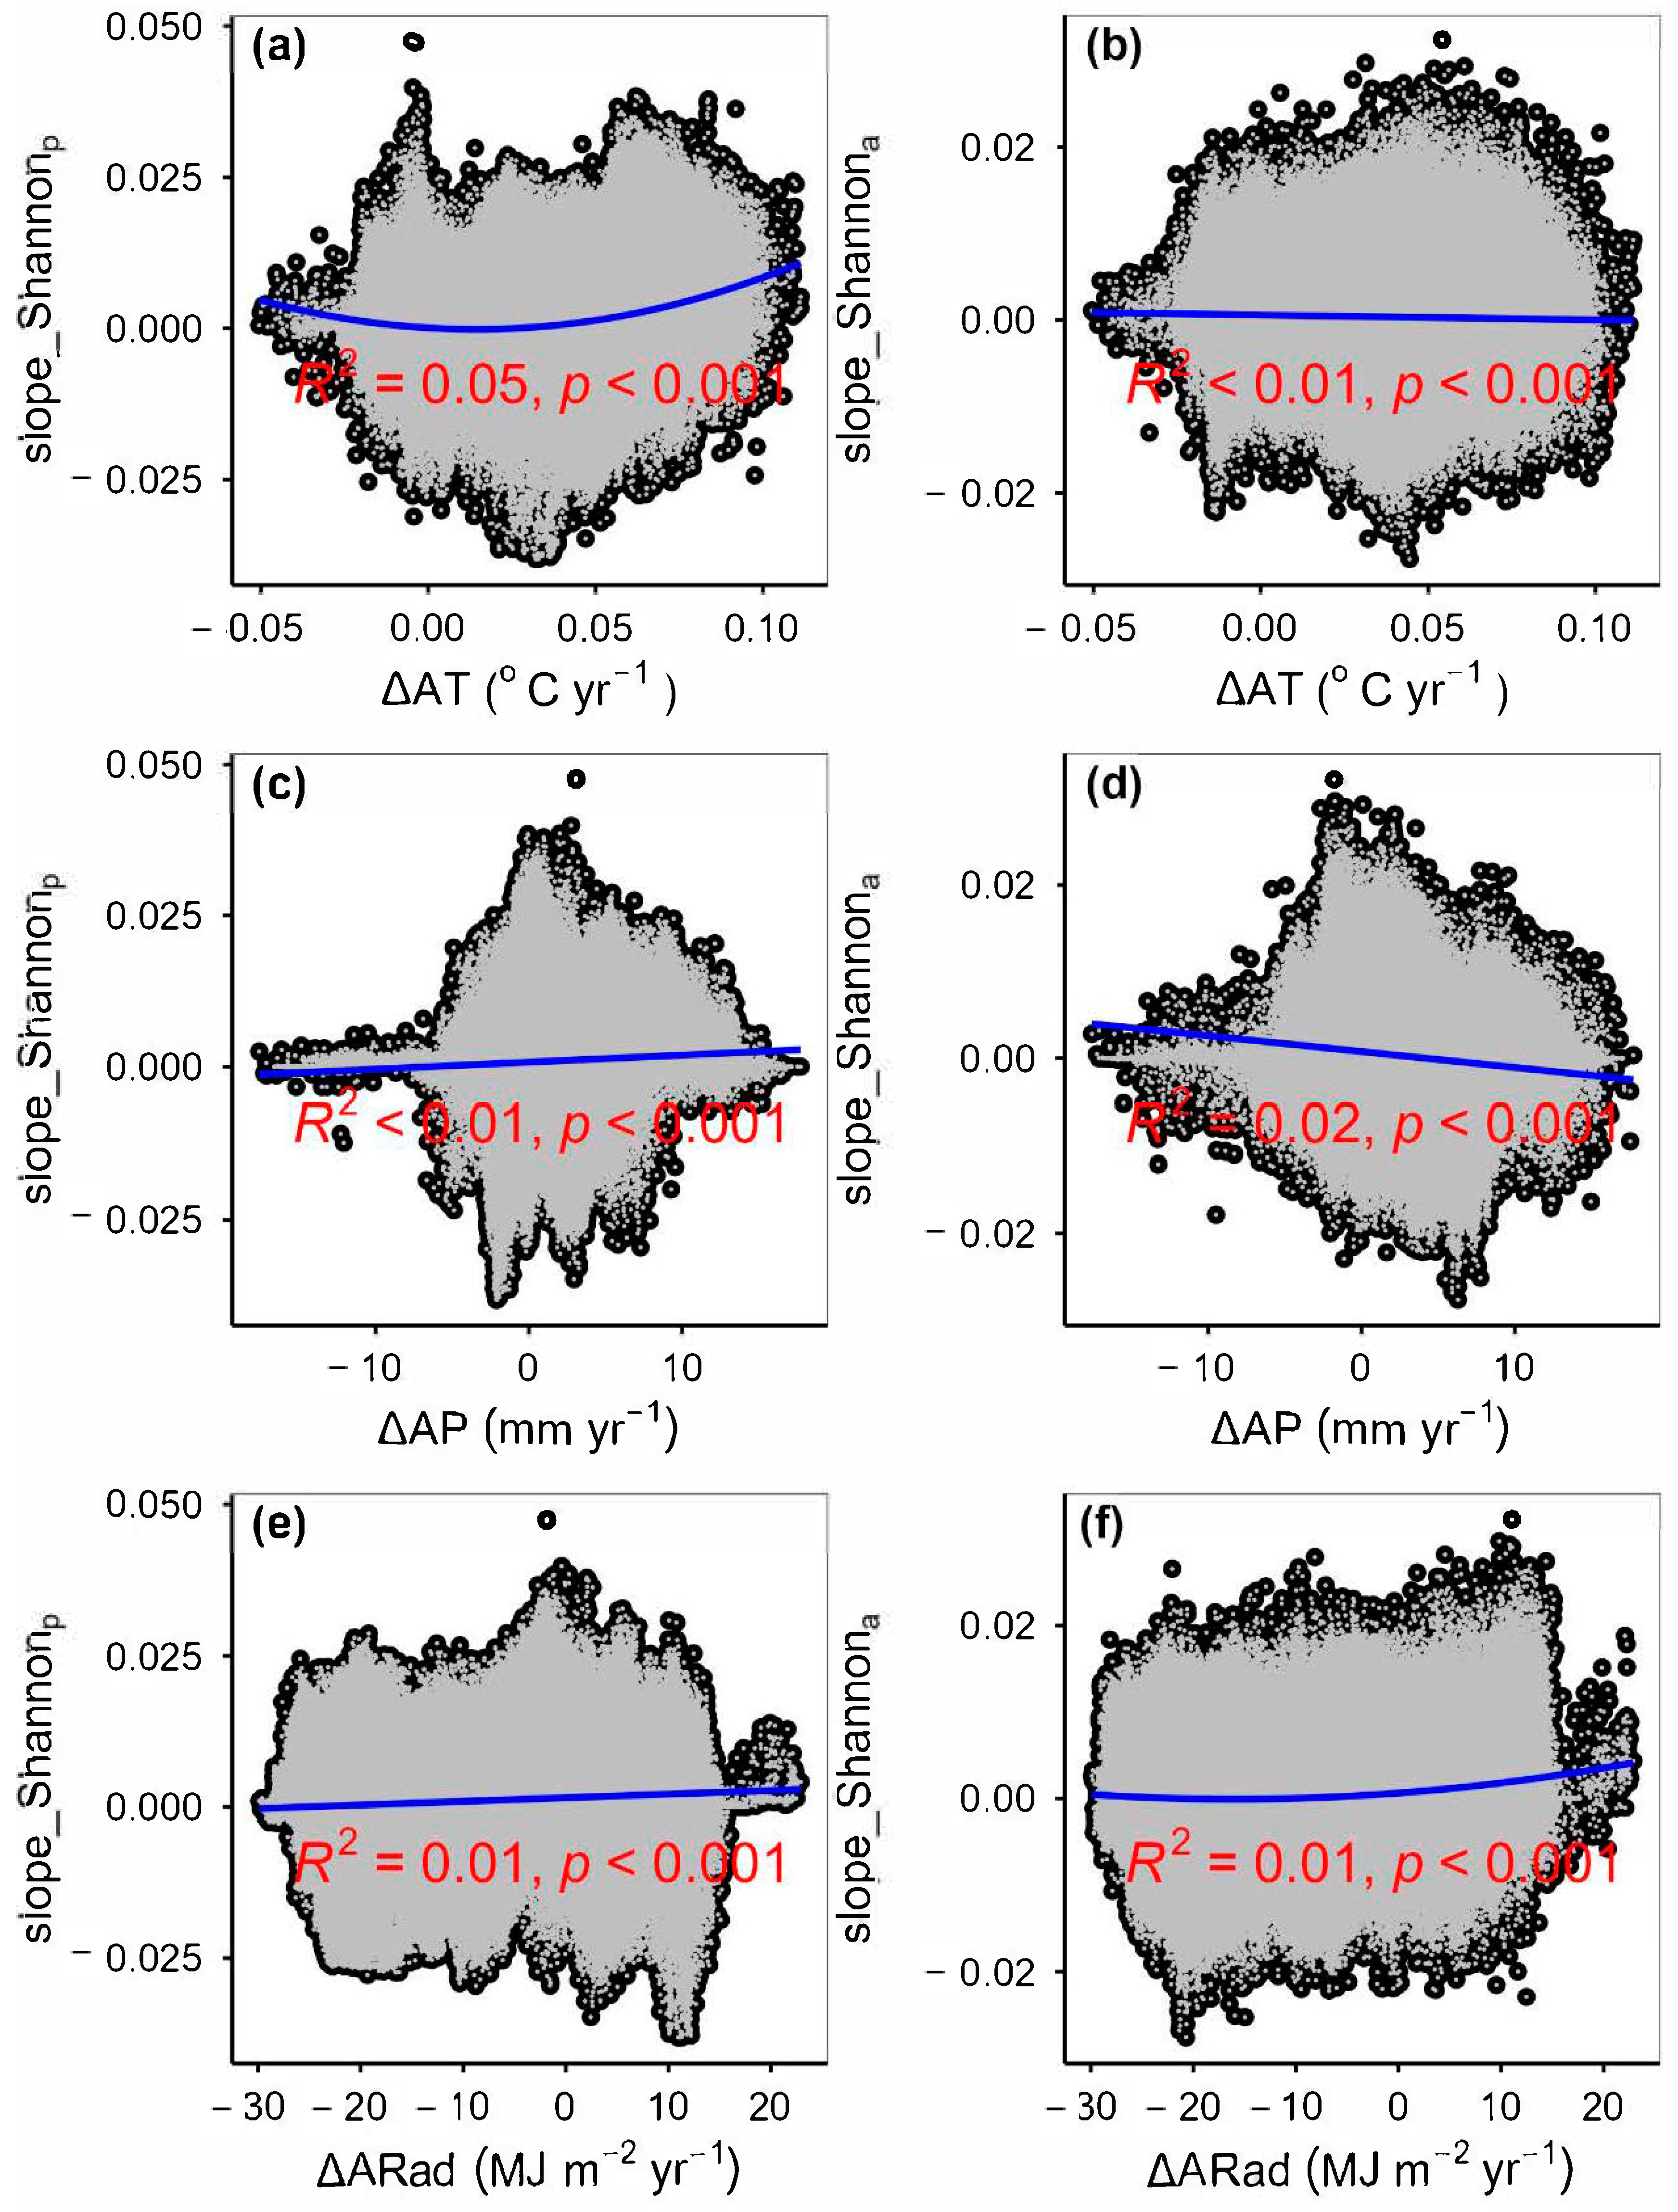
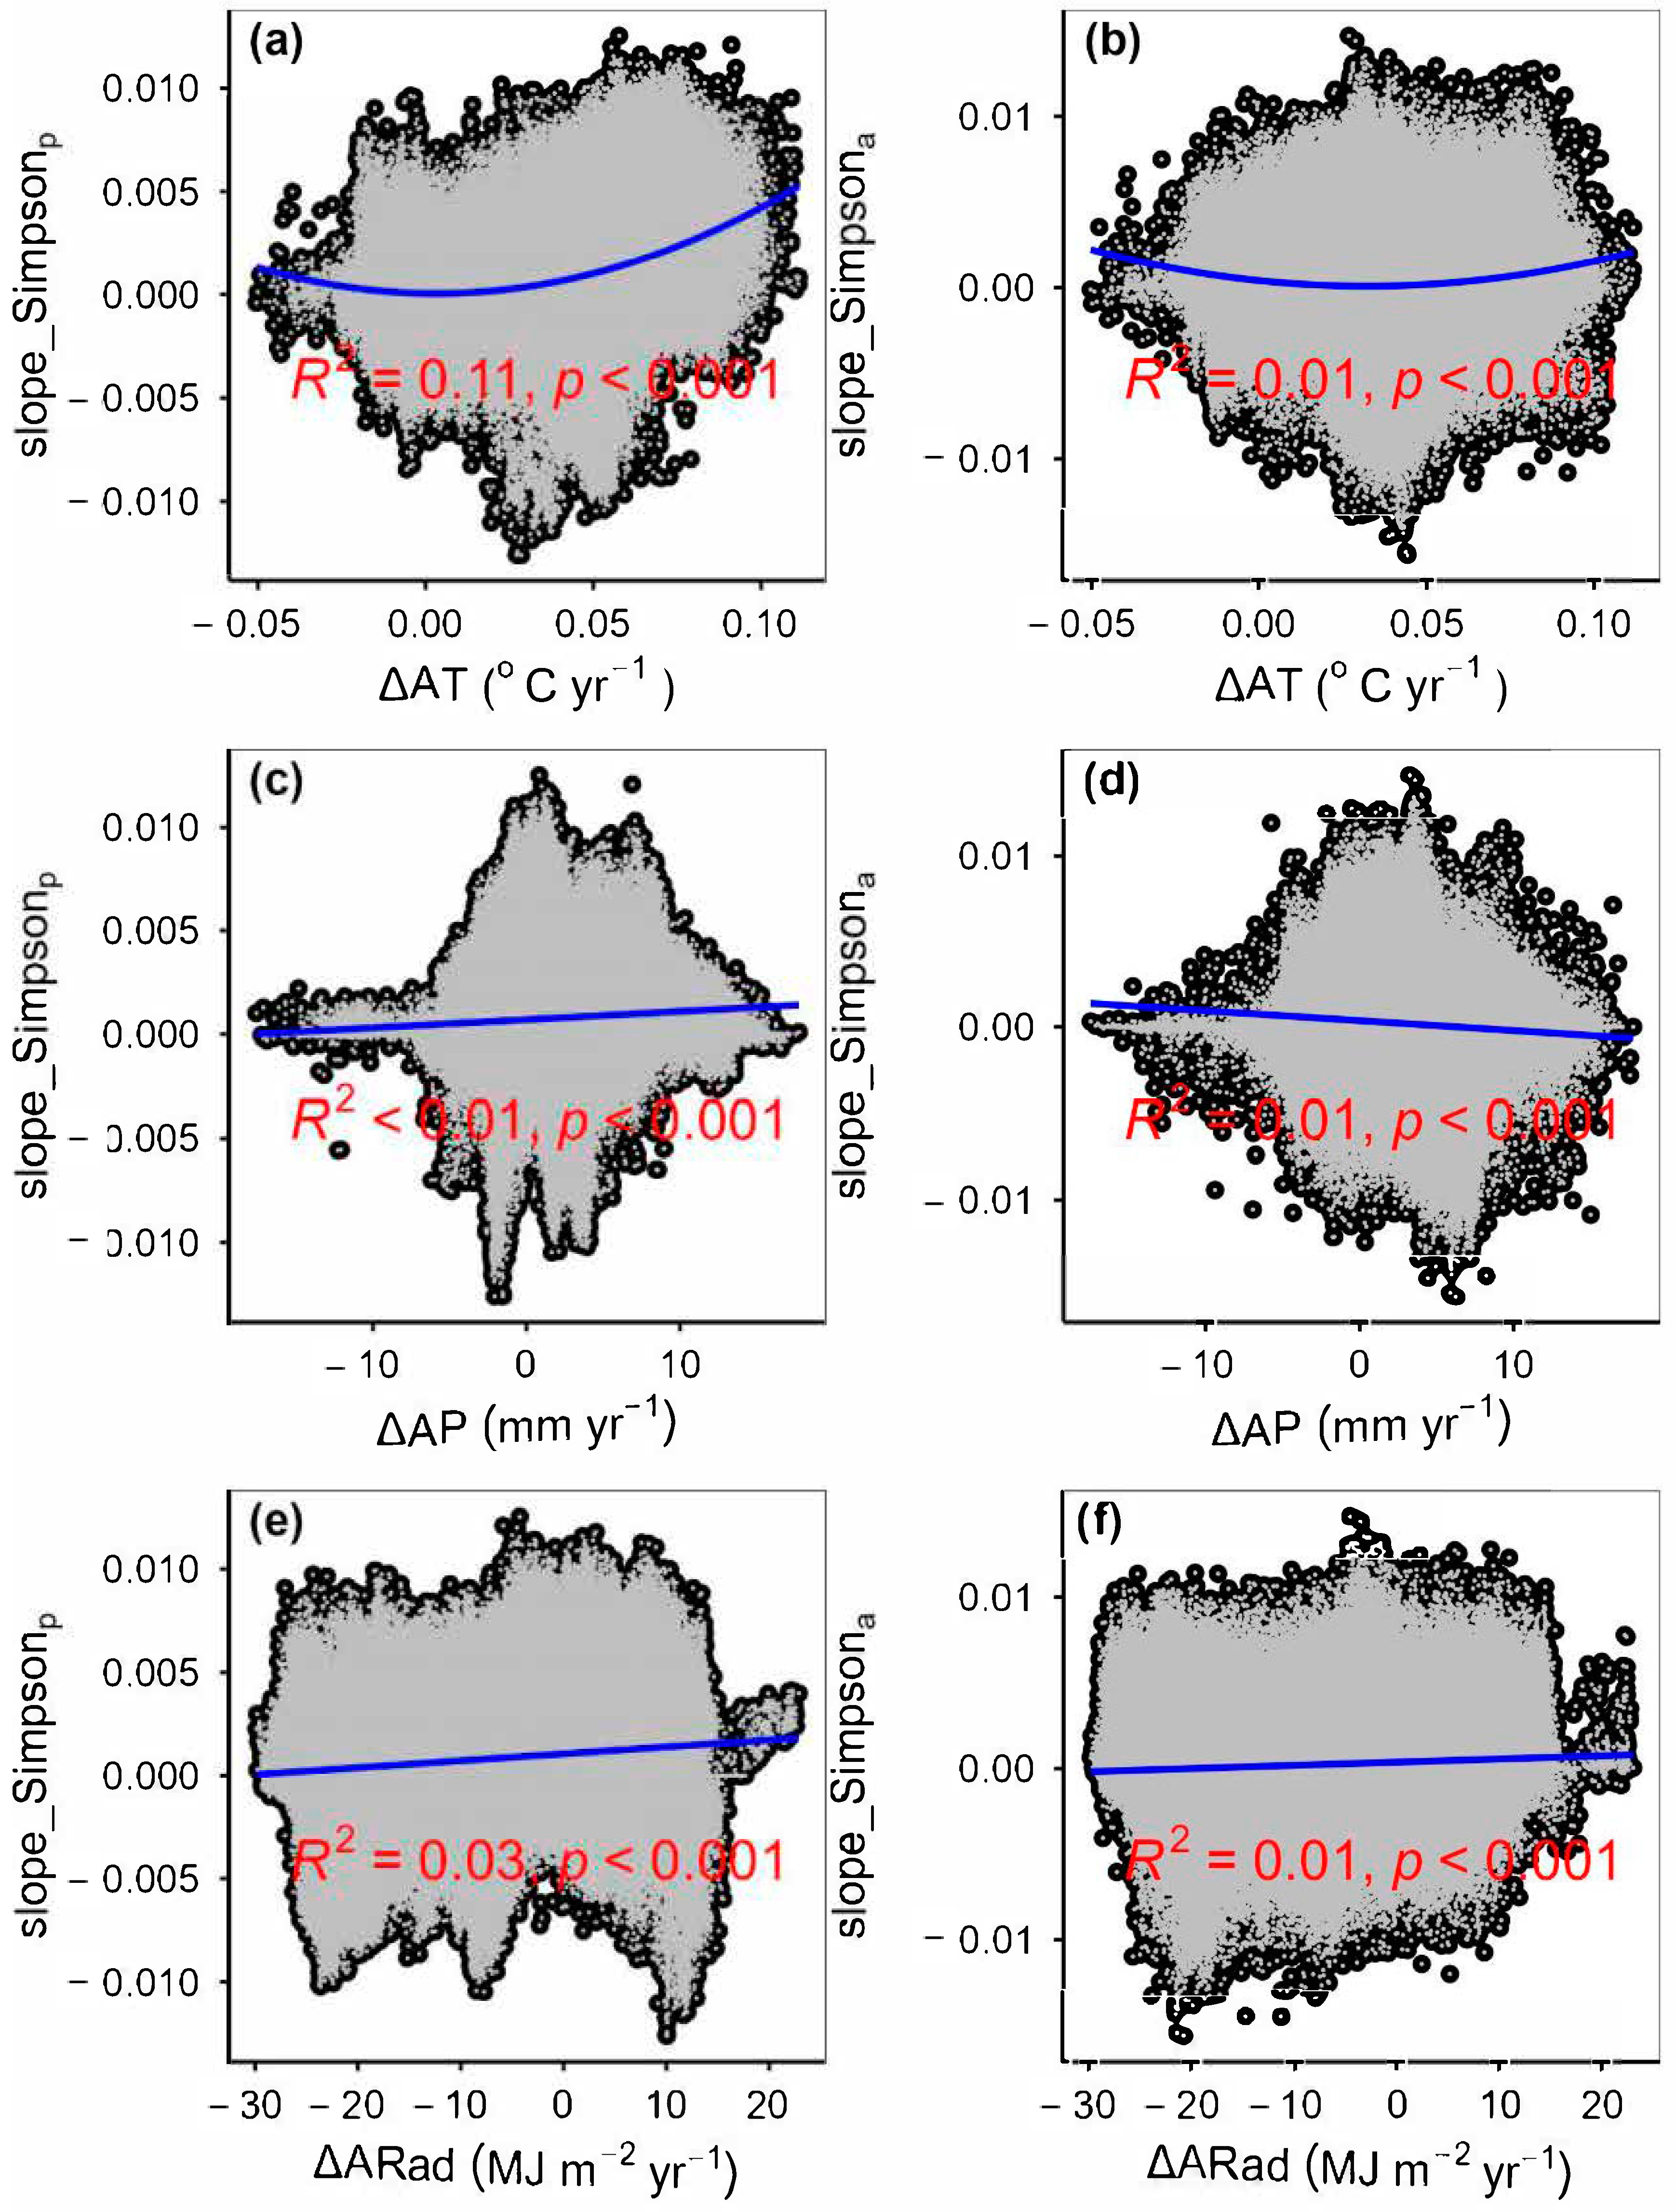
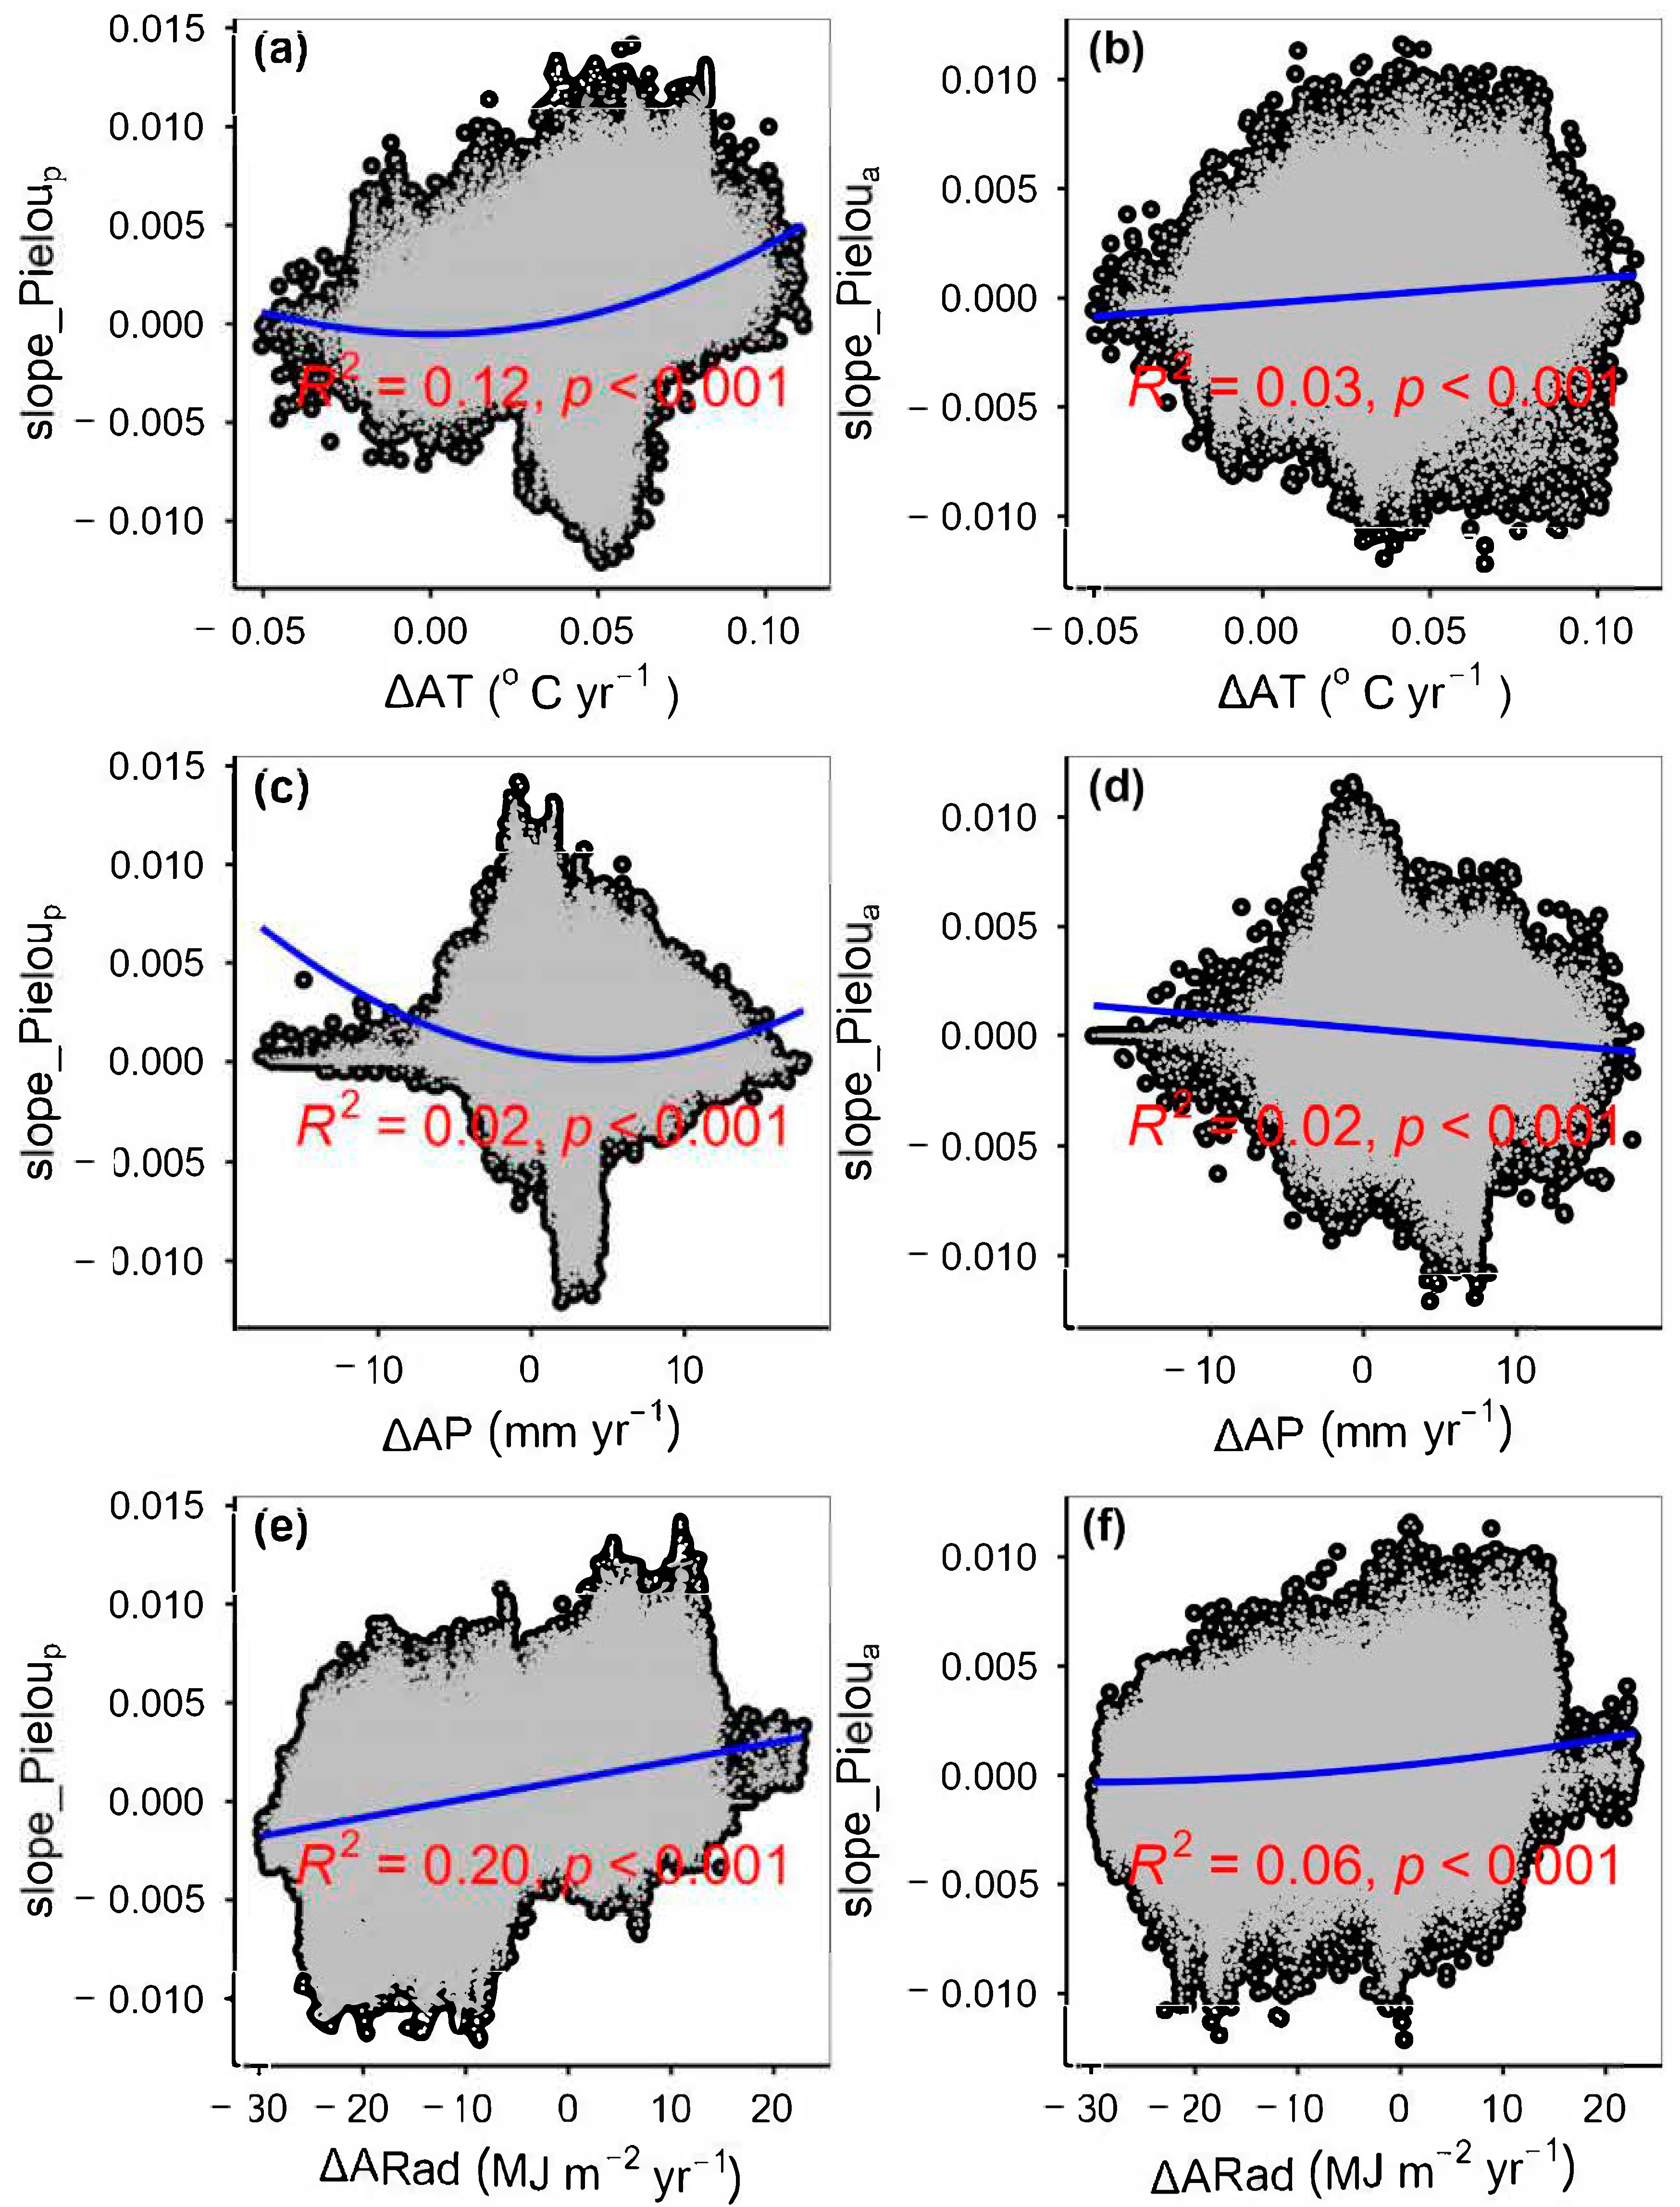
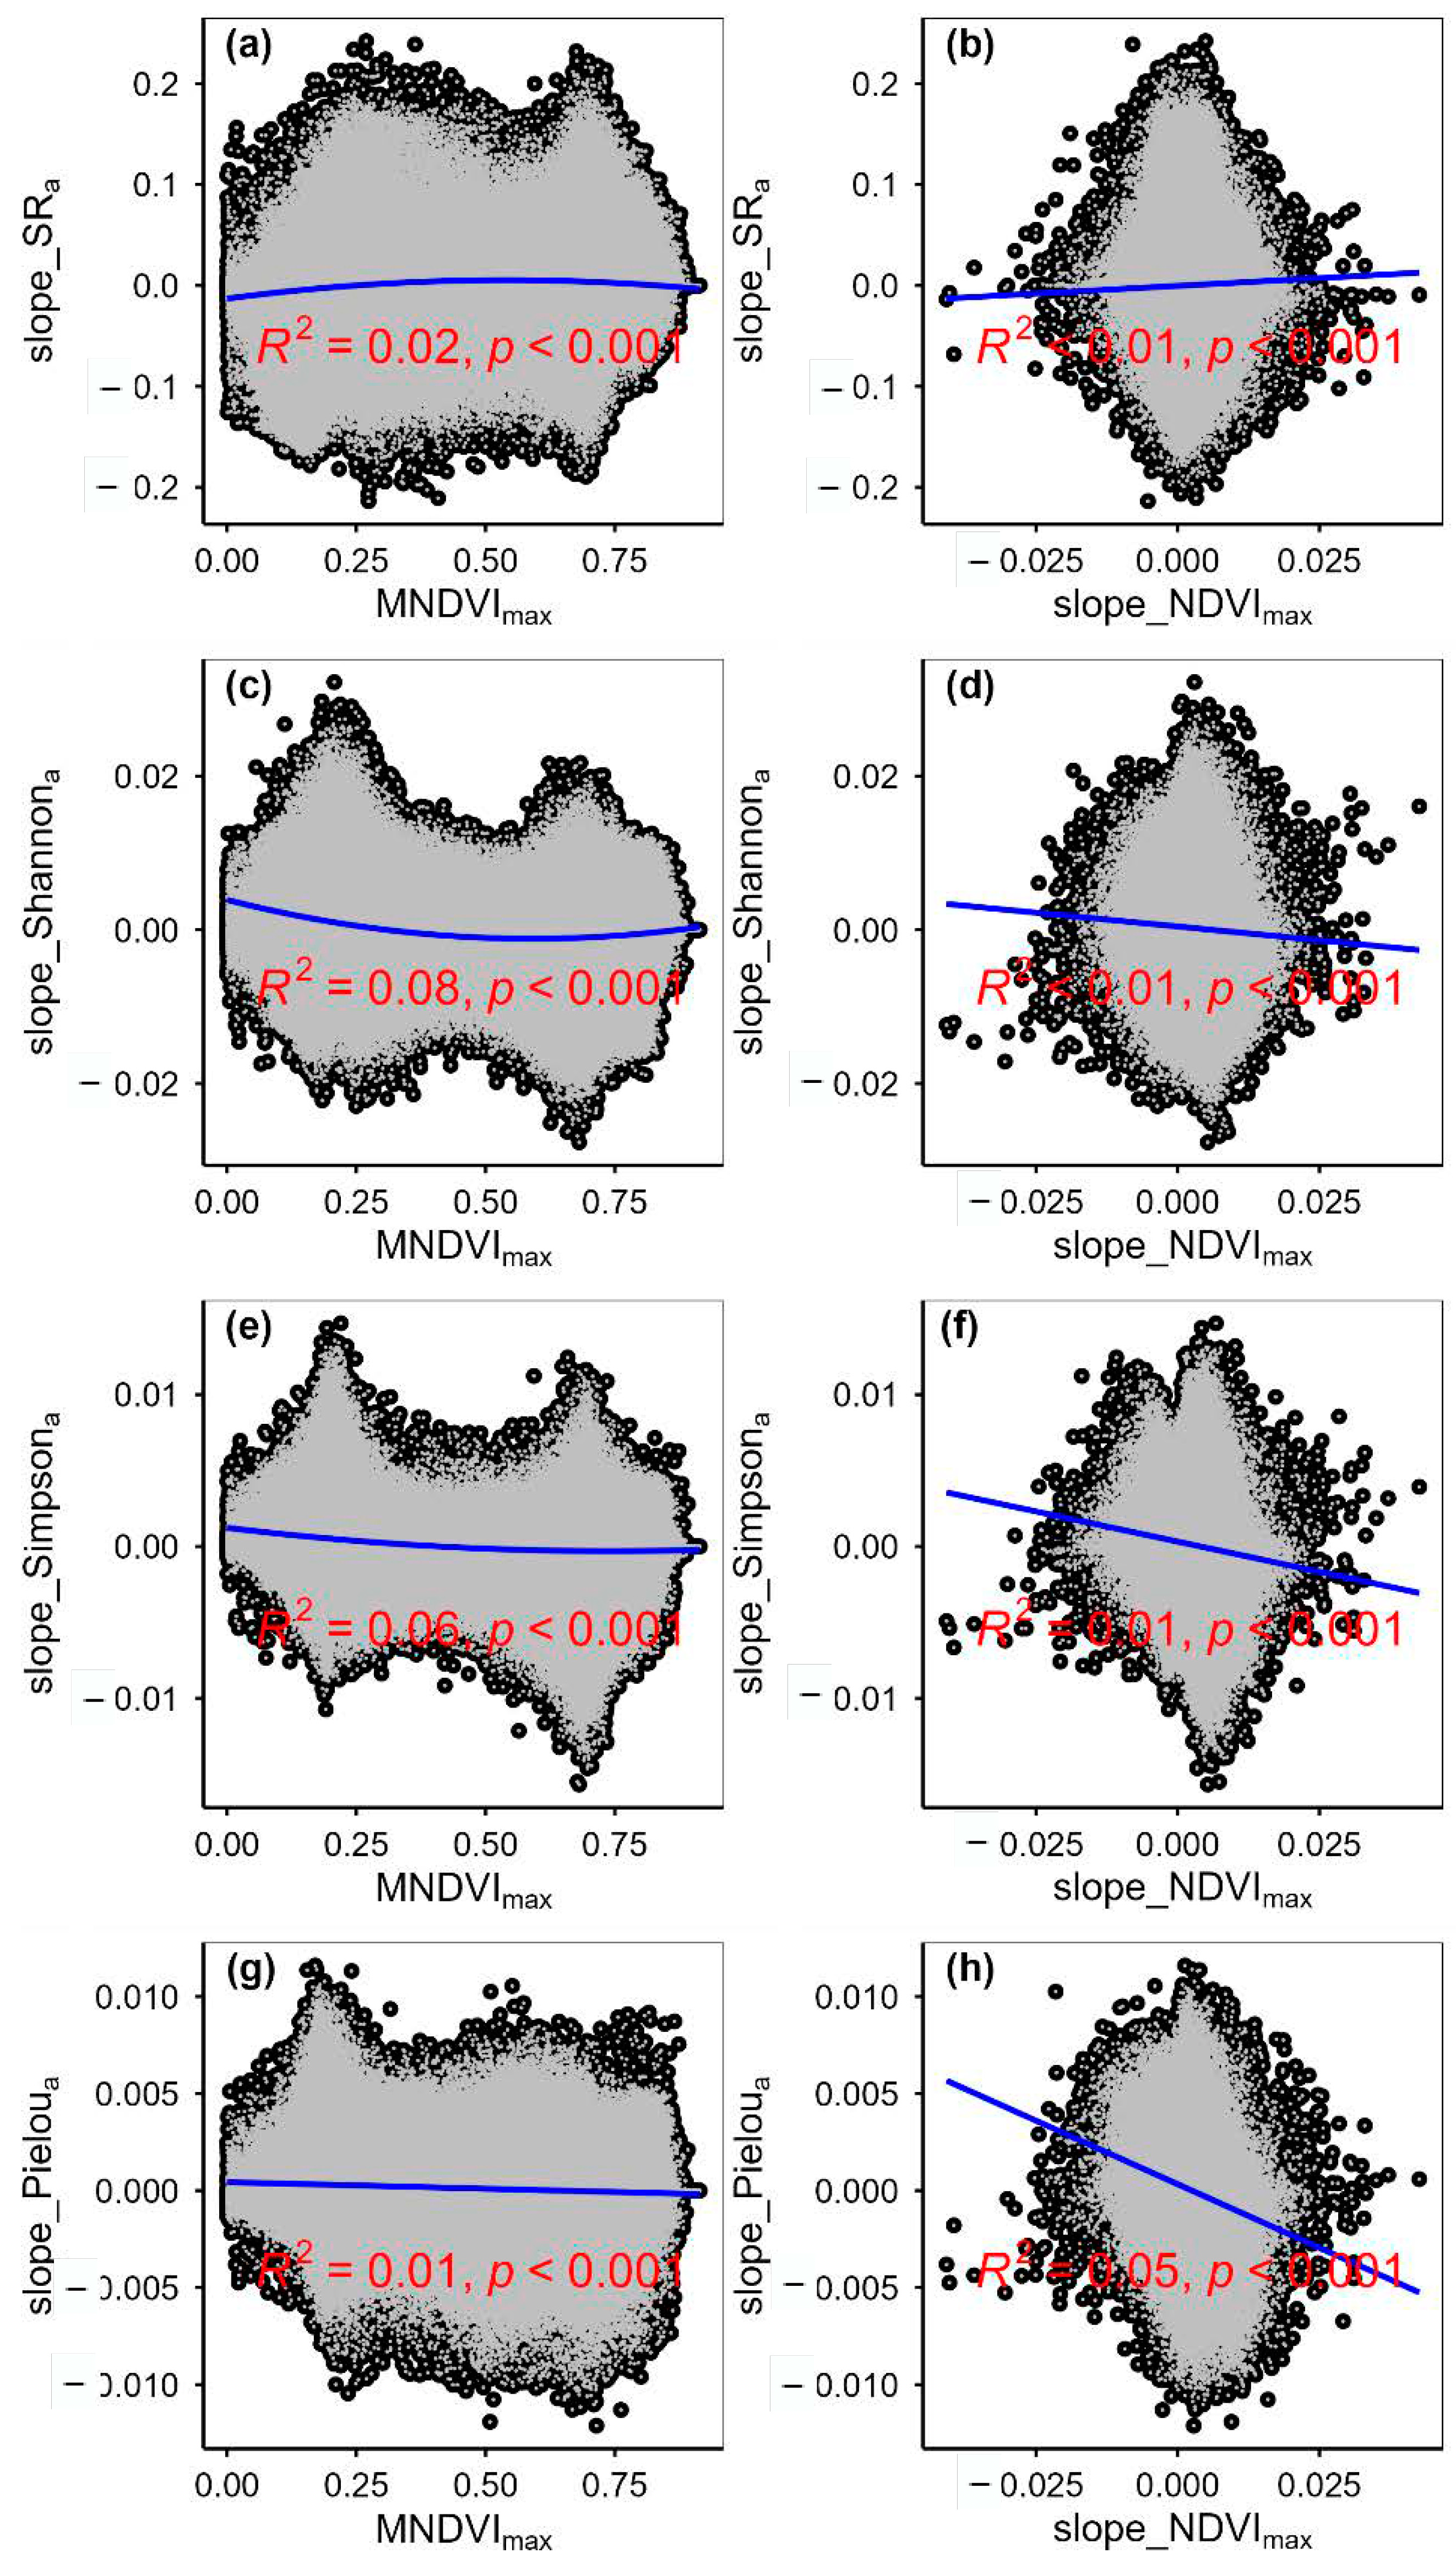
3.2. Change Rates of Plant α-Diversity and Their Correlations with Environmental Factors

The spatial average slope_SRp, slope_SRa, slope_Shannonp, slope_Shannona, slope_Simpsonp, slope_Simpsona, slope_Pieloup and slope_Pieloua values were 0.0027 yr−1, −0.0001 yr−1, 0.0010 yr−1, 0.0004 yr−1, 0.0008 yr−1, 0.0002 yr−1, 0.0003 yr−1 and 0.0002 yr−1, respectively (Figure 1 and Figure 2). There were 56.95%, 47.51%, 57.50%, 54.80%, 63.08%, 56.43%, 53.12% and 51.95% areas showing increasing trends for the slope_SRp, slope_SRa, slope_Shannonp, slope_Shannona, slope_Simpsonp, slope_Simpsona, slope_Pieloup and slope_Pieloua, respectively (Figure 1 and Figure 2, Table 1). There were 33.89%, 41.13%, 35.13%, 41.41%, 33.40%, 38.49%, 43.81% and 42.64% areas showing decreasing change for slope_SRp, slope_SRa, slope_Shannonp, slope_Shannona, slope_Simpsonp, slope_Simpsona, slope_Pieloup and slope_Pieloua, respectively (Figure 1 and Figure 2, Table 1). The change rates of plant α-diversity varied among grassland types (Table A1). For example, climate change caused species loss at a rate of −0.0042 yr−1 in alpine meadow steppes but caused species increases at rates of 0.0060, 0.0024 and 0.0025 yr−1 in alpine steppes, alpine desert-steppes and alpine meadows, respectively (Table A1).
Longitude, latitude, elevation, MAT, MAP, MARad, slope_AT, slope_AP and slope_ARad significantly explained the change rates of plant α-diversity, but their relative impacts were different (Figure A3, Figure A4, Figure A5, Figure A6, Figure A7, Figure A8, Figure A9, Figure A10, Figure A11, Figure A12, Figure A13, Figure A14, Figure A15 and Figure A16). Compared to geography position and mean climate conditions, climate change had greater exclusive impacts on the change rates of plant α-diversity (Figure 3). Compared to the change rates of actual plant α-diversity, climate change had greater impacts on the change rates of potential plant α-diversity (Figure 3). The impacts of geography position and mean climate conditions on the change rates of potential α-diversity were different from those on the change rates of actual α-diversity (Figure 3). Both the MNDVImax and slope_NDVImax were correlated with the change rates of actual α-diversity (Figure A17).

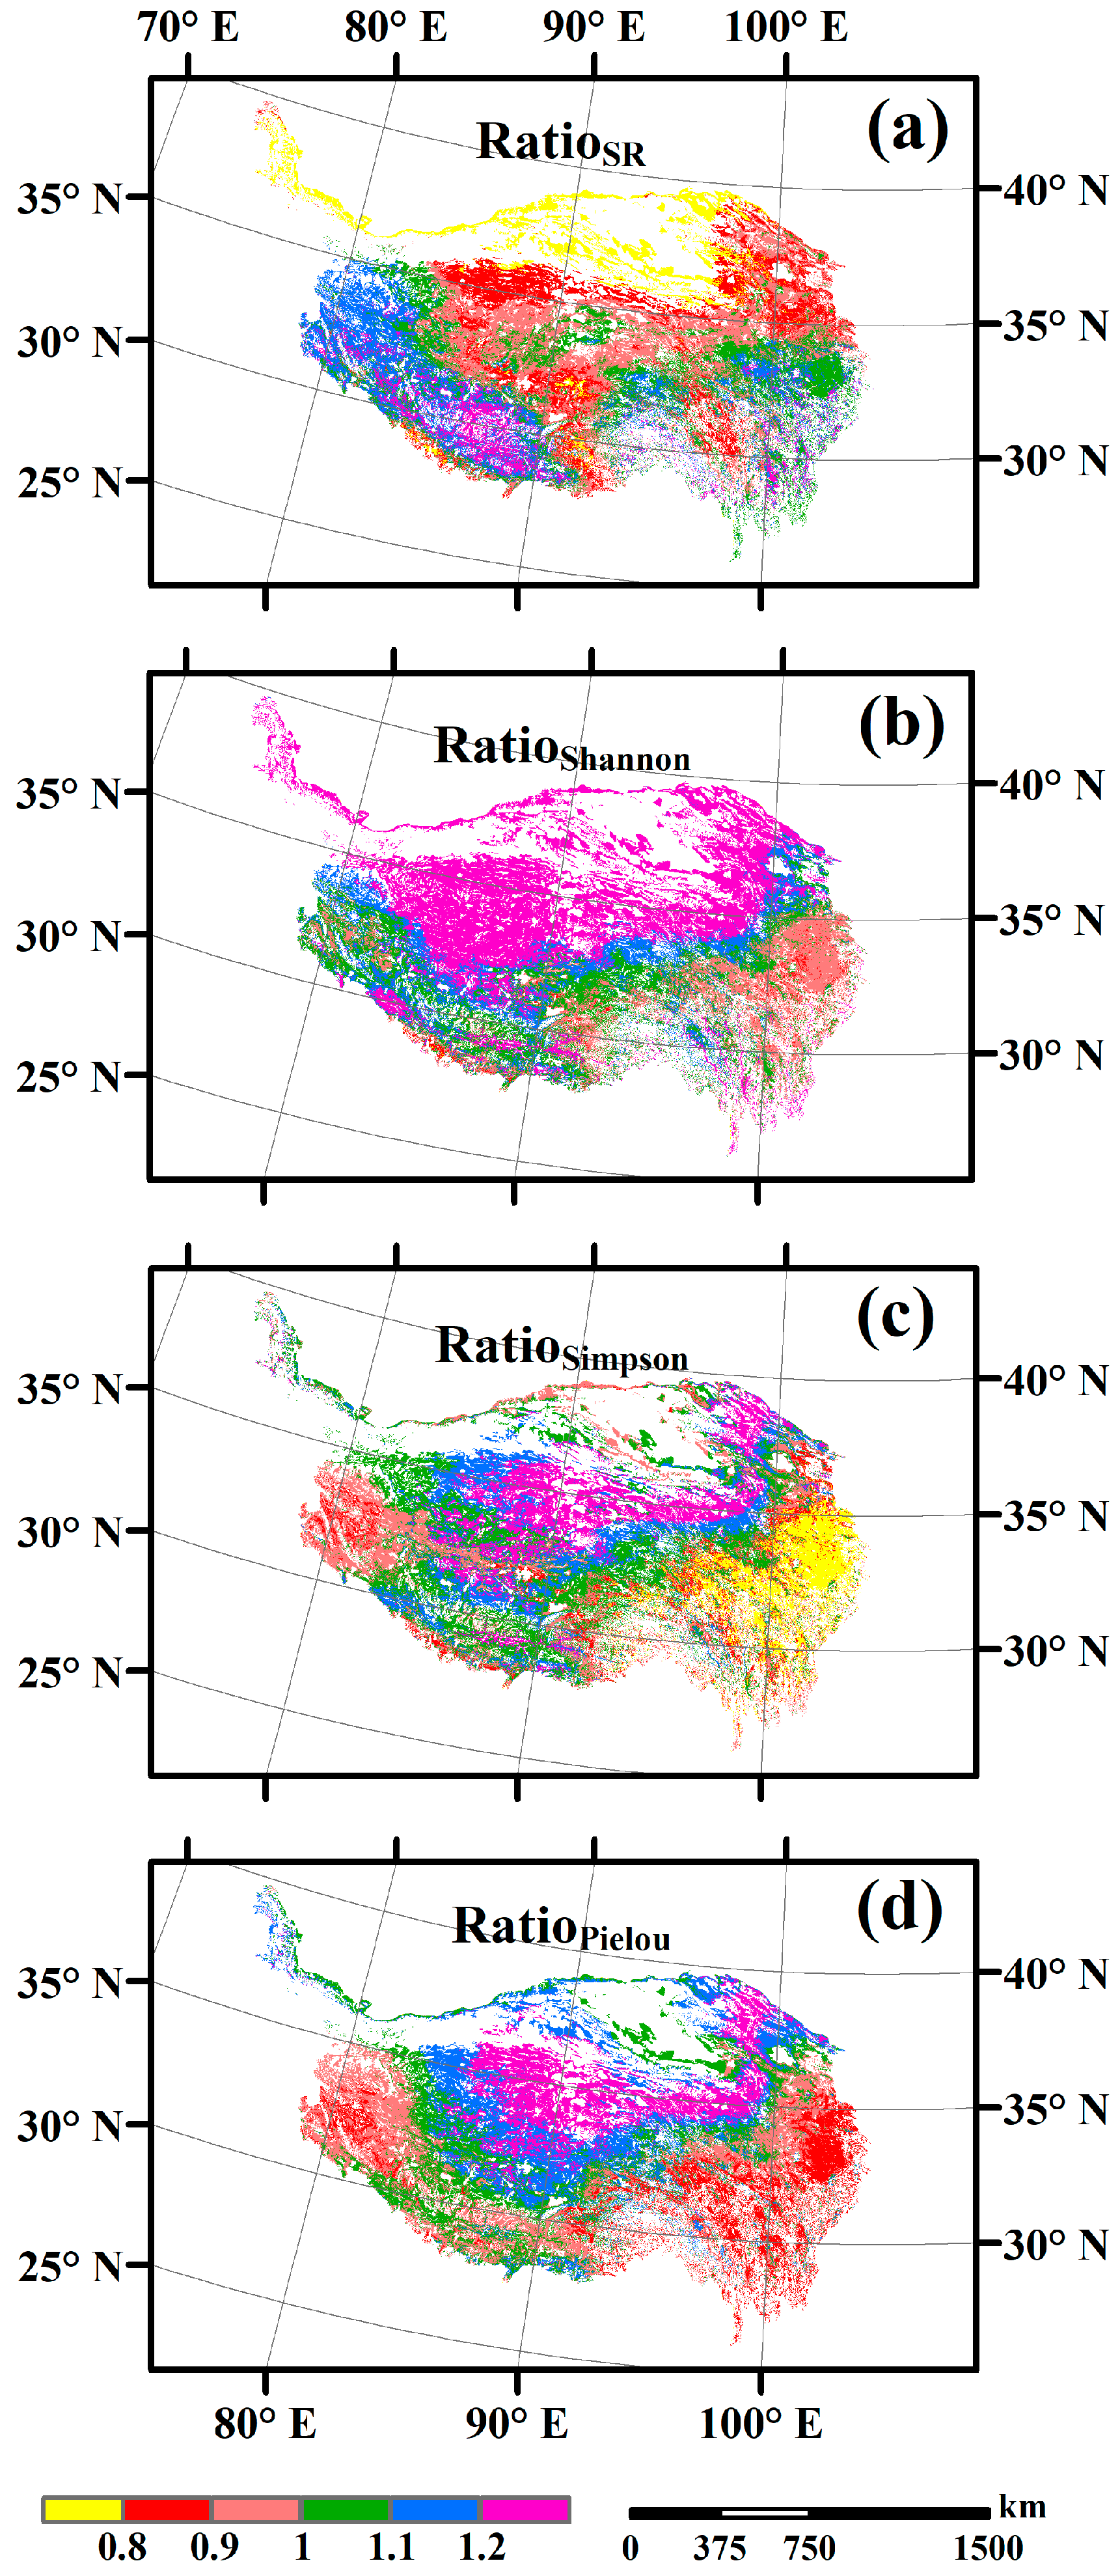
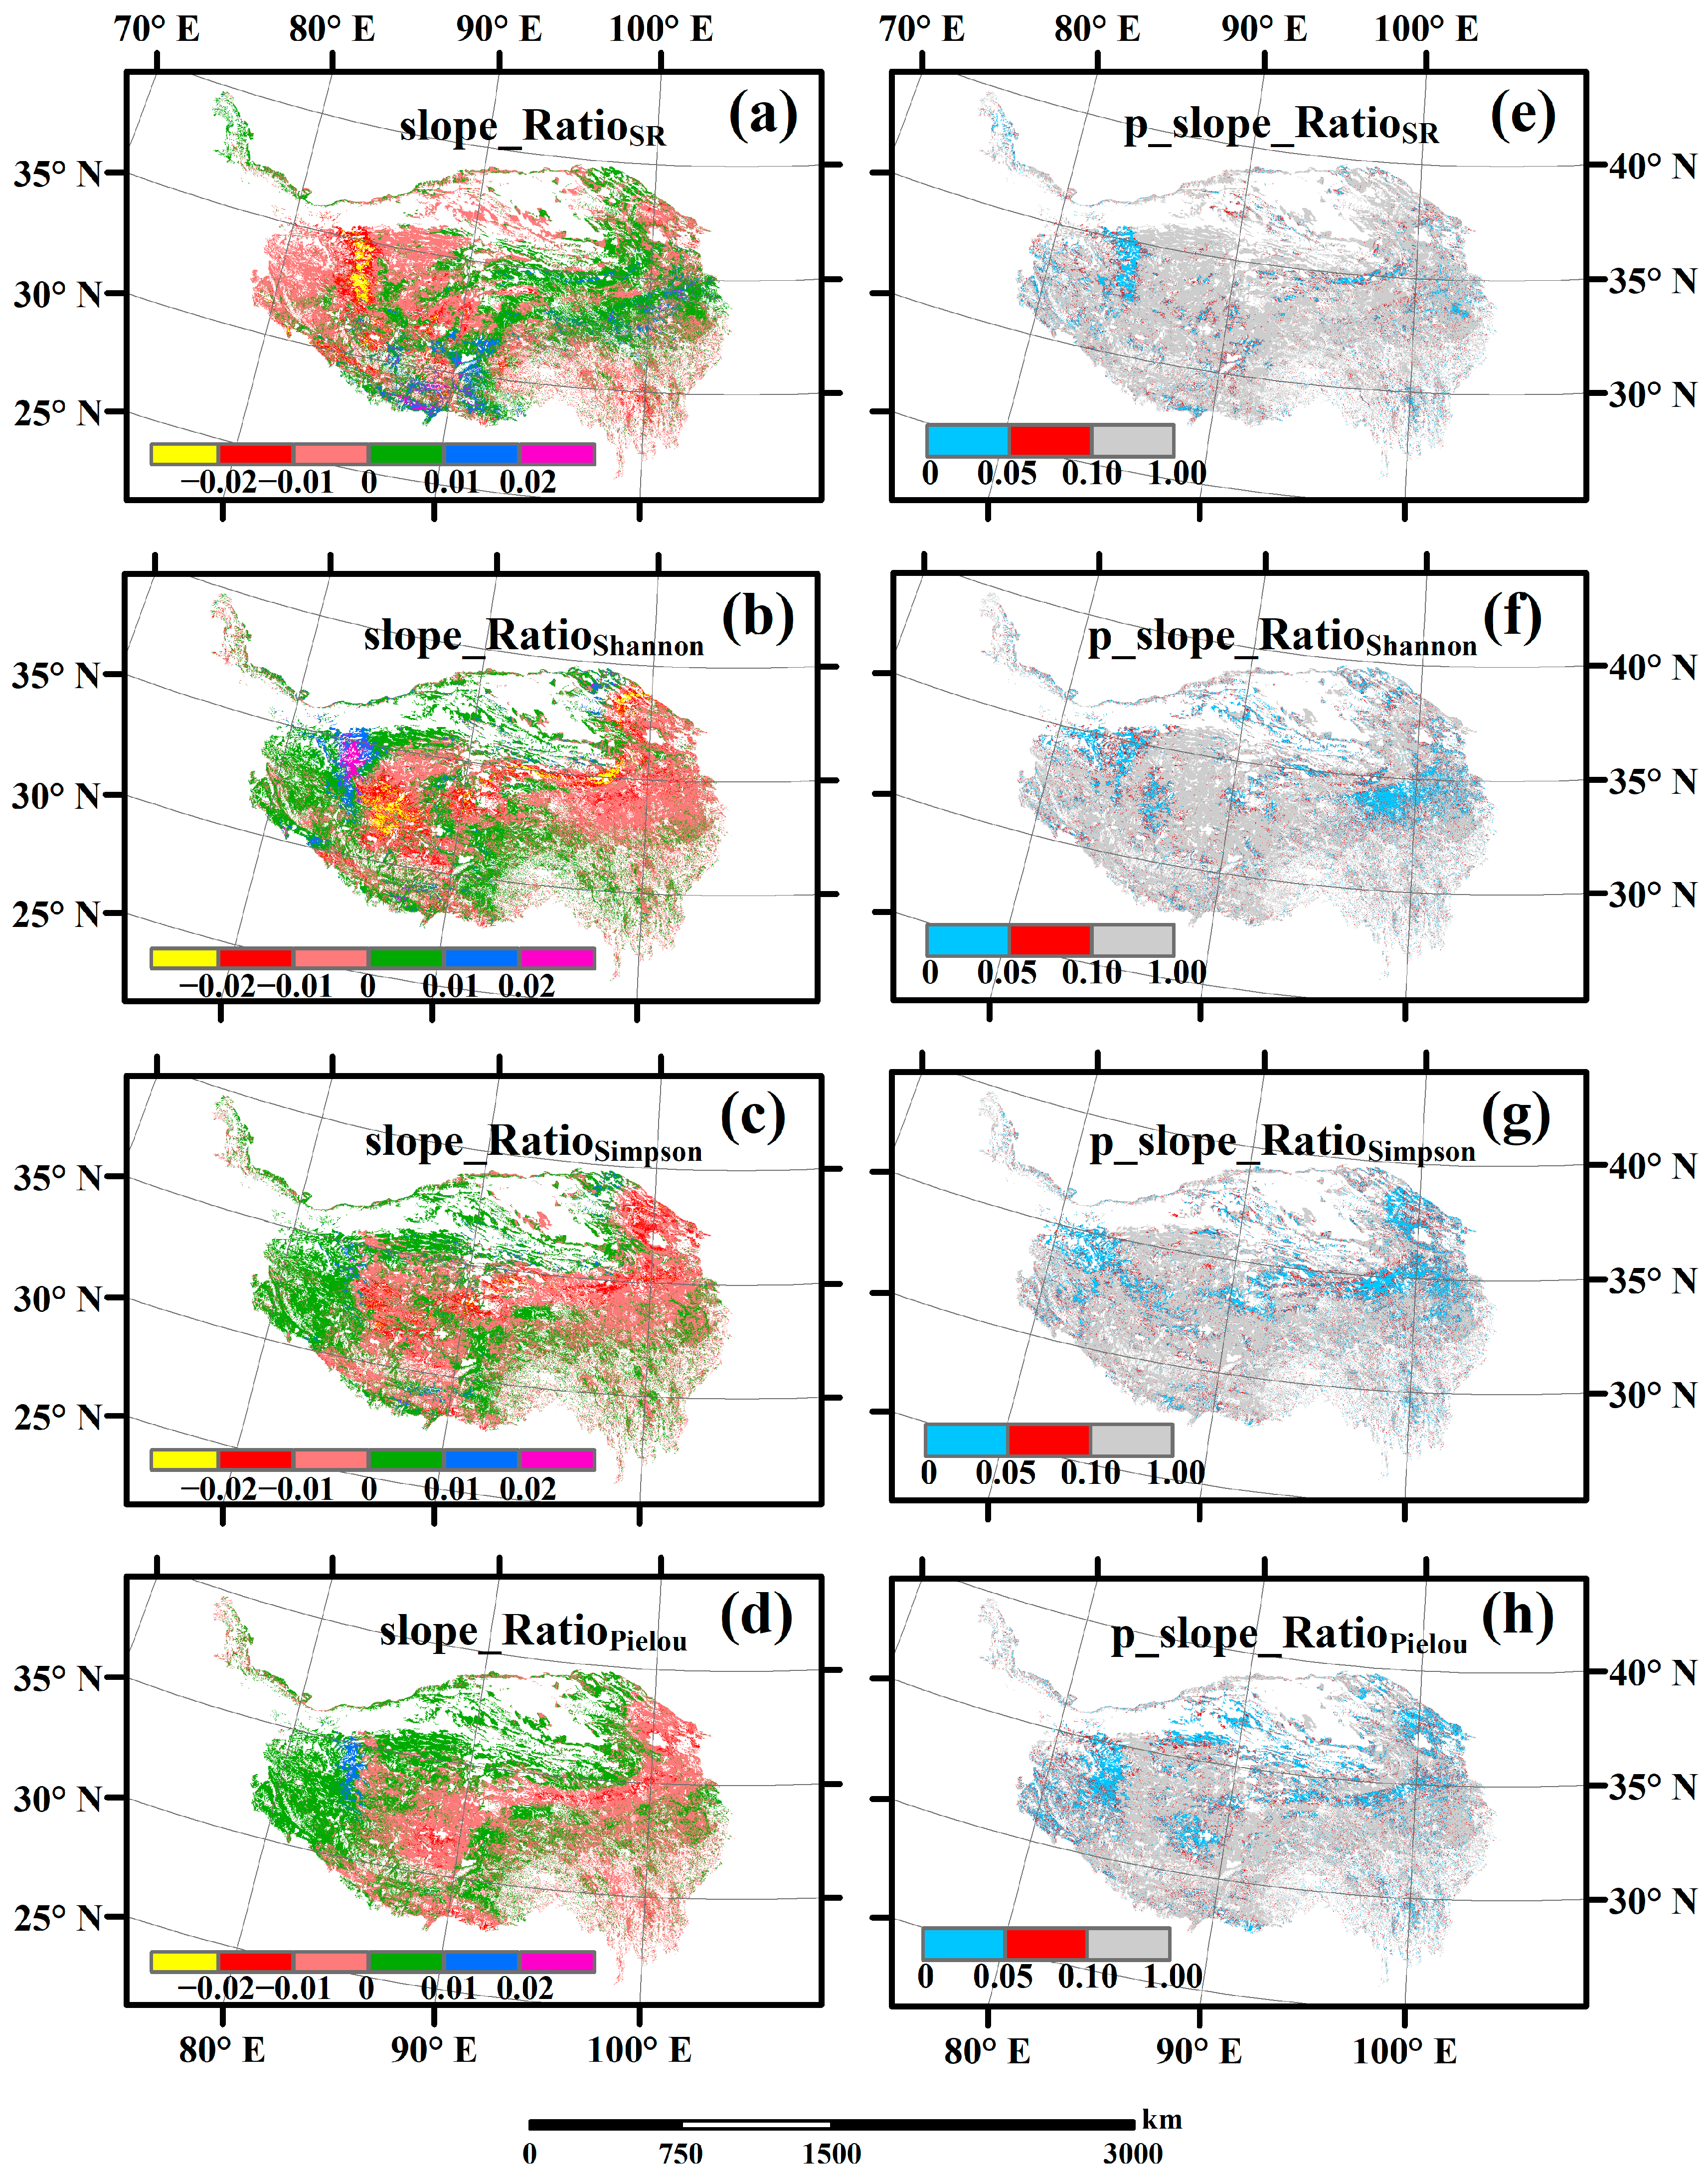
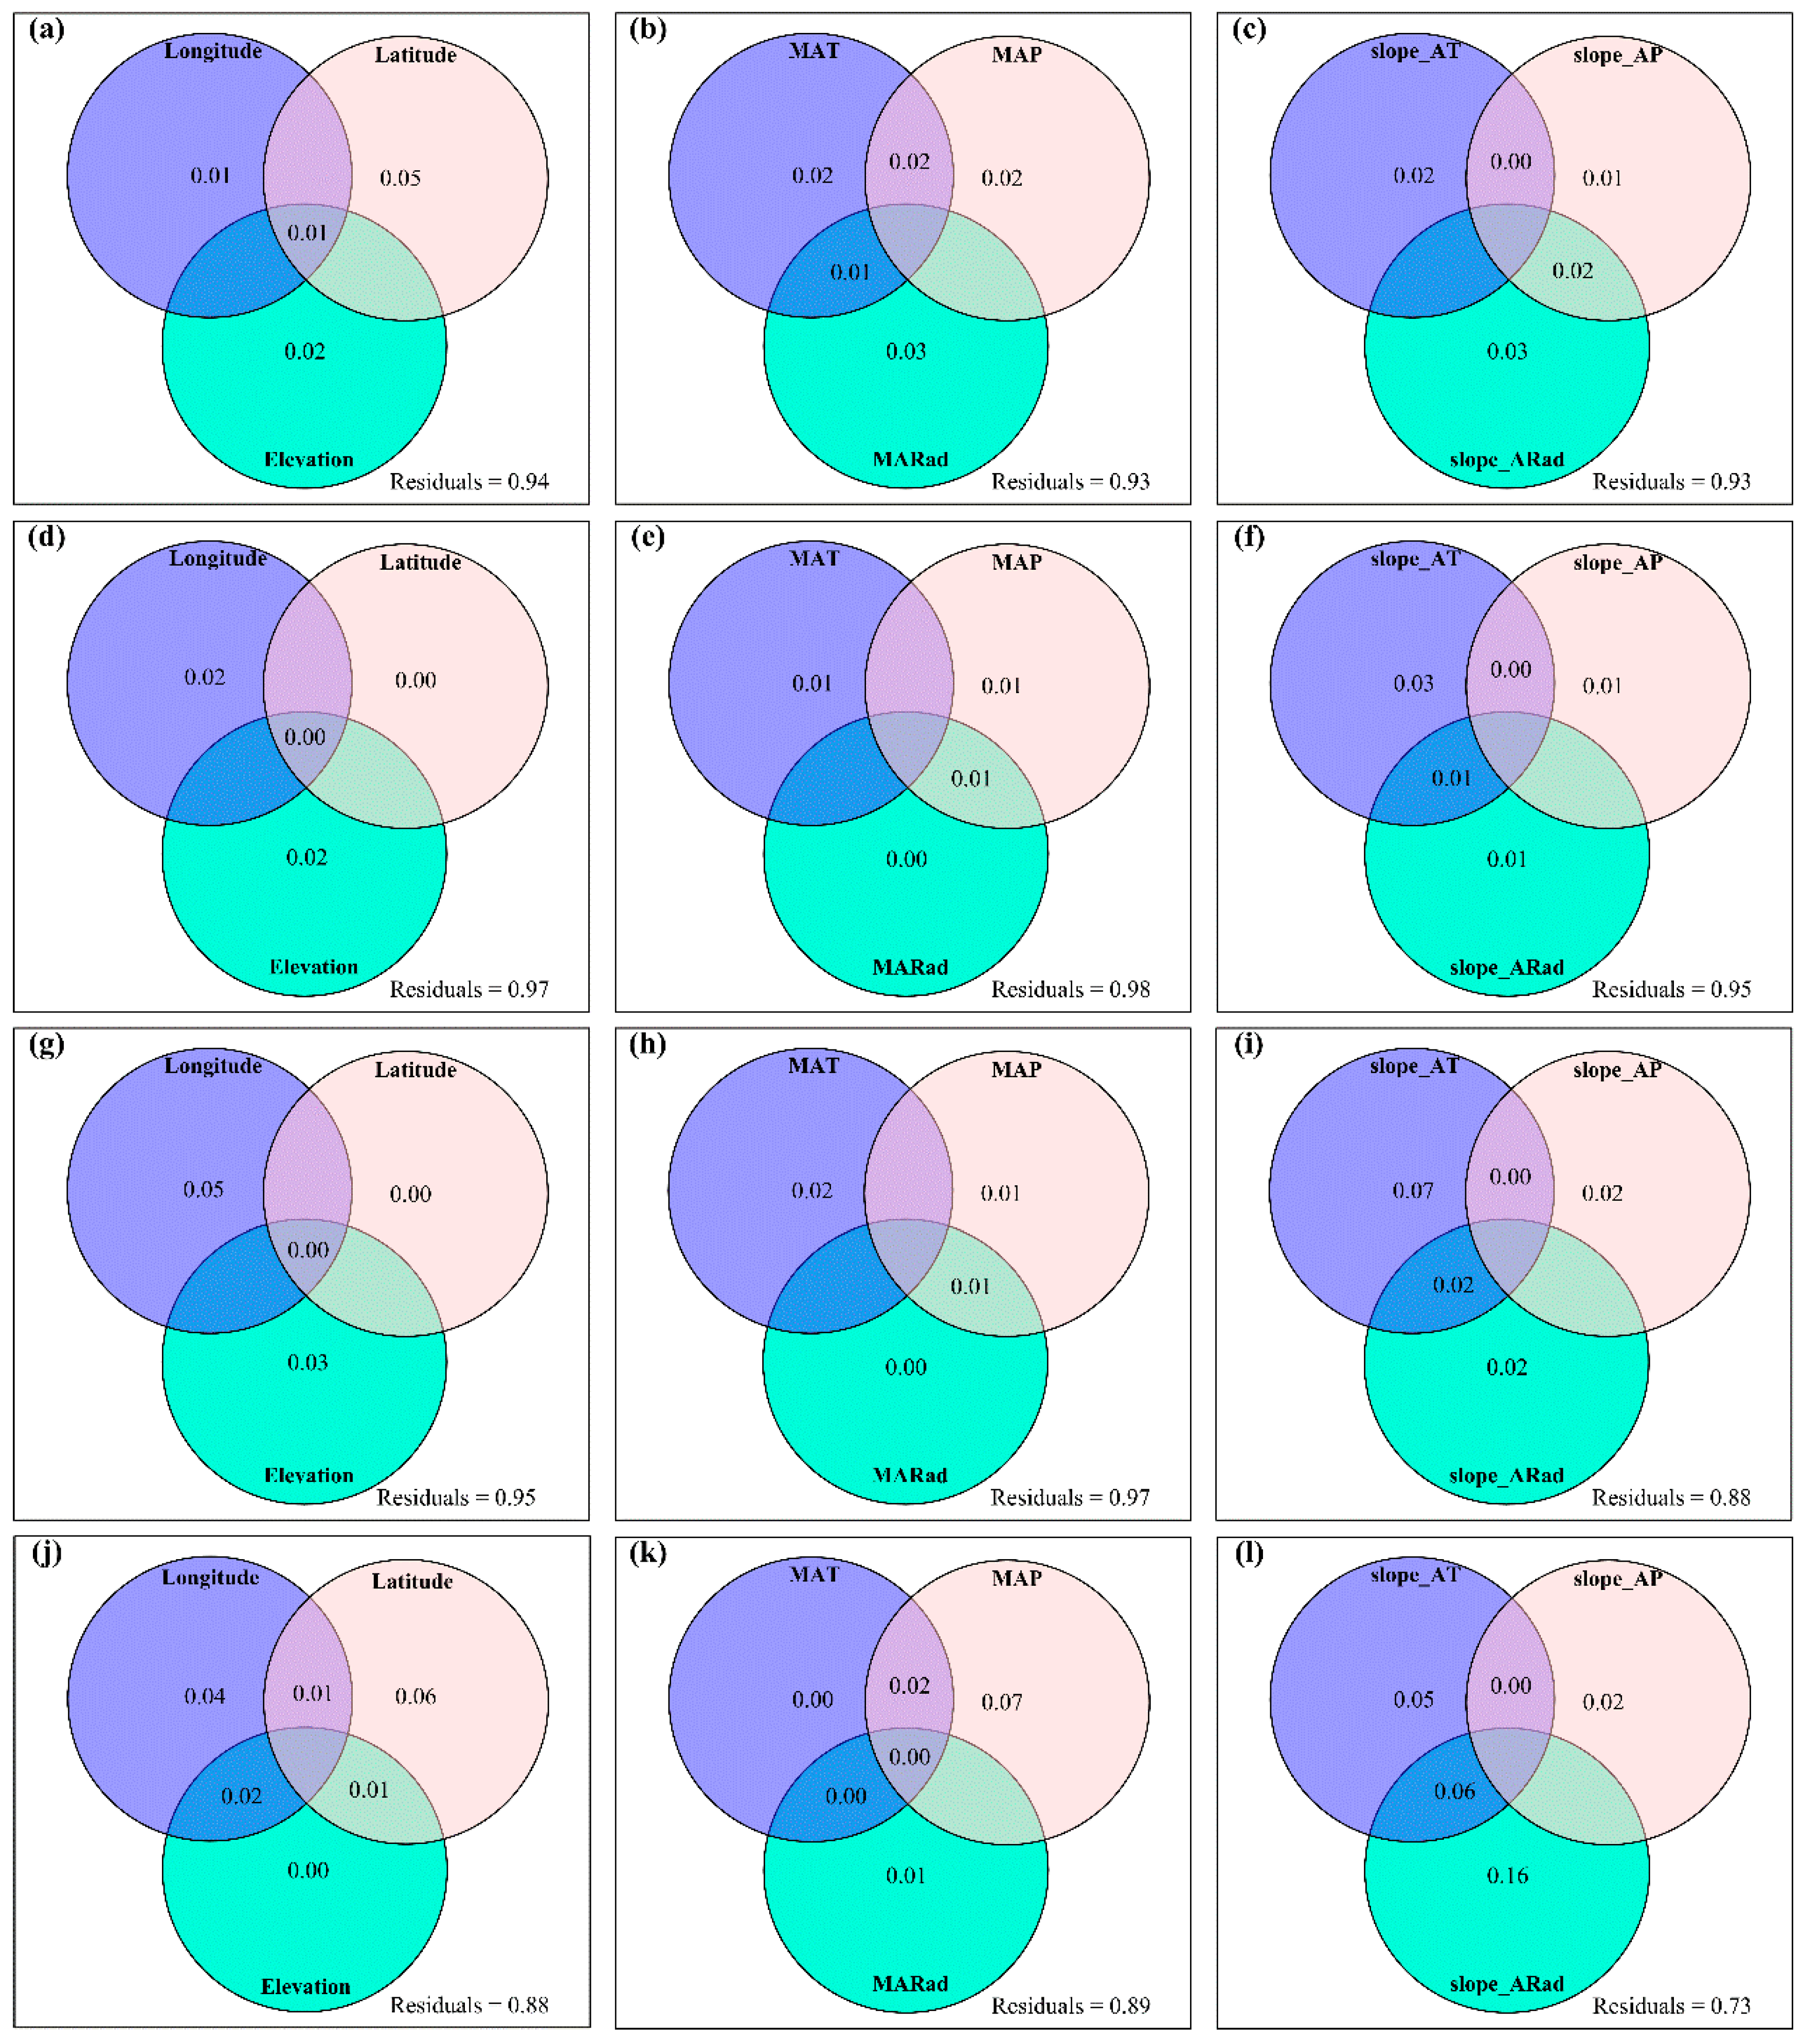
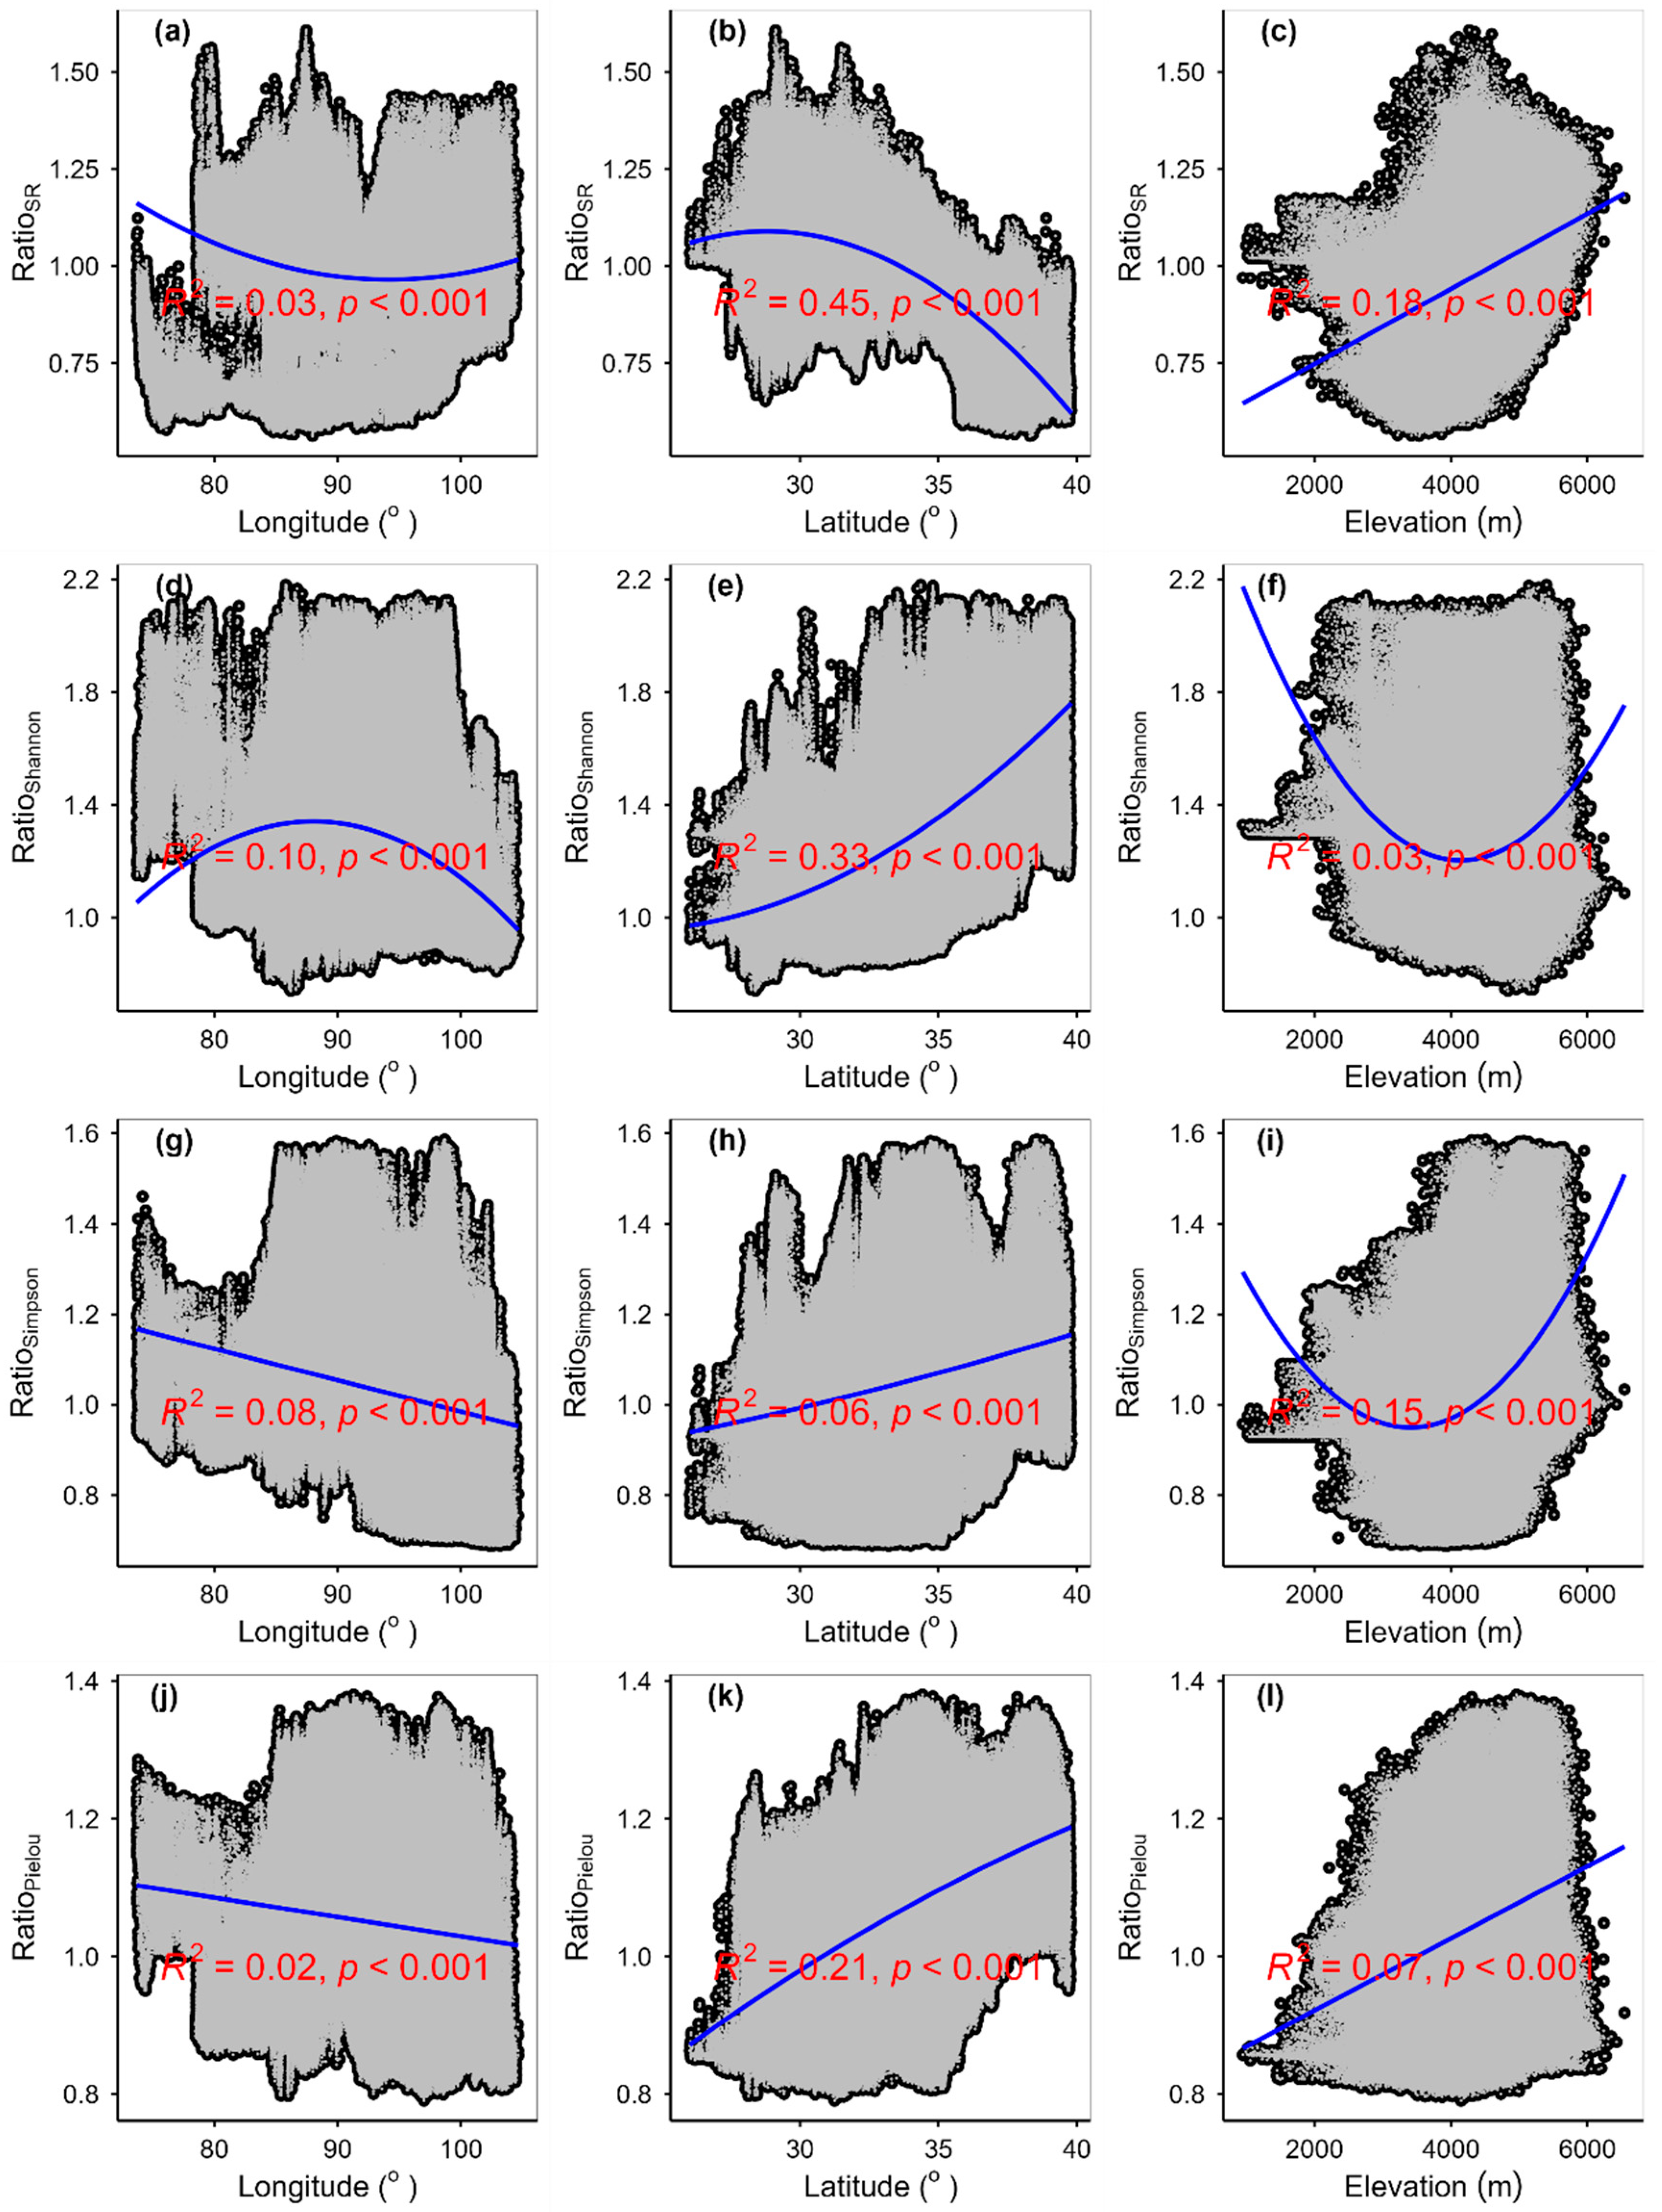
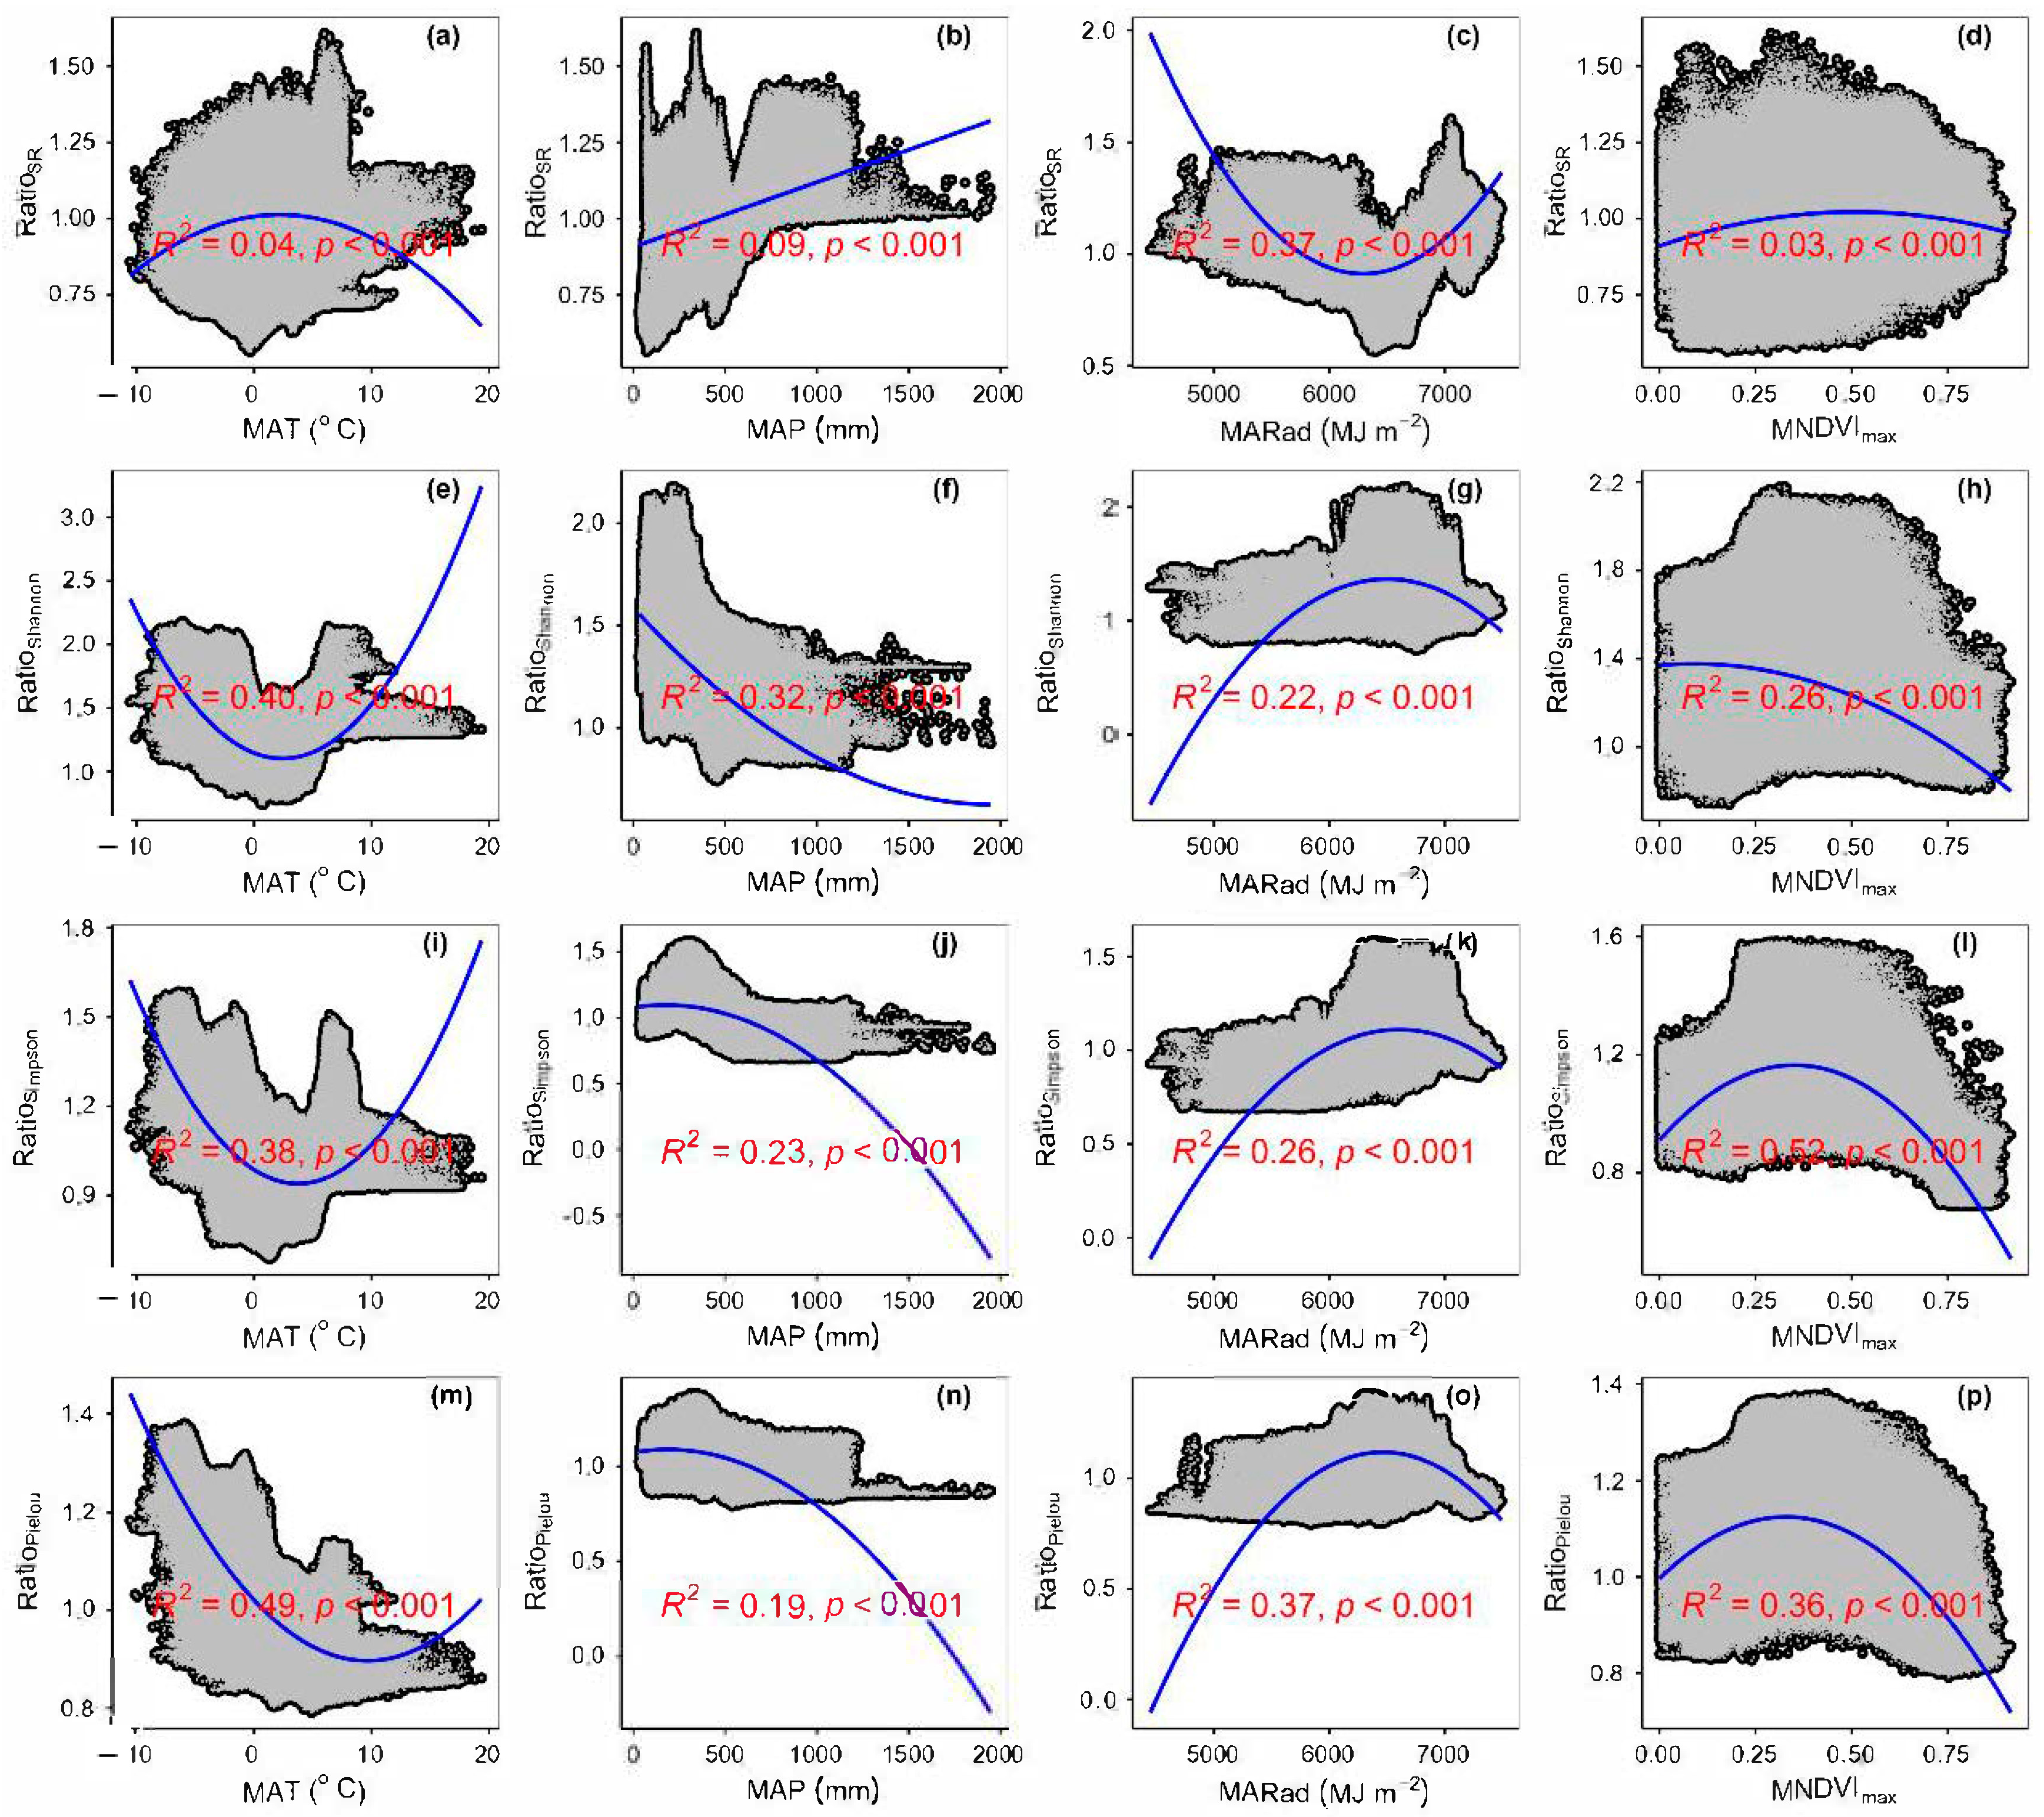
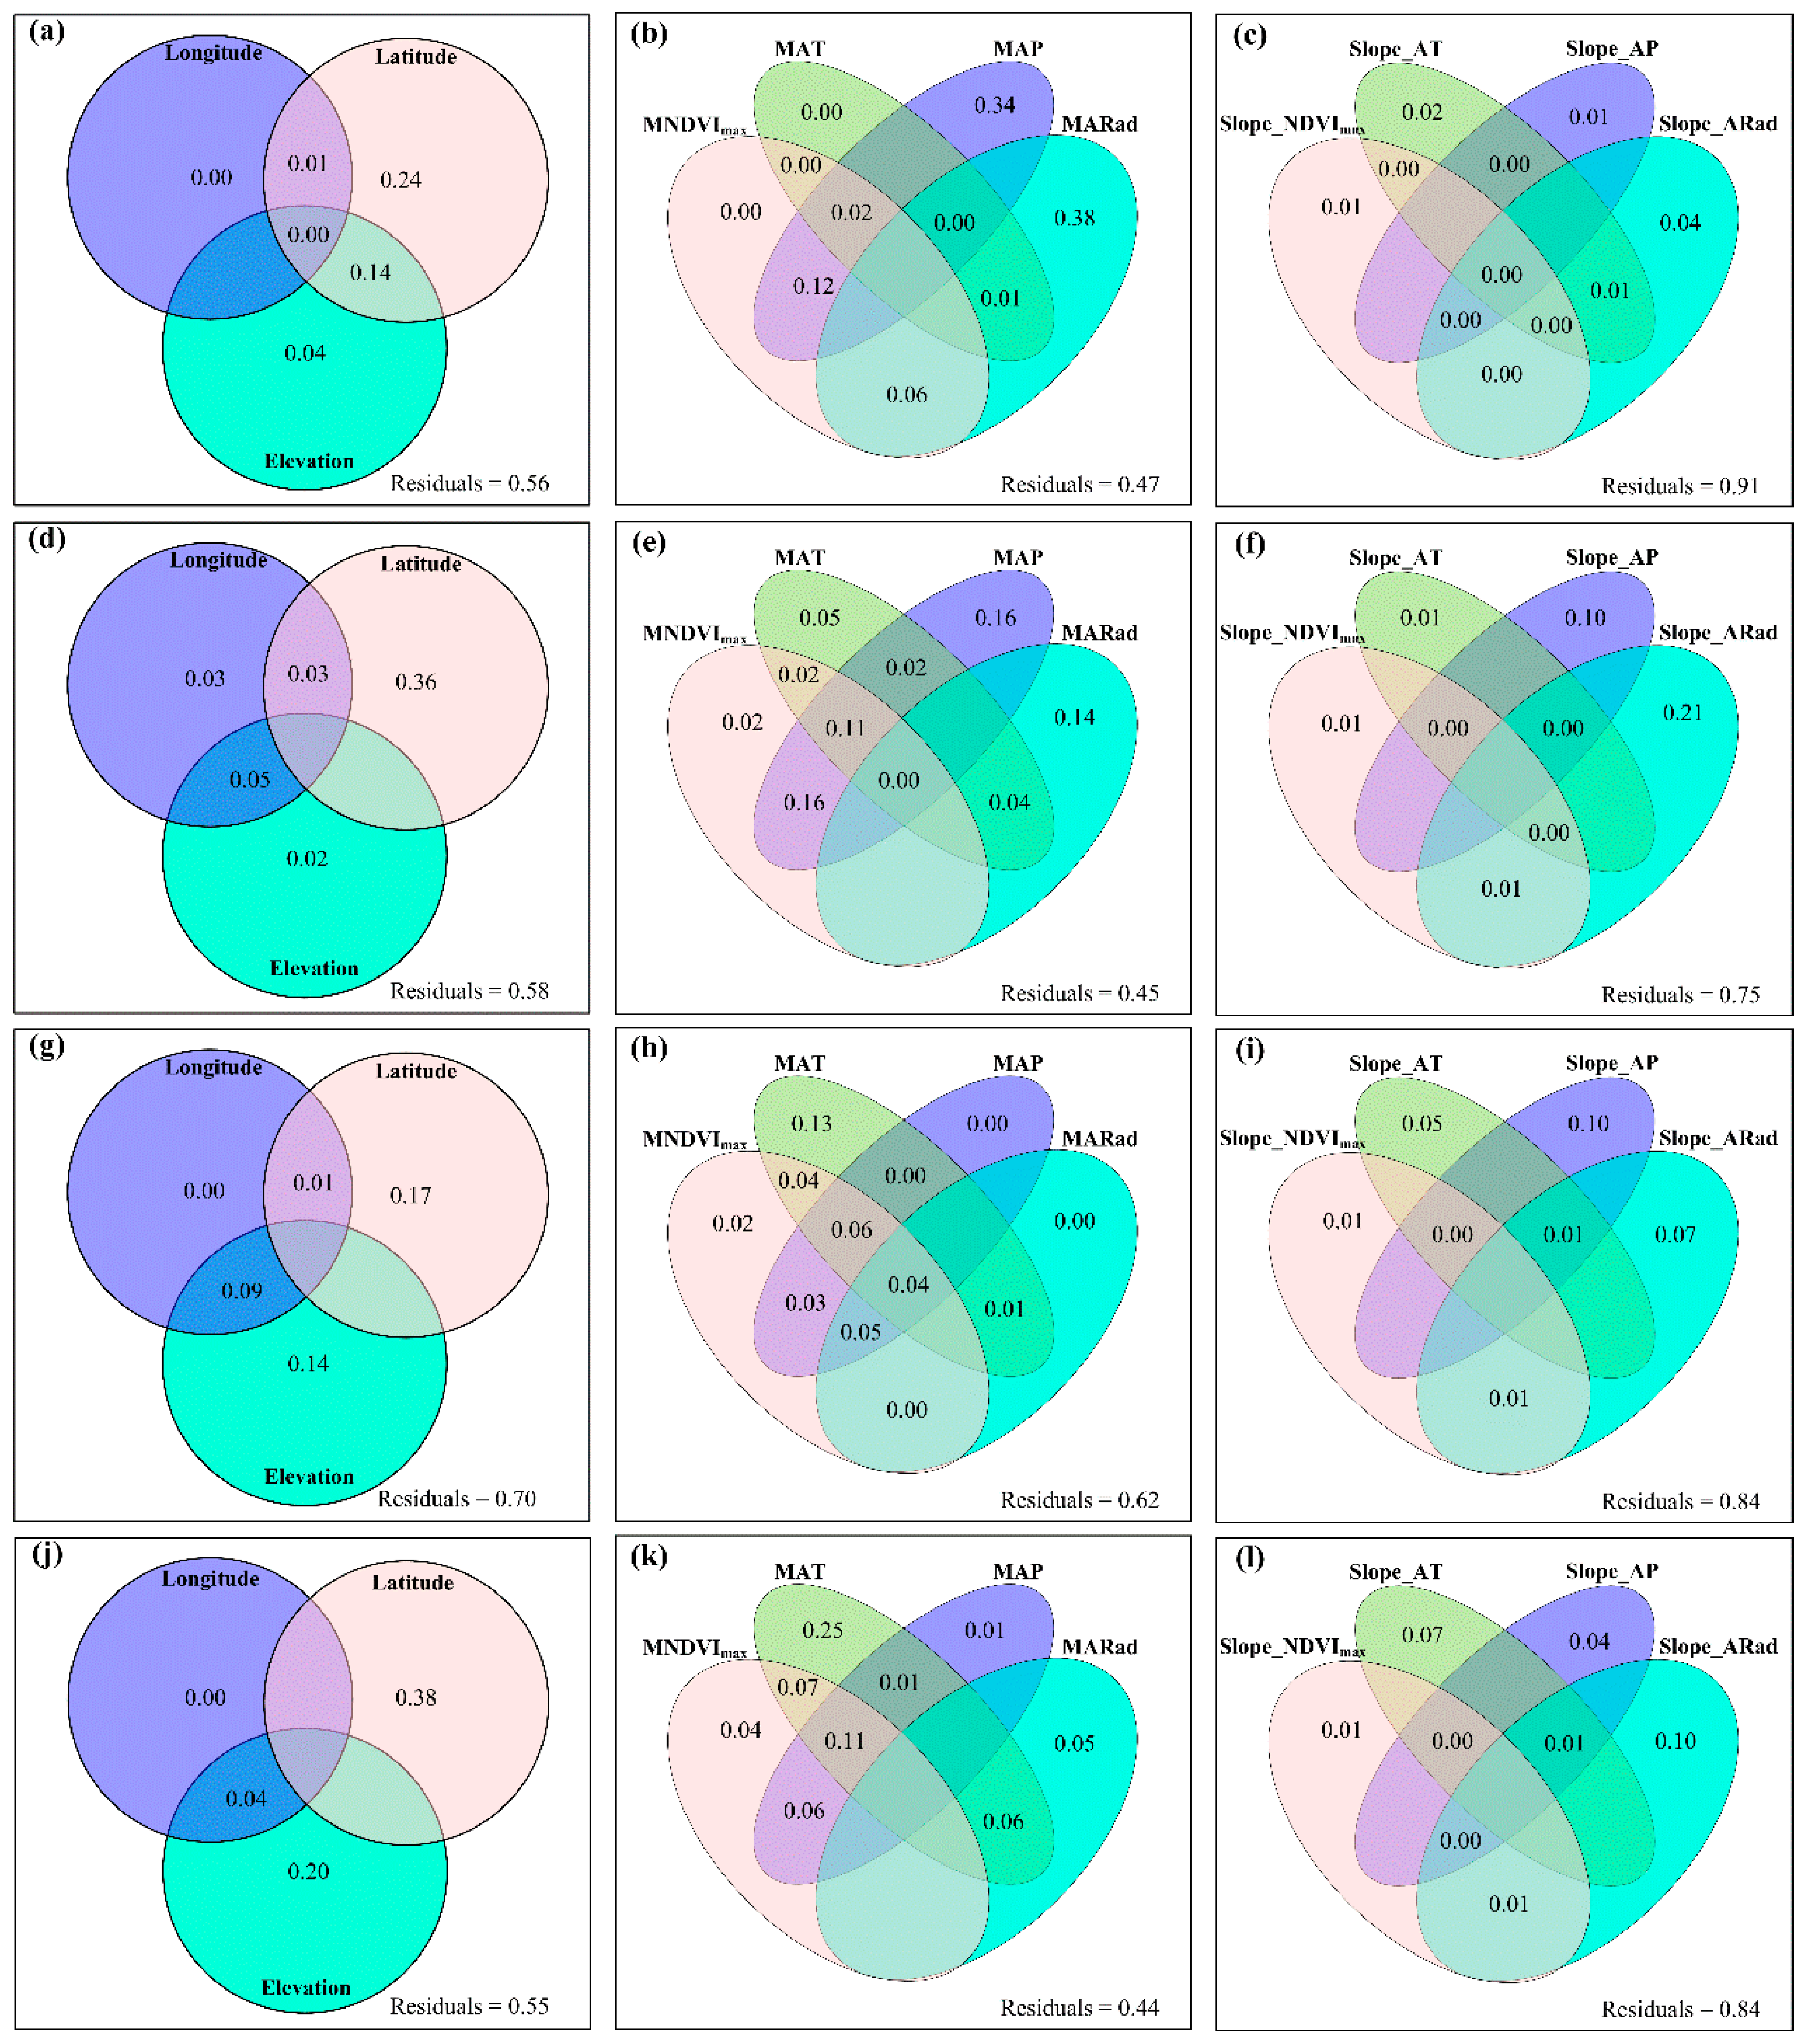
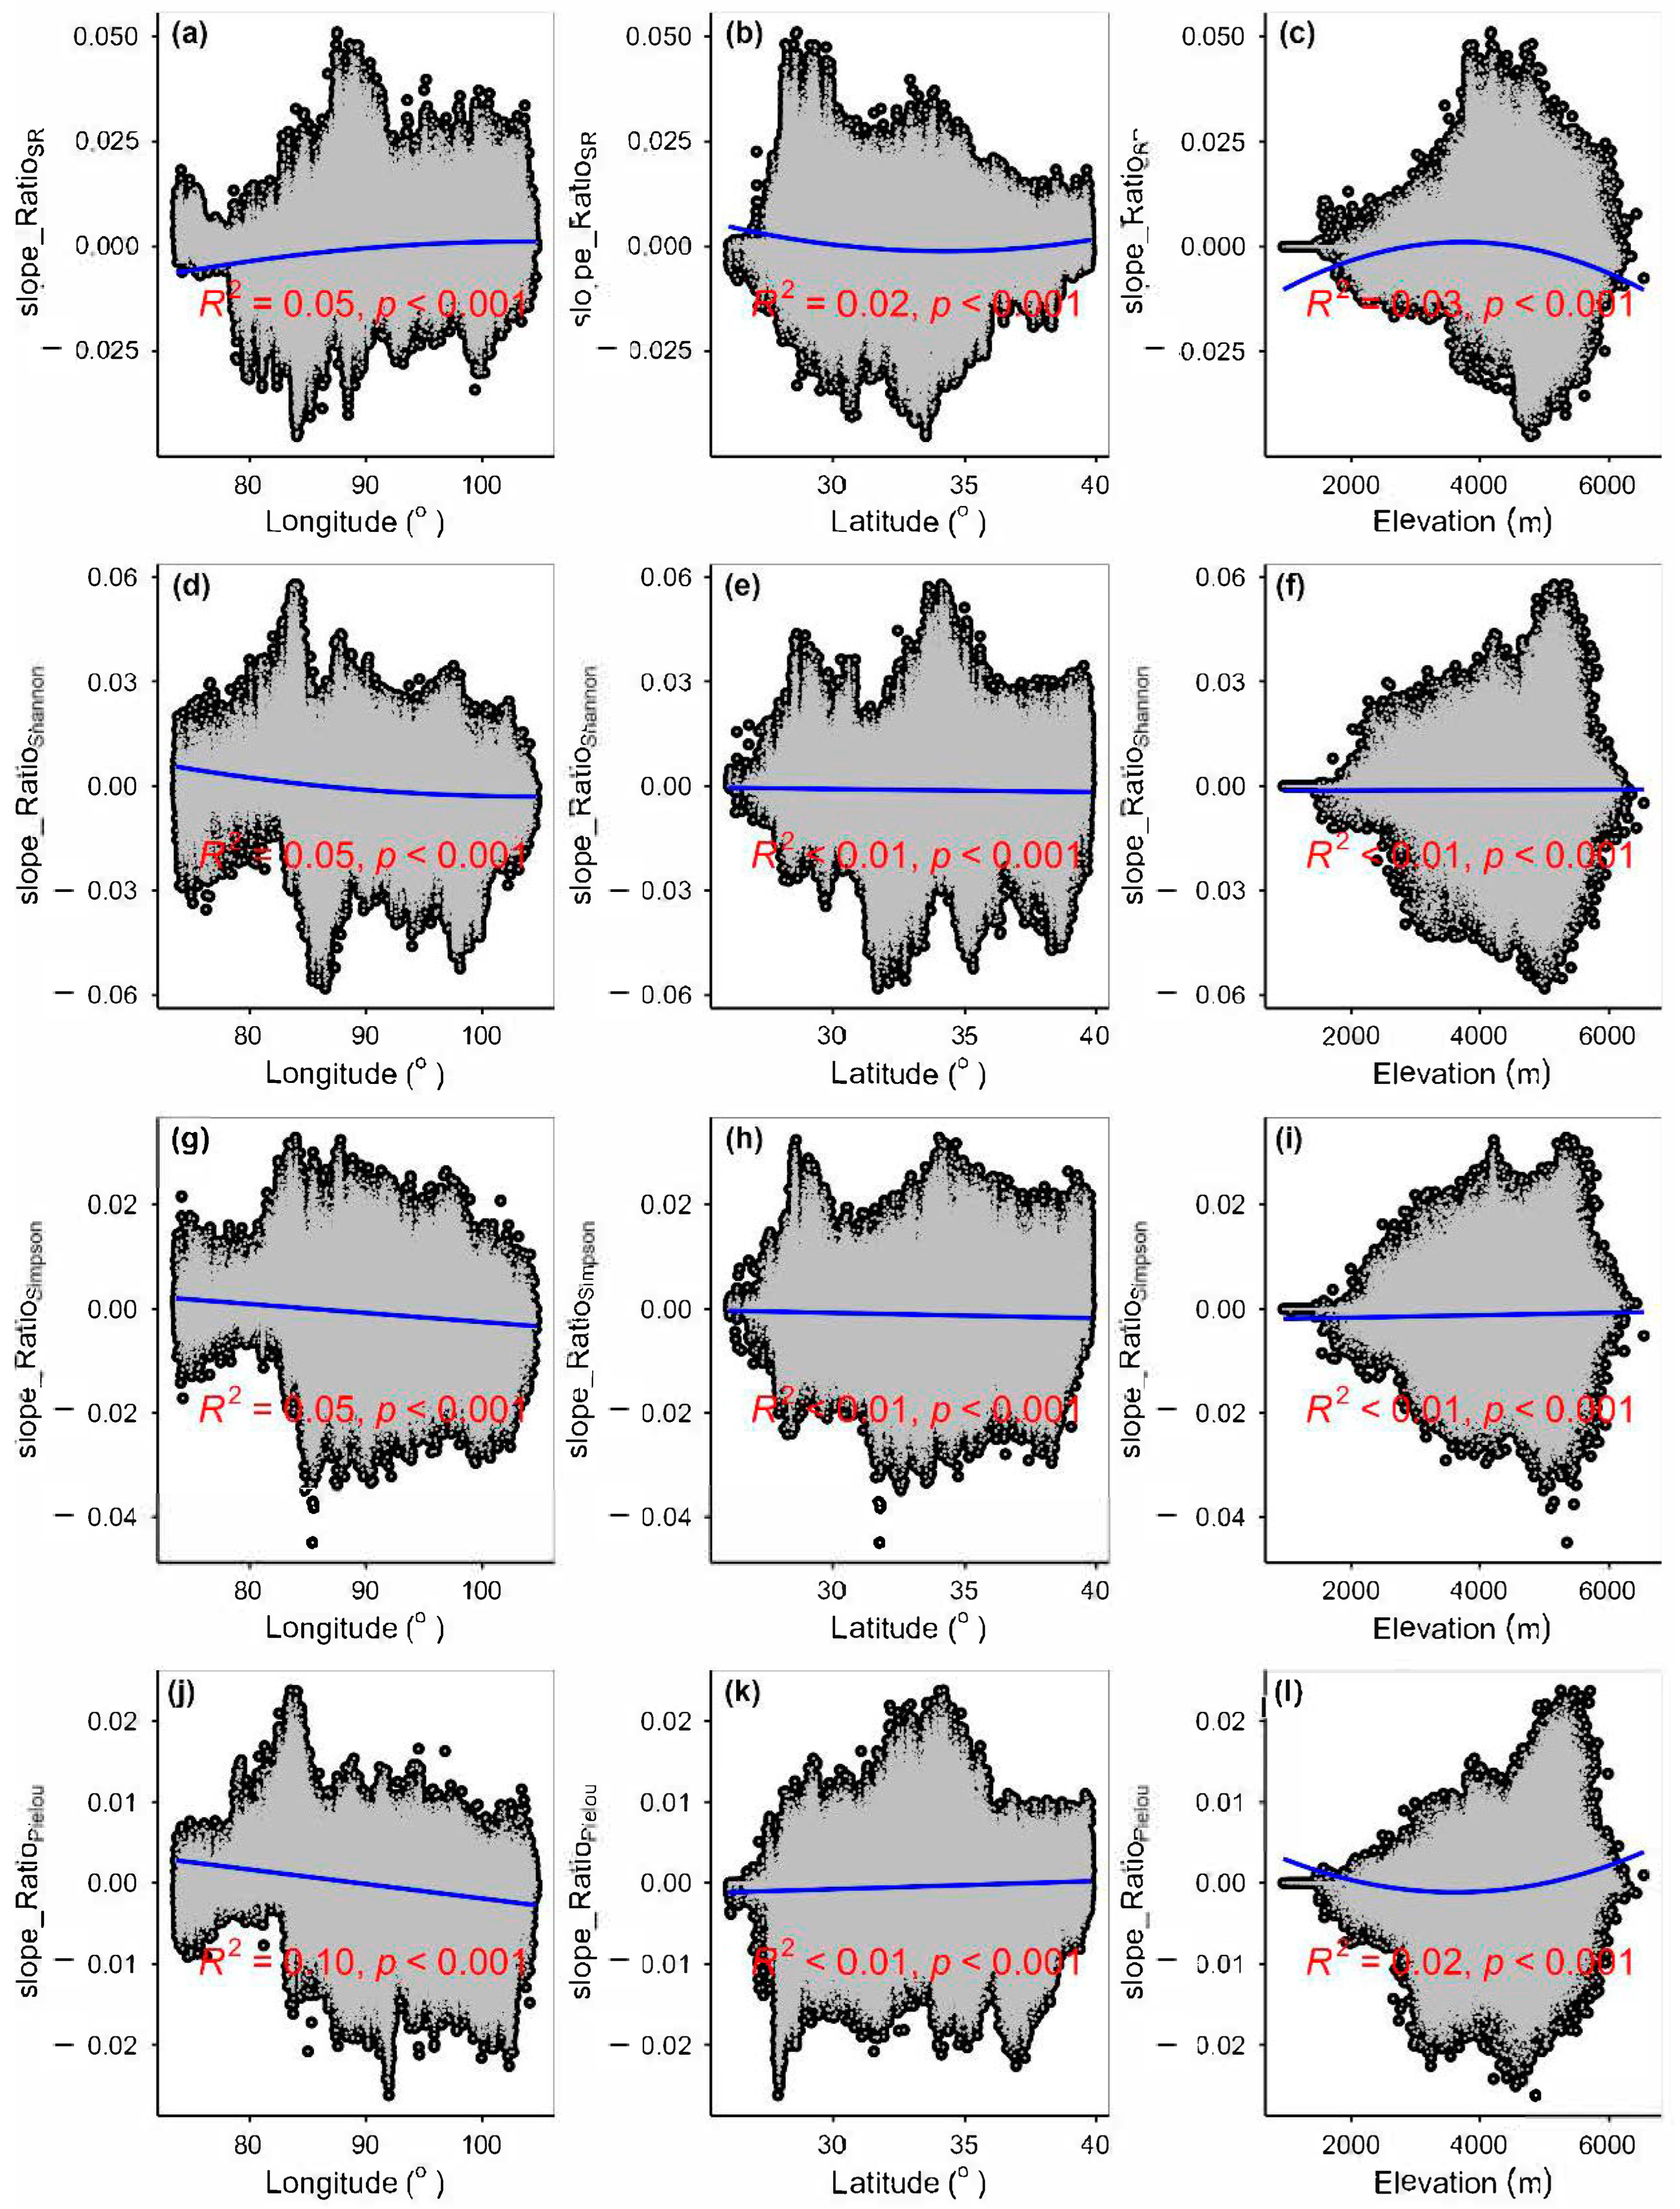
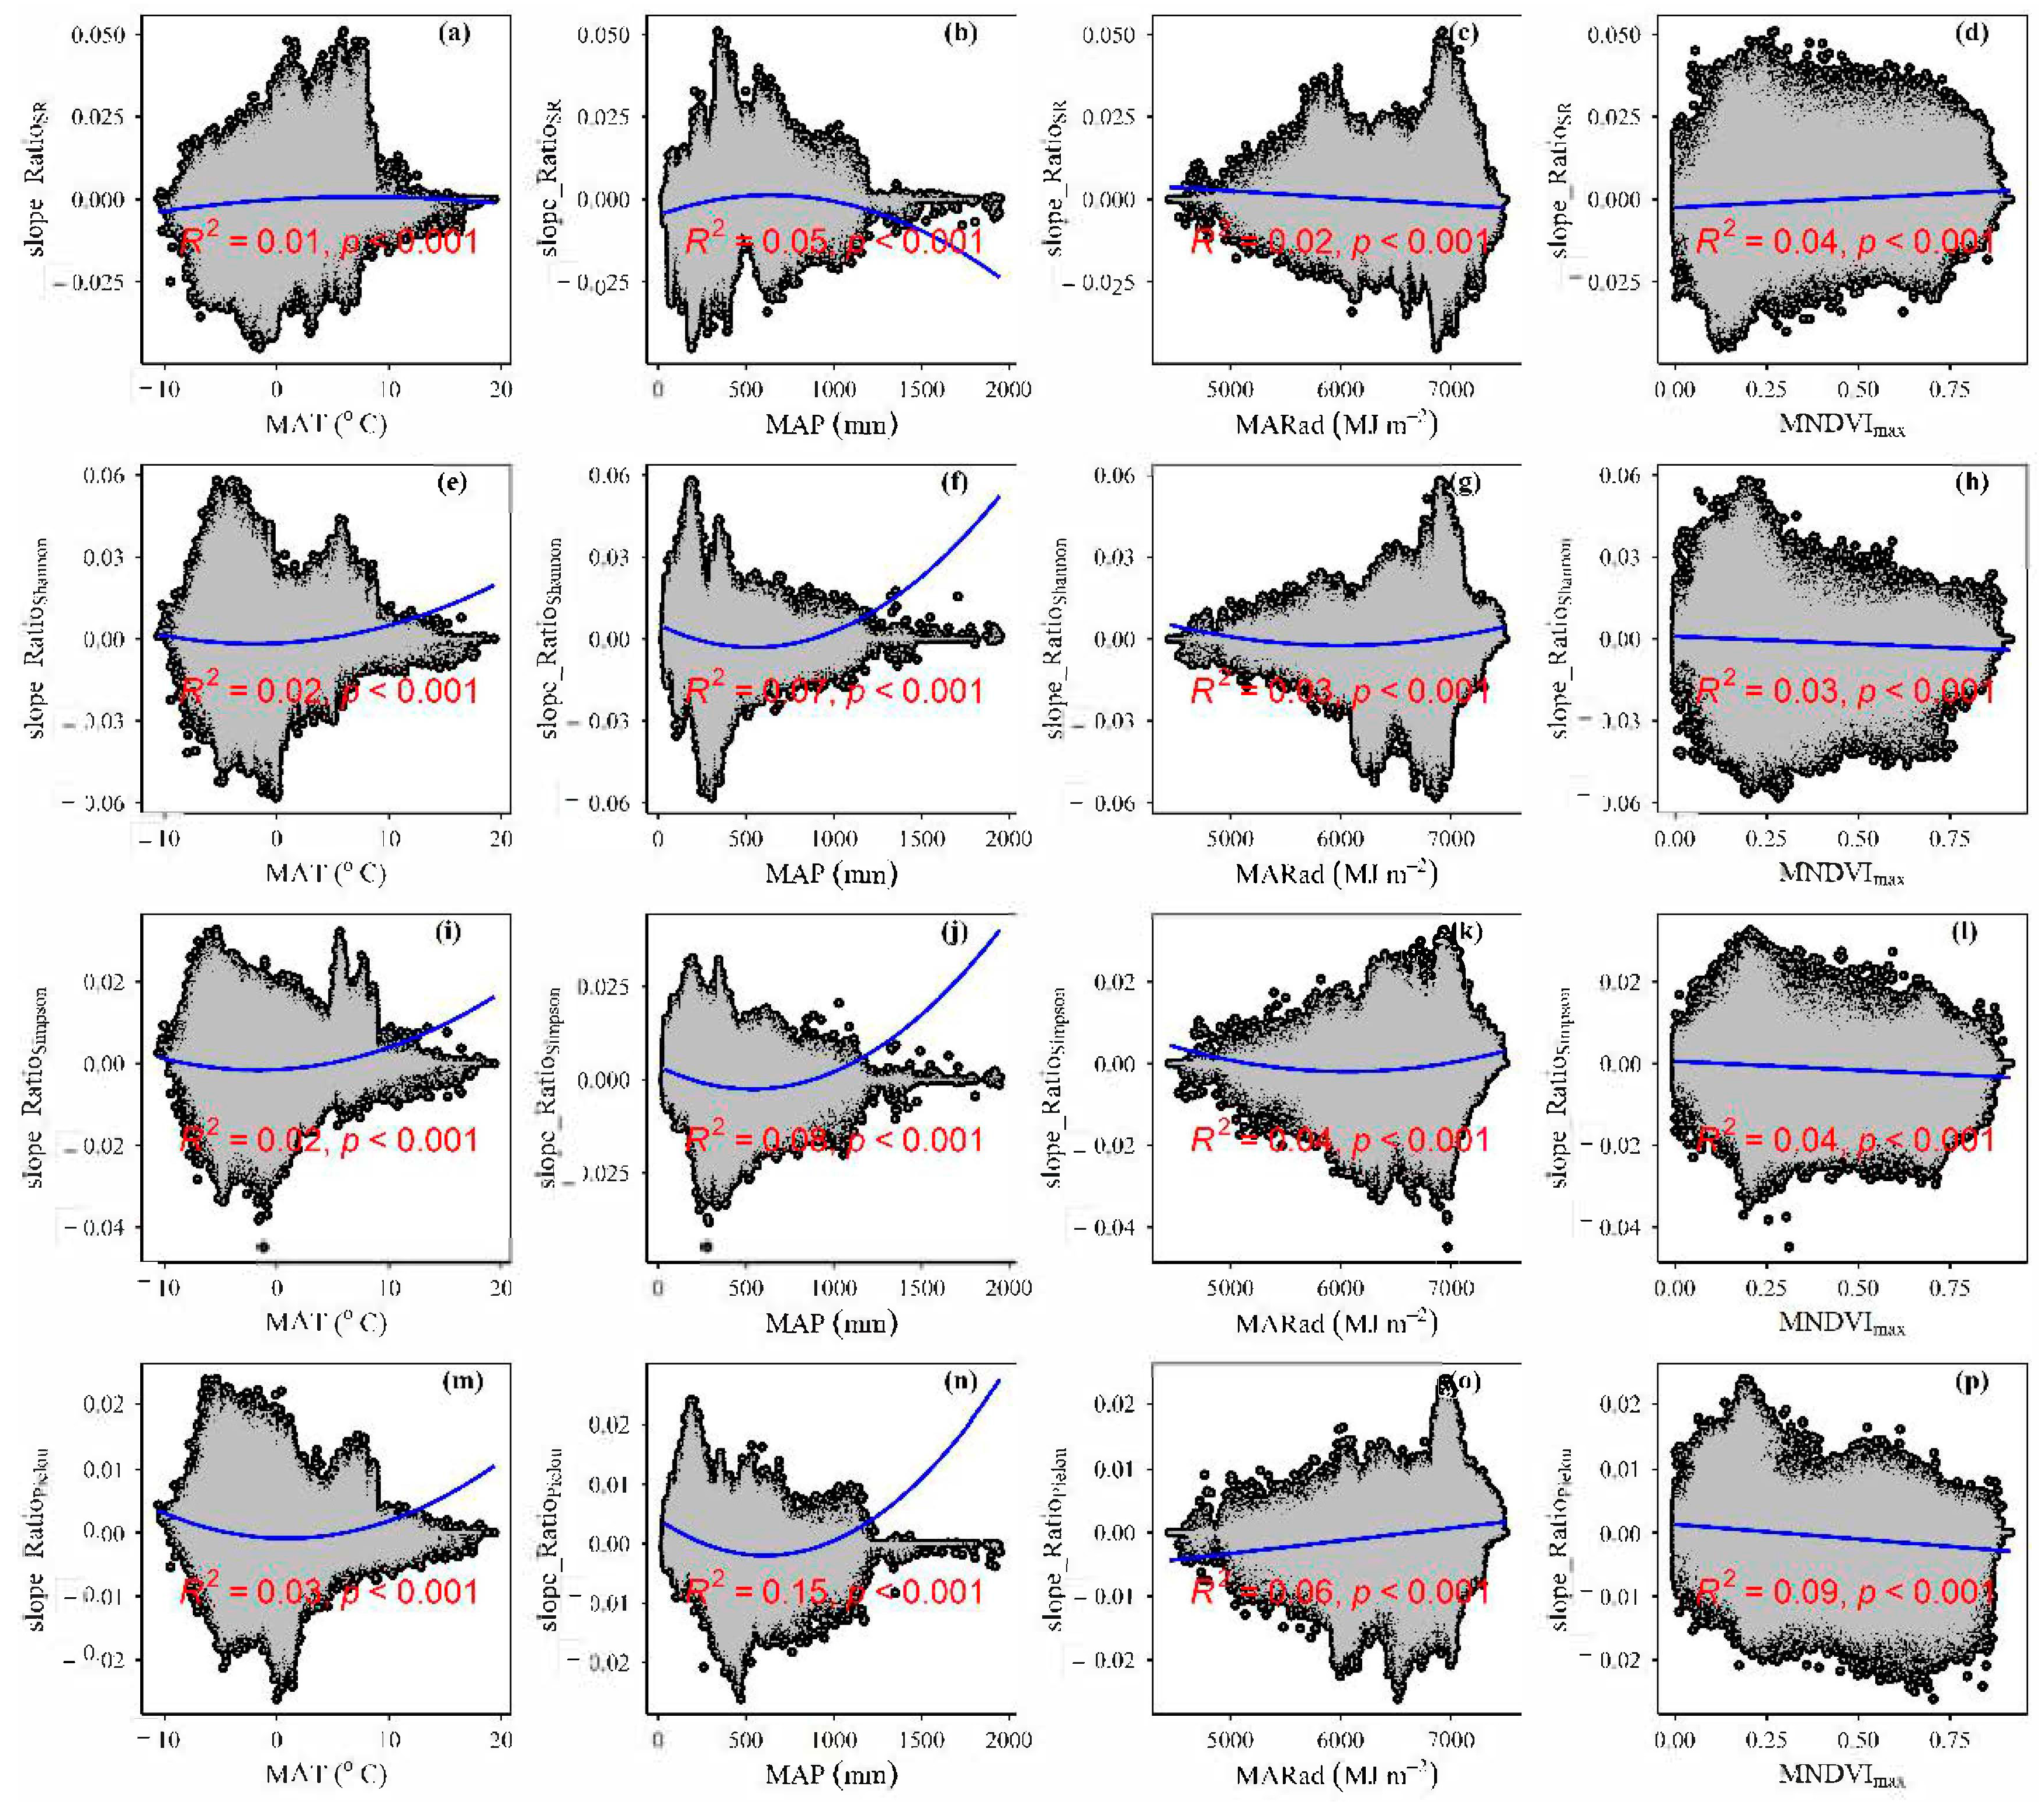
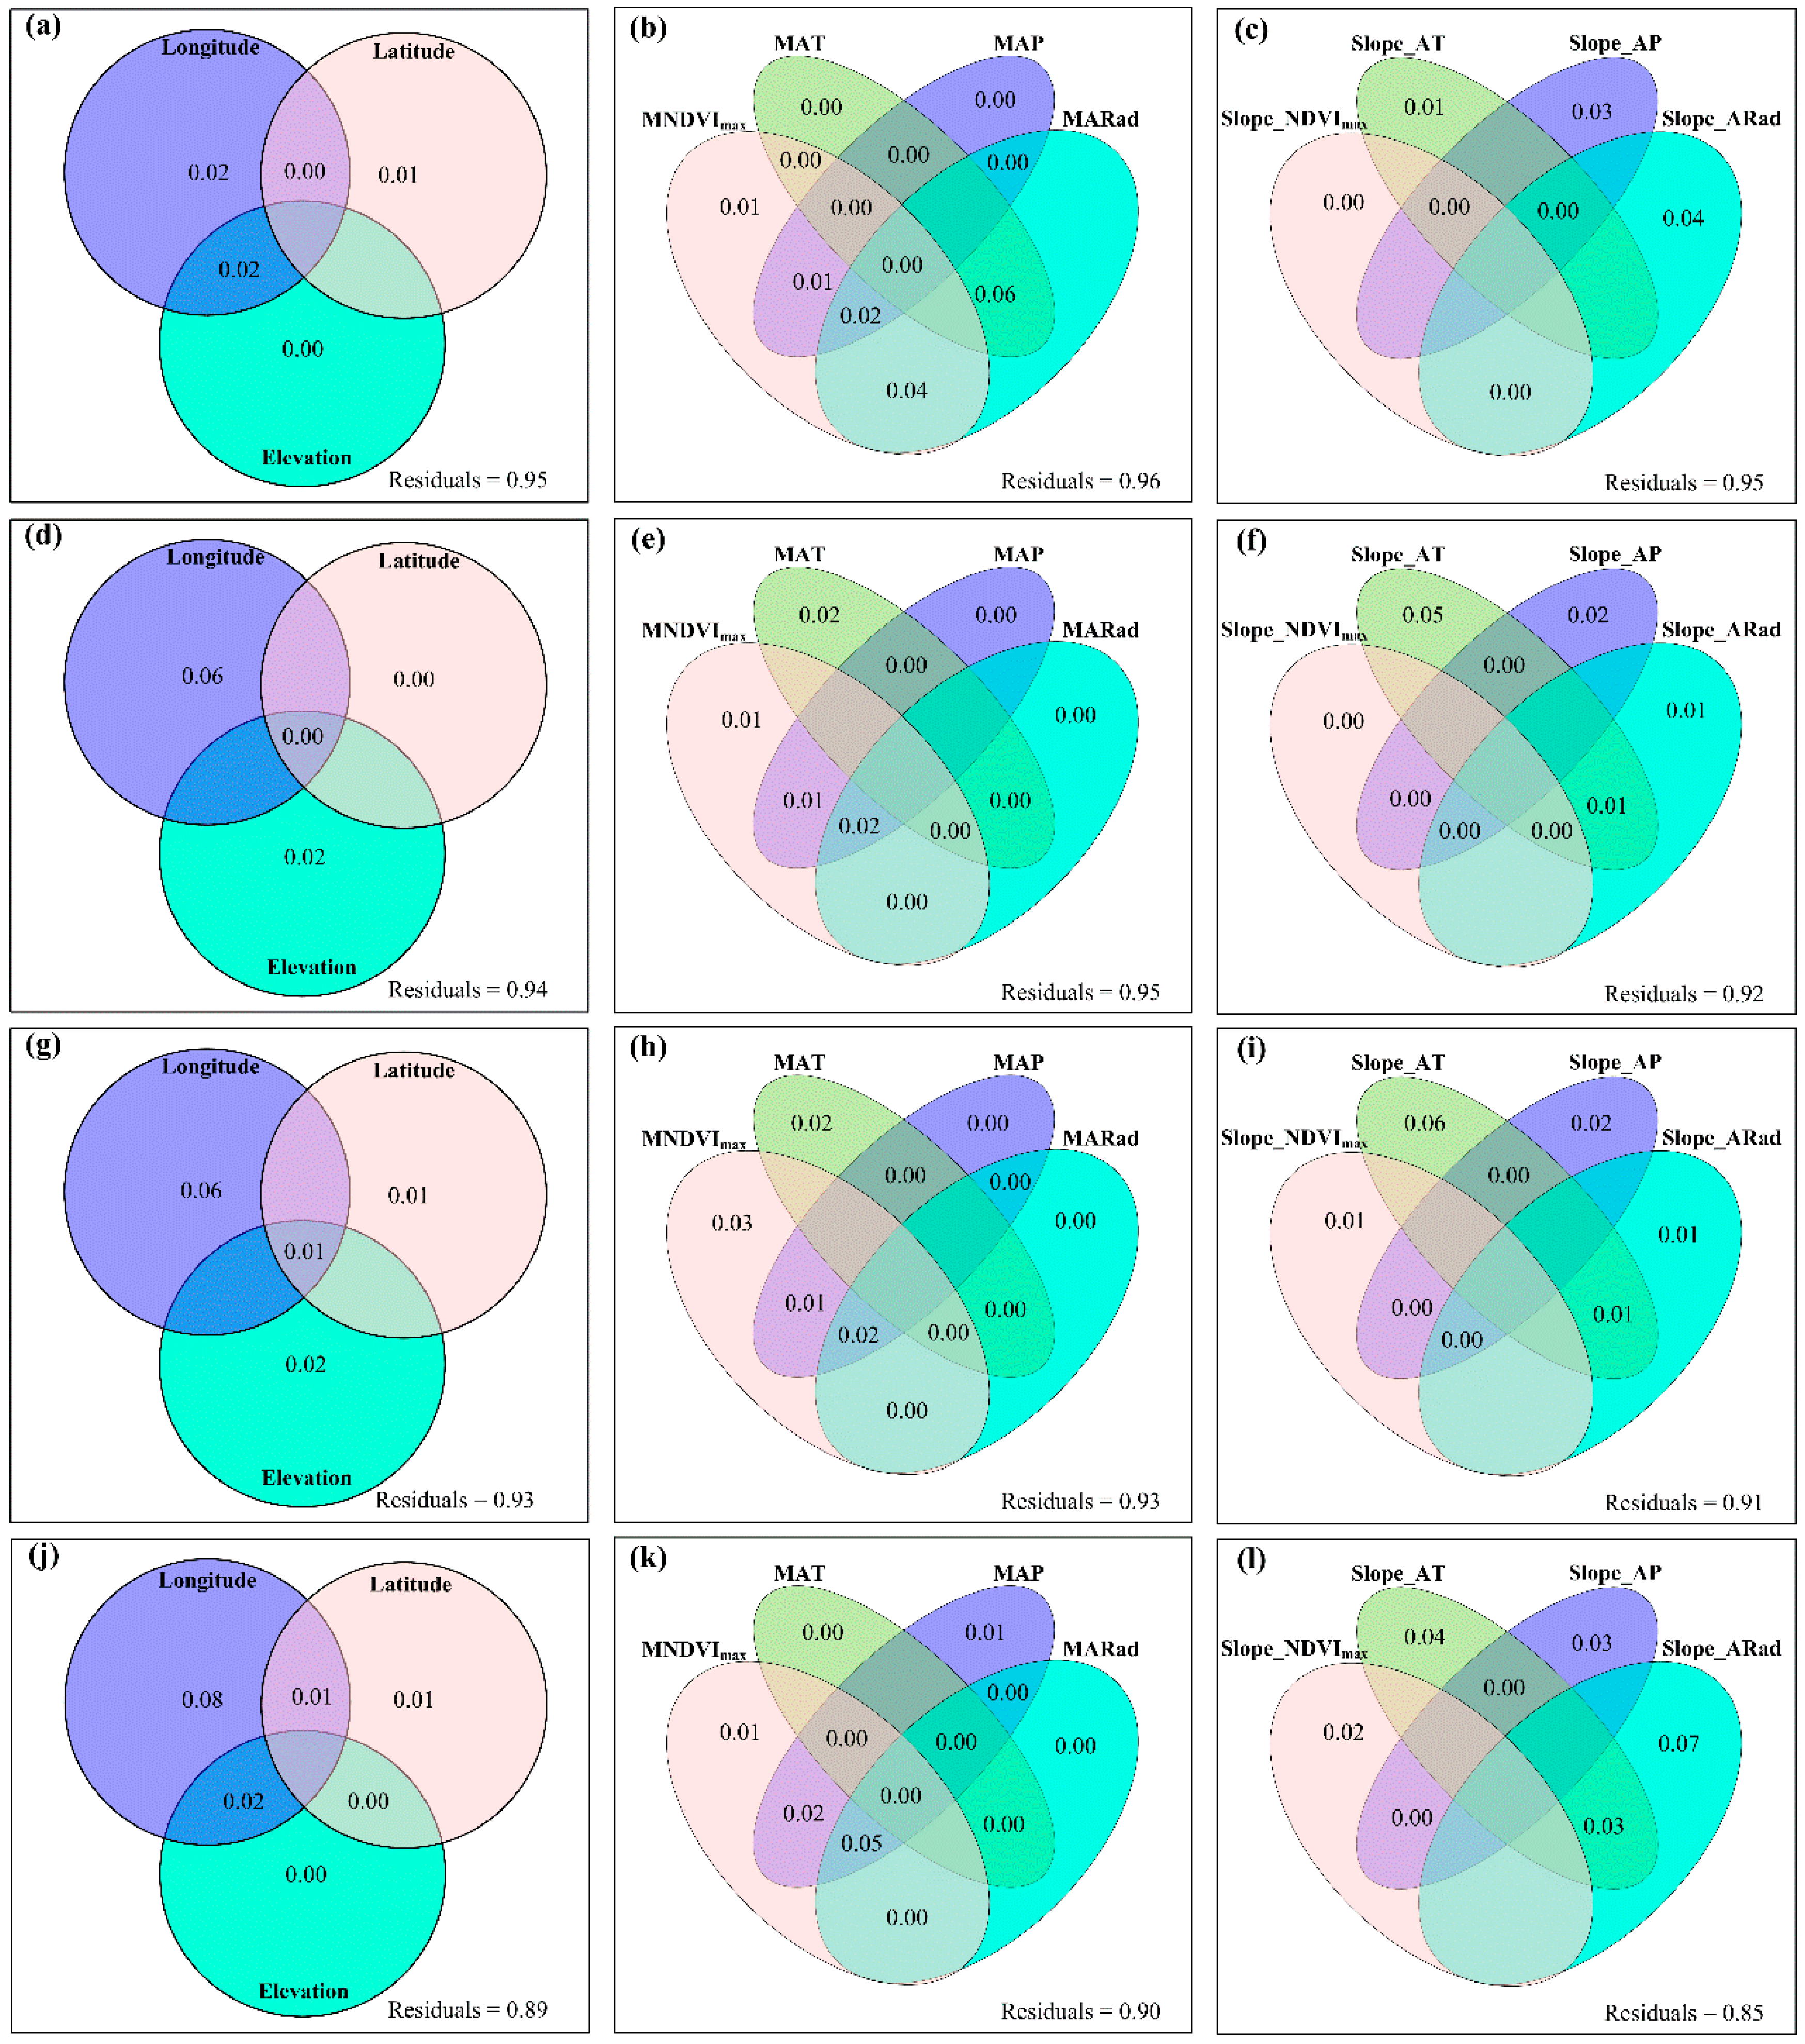
3.3. Spatial Variations of RSR, RShannon, RSimpson and RPielou, and Their Correlations with Environmental Factors

The spatial average values of the human activities’ effects on plant species richness, Shannon, Simpson and Pielou were 0.99, 1.26, 1.04 and 1.05, respectively (Figure 4). On average, there were 46.51%, 81.08%, 61.26% and 61.10% areas showing the positive effects of human activities on plant species richness, Shannon, Simpson and Pielou, respectively (Figure 4). The effects of human activities on plant α-diversity varied with grassland types (Table A2). For example, human activities increased plant species richness by 4% and 2% in alpine meadow-steppes and alpine meadows but decreased plant species richness by 1% and 3% in alpine steppes and alpine desert-steppes, respectively (Table A2).
Longitude, latitude, elevation, MAT, MAP, MARad, MNDVImax, slope_AT, slope_AP, slope_ARad and slope_NDVImax significantly explained the spatial variations of human activities’ effects on plant species α-diversity, but their relative impacts were different (Figure A18, Figure A19, Figure A20 and Figure A21). Compared to longitude and elevation, latitude had a closer correlation with the spatial variations of human activities’ effects on plant species α-diversity (Figure A21). Compared to geography position and climate change + slope_NDVImax, mean climate conditions + NDVImax had greater exclusive impacts on the spatial variations of human activities’ effects on plant species α-diversity (Figure 5).

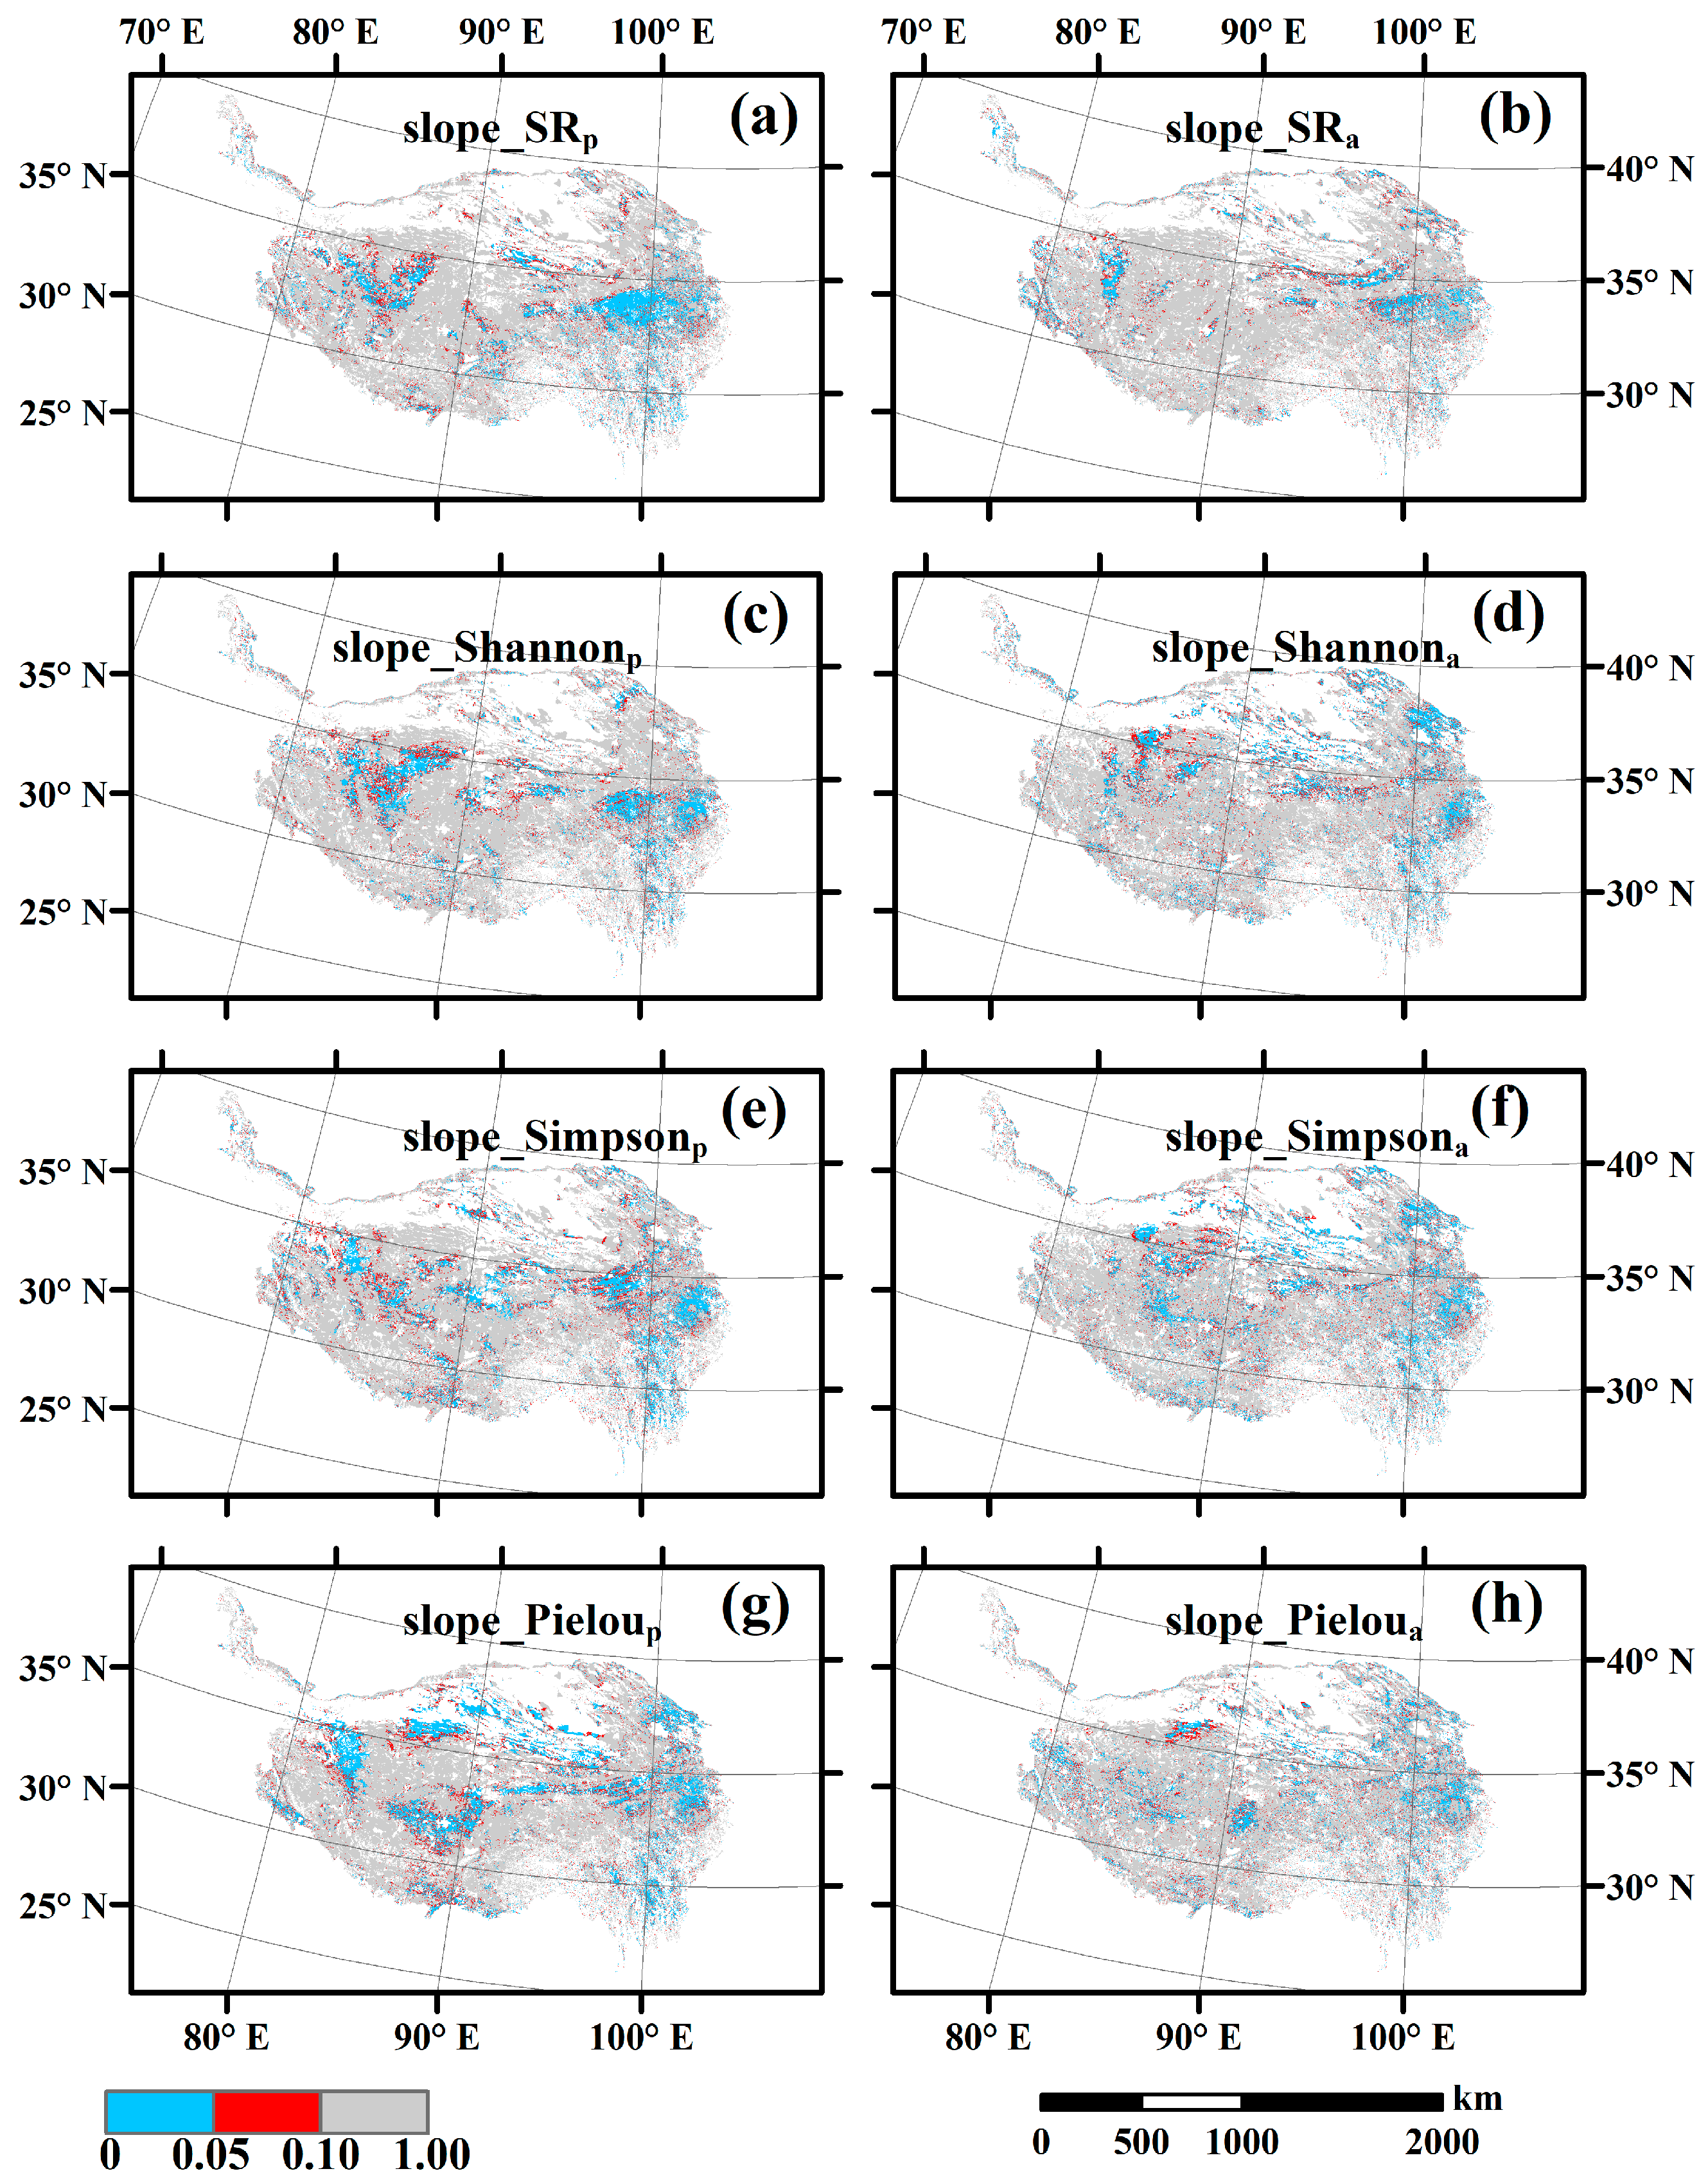
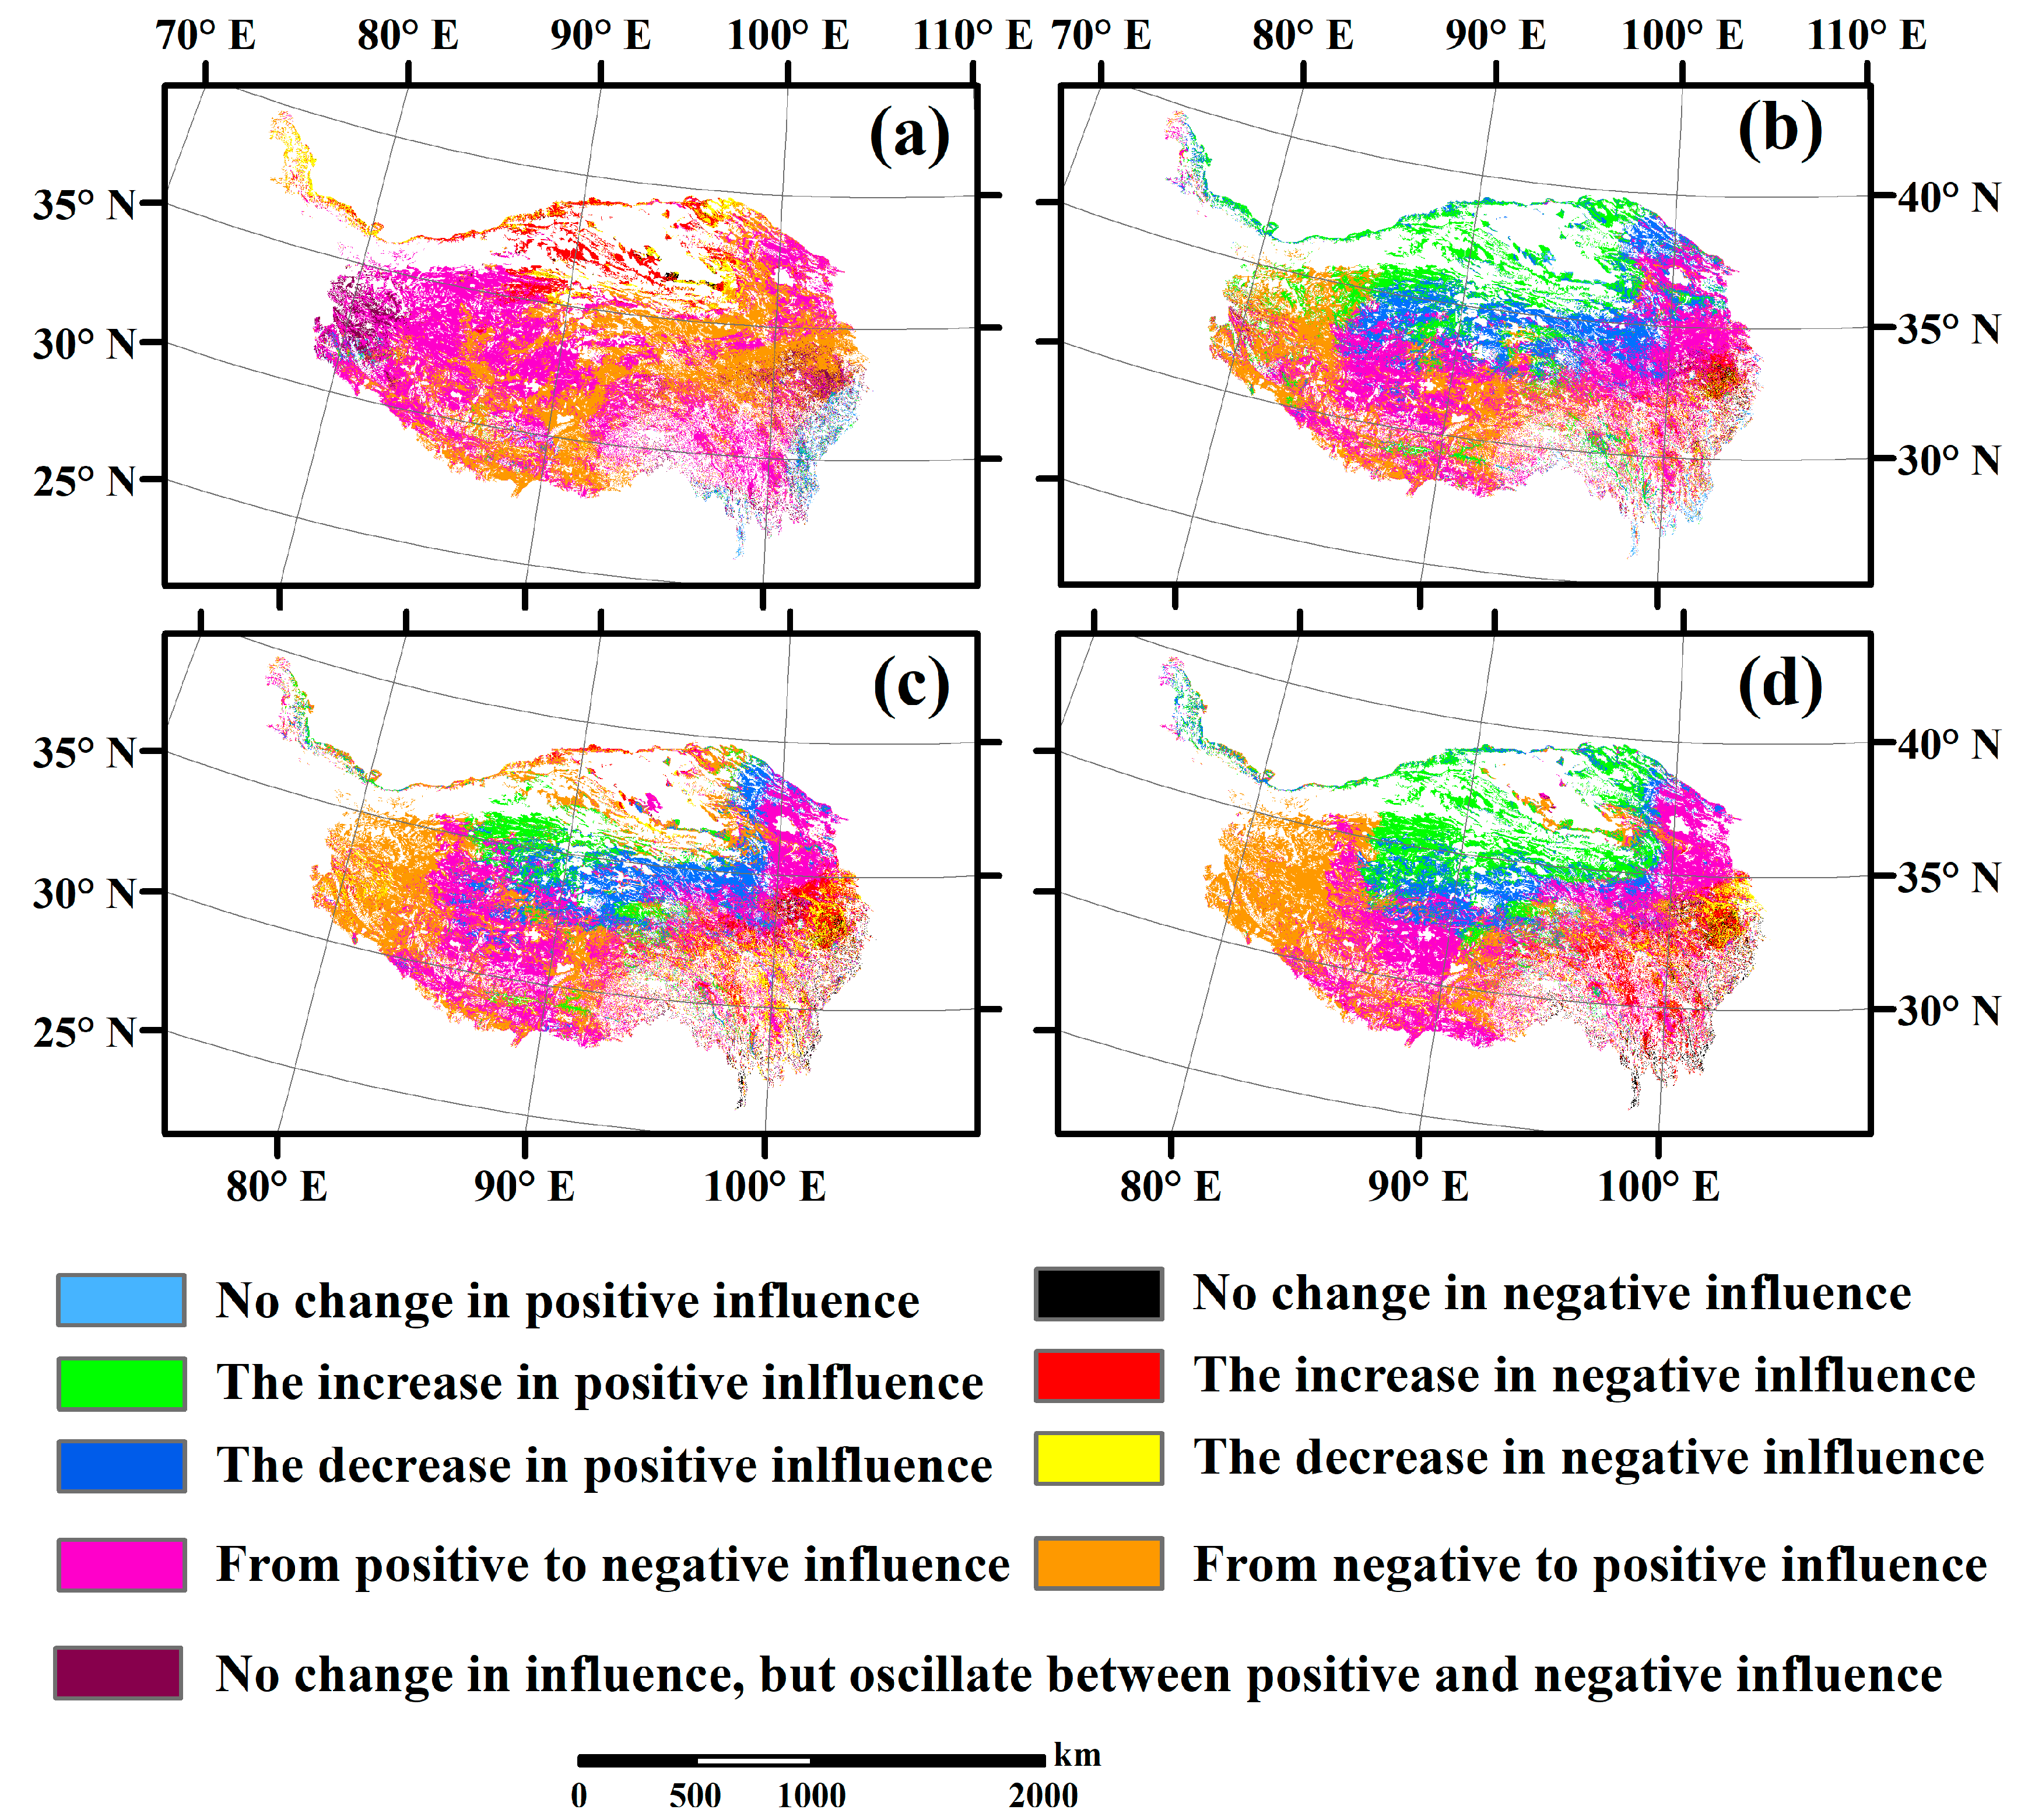
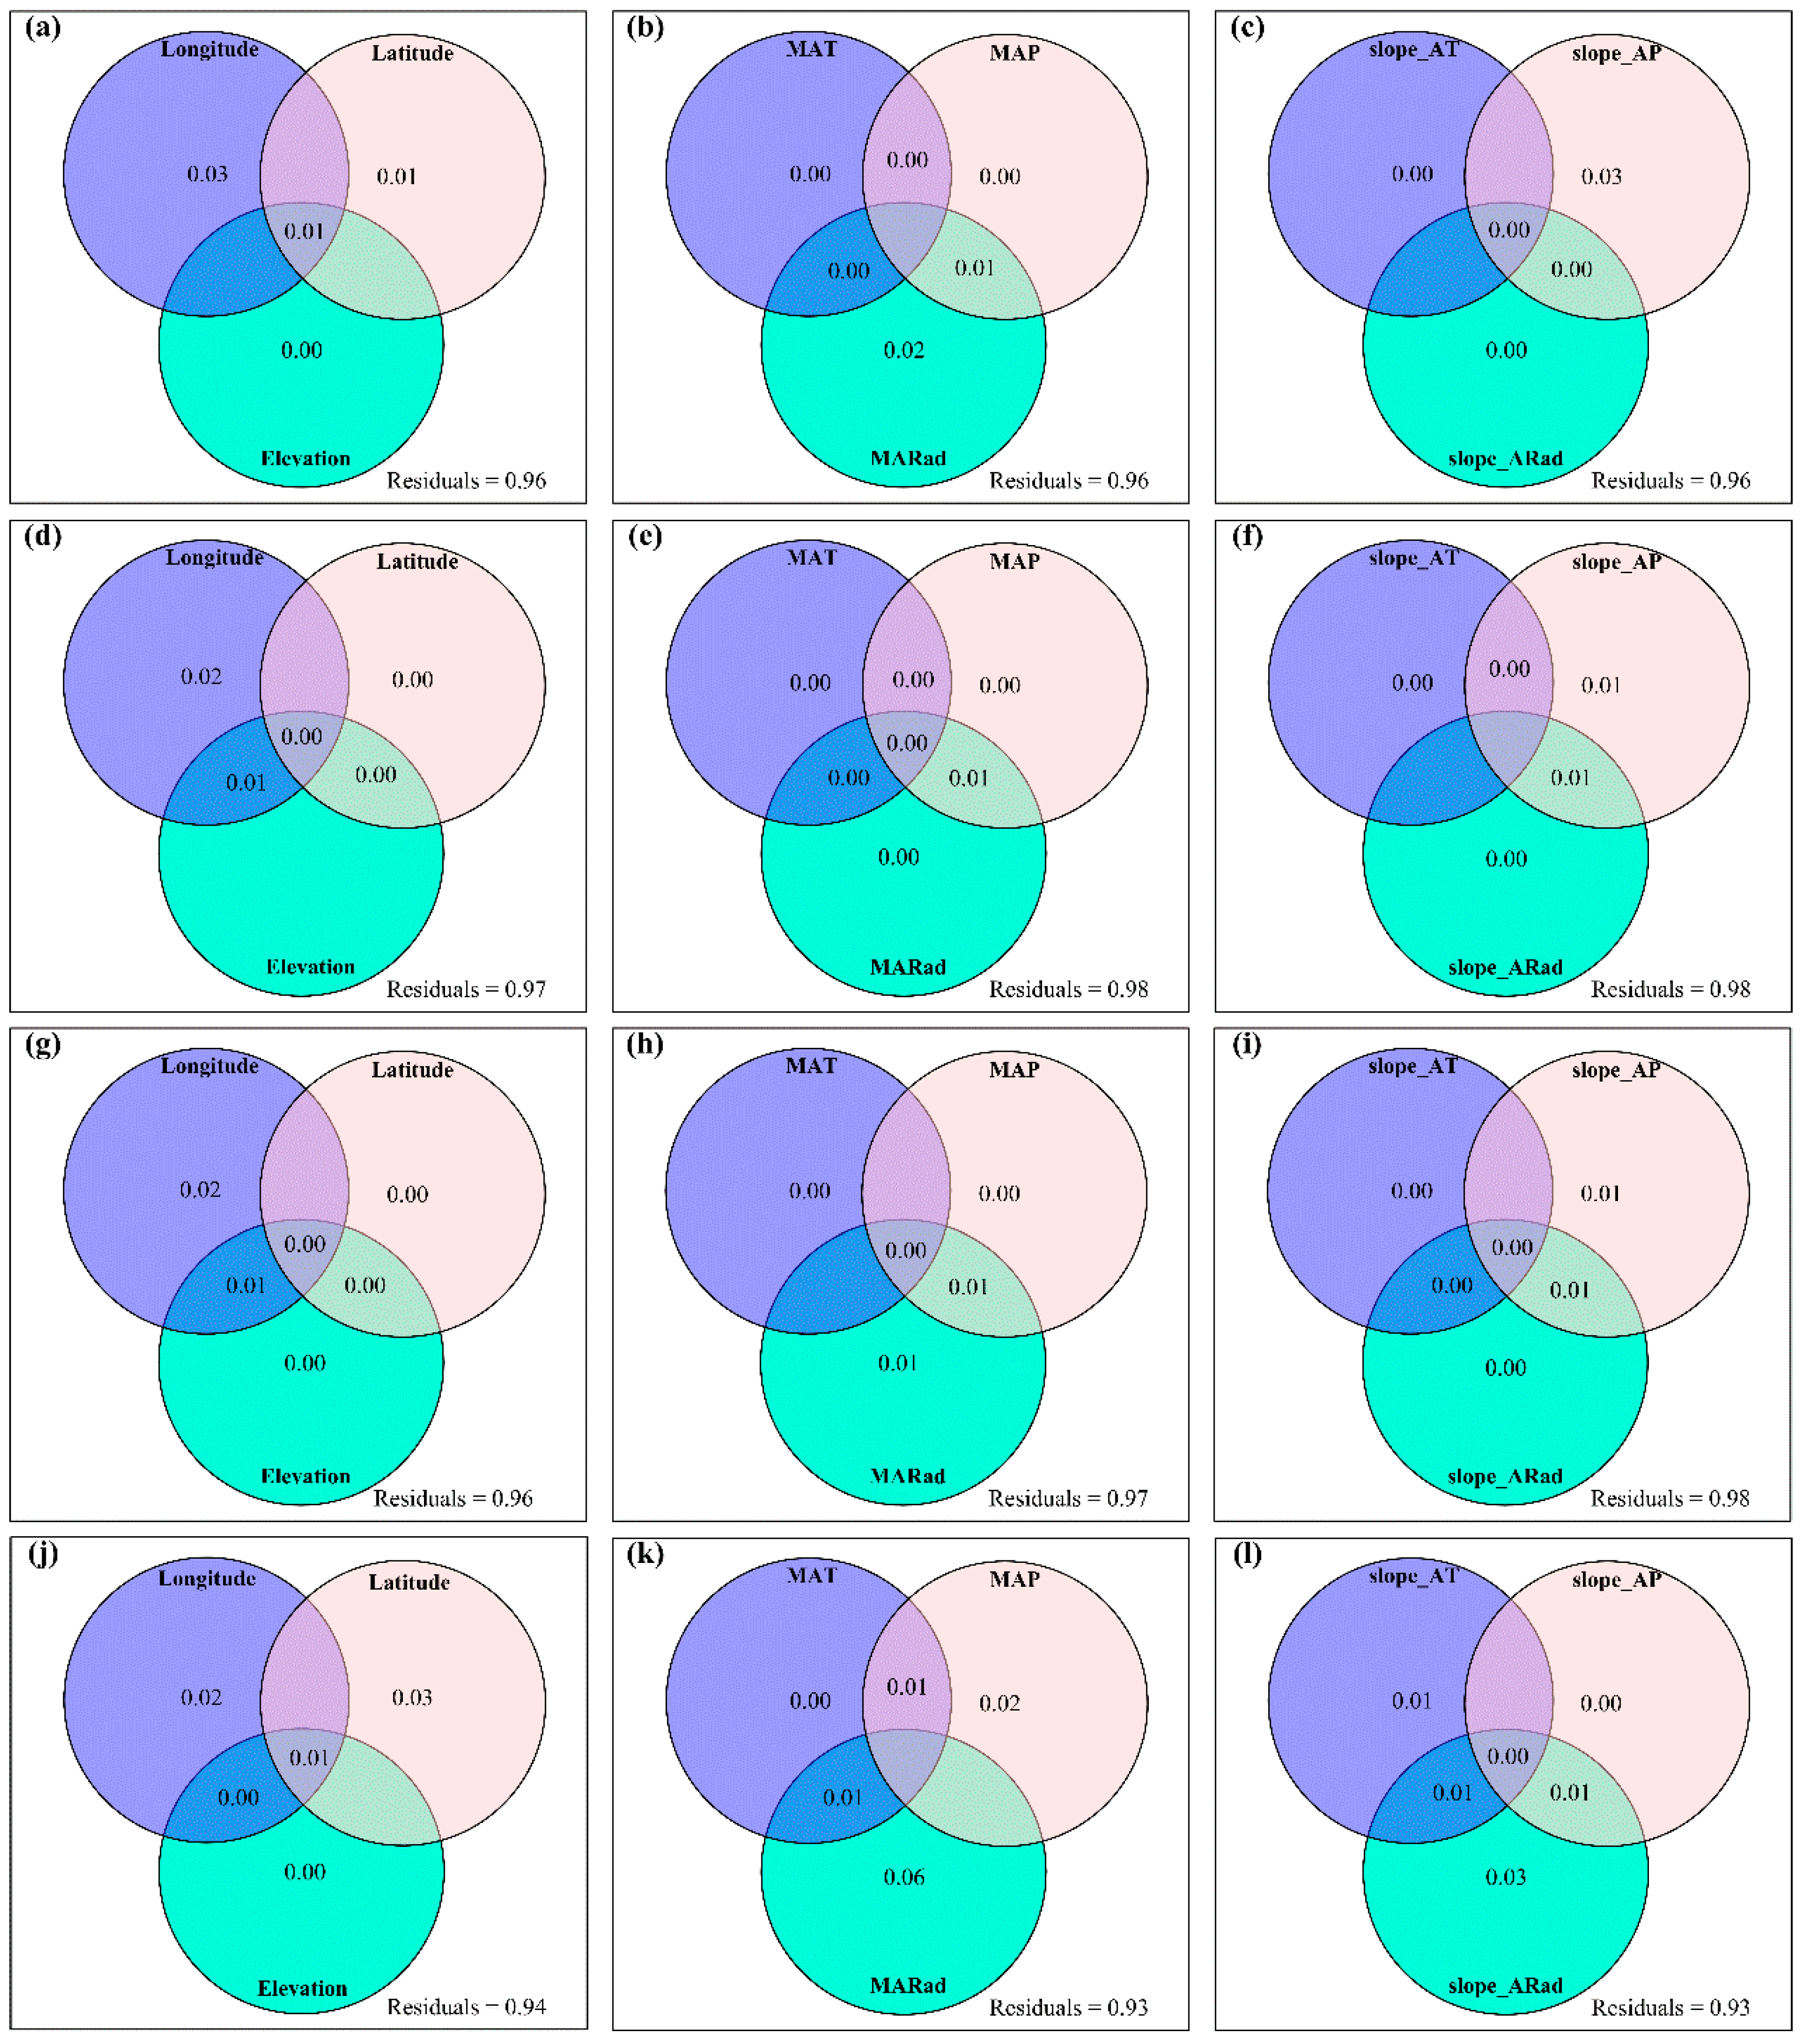
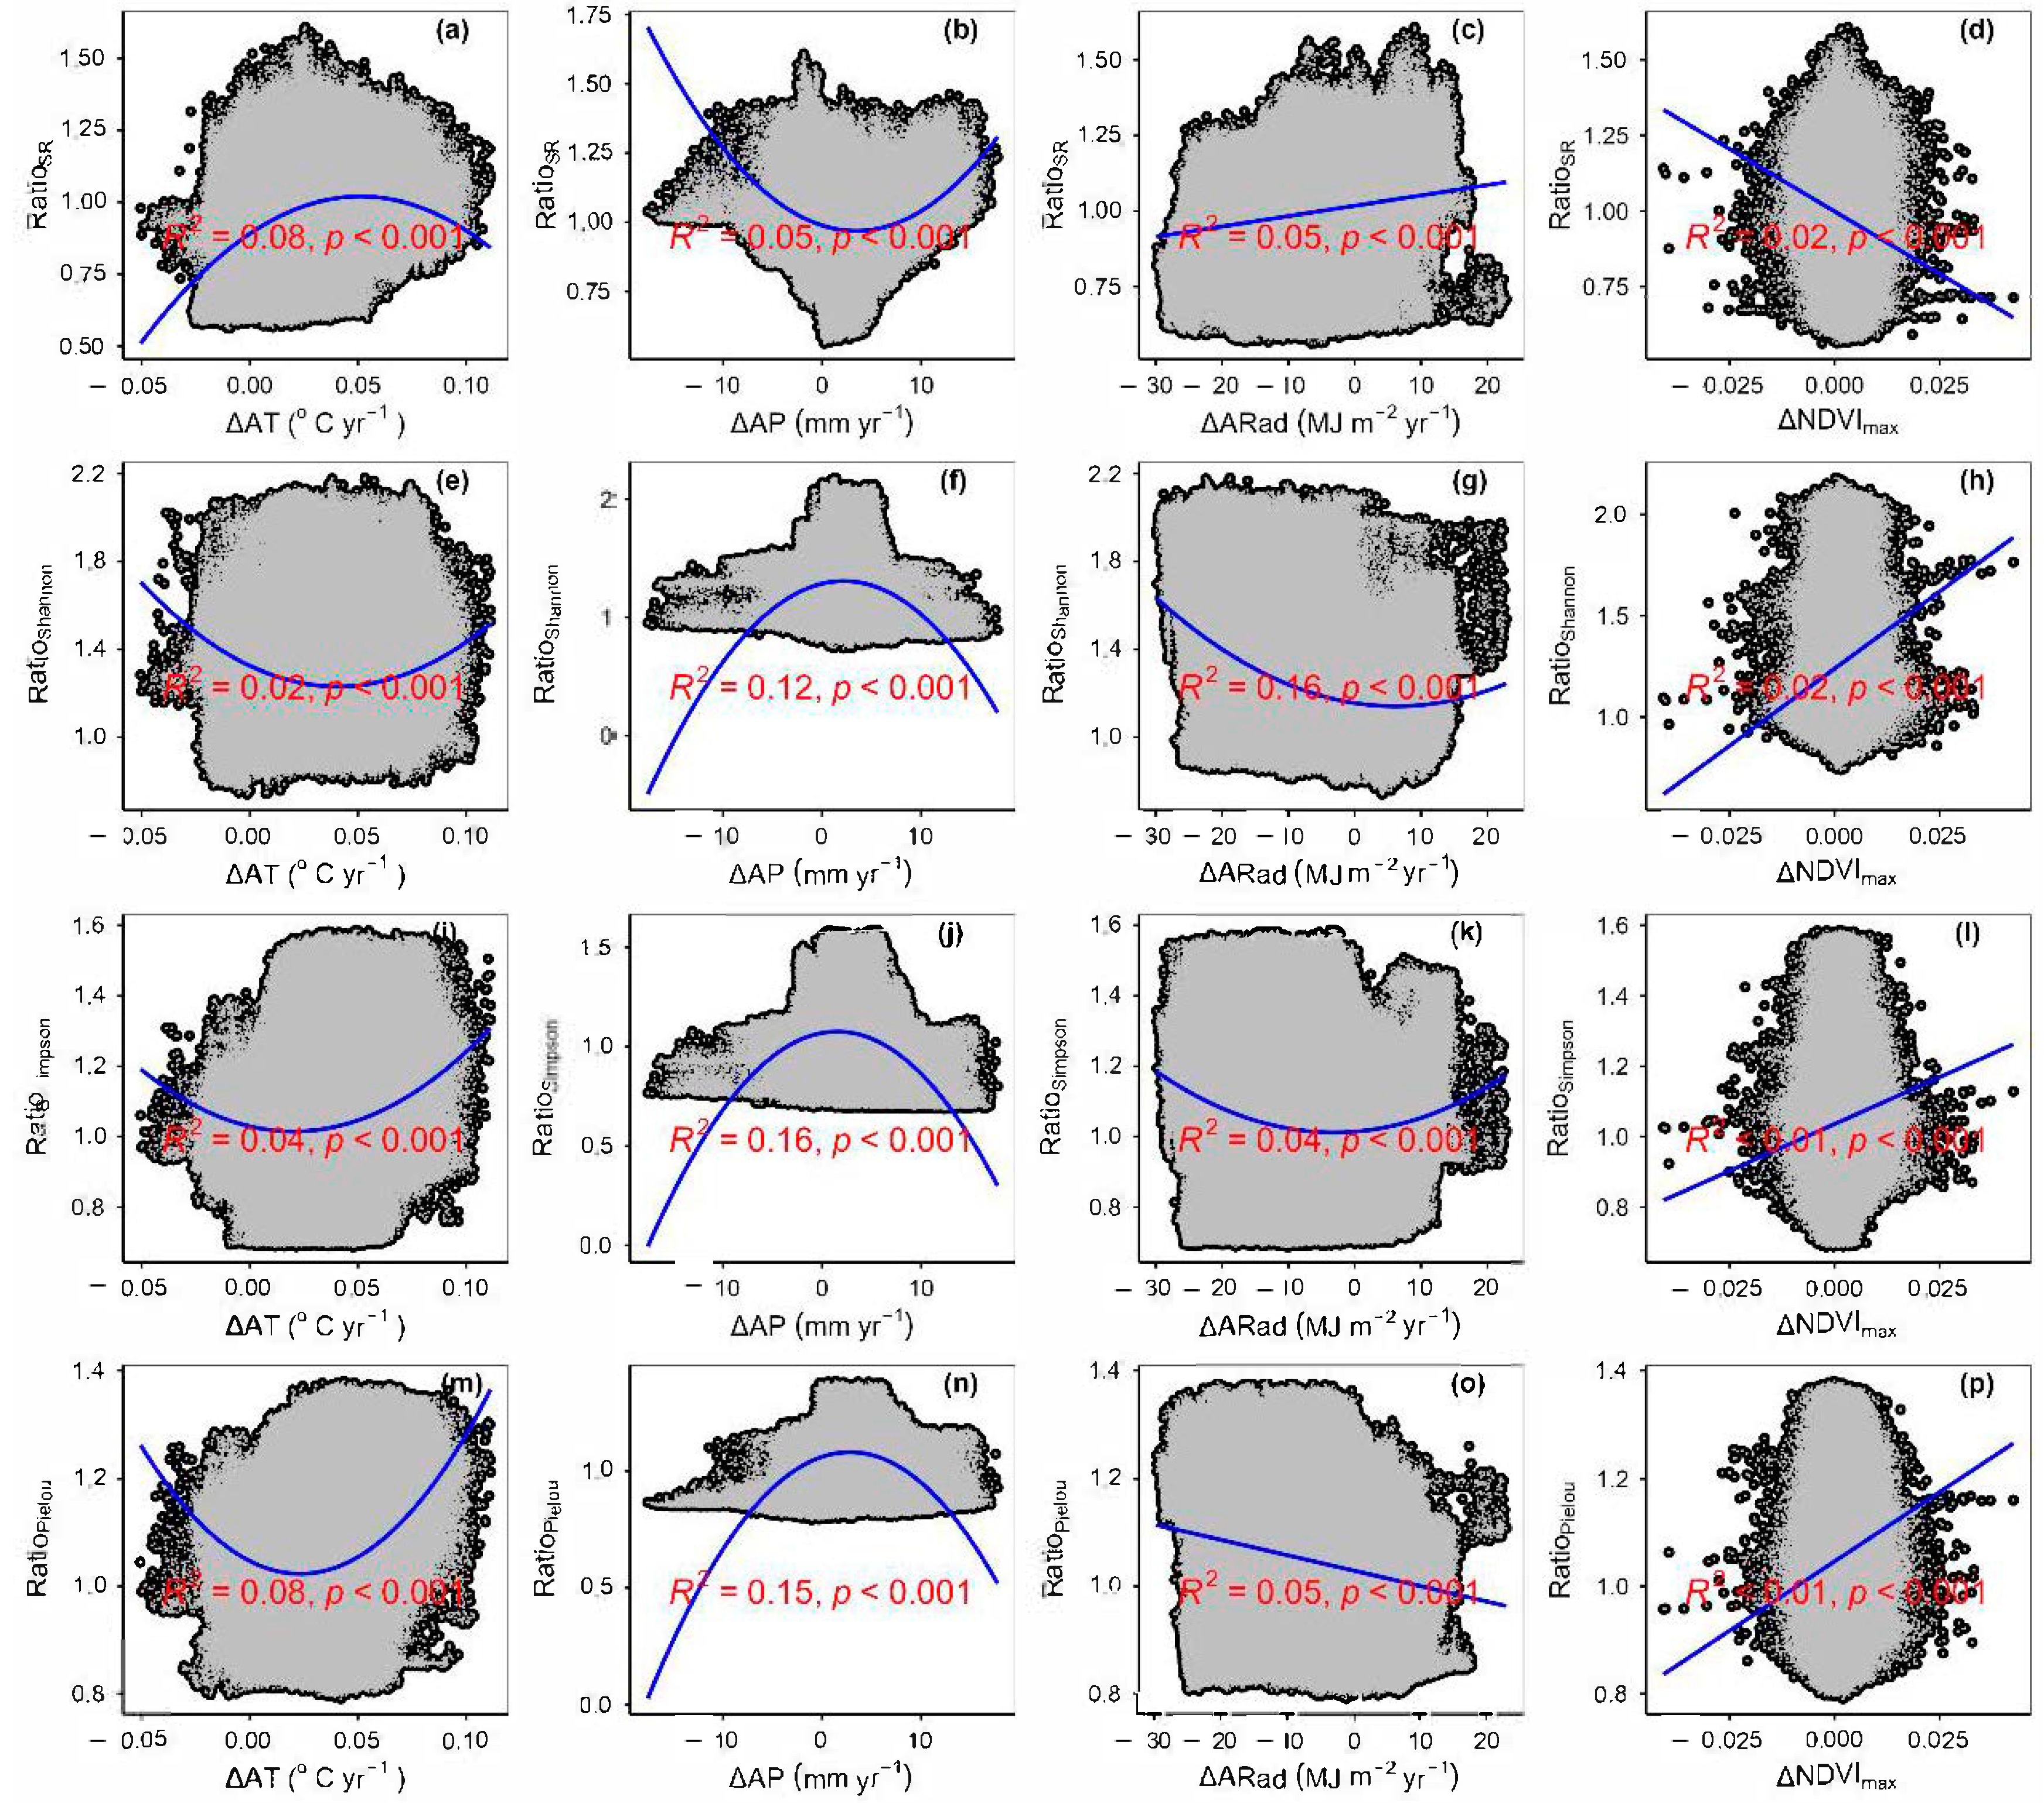
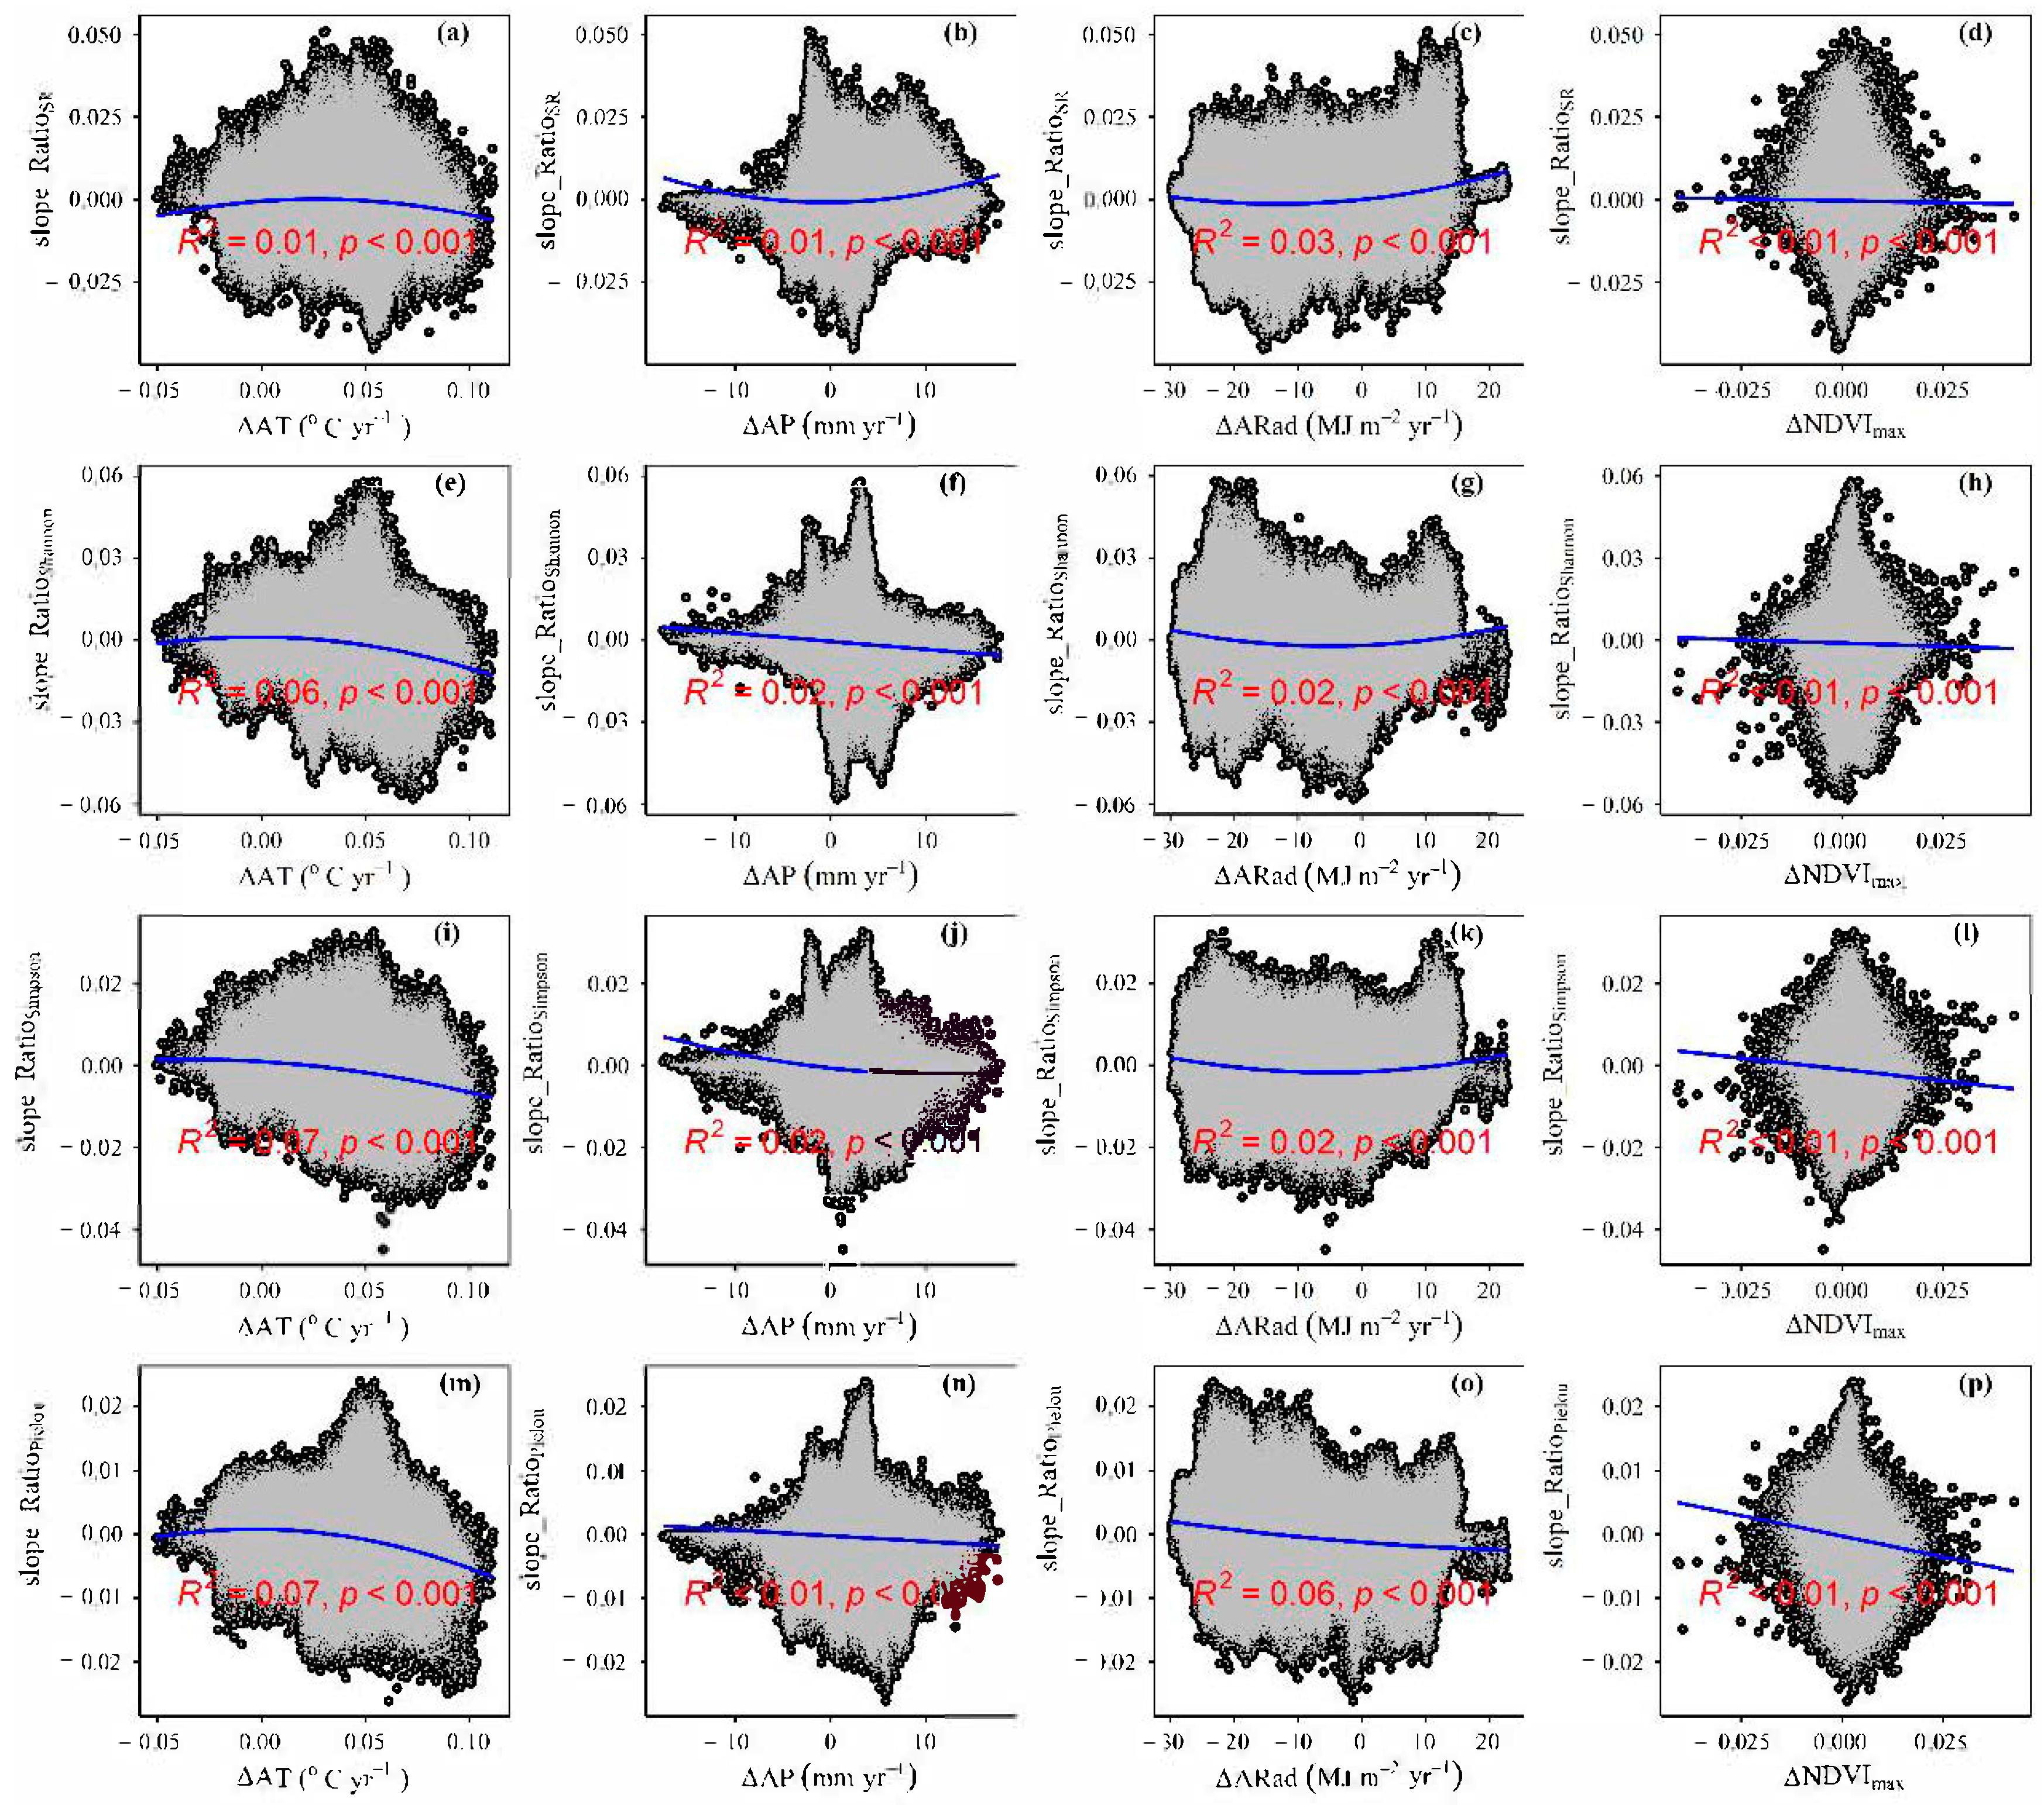
3.4. Temporal Changes in Human Activities Effects on Plant α-Diversity and Their Correlations with Environmental Factors

The spatial average values for the change rate of human activities effects on plant species richness, Shannon, Simpson and Pielou were −0.0004, −0.0011, −0.0011 and −0.0004, respectively (Figure 6). There were 42.40%, 43.97%, 44.65% and 47.88% areas showing increasing trends for the slope_RSR, slope_RShannon, slope_RSimpson and slope_RPielou, respectively (Figure 6 and Figure 7, Table 2). There were 51.96%, 53.88%, 53.68% and 50.22% areas showing decreasing trends for the slope_RSR, slope_RShannon, slope_RSimpson and slope_RPielou, respectively (Figure 6 and Figure 7, Table 2). The change rate of the human activities’ effects on plant species α-diversity varied with grassland types (Table A3).
Longitude, latitude, elevation, MAT, MAP, MARad, MNDVImax, slope_AT, slope_AP, slope_ARad and slope_NDVImax significantly explained the temporal variations of human activities’ effects on plant species α-diversity, but their relative impacts were different (Figure A22, Figure A23, Figure A24 and Figure A25). Compared to latitude and elevation, longitude had a closer correlation with the temporal variations of human activities’ effects on plant species α-diversity (Figure A25). Compared to geography position and mean climate conditions + NDVImax, climate change + slope_NDVImax had greater exclusive impacts on the temporal variations of human activities’ effects on plant species α-diversity (Figure 5).

4. Discussion

Some previous meta-analyses indicated that both climate change and human activities could cause a large loss of plant species in grassland ecosystems [10,19,34,35]. However, in this study, climate change increased plant species α-diversity across all the grassland ecosystems on the Tibetan Plateau. Human activities only caused about 1% species loss but increased the Shannon, Simpson and Pielou across all the grassland ecosystems on the Tibetan Plateau. Therefore, this study cautioned that both climate change and human activities might not cause as much species loss as expected.

4.1. Impacts of Climate Change on Plant Species α-Diversity

Our findings implied that climate change itself predominated the variations of plant species α-diversity, which was similar to some earlier studies [31,33]. However, whether temperature change, precipitation change and radiation change dominated the variations of plant species α-diversity varied with plant species α-diversity indicators. Temperature changes can have greater impacts on the variations of plant species α-diversity than precipitation change, which was in contrast with some earlier studies [29,36]. This phenomenon may be due to different spatial scales (these previous studies were only performed in some points, but this study was performed across all grasslands) and cautioned that precipitation change did not always have greater impacts than temperature change on grassland ecosystems on the Tibetan Plateau. Earlier studies focused on the impacts of precipitation change and warming but not radiation change on plant species α-diversity [14,30]. However, this study demonstrated that slope_ARad had exclusive impacts on and even predominated the change rate of potential α-diversity. This finding not only further supported some earlier studies [33,37] but also further cautioned that the impacts of radiation change on grassland ecological systems should be taken seriously enough on the Tibetan Plateau. Accordingly, temperature change, precipitation change and radiation change can affect the variations of plant species α-diversity, and their impacts on plant species α-diversity should not be ignored and should be highly valued.
Consistent with our Hypothesis, climate change did not always have positive or negative effects on plant species α-diversity, which was similar to some earlier studies performed in grassland ecological systems on [38,39] or outside the Tibetan Plateau [40,41]. This phenomenon was due to the following reasons. Firstly, an earlier study ascribed this phenomenon to the mutually weakening effects of heat and water resources and the regulating ability of climate change magnitudes and mean climate conditions on the impacts of climate change on grassland ecological systems [33]. Moreover, grassland types can also regulate the responses of plant species α-diversity to climate change [14,18]. Secondly, climate change can lead to the invasion of alien species from low elevation and/or low latitude [42,43], and plant species α-diversity may acclimatize to long-term climate change [39]. All these, in turn, can compensate for the possible negative impacts of climate change on plant species α-diversity. Thirdly, vegetative propagation may be the main propagation mode for alpine plants, but plant seed dispersal can still be an important mechanism for new plant colonization and plant community assembly. Climate change can lead to the increase or decline of plant seed yield [44,45,46] by altering plant phenology, which in turn can result in different impacts on plant seed dispersal ability and plant α-diversity. Fourthly, soil seed banks can play important roles in aboveground plant community regeneration [47,48]. Climate warming may increase plant species α-diversity by breaking the dormancy of soil seeds and stimulating their germination [49]. In contrast, climate warming may cause the loss of plant species α-diversity by the reduced soil seed α-diversity caused by climate warming [48]. Fifthly, climate change may alter the root-to-stem ratio by altering the height of plant growth and water availability [50]. Sixthly, plant phyllosphere microorganisms and their host plants are coevolved, and the phyllosphere microbial communities can generally vary with host plants [51,52]. The effects of climate change on the phyllosphere microbial communities can vary among different plants, which in turn can have different feedbacks on the growth of plants, thus indirectly changing plant species α-diversity [53,54,55,56].
Our findings implied that the impacts of climate change on plant species α-diversity did not always decrease with decreasing precipitation, latitude and elevation and increasing temperature. This finding supported some earlier studies which demonstrated that the responses of forage nutrition quality to climate change did not always decrease with increasing temperature and decreasing precipitation and elevation [33,57]. This phenomenon was due to the following reasons. Firstly, an earlier study ascribed this phenomenon to the fact that the impacts of climate change on soil nutrition availability and microbial diversity did not increase with increasing elevation and decreasing temperature [33]. Secondly, the change trends of plant species α-diversity under climate change scenes were mainly correlated with the magnitudes of climate change, but climate change magnitudes were not linearly correlated with latitude, elevation, temperature and precipitation. Thirdly, local plant species pool and soil seed banks did not always increase or decrease linearly with increasing elevation/latitude [47,48,49], and the probability of transient disappearance/appearance of rare plant species and soil seed germination can be related to local plant species pool and soil seed banks under climate change scenes, respectively [17].
Consistent with our hypothesis, the impacts of climate change on plant species α-diversity varied with grassland types, which was similar to some earlier studies conducted in grassland ecological systems on the Tibetan Plateau [18,19]. This phenomenon was due to the following reasons. Firstly, both the local plant species pool and soil seed bank can vary with grassland types [29,47,48]. Secondly, plant diversity can be generally affected by both stochastic and deterministic processes [11,14,58]. Different types of grasslands have different dominant plant species and different assemblages of plant species [14]. Different plant species have different ecological niches and the capacity for sexual and asexual reproduction, which in turn may result in different reactions to temperature, precipitation and radiation change [59,60]. Accordingly, the impacts of climate change on the relative strengths of stochastic and deterministic processes in determining plant community assembly can vary with grassland types [14,43]. Thirdly, light, temperature, water and soil nutrition are four key and important resources of plants, and the availability of these four kinds of resources can vary among grassland types under climate change conditions [61,62,63]. All plants may compete for these four kinds of resources within a specific grassland community, and their competing intensity may vary with grassland types under climate change scenes. Fourthly, the responses of soil microbial diversity and soil pH to climate change can vary with grassland types [18,64,65,66].
Our findings implied that climate change restructured the spatial distribution patterns of plant species α-diversity. Plant species α-diversity was closely correlated with forage nutrition quality, plant production, plant species β-diversity, plant phylogenetic α- and β-diversity and soil pH [5,11,67]. Accordingly, this finding supported some earlier studies which demonstrated that climate change restructured the spatial distribution patterns of forage nutrition quality, plant aboveground plant production, precipitation use efficiency, plant species and phylogenetic diversity and soil pH in grassland ecological systems at various spatial scales on the Tibetan Plateau [14,33,59,66,68]. This phenomenon may be due to the following reasons. Firstly, an earlier study ascribed this phenomenon to the relative changes in the intensity of ecological processes (e.g., selection and dispersal) involved in plant community assembly and the recombination of environmental factors (i.e., temperature, water availability, soil nutrition and soil pH) under climate change scenes in alpine grassland ecological systems [14]. Climate change may cause a new spatial distribution of snow and ice, which are closely correlated with water availability [69,70,71,72,73]. Moreover, climate warming-induced reduction in wind speed may decrease the dispersal ability of wind-pollination plants [43]. Secondly, under the background of climate change, the spatial distribution range of plants varied with plant species, with increasing, decreasing and no change trends [59,60]. Thirdly, climate change may restructure spatial distribution patterns of soil seed banks [47,48] and soil microbial diversity [74].

4.2. Impacts of Human Activities on Plant Species α-Diversity

Our findings implied that human activities altered the impacts of climate change on plant species α-diversity. This finding supported some earlier studies [15,33,66] and was due to the following reasons. Firstly, both fencing and extra nitrogen addition, as two important ways of degrading grasslands restoration, can have different impacts on plant function groups [5,10] and, in turn, affect plant species α-diversity. Secondly, wild animals have been effectively protected based on the implementation of various protection measures, and their population structures and activity ranges have undergone a series of changes. Human activities are affecting and will continue to affect wild animals and, in turn, plant species α-diversity. Thirdly, livestock grazing can alter the relative importance value of different plant species and, in turn, species α-diversity through selective feeding of livestock [11] and feedbacks of livestock excreta and urine to soil nutrients (e.g., nitrogen and phosphorus). Fourthly, buying cultivated grass from non-local regions can relieve grazing pressure on local natural grasslands, and such human activities may not be mainly dependent on climate change.
Consistent with our Hypothesis, human activities did not always have positive or negative effects on plant species α-diversity, which was similar to some earlier studies performed in grassland ecological systems on [10,11] and outside the Tibetan Plateau [35]. This phenomenon was due to the following reasons. Firstly, soil seed banks were not always increased or decreased by human activities [75,76,77]. Secondly, yak dung is often collected by herders for fuel, but sheep/goat dung is generally left in place within the Tibetan grassland ecological systems [33]. The selective feeding preferences of different livestock are not identical. Accordingly, the impacts of human activities on plant species α-diversity can also vary with livestock species. Thirdly, both the intermediate disturbance hypothesis and Milchunas-Sala-Lauenroth mode can suggest that the intensity of human activities is related to the impacts of human activities on plant α-diversity [27,76]. Fourthly, the impacts of human activities on plant species α-diversity can vary with the duration of human activities [35].
Our findings implied that the impacts of human activities on plant species α-diversity varied with the year, which was similar to some earlier studies [35,78,79]. This phenomenon may be due to the following reasons. Firstly, the transition time between warm-season pastures and cold-season pastures is not completely fixed but varies with climatic conditions and vegetation phenology in grassland areas. The grazing scopes of livestock are also not completely static and can vary from year to year. Secondly, the reasonable carrying capacity based on the grass-livestock balance is relatively stable, but actual livestock numbers, forage yield, forage nutritional quality and the proportion of edible forage can be different over the years [33,36]. All kinds of ecological engineering are not done exactly in 1 year but in batches over several years for the Tibetan grassland ecological systems. Thirdly, both livestock structure (e.g., the ratio of yak to sheep) and population structure (e.g., age structure, gender structure) can change over time. Fourthly, the impacts of human activities on water, heat, light and soil nutrition resources and pH for plant growth can vary with years [11,66,78]. Fifthly, both the forage species and magnitude of buying cultivated grass from non-local regions and the forage species, scale and yield of cultivating grass in local regions can vary with years.
Consistent with our Hypothesis, the impacts of human activities on plant species α-diversity varied with grassland types, which was similar to some earlier studies conducted on [11,18] and outside the Tibetan Plateau [35]. This phenomenon may be due to the fact that the effects of human activities on the mechanisms of plant community assembly [11], soil seed banks [76], the ratio of root to stem, soil pH, soil water and soil nutrition can vary with grassland types [11,35,66].
Our findings implied that human activities reconstructed the spatial distribution patterns of plant species α-diversity. This finding supported some earlier studies which demonstrated that human activities restructured the spatial distribution pattern of forage nutrition quality and storage, plant species and phylogenetic diversity and soil pH in grassland ecological systems at various spatial scales on the Tibetan Plateau [5,11,33,66]. This phenomenon may be due to the following reasons. Firstly, the total population and the proportion of people from all walks of life (i.e., the population employment structure) have significant spatial variations on the Qinghai-Tibet Plateau [80]. For example, the number of people engaged in livestock grazing activities can partly determine the size and range of livestock grazing. Secondly, human activities can alter not only the local assembly mechanisms of plant communities but also community turnover among sites. However, these changes can vary with geography position [11]. Plant seeds can be spread in relatively large spaces by human activities such as the feeding behavior of livestock [81,82], but human activities (e.g., the type, size and activity scope of grazing livestock) can vary with geography position. Cold-season and warm-season grazing can generally have different impacts on plant species α-diversity [11,78], and their spatial scopes of warm-season pasture and cold-season pasture are often not completely coincident. Thirdly, human activities may reconstruct the spatial distribution patterns of water and soil nutrition availability and soil pH, and in turn, recombination of environmental variables under the disturbance of human activities [5,66,83]. Fourthly, human activities may alter the spatial distribution pattern of soil fungal communities [84]. Fifthly, both buying cultivated grass from the non-local region and cultivating grass in the local region are important human activities, and the two desires of farmers and herders can vary with geography position.

5. Conclusions

In summary, the impacts of climate change and human activities on plant species α-diversity were quantified during the past 21 years (2000–2020) of the Tibetan grasslands. This study implied that the spatial distribution patterns of plant species α-diversity were altered by both climate change and human activities. Climate change and human activities did not always have negative influences on plant species α-diversity, and their influences changed with space and grassland types. This study cautioned that the anticipated loss of species diversity due to climate change and human activity had been greatly exaggerated by previous studies, at least for the grasslands of the Tibetan Plateau. This study also cautioned that the impacts of radiation changes on plant species α-diversity should also be highlighted, besides warming and precipitation change. These findings may have certain theory and practice guiding significance, at least for biodiversity protection of the grasslands on the Tibetan Plateau.

Author Contributions

Conceptualization, G.F. and S.H.; methodology, G.F.; software, S.H.; validation, G.F.; formal analysis, G.F. and S.H.; investigation, S.H.; resources, S.H.; data curation, G.F.; writing—original draft preparation, G.F. and S.H.; writing—review and editing, G.F. and S.H.; visualization, S.H.; supervision, S.H.; project administration, S.H.; funding acquisition, S.H. All authors have read and agreed to the published version of the manuscript.

Funding

This research was funded by the Chinese Academy of Sciences Youth Innovation Promotion Association [2020054], China National Natural Science Foundation [31600432], Tibet Autonomous Region Science and Technology Project [XZ202301YD0012C; XZ202202YD0009C; XZ202201ZY0003N; XZ202101ZD0007G; XZ202101ZD0003N] and Construction of Zhongba County Fixed Observation and Experiment Station of first Support System for Agriculture Green Development.

Data Availability Statement

The datasets generated for this study are available on request from the corresponding author.

Acknowledgments

We thank the editors and reviewers for their valuable comments.

Conflicts of Interest

The authors declare no conflict of interest.

Appendix A

Figure A1. Spatial patterns for the rate of change in (a) annual temperature (slope_AT), (b) annual precipitation (slope_AP), (c) annual radiation (slope_ARad) and (d) maximum normalized difference vegetation index (slope_NDVImax).
Remotesensing 15 02947 g0a1
Figure A2. Climate change scenes for alpine grassland regions on the Tibetan Plateau in 2000–2020.
Remotesensing 15 02947 g0a2
Figure A3. Correlations (a) between the rate of change in the potential species richness (slope_SRp) and longitude, (b) between the rate of change in the actual species richness (slope_SRa) and longitude, (c) between the slope_SRp and latitude, (d) between the slope_SRa and latitude, (e) between the slope_SRp and elevation and (f) between the slope_SRa and elevation.
Remotesensing 15 02947 g0a3
Figure A4. Correlations (a) between the rate of change in the potential Shannon (slope_Shannonp) and longitude, (b) between the rate of change in the actual Shannon (slope_Shannona) and longitude, (c) between the slope_Shannonp and latitude, (d) between the slope_Shannona and latitude, (e) between the slope_Shannonp and elevation and (f) between the slope_Shannona and elevation.
Remotesensing 15 02947 g0a4
Figure A5. Correlations (a) between the rate of change in the potential Simpson (slope_Simpsonp) and longitude, (b) between the rate of change in the actual Simpson (slope_Simpsona) and longitude, (c) between the slope_Simpsonp and latitude, (d) between the slope_Simpsona and latitude, (e) between the slope_Simpsonp and elevation and (f) between the slope_Simpsona and elevation.
Remotesensing 15 02947 g0a5
Figure A6. Correlations (a) between the rate of change in the potential Pielou (slope_Pieloup) and longitude, (b) between the rate of change in the actual Pielou (slope_Pieloua) and longitude, (c) between the slope_Pieloup and latitude, (d) between the slope_Pieloua and latitude, (e) between the slope_Pieloup and elevation and (f) between the slope_Pieloua and elevation.
Remotesensing 15 02947 g0a6
Figure A7. Correlations (a) between the rate of change in the potential species richness (slope_SRp) and mean annual temperature (MAT), (b) between the rate of change in the actual species richness (slope_SRa) and MAT, (c) between the slope_SRp and mean annual precipitation (MAP), (d) between the slope_SRa and MAP, (e) between the slope_SRp and mean annual radiation (MARad) and (f) between the slope_SRa and MARad.
Remotesensing 15 02947 g0a7
Figure A8. Correlations (a) between the rate of change in the potential Shannon (slope_Shannonp) and mean annual temperature (MAT), (b) between the rate of change in the actual Shannon (slope_Shannona) and MAT, (c) between the slope_Shannonp and mean annual precipitation (MAP), (d) between the slope_Shannona and MAP, (e) between the slope_Shannonp and mean annual radiation (MARad) and (f) between the slope_Shannona and MARad.
Remotesensing 15 02947 g0a8
Figure A9. Correlations (a) between the rate of change in the potential Simpson (slope_Simpsonp) and mean annual temperature (MAT), (b) between the rate of change in the actual Simpson (slope_Simpsona) and MAT, (c) between the slope_Simpsonp and mean annual precipitation (MAP), (d) between the slope_Simpsona and MAP, (e) between the slope_Simpsonp and mean annual radiation (MARad) and (f) between the slope_Simpsona and MARad.
Remotesensing 15 02947 g0a9
Figure A10. Correlations (a) between the rate of change in the potential Pielou (slope_Pieloup) and mean annual temperature (MAT), (b) between the rate of change in the actual Pielou (slope_Pieloua) and MAT, (c) between the slope_Pieloup and mean annual precipitation (MAP), (d) between the slope_Pieloua and MAP, (e) between the slope_Pieloup and mean annual radiation (MARad) and (f) between the slope_Pieloua and MARad.
Remotesensing 15 02947 g0a10
Figure A11. Correlations (a) between the rate of change in the potential species richness (slope_SRp) and the rate of change in annual temperature (ΔAT), (b) between the rate of change in the actual species richness (slope_SRa) and ΔAT, (c) between the slope_SRp and the rate of change in annual precipitation (ΔAP), (d) between the slope_SRa and ΔAP, (e) between the slope_SRp and the rate of change in annual radiation (ΔARad) and (f) between the slope_SRa and ΔARad.
Remotesensing 15 02947 g0a11
Figure A12. Correlations (a) between the rate of change in the potential Shannon (slope_Shannonp) and the rate of change in annual temperature (ΔAT), (b) between the rate of change in the actual Shannon (slope_Shannona) and ΔAT, (c) between the slope_Shannonp and the rate of change in annual precipitation (ΔAP), (d) between the slope_Shannona and ΔAP, (e) between the slope_Shannonp and the rate of change in annual radiation (ΔARad) and (f) between the slope_Shannona and ΔARad.
Remotesensing 15 02947 g0a12
Figure A13. Correlations (a) between the rate of change in the potential Simpson (slope_Simpsonp) and the rate of change in annual temperature (ΔAT), (b) between the rate of change in the actual Simpson (slope_Simpsona) and ΔAT, (c) between the slope_Simpsonp and the rate of change in annual precipitation (ΔAP), (d) between the slope_Simpsona and ΔAP, (e) between the slope_Simpsonp and the rate of change in annual radiation (ΔARad) and (f) between the slope_Simpsona and ΔARad.
Remotesensing 15 02947 g0a13
Figure A14. Correlations (a) between the rate of change in the potential Pielou (slope_Pieloup) and the rate of change in annual temperature (ΔAT), (b) between the rate of change in the actual Pielou (slope_Pieloua) and ΔAT, (c) between the slope_Pieloup and the rate of change in annual precipitation (ΔAP), (d) between the slope_Pieloua and ΔAP, (e) between the slope_Pieloup and the rate of change in annual radiation (ΔARad) and (f) between the slope_Pieloua and ΔARad.
Remotesensing 15 02947 g0a14
Figure A15. The relative contribution of (a) longitude, latitude and elevation to potential species richness (SRp), (b) mean annual temperature (MAT), mean annual precipitation (MAP) and mean annual radiation (MARad) to SRp, (c) the change rate for annual temperature (slope_AT), annual precipitation (slope_AP) and annual radiation (slope_ARad) to SRp, (d) longitude, latitude and elevation to potential Shannon (Shannonp), (e) MAT, MAP and MARad to Shannonp, (f) slope_AT, slope_AP and slope_ARad to Shannonp, (g) longitude, latitude and elevation to potential Simpson (Simpsonp), (h) MAT, MAP and MARad to Simpsonp, (i) slope_AT, slope_AP and slope_ARad to Simpsonp, (j) longitude, latitude and elevation to potential Pielou (Pieloup), (k) MAT, MAP and MARad to Pieloup and (l) slope_AT, slope_AP and slope_ARad to Pieloup.
Remotesensing 15 02947 g0a15
Figure A16. The relative contribution of (a) longitude, latitude and elevation to actual species richness (SRa), (b) mean annual temperature (MAT), mean annual precipitation (MAP) and mean annual radiation (MARad) to SRa, (c) the change rate for annual temperature (slope_AT), annual precipitation (slope_AP) and annual radiation (slope_ARad) to SRa, (d) longitude, latitude and elevation to actual Shannon (Shannona), (e) MAT, MAP and MARad to Shannona, (f) slope_AT, slope_AP and slope_ARad to Shannona, (g) longitude, latitude and elevation to actual Simpson (Simpsona), (h) MAT, MAP and MARad to Simpsona, (i) slope_AT, slope_AP and slope_ARad to Simpsona, (j) longitude, latitude and elevation to actual Pielou (Pieloua), (k) MAT, MAP and MARad to Pieloua and (l) slope_AT, slope_AP and slope_ARad to Pieloua.
Remotesensing 15 02947 g0a16
Figure A17. Correlations (a) between the rate of change in the actual species richness (slope_SRa) and mean value of maximum normalized difference vegetation index (MNDVImax), (b) between slope_SRa and the rate of change in the maximum normalized difference vegetation index (slope_NDVImax), (c) between the rate of change in the actual Shannon (slope_Shannona) and MNDVImax, (d) between slope_Shannona and slope_NDVImax, (e) between the rate of change in the actual Simpson (slope_Simpsona) and MNDVImax, (f) between slope_Simpsona and slope_NDVImax, (g) between the rate of change in the actual Pielou (slope_Pieloua) and MNDVImax and (h) between slope_Pieloua and slope_NDVImax.
Remotesensing 15 02947 g0a17
Figure A18. Correlations (a) between the ratio of actual to potential species richness (RatioSR) and longitude, (b) between the RatioSR and latitude, (c) between the RatioSR and elevation, (d) between the ratio of actual to potential Shannon (RatioShannon) and longitude, (e) between the RatioShannon and latitude, (f) between the RatioShannon and elevation, (g) between the ratio of actual to potential Simpson (RatioSimpson) and longitude, (h) between the RatioSimpson and latitude, (i) between the RatioSimpson and elevation, (j) between the ratio of actual to potential Pielou (RatioPielou) and longitude, (k) between the RatioPielou and latitude and (l) between the RatioPielou and elevation.
Remotesensing 15 02947 g0a18
Figure A19. Correlations (a) between the ratio of actual to potential species richness (RatioSR) and mean annual temperature (MAT), (b) between the RatioSR and mean annual precipitation (MAP), (c) between the RatioSR and mean annual radiation (MARad), (d) between the RatioSR and mean maximum normalized difference vegetation index (MNDVImax), (e) between the ratio of actual to potential Shannon (RatioShannon) and MAT, (f) between the RatioShannon and MAP, (g) between the RatioShannon and MARad, (h) between the RatioShannon and MNDVImax, (i) between the ratio of actual to potential Simpson (RatioSimpson) and MAT, (j) between the RatioSimpson and MAP, (k) between the RatioSimpson and MARad, (l) the RatioSimpson and MNDVImax, (m) between the ratio of actual to potential Pielou (RatioPielou) and MAT, (n) between the RatioPielou and MAP, (o) between the RatioPielou and MARad and (p) between the RatioPielou and MNDVImax.
Remotesensing 15 02947 g0a19
Figure A20. Correlations (a) between the ratio of actual to potential species richness (RatioSR) and the change rate of annual temperature (ΔAT), (b) between the RatioSR and the change rate of annual precipitation (ΔAP), (c) between the RatioSR and the change rate of annual radiation (ΔARad), (d) between the RatioSR and the change rate of maximum normalized difference vegetation index (ΔNDVImax), (e) between the ratio of actual to potential Shannon (RatioShannon) and ΔAT, (f) between the RatioShannon and ΔAP, (g) between the RatioShannon and ΔARad, (h) between the RatioShannon and ΔNDVImax, (i) between the ratio of actual to potential Simpson (RatioSimpson) and ΔAT, (j) between the RatioSimpson and ΔAP, (k) between the RatioSimpson and ΔARad, (l) the RatioSimpson and ΔNDVImax, (m) between the ratio of actual to potential Pielou (RatioPielou) and ΔAT, (n) between the RatioPielou and ΔAP, (o) between the RatioPielou and ΔARad and (p) between the RatioPielou and ΔNDVImax.
Remotesensing 15 02947 g0a20
Figure A21. Relative contribution of (a) longitude, latitude and elevation to the ratio of actual to potential species richness (RatioSR), (b) mean maximum normalized difference vegetation index (MNDVImax), mean annual temperature (MAT), mean annual precipitation (MAP) and mean annual radiation (MARad) to RatioSR, (c) the change rate for maximum normalized difference vegetation index (slope_NDVImax), annual temperature (slope_AT), annual precipitation (slope_AP) and annual radiation (slope_ARad) to RatioSR, (d) longitude, latitude and elevation to the ratio of actual to potential Shannon (RatioShannon), (e) MNDVImax, MAT, MAP and MARad to RatioShannon, (f) slope_NDVImax, slope_AT, slope_AP and slope_ARad to RatioShannon, (g) longitude, latitude and elevation to the ratio of actual to potential Simpson (RatioSimpson), (h) MNDVImax, MAT, MAP and MARad to RatioSimpson, (i) slope_NDVImax, slope_AT, slope_AP and slope_ARad to RatioSimpson, (j) longitude, latitude and elevation to the ratio of actual to potential Pielou (RatioPielou), (k) MNDVImax, MAT, MAP and MARad to RatioPielou and (l) slope_NDVImax, slope_AT, slope_AP and slope_ARad to RatioPielou.
Remotesensing 15 02947 g0a21
Figure A22. Correlations (a) between the change rate for the ratio of actual to potential species richness (slope_RatioSR) and longitude, (b) between the slope_RatioSR and latitude, (c) between the slope_RatioSR and elevation, (d) between the change rate for the ratio of actual to potential Shannon (slope_RatioShannon) and longitude, (e) between the slope_RatioShannon and latitude, (f) between the slope_RatioShannon and elevation, (g) between the change rate for the ratio of actual to potential Simpson (slope_RatioSimpson) and longitude, (h) between the slope_RatioSimpson and latitude, (i) between the slope_RatioSimpson and elevation, (j) between the change rate for the ratio of actual to potential Pielou (slope_RatioPielou) and longitude, (k) between the slope_RatioPielou and latitude and (l) between the slope_RatioPielou and elevation.
Remotesensing 15 02947 g0a22
Figure A23. Correlations (a) between the change rate for the ratio of actual to potential species richness (slope_RatioSR) and mean annual temperature (MAT), (b) between the slope_RatioSR and mean annual precipitation (MAP), (c) between the slope_RatioSR and mean annual radiation (MARad), (d) between the slope_RatioSR and mean maximum normalized difference vegetation index (MNDVImax), (e) between the change rate for the ratio of actual to potential Shannon (slope_RatioShannon) and MAT, (f) between the slope_RatioShannon and MAP, (g) between the slope_RatioShannon and MARad, (h) between the slope_RatioShannon and MNDVImax, (i) between the change rate for the ratio of actual to potential Simpson (slope_RatioSimpson) and MAT, (j) between the slope_RatioSimpson and MAP, (k) between the slope_RatioSimpson and MARad, (l) the slope_RatioSimpson and MNDVImax, (m) between the change rate for the ratio of actual to potential Pielou (slope_RatioPielou) and MAT, (n) between the slope_RatioPielou and MAP, (o) between the slope_RatioPielou and MARad and (p) between the slope_RatioPielou and MNDVImax.
Remotesensing 15 02947 g0a23
Figure A24. Correlations (a) between the change rate for the ratio of actual to potential species richness (slope_RatioSR) and the change rate of annual temperature (ΔAT), (b) between the slope_RatioSR and the change rate of annual precipitation (ΔAP), (c) between the slope_RatioSR and the change rate of annual radiation (ΔARad), (d) between the slope_RatioSR and the change rate of maximum normalized difference vegetation index (ΔNDVImax), (e) between the change rate for the ratio of actual to potential Shannon (slope_RatioShannon) and ΔAT, (f) between the slope_RatioShannon and ΔAP, (g) between the slope_RatioShannon and ΔARad, (h) between the slope_RatioShannon and ΔNDVImax, (i) between the change rate for the ratio of actual to potential Simpson (slope_RatioSimpson) and ΔAT, (j) between the slope_RatioSimpson and ΔAP, (k) between the slope_RatioSimpson and ΔARad, (l) the slope_RatioSimpson and ΔNDVImax, (m) between the change rate for the ratio of actual to potential Pielou (slope_RatioPielou) and ΔAT, (n) between the slope_RatioPielou and ΔAP, (o) between the slope_RatioPielou and ΔARad and (p) between the slope_RatioPielou and ΔNDVImax.
Remotesensing 15 02947 g0a24
Figure A25. Relative contribution of (a) longitude, latitude and elevation to the change rate for the ratio of actual to potential species richness (slope_RatioSR), (b) mean maximum normalized difference vegetation index (MNDVImax), mean annual temperature (MAT), mean annual precipitation (MAP) and mean annual radiation (MARad) to slope_RatioSR, (c) the change rate for maximum normalized difference vegetation index (slope_NDVImax), annual temperature (slope_AT), annual precipitation (slope_AP) and annual radiation (slope_ARad) to slope_RatioSR, (d) longitude, latitude and elevation to the change rate for the ratio of actual to potential Shannon (slope_RatioShannon), (e) MNDVImax, MAT, MAP and MARad to slope_RatioShannon, (f) slope_NDVImax, slope_AT, slope_AP and slope_ARad to slope_RatioShannon, (g) longitude, latitude and elevation to the change rate for the ratio of actual to potential Simpson (slope_RatioSimpson), (h) MNDVImax, MAT, MAP and MARad to slope_RatioSimpson, (i) slope_NDVImax, slope_AT, slope_AP and slope_ARad to slope_RatioSimpson, (j) longitude, latitude and elevation to the change rate for the ratio of actual to potential Pielou (slope_RatioPielou), (k) MNDVImax, MAT, MAP and MARad to slope_RatioPielou and (l) slope_NDVImax, slope_AT, slope_AP and slope_ARad to slope_RatioPielou.
Remotesensing 15 02947 g0a25
Table A1. The mean, standard deviation, minimum and maximum values for the change rate of potential and actual α-diversity in the 17 grassland types during the period 2000–2020.
IndexGrassland TypesChange Rate of Potential α-DiversityChange Rate of Actual α-Diversity
MeanStandard DeviationMinimumMaximumMeanStandard DeviationMinimumMaximum
Species richnesstemperate meadow-steppe 0.00180.0108−0.160.06−0.00650.0174−0.120.14
temperate steppe −0.01480.0515−0.290.200.00540.0310−0.170.21
temperate desert-steppe 0.00000.0157−0.130.070.00070.0174−0.100.09
alpine meadow-steppe −0.00420.0512−0.290.18−0.00210.0369−0.160.19
alpine steppe 0.00600.0350−0.290.21−0.00150.0339−0.210.24
alpine desert-steppe 0.00240.0191−0.220.13−0.01480.0323−0.170.09
temperate steppe-desert−0.00200.0102−0.050.03−0.00380.0124−0.110.06
temperate desert0.00310.0114−0.060.080.00100.0076−0.130.11
alpine desert0.00400.0118−0.100.10−0.00560.0219−0.140.12
warm-temperate tussock0.00050.0039−0.010.04−0.00470.0123−0.070.07
warm-temperate shrub tussock−0.00080.0045−0.060.06−0.00800.0160−0.140.07
tropical tussock0.00030.00340.000.06−0.00040.0037−0.050.01
tropical shrub tussock−0.00010.0010−0.010.01−0.00250.0096−0.080.02
lowland meadow0.00120.0082−0.120.07−0.00070.0093−0.160.09
montane meadow0.00270.0190−0.180.170.00190.0185−0.170.18
alpine meadow0.00250.0409−0.300.210.00340.0319−0.210.23
swamp0.00200.0120−0.130.080.00180.0111−0.110.13
Shannontemperate meadow-steppe −0.00140.0032−0.020.01−0.00040.0024−0.010.01
temperate steppe −0.00110.0059−0.040.030.00090.0050−0.020.03
temperate desert-steppe 0.00010.0020−0.020.010.00180.0045−0.010.02
alpine meadow-steppe 0.00440.0089−0.030.040.00070.0047−0.020.03
alpine steppe 0.00140.0067−0.040.050.00120.0047−0.020.03
alpine desert-steppe −0.00190.0058−0.030.020.00110.0038−0.020.03
temperate steppe-desert−0.00030.0011−0.010.010.00150.0039−0.010.02
temperate desert0.00000.0013−0.010.020.00140.0025−0.010.02
alpine desert−0.00020.0033−0.020.020.00250.0036−0.010.02
warm-temperate tussock−0.00020.0012−0.010.00−0.00050.0021−0.010.01
warm-temperate shrub tussock−0.00030.0013−0.020.01−0.00090.0023−0.010.01
tropical tussock0.00000.0010−0.020.000.00000.0013−0.010.01
tropical shrub tussock0.00000.0003−0.010.00−0.00030.0018−0.010.01
lowland meadow0.00000.0010−0.010.010.00090.0035−0.020.02
montane meadow0.00120.0032−0.030.020.00050.0033−0.020.02
alpine meadow0.00130.0055−0.030.04−0.00070.0048−0.030.03
swamp0.00120.0019−0.010.020.00070.0023−0.010.02
Simpsontemperate meadow-steppe −0.00030.0010−0.010.00−0.00020.0009−0.010.00
temperate steppe −0.00010.0020−0.010.010.00020.0023−0.010.01
temperate desert-steppe 0.00020.00080.000.010.00050.0018−0.010.01
alpine meadow-steppe 0.00210.0027−0.010.010.00080.0017−0.010.01
alpine steppe 0.00100.0023−0.010.010.00060.0019−0.010.01
alpine desert-steppe −0.00060.0018−0.010.010.00030.0012−0.010.01
temperate steppe-desert−0.00020.00060.000.000.00050.00140.000.01
temperate desert0.00010.0008−0.010.010.00040.0012−0.010.01
alpine desert0.00000.0015−0.010.010.00060.0013−0.010.01
warm-temperate tussock−0.00010.00050.000.00−0.00010.00070.000.00
warm-temperate shrub tussock−0.00020.0005−0.010.00−0.00020.0007−0.010.00
tropical tussock0.00000.0004−0.010.000.00000.00060.000.00
tropical shrub tussock0.00000.00010.000.00−0.00010.0008−0.010.00
lowland meadow0.00010.00050.000.000.00020.0012−0.010.01
montane meadow0.00060.0010−0.010.010.00010.0015−0.010.01
alpine meadow0.00100.0018−0.010.01−0.00010.0019−0.020.01
swamp0.00070.00060.000.000.00020.0010−0.010.01
Pieloutemperate meadow-steppe 0.00050.00080.000.00−0.00010.0010−0.010.00
temperate steppe 0.00010.00160.000.010.00040.0023−0.010.01
temperate desert-steppe 0.00000.00070.000.010.00020.0012−0.010.01
alpine meadow-steppe 0.00190.0020−0.010.010.00090.0017−0.010.01
alpine steppe 0.00020.0024−0.010.010.00040.0015−0.010.01
alpine desert-steppe −0.00190.0024−0.010.010.00000.0009−0.010.01
temperate steppe-desert−0.00030.00070.000.000.00040.00090.000.00
temperate desert−0.00030.00080.000.000.00010.0008−0.010.01
alpine desert−0.00140.0017−0.010.00−0.00010.00080.000.01
warm-temperate tussock0.00000.00020.000.00−0.00020.00070.000.00
warm-temperate shrub tussock0.00020.00060.000.00−0.00030.00080.000.00
tropical tussock0.00000.00030.000.000.00000.00030.000.00
tropical shrub tussock0.00000.00000.000.00−0.00010.00050.000.00
lowland meadow−0.00030.00100.000.010.00010.0008−0.010.01
montane meadow0.00050.00120.000.010.00010.0013−0.010.01
alpine meadow0.00080.0017−0.010.010.00000.0017−0.010.01
swamp0.00020.0011−0.010.010.00010.0007−0.010.01
Table A2. The mean, standard deviation, minimum and maximum values for human activities’ effects on plant species α-diversity in the 17 grassland types during the period 2000–2020.
IndexGrassland TypesMeanStandard DeviationMinimumMaximum
Species richnesstemperate meadow-steppe 0.93 0.09 0.79 1.41
temperate steppe 0.93 0.17 0.07 1.59
temperate desert-steppe 0.82 0.21 0.06 1.56
alpine meadow-steppe 1.04 0.13 0.08 1.48
alpine steppe 0.99 0.15 0.06 1.61
alpine desert-steppe 0.97 0.17 0.07 1.47
temperate steppe-desert0.87 0.25 0.06 1.56
temperate desert0.74 0.11 0.06 1.21
alpine desert0.91 0.14 0.06 1.24
warm-temperate tussock1.01 0.07 0.75 1.27
warm-temperate shrub tussock1.00 0.07 0.84 1.43
tropical tussock1.03 0.04 0.91 1.20
tropical shrub tussock1.04 0.05 0.15 1.17
lowland meadow0.75 0.09 0.58 1.22
montane meadow1.00 0.11 0.05 1.46
alpine meadow1.02 0.13 0.05 1.60
swamp1.01 0.13 0.65 1.39
Shannontemperate meadow-steppe 1.32 0.20 0.84 1.58
temperate steppe 1.35 0.21 0.14 2.12
temperate desert-steppe 1.40 0.24 0.09 2.13
alpine meadow-steppe 1.22 0.23 0.09 2.12
alpine steppe 1.36 0.29 0.09 2.17
alpine desert-steppe 1.43 0.29 0.10 2.18
temperate steppe-desert1.33 0.31 0.12 2.11
temperate desert1.43 0.19 0.11 2.14
alpine desert1.55 0.23 0.11 2.15
warm-temperate tussock1.35 0.12 0.92 1.62
warm-temperate shrub tussock1.36 0.11 0.91 1.55
tropical tussock1.29 0.08 0.90 1.47
tropical shrub tussock1.33 0.07 0.18 1.50
lowland meadow1.59 0.25 0.84 2.13
montane meadow1.05 0.19 0.05 2.08
alpine meadow1.12 0.22 0.05 2.13
swamp1.07 0.30 0.85 1.95
Simpsontemperate meadow-steppe 1.00 0.11 0.70 1.16
temperate steppe 1.10 0.14 0.10 1.55
temperate desert-steppe 1.01 0.08 0.09 1.30
alpine meadow-steppe 1.13 0.13 0.09 1.57
alpine steppe 1.11 0.15 0.08 1.58
alpine desert-steppe 1.08 0.14 0.09 1.58
temperate steppe-desert0.98 0.12 0.09 1.40
temperate desert0.98 0.08 0.09 1.34
alpine desert1.13 0.12 0.09 1.57
warm-temperate tussock0.99 0.08 0.77 1.12
warm-temperate shrub tussock1.00 0.08 0.72 1.15
tropical tussock0.93 0.05 0.74 1.09
tropical shrub tussock0.97 0.06 0.14 1.10
lowland meadow1.04 0.09 0.69 1.49
montane meadow0.84 0.14 0.04 1.57
alpine meadow1.00 0.17 0.04 1.59
swamp0.85 0.18 0.69 1.36
Pieloutemperate meadow-steppe 0.89 0.05 0.79 1.16
temperate steppe 1.02 0.09 0.10 1.33
temperate desert-steppe 1.04 0.08 0.09 1.26
alpine meadow-steppe 1.11 0.10 0.09 1.36
alpine steppe 1.10 0.12 0.08 1.38
alpine desert-steppe 1.08 0.13 0.10 1.35
temperate steppe-desert1.01 0.12 0.10 1.25
temperate desert1.05 0.07 0.10 1.31
alpine desert1.14 0.10 0.10 1.38
warm-temperate tussock0.87 0.04 0.82 1.14
warm-temperate shrub tussock0.87 0.03 0.81 1.17
tropical tussock0.86 0.01 0.83 0.93
tropical shrub tussock0.86 0.03 0.12 0.95
lowland meadow1.03 0.05 0.82 1.33
montane meadow0.89 0.09 0.04 1.35
alpine meadow1.02 0.13 0.04 1.38
swamp0.92 0.12 0.82 1.28
Table A3. The mean, standard deviation, minimum and maximum values for the change rate of human activities effects on plant species α-diversity in the 17 grassland types during the period 2000–2020.
IndexGrassland TypesMeanStandard DeviationMinimumMaximum
Species richnesstemperate meadow-steppe −0.0016 0.0030 −0.02 0.02
temperate steppe 0.0035 0.0092 −0.03 0.05
temperate desert-steppe −0.0006 0.0043 −0.03 0.02
alpine meadow-steppe 0.0007 0.0089 −0.04 0.04
alpine steppe −0.0014 0.0070 −0.05 0.05
alpine desert-steppe −0.0046 0.0066 −0.04 0.03
temperate steppe-desert−0.0006 0.0026 −0.02 0.01
temperate desert−0.0003 0.0022 −0.03 0.01
alpine desert−0.0029 0.0056 −0.03 0.02
warm-temperate tussock−0.0008 0.0021 −0.01 0.01
warm-temperate shrub tussock−0.0016 0.0029 −0.02 0.01
tropical tussock−0.0002 0.0011 −0.02 0.00
tropical shrub tussock−0.0005 0.0016 −0.01 0.00
lowland meadow−0.0005 0.0018 −0.02 0.02
montane meadow0.0003 0.0037 −0.03 0.03
alpine meadow0.0009 0.0063 −0.04 0.05
swamp0.0008 0.0031 −0.02 0.02
Shannontemperate meadow-steppe 0.0016 0.0035 −0.01 0.02
temperate steppe 0.0014 0.0073 −0.04 0.04
temperate desert-steppe 0.0021 0.0052 −0.03 0.03
alpine meadow-steppe −0.0050 0.0099 −0.06 0.05
alpine steppe −0.0018 0.0094 −0.06 0.06
alpine desert-steppe 0.0050 0.0090 −0.03 0.06
temperate steppe-desert0.0028 0.0046 −0.02 0.03
temperate desert0.0018 0.0038 −0.04 0.03
alpine desert0.0042 0.0073 −0.05 0.05
warm-temperate tussock0.0005 0.0024 −0.01 0.02
warm-temperate shrub tussock0.0002 0.0022 −0.01 0.02
tropical tussock0.0000 0.0014 −0.01 0.02
tropical shrub tussock−0.0003 0.0018 −0.01 0.01
lowland meadow0.0015 0.0044 −0.02 0.03
montane meadow−0.0010 0.0040 −0.04 0.02
alpine meadow−0.0024 0.0058 −0.05 0.05
swamp−0.0014 0.0038 −0.04 0.02
Simpsontemperate meadow-steppe 0.0003 0.0022 −0.01 0.02
temperate steppe 0.0010 0.0063 −0.02 0.03
temperate desert-steppe 0.0006 0.0034 −0.02 0.02
alpine meadow-steppe −0.0030 0.0061 −0.04 0.03
alpine steppe −0.0010 0.0060 −0.03 0.03
alpine desert-steppe 0.0025 0.0040 −0.02 0.03
temperate steppe-desert0.0015 0.0026 −0.01 0.02
temperate desert0.0009 0.0022 −0.01 0.02
alpine desert0.0021 0.0040 −0.02 0.03
warm-temperate tussock0.0001 0.0015 −0.01 0.01
warm-temperate shrub tussock0.0000 0.0013 −0.01 0.01
tropical tussock0.0000 0.0010 −0.01 0.01
tropical shrub tussock−0.0001 0.0012 −0.01 0.01
lowland meadow0.0004 0.0027 −0.02 0.02
montane meadow−0.0006 0.0031 −0.02 0.02
alpine meadow−0.0022 0.0048 −0.04 0.03
swamp−0.0003 0.0020 −0.01 0.02
Pieloutemperate meadow-steppe −0.0007 0.0016 −0.01 0.00
temperate steppe 0.0000 0.0038 −0.02 0.02
temperate desert-steppe 0.0002 0.0017 −0.01 0.01
alpine meadow-steppe −0.0022 0.0040 −0.02 0.02
alpine steppe 0.0002 0.0040 −0.02 0.02
alpine desert-steppe 0.0028 0.0036 −0.02 0.02
temperate steppe-desert0.0012 0.0015 0.00 0.01
temperate desert0.0005 0.0013 −0.01 0.01
alpine desert0.0021 0.0026 −0.01 0.02
warm-temperate tussock−0.0005 0.0010 −0.01 0.00
warm-temperate shrub tussock−0.0007 0.0013 −0.01 0.00
tropical tussock−0.0001 0.0005 0.00 0.00
tropical shrub tussock−0.0003 0.0008 0.00 0.00
lowland meadow0.0004 0.0019 −0.02 0.01
montane meadow−0.0007 0.0021 −0.02 0.01
alpine meadow−0.0016 0.0037 −0.03 0.02
swamp0.0001 0.0015 −0.01 0.01

References

  1. Pauli, H.; Gottfried, M.; Dullinger, S.; Abdaladze, O.; Akhalkatsi, M.; Benito Alonso, J.L.; Coldea, G.; Dick, J.; Erschbamer, B.; Fernandez Calzado, R.; et al. Recent Plant Diversity Changes on Europe’s Mountain Summits. Science 2012, 336, 353–355. [Google Scholar] [CrossRef] [PubMed] [Green Version]
  2. Brummitt, N.; Araujo, A.C.; Harris, T. Areas of plant diversity—What do we know? Plants People Planet 2021, 3, 33–44. [Google Scholar] [CrossRef]
  3. Han, F.; Yu, C.; Fu, G. Temperature sensitivities of aboveground net primary production, species and phylogenetic diversity do not increase with increasing elevation in alpine grasslands. Glob. Ecol. Conserv. 2023, 43, e02464. [Google Scholar] [CrossRef]
  4. Han, F.; Yu, C.; Fu, G. Asymmetric warming among elevations may homogenize plant α-diversity and aboveground net primary production of alpine grasslands. Front. Ecol. Evol. 2023, 11, 1126651. [Google Scholar] [CrossRef]
  5. Zha, X.J.; Tian, Y.; Ouzhu; Fu, G. Response of forage nutrient storages to grazing in alpine grasslands. Front. Plant Sci. 2022, 13, 991287. [Google Scholar] [CrossRef] [PubMed]
  6. Zong, N.; Fu, G. Variations in species and function diversity of soil fungal community along a desertification gradient in an alpine steppe. Ecol. Indic. 2021, 131, 108197. [Google Scholar] [CrossRef]
  7. Berendse, F.; van Ruijven, J.; Jongejans, E.; Keesstra, S. Loss of Plant Species Diversity Reduces Soil Erosion Resistance. Ecosystems 2015, 18, 881–888. [Google Scholar] [CrossRef] [Green Version]
  8. Welti, E.; Helzer, C.; Joern, A. Impacts of plant diversity on arthropod communities and plant-herbivore network architecture. Ecosphere 2017, 8, e01983. [Google Scholar] [CrossRef] [Green Version]
  9. De Boeck, H.J.; Lemmens, C.; Gielen, B.; Bossuyt, H.; Malchair, S.; Carnol, M.; Merckx, R.; Ceulemans, R.; Nijs, I. Combined effects of climate warming and plant diversity loss on above- and below-ground grassland productivity. Environ. Exp. Bot. 2007, 60, 95–104. [Google Scholar] [CrossRef]
  10. Fu, G.; Shen, Z.X. Response of alpine plants to nitrogen addition on the Tibetan Plateau: A meta-analysis. J. Plant Growth Regul. 2016, 35, 974–979. [Google Scholar] [CrossRef]
  11. Sun, W.; Li, S.; Wang, J.; Fu, G. Effects of grazing on plant species and phylogenetic diversity in alpine grasslands, Northern Tibet. Ecol. Eng. 2021, 170, 106331. [Google Scholar] [CrossRef]
  12. Prieto, P.; Penuelas, J.; Lloret, F.; Llorens, L.; Estiarte, M. Experimental drought and warming decrease diversity and slow down post-fire succession in a Mediterranean shrubland. Ecography 2009, 32, 623–636. [Google Scholar] [CrossRef]
  13. Liu, X.; Chen, L.; Liu, M.; Garcia-Guzman, G.; Gilbert, G.S.; Zhou, S. Dilution effect of plant diversity on infectious diseases: Latitudinal trend and biological context dependence. Oikos 2020, 129, 457–465. [Google Scholar] [CrossRef] [Green Version]
  14. Wang, J.; Yu, C.; Fu, G. Warming reconstructs the elevation distributions of aboveground net primary production, plant species and phylogenetic diversity in alpine grasslands. Ecol. Indic. 2021, 133, 108355. [Google Scholar] [CrossRef]
  15. Klein, J.A.; Harte, J.; Zhao, X.Q. Experimental warming causes large and rapid species loss, dampened by simulated grazing, on the Tibetan Plateau. Ecol. Lett. 2004, 7, 1170–1179. [Google Scholar] [CrossRef]
  16. Trisos, C.H.; Merow, C.; Pigot, A.L. The projected timing of abrupt ecological disruption from climate change. Nature 2020, 580, 496–501. [Google Scholar] [CrossRef]
  17. Wang, S.P.; Duan, J.C.; Xu, G.P.; Wang, Y.F.; Zhang, Z.H.; Rui, Y.C.; Luo, C.Y.; Xu, B.; Zhu, X.X.; Chang, X.F.; et al. Effects of warming and grazing on soil N availability, species composition, and ANPP in an alpine meadow. Ecology 2012, 93, 2365–2376. [Google Scholar] [CrossRef]
  18. Zhang, Y.; Gao, Q.Z.; Dong, S.K.; Liu, S.L.; Wang, X.X.; Su, X.K.; Li, Y.Y.; Tang, L.; Wu, X.Y.; Zhao, H.D. Effects of grazing and climate warming on plant diversity, productivity and living state in the alpine rangelands and cultivated grasslands of the Qinghai-Tibetan Plateau. Rangel. J. 2015, 37, 57–65. [Google Scholar] [CrossRef]
  19. Piao, S.L.; Zhang, X.Z.; Wang, T.; Liang, E.Y.; Wang, S.P.; Zhu, J.T.; Ben, N. Responses and feedback of the Tibetan Plateau’s alpine ecosystem to climate change. Chin. Sci. Bull. 2019, 64, 2842–2855. [Google Scholar] [CrossRef]
  20. Mi, X.; Feng, G.; Hu, Y.; Zhang, J.; Chen, L.; Corlett, R.T.; Hughes, A.C.; Pimm, S.; Schmid, B.; Shi, S.; et al. The global significance of biodiversity science in China: An overview. Natl. Sci. Rev. 2021, 8, nwab032. [Google Scholar] [CrossRef]
  21. Dorji, T.; Hopping, K.A.; Wang, S.P.; Piao, S.L.; Tarchen, T.; Klein, J.A. Grazing and spring snow counteract the effects of warming on an alpine plant community in Tibet through effects on the dominant species. Agric. For. Meteorol. 2018, 263, 188–197. [Google Scholar] [CrossRef]
  22. Klein, J.A.; Harte, J.; Zhao, X.Q. Decline in medicinal and forage species with warming is mediated by plant traits on the Tibetan Plateau. Ecosystems 2008, 11, 775–789. [Google Scholar] [CrossRef]
  23. Wang, C.T.; Long, R.J.; Wang, Q.J.; Ding, L.M.; Wang, M.P. Effects of altitude on plant-species diversity and productivity in an alpine meadow, Qinghai-Tibetan plateau. Aust. J. Bot. 2007, 55, 110–117. [Google Scholar] [CrossRef] [Green Version]
  24. Han, W.W.; Luo, Y.J.; Du, G.Z. Effects of clipping on diversity and above-ground biomass associated with soil fertility on an alpine meadow in the eastern region of the Qinghai-Tibetan Plateau. N. Z. J. Agric. Res. 2007, 50, 361–368. [Google Scholar] [CrossRef]
  25. Wen, J.; Qin, R.M.; Zhang, S.X.; Yang, X.Y.; Xu, M.H. Effects of long-term warming on the aboveground biomass and species diversity in an alpine meadow on the Qinghai-Tibetan Plateau of China. J. Arid Land 2020, 12, 252–266. [Google Scholar] [CrossRef]
  26. Zhou, X.L.; Guo, Z.; Zhang, P.F.; Li, H.L.; Chu, C.J.; Li, X.L.; Du, G.Z. Different categories of biodiversity explain productivity variation after fertilization in a Tibetan alpine meadow community. Ecol. Evol. 2017, 7, 3464–3474. [Google Scholar] [CrossRef]
  27. Ganjurjav, H.; Duan, M.J.; Wan, Y.F.; Zhang, W.N.; Gao, Q.Z.; Li, Y.; Jiangcun, W.Z.; Danjiu, L.B.; Guo, H.B. Effects of grazing by large herbivores on plant diversity and productivity of semi-arid alpine steppe on the Qinghai-Tibetan Plateau. Rangel. J. 2015, 37, 389–397. [Google Scholar] [CrossRef]
  28. Niu, K.C.; Choler, P.; de Bello, F.; Mirotchnick, N.; Du, G.Z.; Sun, S.C. Fertilization decreases species diversity but increases functional diversity: A three-year experiment in a Tibetan alpine meadow. Agric. Ecosyst. Environ. 2014, 182, 106–112. [Google Scholar] [CrossRef]
  29. Wu, J.S.; Zhang, X.; Shen, Z.; Shi, P.; Yu, C.Q. Species richness and diversity of alpine grasslands on the Northern Tibetan Plateau:effects of grazing exclusion and growing season precipitation. J. Resour. Ecol. 2012, 3, 236–242. [Google Scholar]
  30. Stuart Chapin, F., III; Diaz, S. Interactions between changing climate and biodiversity: Shaping humanity’s future COMMENT. Proc. Natl. Acad. Sci. USA 2020, 117, 6295–6296. [Google Scholar] [CrossRef]
  31. Fu, G.; Sun, W. Temperature sensitivities of vegetation indices and aboveground biomass are primarily linked with warming magnitude in high-cold grasslands. Sci. Total Environ. 2022, 843, 157002. [Google Scholar] [CrossRef] [PubMed]
  32. Tian, Y.; Fu, G. Quantifying plant species α-diversity using normalized difference vegetation index and climate data in alpine grasslands. Remote Sens. 2022, 14, 5007. [Google Scholar] [CrossRef]
  33. Fu, G.; Wang, J.; Li, S. Response of forage nutritional quality to climate change and human activities in alpine grasslands. Sci. Total Environ. 2022, 845, 157552. [Google Scholar] [CrossRef] [PubMed]
  34. Wang, D.J.; Zhou, H.K.; Yao, B.Q.; Wang, W.Y.; Dong, S.K.; Shang, Z.H.; She, Y.D.; Ma, L.; Huang, X.T.; Zhang, Z.H.; et al. Effects of nutrient addition on degraded alpine grasslands of the Qinghai-Tibetan Plateau: A meta-analysis. Agric. Ecosyst. Environ. 2020, 301, 106970. [Google Scholar] [CrossRef]
  35. Xiong, D.P.; Shi, P.L.; Zhang, X.Z.; Zou, C.B. Effects of grazing exclusion on carbon sequestration and plant diversity in grasslands of China—A meta-analysis. Ecol. Eng. 2016, 94, 647–655. [Google Scholar] [CrossRef]
  36. Wang, J.; Li, M.; Yu, C.; Fu, G. The change in environmental variables linked to climate change has a stronger effect on aboveground net primary productivity than does phenological change in alpine grasslands. Front. Plant Sci. 2022, 12, 798633. [Google Scholar] [CrossRef]
  37. Fu, G.; Li, S.W.; Sun, W.; Shen, Z.X. Relationships between vegetation carbon use efficiency and climatic factors on the Tibetan Plateau. Can. J. Remote Sens. 2016, 42, 16–26. [Google Scholar] [CrossRef]
  38. Li, J.J.; Yang, C.; Zhou, H.K.; Shao, X.Q. Responses of plant diversity and soil microorganism diversity to water and nitrogen additions in the Qinghai-Tibetan Plateau. Glob. Ecol. Conserv. 2020, 22, e01003. [Google Scholar] [CrossRef]
  39. Zhang, C.H.; Willis, C.G.; Klein, J.A.; Ma, Z.; Li, J.Y.; Zhou, H.K.; Zhao, X.Q. Recovery of plant species diversity during long-term experimental warming of a species-rich alpine meadow community on the Qinghai-Tibet plateau. Biol. Conserv. 2017, 213, 218–224. [Google Scholar] [CrossRef]
  40. Woodward, F.I.; Kelly, C.K. Responses of global plant diversity capacity to changes in carbon dioxide concentration and climate. Ecol. Lett. 2008, 11, 1229–1237. [Google Scholar] [CrossRef]
  41. Halloy, S.R.P.; Mark, A.F. Climate-change effects on alpine plant biodiversity: A New Zealand perspective on quantifying the threat. Arct. Antarct. Alp. Res. 2003, 35, 248–254. [Google Scholar] [CrossRef]
  42. Dolezal, J.; Dvorsky, M.; Kopecky, M.; Liancourt, P.; Hiiesalu, I.; Macek, M.; Altman, J.; Chlumska, Z.; Rehakova, K.; Capkova, K.; et al. Vegetation dynamics at the upper elevational limit of vascular plants in Himalaya. Sci. Rep. 2016, 6, 24881. [Google Scholar] [CrossRef] [Green Version]
  43. Wang, J.W.; Yu, C.Q.; Fu, G. Asymmetrical warming between elevations may result in similar plant community composition between elevations in alpine grasslands. Front. Ecol. Evol. 2021, 9, 757943. [Google Scholar] [CrossRef]
  44. Zhang, Z.; van Kleunen, M. Common alien plants are more competitive than rare natives but not than common natives. Ecol. Lett. 2019, 22, 1378–1386. [Google Scholar] [CrossRef] [PubMed]
  45. Cohen, I.; Zandalinas, S.I.; Huck, C.; Fritschi, F.B.; Mittler, R. Meta-analysis of drought and heat stress combination impact on crop yield and yield components. Physiol. Plant. 2021, 171, 66–76. [Google Scholar] [CrossRef]
  46. Lemoine, N.P.; Doublet, D.; Salminen, J.-P.; Burkepile, D.E.; Parker, J.D. Responses of plant phenology, growth, defense, and reproduction to interactive effects of warming and insect herbivory. Ecology 2017, 98, 1817–1828. [Google Scholar] [CrossRef] [PubMed]
  47. An, H.; Zhao, Y.; Ma, M. Precipitation controls seed bank size and its role in alpine meadow community regeneration with increasing altitude. Glob. Chang. Biol. 2020, 26, 5767–5777. [Google Scholar] [CrossRef] [PubMed]
  48. Ma, M.; Collins, S.L.; Du, G. Direct and indirect effects of temperature and precipitation on alpine seed banks in the Tibetan Plateau. Ecol. Appl. 2020, 30, e02096. [Google Scholar] [CrossRef] [PubMed]
  49. Wang, Q.; Zhang, Z.; Du, R.; Wang, S.; Duan, J.; Iler, A.M.; Piao, S.; Luo, C.; Jiang, L.; Lv, W.; et al. Richness of plant communities plays a larger role than climate in determining responses of species richness to climate change. J. Ecol. 2019, 107, 1944–1955. [Google Scholar] [CrossRef]
  50. Fu, G.; Shen, Z.X.; Sun, W.; Zhong, Z.M.; Zhang, X.Z.; Zhou, Y.T. A meta-analysis of the effects of experimental warming on plant physiology and growth on the Tibetan Plateau. J. Plant Growth Regul. 2015, 34, 57–65. [Google Scholar] [CrossRef]
  51. Aydogan, E.L.; Budich, O.; Hardt, M.; Choi, Y.H.; Jansen-Willems, A.B.; Moser, G.; Mueller, C.; Kaempfer, P.; Glaeser, S.P. Global warming shifts the composition of the abundant bacterial phyllosphere microbiota as indicated by a cultivation-dependent and -independent study of the grassland phyllosphere of a long-term warming field experiment. FEMS Microbiol. Ecol. 2020, 96, fiaa087. [Google Scholar] [CrossRef] [PubMed]
  52. Li, J.; Bates, K.A.; Hoang, K.L.; Hector, T.E.; Knowles, S.C.L.; King, K.C. Experimental temperatures shape host microbiome diversity and composition. Glob. Chang. Biol. 2023, 29, 41–56. [Google Scholar] [CrossRef] [PubMed]
  53. Faticov, M.; Abdelfattah, A.; Roslin, T.; Vacher, C.; Hamback, P.; Blanchet, F.G.; Lindahl, B.D.; Tack, A.J.M. Climate warming dominates over plant genotype in shaping the seasonal trajectory of foliar fungal communities on oak. N. Phytol. 2021, 231, 1770–1783. [Google Scholar] [CrossRef]
  54. Khlifa, R.; Houle, D.; Morin, H.; Kembel, S.W. Inconsistent effects of nitrogen canopy enrichment and soil warming on black spruce epiphytic phyllosphere bacterial communities, taxa, and functions. Can. J. For. Res. 2021, 51, 1199–1207. [Google Scholar] [CrossRef]
  55. Perazzolli, M.; Vicelli, B.; Antonielli, L.; Longa, C.M.O.; Bozza, E.; Bertini, L.; Caruso, C.; Pertot, I. Simulated global warming affects endophytic bacterial and fungal communities of Antarctic pearlwort leaves and some bacterial isolates support plant growth at low temperatures. Sci. Rep. 2022, 12, 18839. [Google Scholar] [CrossRef]
  56. Zhu, Y.-G.; Xiong, C.; Wei, Z.; Chen, Q.-L.; Ma, B.; Zhou, S.-Y.-D.; Tan, J.; Zhang, L.-M.; Cui, H.-L.; Duan, G.-L. Impacts of global change on the phyllosphere microbiome. N. Phytol. 2022, 234, 1977–1986. [Google Scholar] [CrossRef]
  57. Sun, W.; Li, S.; Zhang, Y.; Fu, G. Effect of long-term experimental warming on the nutritional quality of alpine meadows in the Northern Tibet. J. Resour. Ecol. 2020, 11, 516–524. [Google Scholar]
  58. Donoghue, M.J. A phylogenetic perspective on the distribution of plant diversity. Proc. Natl. Acad. Sci. USA 2008, 105, 11549–11555. [Google Scholar] [CrossRef] [PubMed] [Green Version]
  59. Telwala, Y.; Brook, B.W.; Manish, K.; Pandit, M.K. Climate-Induced Elevational Range Shifts and Increase in Plant Species Richness in a Himalayan Biodiversity Epicentre. PLoS ONE 2013, 8, e57103. [Google Scholar] [CrossRef] [Green Version]
  60. He, X.; Burgess, K.S.; Gao, L.-M.; Li, D.-Z. Distributional responses to climate change for alpine species of Cyananthus and Primula endemic to the Himalaya-Hengduan Mountains. Plant Divers. 2019, 41, 26–32. [Google Scholar] [CrossRef]
  61. Fu, G.; Shen, Z.X.; Zhang, X.Z. Increased precipitation has stronger effects on plant production of an alpine meadow than does experimental warming in the Northern Tibetan Plateau. Agric. For. Meteorol. 2018, 249, 11–21. [Google Scholar] [CrossRef]
  62. Fu, G.; Shen, Z. Asymmetrical warming of growing/non-growing season increases soil respiration during growing season in an alpine meadow. Sci. Total Environ. 2022, 812, 152591. [Google Scholar] [CrossRef] [PubMed]
  63. Han, F.; Yu, C.; Fu, G. Non-growing/growing season non-uniform-warming increases precipitation use efficiency but reduces its temporal stability in an alpine meadow. Front. Plant Sci. 2023, 14, 1090204. [Google Scholar] [CrossRef]
  64. Yu, C.Q.; Han, F.S.; Fu, G. Effects of 7 years experimental warming on soil bacterial and fungal community structure in the Northern Tibet alpine meadow at three elevations. Sci. Total Environ. 2019, 655, 814–822. [Google Scholar] [CrossRef] [PubMed]
  65. Zhang, H.; Li, S.; Zhang, G.; Fu, G. Response of soil microbial communities to warming and clipping in alpine meadows in Northern Tibet. Sustainability 2020, 12, 5617. [Google Scholar] [CrossRef]
  66. Sun, W.; Li, S.; Zhang, G.; Fu, G.; Qi, H.; Li, T. Effects of climate change and anthropogenic activities on soil pH in grassland regions on the Tibetan Plateau. Glob. Ecol. Conserv. 2023, 45, 11–18. [Google Scholar] [CrossRef]
  67. Rusch, G.M.; Oesterheld, M. Relationship between productivity, and species and functional group diversity in grazed and non-grazed Pampas grassland. Oikos 1997, 78, 519–526. [Google Scholar] [CrossRef]
  68. Sun, W.; Qi, H.; Fu, G. Response of vegetation precipitation use efficiency to experimental warming in alpine grasslands of Northern Tibet. Pratacultural Sci. 2022, 39, 1069–1079. [Google Scholar]
  69. Tang, Z.G.; Deng, G.; Hu, G.J.; Zhang, H.B.; Pan, H.Z.; Sang, G.Q. Satellite observed spatiotemporal variability of snow cover and snow phenology over high mountain Asia from 2002 to 2021. J. Hydrol. 2022, 613, 128438. [Google Scholar] [CrossRef]
  70. Deng, G.; Tang, Z.G.; Hu, G.J.; Wang, J.W.; Sang, G.Q.; Li, J. Spatiotemporal Dynamics of Snowline Altitude and Their Responses to Climate Change in the Tienshan Mountains, Central Asia, during 2001–2019. Sustainability 2021, 13, 3992. [Google Scholar] [CrossRef]
  71. Tang, Z.G.; Wang, X.R.; Deng, G.; Wang, X.; Jiang, Z.L.; Sang, G.Q. Spatiotemporal variation of snowline altitude at the end of melting season across High Mountain Asia, using MODIS snow cover product. Adv. Space Res. 2020, 66, 2629–2645. [Google Scholar] [CrossRef]
  72. Tang, Z.G.; Wang, X.R.; Wang, J.; Wang, X.; Li, H.Y.; Jiang, Z.L. Spatiotemporal Variation of Snow Cover in Tianshan Mountains, Central Asia, Based on Cloud-Free MODIS Fractional Snow Cover Product, 2001–2015. Remote Sens. 2017, 9, 1045. [Google Scholar] [CrossRef] [Green Version]
  73. Tang, Z.G.; Wang, J.; Li, H.Y.; Liang, J.; Li, C.K.; Wang, X. Extraction and assessment of snowline altitude over the Tibetan plateau using MODIS fractional snow cover data (2001 to 2013). J. Appl. Remote Sens. 2014, 8, 084689. [Google Scholar] [CrossRef]
  74. Han, F.S.; Yu, C.Q.; Fu, G. Warming alters elevation distributions of soil bacterial and fungal communities in alpine grasslands. Glob. Ecol. Conserv. 2022, 39, e02306. [Google Scholar] [CrossRef]
  75. Ma, M.; Walck, J.L.; Ma, Z.; Wang, L.; Du, G. Grazing disturbance increases transient but decreases persistent soil seed bank. Ecol. Appl. 2018, 28, 1020–1031. [Google Scholar] [CrossRef]
  76. Shi, Y.-F.; Shi, S.-H.; Huang, X.-M.; Jiang, Y.-S.; Liu, J.; Zhao, Y.; Zhang, Z.-S. A global meta-analysis of grazing effects on soil seed banks. Land Degrad. Dev. 2022, 33, 1892–1900. [Google Scholar] [CrossRef]
  77. Sternberg, M.; Gutman, M.; Perevolotsky, A.; Kigel, J. Effects of grazing on soil seed bank dynamics: An approach with functional groups. J. Veg. Sci. 2003, 14, 375–386. [Google Scholar] [CrossRef]
  78. Zhang, H.; Fu, G. Responses of plant, soil bacterial and fungal communities to grazing vary with pasture seasons and grassland types, northern Tibet. Land Degrad. Dev. 2021, 32, 1821–1832. [Google Scholar] [CrossRef]
  79. Fu, G.; Wang, J.; Li, S.; He, P. Responses of forage nutrient quality to grazing in the alpine grassland of Northern Tibet. Acta Prataculturae Sin. 2021, 30, 38–50. [Google Scholar]
  80. Wang, C.; Kan, A.; Zeng, Y.; Li, G.; Wang, M.; Ci, R. Population distribution pattern and influencing factors in Tibet based on random forest model. Acta Geogr. Sini. 2019, 74, 664–680. [Google Scholar]
  81. Nathan, R.; Schurr, F.M.; Spiegel, O.; Steinitz, O.; Trakhtenbrot, A.; Tsoar, A. Mechanisms of long-distance seed dispersal. Trends Ecol. Evol. 2008, 23, 638–647. [Google Scholar] [CrossRef] [PubMed]
  82. Cain, M.L.; Milligan, B.G.; Strand, A.E. Long-distance seed dispersal in plant populations. Am. J. Bot. 2000, 87, 1217–1227. [Google Scholar] [CrossRef] [PubMed] [Green Version]
  83. Fu, G.; Shen, Z.X. Response of alpine soils to nitrogen addition on the Tibetan Plateau: A meta-analysis. Appl. Soil Ecol. 2017, 114, 99–104. [Google Scholar] [CrossRef]
  84. Zhang, H.; Fu, G. Responses of phylogenetic diversity of soil fungal community to grazing in alpine grasslands of the Northern Tibet. Acta Agrestia Sin. 2022, 30, 21–28. [Google Scholar]
Figure 1. Spatial patterns for the change rate in (a) potential species richness (slope_SRp), (b) actual species richness (slope_SRa), (c) potential Shannon (slope_Shannonp), (d) actual Shannon (slope_Shannona), (e) potential Simpson (slope_Simpsonp), (f) actual Simpson (slope_Simpsona), (g) potential Pielou (slope_Pieloup) and (h) actual Pielou (slope_Pieloua).
Remotesensing 15 02947 g001
Figure 2. Spatial patterns for the significance of the change rate in (a) potential species richness (slope_SRp), (b) actual species richness (slope_SRa), (c) potential Shannon (slope_Shannonp), (d) actual Shannon (slope_Shannona), (e) potential Simpson (slope_Simpsonp), (f) actual Simpson (slope_Simpsona), (g) potential Pielou (slope_Pieloup) and (h) actual Pielou (slope_Pieloua).
Remotesensing 15 02947 g002
Figure 3. Relative contributions of geography position (i.e., longitude, latitude and elevation), mean climate conditions (i.e., mean annual temperature, mean annual precipitation and mean annual radiation in 2000–2020) and climate change (i.e., change rate for annual temperature, annual precipitation and annual radiation in 2000–2020) to change rate of (a) potential species richness (slope_SRp), (b) actual species richness (slope_SRa), (c) potential Shannon (slope_Shannonp), (d) actual Shannon (slope_Shannona), (e) potential Simpson (slope_Simpsonp), (f) actual Simpson (slope_ Simpsona), (g) potential Pielou (slope_Pieloup) and (h) actual Pielou (slope_Pieloua).
Remotesensing 15 02947 g003
Figure 4. Spatial patterns for (a) the ratio of mean actual species richness to potential species richness (RatioSR), (b) the ratio of mean actual Shannon to potential Shannon (RatioShannon), (c) the ratio of mean actual Simpson to potential Simpson (RatioSimpson) and (d) the ratio of mean actual Pielou to potential Pielou (RatioPielou).
Remotesensing 15 02947 g004
Figure 5. Relative contributions of geography position (i.e., longitude, latitude and elevation), mean climate conditions + NDVImax (i.e., mean annual temperature, mean annual precipitation, mean annual radiation and mean maximum normalized difference vegetation index during growing season in 2000–2020) and climate change + slope_NDVImax (i.e., change rate for annual temperature, annual precipitation, annual radiation and maximum normalized difference vegetation index during growing season in 2000–2020) to (a) mean effect of human activities on plant species richness (RatioSR), (b) change rate for effect of human activities on plant species richness (slope_RatioSR), (c) mean effect of human activities on plant Shannon (RatioShannon), (d) change rate for effect of human activities on plant Shannon (slope_RatioShannon), (e) mean effect of human activities on plant Simpson (RatioSimpson), (f) change rate for effect of human activities on plant Simpson (slope_RatioSimpson), (g) mean effect of human activities on plant Pielou (RatioPielou) and (h) change rate for effect of human activities on plant Pielou (slope_RatioPielou).
Remotesensing 15 02947 g005
Figure 6. Spatial patterns for (a) the change rate in the ratio of actual species richness to potential species richness (slope_RatioSR), (b) the change rate in the ratio of actual Shannon to potential Shannon (slope_RatioShannon), (c) the change rate in the ratio of actual Simpson to potential Simpson (slope_RatioSimpson), (d) the change rate in the ratio of actual Pielou to potential Pielou (slope_RatioPielou), (e) the significances of slope_RatioSR (p_ slope_RatioSR), (f) the significances of slope_RatioShannon (p_ slope_RatioShannon), (g) the significances of slope_RatioSimpson (p_ slope_RatioSimpson) and (h) the significances of slope_RatioPielou (p_ slope_RatioPielou).
Remotesensing 15 02947 g006
Figure 7. Spatial distribution for the changes of human activities on (a) species richness, (b) Shannon, (c) Simpson and (d) Pielou.
Remotesensing 15 02947 g007
Table 1. The area percent ratio (%) for the change rate of plant species α-diversity under different climate change conditions.
Change Rate of α-DiversityClimate Change Scenes
Warming,
Wetting, Brightening
Warming,
Wetting, Dimming
Warming,
Drying, Brightening
Warming,
Drying, Dimming
Cooling,
Wetting, Brightening
Cooling,
Wetting, Dimming
Cooling,
Drying, Brightening
Cooling,
Drying, Dimming
Slope_SRp<04.25 17.80 7.51 2.72 0.63 0.79 0.16 0.04
=00.17 6.88 0.90 1.04 0.01 0.16 0.00 0.00
>05.94 41.18 4.70 2.29 0.54 2.15 0.12 0.03
Slope_Shannonp<02.96 21.42 5.45 3.08 0.55 1.41 0.23 0.04
=00.14 5.36 0.66 0.75 0.04 0.40 0.00 0.01
>07.25 39.07 7.00 2.21 0.60 1.29 0.05 0.03
Slope_Simpsonp<02.07 21.77 4.18 2.84 0.56 1.70 0.24 0.04
=00.09 2.24 0.55 0.52 0.01 0.10 0.00 0.00
>08.20 41.86 8.37 2.69 0.61 1.29 0.04 0.03
Slope_Pieloup<01.39 33.71 2.66 2.74 0.63 2.43 0.20 0.05
=00.13 1.82 0.59 0.45 0.01 0.06 0.00 0.00
>08.83 30.32 9.85 2.85 0.55 0.61 0.08 0.03
Slope_SRa<04.58 23.62 7.48 3.45 0.55 1.27 0.17 0.01
=00.29 8.61 0.62 1.08 0.08 0.67 0.00 0.02
>05.49 33.62 5.02 1.51 0.55 1.15 0.12 0.04
Slope_Shannona<04.07 27.61 4.97 3.31 0.52 0.71 0.19 0.03
=00.09 2.71 0.42 0.44 0.01 0.11 0.00 0.00
>06.19 35.54 7.72 2.29 0.65 2.28 0.10 0.04
Slope_Simpsona<03.14 25.82 4.77 3.11 0.64 0.81 0.18 0.03
=00.13 3.78 0.46 0.48 0.06 0.17 0.00 0.00
>07.09 36.26 7.88 2.46 0.48 2.12 0.11 0.04
Slope_Pieloua<03.08 29.65 4.19 2.86 0.70 2.00 0.14 0.03
=00.21 3.66 0.72 0.63 0.02 0.17 0.00 0.01
>07.07 32.54 8.21 2.56 0.46 0.93 0.14 0.04
Table 2. The area percent ratio (%) for the influence of human activities on plant α-diversity.
Changes in the Influence Intensity of Human Activities on Plant α-DiversitySlope_Rα-diversityRα-diversitySpecies RichnessShannonSimpsonPielou
No change in positive influence=0All > 10.80 0.83 0.08 0.03
No change in negative influence=0All < 10.21 0.44 0.96 1.49
No change in influence, but oscillate between positive and negative influence=0Not all > 1 or not all < 14.63 0.87 0.65 0.37
The increase in positive influence >0All > 10.50 16.37 8.00 17.10
The decrease in negative influence >0All < 13.86 1.01 5.72 3.38
From negative to positive influence >0Not all > 1 or not all < 138.04 26.59 30.93 27.40
The decrease in positive influence<0All > 11.04 17.44 13.24 11.32
The increase in negative influence <0All < 16.24 1.73 6.00 6.78
From positive to negative influence <0Not all > 1 or not all < 144.68 34.71 34.44 32.12
Disclaimer/Publisher’s Note: The statements, opinions and data contained in all publications are solely those of the individual author(s) and contributor(s) and not of MDPI and/or the editor(s). MDPI and/or the editor(s) disclaim responsibility for any injury to people or property resulting from any ideas, methods, instructions or products referred to in the content.

