Article

A GNSS Spoofing Detection and Direction-Finding Method Based on Low-Cost Commercial Board Components

1
School of Land Science and Technology, China University of Geosciences (Beijing), Beijing 100083, China
2
Aerospace Information Research Institute, Chinese Academy of Sciences, Beijing 100094, China
*
Authors to whom correspondence should be addressed.
Remote Sens. 2023, 15(11), 2781; https://doi.org/10.3390/rs15112781
Submission received: 4 May 2023 / Revised: 22 May 2023 / Accepted: 23 May 2023 / Published: 26 May 2023
(This article belongs to the Special Issue Satellite Navigation and Signal Processing)

Abstract

:
The Global Navigation Satellite System (GNSS) is vulnerable to deliberate spoofing signal attacks. Once the user wrongly locks on the spoofing signal, the wrong position, velocity, and time (PVT) information will be calculated, which will harm the user. GNSS spoofing signals are difficult to carry out spoofing attacks in the direction of arrival (DOA) of the real signal, so the spoofing detection method based on DOA is very effective. On the basis of identifying spoofing signals, accurate DOA information of the signal can be further used to locate the spoofer. At present, the existing DOA monitoring methods for spoofing signals are mainly based on dedicated antenna arrays and receivers, which are costly and difficult to upgrade and are not conducive to large-scale deployment, upgrade, and maintenance. This paper proposes a spoofing detection and direction-finding method based on a low-cost commercial GNSS board component (including an antenna). Based on the traditional principle of using a multi-antenna carrier phase to solve DOA, this paper innovatively solves the following problems: the poor direction-finding accuracy caused by the unstable phase center of low-cost commercial antennas, the low success rate of spoofing detection in a multipath environment, and the inconsistent sampling time among multiple low-cost commercial GNSS boards. Moreover, the corresponding prototype equipment for spoofing detection and direction-finding is developed. The measured results show that it can effectively detect spoofing signals in open environments. Under a certain false alarm rate, the detection success rate can reach 100%, and the typical direction-finding accuracy can reach 5 ° .

Graphical Abstract

1. Introduction

The Global Navigation Satellite System (GNSS) has been widely used in many fields, such as positioning, transportation, and meteorological application. In these fields, many modern GNSS technologies have been developed, such as PPP (precise point positioning) [1], integrated navigation technology [2], GNSS Reflectometry [3,4], and so on. These technologies have played an important role in modern society. However, the security of GNSS has attracted more and more attention in recent years. Due to the weak power of GNSS signals when they reach the ground and the public structure of civilian signals, GNSS is vulnerable to the threat of jamming and spoofing, so there are potential risks. Different from jamming, spoofer secretly broadcasts the wrong navigation information to users, making users calculate the wrong time, position, and speed information, which will cause more serious consequences. The team of Professor Humphreys of the University of Texas at Austin successfully implemented the spoofing of drones and yachts, making them deviate from the route [5,6]. In 2017, multiple ships in the Black Sea were affected by GNSS spoofing technology [7]. In 2020, Mit conducted a spoofing attack experiment on the Tesla Model 3 self-driving car. The experimental results show that the existing spoofing attack methods are enough to make the self-driving car deviate from the route and affect its decision-making ability [8]. Facing increasingly serious spoofing attacks, it is imperative to develop anti-spoofing technology. Anti-spoofing technology can be divided into four categories, which are spoofing detection, spoofing identification, spoofing suppression, and spoofer location [9]. The purpose of spoofing detection and identification is to detect whether there are spoofing signals in the current electromagnetic environment and to identify real signals from all signals. Spoofing suppression works to eliminate spoofing signals from received signals and restore the usability of navigation signals. The spoofer location method eliminates the threat of spoofing from the source by estimating the direction or position of the spoofer. For the spoofing detection module, there are mainly methods such as satellite navigation signal authentication technology [10], external equipment assistance [11,12,13,14], and signal processing of the receiver terminal. Among them, the receiver terminal signal processing method has become the easiest method to promote because of its low cost and wide application range. Specifically, receiver terminal signal processing methods can be classified into single-antenna and multi-antenna spoofing detection methods. For the single-antenna methods, most methods use the observations received by the GNSS receiver to design algorithms for spoofing detection. For example, the carrier-to-noise ratio variation of navigation signals [15], the proportional relationship between pseudo-range Doppler and carrier Doppler [16], and receiver autonomous integrity monitoring (RAIM) technology [17] is used. However, such techniques may be difficult to defend against some advanced spoofing attacks, such as traction spoofing [18]. The multi-antenna spoofing detection method utilizes the geometric space difference between real GNSS signals and spoofing signals and is a kind of spoofing detection method based on airspace features. Because the geometric space information of GNSS real signals is almost inimitable, such methods are currently one of the most effective spoofing detection methods. The spoofing detection methods based on multi-antenna have been studied to some extent. Huang proposed a method of spoofing detection using the carrier phase difference of dual antennas, and verified the feasibility of the method from simulation experiments [19]. Swaszek uses multiple commercial receivers to detect spoofing by comparing the positions of different receivers. The false alarm rate depends on the spatial distribution of receivers and the positioning accuracy [20]. A spoofing detection method using the intersection angle between two directions of arrival (IA-DOA) is proposed. The IA-DOA method is proved to be insensitive to the platform attitude, which reduces the cost and complexity of the experiment, but this method cannot obtain the direction information about the spoofer in the airspace [21]. The multi-antenna DOA spoofing detection method is mainly based on the difference between the real signal and the spoofing signal and performs spoofing detection according to the different information of DOAs. In the case of spoofing, the direction-finding of the spoofer can be realized, and the method can eliminate the threat of spoofing from the source. Reference [22] pointed out that for the double-antenna DOA spoofing detection method, the DOAs corresponding to the same carrier phase difference are ambiguous and cannot be eliminated. Additionally, it proved that the triple-antenna in a non-linear arrangement is the minimum requirement to solve DOAs ambiguity. Most of the multi-antenna spoofing detection methods developed later follow this principle in terms of antenna configuration. There have been some studies on solving the DOA of traditional antenna array [23,24]. Michael used a rectangular antenna array to estimate DOA using the ESPRIT algorithm, and realized the joint estimation of DOAs and the attitude of the antenna array. However, it requires a professional antenna array and calculates at the signal level [25]. Professional antenna array equipment and processing algorithms have a high threshold for ordinary users.
At this stage, with the continuous improvement of electronic equipment manufacturing technology, GNSS equipment is developing towards miniaturization and low cost. Many low-cost commercial boards and antennas have appeared. Low-cost commercial board components, including receiver boards and antennas, have been tested in various scenarios [26,27]. However, due to the price and manufacturing process limitations of low-cost commercial board components, there are the following three main error sources that will affect the solution of spoofing detection and direction-finding. First, low-cost commercial boards have clock bias in the sampling of signals, and time synchronization cannot be achieved when multiple receivers work at the same time. There is a power-on clock error; that is, multiple receivers cannot sample observation data at the same time. Moreover, this error is related to the starting up of the receivers. The power-on clock error will be absorbed by the receiver clock offset and cannot be eliminated in the different processes, which will introduce an error to the carrier phase observation value. Second, the antenna phase center is the benchmark of the observation data of the high-precision GNSS receiver, and the stability of the antenna phase center is an important index to measure the performance of the antenna. However, the stability of the phase center of the low-cost antenna is poor, and the antenna phase center fluctuates greatly with factors such as pitch angle and azimuth angle. At this time, when the low-cost antenna receives satellite signals in different directions, it will introduce additional phase differences and increase the measurement error [28]. Third, low-cost antennas are more sensitive to multipath effects. The multipath effect is closely related to the user’s environment, and traditional differential technology is difficult to eliminate its influence. The superimposition of multipath signals and normal signals will not only affect positioning [29] but also lead to deviations in the DOAs of signals. Multipath effects may cause spoofing signals and multipath signals to be indistinguishable [30].
Aiming at the high hardware requirements of traditional array antennas, this paper uses low-cost commercial boards and antennas to build an anti-spoofing platform. In this paper, the effects of various errors of low-cost commercial board components on the carrier phase observations are deduced and considered in detail. For the problem of power-on clock error, a compensation method using pseudo-range and instantaneous Doppler value is proposed in this paper, and the time synchronization of multiple receivers is realized at the algorithm level. In order to solve the instability of the low-cost antenna phase center and the multipath effect, this paper proposes a method to describe the sky map of the time-series average error correction value. Aiming at the problem of carrier single difference ambiguity, the carrier single difference is modeled as the addition of integers and decimals. The fractional part is obtained by calculating the decimals of the two parts of the carrier phase observation value and each error correction value. The integer part is determined by the baseline length. Additionally, the combination of the two parts obtains a complete carrier single difference value. This method simplifies the ambiguity fixation algorithm and makes full use of the length and geometric constraint information of the baseline. The expected value of the DOA can be obtained from the ephemeris information and the prior information on the station position. The calculated value is obtained in real-time by the DOA calculation method. The residual between the calculated value and the expected value fits to the Gaussian distribution with a zero mean value when there is no spoofing signal. And the residual fits a Gaussian distribution with a non-zero mean in the presence of spoofing signals. Based on this, a binary hypothesis testing model was constructed using the sum of squared errors (SSE), and the theoretical threshold was calculated. The experiment proves the effectiveness of the proposed method, and the detection rate reaches 100%. In addition, the spoofing signal is identified. The direction-finding of the spoofer is solved, and the DOA accuracy can reach within 5 degrees.
The subsequent chapters of this paper are arranged as follows: Section 2 introduces the system structure of the method and derives the necessary principles. Section 3 introduces the experimental scenario and displays the experimental results obtained from each experiment. Section 4 analyzes and discusses the experimental results. Section 5 is the conclusion part, which summarizes the research results of this paper and discusses future work.

2. Materials and Methods

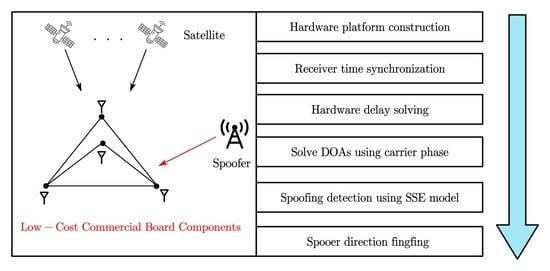
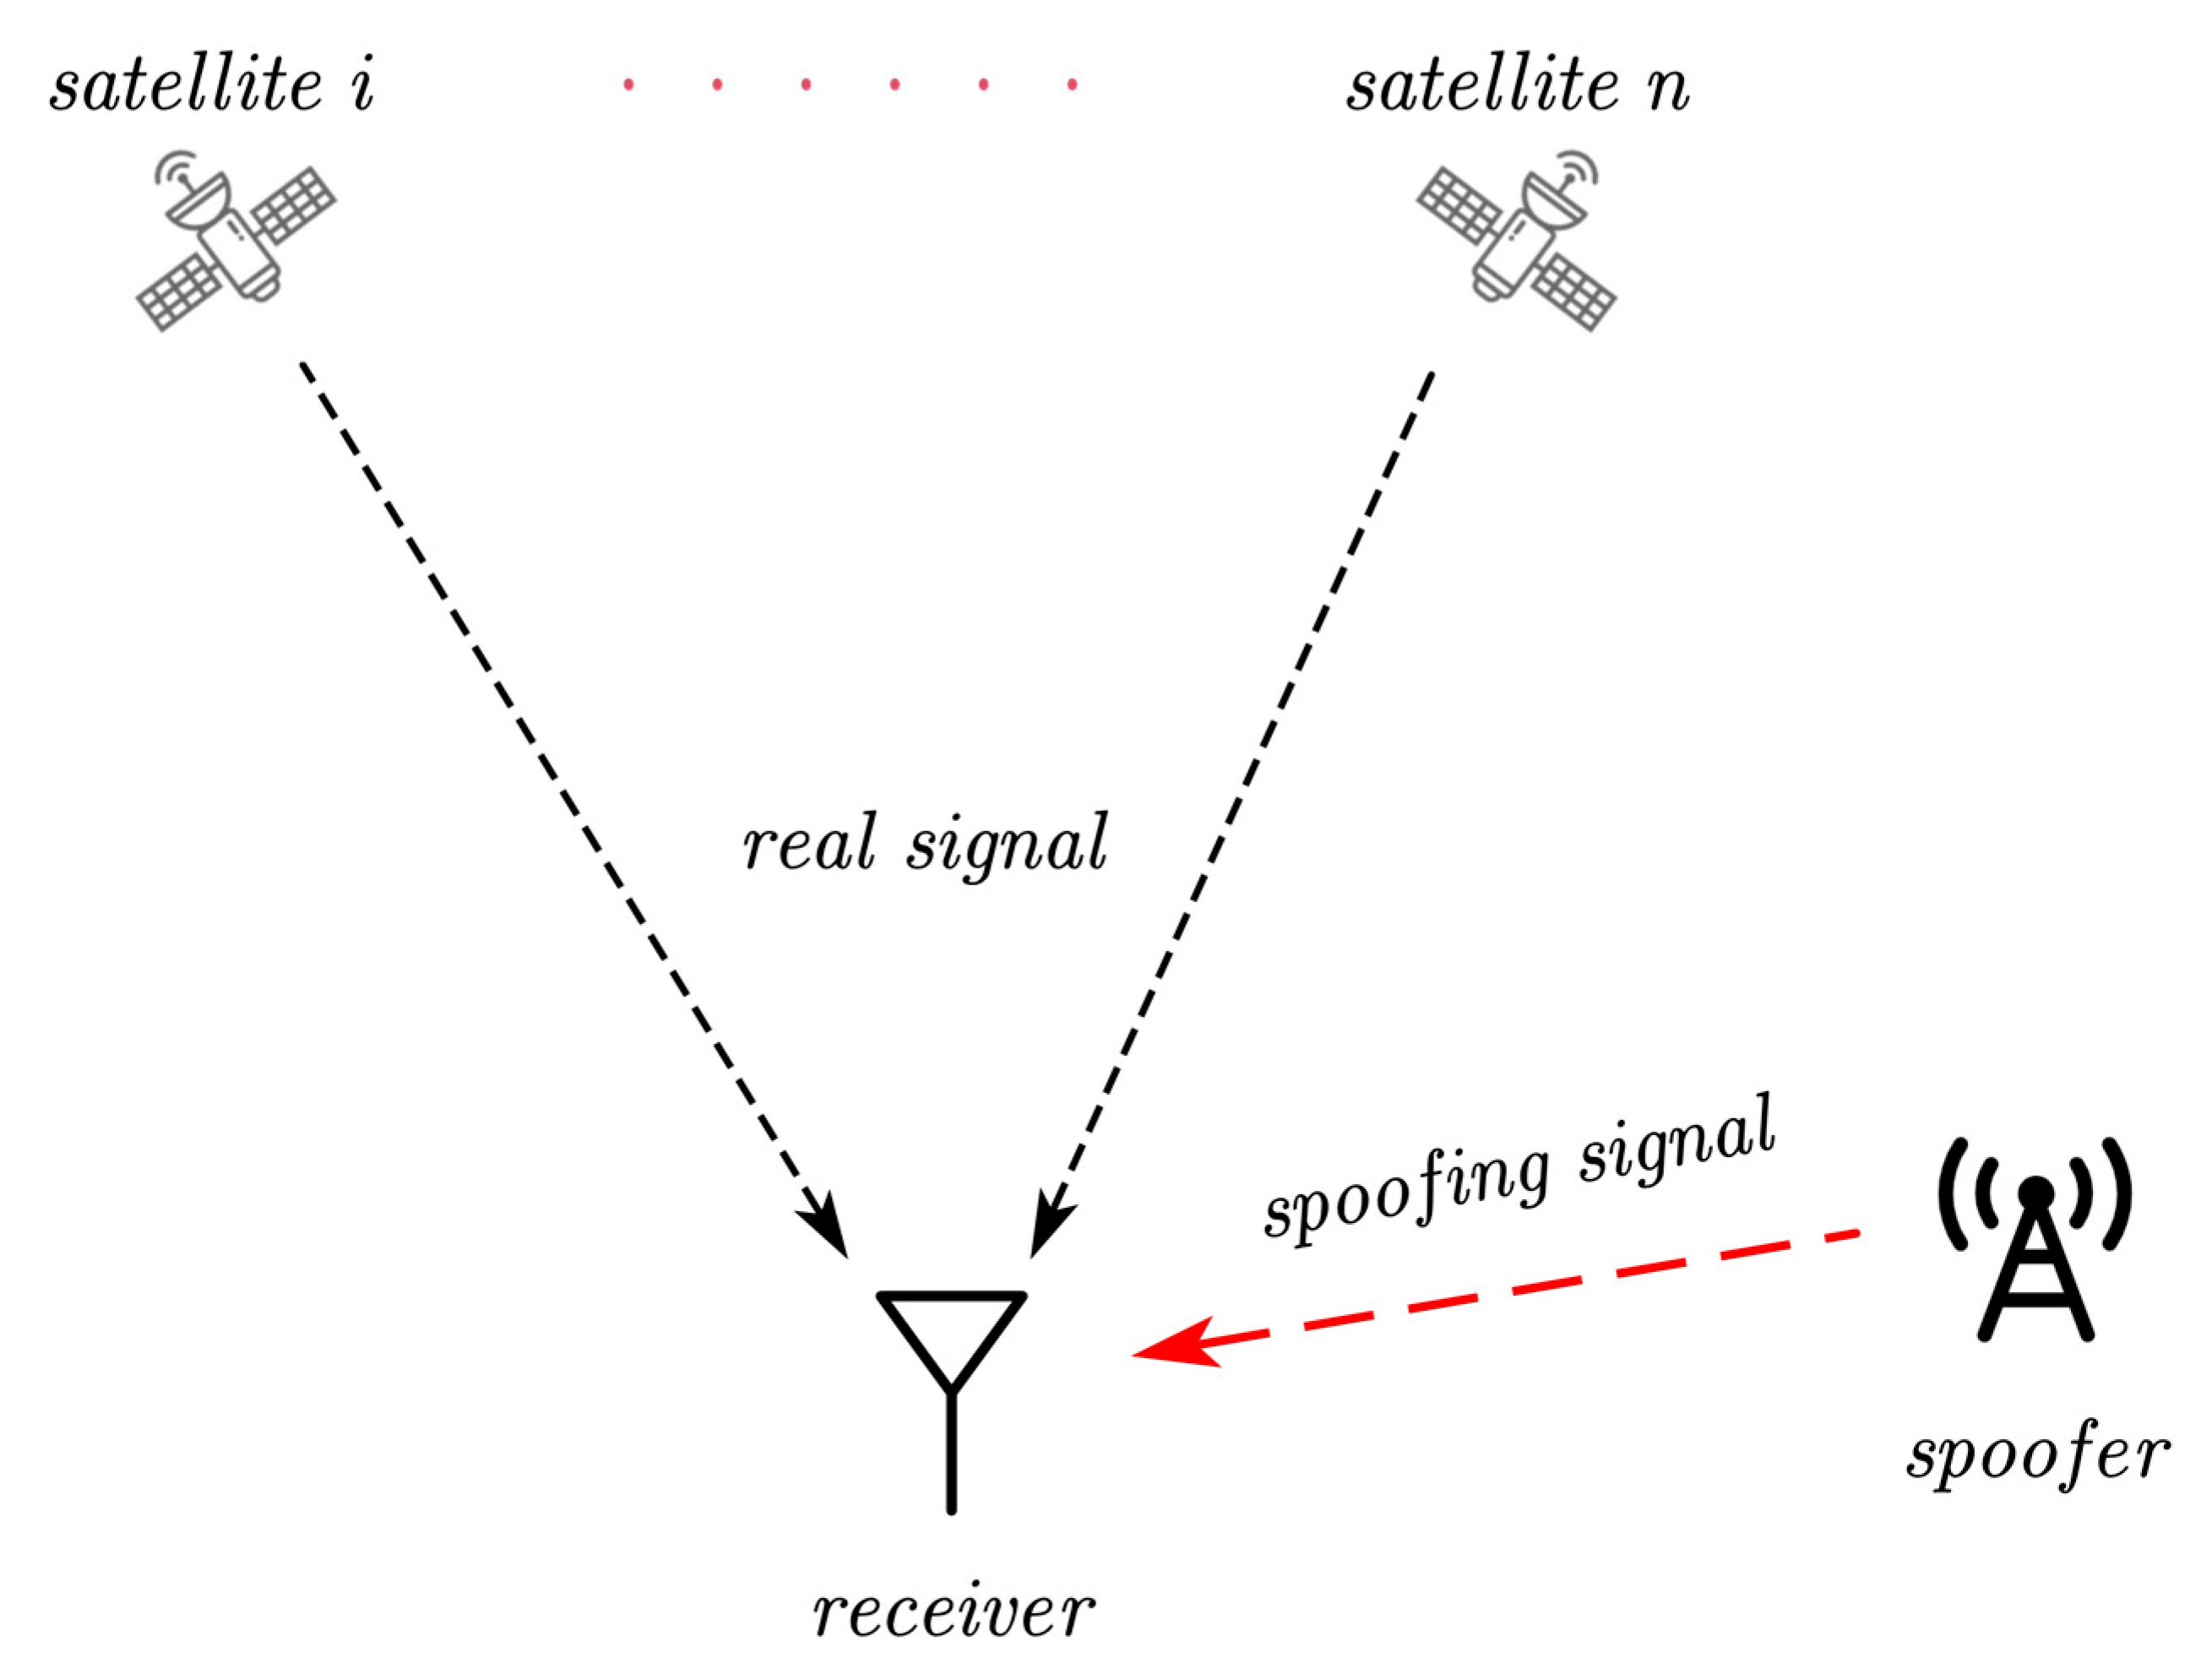
2.1. System Structure

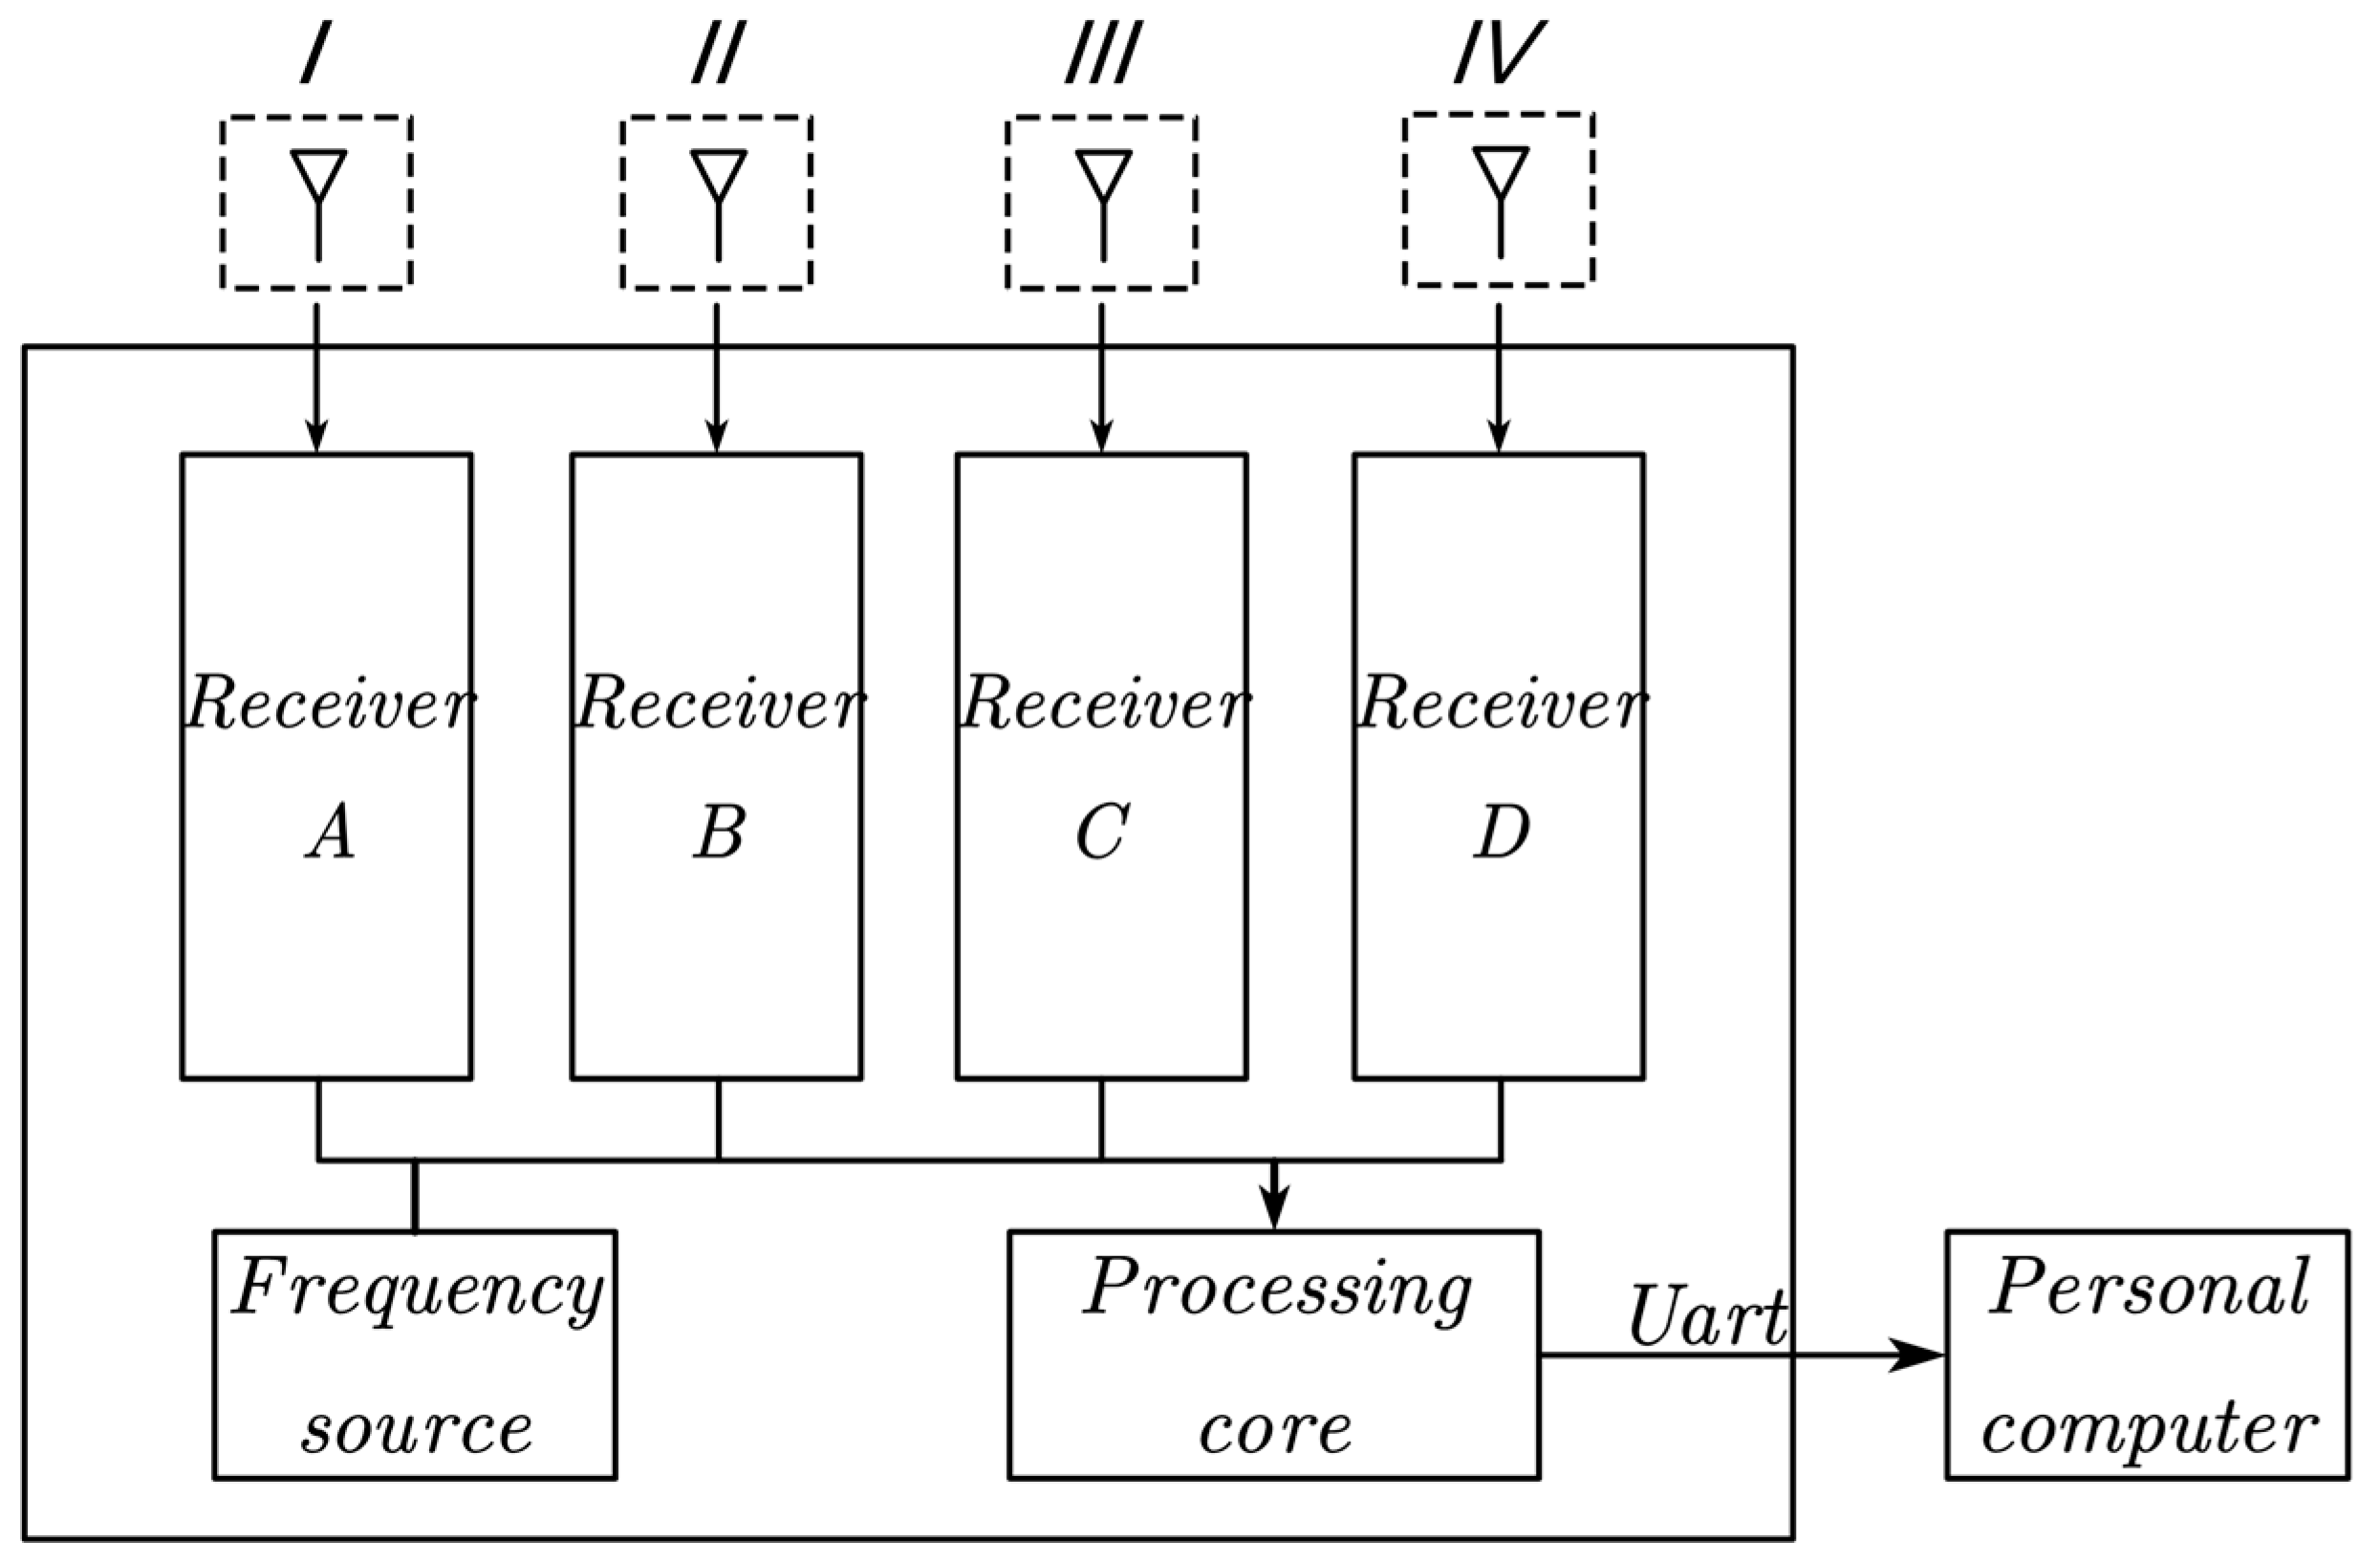
2.1.1. Hardware Structure

Compared with professional surveying and mapping grade boards and antennas, the price of commercial boards and antennas is lower. Figure 1 shows the hardware structure built in this paper. The difficulty of multi-antenna DOA calculation lies in the precise synchronization and data sharing among receivers. Frequency synchronization can be achieved between multiple receivers by locking the external clock, but time synchronization cannot be achieved, which requires compensation at the algorithm level. The data of the four receivers are shared with the processing unit for real-time calculation, and the calculation result are displayed on the computer through the upper computer. Each antenna is connected to the receiver through a long cable, and the delay of the signal in the cable needs to be considered. Low-cost antennas introduce additional measurement errors due to antenna phase center instability and susceptibility to multipath effects, which need to be corrected. Considering the DOA ambiguity of the dual antennas and introducing more geometric constraints, a special configuration of four antennas is designed, as shown in Figure 2. The multi-antenna configuration is closely related to the solution of carrier single difference and the performance of spoofing detection. More calculation details are described in detail in subsequent chapters.

2.1.2. Algorithm Process

In Figure 3, an anti-spoofing system consisting of four low-cost commercial board components is shown. On the one hand, the broadcast ephemeris information is basically impossible to be forged, and the expected DOAs can be obtained from the prior position of the antenna and the broadcast ephemeris information. On the other hand, using the geometric constraint information of the four antennas and the space information formed between the antennas and the satellite, the method of calculating the integer and fractional parts of the carrier single difference is adopted separately. The phase error caused by power-on clock error, antenna phase center error, and multipath effect is compensated. Then, the calculated DOAs can be quickly calculated. According to the data distribution characteristics of the residual error between the calculated DOAs and the expected DOAs, SSE can be used to construct a binary hypothesis testing model to achieve spoofing detection. It can output the spoofing state of the receiver in real-time, identify the spoofing signal, and find the direction information of the spoofer.

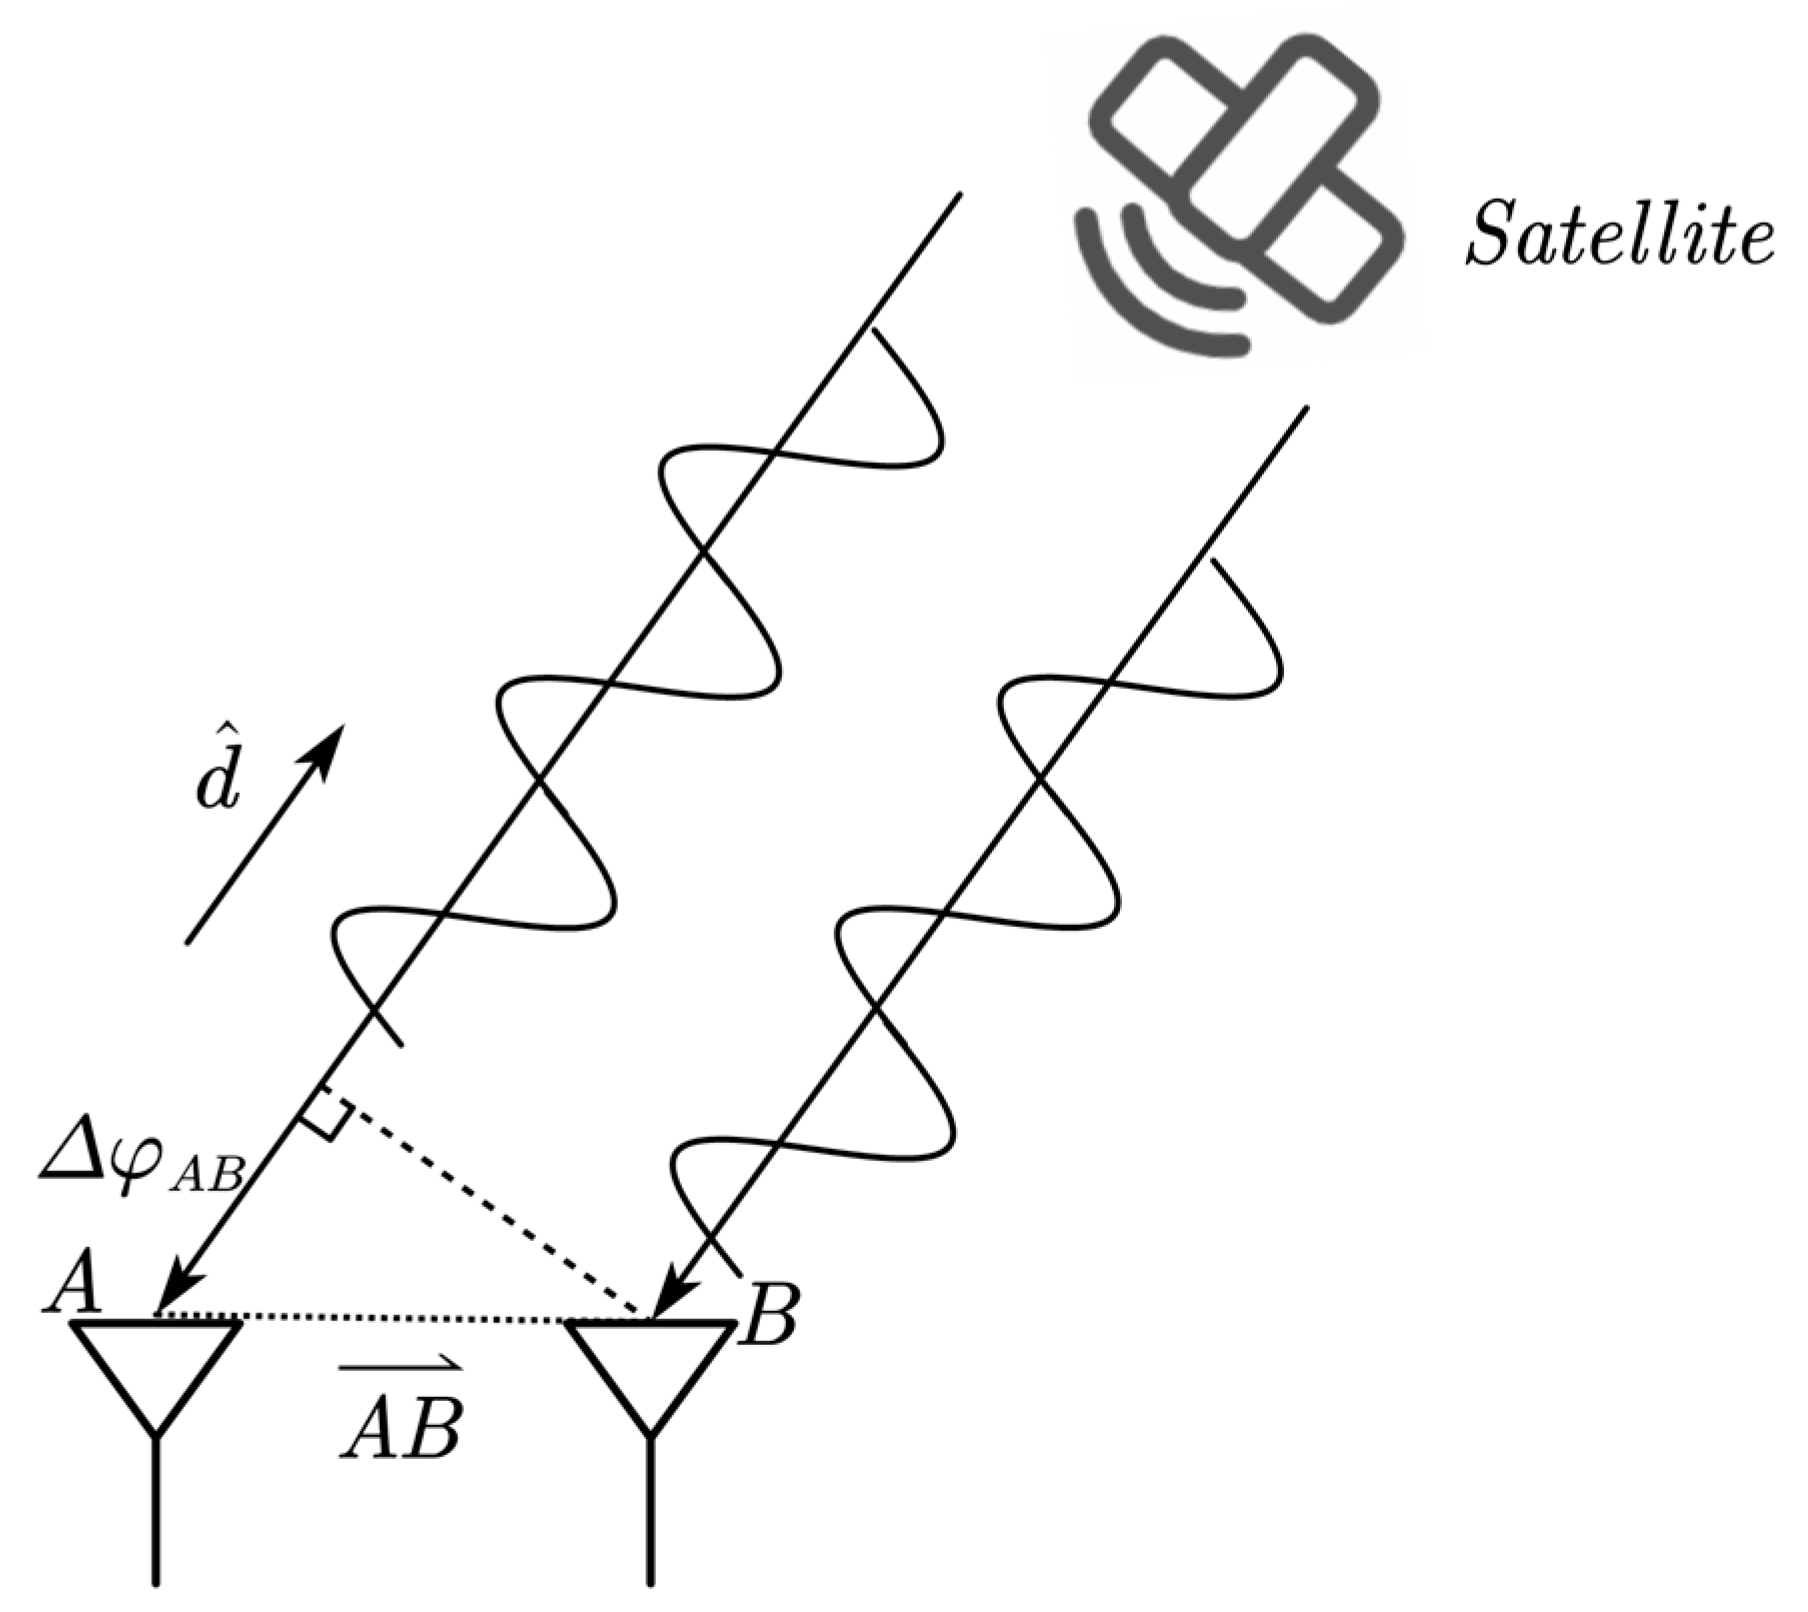
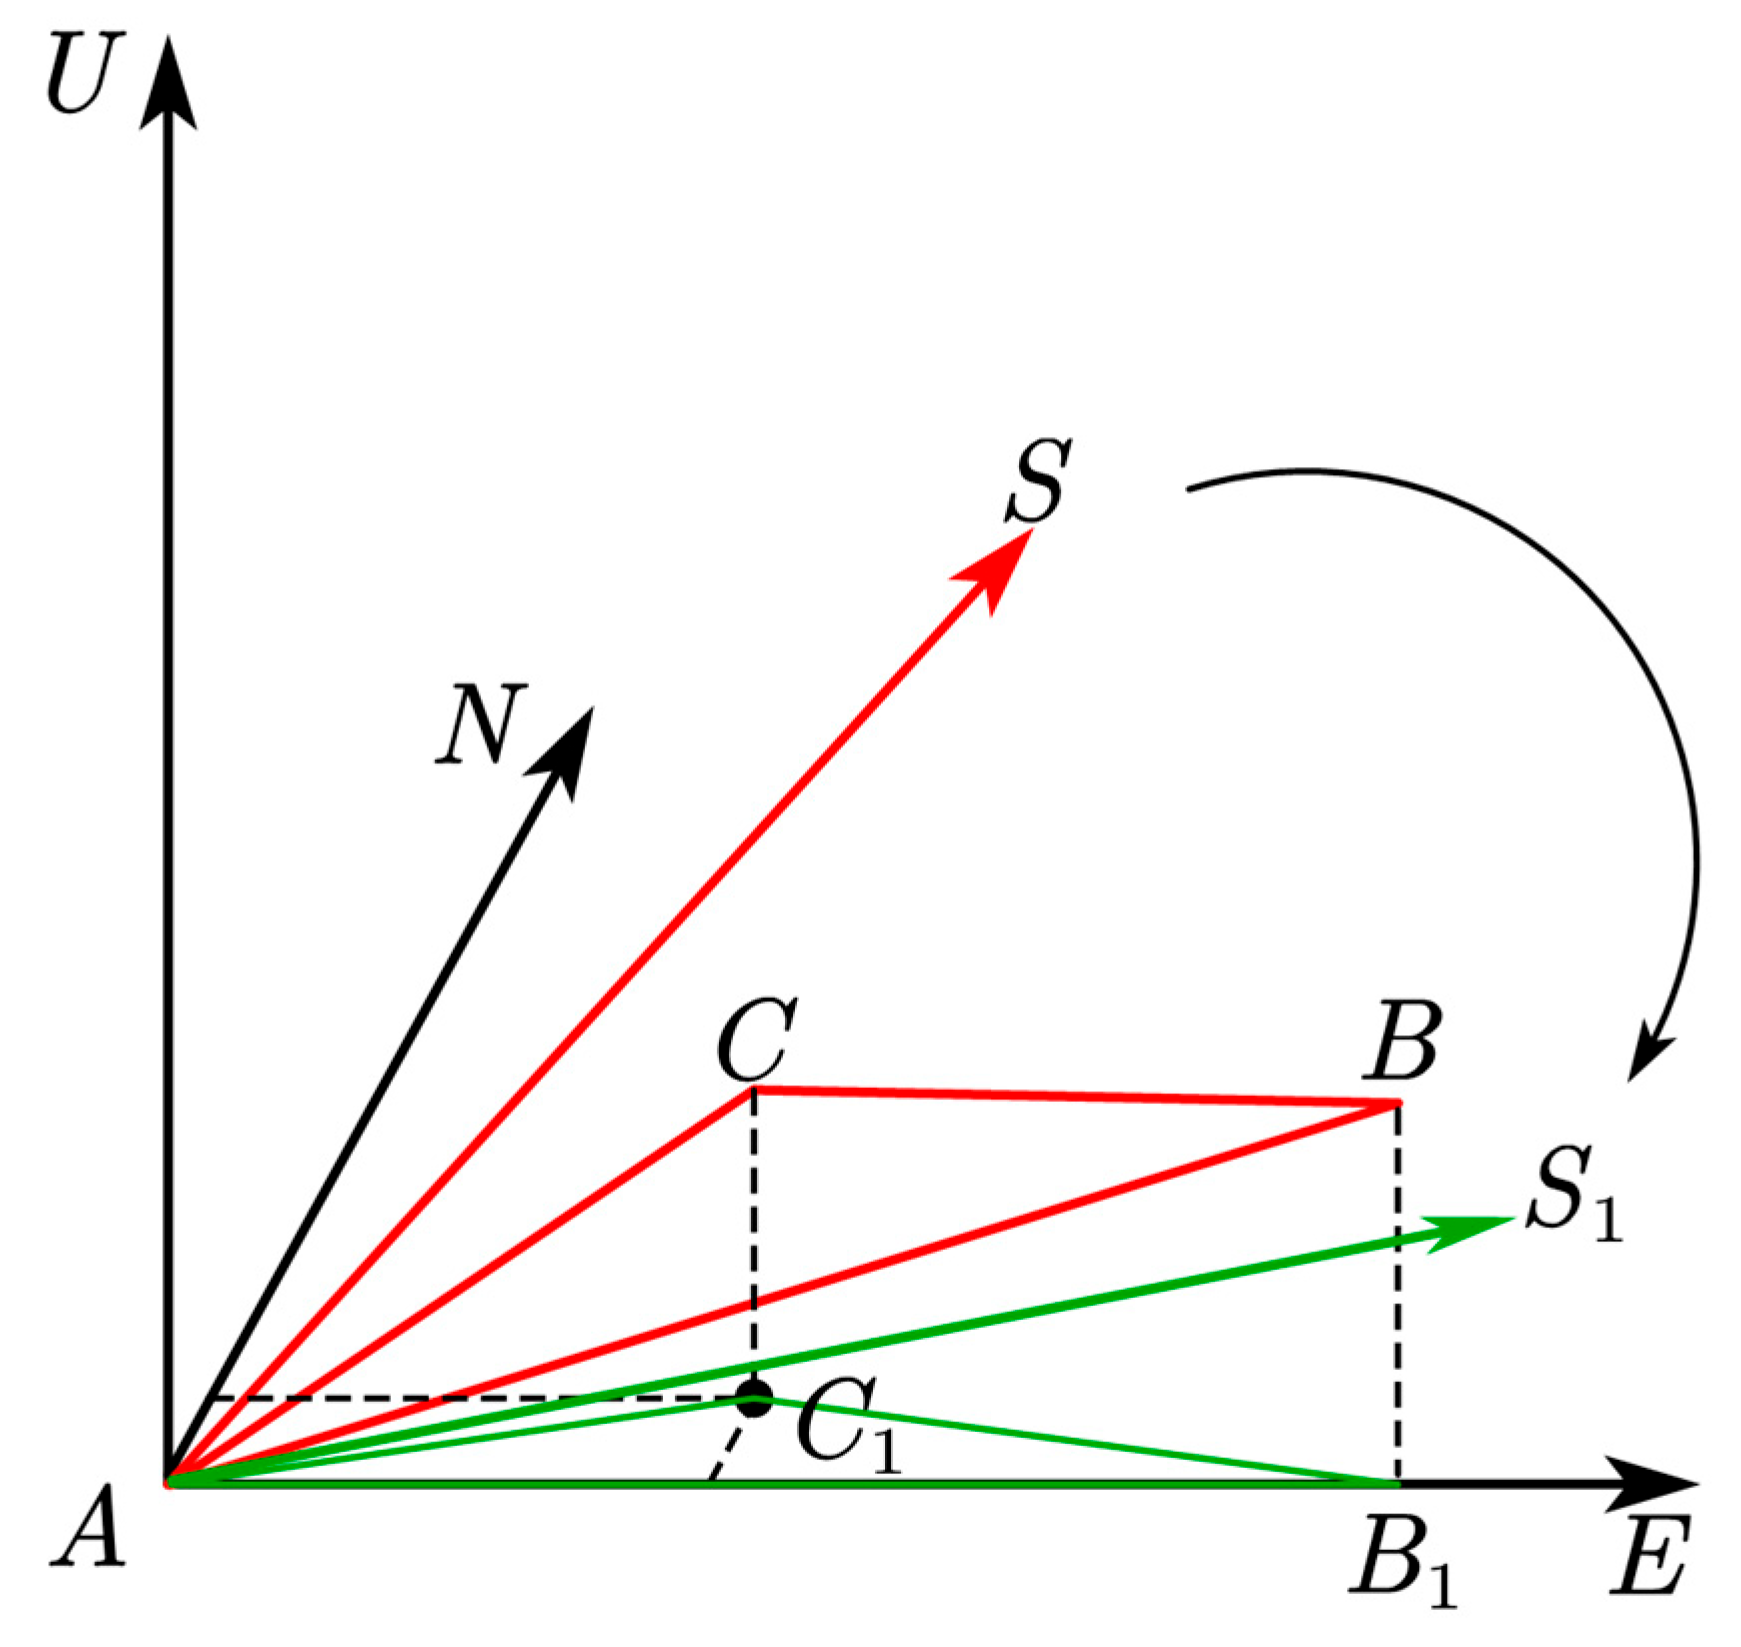
2.2. DOA Calculation

The schematic diagram of the elevation angle α and azimuth angle β of the satellite S in the E N U coordinate system is shown in Figure 4.
The following will take the A and B antennas as an example to illustrate the process of solving α and β . In the E N U coordinate system, the unit vector of the satellite signal direction can be expressed as:
d ^ e n u = cos α sin β , cos α cos β , sin α T
The precise relative coordinates of the four antennas in E N U can be calculated by RTK (Real Time Kinematic). Take antenna A as a reference and set it as the origin of E N U . Then we can solve the relative coordinates between the remaining three antennas and antenna A . The coordinates of A and B antennas in E N U are prior values, set as:
Δ X A B = [ Δ x A B , Δ y A B , Δ z A B ]
The geometric diagram of carrier single difference between antennas A and B is shown in Figure 5.
The carrier difference of the two real signals is expressed as Δ φ A B . The Δ φ A B is the projection of A B on the direction vector of the signal between the A antenna and the satellite, which can be expressed as:
Δ φ A B λ = Δ X A B d ^ e n u = cos α sin β Δ x A B + cos α cos β Δ y A B + sin α Δ z A B
where α [ 0 , π / 2 ] , β [ 0 , 2 π ] , λ is the carrier wavelength. When the coordinates of the baseline are known, the carrier single difference is completely determined by the elevation and azimuth angles. If the antenna C is considered, the relationship can be obtained as follows:
Δ φ A B λ = c o s α sin β Δ x A B + c o s α cos β Δ y A B + s i n α Δ z A B Δ φ A C λ = c o s α sin β Δ x A C + c o s α cos β Δ y A C + s i n α Δ z A C
It can be seen from Equation (4) that if Δ φ A B , Δ φ A C , Δ X A B and Δ X A C can be obtained, α and β can be solved. The relative coordinates between the antennas can be accurately calculated by RTK, and the solution of the carrier single difference will be deduced in detail in the next section. However, the equation similar to Equation (4) is difficult to be solved. Focusing on this problem, this paper proposes a double rotation method to solve it by eliminating some items containing unknowns through graphic rotation. The process of solving the equation is simplified. The schematic diagram before and after rotation in E N U coordinate system is shown in Figure 6.
In Figure 6, A B 1 C 1 can be obtained through the rotation matrix R 1 ( r , p , y ) . Since the coordinates of A , B , and C are known, R 1 ( r , p , y ) can be solved easily. The coordinate relationship before and after rotation is as follows:
Δ X A B 1 = R 1 ( r , p , y ) ( X A B T ) Δ X A C 1 = R 1 ( r , p , y ) ( X A C ) T
The purpose of the rotation is to make A B coincide with the E axis and A B 1 C 1 to be in the same plane as the plane E A N . Then Δ X A B 1 and Δ X A C 1 can be expressed as:
Δ X A B 1 = [ Δ x A B 1 , 0 , 0 ] T Δ X A C 1 = [ Δ x A C 1 , Δ y A C 1 , 0 ] T
Considering Equation (6), and rewriting Equation (4), we can get the following relationship:
Δ φ A B λ = c o s α 1 sin β 1 Δ x A B 1 Δ φ A C λ = c o s α 1 sin β 1 Δ x A C 1 + c o s α 1 cos β 1 Δ y A C 1
where α 1 and β 1 is the elevation and azimuth angles of the satellite S 1 . Then α 1 and β 1 can be easily solved by Equation (7):
α 1 = arccos Δ φ A B λ Δ x A B 1 sin β 1 β 1 = arctan Δ φ A B Δ y A C 1 Δ φ A C Δ x A B 1 Δ φ A B Δ x A C 1
Δ X A S 1 = cos α 1 sin β 1 , cos α 1 cos β 1 , sin α 1 T
By rotating A S 1 in reverse, A S can be obtained. Then further solve α and β . The equation for rotation is as follows:
Δ X A S = R 1 1 ( r , p , y ) Δ X A S 1

2.3. Carrier Single Difference Solution

As can be seen from the previous section, the carrier single difference value is the premise of solving the DOAs. This section describes the solution method of the carrier single difference. The carrier phase observation equation obtained by low-cost commercial receiver measurement is as follows [31]:
φ ˜ i s λ = ρ i s + c d t i d t s + d t r o p , i s d i o n , i s + λ N i s + λ b s + λ b i + d m u l , i + d a p c , i
where i and s denote the index of the station and satellite, respectively. φ ˜ i s is the actual observed value of the carrier phase measurement of the receiver in cycles. ρ i s is the distance between the satellite s and the station i , c is the speed of light, d t i is the receiver clock offset, d t s is the satellite clock offset, d t r o p , i s is the troposphere delay error and d i o n , i s is the ionosphere delay error. N i s is the integer ambiguity, b s is the instrumental biases of the satellite, b i is the cable delay between the receiver and the antenna, d m u l , i is the equivalent distance error caused by the multipath effect, and d a p c , i is the equivalent distance error caused by the antenna phase center error. When two stations i and j observe a satellite s at the same time, the inter-station carrier single difference model can be established:
Δ φ ˜ i j s = φ ˜ i s φ ˜ j s = Δ ρ i j s + c Δ d t i j + λ Δ N i j s + λ Δ b i j + Δ d m u l , i j + Δ d a p c , i j
where d i o n , i s and d t r o p , i s are eliminated due to the shorter baseline distance. The inter-station carrier single difference eliminates the error terms d t s and λ b s . The following equation can be further obtained:
Δ φ ˜ i j s λ Δ N i j s c Δ d t i j λ Δ b i j Δ d m u l , i j Δ d a p c , i j = Δ ρ i j s
Δ ρ i j s is consistent with the meaning of Δ φ A B λ in Equation (3), which is the real distance difference between the satellite s and the station i , j . After solving Δ ρ i j s , the signal DOAs can be solved. Δ φ ˜ i j s is given by the receiver and is a known value. In order to facilitate the subsequent solution, the three errors in Equation (13) are combined and expressed as follows:
η = λ Δ b i j + Δ d m u l , i j + Δ d a p c , i j
Δ N i j s , Δ d t i j and η are three unknowns. First, consider the solution of Δ N i j s . At present, the integer ambiguity resolution method is mainly based on the search algorithm of the search domain. The LAMBDA algorithm is a widely used method at present, but its solution requires multiple epochs to converge. There are also methods that use baseline information to solve ambiguities, such as the long-short baseline method. This method requires that the distance between two antennas is less than half a wavelength. The half wavelength of GPS L1 is 0.0952m. Because of the manufacturing process of the receiving antenna, it is difficult for the distance to be less than half the signal wavelength. Even if the carrier single difference ambiguity problem is solved successfully, low-priced receiver boards may still face the problem of frequent cycle slips, making data processing more difficult. Based on the consideration of the above problems, this paper innovatively proposes a method of calculating the integer and decimals of the carrier single difference value separately. The carrier single difference is modeled as the addition of the integer part and the fractional part. If Δ φ i j s represents the complete carrier single difference, the following relationship can be obtained:
Δ φ i j s = i n t ( Δ φ i j s ) + F r ( Δ φ i j s )
where i n t means to take an integer operation, F r means to take a decimal operation. In theory, i n t ( Δ φ i j s ) consists of several parts, as follows:
i n t Δ φ i j s = Δ N i j s + i n t φ i j + i n t d t i j + i n t η
where i n t φ i j represents the difference in the change in the number of carrier cycles between stations i and j , which is recorded by the wave counter. i n t d t i j represents the integer part of the difference between the receiver clocks and i n t η represents the integer part of the sum of the three errors in Equation (14). Considering the baseline constraint information, the length of A B is 0.4m, and the GPS L1 wavelength is λ . It can be concluded λ | Δ φ i j s | < 0.4 . So, the value range of i n t Δ φ i j s is [ 2 , 2 ] , a total of seven integer values. In this paper, we choose to make i n t Δ φ i j s completely determined by the baseline length, and its value is fixed as enumerable integers.
Consider the solution of F r ( Δ φ i j s ) below, F r ( Δ φ i j s ) consists of the following parts:
F r ( Δ φ i j s ) = F r Δ φ ˜ i j s + c Δ d t i j + η
where Δ φ ˜ i j s represents the difference between the fractional values of the carrier less than one cycle, which is a known value. Then consider making corrections to c Δ d t i j and η .
Consider correcting c Δ d t i j first. There is a clock bias in signal sampling by the receiver board, which can be expressed by the following equation [32]:
d t i = t 0 , i + Δ f i T s N
where t 0 , i is the power-on clock error of the receiver, which is related to each power-on of the receiver. Δ f i is clock frequency, T s denotes the sampling interval and N is the number of samples. Considering the equation for the second receiver j and taking the difference from (18), the following relationship can be obtained:
Δ d t i j = t 0 , i t 0 , j + ( Δ f i Δ f j ) T s N
where if two receivers work with a common frequency source, we can get Δ f i Δ f j = 0 . At this time, if t 0 , i and t 0 , j are equal, the influence of the clock offsets Δ d t i j can be eliminated when making a difference between receivers. Supposing Δ t 0 , i j = t 0 , i t 0 , j , at the hardware level, the elimination of Δ t 0 , i j requires the two receivers to be fully synchronized in time, which is difficult to achieve. Δ t 0 , i j can be compensated at the algorithm level. Use the same antenna to sample one signal and distribute it to two receivers. Simulate a zero-baseline environment to eliminate the influence of other errors as much as possible. Δ t 0 , i j can be compensated with pseudo-range and Doppler frequency from both receivers under zero-baseline conditions. The error compensation value of Δ t 0 , i j at time τ can be expressed as [33]:
c Δ t 0 , i j ( τ ) = λ f d , i ( τ ) C i s ( τ ) C j s ( τ ) / c
where f d , i ( τ ) is the instantaneous Doppler value of the receiver i , and the unit is the cycle. Going a step further, consider compensating for the difference in carrier transmission delay on different receiver boards, which will be absorbed by the clock offset. Under the condition of zero-baseline, it can be obtained by carrier difference, and the complete c Δ d t i j can be expressed as:
c Δ d t i j = c Δ d t i j + φ ˜ i s φ ˜ j s = λ f d , i ( τ ) C i s ( τ ) C j s ( τ ) / c + φ ˜ i s φ ˜ j s
It must be noted that c Δ d t i j is only concerned with its fractional part. In the experiment part, the compensation result of the power-on clock error is given.
Finally, consider the solution of η . It can be seen from Formula (14) that η includes cable delay error, multipath error, and antenna phase center error. So η can be collectively referred to as a hardware delay error. At the hardware level, using cables of the same type and length, adding absorbing materials, and using the same type of antenna can reduce the influence of the three errors. The correction method at the algorithm level is considered below. According to Formulas (13) and (14), F r ( η ) can be expressed as:
F r ( η ) = F r Δ φ i j s Δ φ ˜ i j s c Δ d t i j
Δ φ i j s is the complete carrier single difference, which can be obtained according to Equation (3) by using the true value information of the satellite elevation angle and azimuth angle. According to Formula (22), the single epoch solution of F r ( η ) can be obtained. Due to the complexity of the observation environment, the multipath error is difficult to quantify, but the multipath effect can be weakened by long-term observation. In addition, the phase center of the low-cost antenna will fluctuate due to the change in the incident direction of the signal, which has poor stability and introduces additional measurement errors.
According to the law of the above errors, we consider using the sky grid map to describe the hardware delay error. Fill the single epoch F r ( η ) of different directions into the grid of the sky map. Moreover, through a long period of observation, the average value in each grid can be obtained. The corrections in the sky grid map will be stored as priors. F r ( c Δ d t i j ) and F r ( η ) can be used as prior values in Formula (17) to correct F r ( Δ φ i j s ) in real time. So far, F r ( Δ φ i j s ) can be solved. In Formula (15), F r ( Δ φ i j s ) is the only value, and by combining it with the seven values of i n t Δ φ i j s , a complete carrier single-difference data set can be obtained. In the same way, the data sets solved by using other baselines can be obtained, and the corresponding elevation angle and azimuth angle information can be solved according to Formulas (5)–(10). It can be seen from Figure 2 that the four antennas form a total of four triangles, namely A B C , A C D , A B D and B D C . In each triangle, an equation similar to Equation (4) can be constructed, and a set of corresponding α and β can be solved through steps (5)–(10). If the integer part of the carrier single difference is reasonable, the solutions for the real numbers of α and β can be found in the four triangles. Decompose all real numbers into a data set Θ s , and s is the satellite number. The elevation angle and azimuth angle of the satellite can be calculated by using the observation value and the ephemeris file received from reference A , denoted as α ˜ s and β ˜ s , which are regarded as the expected value of the elevation angle and azimuth angle of the s . We can find the angle values with the smallest difference from α ˜ s and β ˜ s in Θ s , which are recorded as α ^ s and β ^ s . They are the final calculated values of the elevation and azimuth angles. However, if in a spoofing scenario α and β are already close to the angles of the transmitting antenna of the spoofer. The above method will fail. Let the complete set of real solutions of all satellites be U = { Θ 1 , Θ 2 , Θ 3 , , Θ s } . In the spoofing scenario, all satellite signals have the same direction, and the mode of α and β can be found in U as the elevation angle and azimuth angle of the spoofer at this time.

2.4. Anti-Spoofing Method

Figure 7 shows a general spoofing scenario. The spoofer simulates the observation information of the satellite and broadcasts it from an antenna to the user receiver. In this case, the direction information calculated based on the airspace information is related to the spoofer, not the satellite. In general, the broadcast ephemeris is almost impossible to be deceived, and the real direction information of the satellite can be calculated by using the broadcast ephemeris. The calculated value of satellite direction information can be obtained through the DOA calculation method of four antennas. In the case of not being spoofed, the residual between the expected value and the calculated value of DOA conforms to a Gaussian distribution with zero mean, and the sum of squared residuals conforms to a chi-square distribution. When there are one or more spoofing signals in the receiving signal channel of the receiver, the residual sum of squares conforms to the non-central chi-square distribution. Therefore, SSE can be used to assess whether the receiver is spoofed [34]. The SSE test metric is defined as follows:
S S E = t r a c e D p c f R D e n u Q N 1 D p c f R D e n u T
where D p c f is a [ 3 × N ] matrix in the local coordinate frame of the antenna array and N means the number of satellites. Each column in D p c f is a unit vector between the satellite and the receiver, denoted as d ^ p c f i , and i represents the number of columns. D e n u is a [ 3 × N ] matrix in the user E N U coordinate frame. Each column in D e n u is a unit vector between the satellite and the receiver, denoted as d ^ e n u i . The relationship between D p c f and D e n u is D p c f = R D e n u + E . And E is a [ 3 × N ] measurement noise matrix. R is a [ 3 × 3 ] unitary rotation matrix. Q N is a diagonal matrix consisting of the variance of the observation errors, and its diagonal elements are σ 1 2 , σ 2 2 , σ 3 2 , , σ n 2 .
From the definition of the SSE test metric, it can be seen that when the signal direction of the satellite is normal, the SSE test metric obeys the chi-square distribution with a degree of freedom k = 2 N 3 . If there is a spoofing signal in the incoming signals, the SSE test metric obeys the non-central chi-square distribution with the degree of freedom as k and the non-central parameter as λ 1 . The λ 1 shows the degree of deviation between the non-central chi-square distribution and the standard chi-square distribution under the same degree of freedom. The binary hypothesis for spoofing detection can be obtained as:
H 0 ( R e a l )   :   S S E χ 2 ( k ) H 1 ( S p o o f i n g )   :   S S E χ 2 ( k , λ ) k = ( 2 N 3 ) λ 1 = n = 1 N Δ g n σ n 2
where Δ g n is the angle difference between the expected value and the calculated value of the n t h signal DOA, which can be expressed as follows:
Δ g n = arccos d ^ p c f n R d ^ e n u n
σ n is the standard deviation of the measurement error, which is related to the elevation angle of the satellite. In [35], the fitting function of the distribution curve between σ n and α is given as σ n = 2.9 e 0.0086 α . According to the Neyman–Pearson criterion, each epoch can set the SSE test metric related to the false alarm rate as the DOA threshold. In this paper, the false alarm rate P F A R is set to 10 3 . In the case of 6 satellites, the threshold S S E t h of the SSE test matric is 27.88. If the calculated value is greater than S S E t h , it is considered that the receiver is spoofed. The relationship between P F A R and S S E t h is as follows:
P F A R = P { S S E > S S E t h | H 0 } = 1 0 S S E t h p χ 2 ( k ) ( x ) d x
Comparing the DOA calculated value with the expected value, if the difference between the two is large, it can be judged that the signal is a spoofing signal so as to realize spoofing identification. Furthermore, when the receiver is locked onto the same spoofer, the DOAs of all spoofing signals should be the same. The elevation angle and azimuth angle contained in DOAs are the direction information of the deception source. It is also possible to identify the spoofing signals based on the fact that the DOAs of the spoofing signals are the same.

3. Experiments and Results

3.1. Experimental Scenario

In order to verify the effectiveness of the method proposed in this paper, spoofing detection and direction-finding experiments were carried out on the roof of the aerospace information research institute in Beijing. The experimental scenario is shown in Figure 8. The experimental equipment mainly includes a data processing unit, an external clock, a spoofer device, four antennas, and an omnidirectional transmitting antenna. Among them, the data processing unit is composed of four GNSS boards and a computing core. The GNSS board receives observation data and ephemeris data, DOAs are calculated in the computing core, and the real-time calculation results are output by the upper computer. The GNSS receiver board model is Unicorecomm UB480 (UB480 is a GNSS receiver board produced by Unicorecomm company. And the Unicorecom is a company from Beijing, China), and the price is about USD 360. The antenna model is HIGH GAIN HG-ZMYH3181 (HIGH GAIN is a company from Shanghai, China), and the price of a single antenna is about USD 290. The computing core baseboard is XC7Z035 from Xilinx Company (San Jose, CA, USA). The spoofer is a generative spoofer device. In order to improve the electromagnetic environment and weaken the influence of multipath, some absorbing materials are added around the four antennas.

3.2. Experimental Results

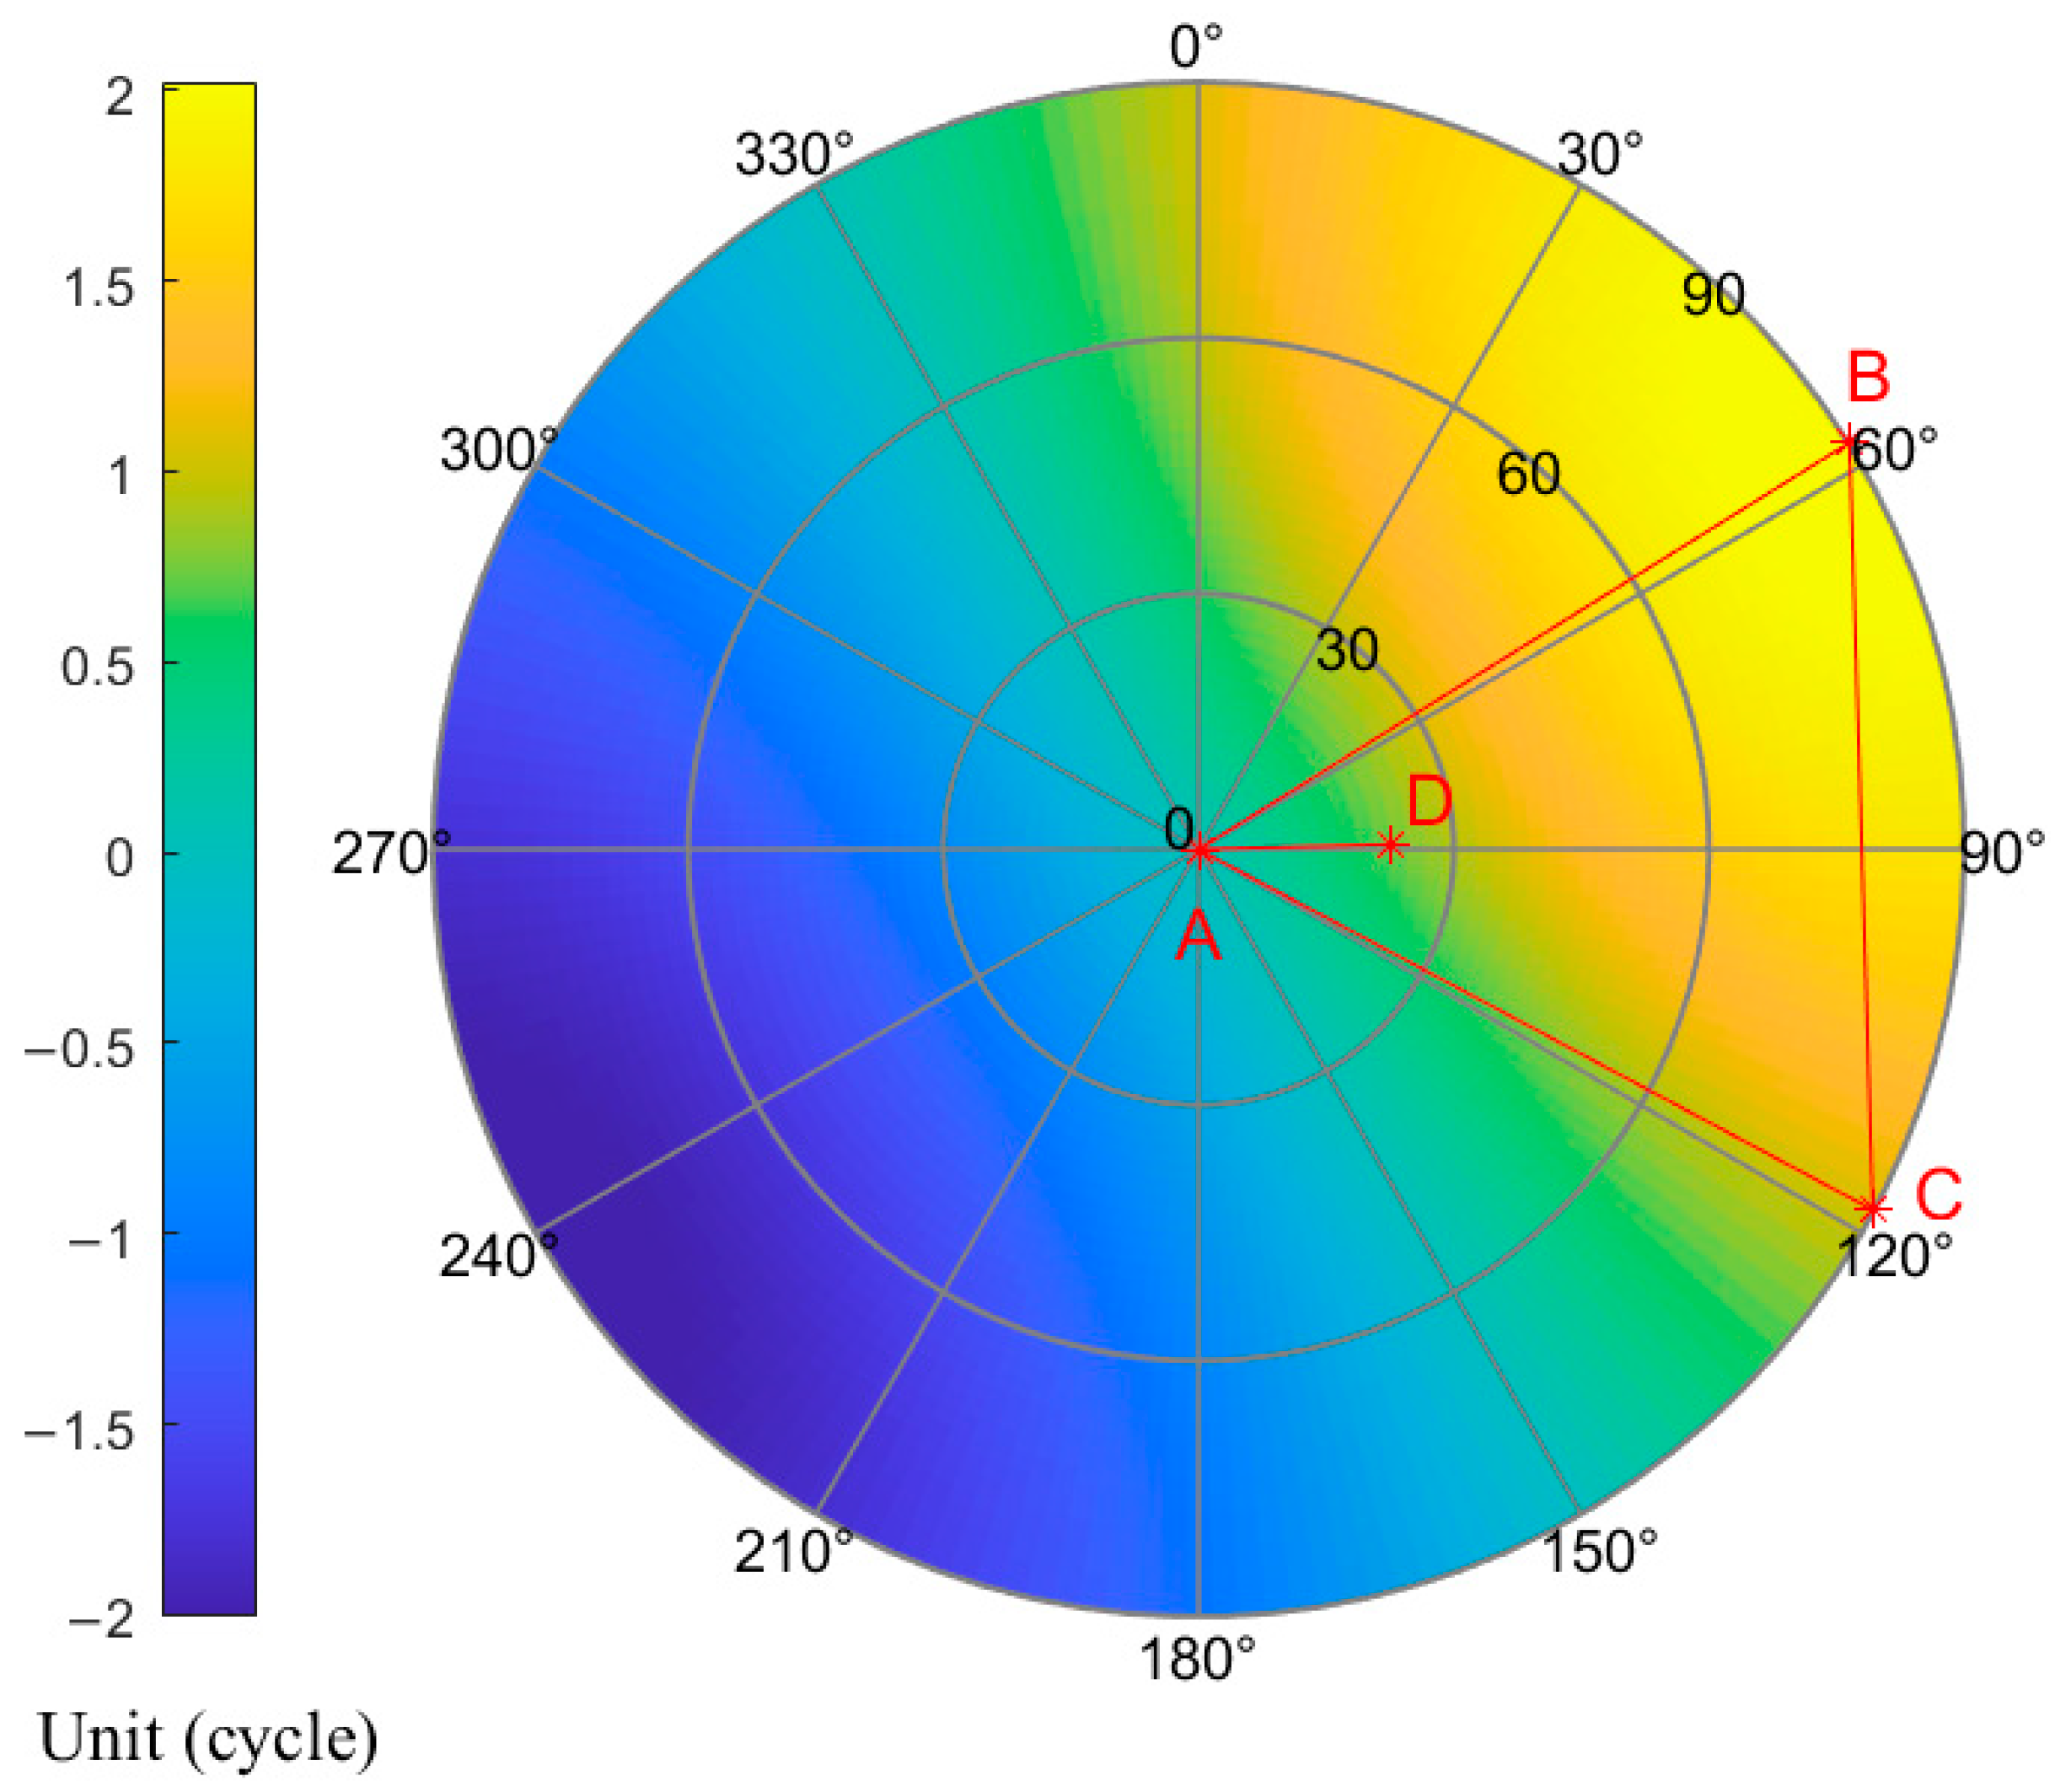
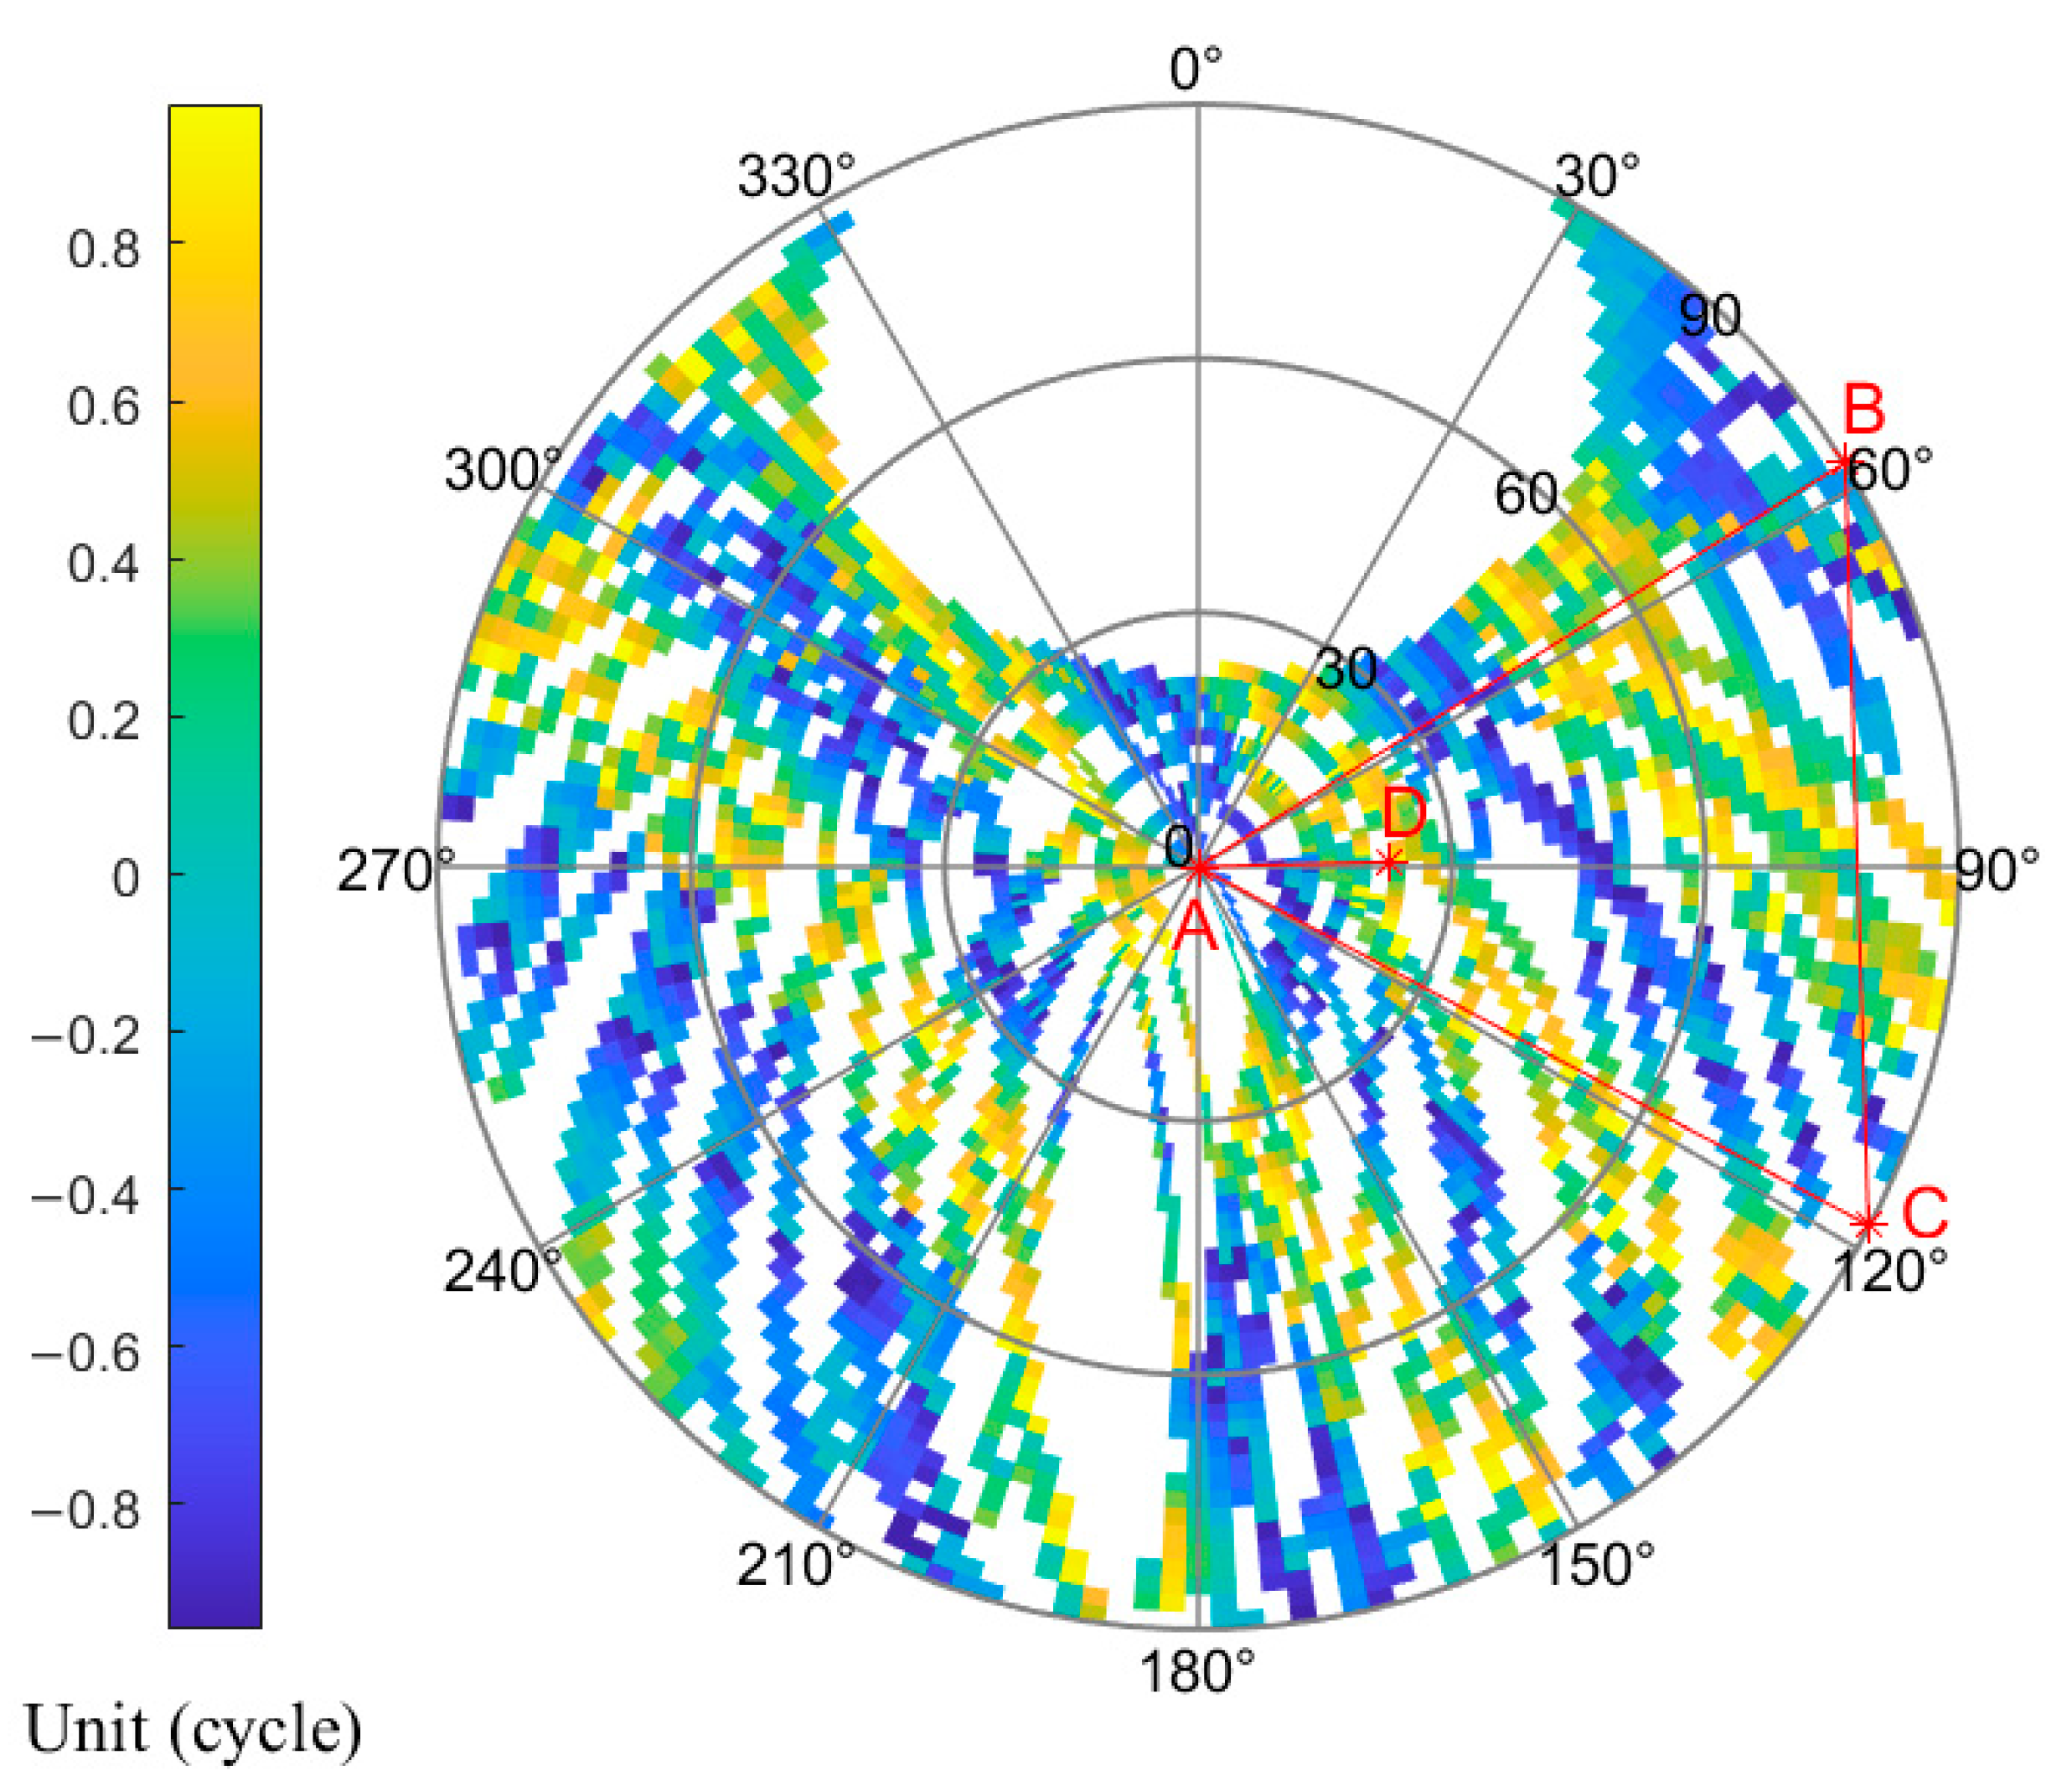
3.2.1. Error Calibration Results

This section focuses on the correction results of the power-on clock error F r ( c Δ d t i j ) and hardware delay error F r ( η ) in Section 2.3. Experimental data were collected on 7 November 2022. Figure 9 shows the calculation results of F r ( c Δ d t i j ) for multiple satellites at the three frequency points of GL1, B1I, and B1C. Table 1 shows the calculated values of GL1 Power-on clock corrections between AB, AC, and AD. Figure 10 shows the average value of F r ( c Δ d t i j ) over a period of time calculated using data from three frequency points of three baselines.
The following experiment is carried out by taking the GPS L1 frequency point as an example. Experimental data were collected on 24 September 2022. The experiment lasted five days, and the sampling frequency was 1 Hz. Figure 11 is the true value of the carrier difference between A and B calculated according to Formula (3), corresponding to Δ φ i j s in Formula (22). Figure 12 is the carrier difference in Formula (22), which is corrected by using the power-on clock correction, corresponding to F r Δ φ ˜ i j s + c Δ d t i j . Figure 13 is the calculation result of F r ( η ) , which is the difference between the data in Figure 11 and Figure 12.

3.2.2. False Alarm Experimental Results

In this section, two experiments were performed under the non-spoofing condition. The first experiment was conducted on 20 October 2022. Additionally, the second experiment was conducted on 25 October 2022. The calculated value of DOA is obtained according to the airspace information, and the expected value of DOA is obtained according to the ephemeris information. In the experiments, the difference between the two groups of values was compared, and the SSE test metric and the false alarm rate were calculated. Figure 14 and Figure 15 show the comparison information of the expected and calculated values of the elevation angle and azimuth angle of G04 and G09 in the first experiment.
Table 2 and Table 3 show more satellite elevation and azimuth error statistics for the first experiment.
Figure 16a and Figure 16b, respectively, show the SSE test metric and the judgment information of the receiver state in two different experiments.

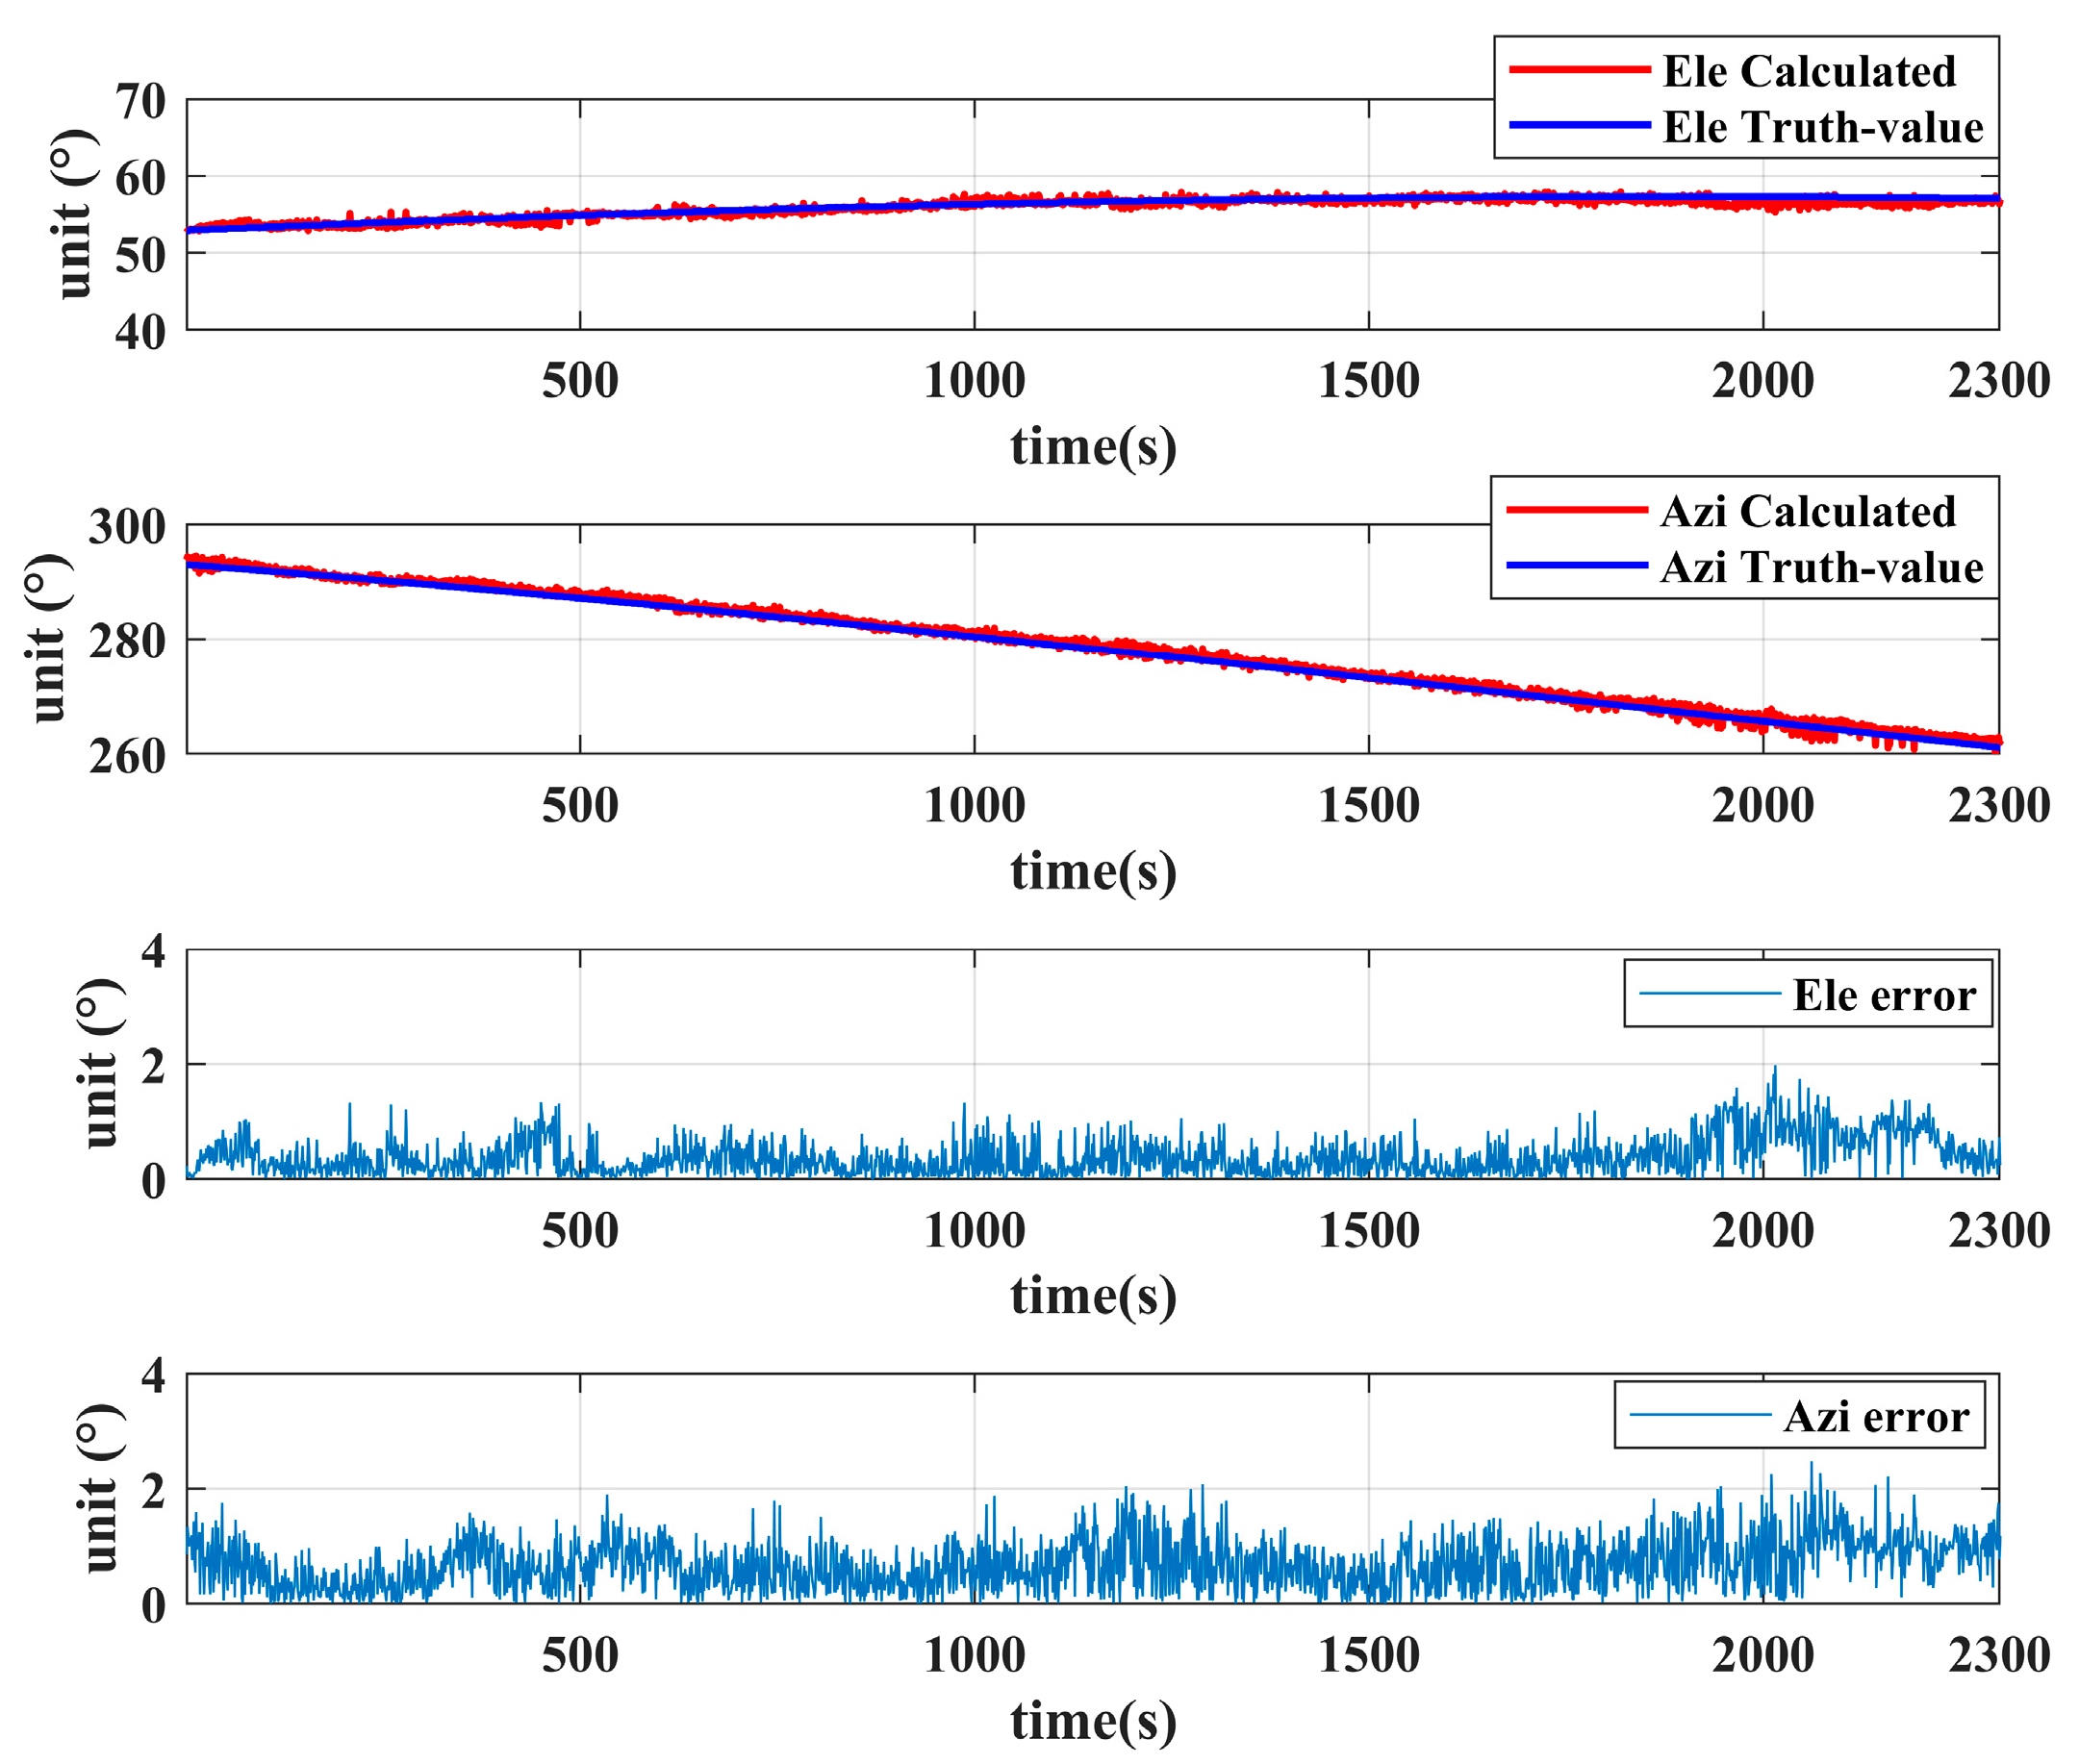
3.2.3. Spoofing Experiments Results

The following shows the experimental results under the spoofing condition. The scene of the spoofing experiment is shown in Figure 8. Two spoofing experiments were conducted on 27 December 2022, and the experimental results are shown in Figure 17a and Figure 17b, respectively.
Figure 18 shows the details of G14 and G21 in the first spoofing experiment, and the part between the two red dotted lines indicates the time period when the spoofer device is turned on. Figure 19 shows the changes in the orientation of all satellites in the airspace for normal and spoofing situations.

4. Discussion

4.1. Discussion on Error Calibration Results

This section discusses the results obtained in Section 3.2.1.
It can be seen from Figure 9 that the correction values are the same among different satellites of the same frequency because the receiver’s power-on clock error is related to the receiver but has nothing to do with the satellite. The test results are consistent with reality. The data in Table 1 provide clearer evidence of this conclusion. The frequency of both GL1 and B1C is the same, while their frequency does not coincide with that of B1I. Therefore, the power-on clock error of GL1 and B1C are the same but different from that of B1C. This is consistent with the derivation of Formula (21), and the power-on clock error is related to the signal frequency. Figure 10 shows the statistical results of the mean value of F r ( c Δ d t i j ) of all satellites among multiple receivers over a period of time.
The fractional part F r ( η ) of the hardware delay error includes cable delay error, multipath error, and antenna phase center error. In this paper, the correction of this error is carried out by using the method of long-term calculation and drawing the error sky map. In Figure 11, Figure 12 and Figure 13, the antenna A is selected as the reference antenna, which is located at the origin of the ENU coordinate system. Ignoring the elevation angle and considering the influence of the azimuth angle, the relative positions of the four antennas in the sky map can be obtained. It can be seen that the sky diagrams of the true and calculated values of carrier difference are approximately symmetrical along the baseline A B . Additionally, the values in the diagram along the baseline A B vary across integers as the elevation angle changes. This feature is more prominent in Figure 12. When the satellite flies above the A B baseline, as the ambiguity difference between stations changes, the corresponding calculated value also changes across integers. This is the reason for the change of crossing integers. The number of times of crossing integers is related to the length of the baseline, and in Figure 11 and Figure 12, it is consistent with the length of the A B baseline. The blank part within the azimuth angle of 330° to 30° in Figure 12 is caused by the fact that there is no sub-satellite point in the north of the test area. The results of A C and A D are similar to those of baseline A B and will not be repeated here.

4.2. Discussion on False Alarm Experimental Results

This section discusses the results obtained in Section 3.2.2.
It can be seen from Figure 14 and Figure 15 that the calculated values are very concentrated around the expected value, and the error between the two fluctuates within a small range. The calculation error of G09 is slightly larger than that of the G04 satellite, which is caused by the lower elevation angle of G09. The observation error accuracy is related to the elevation angle, and a lower elevation angle may lead to an increase in the observation error. In extreme cases, wrong calculations may even occur, and a reasonable elevation angle threshold can be set when the number of satellites is sufficient. There are two possible reasons for the larger observation errors at lower elevation angles. One is that the lower elevation angles lead to lower arrival power and poorer signal quality of satellite signals. The second is that the antenna layout of the planar array limits the accuracy of DOA estimation. From Table 2 and Table 3, it can be seen that the average error and standard deviation of the elevation and azimuth angles are small, the data results are stable and reliable, and the maximum error is within an acceptable range. It shows that the DOA calculation method proposed in this paper is effective and reliable.
In Figure 16a,b, we define two status tags. We mark it as “Real” when the SSE test metric is smaller than S S E t h . Otherwise, we mark it as “Spoof” when the SSE test metric is larger than S S E t h , indicating that at least one spoofing signal exists. The detection threshold S S E t h for spoofing is related to the number of satellites and the chosen false alarm rate P F A R . In this paper, P F A R is 1 × 10 3 . It can be seen from Figure 16a,b that the SSE test metric in each epoch is smaller than the threshold. The state tag of all epochs is judged to be “Real”, which is consistent with the actual situation. This shows that the calculation method and the selection of S S E t h in this paper are reliable.

4.3. Discussion on Spoofing Experiments Results

This section discusses the results obtained in Section 3.2.3.
The spoofing experiments were conducted according to the following description. First, the GPS L1 data of the satellite is normally received through the four antennas. After a period of time, turn on the spoofer device and broadcast spoofing signals to the four antennas. In the spoofing state, all the receiver receives are spoofing signals. After some time, turn off the spoofer device, and the four antennas will receive normal satellite signals again. The experiments mainly focus on the change of the SSE test metric under the spoofing state. The results of two spoofing experiments are shown in Figure 17a,b, respectively. During the time period without spoofing, the SSE test metric is smaller than the threshold. At the moment when the spoofer device is turned on or off, the SSE test metric has a large jump, and its value has a sudden change of about 10 2 magnitude. The SSE test metric is much larger than the threshold during the time period when the receiver is spoofed (the time period between the red dotted lines in Figure 17a,b). Each epoch can accurately determine whether the receiver has received spoofing signals, and the detection rate reaches 100%.
In the case of spoofing, the elevation angle and azimuth angle of each spoofing signal is the direction information of the spoofer. It can be seen from Figure 18 that before the receiver is spoofed, the elevation and azimuth angles of G07 and G14 are different, and the satellite signal is related to the real position of the satellite in the airspace. After the receiver is spoofed, the elevation and azimuth angles of the two satellites suddenly change to near the true value of the direction of the spoofer. This is consistent with reality because, at this time, the signals received by the receiver are all sent by the transmitting antenna of the spoofer. After the spoofer device is turned off, the receiver receives satellite signals normally. The elevation angle and azimuth angle of the two satellites are no longer close to the direction of the transmitting antenna and return to normal. In this experiment, under spoofing conditions, since all satellite signals have the same DOA, and the calculated value of DOA is far from the expected value, it can be identified that the received signals are all spoofing signals.
Figure 19 shows the changes in the orientation of all satellites in the airspace for normal and spoofing situations. Before the spoofer device is turned on, the satellites are at various locations in the airspace. After turning on the spoofer device, the number of satellites simulated by the spoofer is reduced compared with the normal situation, and the elevation and azimuth angles of the satellites are suddenly changed to the direction of the transmitting antenna of the spoofer, which is consistent with the reality. Table 4 shows the different information Δ g n on the DOAs of each signal broadcast by the spoofer. It can be seen from Table 4 that because the spoofing signals broadcast by the same spoofer reach the receiver through the same propagation path, the differences in DOAs between different signals are very small. This is consistent with reality. The direction of the transmitting antenna of the spoofer is E l e = 41 ° ,   A z i = 33 ° , and the error between the calculated values and the real value is within 5 ° .

4.4. Advantages and Disadvantages

This section discusses the advantages and disadvantages of the proposed methods.
The advantages of the proposed method in the article are summarized as follows: Firstly, it achieves spoofing detection and direction-finding using low-cost commercial board components. The implementation of spoofer direction finding is no longer limited to expensive array antennas. Secondly, it solves the question of power-on clock error in low-cost receiver boards. Moreover, the issue of low-cost antennas being susceptible to unstable antenna phase centers and multipath effects. Thirdly, the method proposed in the article simplifies the algorithm for solving carrier phase ambiguity.
The shortcomings of the proposed method in the article are summarized as follows: firstly, in low-elevation situations, the calculation accuracy of DOA is relatively poor, which may be limited by the planar geometric configuration of the antennas in this article. Secondly, due to the simplification of the calculation method for carrier phase ambiguity in the article, both the power-on clock error and the hardware delay error are relative values. If we want to obtain an absolute value, we need to fix the carrier phase ambiguity. The unique determination of ambiguity can also provide assistance in determining the final DOA.

5. Conclusions

This paper proposes a method for spoofing detection and direction-finding based on low-cost commercial board components. By using low-cost commercial board components, approximate DOA calculation accuracy can be obtained. The main conclusions are as follows:
(1)
Low-cost commercial board components can be used for large-scale deployment and implementation due to their low-cost and low-complexity algorithms, with high feasibility and potential application value;
(2)
Compared with professional equipment, low-cost commercial board components must solve two problems in anti-spoofing applications, namely, power-on clock error and hardware delay. The hardware delay includes cable delay error, multipath error, and antenna phase center error. In this paper, the influence of the two problems on the carrier difference is theoretically deduced, and the corresponding error correction method is proposed. Aiming at the power-on clock error, it is proposed to use pseudo-range and instantaneous Doppler values to correct it. For the hardware delay error, this paper uses the method of depicting the time-series average sky map to compensate for it. Finally, an experiment is carried out on the error term, and the experimental results are consistent with the theoretical derivation and the actual situation;
(3)
In the anti-spoofing method, a binary hypothesis testing model is constructed. With a certain false alarm rate, a 100% spoofing detection rate is achieved. Additionally, all spoofing signals are identified. Furthermore, the direction information of the spoofer is obtained under the spoofing condition. The direction error is within 5° range, achieving high accuracy.
In future work, we will pay more attention to the following research. One is to explore the relationship between the configuration of the antenna array and the accuracy of DOA at low elevation angles. The second is to apply low-cost commercial board components to more anti-spoofing scenarios. The third is to conduct test experiments in combination with more common low-cost components.

Author Contributions

Conceptualization, P.M., H.Y. and X.C.; methodology, P.M., H.Y. and R.L. (Ran Li); investigation, Y.G., X.C. and R.L. (Ruidan Luo); resources, Y.G., S.L., G.Z., C.F. and J.X.; software, P.M. and H.Y.; writing—original draft preparation, P.M.; writing—review and editing, P.M., H.Y., X.C., R.L. (Ruidan Luo) and R.L (Ran Li).; visualization, P.M., X.C. and Y.G.; supervision, S.L. and H.Y.; All authors have read and agreed to the published version of the manuscript.

Funding

This research was funded by the National Defense Science and Technology Innovation Special Zone Innovation Workstation of China (Grant No.: CX2022-04-03-02). This work was supported by the Beijing Natural Science Foundation with Grant No. 1234041 and the State Key Laboratory of Satellite Navigation System and Equipment Technology with Grant No. CEPNT2022B01.

Data Availability Statement

Not applicable.

Conflicts of Interest

The authors declare no conflict of interest.

References

  1. Liu, T.; Zhang, B.; Yuan, Y.; Li, M. Real-Time Precise Point Positioning (RTPPP) with raw observations and its application in real-time regional ionospheric VTEC modeling. J. Geod. 2018, 92, 1267–1283. [Google Scholar] [CrossRef]
  2. Xu, Y.; Wang, K.; Yang, C.; Li, Z.; Zhou, F.; Liu, D. GNSS/INS/OD/NHC Adaptive Integrated Navigation Method Considering the Vehicle Motion State. IEEE Sens. J. 2023. [Google Scholar] [CrossRef]
  3. Ghiasi, Y.; Duguay, C.R.; Murfitt, J.; van der Sanden, J.J.; Thompson, A.; Drouin, H.; Prévost, C. Application of GNSS Interferometric Reflectometry for the Estimation of Lake Ice Thickness. Remote Sens. 2020, 12, 2721. [Google Scholar] [CrossRef]
  4. Gholamrezaee, S.; Bagherbandi, M.; Parvazi, K.; Farzaneh, S. A study on the quality of GNSS signals for extracting the sea level height and tidal frequencies utilizing the GNSS-IR approach. GPS Solut. 2023, 27, 72. [Google Scholar] [CrossRef]
  5. Psiaki, M.L.; O’Hanlon, B.W.; Powell, S.P.; Bhatti, J.A.; Wesson, K.D.; Schofield, T.E. GNSS spoofing detection using two-antenna differential carrier phase. In Proceedings of the 27th international technical meeting of the satellite division of the Institute of Navigation (ION GNSS+ 2014), Tampa, FL, USA, 8–12 September 2014; pp. 2776–2800. [Google Scholar]
  6. Shepard, D.P.; Humphreys, T.E.; Fansler, A.A. Evaluation of the vulnerability of phasor measurement units to GPS spoofing attacks. Int. J. Crit. Infrastruct. Prot. 2012, 5, 146–153. [Google Scholar] [CrossRef]
  7. Psiaki, M.; Humphreys, T. Civilian GNSS Spoofing, Detection, and Recovery. Position, Navigation, and Timing Technologies in the 21st Century: Integrated Satellite Navigation, Sensor Systems, and Civil Applications; John Wiley & Sons: Hoboken, NJ, USA, 2021; pp. 655–680. [Google Scholar]
  8. Mit, R.; Zangvil, Y.; Katalan, D. Analyzing tesla‘s level 2 autonomous driving system under different gnss spoofing scenarios and implementing connected services for authentication and reliability of gnss data. In Proceedings of the 33rd International Technical Meeting of the Satellite Division of The Institute of Navigation (ION GNSS+ 2020), Online, 22–25 September 2020; pp. 621–646. [Google Scholar]
  9. Geng, Z. Study on GNSS Spoofing Detection and Mitigation Techoniques; National University of Defense Technology: Changsha, China, 2019. [Google Scholar]
  10. Chen, X.; Luo, R.; Liu, T.; Yuan, H.; Wu, H. Satellite Navigation Signal Authentication in GNSS: A Survey on Technology Evolution, Status, and Perspective for BDS. Remote Sens. 2023, 15, 1462. [Google Scholar] [CrossRef]
  11. Lee, J.-H.; Kwon, K.-C.; An, D.-S.; Shim, D.-S. GPS spoofing detection using accelerometers and performance analysis with probability of detection. Int. J. Control Autom. Syst. 2015, 13, 951–959. [Google Scholar] [CrossRef]
  12. Spoljar, D.; Lenac, K.; Zigman, D.; Marović, M. A Mobile Network-Based GNSS Anti-Spoofing. In Proceedings of the 2018 26th Telecommunications Forum (TELFOR), Belgrade, Serbia, 20–21 November 2018; pp. 1–3. [Google Scholar]
  13. Vagle, N.; Broumandan, A.; Lachapelle, G. Multiantenna GNSS and inertial sensors/odometer coupling for robust vehicular navigation. IEEE Internet Things J. 2018, 5, 4816–4828. [Google Scholar] [CrossRef]
  14. Qiao, Y.; Zhang, Y.; Du, X. A vision-based GPS-spoofing detection method for small UAVs. In Proceedings of the 2017 13th International Conference on Computational Intelligence and Security (CIS), Hong Kong, China, 15–18 December 2017; pp. 312–316. [Google Scholar]
  15. Dehghanian, V.; Nielsen, J.; Lachapelle, G. GNSS spoofing detection based on receiver C/No estimates. In Proceedings of the 25th International Technical Meeting of The Satellite Division of the Institute of Navigation (ION GNSS 2012), Nashville, TN, USA, 17–21 September 2012; pp. 2878–2884. [Google Scholar]
  16. Yuan, D.; Li, H.; Wang, F.; Lu, M. A GNSS acquisition method with the capability of spoofing detection and mitigation. Chin. J. Electron. 2018, 27, 213–222. [Google Scholar] [CrossRef]
  17. Brown, R.G. A baseline GPS RAIM scheme and a note on the equivalence of three RAIM methods. Navigation 1992, 39, 301–316. [Google Scholar] [CrossRef]
  18. Ji, N.; Rao, Y.; Wang, X.; Zou, D.; Chen, X.; Guo, Y. Spoofing Traction Strategy Based on the Generation of Traction Code. Remote Sens. 2023, 15, 500. [Google Scholar] [CrossRef]
  19. Huang, L.; Yong, L.; Xu, B.; Wang, F. Analysis of carry phase difference detection for satellite navigation receivers anti-spoofing. J. Natl. Univ. Def. Technol. 2016, 38, 103–106. [Google Scholar]
  20. Swaszek, P.F.; Hartnett, R.J. A Multiple COTS Receiver GNSS Spoof Detector—Extensions. In Proceedings of the 2014 International Technical Meeting of The Institute of Navigation, San Diego, CA, USA, 27–29 January 2014; pp. 316–326. [Google Scholar]
  21. Chen, Z.; Li, H.; Wei, Y.; Zhou, Z.; Lu, M. GNSS antispoofing method using the intersection angle between two directions of arrival (IA-DOA) for multiantenna receivers. GPS Solut. 2023, 27, 11. [Google Scholar] [CrossRef]
  22. Zhang, X.; Pang, J.; Su, Y.; Ou, G. Spoofing detection technique on antenna array carrier phase double difference. J. Natl. Univ. Def. Technol. 2014, 36, 55–60. [Google Scholar]
  23. Roy, R.; Paulraj, A.; Kailath, T. ESPRIT—A subspace rotation approach to estimation of parameters of cisoids in noise. IEEE Trans. Acoust. Speech Signal Process. 1986, 34, 1340–1342. [Google Scholar] [CrossRef]
  24. Schmidt, R. Multiple emitter location and signal parameter estimation. IEEE Trans. Antennas Propag. 1986, 34, 276–280. [Google Scholar] [CrossRef]
  25. Meurer, M.; Konovaltsev, A.; Cuntz, M.; Hättich, C. Robust joint multi-antenna spoofing detection and attitude estimation using direction assisted multiple hypotheses RAIM. In Proceedings of the 25th international technical meeting of the satellite division of the Institute of Navigation (ION GNSS 2012), Nashville, TN, USA, 17–21 September 2012; pp. 3007–3016. [Google Scholar]
  26. Cina, A.; Piras, M. Performance of low-cost GNSS receiver for landslides monitoring: Test and results. Geomat. Nat. Hazards Risk 2015, 6, 497–514. [Google Scholar] [CrossRef]
  27. Semler, Q.; Mangin, L.; Moussaoui, A.; Semin, E. Development of a low-cost centimetric gnss positioning solution for android applications. Int. Arch. Photogramm. Remote Sens. Spat. Inf. Sci. 2019, XLII-2/W17, 309–314. [Google Scholar] [CrossRef]
  28. Guo, F. Research on High Precision Phase Center Antenna Based on Beidou Satellite Navigation System; University of Electronic Science and Technology of China: Chengdu, China, 2019. [Google Scholar]
  29. Marais, J.; Berbineau, M.; Heddebaut, M. Land mobile GNSS availability and multipath evaluation tool. French National Institute for Transport and Safety Research, Laboratory of Transport Electronics and Signals Processing, 59650 Villeneuve d’Ascq, France. IEEE Trans. Veh. Technol. 2005, 54, 1697–1704. [Google Scholar] [CrossRef]
  30. Chen, J.; Wang, J.; Yuan, H.; Xu, Y.; Chen, X.; Chen, X.; Yang, G. Performance analysis of a GNSS multipath detection and mitigation method with two low-cost antennas in RTK positioning. IEEE Sens. J. 2021, 22, 4827–4835. [Google Scholar] [CrossRef]
  31. Zhou, F. Theory and Methodology of Multi-GNSS Undifferenced and Uncombined Precise Point Positioning; East China Normal University: Shanghai, China, 2018. [Google Scholar]
  32. Wang, T.; Yao, Z.; Lu, M. Mesh topology based clock synchronization technique for pseudolite systems. Navigation 2020, 67, 619–632. [Google Scholar] [CrossRef]
  33. Wu, J.; Tang, X.; Ni, S.; Wang, F. The effect of GNSS receiver clock biase on double differenced carrier phase measurement. In Proceedings of the 2016 5th International Conference on Computer Science and Network Technology (ICCSNT), Changchun, China, 10–11 December 2016; pp. 762–766. [Google Scholar] [CrossRef]
  34. Konovaltsev, A.; Cuntz, M.; Haettich, C.; Meurer, M. Performance analysis of joint multi-antenna spoofing detection and attitude estimation. In Proceedings of the 2013 International Technical Meeting of The Institute of Navigation, San Diego, CA, USA, 27–29 January 2013; pp. 864–872. [Google Scholar]
  35. Chen, J. GNSS Information Processing Methods and Applications Based on Two/Multiple Antenna; University of Chinese Academy of Sciences: Beijing, China, 2022. [Google Scholar]
Figure 1. Schematic diagram of hardware structure. The I, II, III and IV represent the antennas of the four receivers, respectively.
Remotesensing 15 02781 g001
Figure 2. Four-antenna configuration. A, B, C, and D represent four antennas. A B C is an equilateral triangle.
Remotesensing 15 02781 g002
Figure 3. Schematic diagram of algorithm process.
Remotesensing 15 02781 g003
Figure 4. Schematic diagram of DOA in E N U coordinate system. A and B respectively represent two GNSS receiving antennas.
Remotesensing 15 02781 g004
Figure 5. Geometrical diagram of carrier single difference between receivers.
Remotesensing 15 02781 g005
Figure 6. Three-dimensional schematic diagram of A B C before and after rotation. S and S 1 are satellites before and after rotation. A S and A S 1 are the unit vectors of the satellite signal direction before and after rotation.
Remotesensing 15 02781 g006
Figure 7. Schematic diagram of a spoofing attack.
Remotesensing 15 02781 g007
Figure 8. Experimental scene.
Remotesensing 15 02781 g008
Figure 9. Power-on clock corrections for three frequency points of multiple satellites between A and B .
Remotesensing 15 02781 g009
Figure 10. Power-on clock correction value statistics.
Remotesensing 15 02781 g010
Figure 11. The true value of carrier difference between A and B .
Remotesensing 15 02781 g011
Figure 12. Calculated value of carrier difference between A and B .
Remotesensing 15 02781 g012
Figure 13. Statistical value of hardware delay error between A and B .
Remotesensing 15 02781 g013
Figure 14. DOA results of G04 without spoofing.
Remotesensing 15 02781 g014
Figure 15. DOA results of G09 without spoofing.
Remotesensing 15 02781 g015
Figure 16. (a) represents the result of the first experiment without spoofing, and (b) represents the result of the second experiment.
Remotesensing 15 02781 g016aRemotesensing 15 02781 g016b
Figure 17. (a) represents the result of the first experiment with spoofing, and (b) represents the result of the second experiment.
Remotesensing 15 02781 g017aRemotesensing 15 02781 g017b
Figure 18. The detailed changes in the direction of G14 and G21 before and after spoofing.
Remotesensing 15 02781 g018
Figure 19. Changes in the direction of satellites before and after spoofing.
Remotesensing 15 02781 g019
Table 1. Calculated values of GL1 Power-on clock corrections between AB, AC, and AD.
GL1ABACAD
AveStdAveStdAveStd
G010.01230.00780.08910.01320.20160.0178
G100.00930.00560.08980.00860.19870.0173
G120.01190.00550.08930.00870.20120.0175
G210.01440.00780.09280.01030.20240.0181
G220.00900.00550.08530.01200.19820.0172
G230.01210.00640.08910.01280.20210.0177
G250.01300.00540.09090.00880.20160.0174
G310.01140.00550.08740.01220.19850.0264
G320.01140.00530.09140.00880.20110.0173
Table 2. Elevation angle error statistics.
Maximum   ( ° ) Average   ( ° ) Std   ( ° )
G041.980.38380.3191
G093.570.84740.5805
G164.110.39010.4806
G262.880.84920.5970
G273.190.94480.5836
G314.320.90990.6795
Table 3. Azimuth angle error statistics.
Maximum   ( ° ) Average   ( ° ) Std   ( ° )
G042.480.67400.4353
G092.120.66460.4202
G166.71.29030.9061
G263.261.03340.6467
G273.041.15550.6879
G312.671.09580.6073
Table 4. Statistical value of the difference between spoofing signal DOA and true DOA.
Δ g n Mean (°) Δ g n Std (°)
G014.611.22
G144.651.17
G214.601.25
G174.671.23
Disclaimer/Publisher’s Note: The statements, opinions and data contained in all publications are solely those of the individual author(s) and contributor(s) and not of MDPI and/or the editor(s). MDPI and/or the editor(s) disclaim responsibility for any injury to people or property resulting from any ideas, methods, instructions or products referred to in the content.

