Article

Spatiotemporal Variations in Fractional Vegetation Cover and Their Responses to Climatic Changes on the Qinghai–Tibet Plateau

1
Key Laboratory of Land Surface Pattern and Simulation, Institute of Geographic Sciences and Natural Resources Research, Chinese Academy of Sciences, Beijing 100101, China
2
University of Chinese Academy of Sciences, Beijing 100049, China
*
Author to whom correspondence should be addressed.
Remote Sens. 2023, 15(10), 2662; https://doi.org/10.3390/rs15102662
Submission received: 21 March 2023 / Revised: 10 May 2023 / Accepted: 18 May 2023 / Published: 19 May 2023

Abstract

:
The alpine vegetation of the Qinghai–Tibet Plateau (QTP) is extremely vulnerable and sensitive to climatic fluctuations, making it an ideal area to study the potential impacts of climate on vegetation dynamics. Fractional vegetation cover (FVC) is regarded as one of the key indicators in monitoring semiarid and arid ecosystems due to its sensitive responses to vegetation behavior under climatic changes. Although many studies have analyzed the responses of vegetation on the QTP to climatic change, limited information is available on the influence of climatic variables on FVC changes in this area. In this study, we used satellite images and meteorological data to investigate the spatiotemporal variations of FVC during the growing season (FVCGS) during 1998–2018 and evaluated the responses to changes in climatic variables. Results showed that FVCGS displayed an overall fluctuating rise of 0.01/10 a (p < 0.01) over the study period. The FVCGS variation was spatially heterogeneous, with a general trend of greening in the northern and browning in the southern QTP. Obvious correlations were observed between the average FVC, average temperature, and total precipitation of the growing season, with precipitation being the primary controlling factor for vegetation growth. Some regions in the northwestern and northeastern QTP showed greening trends due to the positive influence of precipitation. Some areas in the southwestern QTP experienced browning trends due to water shortages caused, probably, by the weakening of the Indian monsoon. Browning in the southeastern parts was likely caused by drought and permafrost degradation resulting from high temperature. The inconsistent trend of vegetation change on the QTP is relatively high considering the continuous warming and changing atmospheric circulation patterns. FVC in most regions of the QTP has 0–1 month temporal responses to precipitation and temperature. Moreover, the one-month lagged effects of temperature and precipitation had a greater influence on steppe and desert vegetation than on other vegetation types. This research provides new perspectives for understanding the QTP vegetation response to climatic changes and a basis for making reasonable vegetation conservation and management policies.

Graphical Abstract

1. Introduction

The Qinghai–Tibet Plateau (QTP), also regarded as “The Third Pole”, is the highest plateau in the world, with an average elevation of >4000 m a.s.l., and its powerful thermal and topographic forcing mechanisms have profoundly shaped the climate of China and even the whole of Asia [1,2,3]. The ecosystem of the QTP is extremely susceptible and fragile to climatic fluctuations and disturbances, so it is an amplifier for revealing impacts of climatic changes on alpine ecosystems [4,5]. Since the 1960s, the QTP has warmed remarkably [2], and its warming rate is more rapid than that of its surrounding regions due to its high elevation [1,6,7]. As a result of global climatic changes and anthropogenic disturbance, the plateau is facing serious ecological and environmental problems, including decreasing snowpack, glacier retreat [2,8], permafrost degradation [2,9], soil exposure [10], and pasture degradation and overgrazing [2,11].
Vegetation can be a sensitive monitor in reflecting the ecological and environmental status of the QTP under climatic changes [4,11]. Monitoring vegetation dynamics of the QTP is essential for exploring its vegetation change patterns, detecting the impact of global warming, evaluating alpine ecosystem stability, and formulating sustainable protection and development measures. Satellite-observed vegetation parameters, i.e., fractional vegetation cover (FVC), can help evaluate vegetation dynamics on the QTP. FVC is defined as the ratio of the vertical projection area of vegetation (including leaves, stems, and branches) on the ground to the total statistical area, which reflects the dense degree of vegetation, growth condition, and the size of the area for photosynthesis [12]. It can effectively grasp spatiotemporal variations in vegetation cover in a specific region due to its strong sensitivity to vegetation behavior [13]. Moreover, climate change can cause changes in vegetation physiological characteristics, growth rate and growth pattern, which ultimately result in FVC change [14] The underlying connection between FVC and climate factors [14,15,16] indicates that FVC may indirectly reflect climate change. Therefore, the spatiotemporal change in FVC can effectively reveal the characteristics of vegetation growth dynamics, monitor drought stress, and evaluate ecosystem quality in a warming world [17,18].
Approaches of estimating FVC consist of field measurements and satellite-based observations. Field measurements have higher accuracy and spatial resolution but are limited by cost, discontinuous observation time, and smaller areas. Remote sensing observations are less costly, can cover large areas, and can be used to estimate FVC over long periods. Methods for estimating FVC based on remote sensing include empirical models [13], machine learning methods [19,20], physical methods [21], and pixel unmixing models (PUMs) [22,23], of which the latter are widely used because of their simplicity and feasibility. The PUMs assume that every image element on a remotely sensed image is composed of two or more components, and FVC is calculated through decomposing such mixed components. The dimidiate pixel model (DPM) is a linear form of PUM, assuming each image element is the combination of vegetation and non-vegetation components, and it estimates FVC based on these components [19,22]. The DPM does not require field FVC data and facilitates regional vegetation monitoring [24].
Temperature and precipitation are two important factors that influence vegetation growth, and their relationships with vegetation are complex and varied in terms of climate region, season, and vegetation types [11,25]. For alpine ecosystems like the QTP, temperature is recognized as a major contributor for vegetation growth [25]. Increasing temperature has been shown to promote vegetation growth remarkably through prolonging the growing season and promoting the photosynthesis of plants, particularly in regions with sufficient moisture [26]. For vegetation, the photosynthetic capacity will improve with rising temperature; however, it will decrease sharply once an optimal temperature is approached because of accelerating aging and the water imbalance in leaves due to excessive temperature [27]. Climate warming has aggravated the degradation of the extensive permafrost layers on the QTP and resulted in a reduction in the soil moisture content [4,26].
Precipitation also affects vegetation productivity remarkably at high altitudes of the QTP, leading to an obvious imbalance between a great rate of warming and a small rate of vegetation greening [28,29]. It has a certain moderating effect on the vegetation response to temperature, which provokes vegetation growth in hot and dry zones on the QTP and limits it in colder and wetter areas [30]. Precipitation aggravates soil erosion to some extent and diminishes soil organic matter content, thereby decreasing primary productivities [10].
Although many studies have analyzed the responses of vegetation on the QTP to climatic changes [20,26,30,31,32,33], limited information is available on the impacts of climatic factors on FVC changes on the plateau. The scientific question of how climatic variables affect spatiotemporal vegetation dynamics on the QTP still needs further clarification. The available observational data are extremely limited on the QTP because of the vast area, harsh wilds, and vulnerability and complexity of alpine ecosystems, restricting deep insights into long-term vegetation variations on the plateau and their link to climatic changes.
Here, we estimated the FVC of the QTP over a relatively long time interval (1998–2018) and explored the spatiotemporal pattern of the FVC. Then, we analyzed its responses and sensitivity to contemporary climate changes. The primary goals were: (1) to evaluate the spatiotemporal variation trends of the average FVC during the growing season; (2) to quantitatively assess the effects of temperature and precipitation on QTP vegetation and their spatial heterogeneities; and (3) to explore the lagged effects of temperature and precipitation on FVC.

2. Materials and Methods

2.1. Study Area

The QTP (26°–39°N, 73°–104°E) lies in the southwestern part of China (Figure 1), covering an area of about 2.54 × 10⁶ km2. It contains the whole territory of Xizang and Qinghai provinces, along with parts of Xinjiang, Gansu, Sichuan and Yunnan provinces in China. In addition, its terrain is complex, with extensive mountains, valleys, and basins.
The QTP climate is influenced by the interactive effects of atmospheric circulations (e.g., the Indian monsoon and Westerlies) and characterized by insufficient thermal resources, the uneven spatial distribution of precipitation, and abundant insolation [34]. The average annual temperature in the study areas varies from −15 °C to 10 °C, and the average annual precipitation decreases from >1000 mm in the humid southeastern part to <50 mm in the arid northwestern part [34]. The vegetation of the QTP corresponds to the hydrothermal gradient from the southeast to northwest, with broadleaf and coniferous forests growing in humid southeastern mountains, alpine meadow in the east to mid-east, alpine steppe in the mid-west to west, and desert spreads in the cold and dry northwestern areas.
Figure 1. (a) Geographic location, vegetation distribution and ecogeographical regions of the QTP and (b) its terrain information. The detailed definitions of ecogeographical regions are shown in Table 1.
Remotesensing 15 02662 g001

2.2. Data

2.2.1. Normalized Difference Vegetation Index (NDVI) Time Series and Processing

The NDVI shows a linear relationship with FVC and is sensitive to vegetation growth and spatial distribution [22,36], so it is a common vegetation index in DPMs [18]. The SPOT-VGT NDVI dataset is reliable in monitoring vegetation change [37], and has been proven to show higher FVC levels in desert areas [13]. Therefore, this dataset was employed for the analysis of spatiotemporal variation patterns of FVC on the QTP during 1998–2018 in this study.
The raw dataset (with a 1 km spatial resolution and a 10-day temporal resolution) (http://www.vito-eodata.be (accessed on 10 May 2022)) was preprocessed at the Flemish Institute for Technological Research (VITO) with atmospheric correction, geometric correction, and cloud removal [37]. The compound dataset for 10 days was acquired by using the maximum value composite (MVC) approach [29]. Monthly and annual NDVI datasets were also obtained by applying MVC, and pixels having NDVI < 0 were removed for the purpose of avoiding the influence of soil background.

2.2.2. Meteorological Data

A meteorological dataset developed by the National Tibetan Plateau Data Center [38] was adopted. The temporal resolution of the dataset was every 3 h and the spatial resolution was 0.1°. To enable a comparison with NDVI data, the temperature and precipitation datasets were resampled to the same spatial resolution by using a bilinear interpolation method, and their resultant data were integrated into monthly scale during 1998–2018 to facilitate subsequent analysis. Average temperature and total precipitation of the growing season (May–September) of each year were adopted.

2.2.3. Vegetation Data

Dominant vegetations present on the QTP include alpine sparse vegetation, desert, steppe, meadow, shrubland, coniferous forest, and broadleaf forest (Figure 1). The vegetation cover of the QTP was extracted from the detailed 1: 1,000,000 vegetation map [39].

2.2.4. FVC Validation Data

To validate the calculated FVC of this study, a published FVC dataset (with a 250 m spatial resolution and a 1-month temporal resolution) developed by the National Tibetan Plateau Data Center [40] was adopted as validation data. The validation data were resampled to the spatial resolution of 1 km by using a bilinear interpolation method to match the resolution of the FVC dataset of this study.

2.3. Methods

2.3.1. FVC Calculation

The FVC values were calculated by using the DPM. The DPM assumed that the information S captured by remote sensing images was only composed of vegetation information (SV) and soil information (SS) [41]. These components were calculated as below:
S = SV + SS
SV = FVC × Sveg
SS = (1 − FVC) × Ssoil
where Sveg and Ssoil represent pure vegetation and soil pixels, respectively.
Correspondingly, the FVC was calculated as below:
FVC = S     S soil S veg     S soil
S can be replaced by vegetation indicators (VIs) to improve the applicability of this formula [42]. In this case, the SPOT-VGT NDVI dataset was utilized as the VI to estimate the FVC by using the following equation:
FVC =   NDVI     NDVI soil NDVI veg     NDVI soil
where NDVIveg and NDVIsoil are regarded as NDVI values of pure vegetation and pure soil pixels, respectively. They were estimated based on the vegetation NDVI values with accumulating frequencies of 95% and 5%, respectively. Calculated values of FVC range from 0 to 1.
We calculated the monthly FVC values of the QTP from 1998 to 2018 and selected the mean values of monthly FVC from May to September of each year as FVC values of the growing season, namely, FVCGS.

2.3.2. Trends Analyses

Spatial variation trends of the FVCGS time series were analyzed by applying Theil–Sen analysis. This is a non-parametric statistical approach and suitable for analyzing trends of long sequences [43,44]. The formula works as below:
β = Median   ( X j   X i j     i ) ,   1998     i   <   j     2018
where β is the median of the slope of the FVCGS dataset; Xj and Xi are the FVCGS in years j and i. If β > 0, the FVCGS displays an increasing trend; if β < 0, the sequence displays a decreasing trend.
The Mann–Kendall test, which is a non-parametric test not affected by data distribution and outliers [45], was adopted to evaluate the significance of the vegetation trend. The equation works as below:
Z = S   -   1 var ( S ) ,   S   >   0 0 ,   S = 0 S + 1 var ( S ) , S   <   0
S = i = 1 n - 1 j = i + 1 n sign   ( X j X i )
var ( S ) = n ( n     1 ) ( 2 n + 5 ) 18
sign   ( X j X i ) = 1 ,   X j X i   >   0 0 ,   X j X i = 0 1 ,   X j X i   <   0
where Xj and Xi are the FVCGS values of years j and i; n is the time span. Given an α significance level, when |Z| > u(1−α)/2, the FVCGS sequence varies significantly at α confidence level. For this study, a |Z| higher than 1.96 means a significant FVCGS variation trend at the 0.05 level, otherwise no significant change is observed.

2.3.3. Hurst Exponent Index

The consistency of the changing trends in sequences can be quantitatively evaluated with the Hurst exponent index (H), which has been applied in many scientific fields [46]. Rescaled range analysis is a common approach for estimating H [47]. The calculation steps were as below:
Given {FVCGS (t)} sequence (t = 1, 2, …, n), the average sequence of {FVCGS (t)} was given by:
FVC GS τ ¯ = 1 τ t = 1 τ FVC GS   ( τ ) ,   τ = 1 ,   2 ,   ,   n
The cumulative deviation was expressed as:
X ( t , τ ) = t = 1 t ( FVC GS ( t )   FVC GS ¯ ( τ ) ) ,   1     t   τ
The range sequence was created as:
R ( τ ) = max 1 t τ X ( t ,   τ )   min 1 t τ X ( t ,   τ ) ,   τ = 1 ,   2 ,   ,   n
The standard deviation series was generated as:
S ( τ ) = [ 1 τ t = 1 τ ( FVC GS ( t )   FVC GS ¯ ( τ ) ) 2 ] 1 2 ,   τ = 1 ,   2 ,   ,   n
The calculation formula of H was:
R ( τ ) S ( τ ) = ( c τ ) H
Wang et al. [46] considered that H has a range of value from 0 to 1, and the H value in different intervals means different changing trends of time series. In the case of H = 0.5, the FVCGS series should vary randomly, demonstrating that the change trend in the future is not associated with that of the past. In the case of H < 0.5, the FVCGS change trend is anti-consistent, and the lower the H value, the greater the degree of inconsistency. On the other hand, FVCGS change trends are consistent if H is in the range of 0.5–1, and the higher the H value, the greater the degree of consistency.

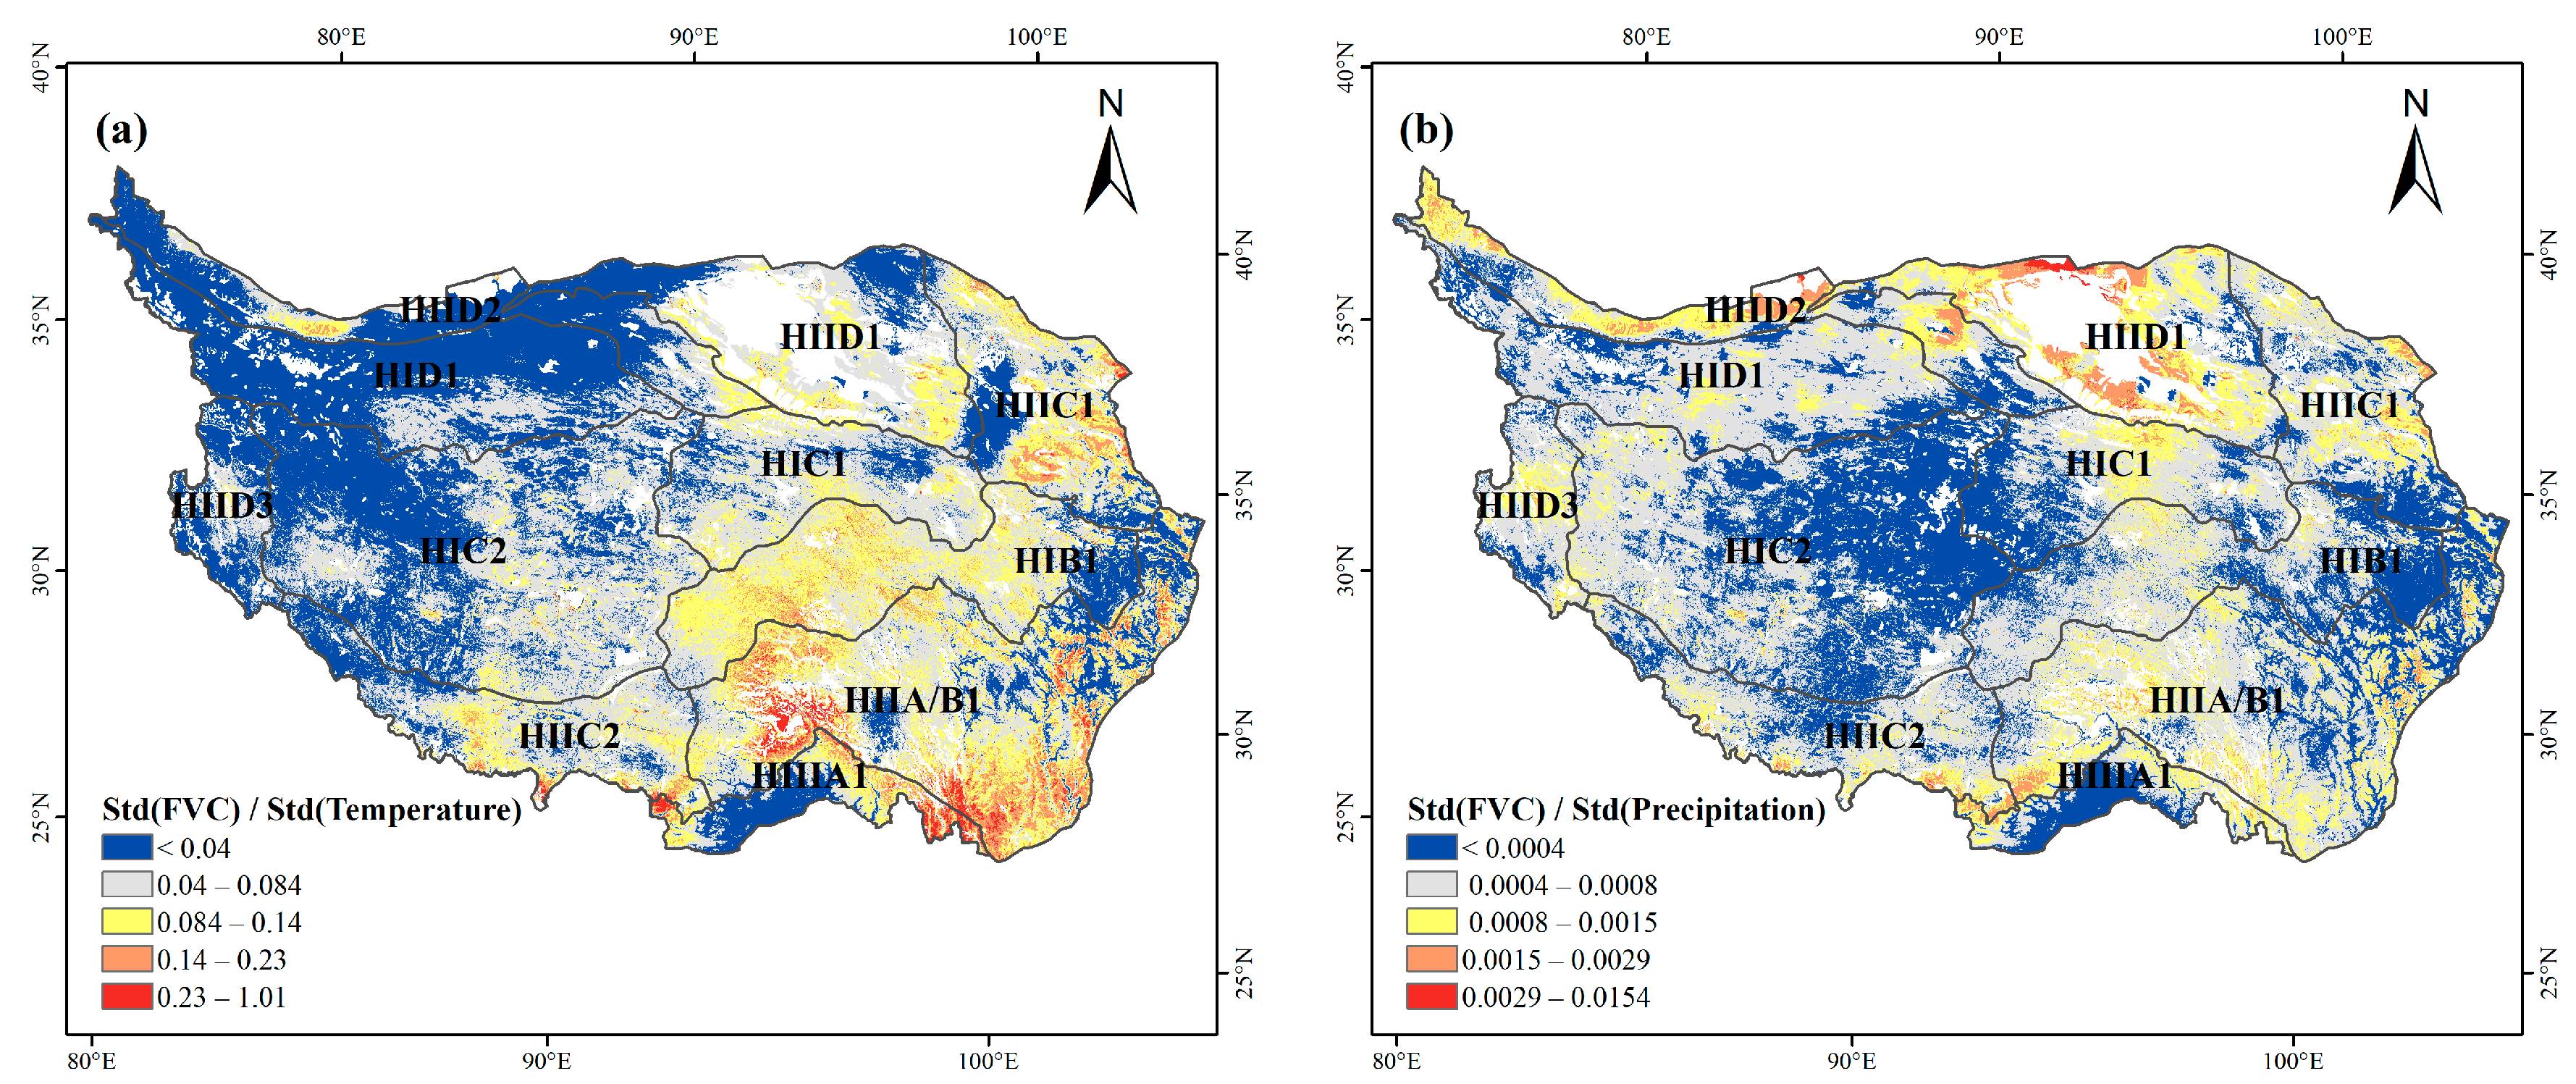
2.3.4. Multicollinearity Analysis and Sensitivity Analysis

The variance inflation factor (VIF) was used to measure the degree of collinearity among independent variables. The higher the VIF, the greater the collinearity. A VIF greater than 10 is generally considered to indicate the presence of severe collinearity.
The standard deviation ratio (StdR) of FVC to climate factors was used to evaluate the sensitivity of vegetation to climate factors. The StdR was calculated as below:
StdR = Std (FVC)/Std (Climate factor)
where Std (FVC) is the standard deviation of the FVC; Std (Climate factor) refers to the standard deviation of an individual climate factor (temperature or precipitation). A higher StdR value indicates a higher sensitivity of FVC to the climate factor.

2.3.5. Partial Correlation Analyses

Partial correlation analyses were applied in assessing correlations between climatic factors and FVC because they can effectively describe relationships between two variables while avoiding the interference of remaining variables [44]. The equation of partial correlation coefficient (PCC) works as below:
R xy z = R xy   R xz   ×   R yz ( 1     R xy 2 )   ×   ( 1     R yz 2 )
where Rxy•z is the PCC between variable x and variable y after excluding the influence of variable z. The PCC ranges from −1 to 1. The significance of the PCC was assessed through a t-test. Rxy refers to a simple correlation between variable x and variable y. The equation works as below:
R xy = i = 1 n [ ( x i   x ¯   ) ( y i   y ¯   ) ] i = 1 n ( x i   x ¯   ) 2 i = 1 n ( y i   y ¯   ) 2
where xi and yj are the pixel FVCGS of year i and year j;   x ¯ and   y ¯ refer to mean values during this studied period. Similarly, simple correlation between variables x and z (Rxz) and y and z (Ryz) can be obtained.

2.3.6. Time-Lag Effects Analyses

We calculated the PCC between FVCGS, temperature, and precipitation in the range of 0–3 months to analyze the lagged effects (lag1: 1-month lagged effect; lag2: 2-month lagged effect; lag3: 3-month lagged effect). The time scale of the maximum PCC was used to describe the lagged scale. Previous studies pointed out that vegetation dynamics during the growing season are clearly affected by the precipitation of other months [8,11]. Thus, we examined the time-lag effects of temperature and precipitation on vegetation throughout the whole study interval.

3. Results

3.1. FVCGS Validation

As shown in the density scatter plot (Figure 2), the fitting accuracy of the FVC calculated in this study and the validation dataset during 2000–2018 was high (R2 = 0.92), which indicates that the calculated FVC in this study is reliable. Moreover, the FVC of this study was calculated within the QTP, which should be relatively more accurate to reflect the vegetation in the study region.

3.2. Analyses of Vegetation Variation Trends

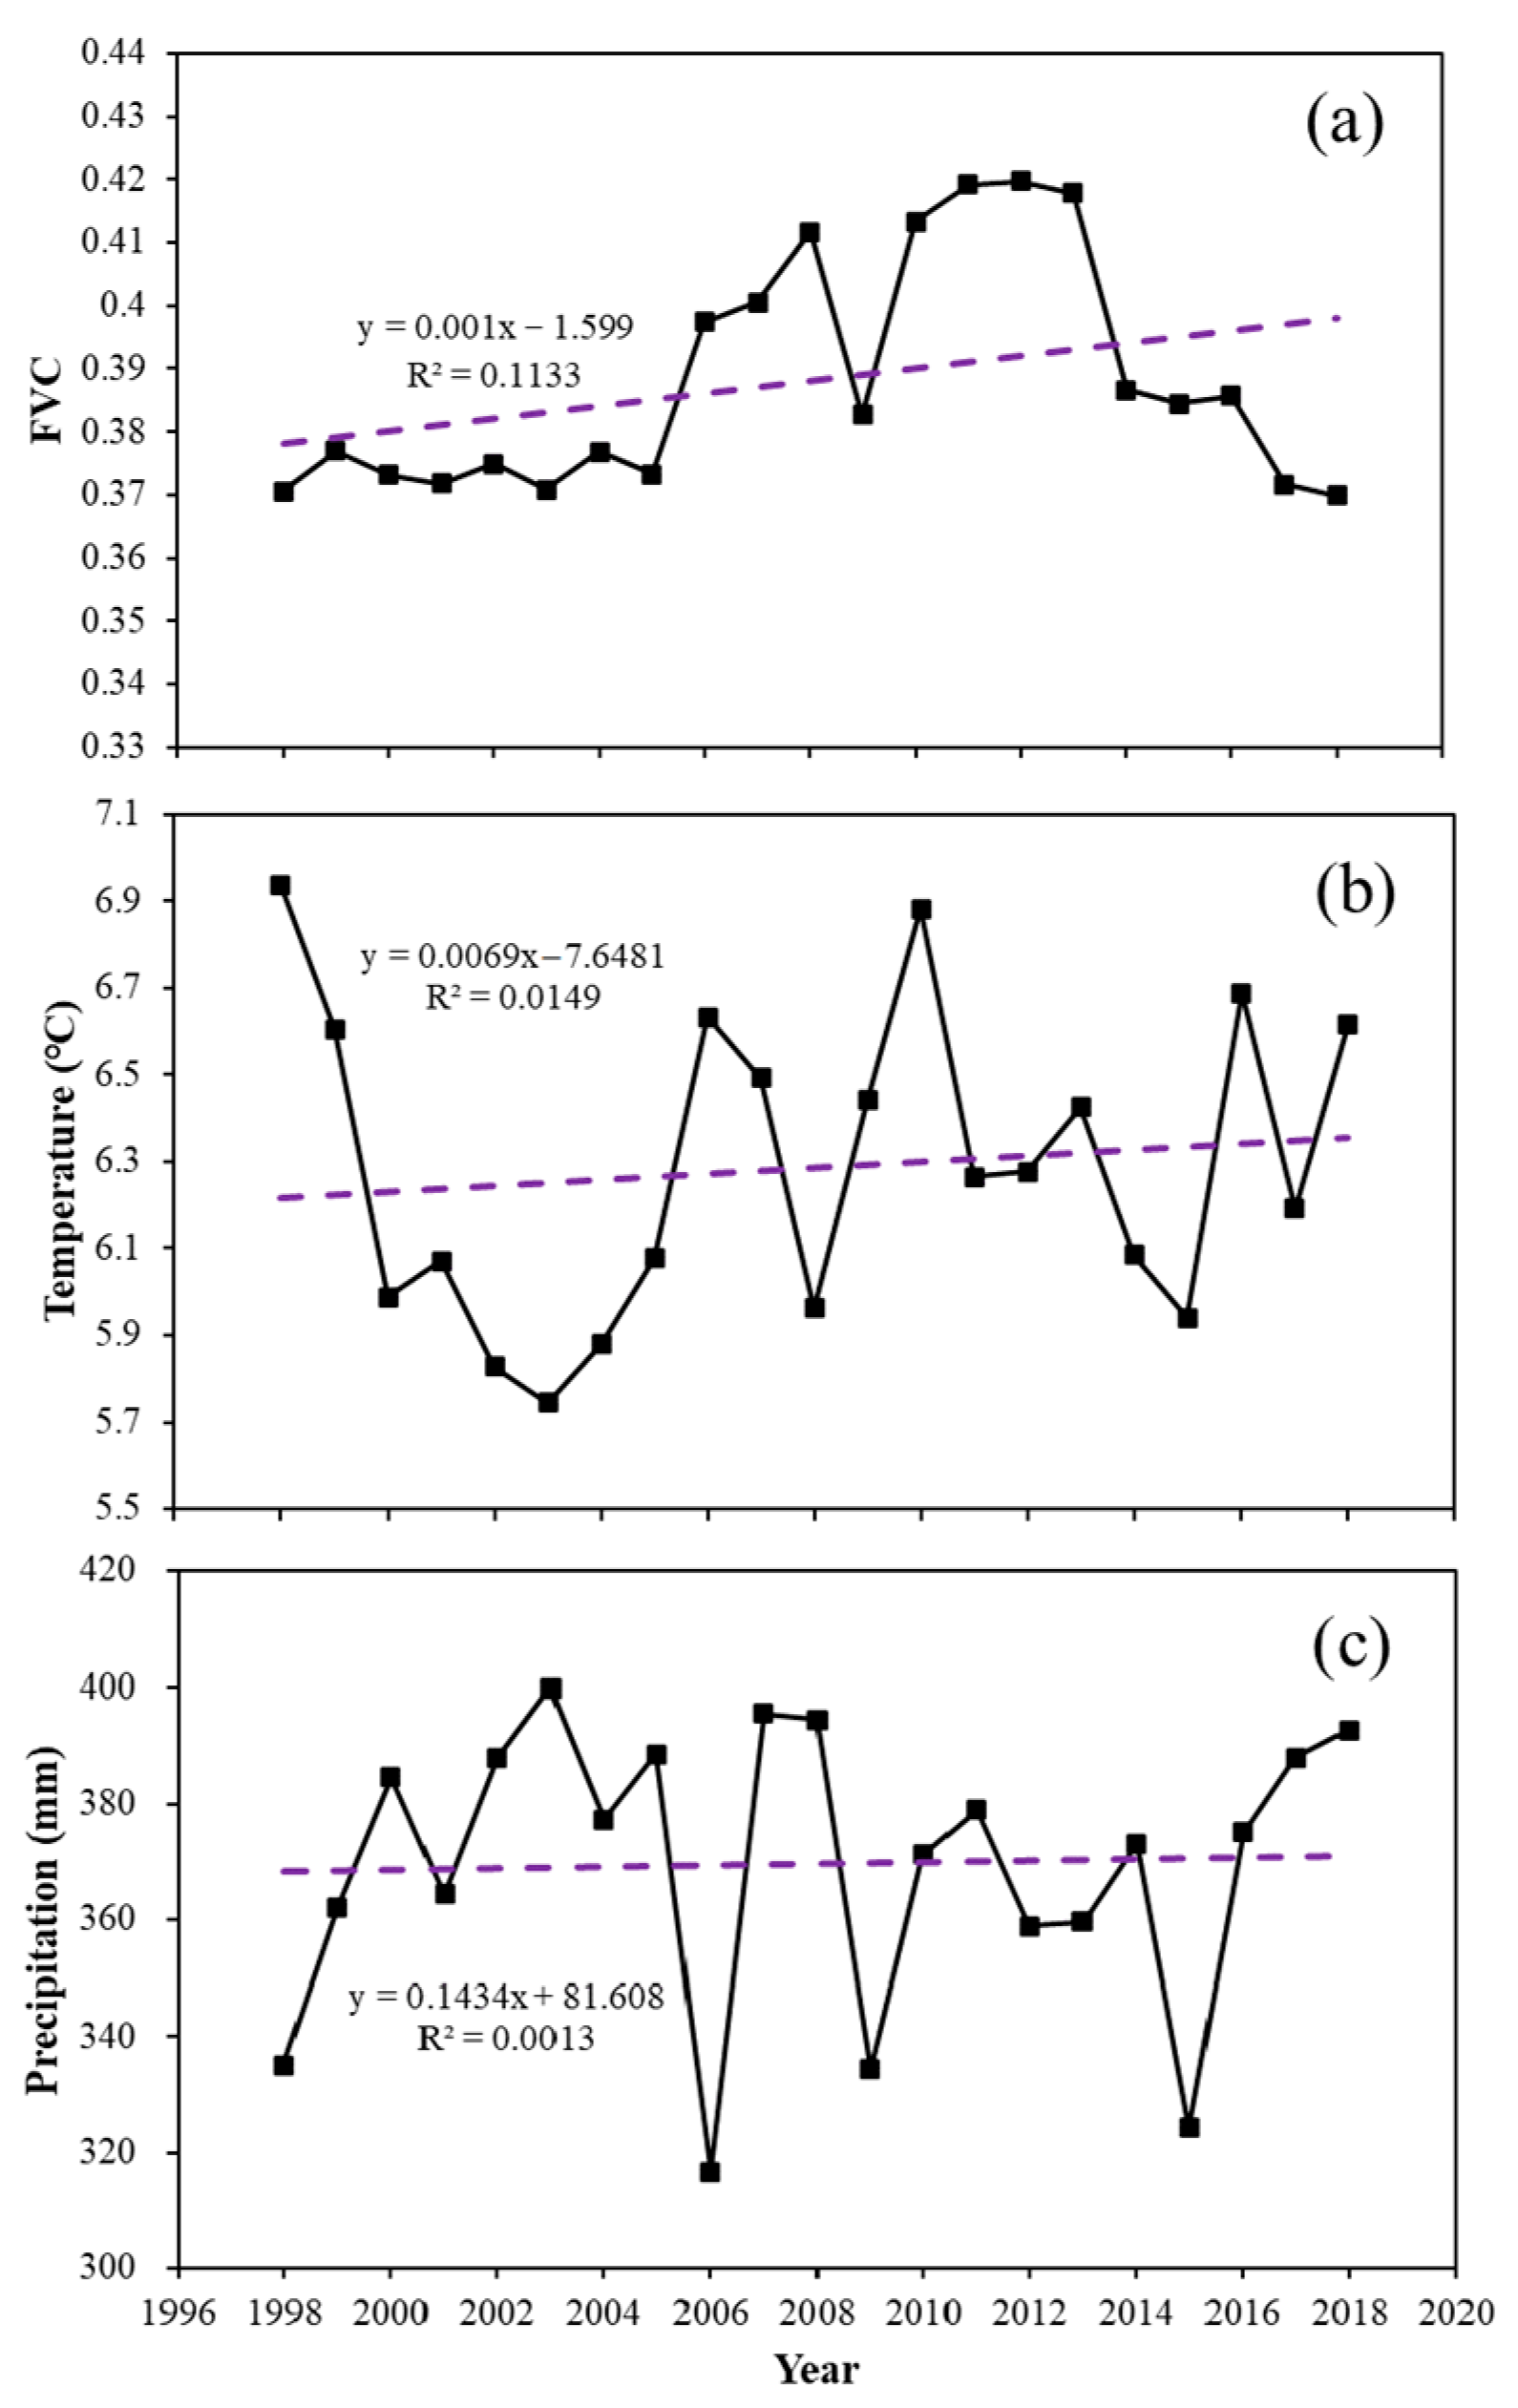
3.2.1. The Temporal Variations of FVCGS

The FVCGS time series reflected the temporal change characteristics of vegetation on the QTP. The annual FVCGS ranged from 0.36 to 0.42 and displayed an overall fluctuating rise of 0.01/10 a (0.01 per decade) (p < 0.01) during 1998–2018 (Figure 3a). Before 2005, the FVCGS values changed between 0.36 and 0.38, and the growth rate was relatively slow. After 2005, FVCGS increased rapidly and fluctuated greatly. During 2006–2013, the FVCGS values remained high, except in 2009, and reached a peak in 2012. A rapid decrease trend occurred until 2018.

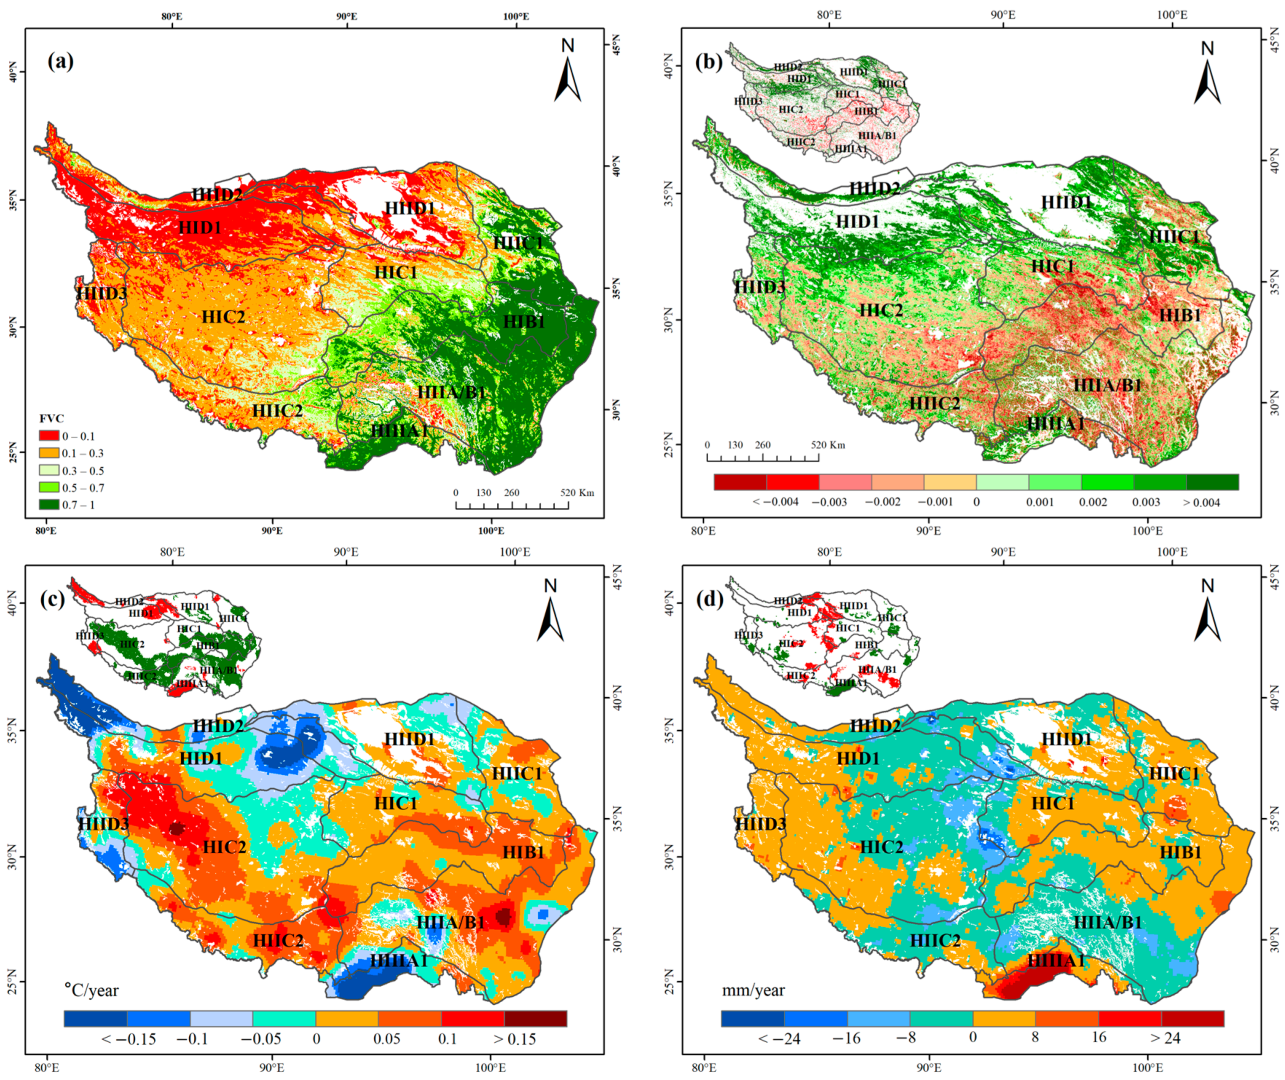
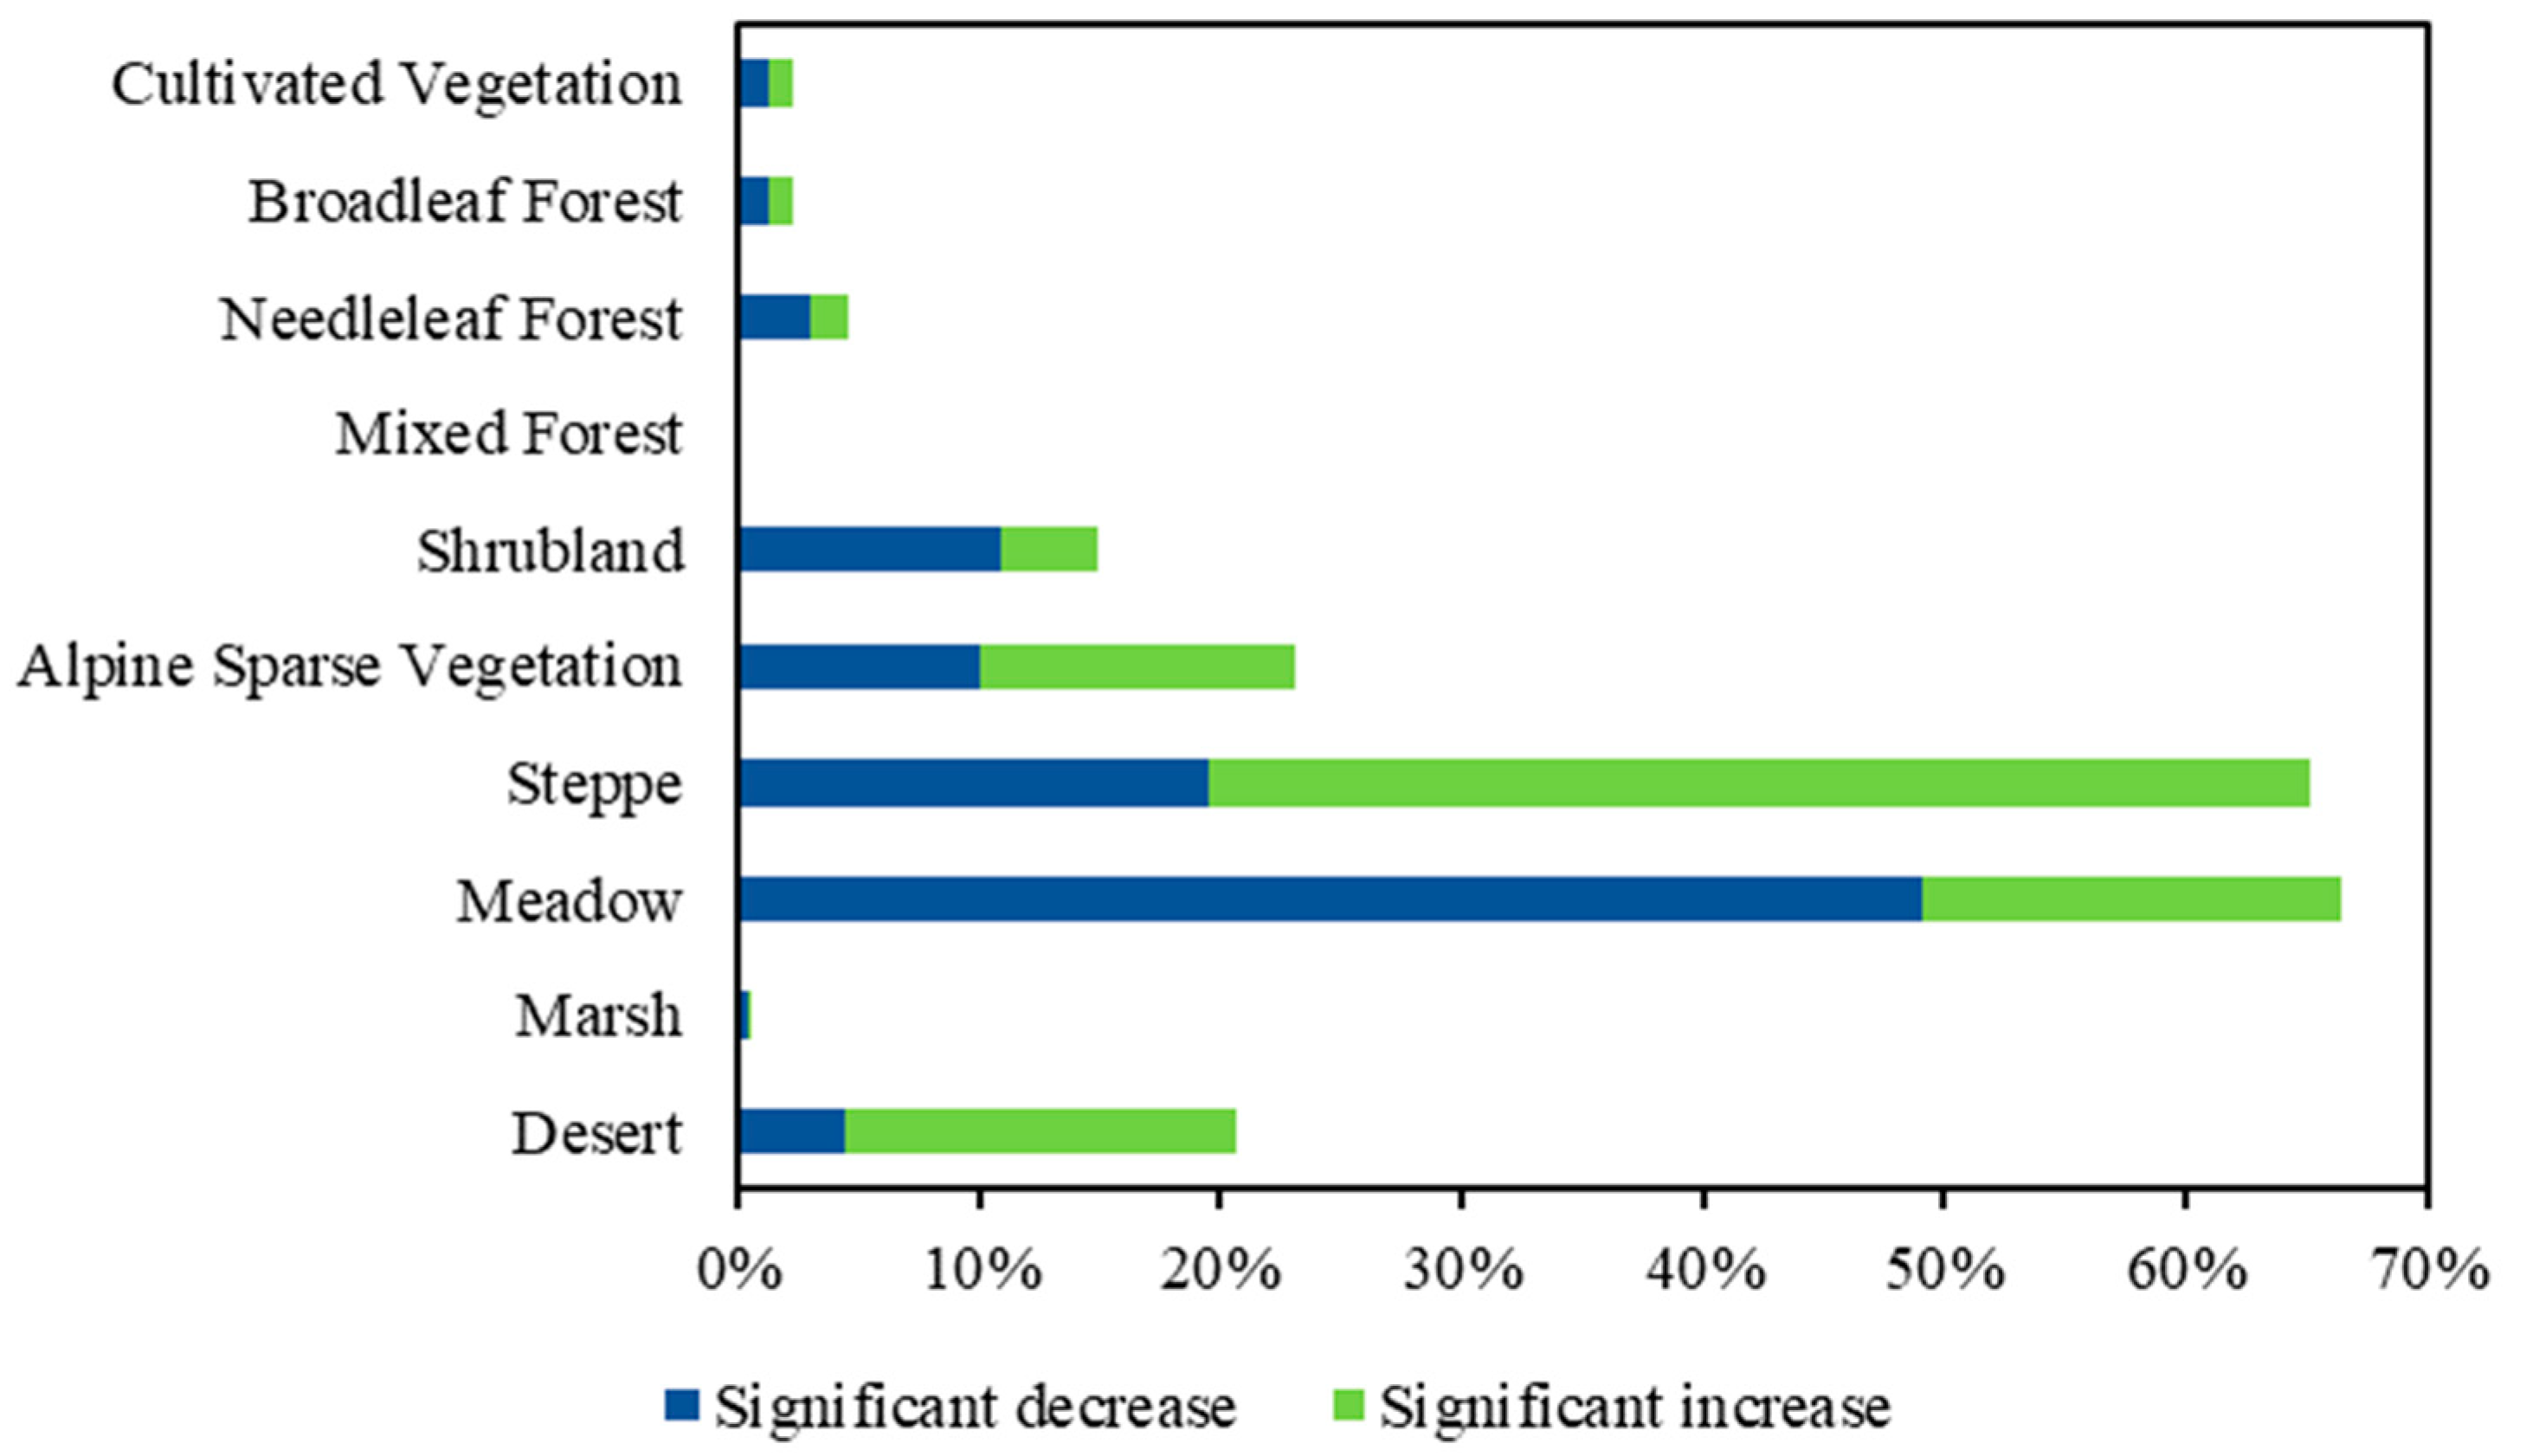
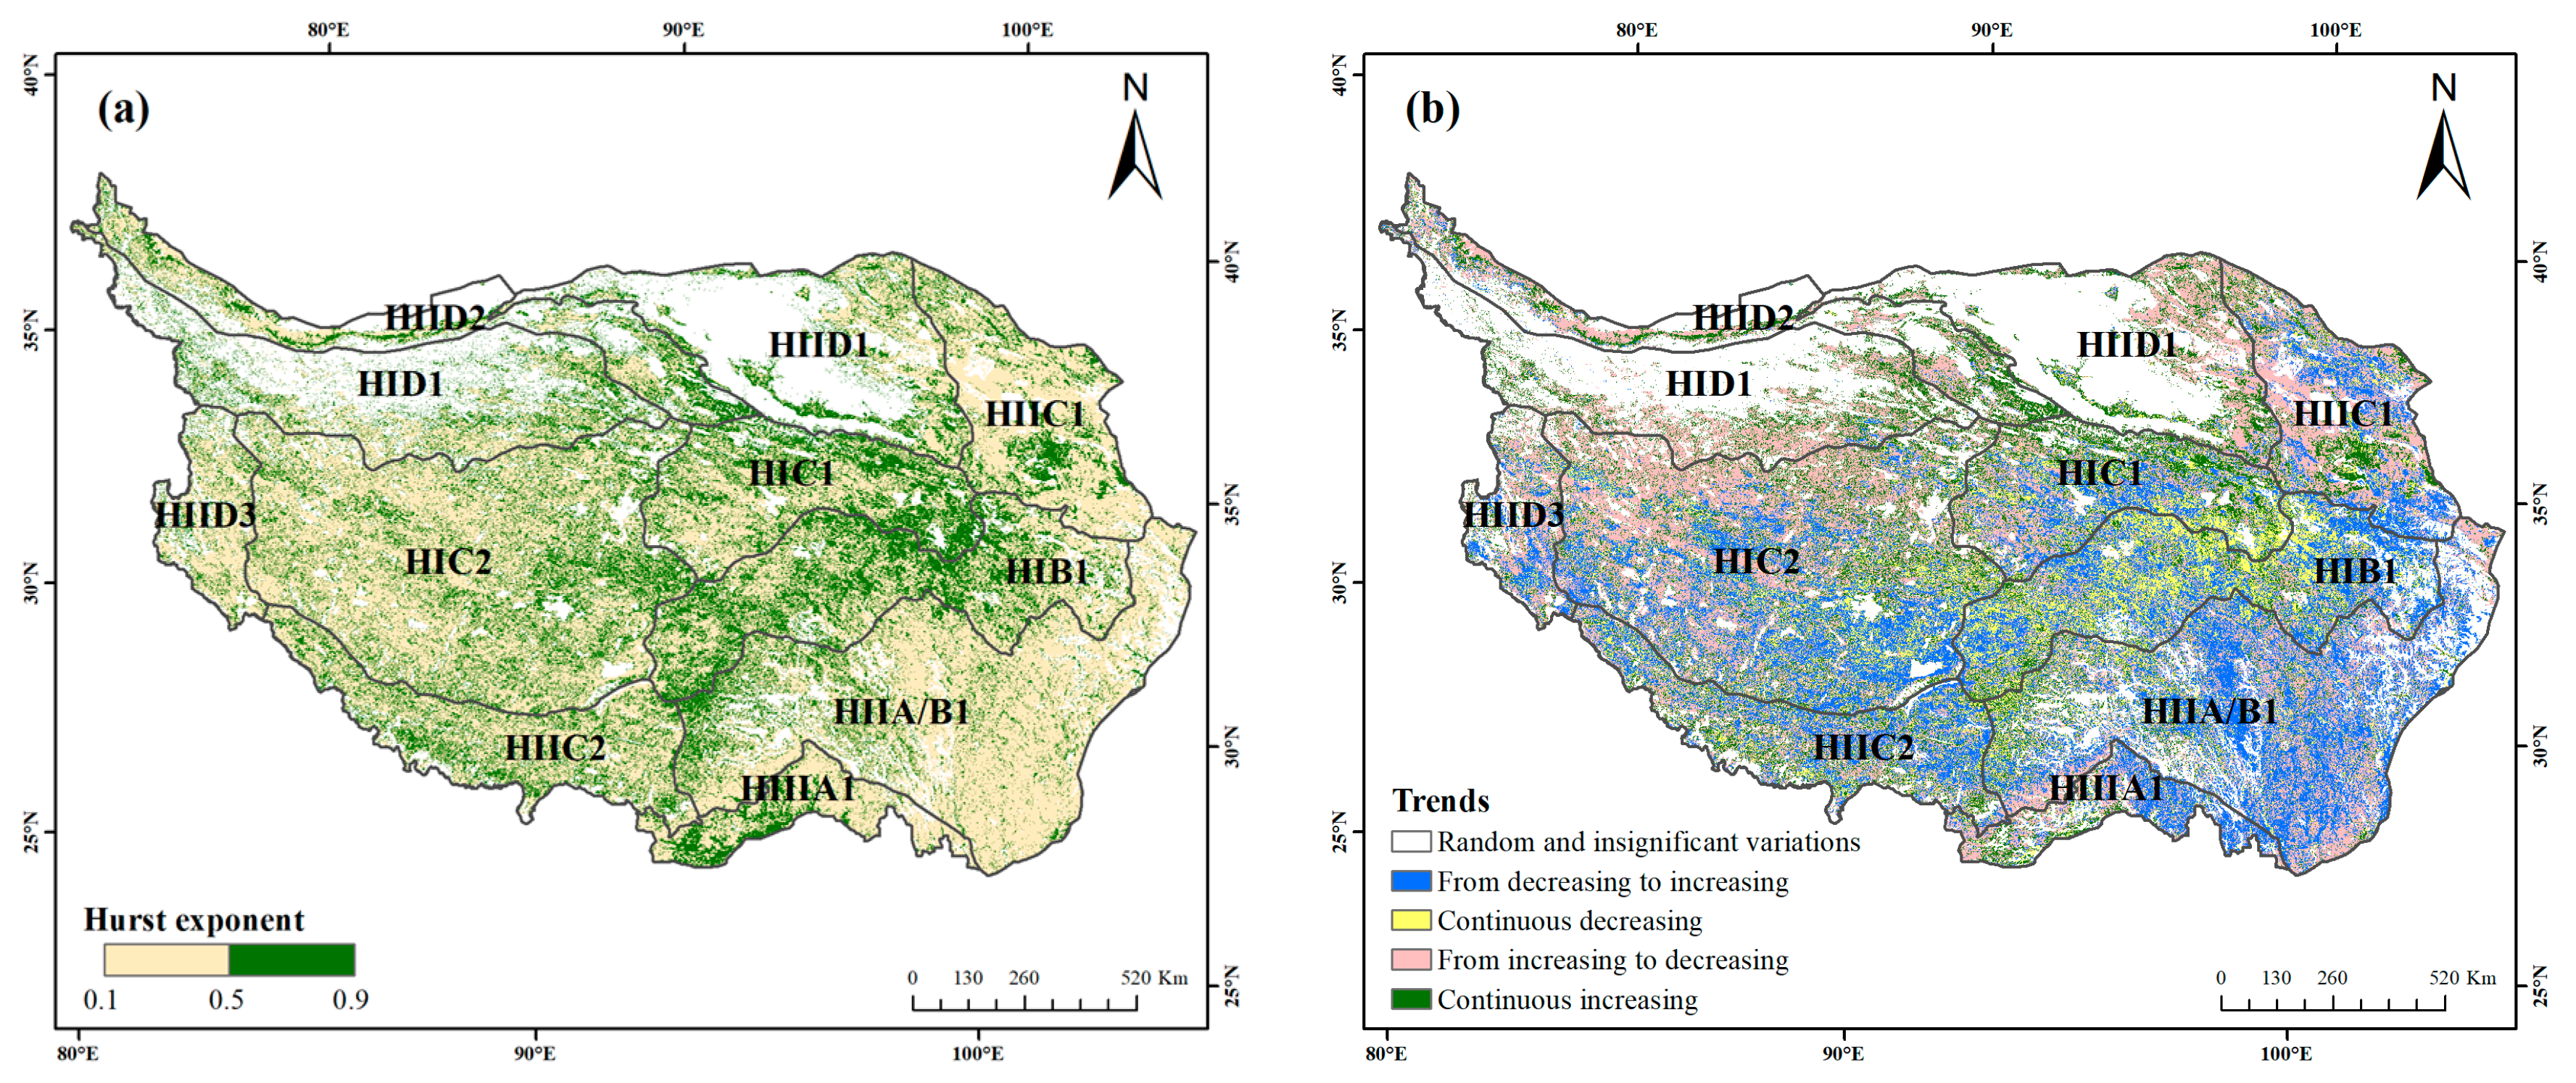
3.2.2. The Spatial Variations and Consistency of FVCGS Trends

The annual average FVCGS values were high in the southeastern QTP, and showed a decreased trend from the eastern to western areas (Figure 4a). High annual FVCGS values at the 0.7–1.0 level were mainly distributed in the northeastern to southeastern QTP (e.g., HIIC1, HIB1, HIIA/B1, and HIIIA1 ecogeographical regions). The values at the 0–0.3 level were mainly found in the steppe and desert regions in the western and northwestern QTP (e.g., HIC2, HID1, HIID1, HIID2, and HIID3).
Trend analyses indicated that the FVCGS change trends varied with various vegetation types and regions (Figure 4b and Table 2). Areas showing greening and browning tendency occupied 45% and 31% of the QTP, respectively. Significant (p < 0.05) greening areas (16% of the QTP) primarily spread in the northern QTP (e.g., HID1, HIIC1, HIID1, and HIID2). Significant browning areas (8% of the QTP) largely spread in the middle QTP, where meadow prevails (e.g., HIB1 and the southern HIC1). Some areas in the southeastern QTP (e.g., HIIA/B1) also exhibited significant browning trends.
In terms of vegetation types, steppe, desert, and alpine sparse vegetation mainly showed greening trends, with their significant greening areas accounting for 46%, 16%, and 13% of the total significant greening areas, respectively. Meadow, shrubland, and needleleaf forest showed browning trends, with their significant browning areas accounting for 49%, 11%, and 3% of the total significant browning areas, respectively (Figure 5).
Regions with H between 0.1 and 0.5 occupied 52% of the whole QTP, and were mostly located in the eastern and southwestern areas (e.g., HIIC1, HIIA/B1, and HIC2) (Figure 6). Regions with H between 0.5 and 0.9 accounted for 25%, and most of them were located in the middle and southern areas (e.g., HIC1 and HIB1). A trend analysis showed that FVCGS of the mid-northern parts (e.g., the southern HIID1) experienced a continuous increase, accounting for about 13% of the QTP. The continuous decrease mainly occurred in the middle areas (e.g., the eastern HIC1), accounting for 10% of the QTP. About 29% of the QTP experienced a shift from increasing to decreasing, mostly occurring in the northwestern and northeastern regions (the southern HID1, northeastern HIID1, and southern HIIC1). By contrast, 16% of the QTP, mainly in the southern areas, experienced a change from decreasing to increasing (the southern HIC2, HIIC2, and HIIA/B1). The future change trend of FVCGS on the QTP will show obvious spatial differentiation characteristics.

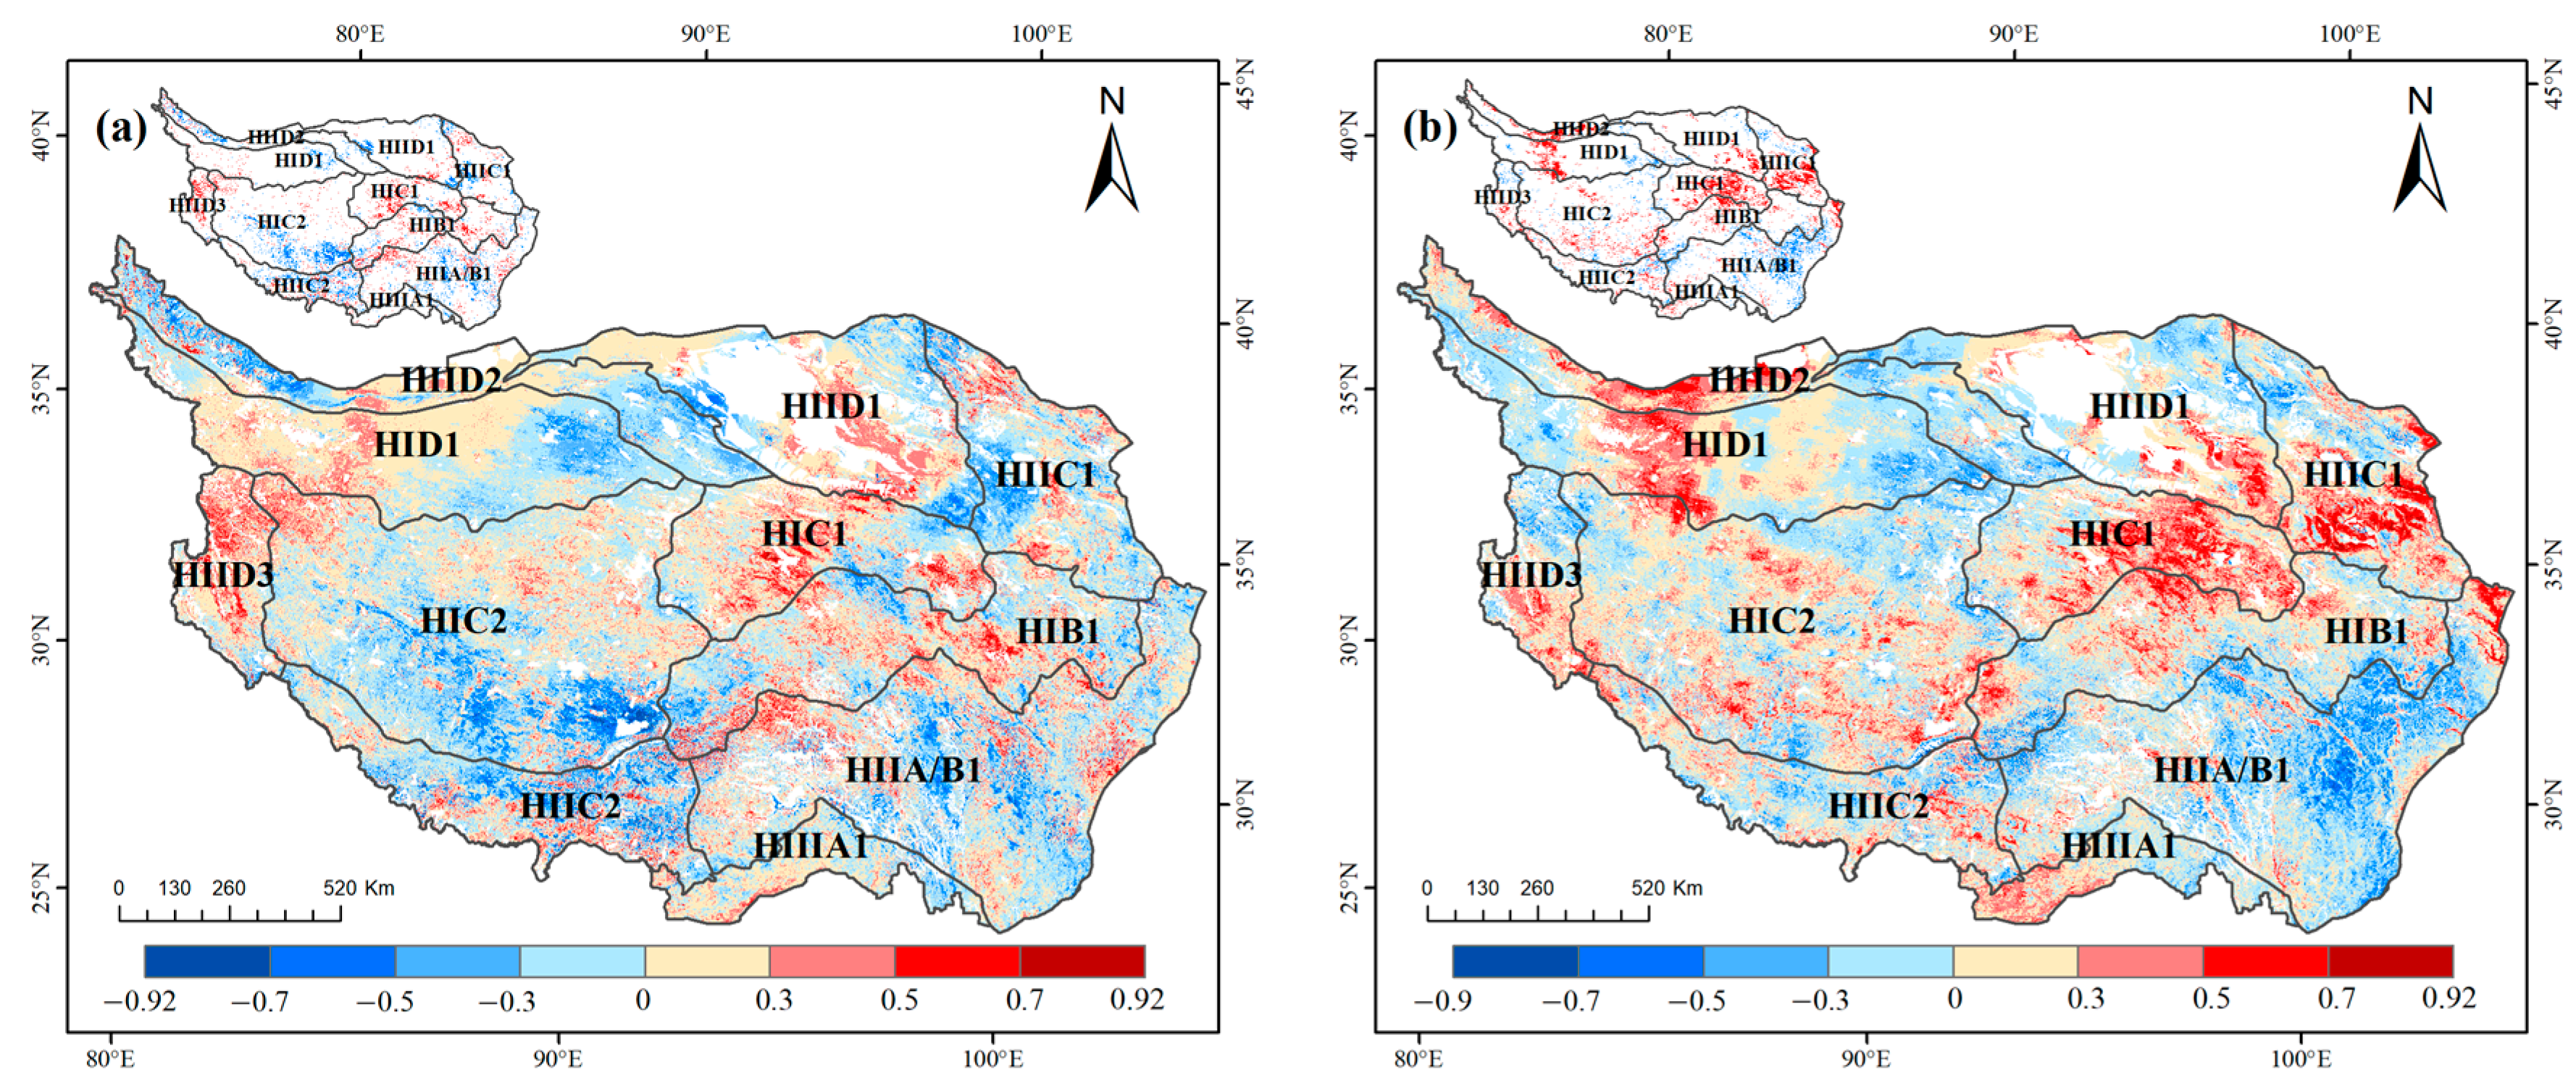
3.3. Correlation Analyses of FVCGS with Climatic Variables

Multicollinearity analysis yielded a VIF of 1.16 (<10) between temperature and precipitation, which indicated that there was no obvious collinearity between the two climate factors. Therefore, both factors were included in further analyses concerning the vegetation response to climate change.
Spatially, the correlation analyses between average FVC values and average temperature, and between average FVC and total precipitation of the growing season, varied greatly (Figure 7).
Approximately 46% of the plateau displayed positive correlations between FVCGS and temperature. Significant positive correlations (p < 0.05) were found in the northwestern and mid-eastern areas (e.g., HIID3, HIC1, and HIB1), accounting for 4% of the QTP. On the other hand, areas with negative coefficients accounted for 42% of the QTP. About 5% of the plateau had significant negative correlations (p < 0.05), which were primarily distributed in the southwestern areas (e.g., the southern HIC2 and HIIC2). Proportions of positive and negative relationships of FVCGS and precipitation occupied 49% and 40% of the QTP, respectively. Precipitation had significant positive impacts on FVCGS in about 6% of the QTP, mainly in the northeastern and western QTP (e.g., HIC1, HIIC1, HIC2, HID1, and HIID2). Significantly negative correlations (p < 0.05) between precipitation and FVCGS, occupying 3% of the QTP, were mainly found in the Hengduan Mountains (the eastern HIIA/B1). These results showed that FVGGS displayed significant positive correlations (p < 0.05) with precipitation more frequently than with temperature.

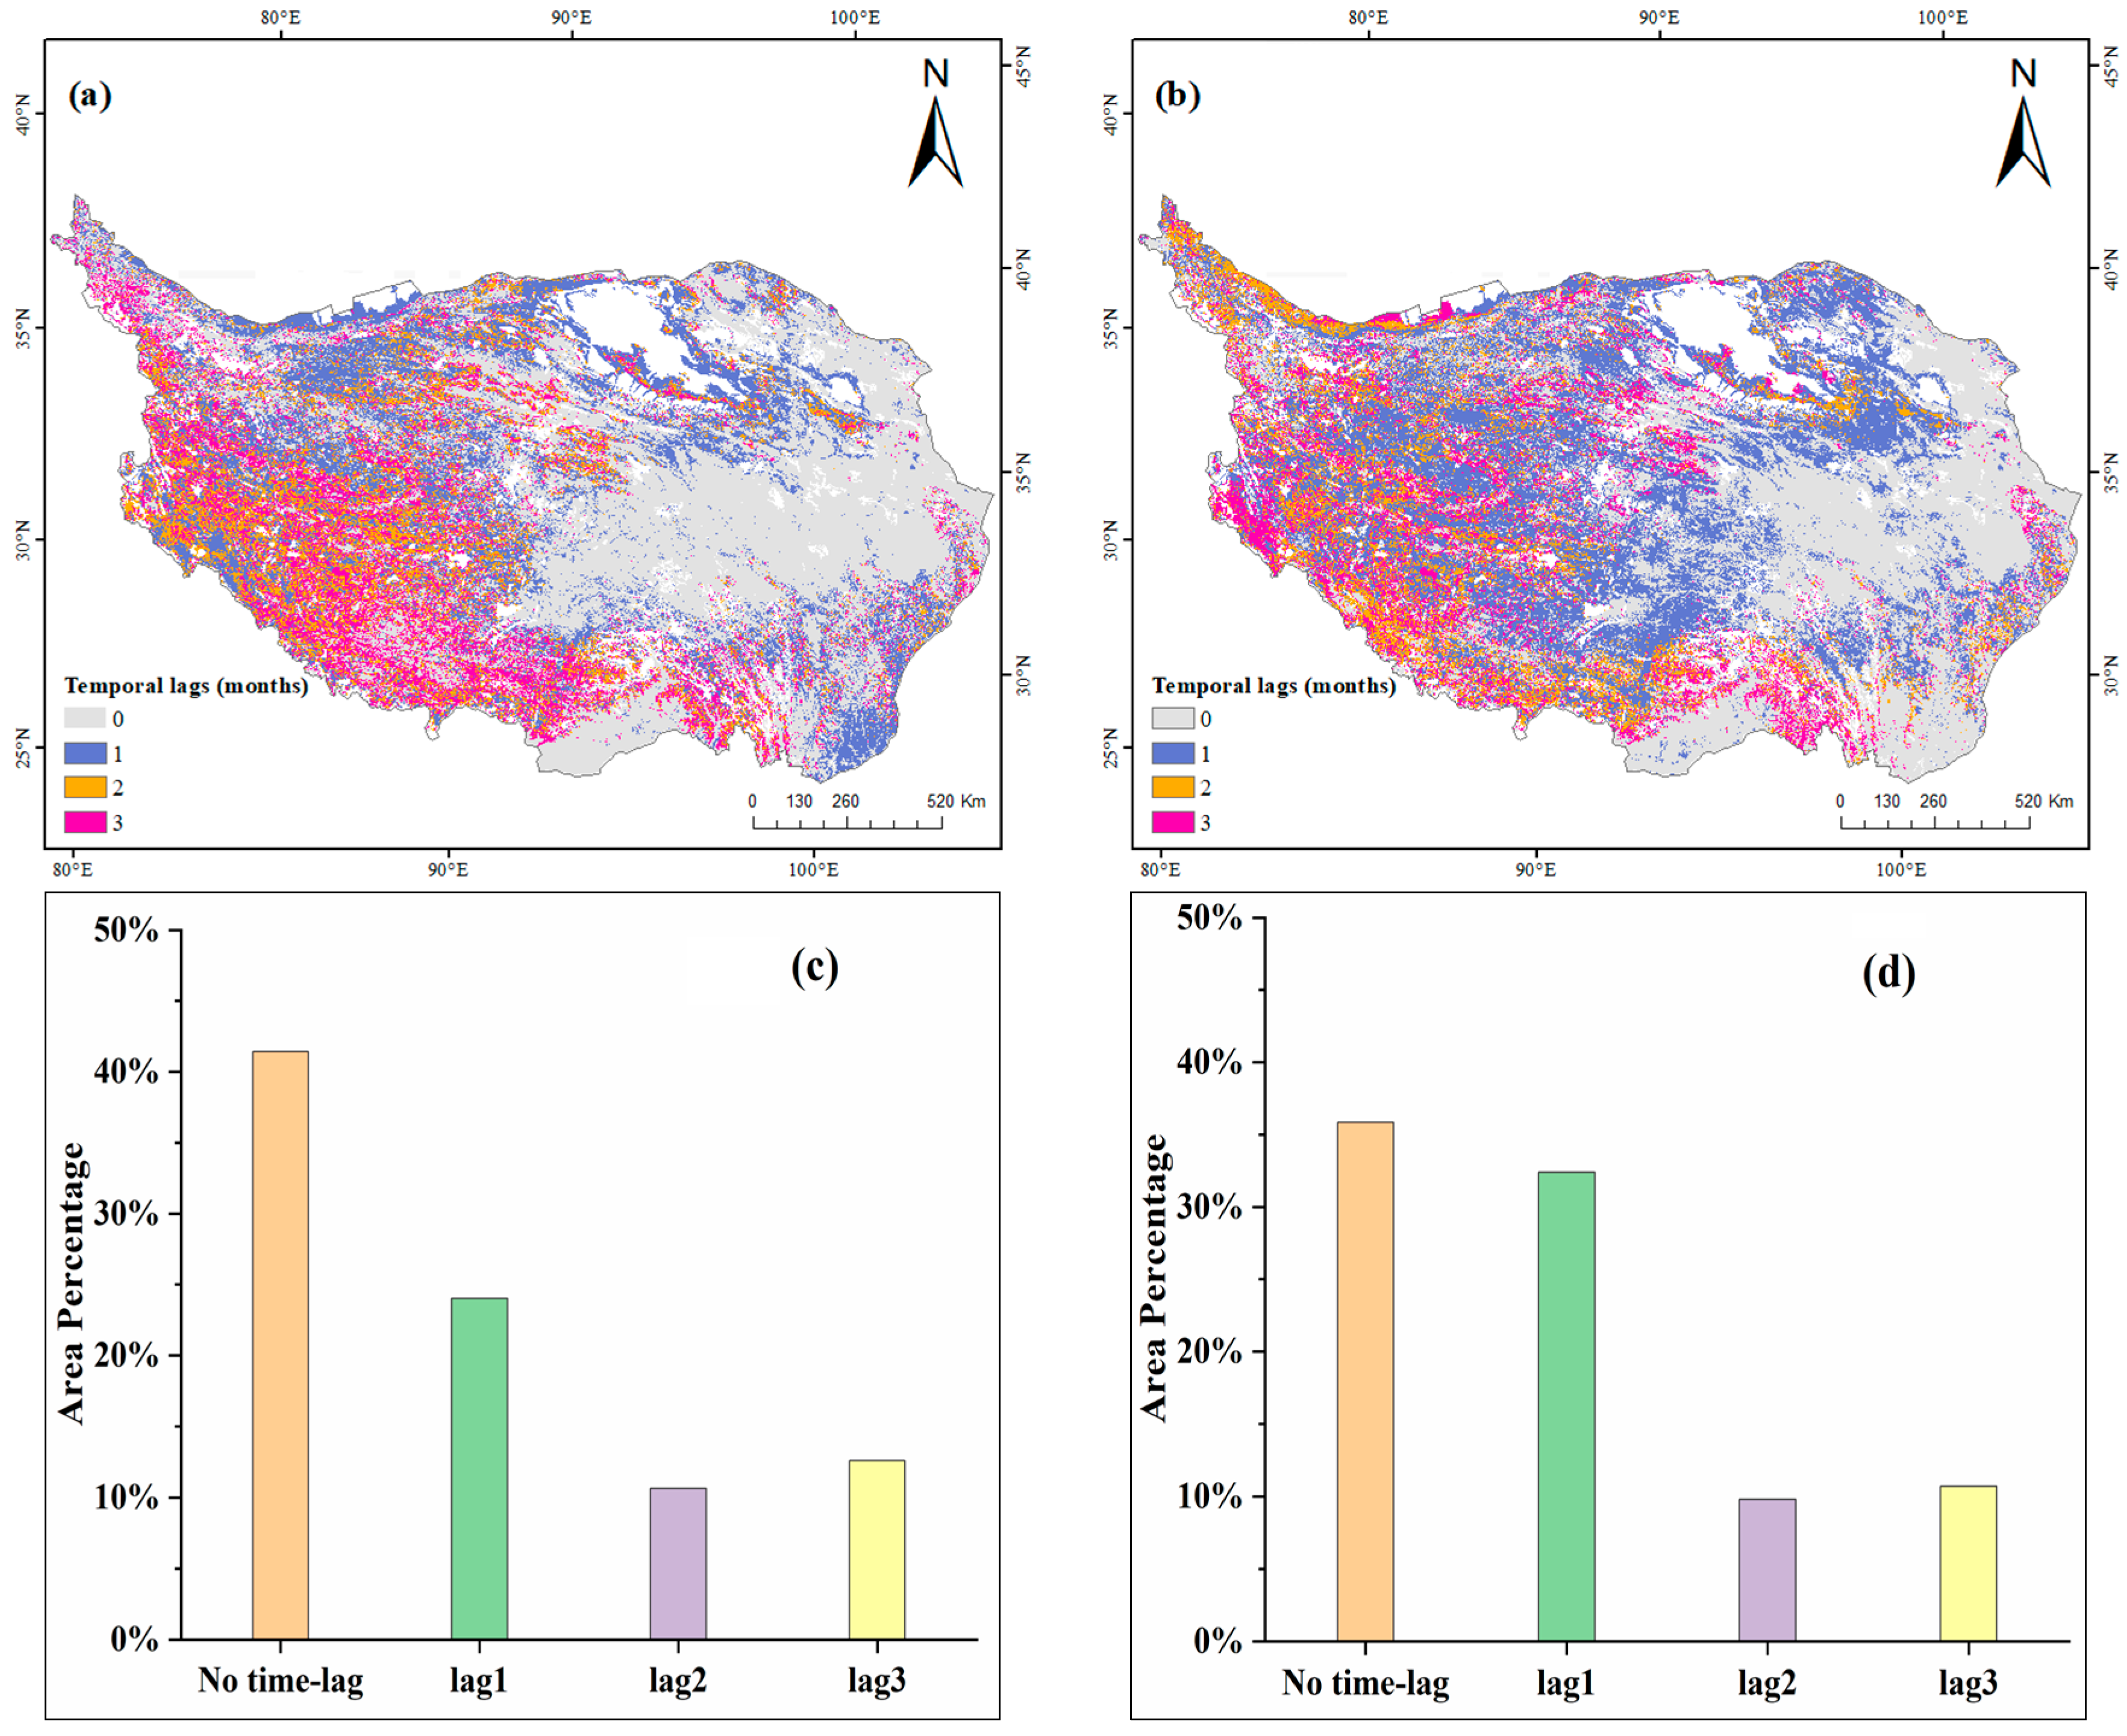
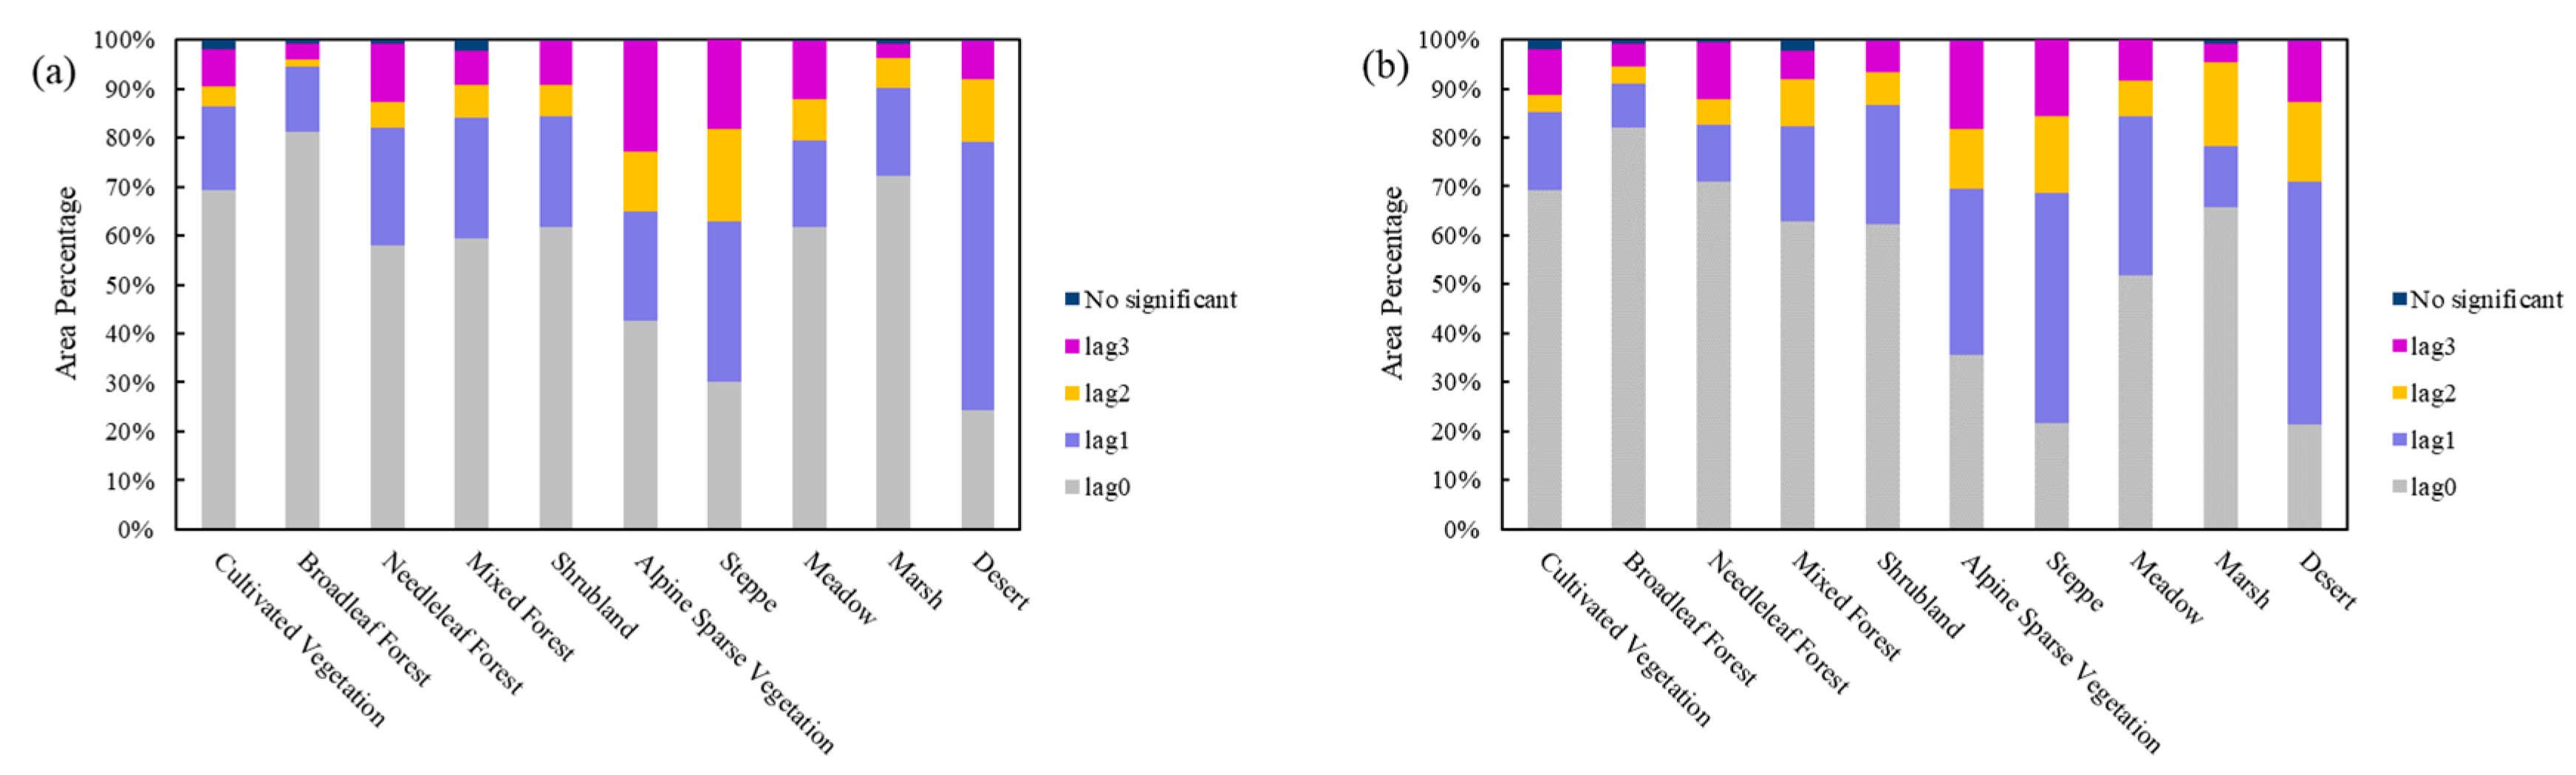
3.4. Lagged Responses of FVC to Climatic Variables

Correlation analyses between climatic variables and FVC within 0–3 months showed that various vegetation types exhibited distinct temporal reactions to the same climatic variable (Figure 8), and that the same vegetation also showed different temporal responses to different climatic variables (Figure 9).
Lagged effects of temperature on vegetation mostly happened in the western QTP and southeastern margins of the QTP. Pixels without temporal effects and with lag1 effects of temperature on vegetation accounted for 41% and 24% of the QTP, respectively. This proportion was much larger compared with lag2 and lag3 effects. Steppe primarily showed no temporal effects or lag1 effects, covering 30% and 33% of the steppe areas, respectively. The temporal effects of temperature on desert vegetation were dominated by lag1 effects, covering 55% of total desert areas. Other vegetation types were sensitive to the temperature of current months.
The lagged responses of vegetation to precipitation exhibited a spatial distribution pattern similar to that of temperature. The no temporal effects and lag1 effects of precipitation on vegetation were evident, accounting for 36% and 32% of the QTP, respectively. Alpine sparse vegetation showed no temporal effects or lag1 effects of precipitation, accounting for 35% and 34%, respectively. The lag1 effects of precipitation were obvious in steppe and desert vegetation, whereas other vegetation types had no obvious time-lag responses to precipitation.

4. Discussion

4.1. Temporal Variations and Driving Climatic Variables of FVCGS on the QTP

FVCGS generally showed a fluctuating upward trend during 1998–2018, with a rapid growth after 2005, but a shift from increasing to decreasing trend occurred around 2012 (Figure 3). The temperature and precipitation series showed overall upward trends, which were consistent with the vegetation change trend. However, their coupling effects may lead to complex responses of FVCGS dynamics.
Before 2005, vegetation growth on the QTP may have been affected by low temperature, leading to low FVCGS values and a flat growth trend. By contrast, the temperature rebound after 2005 may have promoted the rapid increase in FVCGS (Figure 3). Except for climatic changes, the rapid increase in FVCGS after 2005 may also be associated with changes in regional ecological policies, e.g., “grassland restoration”, “returning pasture to grass”, and “ecological migration” [48]. Since 2003, grazing bans and fencing enclosure have been implemented and promoted on the QTP, which has been conducive to restoring grassland ecology [49]. For example, fenced grazing was implemented across a large area of northern Tibet (e.g., the northern HIC2, the southern HID1 and HIID3) during 2004–2012 [50]. However, continuous increases in temperature may increase evapotranspiration and reduce soil moisture, which can negatively affect alpine vegetation growth [51,52]. This negative effect should have resulted in the obvious decrease in FVCGS after 2012 (Figure 3).
The decrease in precipitation on the QTP may lead to drought events, which can deepen the vegetation water stress problem [53]. In this study, particularly low precipitation in individual years was observed (e.g., 2006, 2009, and 2015), which was related to the El Niño events in 2006, 2009, and 2015 [54]. The QTP may face the risk of drought in El Niño years, so FVCGS showed relatively low values in 2009 and 2015. An exception was found in 2006, when low precipitation did not lead to low FVCGS. A possible explanation is that a larger meltwater supply from snow and glaciers induced by higher temperatures in this year may have attenuated the pressure of reduced precipitation. The sharp decline in precipitation in 2015 should have further restrained vegetation greening despite the rebound of precipitation thereafter. After 2015, anthropogenic activities (such as overgrazing) affected vegetation remarkably and may also have caused grassland degradation on the QTP [52]. Thus, the ameliorating climate conditions after 2015 (overall rising temperature and precipitation) did not lead to an improvement in vegetation.

4.2. Spatial Patterns and Driving Climatic Variables of FVCGS on the QTP

The FVCGS change on the QTP during 1998–2018 showed obvious spatial heterogeneity with a general trend of greening in the northern and browning in the southern QTP (Figure 4b). Wang et al. [51] proposed that vegetation had a general trend of browning in the southern areas and greening in the northern areas of the QTP during 2000–2015, which was consistent with the spatial change pattern in this study.
Specifically, most parts of the northeastern and northwestern QTP, which are dominated by steppe and desert, exhibited obvious greening, and the FVCGS values had significant positive correlations with precipitation (Figure 4b and Figure 7b). Meanwhile, high StdR values also indicated a high sensitivity of FVCGS to precipitation in these regions (Figure 10). These regions are arid or semiarid regions with low precipitation, and precipitation is the key factor controlling FVCGS dynamics [4]. During 1998–2018, precipitation in these regions increased significantly and contributed considerably to the vegetation greening. Precipitation is also a primary driving factor for the vegetation growth in other semiarid areas of China. During 1982–2018, Di et al. [55] found that precipitation positively enhanced the grassland growth in some areas of the northern China which are exposed to water stress. The low values and large variation range of FVCGS may also contribute to the increase in FVCGS in the northern QTP [44,56]. Vegetation in the northeastern QTP may be at risk of browning in the future (Figure 6b). Vegetation in the southern corner of the northeastern QTP (e.g., the northern HIB1 and northeastern HIC1) may face continuous degradation. Li et al. [4] hypothesized that the decreased precipitation of the northeastern QTP caused by the weakened Westerlies may deepen the vegetation degradation trend, and our results supported this view. Except for climatic influence, vegetation in this region may be influenced by anthropogenic disturbance, such as overgrazing [53]. However, vegetation showed a low sensitivity to temperature and precipitation in some regions of the northern QTP (e.g., the eastern HID1) and was negatively correlated with two climate factors. The greening of vegetation in these regions may have resulted from the effective implementation of management policies [49,50]. For instance, the number of livestock in Qinghai province has decreased remarkably and remained stable since the 1990s [11].
Vegetation in the middle and southwestern QTP (e.g., the western HIB1, southeastern HIC2, and northeastern HIIC2) showed significant browning. This browning trend had positive correlations with precipitation and negative correlations with temperature. During the study period, the southwestern QTP experienced a significant rise in temperature and a decline in precipitation (Figure 4c,d). A sensitivity analysis indicated that vegetation in this region was more sensitive to rising temperature (Figure 10). This finding indicated that the browning of vegetation in the region was due to water shortage. Rainfalls of the southwestern QTP are obviously subject to the changing intensity of the Indian monsoon [4]. According to Yao et al. [57], a weakened Indian monsoon during the period 1979–2010 resulted in less precipitation in the southwestern QTP and may have led to the observed vegetation browning in the region. Li et al. [33] noticed that vegetation of the southwestern QTP displayed a greening trend with the strengthening of the Indian monsoon during 2010–2018. This study showed a shift from browning to greening in most areas of the southwestern QTP during 1998–2018 (Figure 6b), indicating that the Indian monsoon may have strengthened.
In humid and subhumid regions on the southeastern QTP (e.g., HIB1 and HIIA/B1), temperature and precipitation both showed negative effects on vegetation growth in most cases, but precipitation had a more obvious negative influence on vegetation than those of temperature (Figure 7). However, the sensitivity of vegetation to temperature was much higher than that of precipitation, so the temperature change had a greater impact on vegetation growth (Figure 10). Consequently, significantly increased temperature during the study period in the southeastern QTP (Figure 4c,d) may cause drought problems and result in a decline in vegetation growth there. Yang et al. [58] proposed that the weakened East Asian monsoon may have resulted in a decline in precipitation in the southern and eastern QTP, exacerbating the water shortage in recent decades. According to the analysis of two drought indices, the southeastern corner on the QTP was revealed to have become drier than its vicinities during 2000–2015 [51]. Kuang and Jiao [34] demonstrated that the southeastern part of the QTP has turned warmer and drier over the past half century. Therefore, further attention should be paid to the characteristics and mechanisms of vegetation response to drought on the southeastern QTP, and local environmental and forestry departments should be concerned about the influence of extreme drought events. Moreover, high temperatures can increase the depth of frozen soil, causing the degradation of vegetation to varying degrees [59,60,61,62]. Yang et al. [63] pointed out that the increase in the permafrost active layer had negative impacts on meadow growth. These factors may be responsible for the browning of vegetation in the southeastern QTP. In addition, urbanization in the central and eastern parts of the QTP developed steadily from 2000 to 2018, and urban land expansion [49] should have negative impacts on vegetation greening.
With the impact of global warming and uneven precipitation, alpine vegetation all over the world may be faced with a similar water shortage situation as the QTP. It is necessary to identify the spatial differences in vegetation response to climate factors, and to determine the primary limiting factor of vegetation growth in alpine ecosystems. This knowledge should provide the basis for policymakers to adopt properly targeted conservation and management measures. In addition, alpine ecosystems are vulnerable to the impact of human activities, and require reasonable conservation and management.

4.3. The Time Response of Vegetation to Climatic Variables

The time scale of vegetation responses to climatic variables is usually below three on a monthly scale [64,65]. Vegetation growth on the QTP shows obvious responses to the temperature and precipitation conditions of the previous and current months. By contrast, the effects with a lag of 2–3 months are much weaker (Figure 8). Lagged effects of temperature and precipitation occur for various reasons. Vegetation has a certain level of resistance and resilience to climatic changes, and its stability will remain until climatic variables exceed the tolerance threshold [44,66]. The water in deep soil, which is crucial for vegetation growth, takes some time to accumulate and rise to the surface [32,67]. Mo et al. [68] proposed that the spatial pattern of vegetation dynamics is closely related to soil moisture storage in previous year in the Horqin Sands.
Vegetation types of the plateau showed different lagged responses to climatic variables. The time-lag effects of precipitation and temperature affected steppe, alpine sparse vegetation, and desert vegetation obviously (Figure 9). Vegetation in cold regions has relatively obvious time-lag responses to temperature [44]. Steppe in semiarid/arid areas has relatively well-developed root systems and needs more accumulated water (deep soil moisture) to achieve important changes [69,70]. Desert vegetation also needs to accumulate enough water to maintain growth due to low soil water content [71,72].

4.4. Limitations

This study focused primarily on the impact of temperature and precipitation on vegetation, and other driving factors (e.g., solar radiation, wind speed, soil characteristics) may also influence vegetation growth on the QTP. The spatial variations of vegetation on the southeastern QTP showed inconsistent patterns with temperature and precipitation, suggesting that other factors also affect vegetation growth. Some studies have reported that solar radiation is becoming increasingly important for vegetation growth on the southeastern QTP [73,74]. Nevertheless, the impacts of other factors (solar radiation, wind speed, and soil characteristics) fall out of the scope of this research, and their significance to vegetation dynamics of the QTP needs further assessment in the future.
In addition, time-lag effects were assessed on a monthly scale in this research, which was insufficient in detecting shorter time-lags. Future study may improve the understanding of the temporal effect on a daily scale by examining vegetation dynamics at a finer temporal resolution. It is also noteworthy that, for some areas with complex topography, the 1 km spatial resolution may lead to information loss and additional uncertainty. However, high spatial resolution may lead to information redundancy and increased difficulty in data processing. The spatial resolution of a study should be determined by considering this trade-off and the main aim of the study.

5. Conclusions

The spatiotemporal variations of the FVCGS on the QTP during 1998–2018 and their correlation and sensitivity with temperature and precipitation were analyzed in this study. This work represents the first attempt at using FVC to monitor the QTP vegetation dynamics and their responses to climate change. The findings provide further insights into understanding the trends of alpine vegetation changes of the QTP over long time scales, and into clarifying the regional differences in the effects of climate factors on vegetation dynamics.
The FVCGS values were low, and the growth trend was relatively flat due to low temperatures before 2005. The warmer climate after 2005 led to a rapid increase in FVCGS, which may also have been influenced by changes in ecological policy. After 2012, FVCGS decreased to levels similar to those before 2005, probably attributable to composite effects of multiple climatic factors.
Spatially, areas of the northwestern and northeastern QTP showed greening trends due to the positive effect of precipitation. Some areas in the southwestern QTP showed obvious browning trends, probably due to water shortages caused by the weakened Indian monsoon. The southeastern QTP, dominated by meadow, shrubland, and forest, showed browning trends that may be attributed to drought and permafrost degradation resulting from high temperatures.
A relatively high degree of inconsistency was revealed in the trends of future vegetation changes, probably due to continuous warming and changing atmospheric circulation patterns. Specifically, vegetation in the northeastern QTP may be at risk of browning, whereas most areas in the southwestern QTP are showing a shift from browning to greening.
The 0–1 month temporal impacts of temperature and precipitation had obvious influences on vegetation in most areas of the QTP. The responses of steppe and desert ecosystems to temperature and precipitation lagged by one month. Other vegetation types were more sensitive to the climatic conditions of current months.
These findings indicate that FVC is a good vegetation indicator in semiarid and arid regions, and is beneficial for evaluating the spatiotemporal dynamics of alpine ecosystems. Monitoring the FVC variation on the QTP can provide a reliable surveillance system for alpine ecosystem dynamics, while exploring the relationship between FVC and climate factors can form the basis for formulating sustainable vegetation conservation and management policies. In addition, the browning trend detected in the southeastern QTP implies the possibility of vegetation degradation with increasing drought risk induced by continuous global warming, which should attract the attention of policymakers, land managers, and conservationists.

Author Contributions

Conceptualization, H.H.; Funding acquisition, Y.Z. and F.Q.; Methodology, H.H.; Resources, H.H.; Supervision, F.Q.; Writing—original draft, H.H.; Writing—review and editing, Y.Z., Y.Y. and F.Q. All authors have read and agreed to the published version of the manuscript.

Funding

This research was supported by the National Natural Science Foundation of China (Grant No. 41888101), the National Key Research and Development Program of China (Grant No. 2022YFF0801501), and the National Natural Science Foundation of China (Grant Nos. 42071114 and 41977395).

Data Availability Statement

Not applicable.

Conflicts of Interest

The authors declare no conflict of interest.

References

  1. Kang, S.; Xu, Y.; You, Q.; Flügel, W.-A.; Pepin, N.; Yao, T. Review of climate and cryospheric change in the Tibetan Plateau. Environ. Res. Lett. 2010, 5, 015101. [Google Scholar] [CrossRef]
  2. Yao, T.; Thompson, L.G.; Mosbrugger, V.; Zhang, F.; Ma, Y.; Luo, T.; Xu, B.; Yang, X.; Joswiak, D.R.; Wang, W. Third pole environment (TPE). Environ. Dev. 2012, 3, 52–64. [Google Scholar] [CrossRef]
  3. You, Q.; Min, J.; Kang, S. Rapid warming in the Tibetan Plateau from observations and CMIP5 models in recent decades. Int. J. Climatol. 2016, 36, 2660–2670. [Google Scholar] [CrossRef]
  4. Li, P.L.; Hu, Z.M.; Liu, Y.W. Shift in the trend of browning in Southwestern Tibetan Plateau in the past two decades. Agric. For. Meteorol. 2020, 287, 107950. [Google Scholar] [CrossRef]
  5. Liu, J.; Lu, Y. How Well Do CMIP6 Models Simulate the Greening of the Tibetan Plateau? Remote Sens. 2022, 14, 4633. [Google Scholar] [CrossRef]
  6. Wu, J.; Li, M.; Zhang, X.; Fiedler, S.; Gao, Q.; Zhou, Y.; Cao, W.; Hassan, W.; Margarint, M.C.; Tarolli, P.; et al. Disentangling climatic and anthropogenic contributions to nonlinear dynamics of alpine grassland productivity on the Qinghai-Tibetan Plateau. J. Environ. Manag. 2021, 281, 111875. [Google Scholar] [CrossRef]
  7. Peng, Y.; Duan, A.; Hu, W.; Tang, B.; Li, X.; Yang, X. Observational constraint on the future projection of temperature in winter over the Tibetan Plateau in CMIP6 models. Environ. Res. Lett. 2022, 17, 034023. [Google Scholar] [CrossRef]
  8. Sun, C.; Xu, X.; Zhao, T.; Yao, T.; Zhang, D.; Wang, N.; Ma, Y.; Ma, W.; Chen, B.; Zhang, S.; et al. Distinct impacts of vapor transport from the tropical oceans on the regional glacier retreat over the Qinghai-Tibet Plateau. Sci. Total Environ. 2022, 823, 153545. [Google Scholar] [CrossRef] [PubMed]
  9. Ran, Y.; Cheng, G.; Dong, Y.; Hjort, J.; Lovecraft, A.L.; Kang, S.; Tan, M.; Li, X. Permafrost Degradation Increases Risk and Large Future Costs of Infrastructure on the Third Pole. Commun. Earth Environ. 2022, 3, 238. [Google Scholar] [CrossRef]
  10. Guo, B.; Zang, W.Q.; Yang, F.; Han, B.M.; Chen, S.T.; Liu, Y.; Yang, X.; He, T.L.; Chen, X.; Liu, C.T.; et al. Spatial and temporal change patterns of net primary productivity and its response to climate change in the Qinghai–Tibet Plateau of China from 2000 to 2015. J. Arid Land 2020, 12, 1–17. [Google Scholar] [CrossRef]
  11. Lehnert, L.W.; Wesche, K.; Trachte, K.; Reudenbach, C.; Bendix, J. Climate variability rather than overstocking causes recent large scale cover changes of Tibetan pastures. Sci. Rep. 2016, 6, 24367. [Google Scholar] [CrossRef]
  12. Gitelson, A.A.; Kaufman, Y.J.; Stark, R.; Rundquist, D. Novel algorithms for remote estimation of vegetation fraction. Remote Sens. Environ. 2002, 80, 76–87. [Google Scholar] [CrossRef]
  13. Geng, X.; Wang, X.; Fang, H.; Ye, J.; Han, L.; Gong, Y.; Cai, D. Vegetation coverage of desert ecosystems in the Qinghai-Tibet Plateau is underestimated. Ecol. Indic. 2022, 137, 108780. [Google Scholar] [CrossRef]
  14. Liu, H.; Li, X.J.; Mao, F.J.; Zhang, M.; Zhu, D.; He, S.B.; Huang, Z.H.; Du, H.Q. Spatiotemporal evolution of fractional vegetation cover and its response to climate change based on MODIS data in the subtropical region of China. Remote Sens. 2021, 13, 913. [Google Scholar] [CrossRef]
  15. Mao, P.; Zhang, J.; Li, M.; Liu, Y.; Wang, X.; Yan, R.; Shen, B.; Zhang, X.; Shen, J.; Zhu, X.; et al. Spatial and temporal variations in fractional vegetation cover and its driving factors in the Hulun Lake region. Ecol. Indic. 2022, 135, 108490. [Google Scholar] [CrossRef]
  16. Lin, X.; Chen, J.; Lou, P.; Yi, S.; Qin, Y.; You, H.; Han, X. Improving the Estimation of Alpine Grassland Fractional Vegetation Cover Using Optimized Algorithms and Multi-Dimensional Features. Plant Methods 2021, 17, 96. [Google Scholar] [CrossRef]
  17. Fang, H.; Li, S.; Zhang, Y.; Wei, S.; Wang, Y. New insights of global vegetation structural properties through an analysis of canopy clumping index, fractional vegetation cover, and leaf area index. Sci. Remote Sens. 2021, 4, 100027. [Google Scholar] [CrossRef]
  18. Yan, K.; Gao, S.; Chi, H.; Qi, J.; Song, W.; Tong, Y.; Mu, X.; Yan, G. Evaluation of the Vegetation-Index-Based Dimidiate Pixel Model for Fractional Vegetation Cover Estimation. IEEE Trans. Geosci. Remote Sens. 2021, 60, 4400514. [Google Scholar] [CrossRef]
  19. Jia, K.; Liang, S.; Liu, S.; Li, Y.; Xiao, Z.; Yao, Y.; Jiang, B.; Zhao, X.; Wang, X.; Xu, S.; et al. Global Land Surface Fractional Vegetation Cover Estimation Using General Regression Neural Networks from MODIS Surface Reflectance. IEEE Trans. Geosci. Remote Sens. 2015, 53, 4787–4796. [Google Scholar] [CrossRef]
  20. Lehnert, L.W.; Meyer, H.; Wang, Y.; Miehe, G.; Thies, B.; Reudenbach, C.; Bendix, J. Retrieval of grassland plant coverage on the Tibetan Plateau based on a multi-scale, multi-sensor and multi-method approach. Remote Sens. Environ. 2015, 164, 197–207. [Google Scholar] [CrossRef]
  21. Fernández-Guisuraga, J.M.; Verrelst, J.; Calvo, L.; Suárez-Seoane, S. Hybrid inversion of radiative transfer models based on high spatial resolution satellite reflectance data improves fractional vegetation cover retrieval in heterogeneous ecological systems after fire. Remote Sens. Environ. 2021, 255, 112304. [Google Scholar] [CrossRef]
  22. Gutman, G.; Ignatov, A. The Derivation of the Green Vegetation Fraction from NOAA/AVHRR Data for Use in Numerical Weather Prediction Models. Int. J. Remote Sens. 1998, 8, 1533–1543. [Google Scholar] [CrossRef]
  23. Jiapaer, G.; Chen, X.; Bao, A. A comparison of methods for estimating fractional vegetation cover in arid regions. Agric. For. Meteorol. 2011, 151, 1698–1710. [Google Scholar] [CrossRef]
  24. Deng, Z.; Lu, Z.; Wang, G.; Wang, D.; Ding, Z.; Zhao, H.; Xu, H.; Shi, Y.; Cheng, Z.; Zhao, X. Extraction of Fractional Vegetation Cover in Arid Desert Area Based on Chinese GF-6 Satellite. Open Geosci. 2021, 13, 416–430. [Google Scholar] [CrossRef]
  25. Jiao, K.-W.; Gao, J.-B.; Liu, Z.-H.; Wu, S.-H.; Fletcher, T.L. Revealing climatic impacts on the temporal and spatial variation in vegetation activity across China: Sensitivity and contribution. Adv. Clim. Chang. Res. 2021, 12, 409–420. [Google Scholar] [CrossRef]
  26. Ganjurjav, H.; Gao, Q.Z.; Gornish, E.S.; Schwartz, M.W.; Liang, Y.; Cao, X.J.; Zhang, W.N.; Zhang, Y.; Li, W.H.; Wan, Y.F.; et al. Differential response of alpine steppe and alpine meadow to climate warming in the central Qinghai-Tibetan Plateau. Agric. For. Meteorol. 2016, 223, 233–240. [Google Scholar] [CrossRef]
  27. Huang, M.T.; Piao, S.L.; Ciais, P.; Penuelas, J.; Wang, X.H.; Keenan, T.F.; Peng, S.S.; Berry, J.A.; Wang, K.; Mao, J.F.; et al. Air temperature optima of vegetation productivity across global biomes. Nat. Ecol. Evol. 2019, 3, 772–779. [Google Scholar] [CrossRef]
  28. Li, H.; Li, Y.; Shen, W.; Li, Y.; Lin, J.; Lu, X.; Xu, X.; Jiang, J. Elevation-Dependent Vegetation Greening of the Yarlung Zangbo River Basin in the Southern Tibetan Plateau, 1999–2013. Remote Sens. 2015, 7, 16672–16687. [Google Scholar] [CrossRef]
  29. Liu, L.; Wang, Y.; Wang, Z.; Li, D.; Zhang, Y.; Qin, D.; Li, S. Elevation-dependent decline in vegetation greening rate driven by increasing dryness based on three satellite ndvi datasets on the Tibetan plateau. Ecol. Indic. 2019, 107, 105569. [Google Scholar] [CrossRef]
  30. Cong, N.; Shen, M.; Yang, W.; Yang, Z.; Zhang, G.; Piao, S. Varying responses of vegetation activity to climate changes on the Tibetan Plateau grassland. Int. J. Biometeorol. 2017, 61, 1433–1444. [Google Scholar] [CrossRef]
  31. Diao, C.; Liu, Y.; Zhao, L.; Zhuo, G.; Zhang, Y. Regional-scale vegetation-climate interactions on the Qinghai-Tibet Plateau. Ecol. Inform. 2021, 65, 101413. [Google Scholar] [CrossRef]
  32. Hua, T.; Wang, X. Temporal and Spatial Variations in the Climate Controls of Vegetation Dynamics on the Tibetan Plateau during 1982–2011. Adv. Atmos. Sci. 2018, 35, 1337–1346. [Google Scholar] [CrossRef]
  33. Li, C.; de Jong, R.; Schmid, B.; Wulf, H.; Schaepman, M.E. Changes in grassland cover and in its spatial heterogeneity indicate degradation on the Qinghai-Tibetan Plateau. Ecol. Indic. 2020, 119, 106641. [Google Scholar] [CrossRef]
  34. Kuang, X.; Jiao, J.J. Review on climate change on the Tibetan Plateau during the last half century. J. Geophys. Res. Atmos. 2016, 121, 3979–4007. [Google Scholar] [CrossRef]
  35. Yin, Y.; Wu, S.; Zhao, D.; Zheng, D.; Pan, T. Modeled effects of climate change on actual evapotranspiration in different eco-geographical regions in the Tibetan Plateau. J. Geogr. Sci. 2013, 23, 195–207. [Google Scholar] [CrossRef]
  36. Tucker, C.J. Red and photographic infrared linear combinations for monitoring vegetation. Remote Sens. Environ. 1979, 8, 127–150. [Google Scholar] [CrossRef]
  37. González-Naharro, R.; Quirós, E.; Fernández-Rodríguez, S.; Silva-Palacios, I.; Maya-Manzano, J.M.; Tormo-Molina, R.; Pecero-Casimiro, R.; Monroy-Colin, A.; Gonzalo-Garijo, Á. Relationship of NDVI and oak (Quercus) pollen including a predictive model in the SW Mediterranean region. Sci. Total Environ. 2019, 676, 407–419. [Google Scholar] [CrossRef]
  38. Kun, Y. China Meteorological Forcing Dataset (1979–2018); National Tibetan Plateau Data Center, Institute of Tibetan Plateau Research, Chinese Academy of Sciences: Beijing, China, 2018. [Google Scholar]
  39. Hou, X. 1:1 Million Vegetation Map of China; National Tibetan Plateau Data Center: Beijing, China, 2019. [Google Scholar]
  40. Gao, J.; Shi, Y.; Zhang, H.; Chen, X.; Zhang, W.; Shen, W.; Xiao, T.; Zhang, Y. China Regional 250m Fractional Vegetation Cover Data Set (2000–2022); National Tibetan Plateau/Third Pole Environment Data Center, Institute of Tibetan Plateau Research, Chinese Academy of Sciences: Beijing, China, 2022. [Google Scholar]
  41. Li, F.; Chen, W.; Zeng, Y.; Zhao, Q.; Wu, B. Improving estimates of grassland fractional vegetation cover based on a pixel dichotomy model: A case study in Inner Mongolia, China. Remote Sens. 2014, 6, 4705–4722. [Google Scholar] [CrossRef]
  42. Yang, G.J.; Pu, R.L.; Zhang, J.X.; Zhao, C.J.; Feng, H.K.; Wang, J.H. Remote sensing of seasonal variability of fractional vegetation cover and its object-based spatial pattern analysis over mountain areas. ISPRS J. Photogramm. 2013, 77, 79–93. [Google Scholar] [CrossRef]
  43. Liu, Y.; Li, L.; Chen, X.; Zhang, R.; Yang, J. Temporal-spatial variations and influencing factors of vegetation cover in Xinjiang from 1982 to 2013 based on GIMMS-NDVI3g. Glob. Planet. Chang. 2018, 169, 145–155. [Google Scholar] [CrossRef]
  44. Ma, Y.; Guan, Q.; Sun, Y.; Zhang, J.; Yang, L.; Yang, E.; Li, H.; Du, Q. Three-dimensional dynamic characteristics of vegetation and its response to climatic factors in the Qilian Mountains. Catena 2022, 208, 105694. [Google Scholar] [CrossRef]
  45. Ren, Z.; Tian, Z.; Wei, H.; Liu, Y.; Yu, Y. Spatiotemporal evolution and driving mechanisms of vegetation in the Yellow River Basin, China during 2000–2020. Ecol. Indic. 2022, 138, 108832. [Google Scholar] [CrossRef]
  46. Wang, B.; Xu, G.; Li, P.; Li, Z.; Zhang, Y.; Cheng, Y.; Jia, L.; Zhang, J. Vegetation dynamics and their relationships with climatic factors in the Qinling Mountains of China. Ecol. Indic. 2020, 108, 105719. [Google Scholar] [CrossRef]
  47. Peng, J.; Liu, Z.; Liu, Y.; Wu, J.; Han, Y. Trend analysis of vegetation dynamics in Qinghai–Tibet Plateau using Hurst Exponent. Ecol. Indic. 2012, 14, 28–39. [Google Scholar] [CrossRef]
  48. Guo, B.; Han, B.; Yang, F.; Chen, S.; Liu, Y.; Yang, W. Determining the contributions of climate change and human activities to the vegetation NPP dynamics in the Qinghai-Tibet Plateau, China, from 2000 to 2015. Environ. Monit. Assess. 2020, 192, 663. [Google Scholar] [CrossRef]
  49. Wang, Y.; Lv, W.; Xue, K.; Wang, S.; Zhang, L.; Hu, R.; Zeng, H.; Xu, X.; Li, Y.; Jiang, L.; et al. Grassland Changes and Adaptive Management on the Qinghai–Tibetan Plateau. Nat. Rev. Earth Environ. 2022, 3, 668–683. [Google Scholar] [CrossRef]
  50. Yu, C.; Zhang, X.; Zhang, J.; Li, S.; Song, C.; Fang, Y.; Wurst, S.; Wu, J. Grazing exclusion to recover degraded alpine pastures needs scientific assessments across the northern Tibetan Plateau. Sustainability 2016, 8, 1162. [Google Scholar] [CrossRef]
  51. Wang, Y.; Fu, B.; Liu, Y.; Li, Y.; Feng, X.; Wang, S. Response of vegetation to drought in the Tibetan Plateau: Elevation differentiation and the dominant factors. Agric. For. Meteorol. 2021, 306, 108468. [Google Scholar] [CrossRef]
  52. Zhang, C.; Tang, Q.; Chen, D. Recent Changes in the Moisture Source of Precipitation over the Tibetan Plateau. J. Clim. 2017, 30, 1807–1819. [Google Scholar] [CrossRef]
  53. Duan, H.; Xue, X.; Wang, T.; Kang, W.; Liao, J.; Liu, S. Spatial and Temporal Differences in Alpine Meadow, Alpine Steppe and All Vegetation of the Qinghai-Tibetan Plateau and Their Responses to Climate Change. Remote Sens. 2021, 13, 669. [Google Scholar] [CrossRef]
  54. Lei, Y.; Zhu, Y.; Wang, B.; Yao, T.; Yang, K.; Zhang, X.; Zhai, J.; Ma, N. Extreme Lake Level Changes on the Tibetan Plateau Associated with the 2015/2016 El Niño. Geophys. Res. Lett. 2019, 46, 5889–5898. [Google Scholar] [CrossRef]
  55. Di, K.; Hu, Z.; Wang, M.; Cao, R.; Liang, M.; Wu, G.; Chen, R.; Hao, G.; Zhao, Y. Recent greening of grasslands in northern China driven by increasing precipitation. J. Plant Ecol. 2021, 14, 843–853. [Google Scholar] [CrossRef]
  56. Zou, F.L.; Li, H.D.; Hu, Q.W. Responses of vegetation greening and land surface temperature variations to global warming on the Qinghai-Tibetan Plateau, 2001–2016. Ecol. Indic. 2020, 119, 106867. [Google Scholar] [CrossRef]
  57. Yao, T.; Thompson, L.; Yang, W.; Yu, W.; Gao, Y.; Guo, X.; Yang, X.; Duan, K.; Zhao, H.; Xu, B.; et al. Different glacier status with atmospheric circulations in Tibetan Plateau and surroundings. Nat. Clim. Chang. 2012, 2, 663–667. [Google Scholar] [CrossRef]
  58. Yang, K.; Wu, H.; Qin, J.; Lin, C.G.; Tang, W.J.; Chen, Y.Y. Recent climate changes over the Tibetan Plateau and their impacts on energy and water cycle: A review. Glob. Planet. Chang. 2014, 112, 79–91. [Google Scholar] [CrossRef]
  59. Wang, Z.R.; Yang, G.J.; Yi, S.H.; Wu, Z.; Guan, J.Y.; He, X.B.; Ye, B.S. Different response of vegetation to permafrost change in semi-arid and semi-humid regions in Qinghai–Tibetan Plateau. Environ. Earth Sci. 2012, 66, 985–991. [Google Scholar]
  60. Tang, Z.; Wang, X.; Deng, G.; Wang, X.; Jiang, Z.; Sang, G. Spatiotemporal variation of snowline altitude at the end of melting season across High Mountain Asia, using MODIS snow cover product. Adv. Space Res. 2020, 66, 2629–2645. [Google Scholar] [CrossRef]
  61. Tang, Z.; Deng, G.; Hu, G.; Zhang, H.; Pan, H.; Sang, G. Satellite observed spatiotemporal variability of snow cover and snow phenology over high mountain Asia from 2002 to 2021. J. Hydrol. 2022, 613, 128438. [Google Scholar] [CrossRef]
  62. Tang, Z.; Wang, J.; Li, H.; Liang, J.; Li, C.; Wang, X. Extraction and assessment of snowline altitude over the Tibetan plateau using MODIS fractional snow cover data (2001 to 2013). J. Appl. Remote Sens. 2014, 8, 084689. [Google Scholar] [CrossRef]
  63. Yang, M.; Nelson, F.E.; Shiklomanov, N.I.; Guo, D.; Wan, G. Permafrost degradation and its environmental effects on the Tibetan Plateau: A review of recent research. Earth Sci. Rev. 2010, 103, 31–44. [Google Scholar] [CrossRef]
  64. Piao, S.; Fang, J.; Zhou, L.; Guo, Q.; Henderson, M.; Ji, W.; Li, Y.; Tao, S. Interannual variations of monthly and seasonal normalized difference vegetation index (NDVI) in China from 1982 to 1999. J. Geophys. Res. 2003, 108, 4401. [Google Scholar] [CrossRef]
  65. Wen, Y.; Liu, X.; Xin, Q.; Wu, J.; Xu, X.; Pei, F.; Li, X.; Du, G.; Cai, Y.; Lin, K.; et al. Cumulative Effects of Climatic Factors on Terrestrial Vegetation Growth. J. Geophys. Res. Biogeosci. 2019, 124, 789–806. [Google Scholar] [CrossRef]
  66. Li, M.; Wu, J.; He, Y.; Wu, L.; Niu, B.; Song, M.; Zhang, X. Dimensionality of grassland stability shifts along with altitudes on the Tibetan Plateau. Agric. For. Meteorol. 2020, 291, 108080. [Google Scholar] [CrossRef]
  67. Vicente-Serrano, S.M.; Camarero, J.J.; Azorín-Molina, C. Diverse responses of forest growth to drought time-scales in the northern hemisphere. Glob. Ecol. Biogeogr. 2014, 23, 1019–1030. [Google Scholar] [CrossRef]
  68. Mo, K.; Cong, Z.; Lei, H. Optimal vegetation cover in the Horqin Sands, China. Ecohydrology 2016, 9, 700–711. [Google Scholar] [CrossRef]
  69. Lehmann, C.E.R.; Anderson, T.M.; Sankaran, M.; Higgins, S.I.; Archibald, S.; Hoffmann, W.A.; Hanan, N.P.; Williams, R.J.; Fensham, R.J.; Felfili, J.; et al. Savanna Vegetation-Fire-Climate Relationships Differ among Continents. Science 2014, 343, 548–552. [Google Scholar] [CrossRef] [PubMed]
  70. Lehmann, C.E.R.; Archibald, S.A.; Hoffmann, W.A.; Bond, W.J. Deciphering the Distribution of the Savanna Biome. New Phytol. 2011, 191, 197–209. [Google Scholar] [CrossRef]
  71. Kong, D.; Miao, C.; Borthwick, A.G.L.; Lei, X.; Li, H. Spatiotemporal variations in vegetation cover on the Loess Plateau, China, between 1982 and 2013: Possible causes and potential impacts. Environ. Sci. Pollut. Res. 2018, 25, 13633–13644. [Google Scholar] [CrossRef]
  72. Wang, X.-G.; Lü, X.-T.; Zhang, H.-Y.; Dijkstra, F.A.; Jiang, Y.-G.; Wang, X.-B.; Lu, J.-Y.; Wang, Z.-W.; Han, X.-G. Changes in soil C: N: P stoichiometry along an aridity gradient in drylands of northern China. Geoderma 2020, 361, 114087. [Google Scholar] [CrossRef]
  73. Li, L.; Zhang, Y.; Liu, L.; Wu, J.; Wang, Z.; Li, S.; Zhang, H.; Zu, J.; Ding, M.; Paudel, B. Spatiotemporal patterns of vegetation greenness change and associated climatic and anthropogenic drivers on the Tibetan Plateau during 2000–2015. Remote Sens. 2018, 10, 1525. [Google Scholar] [CrossRef]
  74. Wang, H.S.; Liu, D.S.; Lin, H.; Montenegro, A.; Zhu, X.L. NDVI and vegetation phenology dynamics under the influence of sunshine duration on the Tibetan plateau. Int. J. Climatol. 2015, 35, 687–698. [Google Scholar] [CrossRef]
Figure 2. Density scatter plot of the annual average FVCGS during 2000–2018 between the FVC dataset calculated in this study and the published FVC products [40].
Remotesensing 15 02662 g002
Figure 3. Interannual variations of the average values of (a) FVCGS, (b) average temperature, and (c) total precipitation during the growing season (May–September) from 1998 to 2018.
Remotesensing 15 02662 g003
Figure 4. Spatial patterns of (a) the annual average FVCGS, (b) trends in FVCGS, (c) trends in average temperature, and (d) trends in total precipitation of the growing season during 1998–2018. The inset maps show significant (p < 0.05) increase (green) and decrease (red) in FVCGS, temperature, and precipitation.
Remotesensing 15 02662 g004
Figure 5. Significant (p < 0.05) variation trends of different vegetation types in FVCGS during 1998–2018.
Remotesensing 15 02662 g005
Figure 6. Spatial patterns of (a) Hurst exponent and (b) trends in FVCGS changes in the future.
Remotesensing 15 02662 g006
Figure 7. Spatial patterns of correlation analyses of FVCGS with (a) temperature and (b) precipitation during 1998–2018. The inset maps show significant (p < 0.05) positive correlations (red) and negative correlations (blue), respectively.
Remotesensing 15 02662 g007
Figure 8. Spatial patterns of the temporal responses of FVCGS to (a) temperature and (b) precipitation, and the proportion of time-lag effects on different time scales for temperature (c) and precipitation (d), indicated by bars.
Remotesensing 15 02662 g008
Figure 9. Temporal effects of (a) temperature and (b) precipitation on different vegetation types.
Remotesensing 15 02662 g009
Figure 10. Sensitivity analysis of FVCGS with (a) temperature and (b) precipitation during 1998–2018.
Remotesensing 15 02662 g010
Table 1. Ecogeographical regions of the QTP following the definition of Yin et al. [35].
IDClimate ConditionEcogeographical Regions
HIB1Plateau sub-cold sub-humidGuoluo-Naqu Plateau mountain alpine shrub-meadow region
HIC1Plateau sub-cold semi-aridSouthern Qinghai Plateau and wide valley alpine meadow-steppe region
HIC2Plateau sub-cold semi-aridQiangtang Plateau lake basin alpine steppe region
HID1Plateau sub-cold aridKunlun high mountain and plateau alpine desert region
HIIA/B1Plateau temperate humid/sub-humidWestern Sichuan and Eastern Xizang high mountain and deep valley coniferous forest region
HIIC1Plateau temperate semi-aridQilian mountains of eastern Qinghai high mountain and basin coniferous forest and steppe region
HIIC2Plateau temperate semi-aridSouthern Xizang high mountain and valley shrub-steppe region
HIID1Plateau temperate aridQaidam Basin desert region
HIID2Plateau temperate aridNorth Kunlun mountain desert region
HIID3Plateau temperate aridNgari mountains desert region
HIIIA1Plateau subtropical humidSouthern East Himalayas seasonal rainforest and evergreen broad-leaved forest region
Table 2. Proportion of trends to the total QTP area (%) in FVCGS, average temperature, and total precipitation of the growing season during 1998–2018.
IncreaseSignificant Increase (p < 0.05)DecreaseSignificant Decrease (p < 0.05)
FVCGS4516318
Temperature5831319
Precipitation477429
Disclaimer/Publisher’s Note: The statements, opinions and data contained in all publications are solely those of the individual author(s) and contributor(s) and not of MDPI and/or the editor(s). MDPI and/or the editor(s) disclaim responsibility for any injury to people or property resulting from any ideas, methods, instructions or products referred to in the content.

