Article

Precipitation Microphysics of Locally-Originated Typhoons in the South China Sea Based on GPM Satellite Observations

Department of Atmosphere Science and Engineering, College of Meteorology and Oceanography, National University of Defense Technology, Changsha 410073, China
*
Authors to whom correspondence should be addressed.
Remote Sens. 2023, 15(10), 2657; https://doi.org/10.3390/rs15102657
Submission received: 7 April 2023 / Revised: 10 May 2023 / Accepted: 16 May 2023 / Published: 19 May 2023

Abstract

:
Locally-originated typhoons in the South China Sea (SCS) are characterized by long duration, complex track, and high probability of landfall, which tend to cause severe wind, rainstorm, and flood disasters in coastal regions. Therefore, it is of great significance to conduct research on typhoon precipitation microphysics in the SCS. Using GPM satellite observations, the precipitation microphysics of typhoons in the SCS are analyzed by combining case and statistical studies. The precipitation of Typhoon Ewiniar (2018) in the SCS is found to be highly asymmetric. In the eyewall, the updraft is strong, the coalescence process of particles is distinct, and the precipitation is mainly concentrated in large raindrops. In the outer rainbands, the “bright-band” of melting layer is distinct, the melting of ice particles and the evaporation of raindrops are distinct, and there exist a few large raindrops in the precipitation. Overall, the heavy precipitation of typhoons in the SCS is composed of higher concentration of smaller raindrops than that in the western Pacific (WP), leading to a more “oceanic deep convective” feature of typhoons in the SCS. While the heavy precipitation of typhoons in the SCS is both larger in drop size and number concentration than that in the North Indian Ocean (NIO), leading to more abundant rainwater of typhoons in the SCS. For the relatively weak precipitation (R < 10 mm h−1), the liquid water path (LWP) of typhoons in the SCS is higher than that of the NIO, while the ice water path (IWP) of the locally-originated typhoons in the SCS is lower than that of the WP. For the heavy precipitation (R ≥ 10 mm h−1), the LWP and IWP of typhoons in the SCS are significantly higher than those in the WP and NIO.

1. Introduction

The South China Sea (SCS) is a low-latitude marginal sea in South Asia, directly off the coast of mainland China and the Indochina Peninsula [1]. As one of the most important basins of typhoons in the world, the SCS is affected by two main types of typhoons. One is introduced from the western Pacific (WP) with a large proportion, and the other is locally originated in the SCS, accounting for a relatively small proportion. However, the locally-originated typhoons in the SCS are characterized by complex tracks, long duration, and the high probability of landfall, which bring torrential rain and flood disasters and cause severe loss of life and property to coastal areas every year. Therefore, the study of locally-originated typhoons in the SCS is of great significance.
The accurate description of the microphysical process of cloud and precipitation in the numerical model is the key to improving the forecast of typhoon precipitation [2]. Through observation, we can intuitively understand the cloud and precipitation microphysics and improve the microphysics parameterization schemes [3,4]. The observational study of typhoon precipitation microphysics has always been a hot topic. Based on ground observation methods such as the disdrometer and polarimetric radar, many scholars have analyzed and studied the raindrop size distribution characteristics [5,6,7,8,9,10] and polarization characteristics [11,12,13,14,15,16] of landfalling typhoons. There are relatively fewer studies on the microphysical characteristics of typhoon precipitation in the SCS. Zheng et al. [17] used the two-dimensional video disdrometer (2DVD) disdrometer and dual-polarization radar to study the SCS typhoon Kajiki (2019) and found that compared with the landfalling typhoons in eastern China, Kajiki (2019) has a larger mass-weighted diameter (Dm) and a lower mean number concentration (Nw). Feng et al. [18] also used the 2DVD disdrometer and dual-polarization radar to analyze the differences in microphysical characteristics before and after the landfall of Ewiniar (2018), and found that the warm rain process contributes more to the precipitation before landfall, while the ice process contributes more to the precipitation after landfall. However, these are only results from case studies. At present, there still lack statistical observational results for typhoons in the SCS, especially for the locally-originated typhoons. More importantly, ground disdrometer or radar observations are hardly capable of capturing the precipitation process of typhoons at sea.
Satellite is an effective means of observing typhoon precipitation in the SCS. On 28 February 2014, the GPM satellite equipped with the world’s first spaceborne dual-frequency precipitation radar (DPR) was launched into space, providing a new idea for maritime typhoon precipitation observation. Huang and Chen [19] first used GPM data to conduct a statistical study on typhoon precipitation in the WP. Their results showed that the average Dm value of convective precipitation at a height of 2 km is generally greater than that of stratiform precipitation, and Dm of both convective and stratiform precipitation increases with precipitation efficiency. Using satellite-ground joint observation from GPM satellite, ground-based disdrometer and radar, Wu et al. [20,21] analyzed the differences in the microphysical characteristics in different typhoon rainbands and precipitation types, and found that the raindrops in the typhoon eyewall are dominated by the coalescence process, and the raindrop coalescence, break-up and evaporation processes in the inner rainbands are close to balance, while the melting and evaporation processes are the main precipitation microphysical processes in the outer rainbands. Meanwhile, the raindrop coalescence process of typhoon convective precipitation is more significant, leading to a high proportion of large raindrops, while the raindrop break-up process of stratiform precipitation is more significant, resulting in a considerable proportion of small raindrops. Zhang et al. [22] used GPM data to analyze the landfalling typhoons in Northeast China in 2020, and compared with the typhoon precipitation in other regions, it is found that the Dm and Nw of typhoons in Northeast China are smaller than those in East China, the SCS, and Taiwan. Kumar et al. [23] used the GPM observation from 2014 to 2021 to study the precipitation characteristics of the eyewall, inner rainband, and outer rainband of typhoons in the North Indian Ocean (NIO). The study found that compared with the spiral rainbands, the precipitation in the typhoon eyewall is more intense and stratiform precipitation is mainly concentrated in the spiral rainbands. However, to the best of the authors’ knowledge, there is currently no GPM-based study on the precipitation microphysical characteristics of locally-originated typhoons in the SCS.
From the above literature, it is not difficult to find that the current research on typhoon precipitation is more concentrated in the WP, the NIO, and other sea areas, and there is relatively less research on typhoon precipitation in the SCS. Therefore, this paper mainly uses GPM observational data to conduct both case and statistical studies on the precipitation microphysical characteristics of locally-originated typhoons in the SCS. The results will not only contribute to the understanding of microphysical mechanisms in forming typhoon precipitation in the SCS, but also lay a theoretical basis for improving the quantitative rainfall estimation and forecast of typhoon precipitation in the SCS.

2. Data and Methods

2.1. Disdrometer Observations

This study used the raw data from the PARSIVEL disdrometer deployed in Hainan province, China, and selected the precipitation observation data of typhoon Ewiniar (2018) when it passed Hainan from 2000 UTC, 3 June to 2300 UTC, 8 June. The PARSIVEL disdrometer used in this paper is manufactured by OTT Hydromet in Germany. OTT PARSIVEL is a laser optical sensor used to directly measure the diameter (D, mm) and terminal velocity (V, m s−1) of falling particles. OTT PARSIVEL can measure hydrometeors with a size of approximately 0–25 mm, and subdivide them into 32 different classes. For liquid precipitation, the diameter of a hydrometeor can be approximately interpreted as the diameter of a spherical raindrop with an equivalent volume. Likewise, OTT PARSIVE subdivides the speed into 32 non-equidistant classes, and the detection range is 0–22.4 m s−1. As a result, OTT PARSIVEL stores particles in 32 × 32 matrices with a time resolution of 1 min [24]. Using the data processing method in Wu et al. [25], 2391 effective 1-min samples were finally extracted. Based on the outputs of D and V, the mass-weighted diameter of the raindrop spectrum (Dm, mm), normalized intercept parameter (Nw, mm−1 m−3), rain rate (R, mm h−1), and reflectivity factor (Z, dBZ) can be further derived following Wu et al. [21].

2.2. GPM Observations

The DPR onboard the GPM satellite core observation platform consists of Ku-band (13.6 GHz) and Ka-band (35.5 GHz), which can effectively retrieve the three-dimensional structure of precipitation. Before the V06 version, the GPM-DPR product is categorized according to three different scanning modes: Ku-band normal scan (NS), Ka-band matched scan (MS) and Ka-band high-resolution scan (HS). In the latest V07 version, a new full scan (FS) mode is adopted, which is defined as a full-frame dual-frequency product with a vertical resolution of 125 m. This FS format is suitable for data collected before and after the KaPR scanning mode change in May 2018. In MS scan mode, the vertical resolution of the Ka-band is the same as that of the Ku-band, while the vertical resolution of the KaHS data is 500 m. In both cases, the radar returns are oversampled at twice the rate corresponding to the resolution: 125 m for the matched beam and 250 m for the KaHS. When working, the Ku-band radar scans 49 pixels with each pixel is about 5 km × 5 km, and the vertical resolution is 250 m. Although the Ka-band radar also scans 49 pixels at a time, these pixels are divided into two types. In the KaMS, the beams are matched to the central 25 beams of the KuPR, providing a 120 km scan swath. While in the KaHS, the scanning results of the high-sensitivity mode are matched with the 24 sample points in the outer area that are not matched with the Ka-band scanning mode, so as to ensure that 49 pixels have both Ku-band and Ka-band matching, thereby obtaining wider dual-frequency scan results. For more information, please refer to the official document [26].
This paper selects three typical typhoons with GPM overpasses during 2014-2022 (Figure 1), including Ewiniar (2018), Bebinca (2018), and Chaba (2022). Notice all of these typhoons must be locally originated in the SCS (105°E–120°E, 5°N–25°N), and reach at least tropical storm intensity in their life spans. Ewiniar (2018) is a tropical storm, Chaba (2022) is a typhoon, and Bebinca (2018) is a Severe Tropical Storm, which is at tropical depression level when observed by GPM. Since the selected typhoon cases all occurred after May 2018, the DPR_FS V07 standard product is used to obtain the attenuation-corrected equivalent radar reflectivity Ze (dBZ), dual frequency ratio (DFR), rain rate R (mm h−1), mass-weighted diameter Dm (mm), normalized intercept parameter Nw (mm−6 m−3), storm top height (STH), and path integral attenuation (PIA). Referring to the precipitation classification method proposed by Tokay and Short [27], precipitation with R ≥ 10 mm h−1 is defined as heavy precipitation, and precipitation with R < 10 mm h−1 is defined as weak precipitation. As a result, a total of 15,261 near-surface samples were identified, including 1877 heavy precipitation samples and 13,384 weak precipitation samples.

3. Results

3.1. Weather Situation Analysis

Before analyzing the microphysical characteristics of typhoon precipitation, we first analyze the weather situation for the occurrence and development of locally-originated typhoons in the SCS. The initial and developing stages of three typical typhoons are selected, and the ERA5 data is used to draw the geopotential height at 500 hPa and the water vapor flux at 700 hPa, as shown in Figure 2.
Ewiniar (2018) was the first typhoon landing in mainland China in 2018. It attacked Zhanjiang, Haikou, and Yangjiang successively, and produced more than 200 mm of cumulative precipitation in Guangzhou and caused at least 5 deaths. At 1200 UTC on 2 June 2018, Ewiniar (2018) formed at the SCS, then was guided by the equatorial anticyclonic airflow, and moved slowly northward. The WP subtropical high (WPSH) extends westward to the Indochina Peninsula, right in front of the storm’s moving direction, preventing the storm from moving forward. At 1200 UTC on 4 June, Ewiniar (2018) moved to the south of Hainan Island. Under the joint impact of the typhoon and the westerly trough, the WPSH gradually split into two parts, with the east part located over the Indochina Peninsula and the west part located near eastern Taiwan Island. Subsequently, the east part of WPSH merged with the westward propagation to form a new high-pressure ridge, and together with the westerly trough, a saddle-shaped field was established, leading to weak steering flow. Under such circumstances, Ewiniar (2018) was susceptible to different weather systems, thereby spinning around the Qiongzhou Strait, and finally moving eastward under the guidance of the westerly trough.
Bebinca (2018) has a complex track and a long life-span. It has landed in coastal Asia four times, causing nearly 20 deaths in China and Vietnam. At 0000 UTC on 9 August 2018, Bebinca (2018) formed and moved slowly northward under the influence of the cross-equatorial airflow. Almost at the same time, another typhoon Yagi (2018) also formed on the WP and moved northwestward under the guidance of the WPSH. Under the joint influence of the two typhoons, the WPSH weakened and retreated eastward. As the distance between the two typhoons decreased, the Fujiwara effect [30] became more pronounced, and Bebinca (2018) showed complex track changes, hovering over the south of Guangdong. As the continental high-pressure ridge developed and moved eastward, Bebinca (2018) moved westward under the influence of continental anticyclone-guided airflow.
Chaba (2022) is the first typhoon landing in China in 2022, causing the wreck of the “Fujing 001” ship, causing 25 deaths and 1 missing. Affected by the easterly wave, Chaba (2022) formed at 0800 UTC on 29 June, and moved slowly to the north due to the β effect. Consequently, the WPSH split up, and its westward extension cut off the water vapor transport of the southwest monsoon. Not until the westward extension gradually dissipated, did the southwest monsoon begin to transport water vapor to Chaba (2022). Due to the strong airflow guided by the WPSH, typhoon Chaba (2022) moved northwestward and gradually disappeared after landfall.
From the above analysis, one realizes that when a local typhoon originates in the SCS, it is guided by a weak steering flow and moves slowly. When the storm moves northward to the vicinity of the land, it is susceptible to different weather systems including westerly trough, continental high, and WPSH, resulting in complex typhoon tracks such as spinning, swinging, quasi-stationary, and even retrograde. In terms of water vapor transport, the southwest monsoon provides an important water vapor supply for typhoon growth, however, the time of water supply might vary. For instance, Ewiniar (2018) and Bebinca (2018) received the water vapor transport from the southwest monsoon at their initial stage, while Chaba (2022) received the water vapor transport from the southwest monsoon only when it developed to some extent. During the initial stage of Chaba (2022), the WPSH was abnormally strong, which hindered the water vapor transport from the southwest monsoon.

3.2. Ground Validation for GPM

Before using GPM data, its applicability in the SCS should be evaluated. A typical case of typhoon Ewiniar (2018) is chosen to evaluate the GPM capability. On the one hand, typhoon Ewiniar (2018) caused severe disasters to the coastal areas, and on the other hand, both GPM satellite and ground disdrometer have captured the precipitation process of Ewiniar (2018).
Figure 3 gives the probability density function (PDF) distributions of Ze, R, Dm, and Nw for both strong and weak precipitation types. Compared with the ground disdrometer observations, GPM can well depict the peak characteristics of microphysical quantities, except for Dm of weak precipitation. Meanwhile, Table 1 calculates the Normalized Bias (NB) of different microphysical quantities following Wu et al. [31]. It is suggested that the mean deviation of reflectivity for heavy (weak) precipitation is −0.94% (−2.41%), indicating that the instrument onboard GPM shows good performance and the direct radiance observation is in good agreement with the ground observation. However, other physical quantities retrieved by GPM satellite are slightly biased, with Nw slightly overestimated (2.63%) and Dm underestimated (−6.53%) for heavy precipitation while Nw slightly underestimated (−4.81%) and Dm overestimated (1.22%) for weak precipitation. In addition, the deviation of retrieved precipitation intensity is relatively large, where the mean deviation of heavy precipitation is −16.21% and that of weak precipitation is −24.24%. It can be seen that the retrieval results of GPM for microphysical characteristics are basically satisfying, but GPM tends to underestimate the rainfall intensity.

3.3. Analysis of Precipitation Microphysics

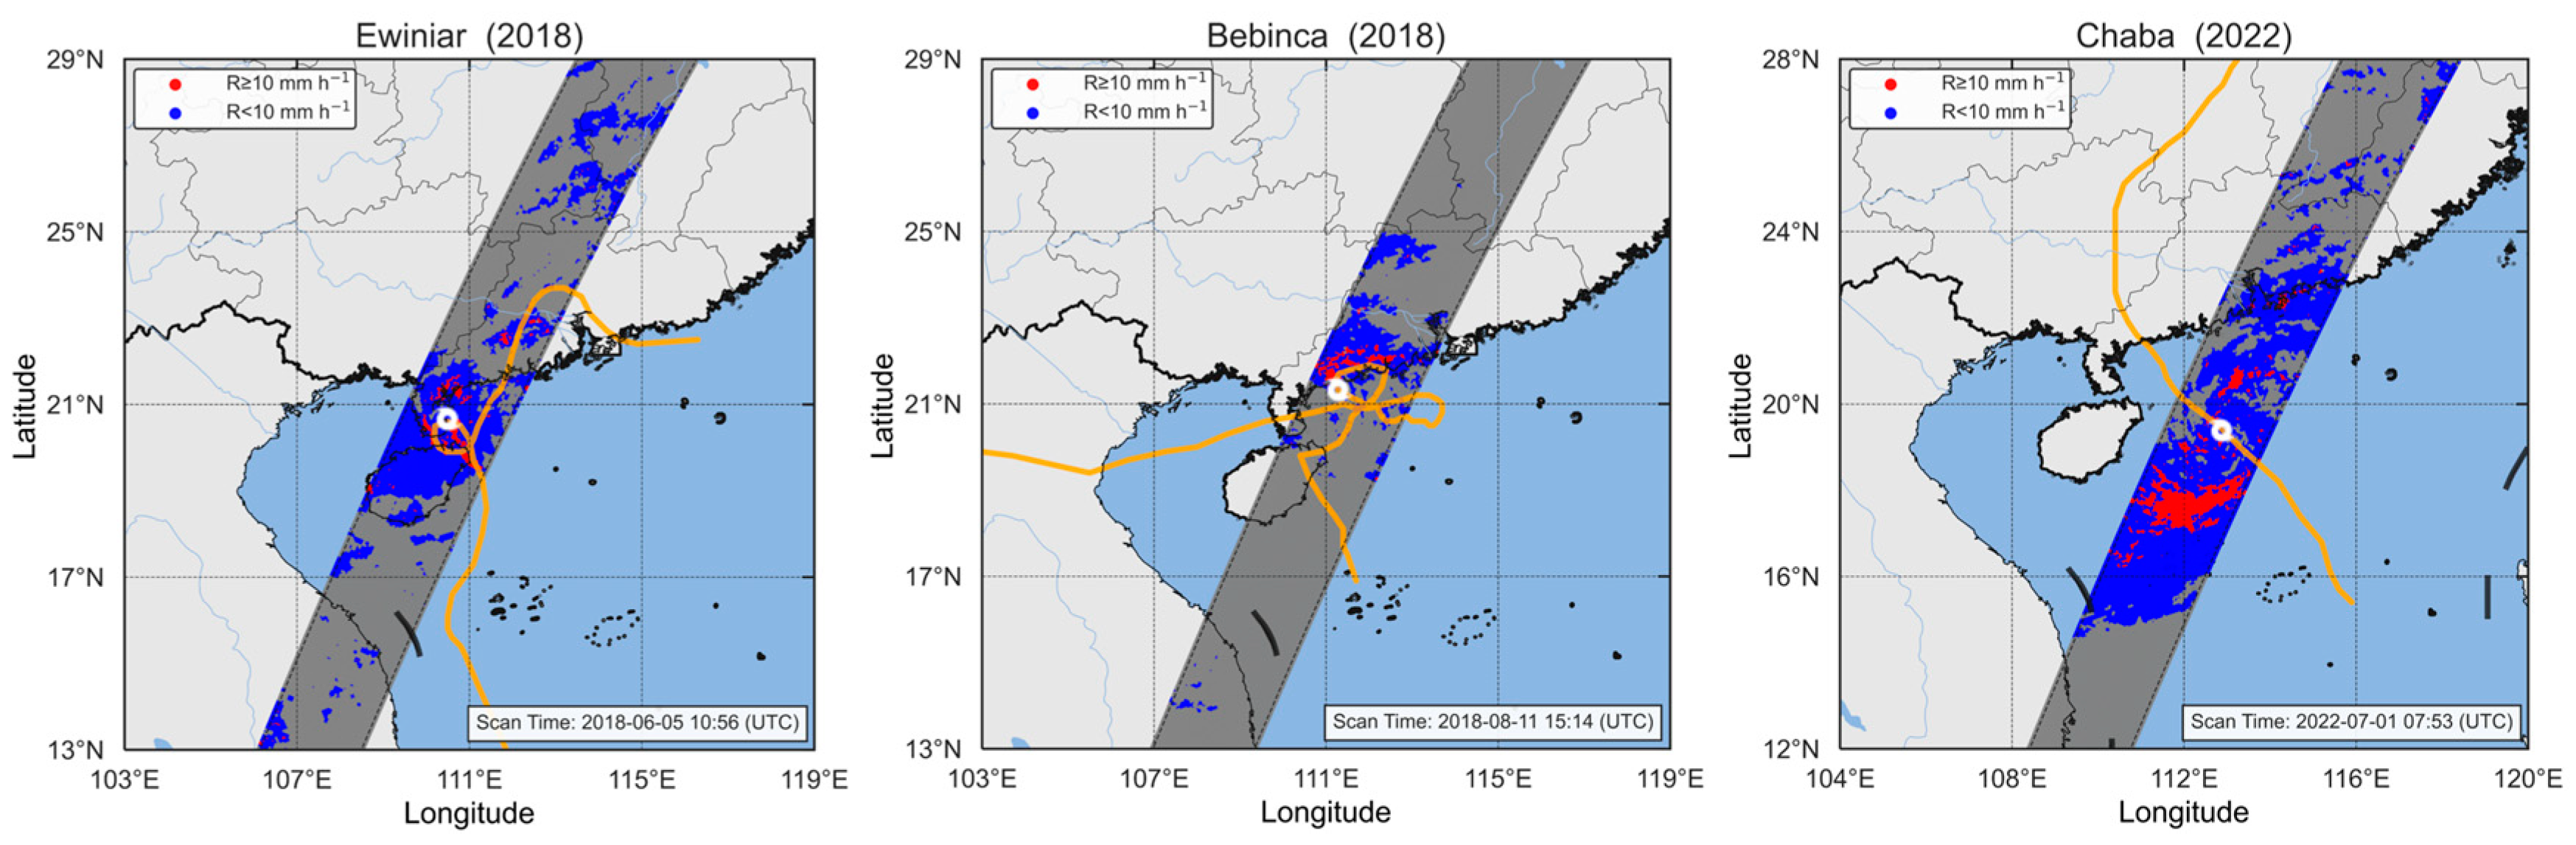
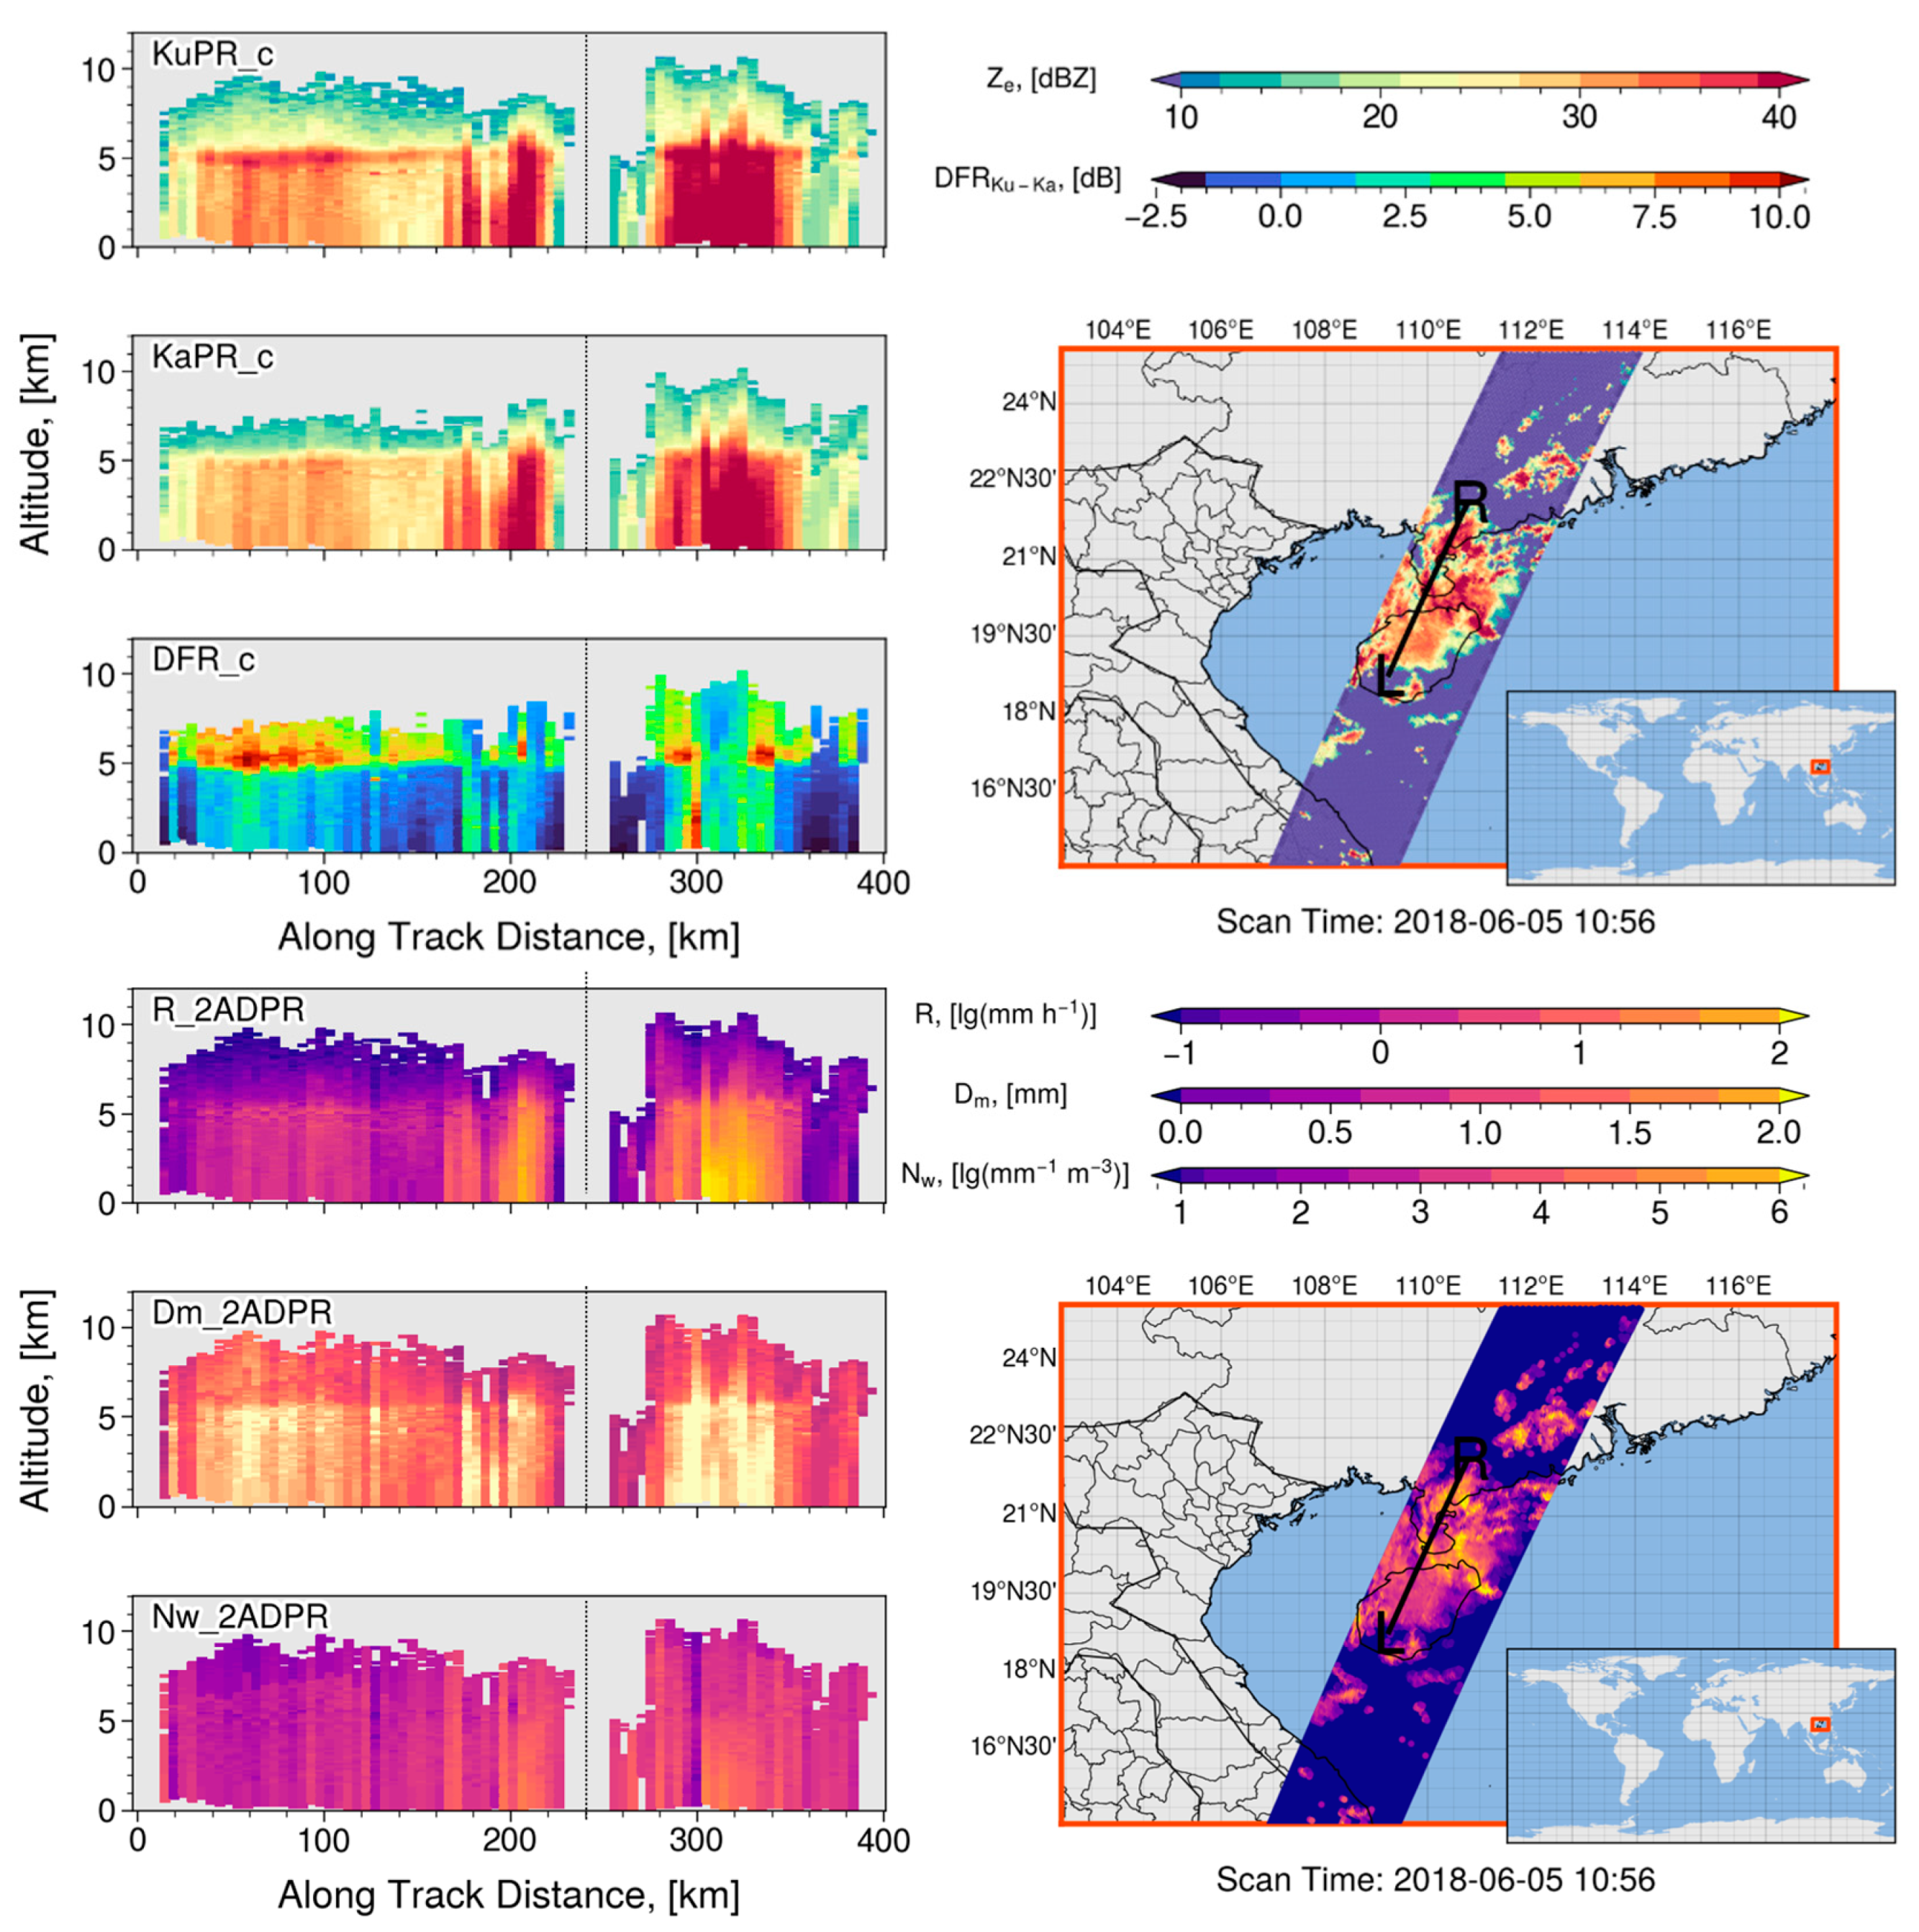
3.3.1. Case Analysis of Typhoon Ewiniar (2018)

Based on the above evaluation results, it is found that the overall performance of GPM precipitation retrieval is satisfying, but the retrieval of the near-surface precipitation of typhoon Ewiniar (2018) in the SCS needs further improvement. In order to better analyze the precipitation characteristics, joint observation from the ground disdrometer and the GPM satellite is used to study Ewiniar (2018), a typical locally-originated typhoon in the SCS.
In order to distinguish the precipitation of different intensities, the observational results are subdivided into six classes according to the method of Wu et al. [23], namely, R < 2, 2 ≤ R < 5, 5 ≤ R < 10, 10 ≤ R < 20, 20 ≤ R < 40 and R ≥ 40 (unit: mm h−1). In addition, raindrops with a diameter greater than 4 mm are defined as large raindrops, raindrops with a diameter of 1–4 mm are defined as medium raindrops, and raindrops with a diameter of less than 1 mm are defined as small raindrops. The composite raindrop spectrum under different rain rates is shown in Figure 4, and the contribution of Dm and Nw to precipitation is also given at the same time.
As shown in Figure 4, the size and number of raindrops both increase with the increase in rain rates when R < 40 mm h−1, which indicates that the increase in concentration is as important as an increase in raindrop diameter for precipitation enhancement. Meanwhile, the proportion of particles with a diameter of 0–1 (2–3) mm in Dm decreased (increased), while the proportion of particles with a concentration of 2–3 (4–6) mm−6 mm−3 in Nw decreased (increased), indicating that the number of large (small) particles is relatively increased (reduced), and there is an obvious process of particle collision and coalescence. When R ≥ 40 mm h−1, the diameter of the large raindrop no longer increases, and the growth of the raindrop reaches an equilibrium state. It should be noted that with the increase in rain rates, the concentration of small raindrops at 0.5–1 mm increases significantly, indicating an obvious break-up process of large raindrops. In addition to the increase in the number of large raindrops, the contribution of high-concentration small and medium-sized raindrops to precipitation is also important.
The horizontal and vertical precipitation structure of typhoon Ewiniar (2018) was observed using the GPM satellite, as shown in Figure 5. According to the horizontal distribution of the radar echoes and the rain rates, there is a good relationship between the large value of radar echo and the large value of rain rate. Meanwhile, the precipitation coverage area on the south side of typhoon Ewiniar (2018) is larger than the precipitation area on the north side, showing an obvious asymmetric feature in the horizontal distribution. The radar reflectivity and the rain rate near the typhoon eye is higher, and as the distance from the typhoon center increases, the radar reflectivity and rain rate decrease gradually.
Through the eye of typhoon Ewiniar (2018), the vertical profiles of the storm along the L–R line are analyzed in Figure 5. The upper part of Figure 5 shows the vertical distribution of the radar echo, while the lower part shows the distribution of the precipitation microphysics. Overall, the rainband on the left side of the typhoon is wider than that of the right side, and the distribution of the typhoon rainbands is obviously asymmetric. Near the typhoon eye, there are strong radar echo areas (>40 dBZ) in the eyewall areas on both sides, which are consistent with the heavy precipitation center. The precipitation in the eyewall area also shows similar asymmetry feature. From the distribution of Dm and Nw, it can be seen that the heavy precipitation in the right-side eyewall area is mainly composed of high-concentration large raindrops, and there are also a small number of large raindrops in the left-side peripheral rainbands, which further explains the relatively strong echo center in this area. Meanwhile, on the right side of the typhoon eye, the strong reflectivity area is more concentrated and the convection features are obvious. While on the left side of the typhoon eye, there are obvious characteristics of the zero degree “bright-band” in the outer rainbands near an altitude of 5 km.
Since the Ku-band is more sensitive to large particles, while the Ka-band is more sensitive to small particles, the large value of DFR (i.e., ZKu/ZKa) could thereby contribute to distinguishing different size of particles. When particles are relatively large, the Ku-band is approximately proportional to the sixth power of diameter, while the Ka-band is approximately proportional to the second power of diameter. For smaller particles, both Ku-band and Ka-band are proportional to the sixth power of diameter, so that DFR could be more sensitive to large particles. From the distribution of DFR, it can be seen that there is large value of DFR on both sides of the typhoon eye, and the large DFR on the right side of the typhoon eye is located throughout the whole eyewall column. In contrast, the large DFR value on the left side of the typhoon eye is only located in the upper level of the outer rainbands, while the DFR of lower level is relatively small, which indicates that the microphysical processes between the eyewall and rainbands can be significantly different. Specifically, in the eyewall area, due to the strong updraft of convective cloud, the coalescence between particles is obvious, resulting in larger Dm and Nw. As for the outer rainbands, due to the relatively weaker updraft of stratiform cloud, there is an obvious melting layer “bright-band” feature. The ice particles quickly fall and melt into liquid water through the melting layer, and evaporate when falling to the ground, resulting in a small number of large raindrops. Therefore, although the Dm is large there, the Nw is relatively smaller.

3.3.2. Statistical Analysis of Locally-Originated Typhoons in the SCS

Considering the lack of direct observation data on the sea, it is very convenient to conduct statistical research on the precipitation of locally-originated typhoons in the SCS by using the GPM satellite observations. Ryu et al. [32] collected GPM data from 2014 to 2019, and used the Gaussian mixture model cluster analysis method to divide heavy precipitation into three categories, namely the “continental convective”, the “oceanic deep convective”, and the “oceanic shallow convective”. Figure 6 shows the Dm–Nw scatter distribution of typhoon heavy precipitation in the SCS, where the gray box represents the three types of heavy precipitation given by Ryu et al. [32], and the pink marks represent mean position of the heavy precipitation in three typhoon cases. After calculation, it is found that the average value of <Dm, Nw> for Ewiniar (2018) is (1.59, 4.15), the average value of <Dm, Nw> for Bebinca (2018) is (1.61, 4.11), and the average value of <Dm, Nw> for Chaba (2022) is (1.48, 4.40). Notice the average position of the heavy precipitation for the three typhoons are all within the scope of “oceanic deep convective”, and the <Dm, Nw> of Ewiniar (2018) and Bebinca (2018) are close to each other. In contrast, Chaba (2022) exhibits “oceanic shallow convective” feature. Since Bebinca (2018) is a tropical depression, Ewiniar (2018) is a tropical storm, and Chaba (2022) is a typhoon, it can be assumed that as the typhoon intensity increases, Dm tends to decrease, Nw tends to increase, and heavy precipitation of SCS typhoons tends to become more “oceanic shallow convective”. This phenomenon, however, needs more observational data for verification.
Meanwhile, it can be seen from Figure 7 that with the increase in typhoon intensity, the median STH and PIA gradually increase, indicating a larger vertical extent and stronger updraft in convection. It is possible that the breakup of large raindrops may be more obvious as the intensity of typhoon increases in the SCS. In addition, the position of the red square in Figure 6 represents the mean value of the locally-originated typhoons in the SCS, the green square represents the mean position of the typhoon in the WP according to Huang and Chen [20], and the blue square represents the mean position of typhoon in the NIO according to Kumar et al. [23]. Overall, the heavy precipitation of locally-originated typhoons in the SCS is “oceanic deep convective” with the average value of 1.52 for Dm, and the average value of 4.31 for Nw. Compared with storms in the WP (the average Dm is about 1.69 and the average Nw is about 3.58), locally-originated typhoons in the SCS have higher Nw and lower Dm, and are more “oceanic deep convective”. Compared with the storms in the NIO (the average Dm is about 1.37, and the average Nw is about 3.63), the Dm and Nw of the locally-originated typhoons in the SCS are higher, and the precipitation particles are more abundant.
Figure 8 shows the probability distribution of LWP and IWP for both weak precipitation and heavy precipitation in the SCS typhoons. It can be seen that the distribution of LWP and IWP in weak precipitation is relatively concentrated, and the average LWP of locally-originated typhoons in the SCS is 947.1 g m−2, the average IWP is 363.3 g m−2, while the LWP of the typhoons in the WP (NIO) is 938.2 (809.4) g m−2, the IWP is 474.7 (375.4) g m−2. Compared with the WP, the LWP of the weak precipitation of the locally-originated typhoons in the SCS is basically the same, whereas the IWP is lower, indicating that the cold-cloud process of the WP typhoon may be more prominent. Compared with the NIO typhoon, the weak precipitation of the locally-originated typhoons in the SCS has more LWP and slightly lower IWP, indicating that the warm-cloud process of locally-originated typhoons in the SCS may be more prominent.
The distribution of LWP and IWP is more scattered in heavy precipitation than weak precipitation. The average LWP of locally-originated typhoons in the SCS is 3010.8 g m−2, the average IWP of locally-originated typhoons in the SCS is 562.5 g m−2. While the average LWP of typhoons in the WP (NIO) is 2103.0 (2477.8) g m−2, and the average IWP of typhoons in the WP (NIO) is 311.5 (275.0) g m−2. Compared with the heavy typhoon precipitation in the WP and the NIO, the IWP/LWP of the locally-originated typhoons in the SCS is higher, indicating more abundant water content in the heavy precipitation of the locally-originated typhoons in the SCS, which is likely due to the transport of water vapor from the southwest monsoon.

4. Discussion

In this study, locally-originated typhoons in the SCS are selected as the research object, but the number of SCS typhoons is relatively small, and the number of GPM overpass is even less. Therefore, more observation data are needed to enrich the research results. With the progress of satellite remote sensing technology and the launch of newly developed satellites, it is believed that the problem of insufficient observational data can be effectively solved. Recently, the Chinese FY-3G satellite, which is also equipped with dual-frequency precipitation measurement radar (PMR), has been launched successfully. The addition of the FY-3G satellite will greatly increase the probability of capturing typhoons in the SCS, and further promote the research progress of typhoon precipitation in this area. Meanwhile, the cross validation and collaborative observation between FY-3G PMR and GPM DPR satellites will also be the research hotspot in the future.
The significance of observing the typhoon precipitation microphysics lies in improving the cloud microphysical scheme in the model to obtain more accurate typhoon forecast. In this paper, the statistical parameters such as Dm, Nw, LWP, and IWP of typhoon precipitation over the SCS have important application value for improving the performance of microphysical parameterization schemes in the SCS. By comparing the microphysical characteristics of typhoons in different oceanic basins, this paper found that the differences of typhoon precipitation microphysics in SCS, WP, and NIO are significant. In the future development of typhoon models, whether it is necessary to adjust microphysical parameterization schemes for typhoons in different oceanic basins, will be a direction worth studying. Currently, the study only focused on the typhoon precipitation in the SCS, future works will investigate the role of clouds and their associated dynamics in intensifying and sustaining typhoons [34].

5. Conclusions

Using GPM satellite observations over the SCS during 2014–2022, the precipitation microphysical characteristics of locally-originated typhoons in the SCS are investigated. The following conclusions can be finally obtained:
(1)
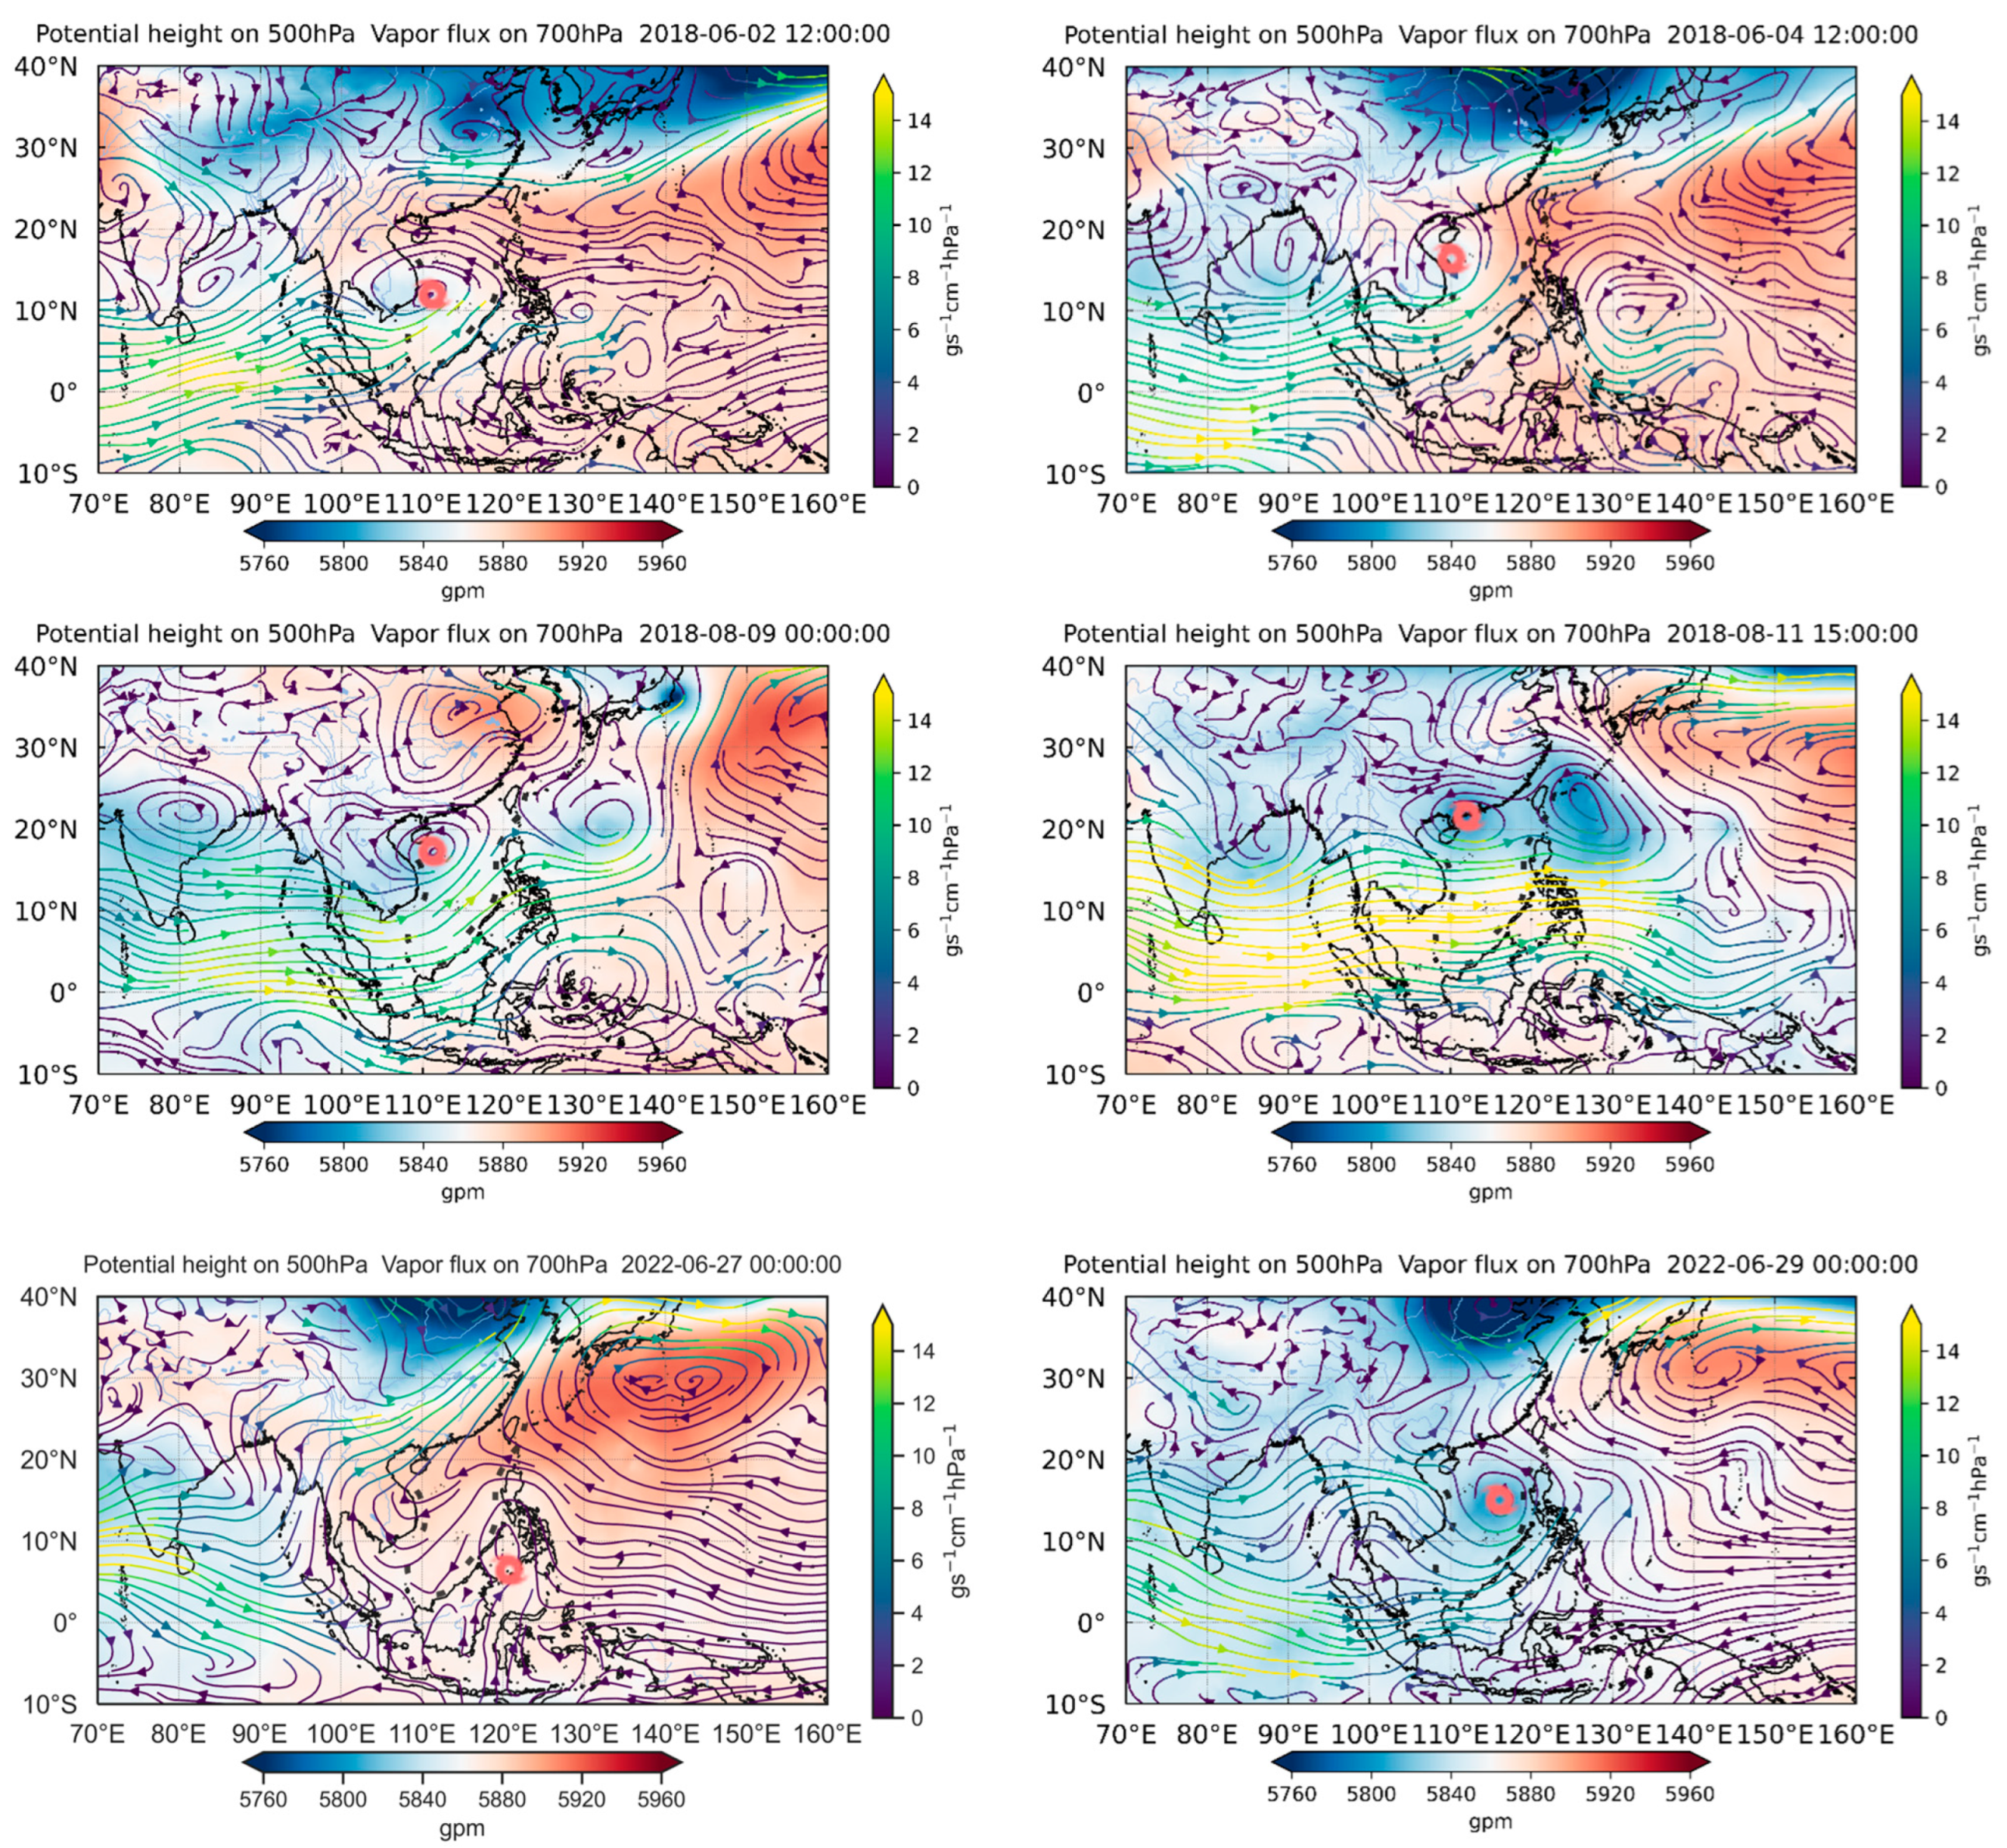
The typhoon genesis in the SCS is closely related to the monsoon trough or the easterly wave, and the southwest monsoon provides an important water vapor supply for the growth of typhoons in the SCS. Compared with the typhoons in the WP, the typhoons in the SCS are farther away from the subtropical high, leading to weak steering flow and slow moving speed in their initial stage. As the SCS typhoon moves northward, it is jointly affected by the continental high, the WP subtropical high, and the westerly trough, resulting in complex track.
(2)
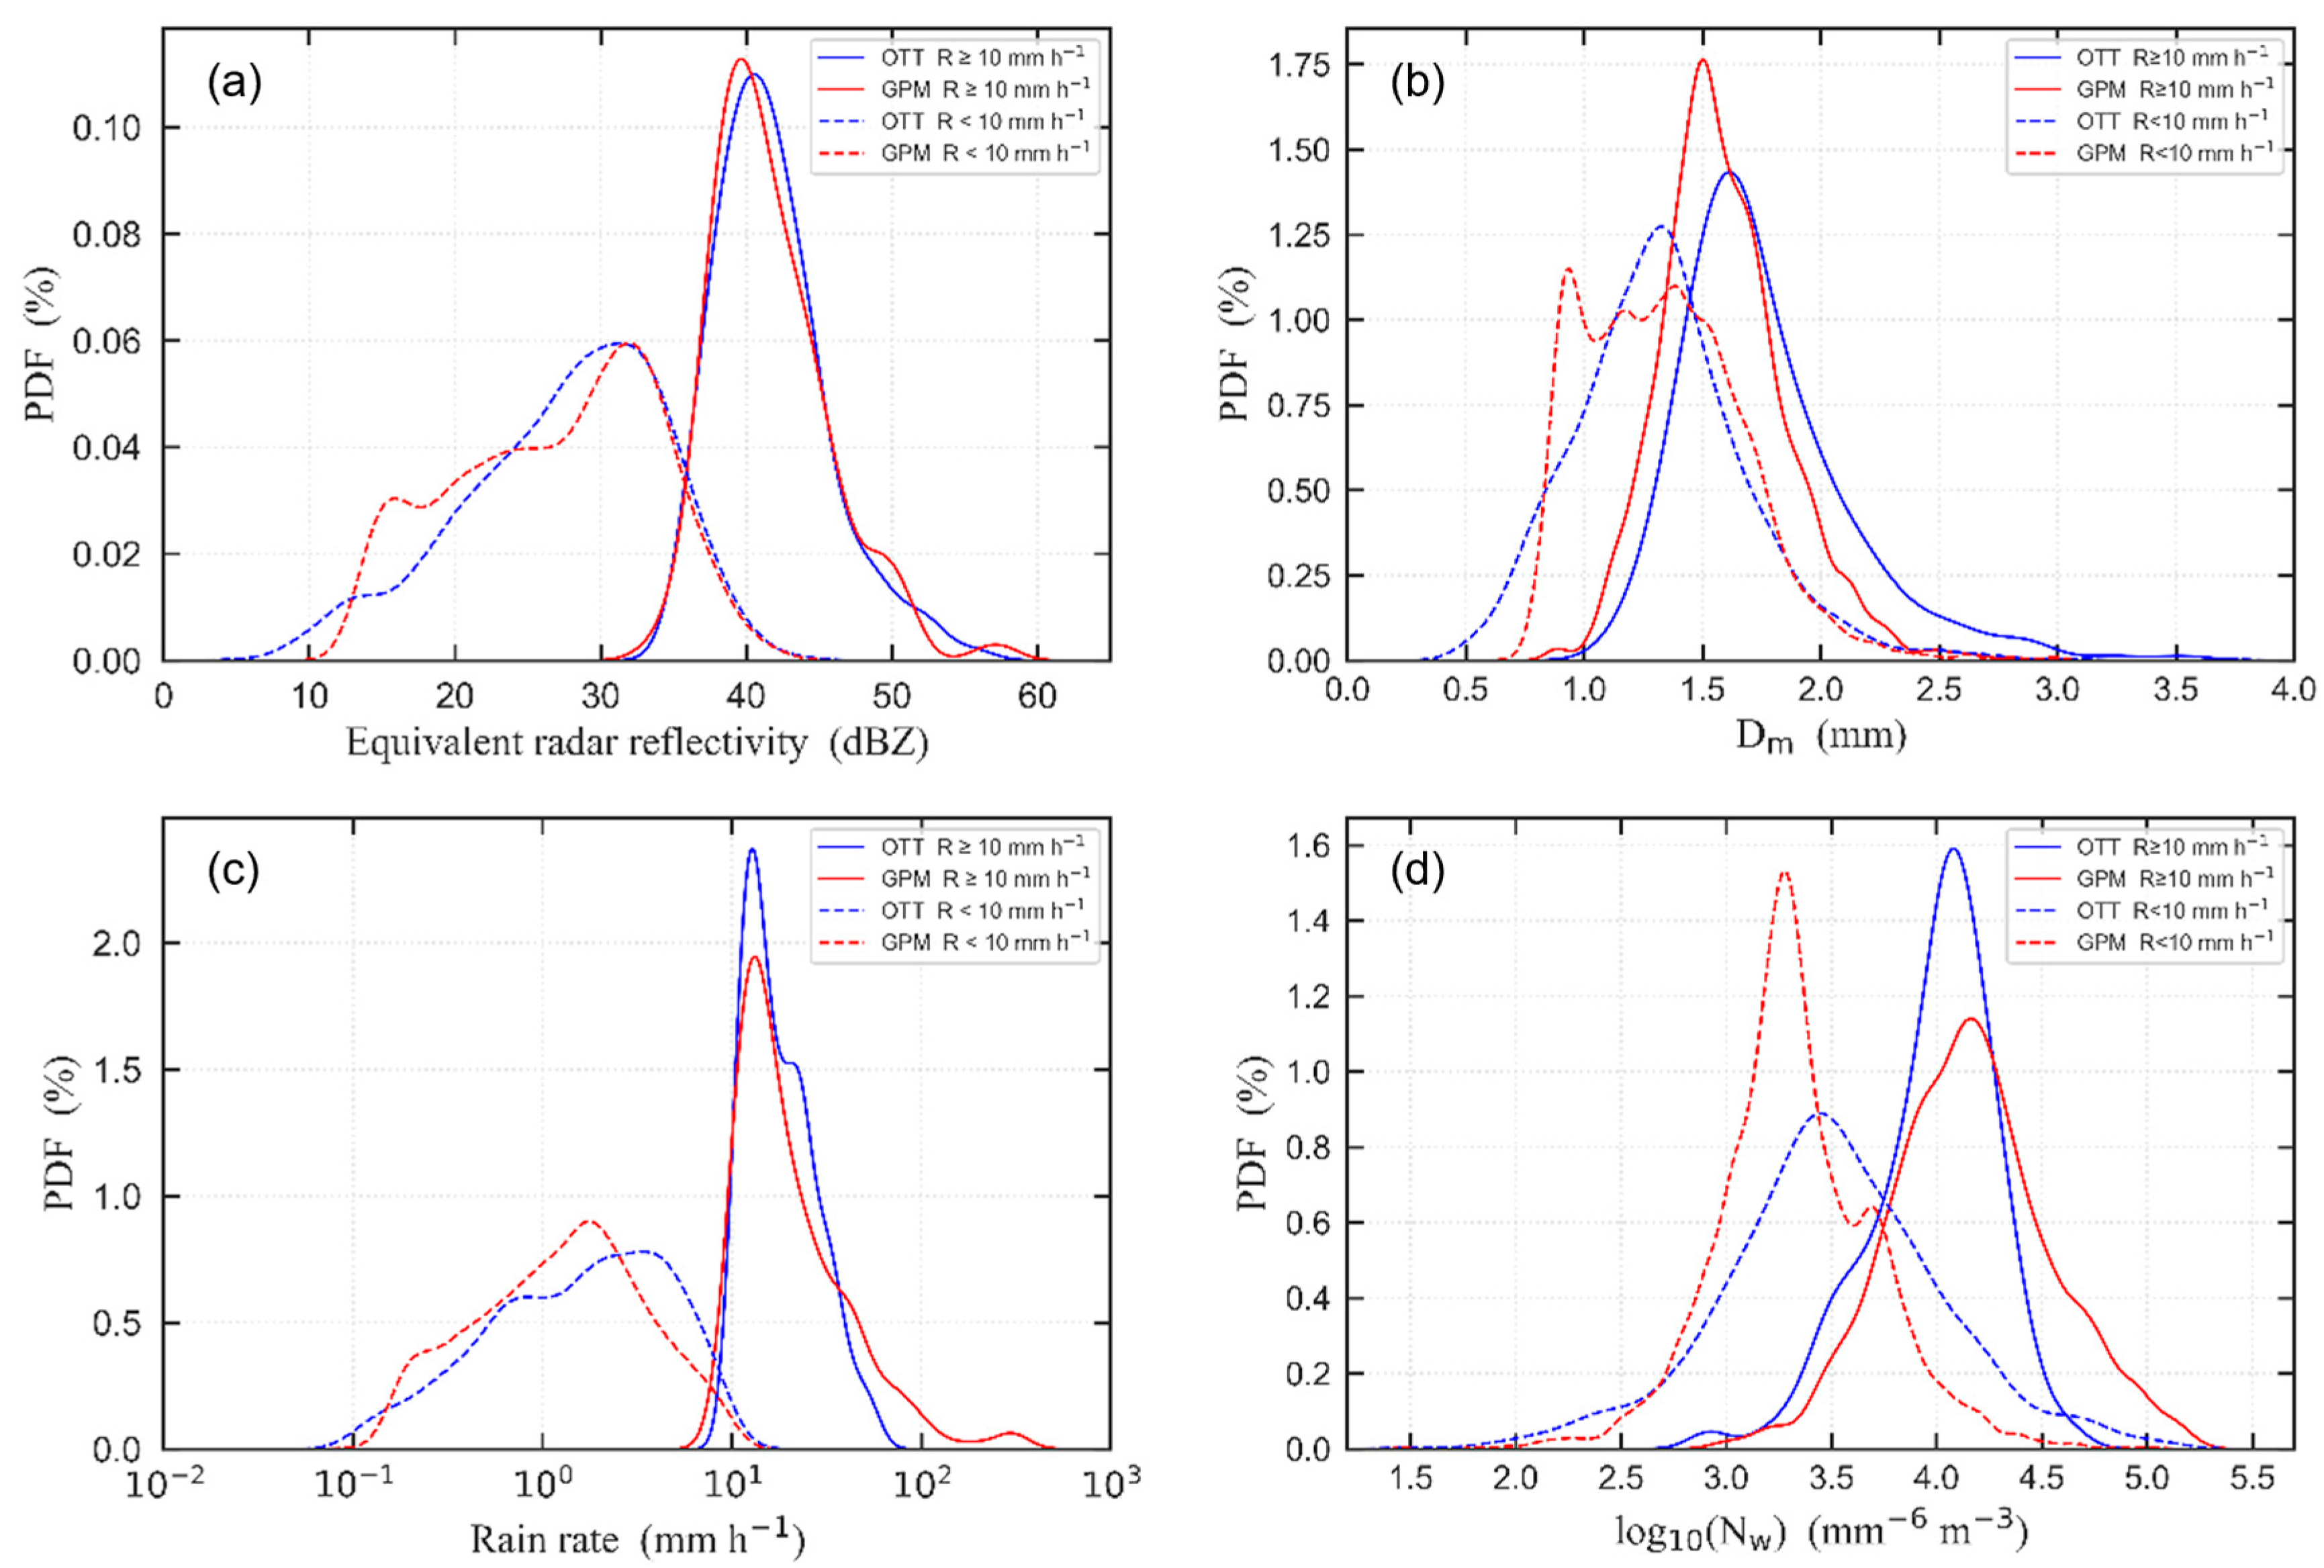
The applicability of GPM satellite in the SCS is evaluated against ground-based OTT disdrometer measurements. It is suggested that the deviations of GPM-retrieved dBZ, Dm and Nw for R ≥ 10 mm h−1 (R < 10 mm h−1) are −0.94% (−2.41%), −6.53% (1.22%) and 2.63 (−4.81%), respectively. This indicates that the performance of GPM precipitation retrieval algorithm in the SCS is overall satisfying but needs to be improved in its retrieval of rain rates.
(3)
The eyewall and spiral rainbands of Typhoon Ewiniar (2018) in the SCS are found to be highly asymmetric. In the eyewall, the updraft is strong, the coalescence process of particles is distinct, and the precipitation is mainly concentrated in large raindrops. In the outer rainbands, the “bright-band” of melting layer is distinct, the melting of ice particles and the evaporation of raindrops are obvious, and there exist a few large raindrops in the precipitation.
(4)
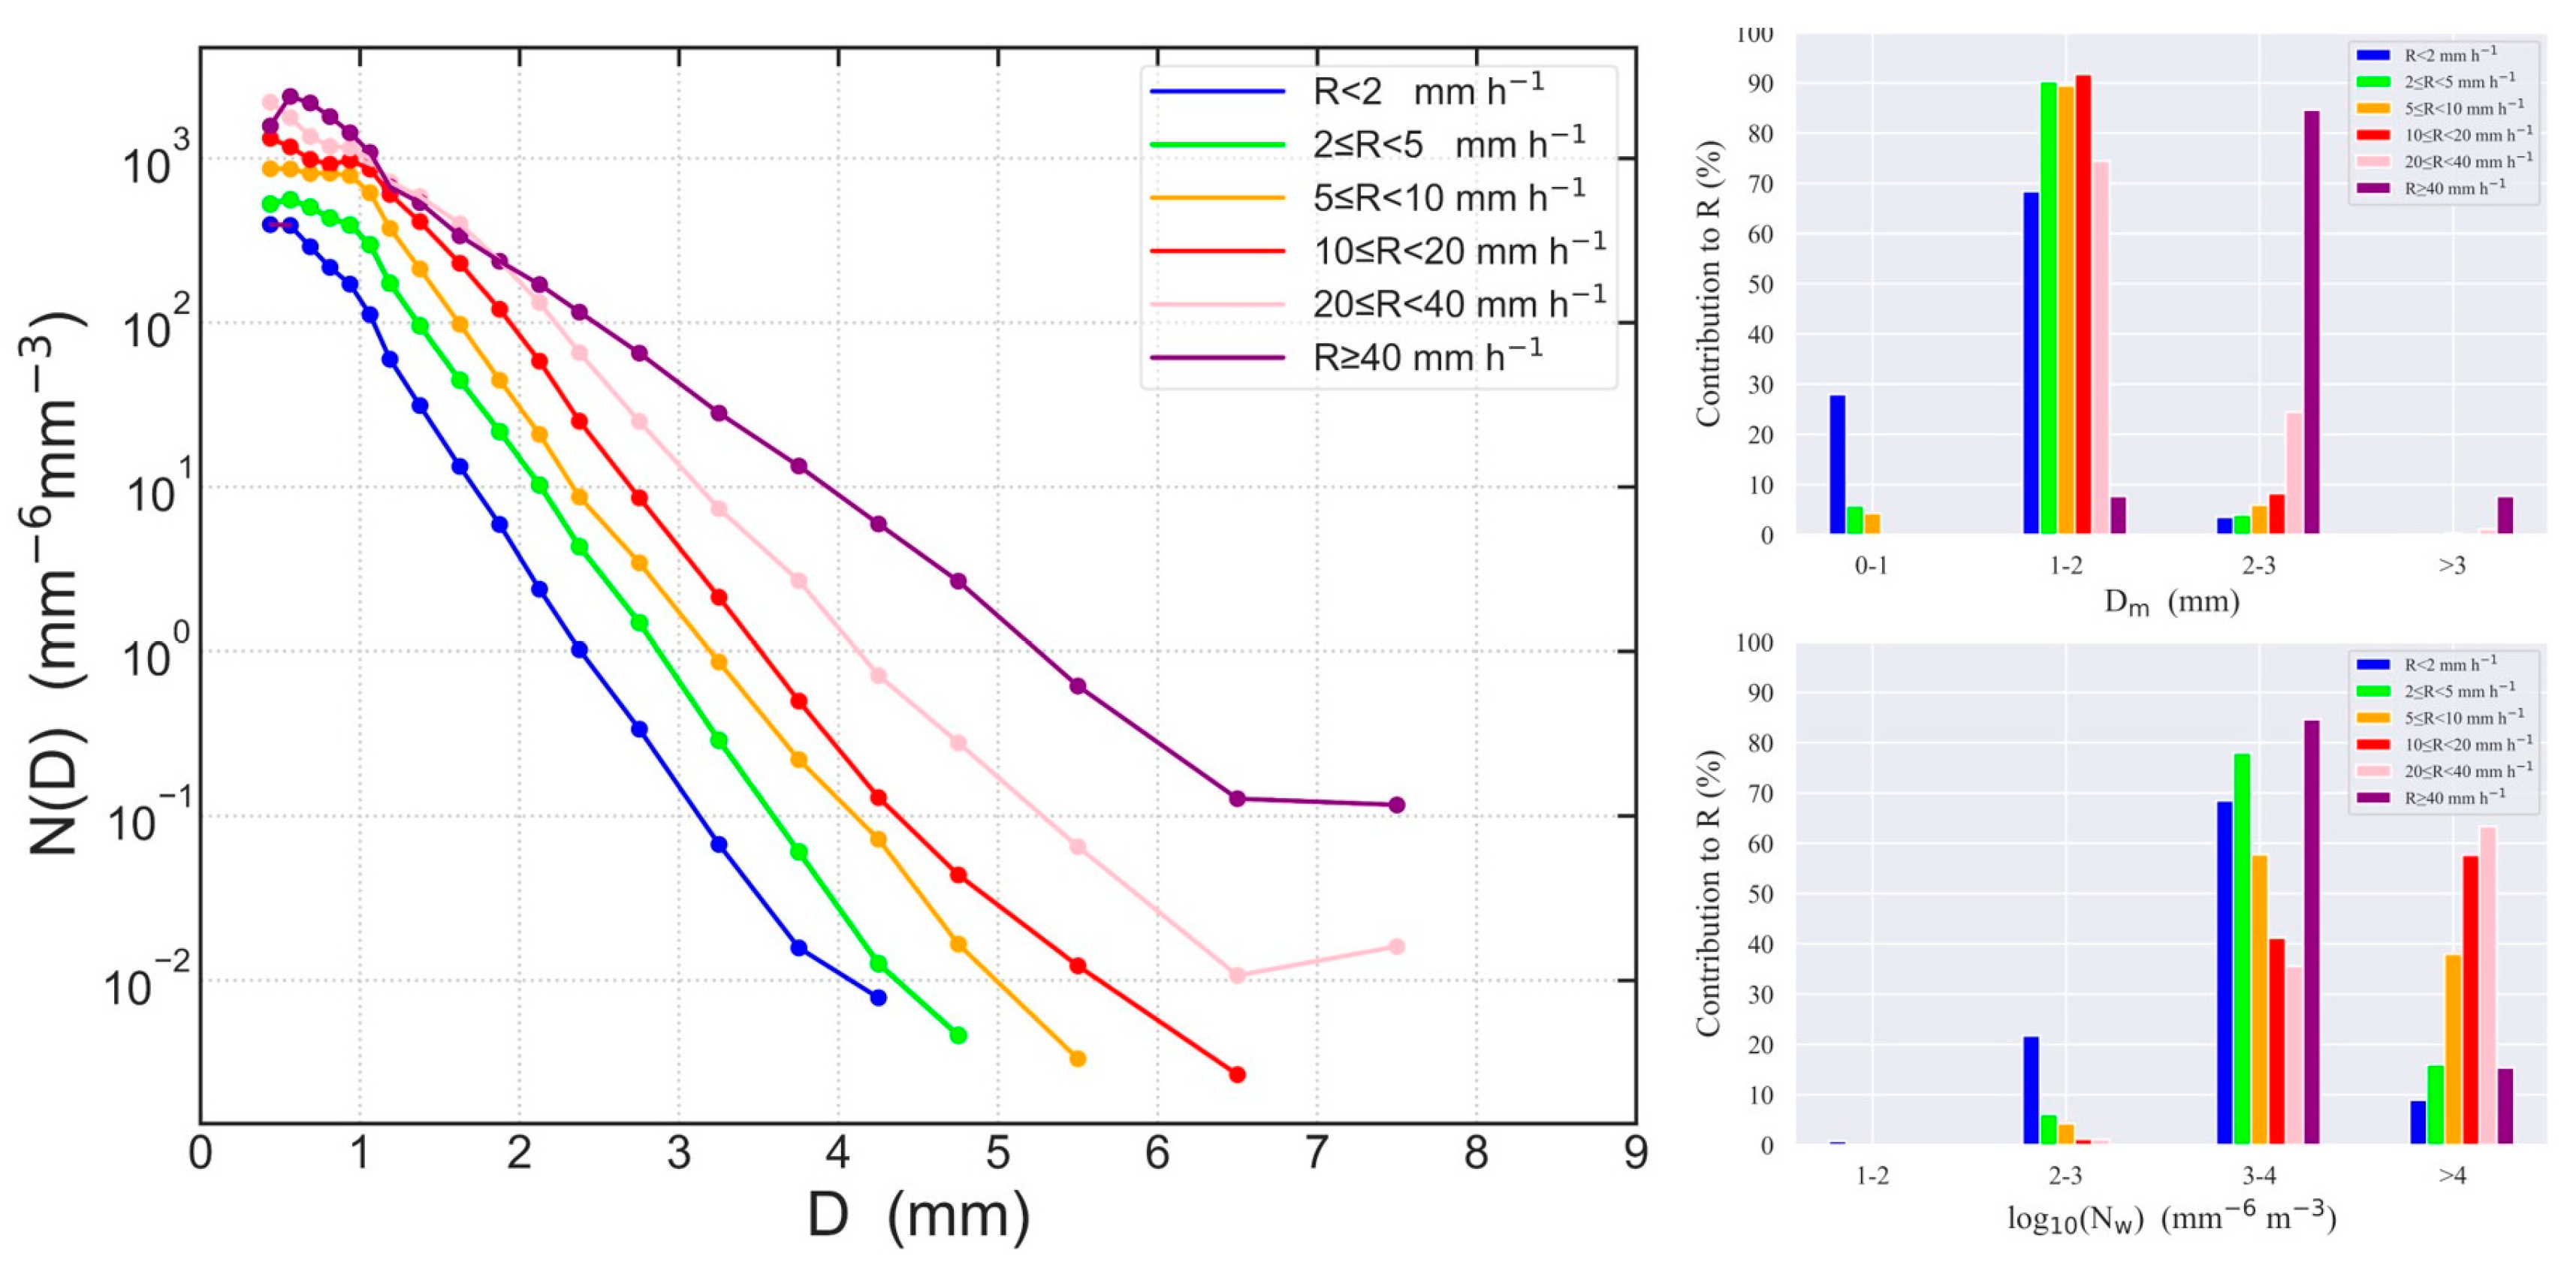
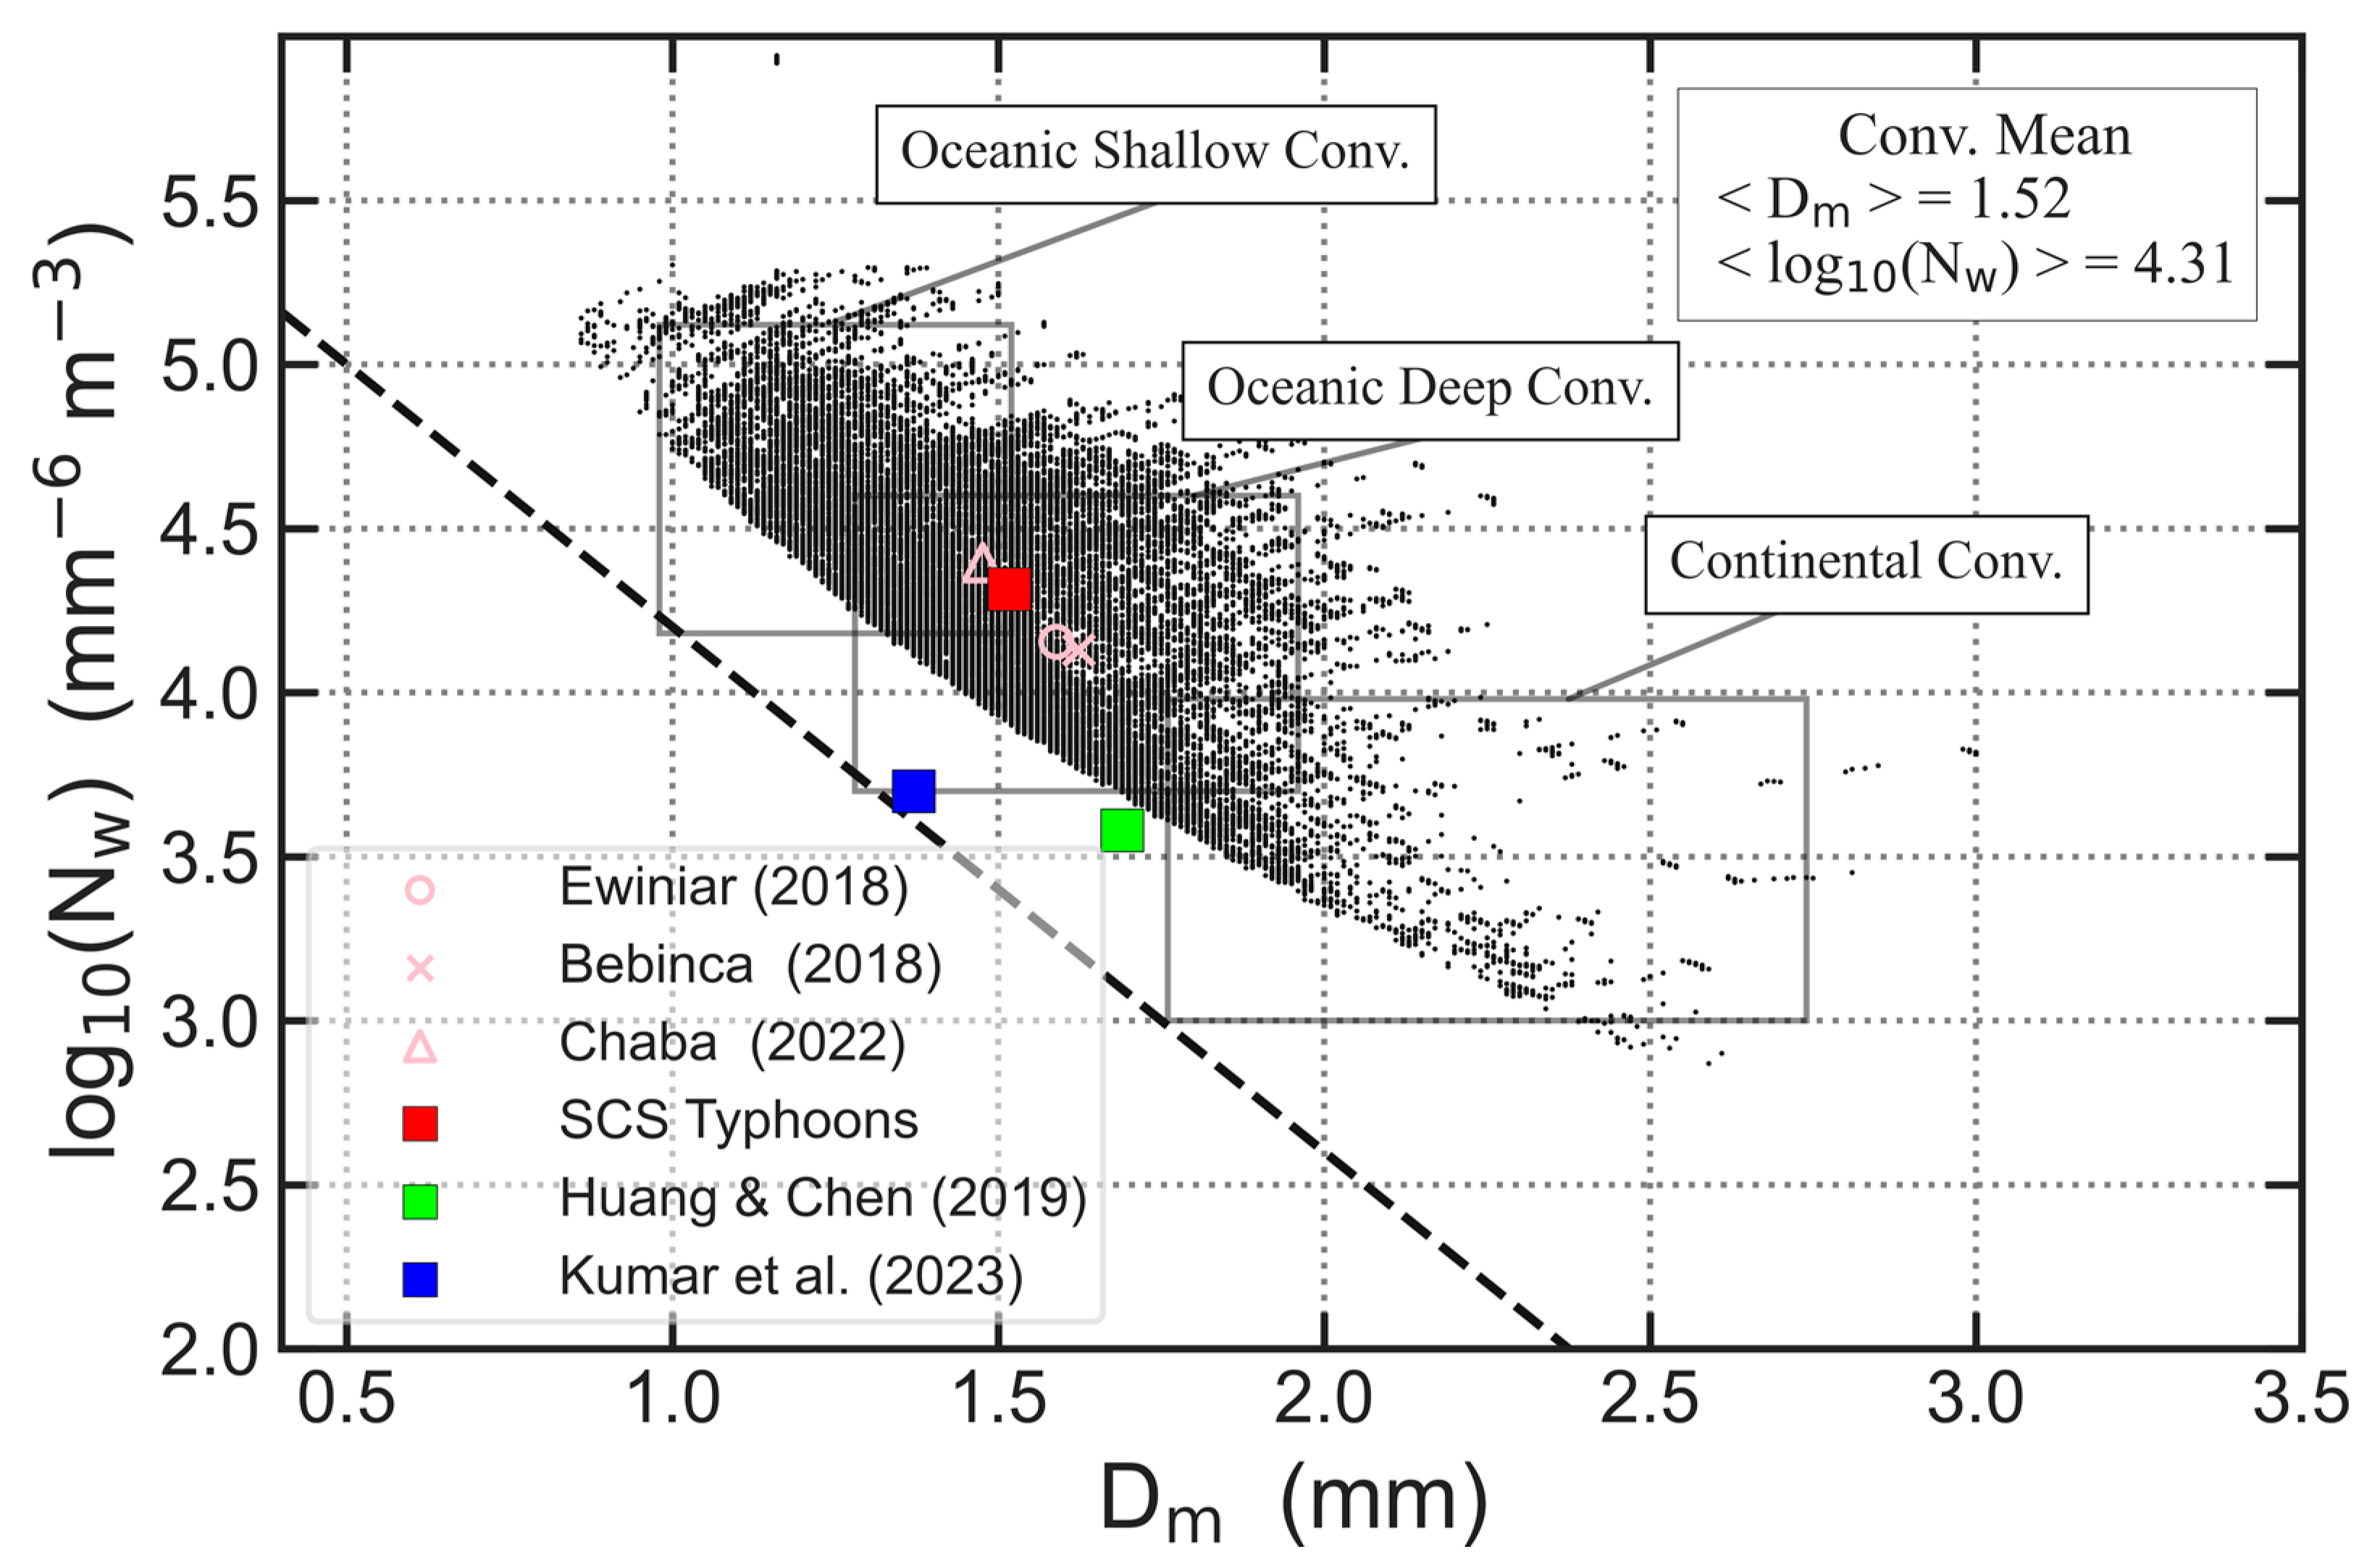
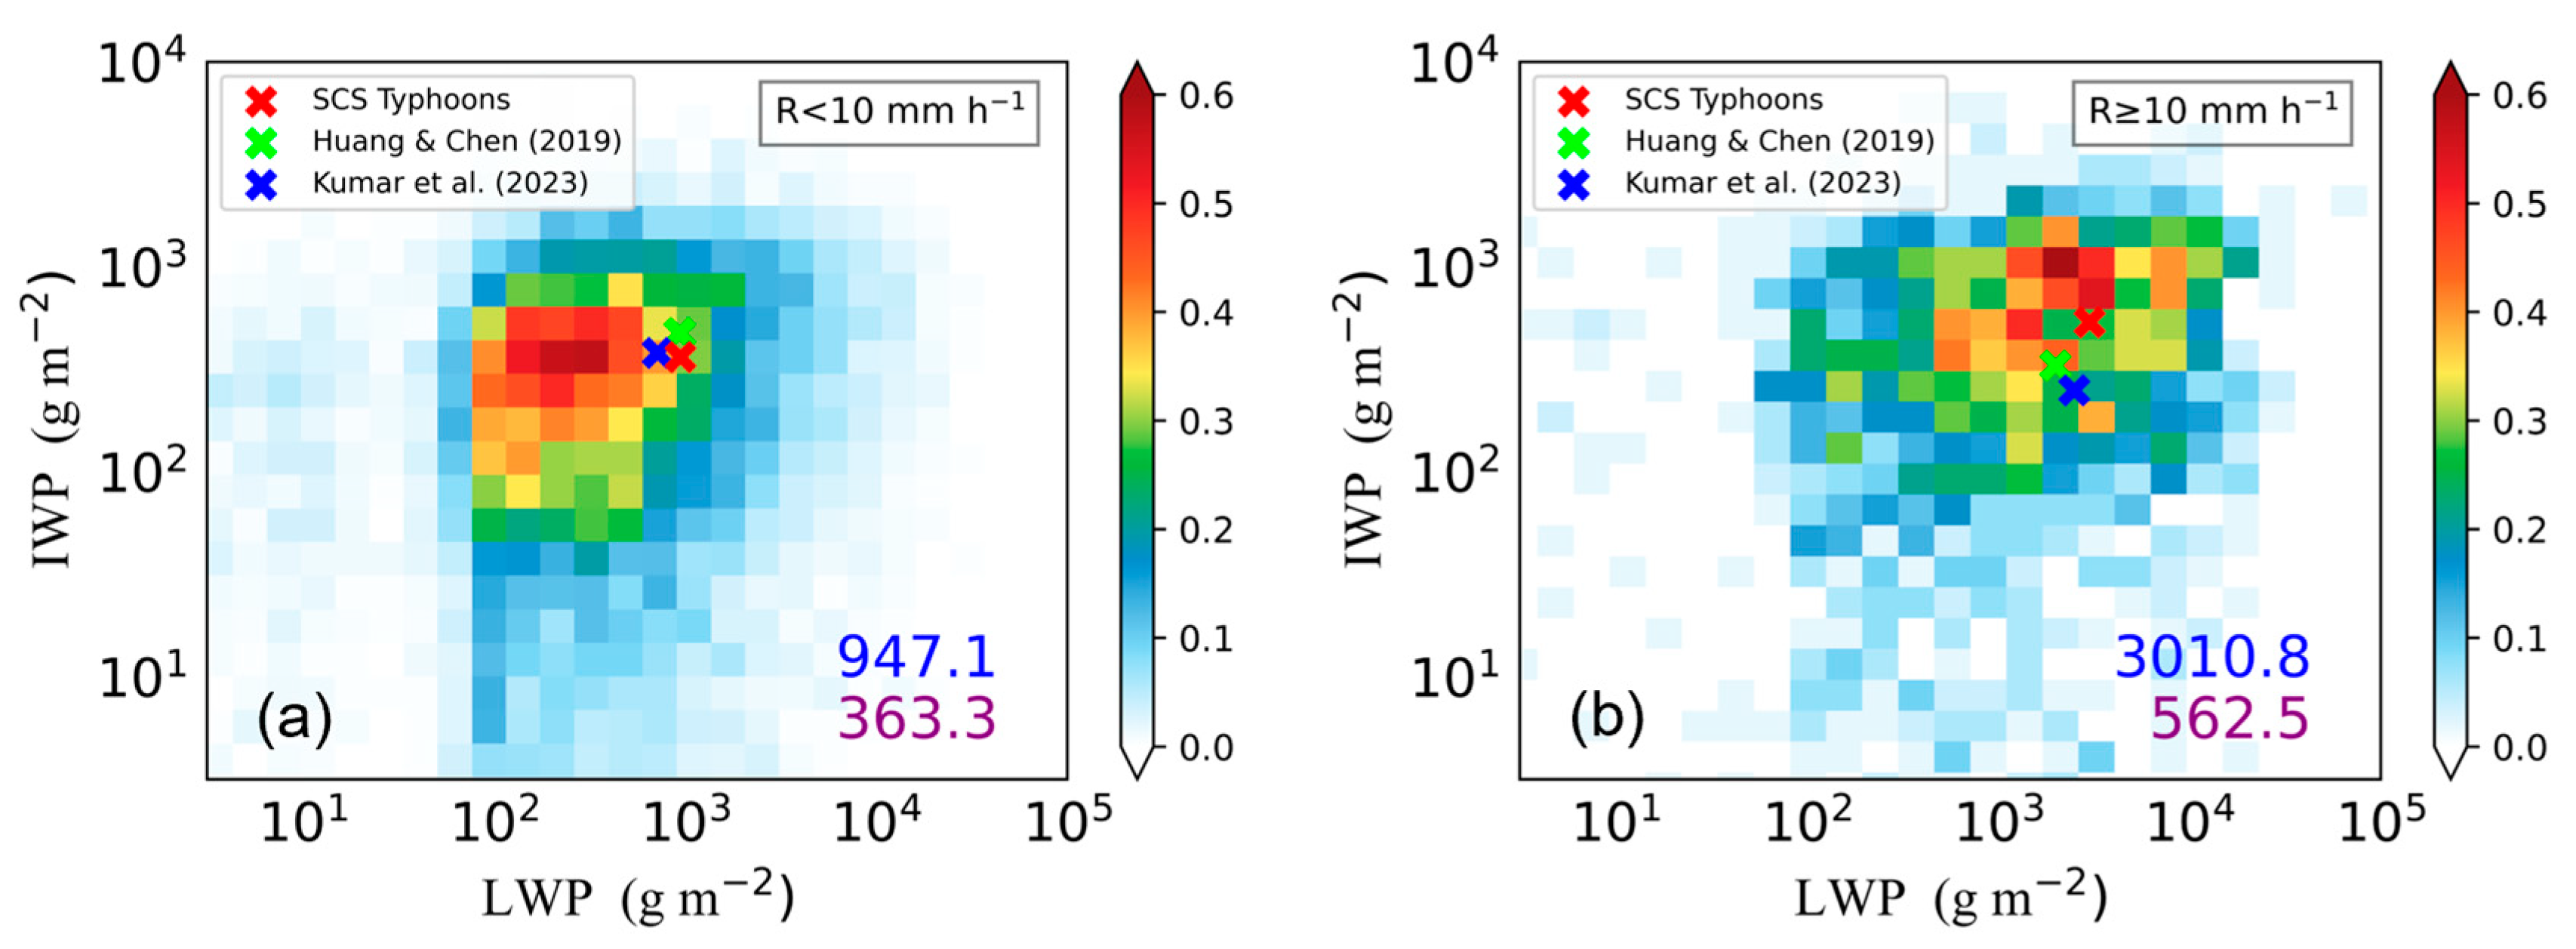
Compared with the WP, the typhoon heavy precipitation in the SCS is composed of a higher concentration of smaller raindrops, which is more “oceanic deep convective”. Compared with the NIO, the typhoon heavy precipitation in the SCS is both larger in drop size and number concentration, which contains more abundant raindrops. In addition, with the increase in typhoon intensity over the SCS, heavy precipitation tends to develop towards “oceanic shallow convective”. For weak precipitation, the LWP of the SCS typhoons is higher than that of the NIO typhoons, while the IWP of the SCS typhoons is lower than that of the WP typhoons. For heavy precipitation, the LWP and IWP of the SCS typhoons are significantly higher than those of the WP typhoons and the NIO typhoons.

Author Contributions

Conceptualization, X.H. and Z.W.; methodology, Z.W.; software, H.Z.; validation, Z.W., Y.X., Y.Z. and L.Z.; formal analysis, X.H. and Z.W.; investigation, X.H.; resources, Y.Z.; data curation, X.H.; writing—original draft preparation, X.H. and Z.W.; writing—review and editing, W.X.; visualization, H.Z.; supervision, Y.X.; project administration, L.Z.; funding acquisition, Y.Z. All authors have read and agreed to the published version of the manuscript.

Funding

This research was funded jointly by the National Natural Science Foundation of China [grant numbers 42075080, 41975066] and the Hunan Provincial Innovation Foundation for Postgraduate [grant number CX20220075].

Data Availability Statement

GPM DPR data can be obtained from the Goddard Earth Sciences Data and Information Services Center (GES DISC) via https://disc.gsfc.nasa.gov, accessed on 20 January 2023. ERA5 data can be obtained from the Climate Data Store (CDS) via https://cds.climate.copernicus.eu/cdsapp#!/home, accessed on 21 January 2023. Disdrometer data can be acquired by sending request to the first corresponding author (wuzuhang18@nudt.edu.cn).

Conflicts of Interest

The authors declare no conflict of interest.

References

  1. Morton, B.; Blackmore, G. South China Sea. Mar. Pollut. Bull. 2001, 42, 1236–1263. [Google Scholar] [CrossRef] [PubMed]
  2. Wu, Z.; Zhang, Y.; Zhang, L.; Zheng, H. Improving the WRF forecast of landfalling tropical cyclones over the Asia-Pacific region by constraining the cloud microphysics model with GPM observations. Geophys. Res. Lett. 2022, 49, 2022GL100053. [Google Scholar] [CrossRef]
  3. Zhang, Y.; Wu, Z.; Zhang, L.; Zheng, H. A comparison of spectral bin microphysics versus bulk parameterization in forecasting Typhoon In-Fa (2021) before, during, and after its landfall. Remote Sens. 2022, 14, 2169. [Google Scholar] [CrossRef]
  4. Wu, Z.; Zhang, Y.; Xie, Y.; Zhang, L.; Zheng, H. Radiance-based assessment of bulk microphysics models with seven hydrometeor species in forecasting Super-typhoon Lekima (2019) near landfall. Atmos. Res. 2022, 273, 106173. [Google Scholar] [CrossRef]
  5. Tokay, A.; Bashor, P.; Habib, E.; Kasparis, T. Raindrop size distribution measurements in tropical cyclones. Mon. Weather Rev. 2008, 136, 1669–1685. [Google Scholar] [CrossRef]
  6. Chang, W.; Wang, T.; Lin, P. Characteristics of the raindrop size distribution and drop shape relation in typhoon systems in the western Pacific from the 2D video disdrometer and NCU C-band polarimetric radar. J. Atmos. Ocean. Technol. 2009, 26, 1973–1993. [Google Scholar] [CrossRef]
  7. Wen, L.; Zhao, K.; Chen, G.; Wang, M.; Zhou, B.; Huang, H.; Hu, D.; Lee, W.; Hu, H. Drop size distribution characteristics of seven typhoons in China. J. Geophys. Res. Atmos. 2018, 123, 6529–6548. [Google Scholar] [CrossRef]
  8. Bao, X.; Wu, L.; Tang, B.; Ma, L.; Wu, D.; Tang, J.; Chen, H.; Wu, L. Variable Raindrop Size Distributions in Different Rainbands Associated With Typhoon Fitow (2013). J. Geophys. Res. Atmos. 2019, 124, 12262–12281. [Google Scholar] [CrossRef]
  9. Seela, B.; Janapati, J.; Lin, P.; Lee, M. An insight into the microphysical attributes of northwest Pacific tropical cyclones. Sci. Rep. 2023, 13, 4432. [Google Scholar] [CrossRef]
  10. Lyu, J.; Xiao, H.; Du, Y.; Sha, L.; Deng, Y.; Jia, W.; Niu, S.; Zhou, Y.; Pang, G. Variations of Raindrop size distribution and radar retrieval in outer rainbands of typhoon Mangkhut (2018). J. Meteorol. Res. 2022, 36, 500–519. [Google Scholar] [CrossRef]
  11. May, P.; Kepert, J.; Keenan, T. Polarimetric radar observations of the persistently asymmetric structure of Tropical Cyclone Ingrid. Mon. Weather Rev. 2008, 136, 616–630. [Google Scholar] [CrossRef]
  12. Wang, M.; Zhao, K.; Xue, M.; Zhang, G.; Liu, S.; Wen, L.; Chen, G. Precipitation microphysics characteristics of a typhoon Matmo (2014) rainband after landfall over eastern China based on polarimetric radar observations. J. Geophys. Res. Atmos. 2016, 121, 12415–12433. [Google Scholar] [CrossRef]
  13. Wu, D.; Zhao, K.; Kumjian, M.; Chen, X.; Huang, H.; Wang, M.; Didlake, A.C., Jr.; Duan, Y.; Zhang, F. Kinematics and microphysics of convection in the outer rainband of Typhoon Nida (2016) revealed by polarimetric radar. Mon. Weather Rev. 2018, 146, 2147–2159. [Google Scholar] [CrossRef]
  14. Didlake, A.; Kumjian, M. Examining storm aymmetries in hurricane Irma (2017) using polarimetric radar observations. Geophys. Res. Lett. 2018, 45, 13513–13522. [Google Scholar] [CrossRef]
  15. Brauer, N.; Basara, J.; Kirstetter, P.; Wakefield, R.; Homeyer, C.; Yoo, J.; Shephers, M.; Santanello, J.A., Jr. The inland maintenance and reintensification of tropical storm Bill (2015). Part II: Precipitation microphysics. J. Hydrometeorol. 2021, 22, 2695–2711. [Google Scholar]
  16. Huang, H.; Zhao, K.; Fu, P.; Chen, H.; Chen, G.; Zhang, Y. Validation of precipitation measurements from the dual-frequency precipitation radar onboard the GPM core observatory using a polarimetric radar in South China. IEEE Trans. Geosci. Remote Sens. 2022, 60, 4104216. [Google Scholar] [CrossRef]
  17. Zheng, H.; Zhang, Y.; Zhang, L.; Lei, H.; Wu, Z. Precipitation microphysical processes in the inner rainband of tropical cyclone Kajiki (2019) over the South China Sea revealed by polarimetric Radar. Adv. Atmos. Sci. 2021, 38, 65–80. [Google Scholar] [CrossRef]
  18. Feng, L.; Xiao, H.; Liu, X.; Hu, S.; Li, H.; Xiao, L.; Hao, X. Precipitation microphysical characteristics of typhoon Ewiniar (2018) before and after its final landfall over southern China. Adv. Atmos. Sci. 2023, 40, 1005–1020. [Google Scholar] [CrossRef]
  19. Huang, H.; Chen, F. Precipitation microphysics of tropical cyclones over the western North Pacific based on GPM DPR observations: A preliminary analysis. J. Geophys. Res. Atmos. 2019, 124, 3124–3142. [Google Scholar] [CrossRef]
  20. Wu, Z.; Huang, Y.; Zhang, Y.; Zhang, L.; Lei, H.; Zheng, H. Precipitation characteristics of typhoon Lekima (2019) at landfall revealed by joint observations from GPM satellite and S-band radar. Atmos. Res. 2021, 260, 105714. [Google Scholar] [CrossRef]
  21. Wu, Z.; Zhang, Y.; Zhang, L.; Zheng, H.; Huang, X. A comparison of convective and stratiform precipitation microphysics of the record-breaking Typhoon In-Fa (2021). Remote Sens. 2022, 14, 344. [Google Scholar] [CrossRef]
  22. Zhang, A.; Chen, Y.; Pan, X.; Hu, Y.; Chen, S.; Li, W. Precipitation microphysics of tropical cyclones over Northeast China in 2020. Remote Sens. 2022, 14, 2188. [Google Scholar] [CrossRef]
  23. Kumar, K.; Das, S.; Deshpande, S. Pandithurai G. Regional variability of precipitation characteristics in tropical cyclones over the North Indian Ocean from GPM-DPR measurements. Atmos. Res. 2023, 283, 106568. [Google Scholar] [CrossRef]
  24. Battaglia, A.; Rustemeier, E.; Tokay, A.; Blahak, U.; Simmer, C. PARSIVEL snow observations: A critical assessment. J. Atmos. Ocean. Technol. 2010, 27, 333–344. [Google Scholar] [CrossRef]
  25. Wu, Z.; Zhang, Y.; Zhang, L.; Lei, H.; Xie, Y.; Wen, L.; Yang, J. Characteristics of summer season raindrop size distribution in three typical regions of western Pacific. J. Geophys. Res. Atmos. 2019, 124, 4054–4073. [Google Scholar] [CrossRef]
  26. Iguchi, T.; Seto, S.; Meneghini, R.; Yoshida, N.; Awaka, J.; Le, M.; Chandrasekar, V.; Brodzik, S.; Kubota, T. GPM/DPR Level-2 Algorithm Theoretical Basis Document; NASA Goddard Space Flight Center: Greenbelt, MD, USA, 2021. [Google Scholar]
  27. Tokay, A.; Short, D. Evidence from tropical raindrop spectra of the origin of rain from stratiform versus convective clouds. J. Appl. Meteorol. Clim. 1996, 35, 355–371. [Google Scholar] [CrossRef]
  28. Ying, M.; Zhang, W.; Yu, H.; Lu, X.; Feng, J.; Fan, Y.; Zhu, Y.; Chen, D. An overview of the China Meteorological Administration tropical cyclone database. J. Atmos. Ocean. Technol. 2014, 31, 287–301. [Google Scholar] [CrossRef]
  29. Lu, X.; Yu, H.; Ying, M.; Zhao, B.; Zhang, S.; Lin, L.; Bai, L.; Wan, R. Western North Pacific tropical cyclone database created by the China Meteorological Administration. Adv. Atmos. Sci. 2021, 38, 690–699. [Google Scholar] [CrossRef]
  30. Fujiwara, S. The natural tendency towards symmetry of motion and its application as a principle in meteorology. Q. J. R. Meteorol. Soc. 1921, 47, 287–293. [Google Scholar] [CrossRef]
  31. Wu, Z.; Zhang, Y.; Zhang, L.; Hao, X.; Lei, H.; Zheng, H. Validation of GPM precipitation products by comparison with ground-based Parsivel disdrometers over Jianghuai region. Water 2019, 11, 1260. [Google Scholar] [CrossRef]
  32. Ryu, J.; Song, H.; Sohn, B.; Liu, C. Global distribution of three types of drop size distribution representing heavy rainfall from GPM/ DPR measurements. Geophys. Res. Lett. 2021, 48, e2020GL090871. [Google Scholar] [CrossRef]
  33. Bringi, V.; Chandrasekar, V.; Hubbert, J.; Gorgucci, E.; Randeu, W.; Schoenhuber, M. Raindrop size distribution in different climatic regimes from disdrometer and dual-polarized radar analysis. J. Atmos. Sci. 2003, 60, 354–365. [Google Scholar] [CrossRef]
  34. Subrahmanyam, K.V.; Kumar, K.K.; Tourville, N.D. CloudSat Observations of Three-Dimensional Distribution of Cloud Types in Tropical Cyclones. IEEE J. Sel. Top. Appl. Earth Obs. Remote Sens. 2018, 11, 339–344. [Google Scholar] [CrossRef]
Figure 1. The precipitation distribution and typhoon tracks [28,29], where the orange line represents the typhoon track, the white typhoon mark represents the typhoon center during GPM overpass, the gray zone represents the area scanned by GPM, the red dots represent the heavy precipitation area with R ≥ 10 mm h−1, and the blue dots represent weak precipitation areas with R < 10 mm h−1.
Remotesensing 15 02657 g001
Figure 2. The 500 hPa geopotential height map superimposed with the 700 hPa water vapor flux streamline diagram for three locally-originated typhoons in the SCS at different developing stages. The red typhoon mark represents the typhoon center.
Remotesensing 15 02657 g002
Figure 3. Comparison of PDF distribution between OTT observation and GPM observation, the panels (ad) represent the reflectivity factor Ze, mass-weighted average diameter Dm, rain rate R, and normalized intercept parameter Nw, respectively. The blue solid line represents the OTT observation with R ≥ 10 mm h−1, the blue dotted line represents R < 10 mm h−1, the red solid line represents the GPM observation with R ≥ 10 mm h−1, and the red dotted line represents R < 10 mm h−1.
Remotesensing 15 02657 g003
Figure 4. The composite raindrop size distribution measured by OTT under different rain rates and the corresponding proportion of Dm and Nw in different classes.
Remotesensing 15 02657 g004
Figure 5. The vertical and horizontal distributions of radar reflectivity and precipitation microphysical parameters. The upper panels represent Ku-band (Ka-band) radar reflectivity Ze, and dual frequency ratio DFR, while the lower panels represent rain rate R, mass-weighted mean diameter Dm, and the normalized intercept parameter Nw.
Remotesensing 15 02657 g005
Figure 6. Dm–Nw distribution of typhoon heavy precipitation in the SCS. The dotted line represents the fitting line of stratiform precipitation proposed by Bringi et al. [33], and the gray box represents the division of different heavy precipitation types proposed by Ryu et al. [32]. The red square represents the mean values of locally-originated typhoons in the SCS, the green square represents the mean values of the typhoons in the WP [19], and the blue square represents the mean values of typhoons in the NIO [23].
Remotesensing 15 02657 g006
Figure 7. The box plots of (a) storm top height (STH) and (b) path integral attenuation (PIA) for heavy precipitation in different SCS typhoons. The green lines represent the median, the bottom and top blue lines of the box indicate the 25th and 75th percentiles, respectively. The bottom and top black lines represent the minimum and maximum, respectively.
Remotesensing 15 02657 g007
Figure 8. Probability distribution of LWP and IWP of typhoon precipitation in the SCS, where (a) represents weak precipitation, and (b) represents strong precipitation. The red cross is the mean value of typhoon precipitation in the SCS, the green cross is the mean value of typhoon precipitation in the WP [19], and the blue cross is the mean value of typhoon precipitation in the NIO [23].
Remotesensing 15 02657 g008
Table 1. Comparison of sample number, reflectivity factor Ze, rain rate R, mass-weighted mean diameter Dm, and normalized intercept parameter Nw between GPM and OTT observations.
Rain Rate
(mm h−1)
GPM Sample QuantityOTT Sample QuantityNB (%) of ZeNB (%) of RNB (%) of DmNB (%) of Nw
R ≥ 10365273−0.94−16.21−6.532.63
R < 1037082118−2.41−24.241.22−4.81
Disclaimer/Publisher’s Note: The statements, opinions and data contained in all publications are solely those of the individual author(s) and contributor(s) and not of MDPI and/or the editor(s). MDPI and/or the editor(s) disclaim responsibility for any injury to people or property resulting from any ideas, methods, instructions or products referred to in the content.

