Article

Spatiotemporal Characteristics and Regional Variations of Active Fires in China since 2001

1
Institute of Geographic Sciences and Natural Resources Research, Chinese Academy of Sciences, Beijing 100101, China
2
College of Resources and Environment, University of Chinese Academy of Sciences, Beijing 100049, China
3
Key Laboratory of Carrying Capacity Assessment for Resource and Environment, Ministry of Natural Resources, Beijing 101149, China
*
Author to whom correspondence should be addressed.
Remote Sens. 2023, 15(1), 54; https://doi.org/10.3390/rs15010054
Submission received: 20 October 2022 / Revised: 13 December 2022 / Accepted: 17 December 2022 / Published: 22 December 2022

Abstract

:
Currently, fires (e.g., biomass burning and/or straw burning) are still prevailing and serious globally. However, the issue of the characteristics, types, and drives of fire occurrence is always a challenge and varies distinctively worldwide. Using Moderate Resolution Imaging Spectroradiometer (MODIS) Collection 6 (C6) active fire products during 2001–2020, here, we analyzed the occurrence frequencies and spatiotemporal characteristics of active fires at the provincial and regional to national scales and at the monthly and annual scales in China. The accumulated occurrence frequencies of MODIS C6 active fires in China were up to 184.91 × 10⁴ in the past two decades, and the average annual level was 9.25 × 10⁴, especially in 2014 (15.20 × 10⁴). The overall trend of active fires was rising and then falling, but with significant spatial and temporal differences in the last 20-years. Temporally, nearly 61% of active fires occurred in spring (36%) and autumn (25%), particularly in August (16%), April (14%), and October (13%). Spatially, about 90% of active fires occurred in the east of the Hu Huanyong Line, particularly in Northeast China (25%), South China (23%), and East China (20%). In China, the most active fires were concentrated in the Northeast Plain, the North China Plain, the southeast hills, and the Yunnan–Kweichow Plateau. In terms of temporal differences across regions, active fires in Northeast China, North China, and Northwest China were concentrated in spring and autumn, especially in March, April, and October; in East China, they were concentrated in summer, especially in June; and in South China and Southwest China, they were concentrated in winter and spring, especially from December to April of the following year. Our study provides a full analysis of spatio–temporal characteristics and changes of active fires in China, and it can also assist in supplying a beneficial reference for higher monitoring and controlling of fires such as straw burning.

1. Introduction

Fires, or now detected as satellite-based active fires, including cropland fires, forest fires, grassland fires, and shrub fires, play a very important role in the interrelationship between climate change or human activities and carbon cycling [1,2]. Active fires, either natural or manmade, are one of the most important disturbances of global terrestrial ecosystems and have had a substantial impact on the climate system and biogeochemical cycles [3]. Increasingly frequent active fires [4,5,6], since the Anthropocene, not only exacerbate climate change [2,7,8,9,10], but also pose a serious threat to public health and human life, health and safety [11]. Therefore, many countries and regions have implemented stricter measures and introduced a range of sustainable fire policies [12], such as the National Development and Reform Commission of China’s issuing of the “Notice on Strengthening the Comprehensive Utilization of Crop Straw and Banning of Crop Burning” [2]. Thus, delineating the spatiotemporal characteristics and regional variations in fires is significant for the development of national individual or local policies to improve the atmospheric environment and address climate change.
Since the early 1990s, with the rapid development of remote sensing technology, satellites have increasingly been used for fire monitoring [13,14]. For instance, the Moderate Resolution Imaging Spectroradiometer (MODIS) and Visible Infrared Imaging Radiometer Suite (VIIRS) have shown great potential in monitoring active fires to diagnose their spatiotemporal variations [15,16,17]. With over 20 years of active fire products such as the MODIS Collection 6 (C6) [18,19], these products have made important contributions to estimating the location, range, frequency, and intensity of active fires [20,21]. Since the 21st century, MODIS active fire products have been applied widely to study global fire events [22,23], such as fire condition monitoring, economic damage assessment [24], air pollution evaluation [25,26], and climate change simulation [27]. However, the issue of the characteristics, types, and drives of fire occurrences is always a challenge and varies distinctively worldwide. For example, the Asia-Pacific region including China is the most frequent region of natural disasters (e.g., fires) in the world.
China, as a country with complex and diverse physical geography and climate conditions, is a typical and vulnerable region of active fires. The main source of active fires in China is cropland fires (e.g., open field burning of crop straw), followed by forest fires [28]. Meanwhile, China has the world’s largest crop production and a major agricultural country [28]. In particular, cropland fires are common during spring planting and autumn harvest to remove straws (i.e., straw burning) for subsequent cultivation [29]. Currently, straw burning is widespread in major farming areas in China, for example, in the Northeast Plain, North China Plain, and Middle and Lower Yangtze Plain [2,30,31]. Forest fires also occur frequently in China, mainly in the northeastern, southwestern, and southeastern forest regions [32,33,34]. For instance, from 1965 to 2010, thousands of forest fires happened in Daxinganling, in the northeast of China. Among them, the total of burned forest area was up to 35,230.19 km2 [35]. To date, many scholars have conducted extensively research on fires in China, including fire detection algorithms. However, most of the studies focused on the distribution of fires in a short time or a small regional scale and focused on the analysis of environmental pollution caused by a single type of fire [36,37,38]. In particular, there is still a lack of clear and in-depth understanding of the distribution, temporal, and spatial pattern and regional differences in active fire spots on a national scale and long time series. Not coincidentally, MODIS C6 active fire products (1 km, Collection 6) released in 2001 provide an opportunity to monitor the dynamics and regional differences in active fires.
Here, using MODIS C6 active fire products (2001–2020), we analyzed the occurrence frequencies and spatiotemporal differences in active fires at the provincial and regional to national scales and at the monthly and annual scales in China. Our study will provide data support and a scientific basis for discussing the causes and types of active fires in China, as well as making policies such as straw burning and forest fire prevention.

2. Study Area, Data, and Methods
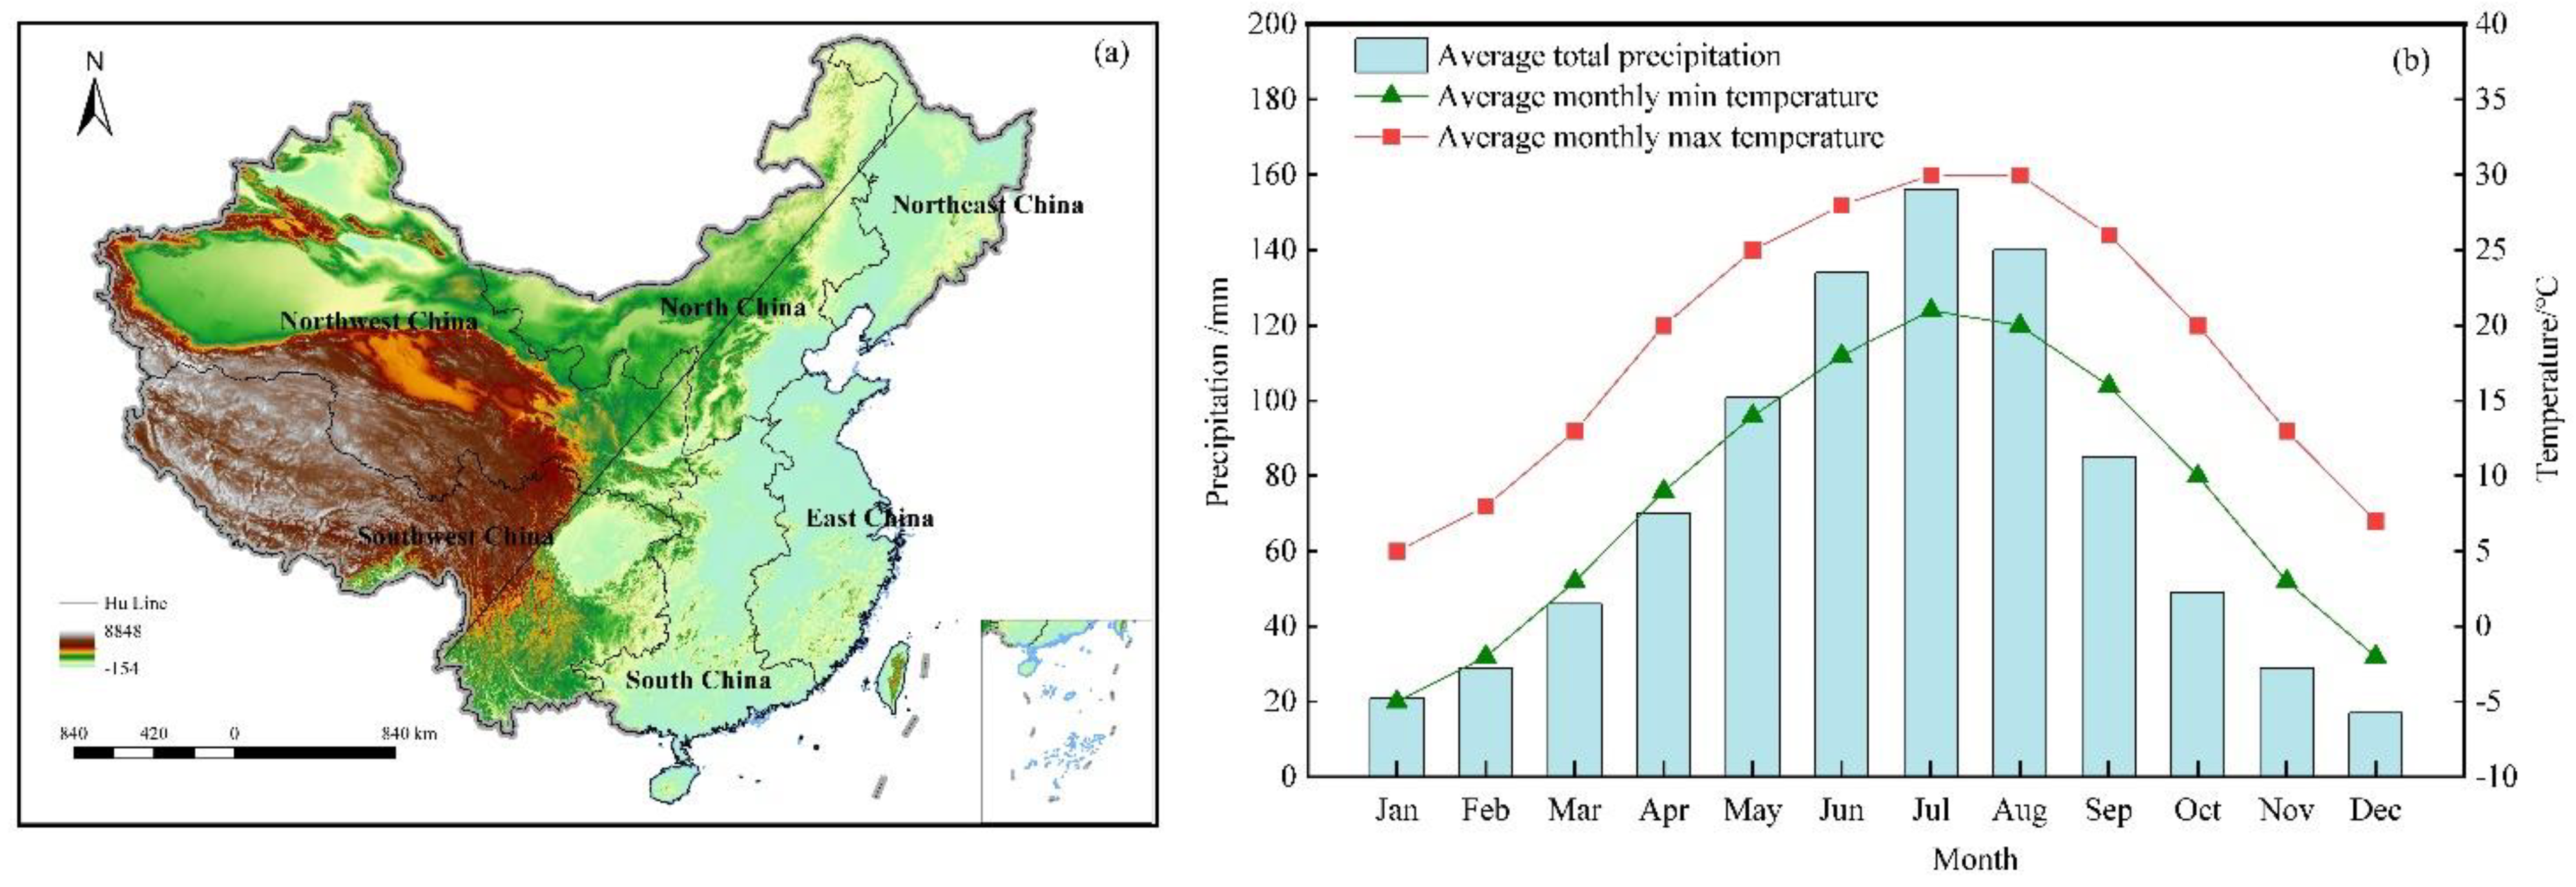
2.1. Study Area

China is located in the east of Asia and on the west coast of the Pacific Ocean, with a land area of about 9.6 × 10⁶ km2. China has a large latitude span and various geomorphological types with a complex climate (Figure 1). China’s climate is characterized by a monsoon climate with high temperatures and a rainy summer and a cold and rainy winter, and the high-temperature period is consistent with the rainy period (Figure 1b). China’s land cover types are also bounded by the “Hu Huanyong Line”, which mainly includes forests, grasslands, and farmland. Forests and farmland are mainly distributed in the east and grasslands are mainly distributed in the west. The Hu Huanyong Line, as the dividing line between the population development level and the socioeconomic pattern of China, starts from Aihui, Heilongjiang Province in the north and reaches Tengchong, Yunnan Province in the south. On the east side of the Hu Huanyong Line, which accounts for 43.18% of the country’s land area, 93.77% of the country’s population and 95.70% of the GDP are gathered. On the west side of the Hu Huanyong Line, the land is vast and sparsely populated, so the functions of developing the economy and gathering the population are weak. The complexity and diversity of the topography, climatic conditions, and ecosystems make China face enormous threats of natural disasters, such as frequent fires. At the same time, human activities and social development further aggravate the (re-)occurrence of natural disasters such as fires.
This study aims to better reflect the regional differences in and characteristics of active fires in China; thus, the entire country was divided into six regions (Figure 1a), including East China (the eight provinces Anhui, Fujian, Jiangxi, Jiangsu, Shandong, Shanghai, Taiwan, and Zhejiang), North China (the five provinces/regions Beijing, Hebei, Inner Mongolia, Shanxi, and Tianjin), Northeast China (the three provinces Jilin, Liaoning, and Heilongjiang), Northwest China (the five provinces/regions Gansu, Ningxia, Qinghai, Shaanxi, and Xinjiang), South China (the eight provinces/regions Hainan, Henan, Hong Kong, Hubei, Hunan, Guangdong, Guangxi, and Macao), and Southwest China (the five provinces/regions Chongqing, Guizhou, Sichuan, Tibet, and Yunnan).

2.2. MODIS Active Fire Datasets and Preprocessing

MODIS C6 active fire products, furnished by means of the Fire Information for Resource Management System (FIRMS), are in three formats, namely, the Shapefile (.shp), Google Earth Keyhole Markup Language, and Comma-Separated Text (.csv) [39]. These products additionally furnish associated records on active fires such as the timing and dates of occurrences (e.g., second/minute/hour), locations (i.e., latitude and longitude), and confidence levels as well as fire radiative power [1]. The MODIS C6 is mainly processed according to the standard active fire and over fire area products obtained by Terra and Aqua satellites. The revisiting period of the near-equatorial double-star combination is 4 times/d, and the daily observation times increase from low latitude to high latitude. The Terra satellite passes through the equator at 10:30 and 22:30 Greenwich Mean Time (GMT) every day, and the Aqua satellite, at 1:30 and 13:30 (GMT) every day, ensuring observation at least four times a day. MODIS C6 active fire products are responsible for the longest fire records at a global scale [40]. Since the beginning of the 21st century, MODIS fire products have been used widely in the research of global fire events for many years [22,23] and are very suitable for the study of dynamic changes in long time series. In this paper, we mainly used the fire collection, date, time, and location information corresponding to the active fire products to analyze the occurrence frequencies and spatiotemporal differences in active fires in China, which have been analyzed since 2001 based on ArcGIS 10.x (https://www.arcgis.com/index.html: accessed on 1 March 2022). The Geographic Information System (GIS) is a computer system for inputting, storing, querying, analyzing, and displaying geographic data. The MODIS C6 fire products used in China (Shapefile format) during 2001–2020 were ordered, bulk processed, and downloaded for analysis from the NASA FIRMS portal (https://firms.modaps.eosdis.nasa.gov/download/: accessed on 1 March 2022).
Based on the MODIS C6 fire products, the fire occurrence frequencies of different spatiotemporal scales from 2001 to 2020 were calculated. We initially used the total fire counts to analyze interannual variations and to reveal the spatial differences in fire occurrence frequencies or intensities nationally as well as in the six different regions, namely, East China, North China, Northeast China, Northwest China, Southern China, and Southwest China, respectively. Annually and monthly available active fire counts were then further used to display temporal variations and regional differences. Finally, spatiotemporal changes in the occurrence frequencies of active fires in three typical areas (i.e., Heilongjiang, Anhui, and Yunnan) were finally analyzed.

3. Results and Analysis

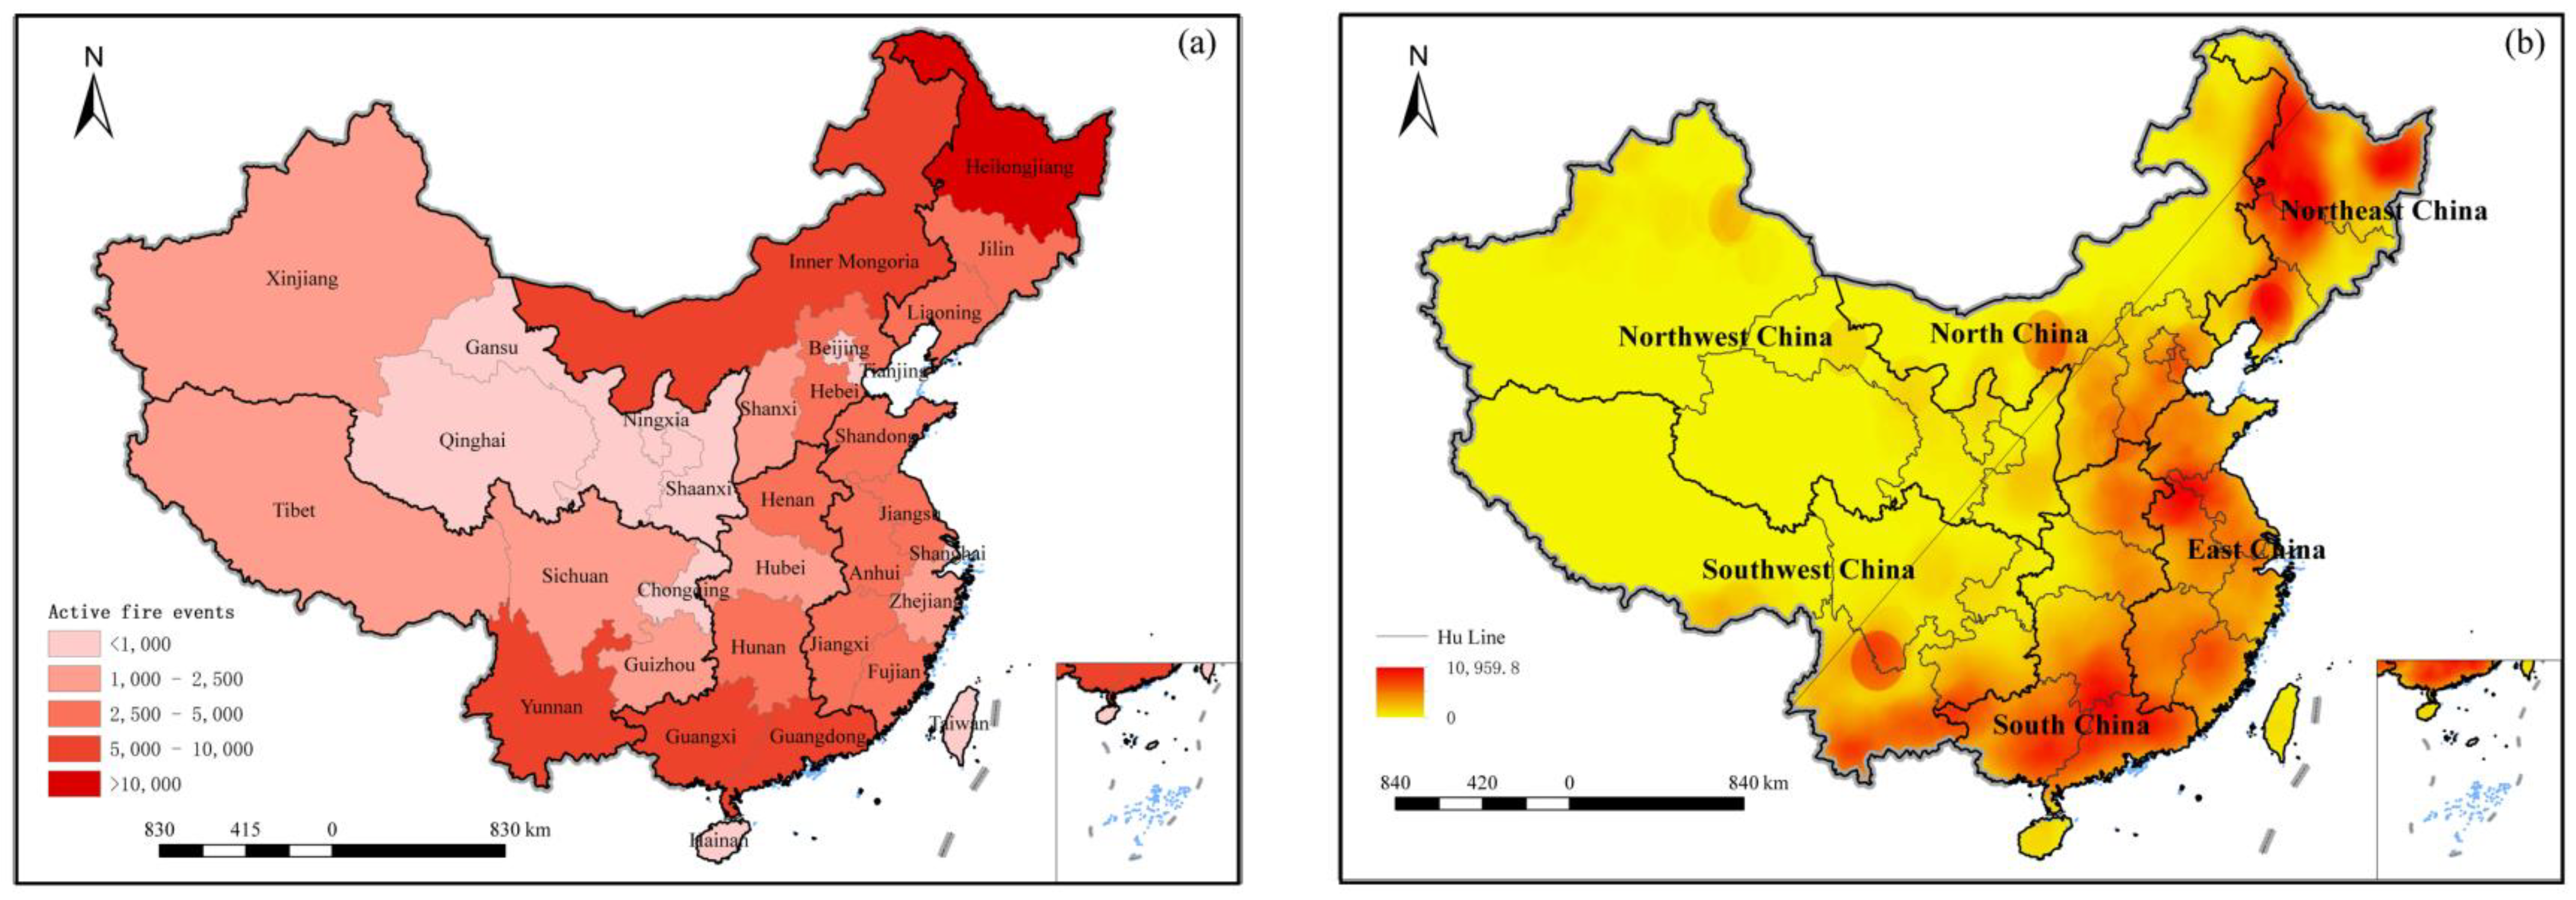
3.1. Spatial Characteristics of Active Fires in China

The 20-year (2001–2020) sum of active fire occurrences was as high as 184.91 × 10⁴ in China based on the MODIS data products. Comparative analyses indicated that the cumulative frequency of active fires in Northeast China, South China, East China, North China, Southwest China, and Northwest China in 2020 was 2.51 × 10⁴, 1.17 × 10⁴, 1.22 × 10⁴, 1.53 × 10⁴, 1.13 × 10⁴ and 0.62 × 10⁴, respectively, accounting for 30.62%, 14.25%, 14.97%, 18.70%, 13.87% and 7.59%, respectively.
From the provincial scale (Figure 2a), Heilongjiang was the province with an average annual active fire number of more than 10,000 in the last 20 years. There were four provinces with an average annual number of active fires of 5000–10,000, namely, Yunnan, Inner Mongolia, Guangdong, and Guangxi, in sequence. There were ten provinces with an average annual fire number of 2500–5000, which were Hunan, Jilin, Anhui, Liaoning, Hebei, Shandong, Jiangxi, Henan, Fujian, and Jiangsu. There were seven provinces with an average annual fire number of 1000–2500, which were Sichuan, Xinjiang, Shanxi, Hubei, Guizhou, Zhejiang, and Tibet. Furthermore, the average annual number of active fires in the other 12 provinces was below 1000. The statistical results showed that there were fifteen provinces with more than 2500 annual active fire spots, accounting for 80% of the whole country, mainly distributed in Northeast China, South China, and East China. The yearly average number of active fires in Heilongjiang ranked first, reaching 1.55 × 10⁴ and accounting for 16.72%, followed by Yunnan and Inner Mongolia, with an average number of active fires per year being 0.66 × 10⁴ and 0.64 × 10⁴ and accounting for 7.11% and 6.91%, respectively. The six regions showed that the active fire spots were mainly concentrated in Northeast China, South China, and East China, while the active fire spots in Northwest China were few.
Spatially, more than 90% (166.39 × 10⁴) of active fires in China were distributed in the area east of the Hu Huanyong Line (Figure 2b). Notably, the occurrence and development of active fires are highly correlated with human activities and socioeconomic level. The MODIS C 6 active fires from 2001 to 2020 were mainly distributed in the following areas: (1) The hinterland of Daxinganling and the Northeast Plain, especially in the west and northeast of Heilongjiang, the west of Jilin, and the middle of Liaoning; (2) the North China Plain, especially the Huanghuai Plain (e.g., northern Anhui); (3) the southeast hills, especially in Guangdong, eastern Guangxi, and southern Hunan; (4) the Yunnan–Kweichow Plateau, most of southern Yunnan, and parts of northern Yunnan. It can clearly be found that these areas are mainly grain-producing areas (e.g., rice paddy, maize, and wheat) and/or important forest areas in China.

3.2. Temporal Characteristics of Active Fires in China

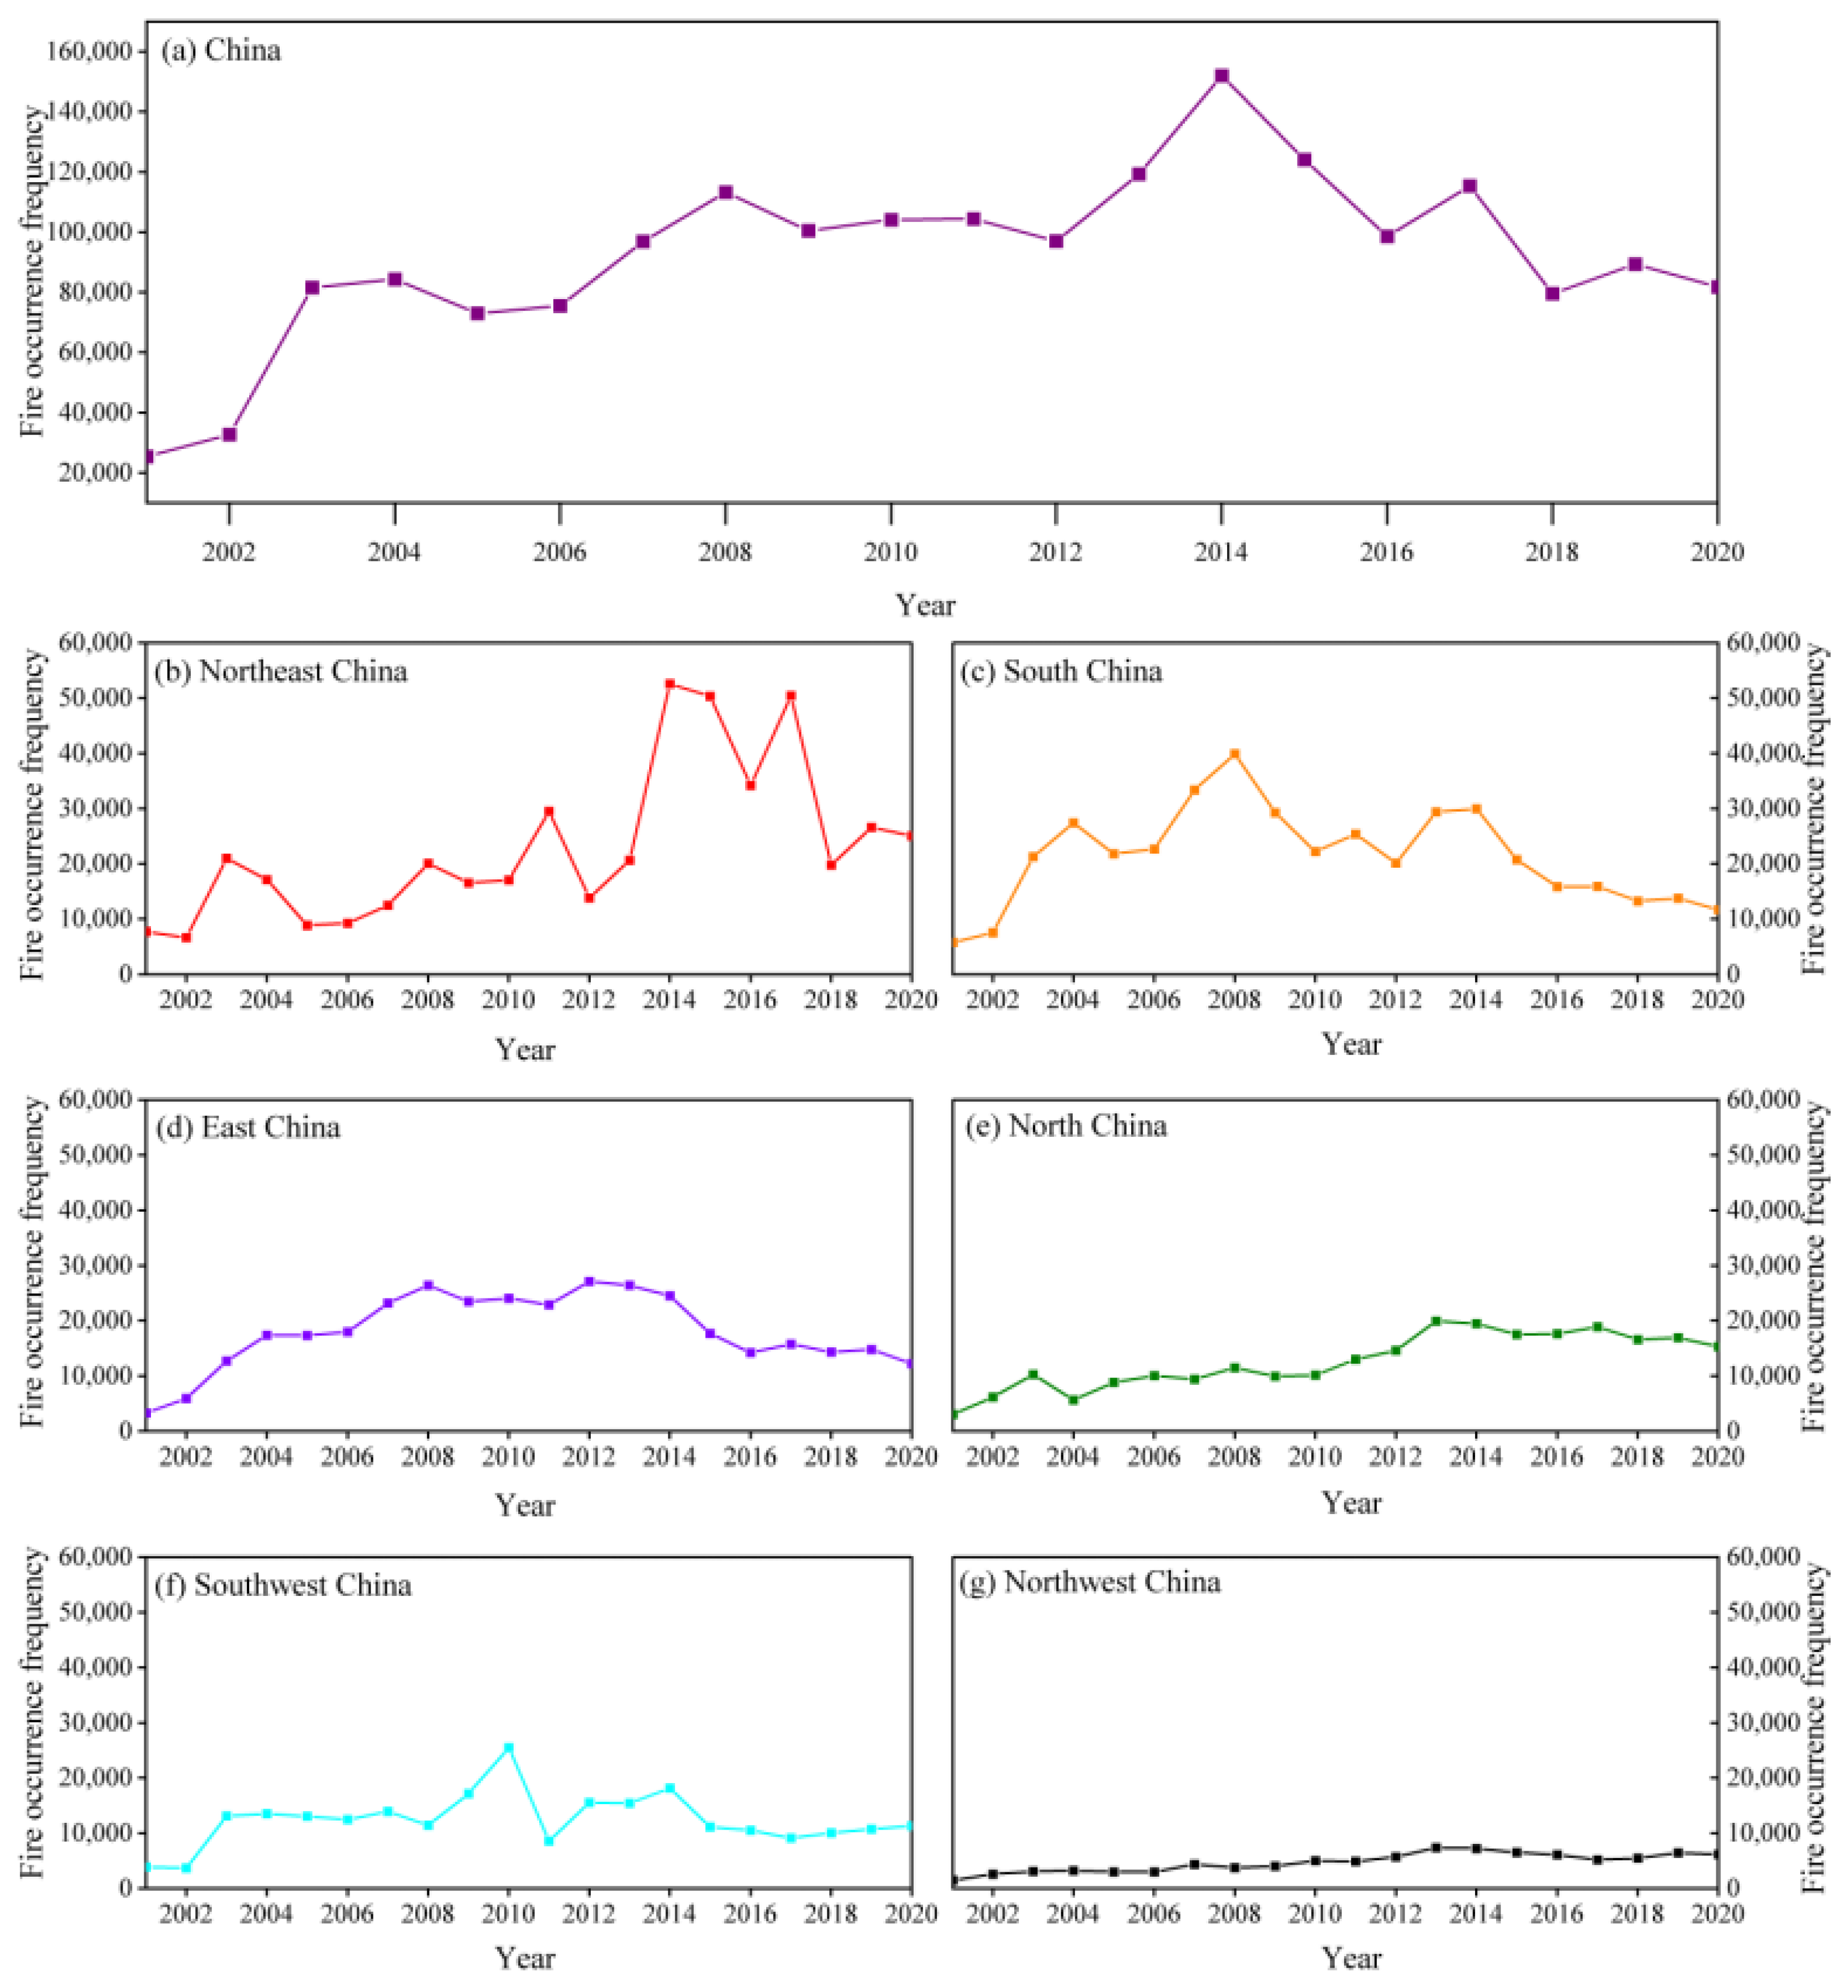
3.2.1. Annual Analyses

Temporally, Chinese active fires showed significant annual changes from 2.54 × 10⁴ in 2001 to 8.18 × 10⁴ in 2020, with an annual average of approximately 9.246 × 10⁴. According to Figure 3a, the active fires in China have maintained a trend of first increasing and then decreasing during 2001–2020. More importantly, between the maximum frequencies of active fires in China and the El Niño event from 2014 to 2016, the time consistency was found coincidentally [41]. It can therefore be inferred that a peak fire number (15.20 × 10⁴) was seen in 2014, closely connected with the strong El Niño phenomenon [42], which usually causes severe droughts and little rainfall and provides convenience for the (re-)occurrence and development of active fires such as straw burning and forest wildfires [43]. It is noted that the frequency of active fires decreased significantly after 2014, which has a lot to do with the increasing emphasis on the straw burning ban at the national level. For example, the National Development and Reform Commission of China issued the “Notice on Further Accelerating the Comprehensive Utilization of Crop Straw and Banning of Crop Burning” in 2015 [2].
From the regional scale of view, according to MODIS C6 active fire products, there were obvious regional differences in six regions of China during 2001– 2020. As far as the cumulative frequency of active fires, the average proportions of Northeast China, South China, East China, North China, Southwest China, and Northwest China were 24.88%, 23.12%, 19.57%, 13.80%, 13.46%, and 5.13%, respectively. Since 2001, active fire occurrences of 46.00 × 10⁴ occurred in Northeast China, showing significant annual changes, with an annual average of approximately 2.30 × 10⁴. The active fires in Northeast China have been increasing at first and then decreasing and a peak fire number (5.26 × 10⁴) was in 2014 (Figure 3b), which was consistent with the whole country. It showed that active fire events in Northeast China played a very important role in China. The active fires in Northeast China were additionally affected by the El Niño phenomenon and the straw burning ban. Notably, the active fires in Northeast China rebounded in 2017, reaching 5.05 × 10⁴. The research showed that due to the extremely cold weather in winter, after the autumn harvest in 2016, a large number of crop straws in the Northeast Plain was difficult to degrade naturally, and the centralized burning was postponed until the following spring [35]. Therefore, the policy of comprehensive utilization measures of straw should be strictly implemented and popularized to control the rebound trend of crop straw burning in recent years.
In the same period, the cumulative frequency of active fires in South China reached 42.74 × 10⁴, which was second only to Northeast China (2.30 × 10⁴). According to Figure 3c, the average annual frequency of active fires in South China has been about 2.14 × 10⁴, and the overall trend has first increased and then decreased, with a peak fire number (3.99 × 10⁴) seen in 2008. Compared with Northeast China, the active fires in South China have been declining since 2009. The reduction in fires may be closely related to the local fire management policy of China [34]. The 20-year sum of active fire occurrences was 36.19 × 10⁴ in East China, showing significant annual changes, and the overall trend first increased and then decreased (Figure 3d) with a peak fire number (2.71 × 10⁴) seen in 2012. With the release of the State Council’s “Air Pollution Prevention and Control Action Plan” in 2013, the policy of prohibiting straw burning in East China was introduced on a large scale, and the number of active fires showed a downward trend [2]. During 2001–2020, the total occurrences of active fires amounted to 25.52 × 10⁴ in North China, with an annual average of approximately 1.28 × 10⁴. The active fires in North China have maintained an increasing trend with a peak number of fires (1.99 × 10⁴) in 2013 (Figure 3e). As the main area of North China, the North China Plain is an important agricultural production base in China, with dense straw burning sites, and its overall active fires increased year by year, which deserves high attention. The cumulative frequency of active fires in Southwest China was 24.89 × 10⁴, which was generally low (Figure 3f). The two frequency peaks in 2010 and 2014 were in the characteristic years of the El Niño phenomenon, while the other years were relatively stable and had no obvious regularity. The land in Southwest China was covered by major forests, which provide convenience for the occurrence and development of forest fires [9]. Moreover, the frequency of active fires in Northwest China has been the lowest, accounting for less than 6% in the past 20 years, but it has been on the rise (Figure 3g).

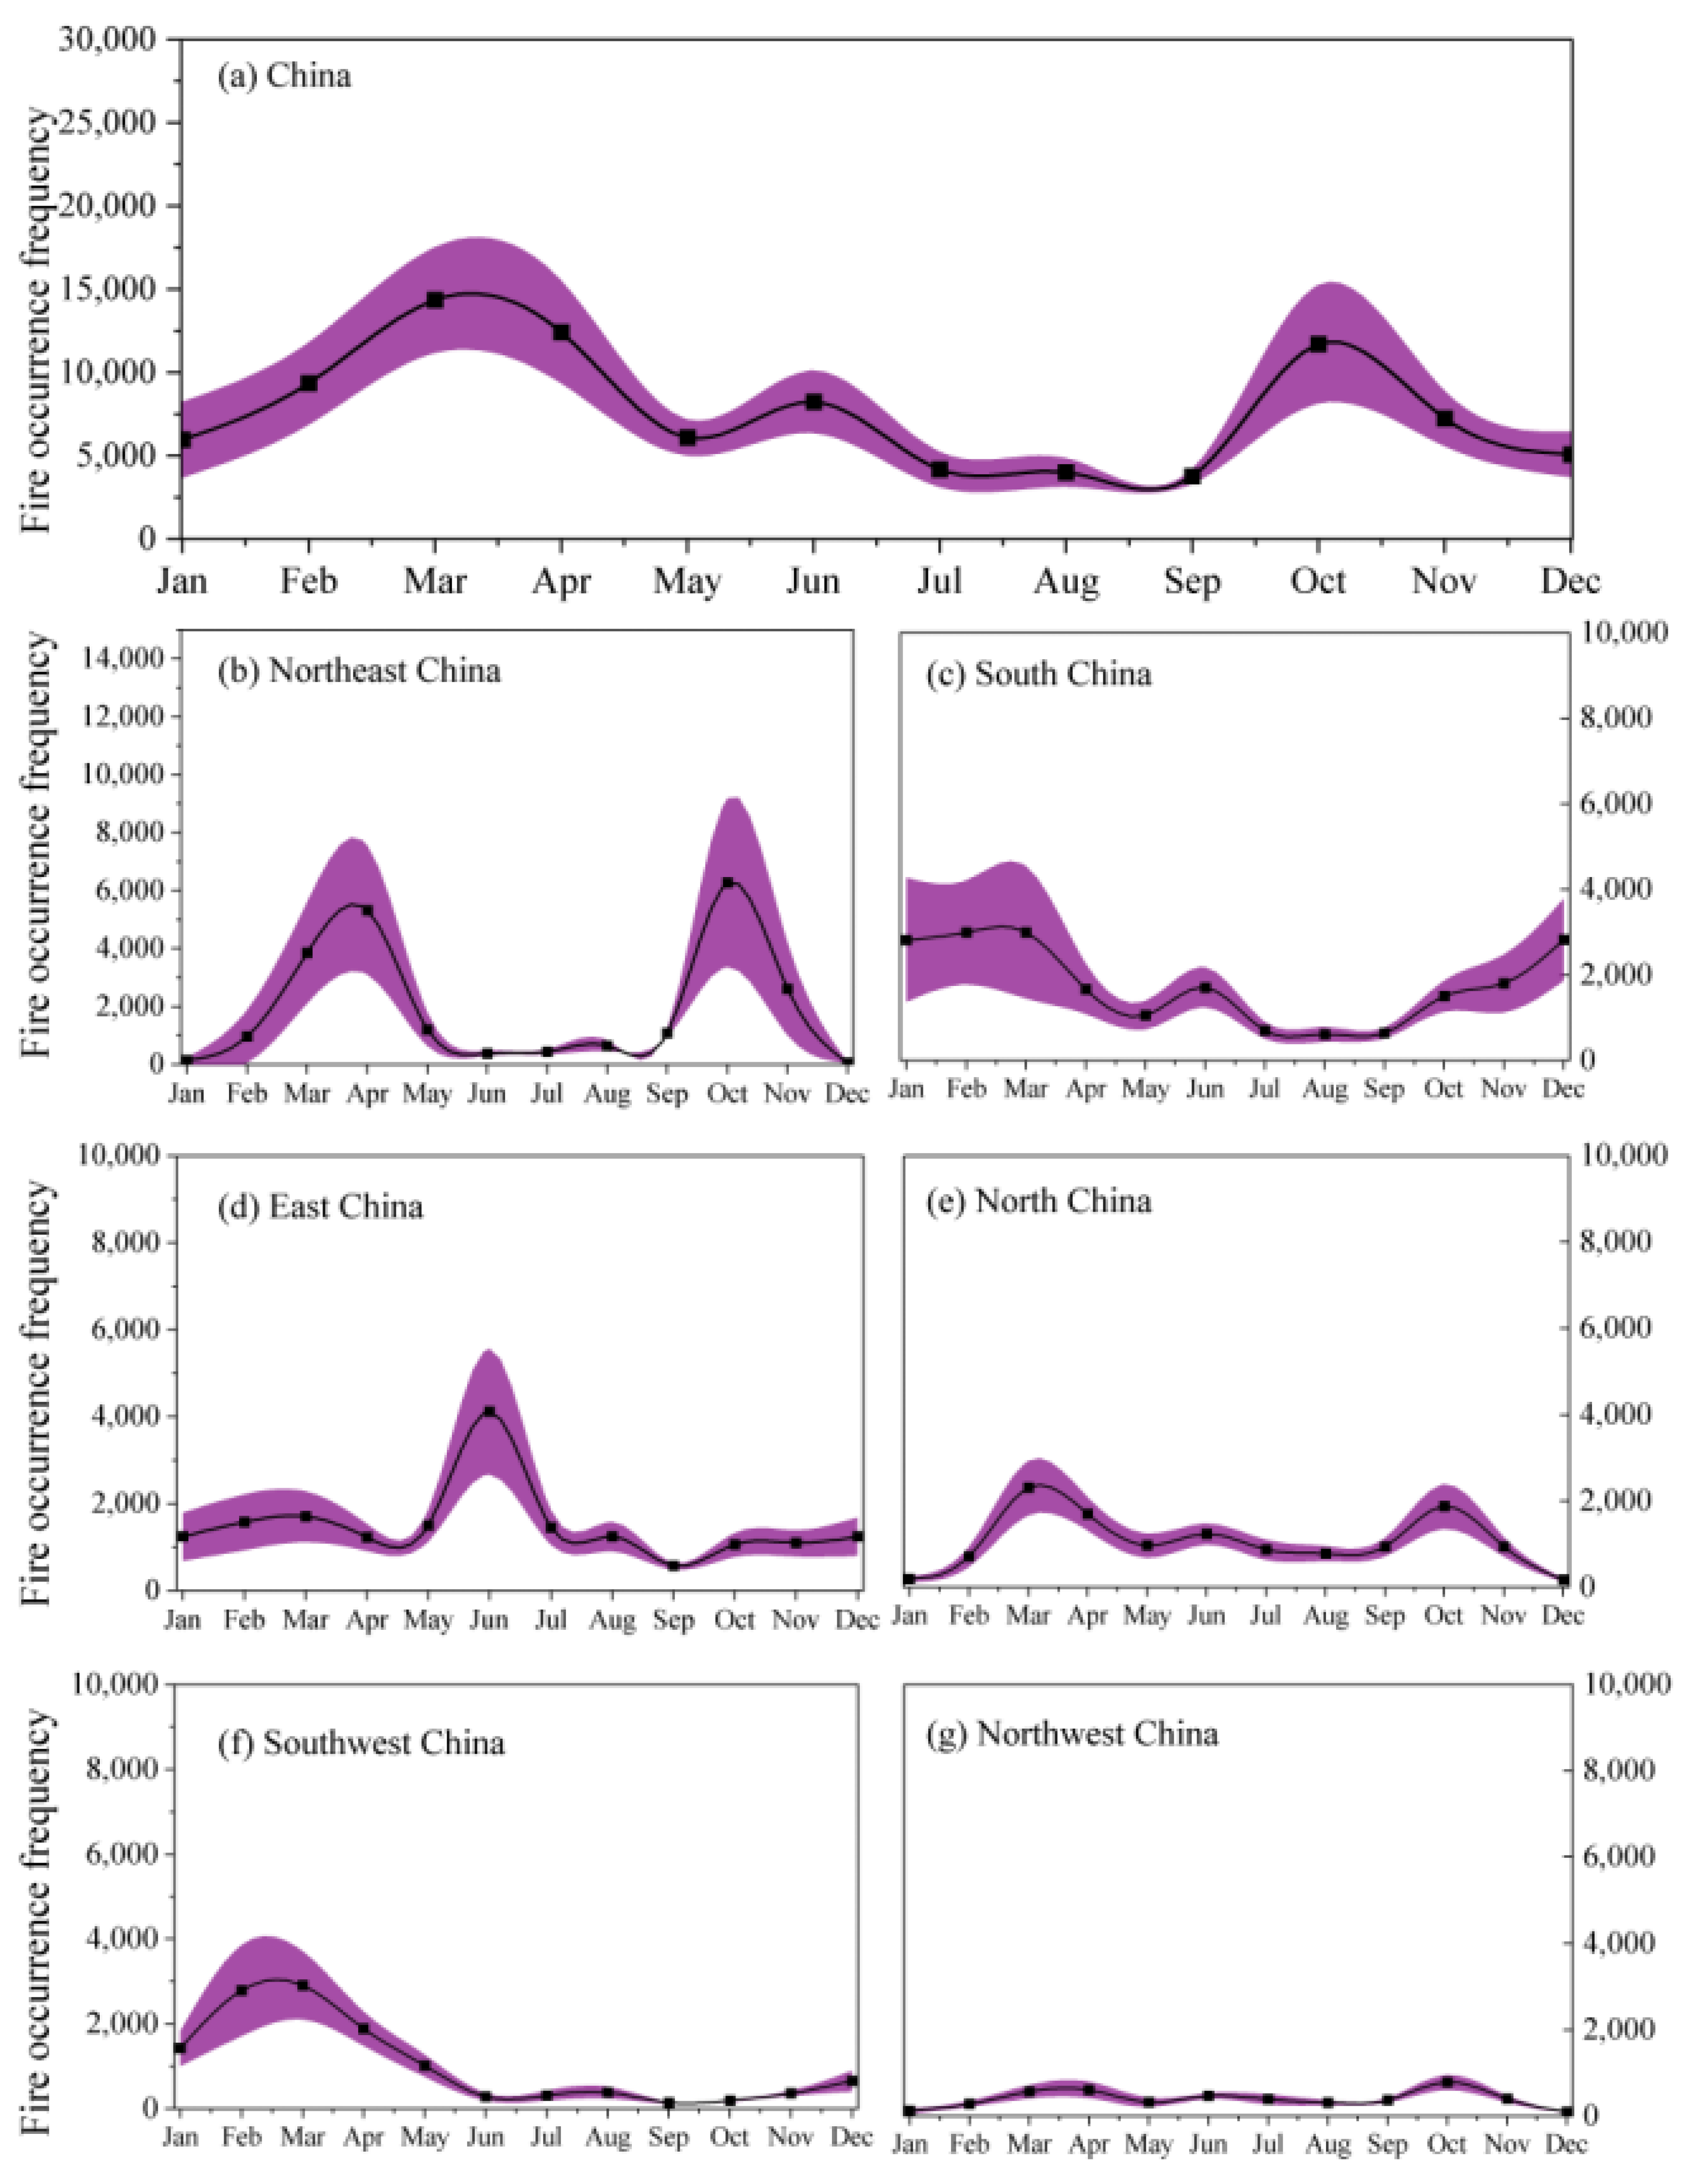
3.2.2. Monthly Analyses

Compared with the annual analysis, the monthly average occurrence frequencies of active fires were about 7.70 × 10³, 1.92 × 10³ (24.88%), 1.78 × 10³ (23.12%), 1.51 × 10³ (19.57%), 1.06 × 10³ (13.80%), 1.04 × 10³ (13.46%), and 0.40 × 10³ (5.15%) throughout this study period in China, Northeast China, South China, East China, North China, Southwest China, and Northwest China, respectively. Active fires in China tended to be relatively temporally concentrated in spring and autumn during 2001–2020, especially within March (15.53%), April (13.45%), and October (12.67%) (Figure 4a).
At the six regional scales, the frequencies of active fires in Northeast China, North China, and Northwest China were consistent with the whole country, showing the characteristics of high incidence in spring and autumn, concentrated in March, April, and October (Figure 4). Specifically, in Northeast China, October (27.27%) was the highest, followed by April (23.11%) and March (16.75%) (Figure 4b). In North China, March (18.12%) was the highest, followed by October (14.75%) and April (13.36%) (Figure 4e). In Northwest China, October (16.55%) was the highest, followed by April (12.92%) and March (11.92%) (Figure 4g). Compared with North China and Northwest China, Northeast China had strong seasonality, with nearly 70% of active fire spots, which were concentrated in March, April, and October. On the one hand, the low temperature in winter in Northeast China led to a long period of snow accumulation and more precipitation in summer, which made the air very humid, resulting in almost no fire spots in winter and summer. On the other hand, in Northeast China, spring and autumn are the driest seasons, with strong winds and little precipitation, which leads to the greatest risk of forest fire. Straw burning often occurred in farmland [28], especially in the Sonnen Plain, Liaohe Plain, and Sanjiang Plain, which are important farming areas in China and led to concentrated fire spots in spring and autumn.
The frequencies of active fires in South China and Southwest China were concentrated from December to April of the following year, showing a high incidence in spring and autumn. Specifically, in South China, March (14.04%) was the highest, followed by February (14.02%), December (13.24%), and January (13.22%) (Figure 4c). In Southwest China, March (23.43%) was the highest, followed by February (22.48%) and April (15.24%) (Figure 4f). The results showed that Southwest China had strong seasonality, with nearly 60% of active fire spots, which were concentrated from February to April. Active fire spots in Southwest China were mainly distributed in most parts of Yunnan, southwest Guizhou, and southern Sichuan. The climate of these places is a subtropical monsoon climate, which is completely different from that in Northeast China, and the temperature changes only a little in all seasons. In addition, the land cover in this area is mainly semi-humid, evergreen, broad-leaved forest, and its fire risk rating is serious during the winter and spring.
The frequencies of active fires in East China were characterized by a high incidence in summer, which occurred in June (Figure 4d), accounting for nearly 1/4 of the total number of fires in the whole year, especially in the Huanghuai Plain at the junction of Shandong, Anhui, and Jiangsu. East China is an important farming area of China and its land cover type is mainly farmland. Among them, winter wheat is one of the most important crops in this area. The peak of active fire in June was closely related to the winter wheat harvest [28]. To increase the soil fertility of the next tillage, many wheat stubbles were burned after harvest.

3.3. Analysis of Active Fires in Typical Provinces of China

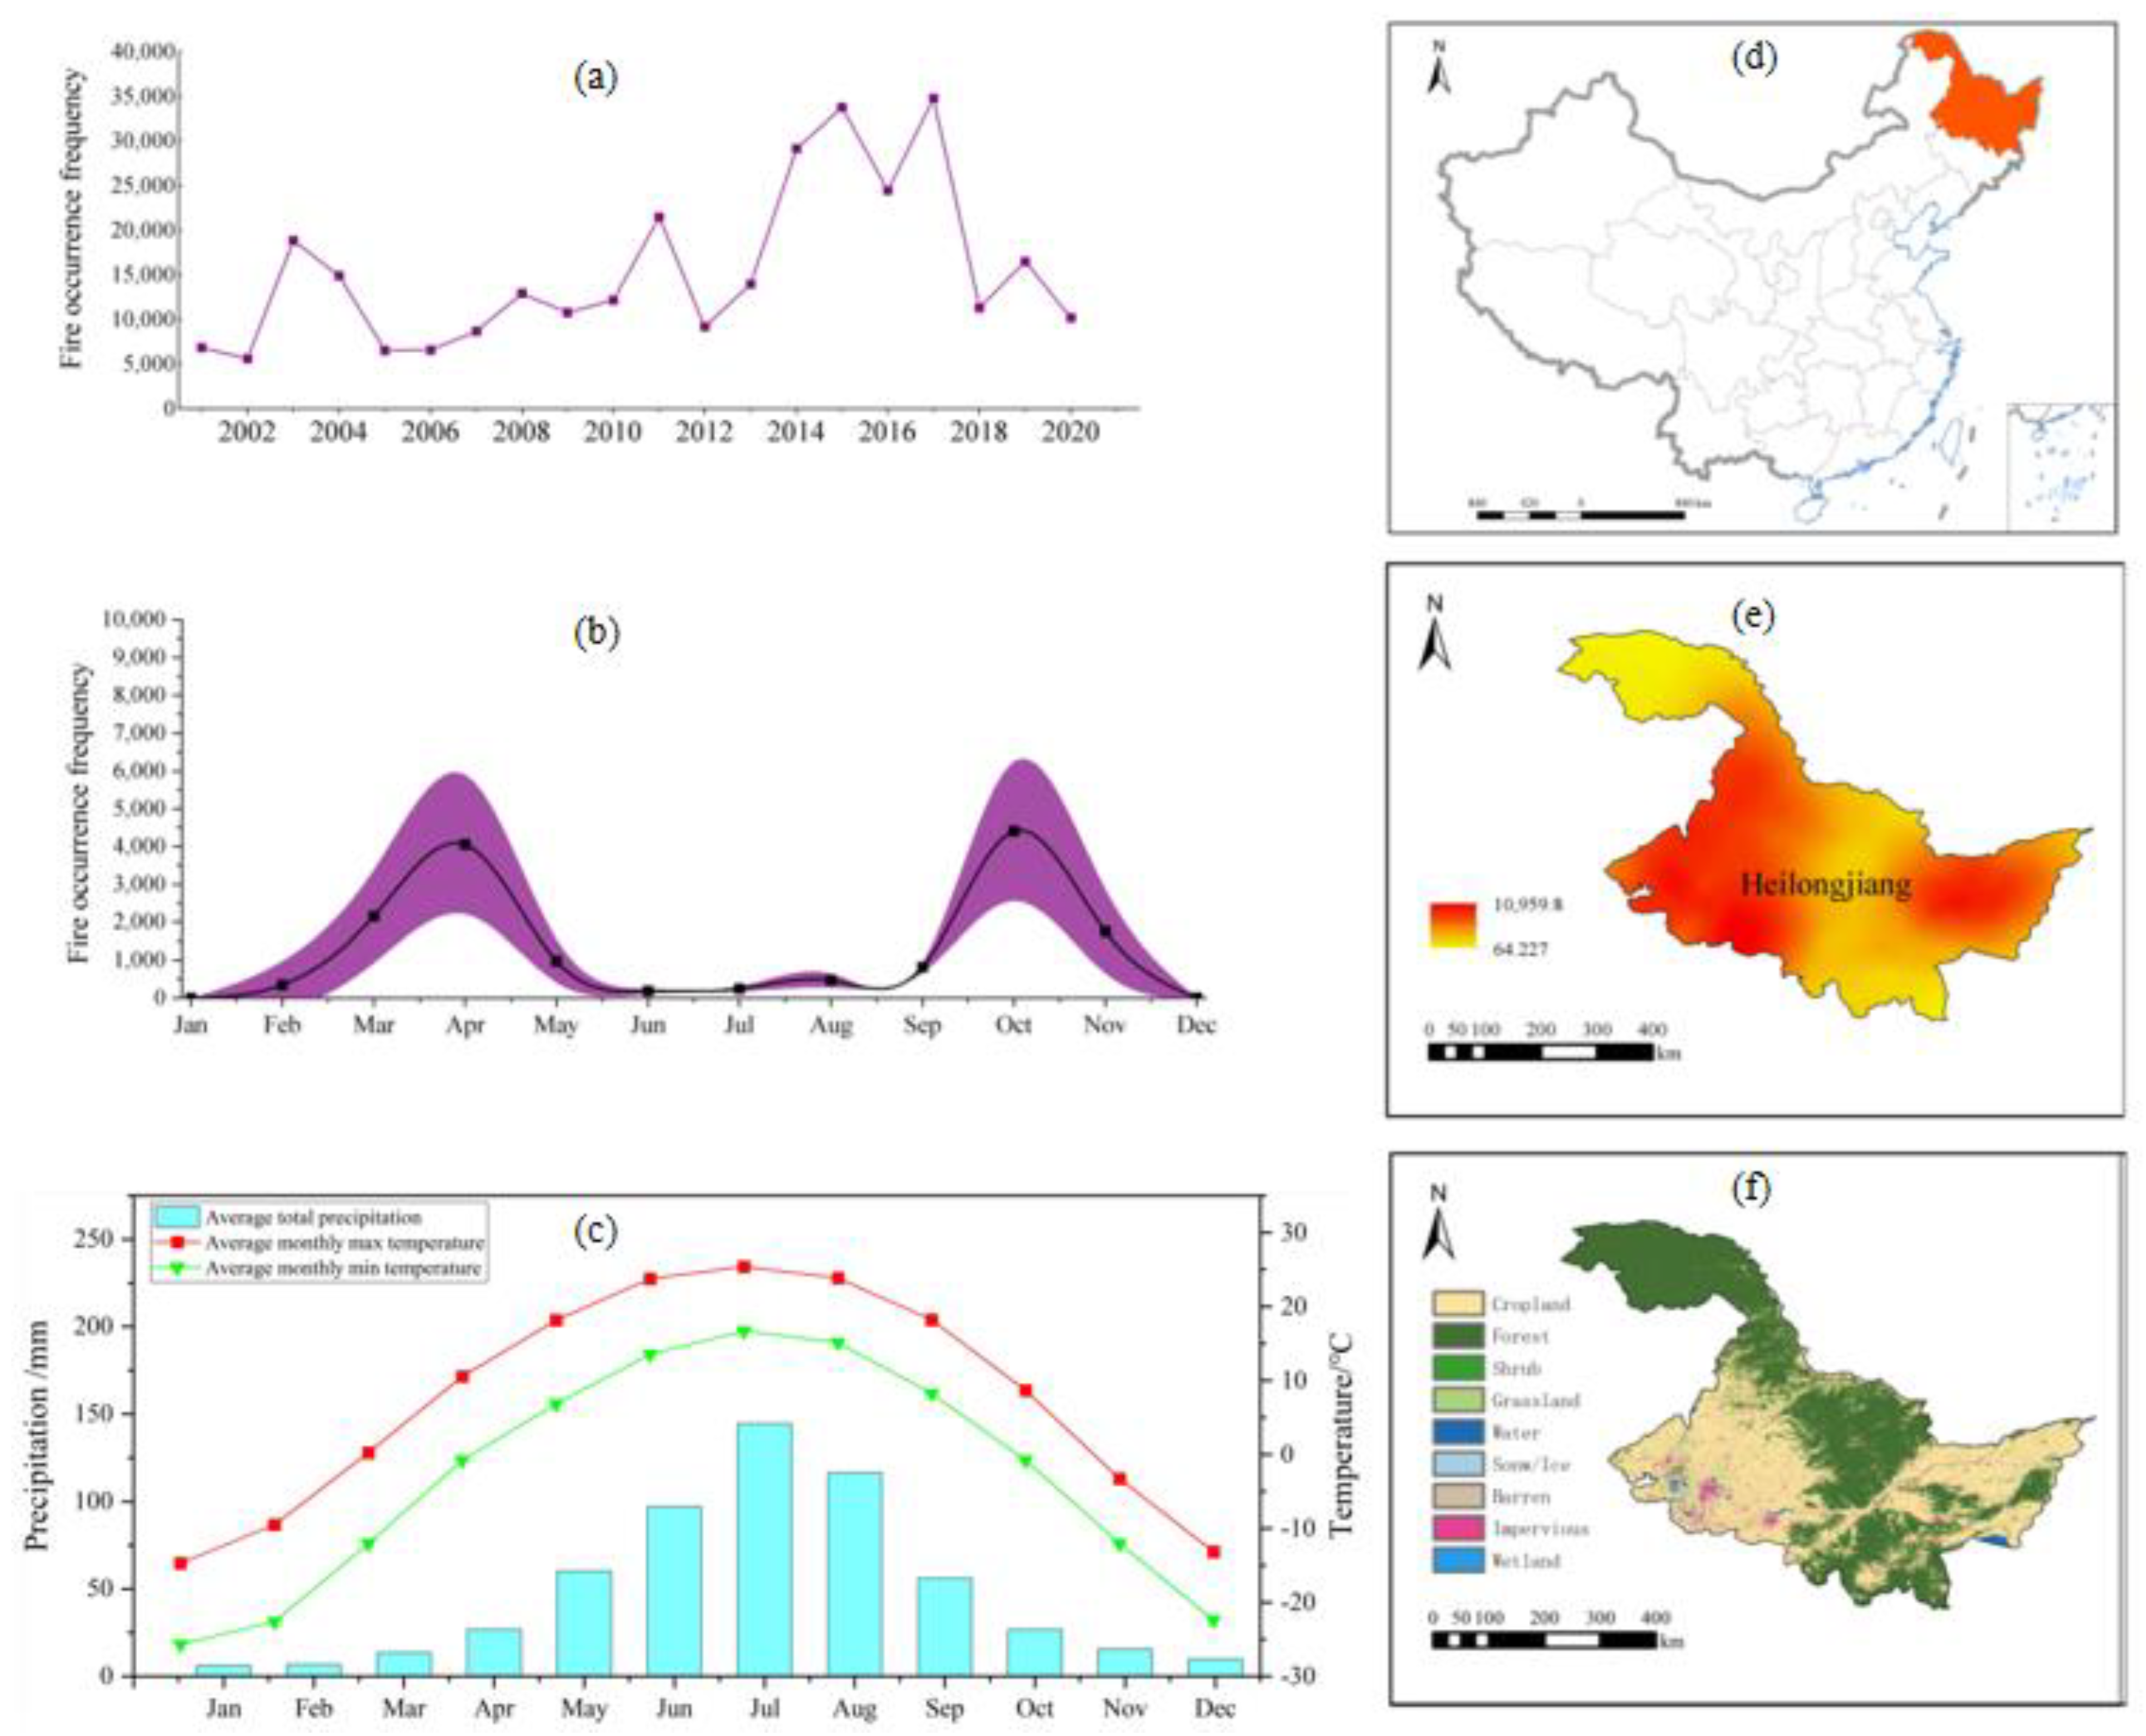
3.3.1. Spatiotemporal Patterns of Active Fires in Heilongjiang Province

From 2001 to 2020, the cumulative frequency of active fires in Heilongjiang Province reached 30.91 × 10⁴, accounting for 67% of Northeast China, mainly distributed in the Sanjiang Plain, Songnen Plain, and Daxinganling area (Figure 5e). Heilongjiang has vast farmland and virgin forests (Figure 5f), which provide abundant combustible materials for open fires and are easily affected by human activities and an arid climate, especially in spring and autumn [33]. In the past 20 years, the annual average frequency of active fires in Heilongjiang Province was about 1.55 × 10⁴, which was consistent with the trend in Northeast China and generally showed a trend of first increasing and then decreasing, but the highest peak was 3.48 × 10⁴ in 2017 and the second peak was 3.38 × 10⁴ in 2015 (Figure 5a). In recent years, the growing area of grain crops in Heilongjiang Province has been expanding, which has led to a continuous increase in the total amount of straw burned in the open air in spring and autumn [44], making the active fire point reach the first peak in 2015. In 2016, Heilongjiang Province intensively introduced the straw burning ban, which resulted in a decrease in the total number of active fires. This included, for example, the “Notice of the General Office of the People’s Government of Heilongjiang Province on Printing and Distributing the Implementation Plan of Banning Burning Straw in the Field to Improve the Quality of Atmospheric Environment in Heilongjiang Province”. However, due to the extreme cold weather in Heilongjiang in winter 2017 [35] and the measures for the comprehensive utilization of straw not having been implemented and popularized at a large scale, a large amount of straw produced in the harvest period was not effectively treated, which led to a large-scale return to straw burning in 2017, reaching its highest level in history; after that, it began to decline significantly.
At the monthly level, the active fires in Heilongjiang Province were characterized by a high incidence in spring and autumn, mainly in October and April (Figure 5b). A large amount of dry biomass, especially fallen leaves, coupled with the high temperatures in spring and autumn, exacerbated the occurrence of wildfires (Figure 5d). At the same time, as a major agricultural province and the province with the highest grain output in China since 2011, the phenomenon of unauthorized open burning of straw during spring plowing and autumn harvest frequently occurred in Heilongjiang Province [44].

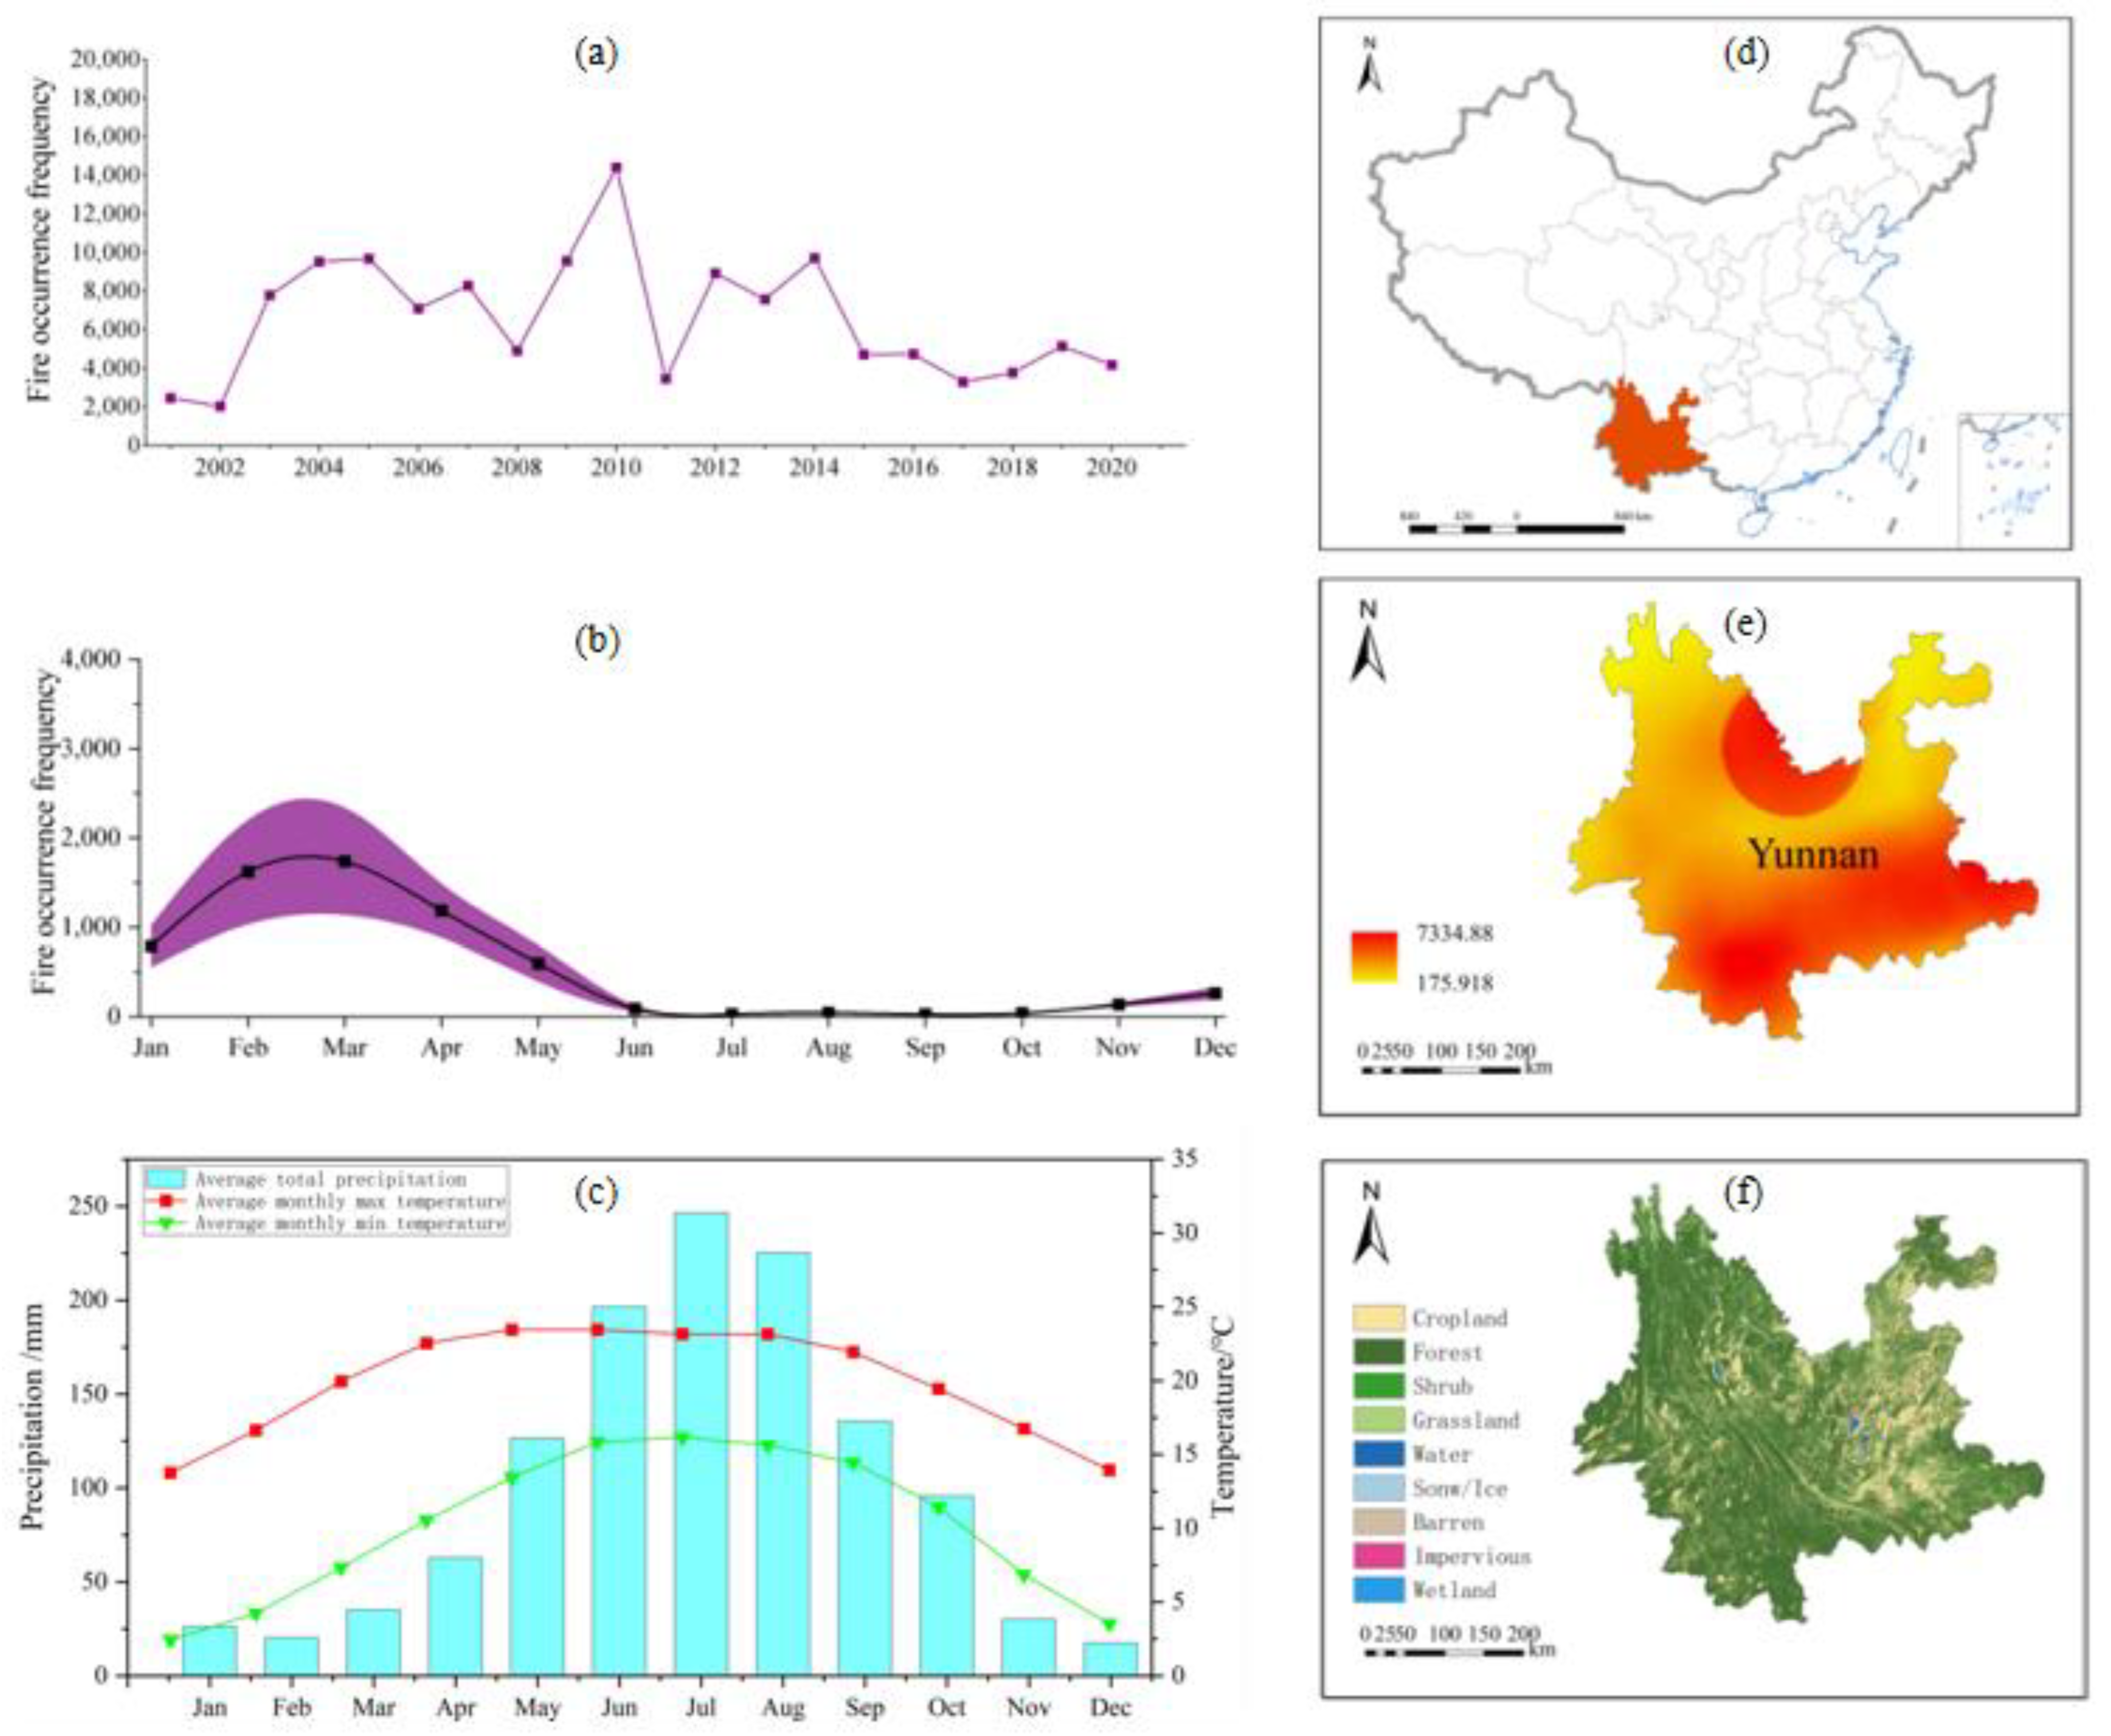
3.3.2. Spatiotemporal Patterns of Active Fires in Yunnan Province

According to MODIS C6 active fire data products statistics, the cumulative frequency of active fires in Yunnan from 2001 to 2020 reached 13.14 × 10⁴, accounting for 52.79% of Southwest China, mainly distributed in the forest areas in the southern and northern parts of Yunnan Province (Figure 6e). From 2001 to 2020, the annual average frequency of active fires in Yunnan Province was about 0.66 × 10⁴, which showed a general fluctuation trend, with the highest in 2010 (1.44 × 10⁴) and the smaller peaks in 2005 and 2014 (Figure 6a). It is worth noting that these years were the characteristic years of the El Niño phenomenon in the 21st century, which showed that the active fires in Yunnan Province were sensitive to the El Niño event. After 2015, the active fires in Yunnan Province decreased and remained at a low level due to the forest fire prevention policy. For example, the Standing Committee of Yunnan Provincial People’s Congress issued “Regulations on Forest Fire Prevention in Yunnan Province”. At the monthly scale, the active fires in Yunnan Province were characterized by a high incidence in spring and winter, mainly in between January and April (Figure 6b). The climate of Yunnan Province is a subtropical monsoon climate (Figure 6d) and the land cover is mainly forest (Figure 6f). The wet and dry seasons are distinct in Yunnan Province, and the wet season (rainy season) is from May to October, with 85% of concentrated rainfall. The dry season (dry season) is from November to April of the following year and precipitation only accounts for 15% of the whole year. In winter and spring, the climate is relatively dry and the temperature is high and thus, there is a lot of dry biomass, which makes fires more likely to occur [45].

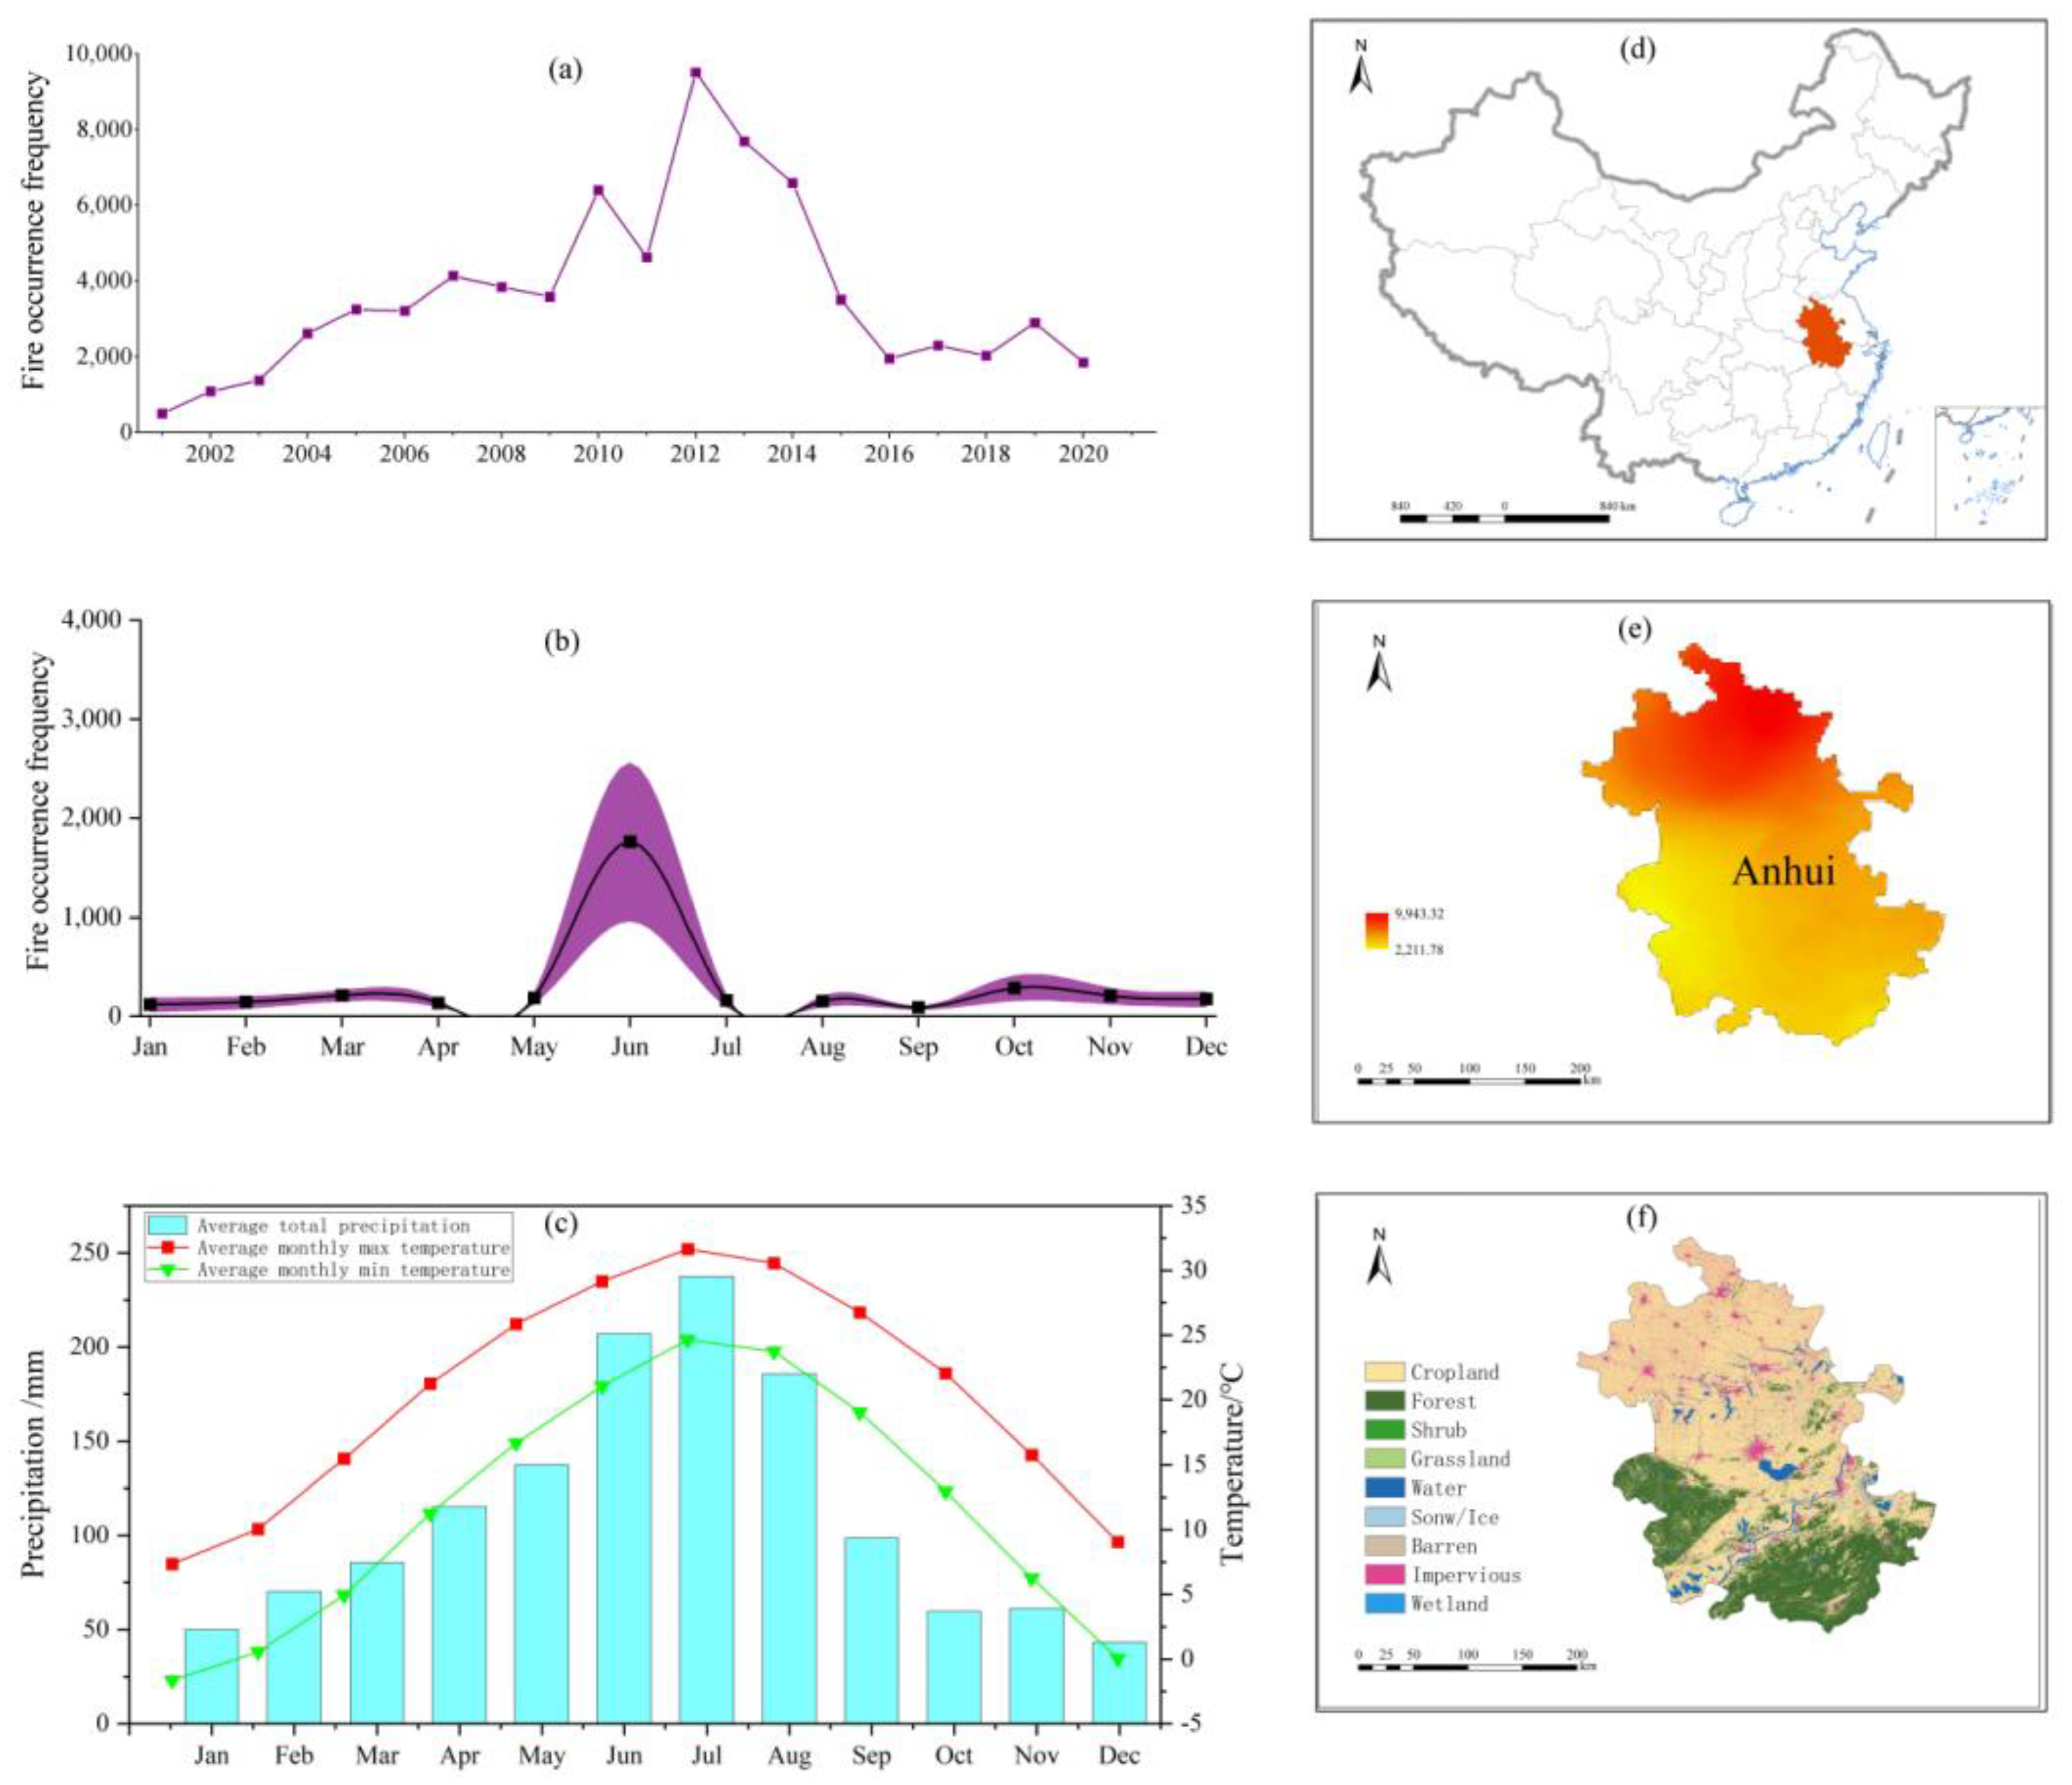
3.3.3. Spatiotemporal Patterns of Active Fires in Anhui Province

During 2001–2020, the cumulative frequency of active fires in Anhui Province reached 7.30 × 10⁴, mainly distributed in the agricultural area of the Huanghuai Plain (Figure 7e,f). From 2001 to 2020, the annual average frequency of active fires in Anhui Province was about 0.36 × 10⁴, which showed a general trend of first increasing and then decreasing, with the highest in 2012 (0.95 × 10⁴) (Figure 7a). Since the State Council issued the Air Pollution Prevention Action Plan in 2013, Anhui Province, as a major grain-producing province in East China, has closely followed the central policy and intensively introduced straw treatment policies. This has included, for example, the Implementation Opinions on Returning Crop Straw to the Field in 2014, the “Notice on Further Improving the Burning and Comprehensive Utilization of Straw” in 2015, and the Notice of the General Office of the People’s Government of Anhui Province on Doing the Burning and Comprehensive Utilization of Straw in 2016. Under the continuous influence of relevant policies, since 2013, the number of active fire occurrences in Anhui Province had been declining in a cliff-like way and had not rebounded. It can be seen that the straw treatment policies in Anhui Province effectively control the forms of straw burning in the province.
At the monthly level, the frequencies of active fires in Anhui Province were characterized by a high incidence in summer, mainly in June (Figure 7b), accounting for 48.25%. The harvest season of winter wheat in summer and the high concentration of active fires in June were closely related to straw burning in this area [46].

4. Conclusions and Discussion

In this study, using MODIS Collection 6 (C6) active fire products (2001–2020), we analyzed the occurrence frequencies and spatiotemporal differences in active fires at the provincial and regional to national scales and at the monthly, seasonal, and annual scales. The results revealed that the accumulated occurrence frequencies of MODIS C6 active fires in China were up to 184.91 × 10⁴, and the average annual level was 9.25 × 10⁴, especially in 2014 (15.20 × 10⁴). The overall trend of active fires was rising and then falling, but with significant spatial and temporal differences.
In terms of temporal level, nearly 61% of active fires occurred in spring (36%) and autumn (25%), particularly in August (16%), April (14%), and October (13%). Spatially, the frequencies of active fires in Northeast China, North China, and Northwest China were consistent with the whole country, showing the characteristics of a high incidence in spring and autumn, concentrated in March, April, and October. The frequencies of active fires in South China and Southwest China were concentrated from December to April of the following year, showing a high incidence in spring and autumn. The frequencies of active fires in East China were characterized by a high incidence in summer, which occurred in June. More importantly, more than 90% of active fires in China were distributed in the east of the Hu Huanyong Line in the last 20 years, particularly in Northeast China (25%), South China (23%), and East China (20%). Active fires were mainly distributed in the Northeast Plain, the North China Plain (particularly in the Huanghuai Plain), the southeast hills (especially in Guangdong, eastern Guangxi, and southern Hunan), and the Yunnan–Kweichow Plateau (most of southern Yunnan and parts of northern Yunnan).
Although this research has achieved some expected results, it still has some limitations. Firstly, the uncertainty of this study may come from the remote sensing data. Because the spatial resolution of MODIS products is 1 km, some active fire points may not have been detected because of rapid burning, cloud cover, or just because of limited spatial scale. Secondly, this study failed to combine the potential impacts of active fires with air quality, and further research is needed to quantify the potential impacts of active fires on different social, ecological, and economic issues at the national and regional scales. Therefore, more detailed remote sensing data are needed to monitor active fires. MODIS data are also an optical remote sensing product, and it is difficult for it to make observations effectively in rainy weather or severely hazy weather, which leads to the number of detected fires being less than the actual number of fires; this is also a traditional and difficult problem. In the future, we will pay attention to the following aspects. The scale and time differences in the active fires of the different vegetation types in China require further discussion. Moreover, comparative analyses of active fire occurrence frequencies at the provincial, regional, and national scales derived from VIIRS and MODIS sensors are necessary. Finally, it is necessary to further study the types, occurrence probabilities, and intensities of active fires in China.
Furthermore, the characteristics of active fires are closely related to natural factors (e.g., topography, climate (temperature, precipitation, wind speed), vegetation (NDVI)) and human factors (e.g., land cover, population density, road density, residential density). In the next step, we will further study the influence of natural and human factors on the characteristics of active fires and deeply explore the action and driving mechanism of the main influencing factors on the occurrence and development of active fires. Meanwhile, we will further study the environmental effects caused by active fires, including estimating the related emissions and assessing their effects on the ambient air quality at the national and regional scales.

Author Contributions

Conceptualization, Z.F. and C.X.; methodology, C.L.; software, C.L.; validation, C.L.; formal analysis, C.L.; investigation, C.L.; resources, C.L. and C.X.; data curation, C.L. and C.X.; writing—original draft preparation, C.L.; writing—review and editing, C.X.; visualization, C.L. and C.X.; supervision, Z.F. and C.X.; project administration, Z.F.; funding acquisition, Z.F. and C.X. All authors have read and agreed to the published version of the manuscript.

Funding

This research was funded by the Strategic Priority Research Program of the Chinese Academy of Sciences (XDA20010203) and the National Natural Science Foundation of China (42130508 and 42001226).

Data Availability Statement

Some or all data and models that support the findings of this study are available from the corresponding author upon reasonable request.

Conflicts of Interest

The authors declare no conflict of interest.

References

  1. Xiao, C.; Feng, Z.; Li, P. Active fires show an increasing elevation trend in the tropical highlands. Glob. Chang. Biol. 2022, 28, 2790–2803. [Google Scholar] [CrossRef] [PubMed]
  2. Huang, L.; Zhu, Y.; Wang, Q.; Zhu, A.; Liu, Z.; Wang, Y.; Allen, D.T.; Li, L. Assessment of the effects of straw burning bans in China: Emissions, air quality, and health impacts. Sci. Total Environ. 2021, 789, 147935. [Google Scholar] [CrossRef] [PubMed]
  3. Bowman, D.; Balch, J.K.; Artaxo, P.; Bond, W.J.; Carlson, J.M.; Cochrane, M.A.; D’Antonio, C.M.; DeFries, R.S.; Doyle, J.C.; Harrison, S.P.; et al. Fire in the earth system. Science 2009, 324, 481–484. [Google Scholar] [CrossRef] [PubMed]
  4. Westerling, A.L.; Hidalgo, H.G.; Cayan, D.R.; Swetnam, T.W. Warming and earlier spring increase western U.S. forest wildfire activity. Science 2006, 313, 940–943. [Google Scholar] [CrossRef] [Green Version]
  5. Cochrane, M.A.; Barber, C.P. Climate change, human land use and future fires in the Amazon. Glob. Chang. Biol. 2009, 15, 601–612. [Google Scholar] [CrossRef]
  6. Pechony, O.; Shindell, D.T. Driving forces of global wildfires over the past millennium and the forthcoming century. Proc. Natl. Acad. Sci. USA 2010, 107, 19167–19170. [Google Scholar] [CrossRef] [Green Version]
  7. Turetsky, M.R.; Benscoter, B.; Page, S.; Rein, G.; van der Werf, G.R.; Watts, A. Global vulnerability of peatlands to fire and carbon loss. Nat. Geosci. 2014, 8, 11–14. [Google Scholar] [CrossRef]
  8. Van der Werf, G.R.; Randerson, J.T.; Giglio, L.; van Leeuwen, T.T.; Chen, Y.; Rogers, B.M.; Mu, M.; van Marle, M.J.E.; Morton, D.C.; Collatz, G.J.; et al. Global fire emissions estimates during 1997–2016. Earth Syst. Sci. Data 2017, 9, 697–720. [Google Scholar] [CrossRef] [Green Version]
  9. Jolly, W.M.; Cochrane, M.A.; Freeborn, P.H.; Holden, Z.A.; Brown, T.J.; Williamson, G.J.; Bowman, D.M.J.S. Climate–induced variations in global wildfire danger from 1979 to 2013. Nat. Commun. 2015, 6, 7537. [Google Scholar] [CrossRef] [Green Version]
  10. Zong, Z.; Wang, X.; Tian, C.; Chen, Y.; Qu, L.; Ji, L.; Zhi, G.; Li, J.; Zhang, G. Source apportionment of PM2.5 at a regional background site in North China using PMF linked with radiocarbon analysis: Insight into the contribution of biomass burning. Atmos. Chem. Phys. 2016, 16, 11249–11265. [Google Scholar] [CrossRef]
  11. Lelieveld, J.; Evans, J.S.; Fnais, M.; Giannadaki, D.; Pozzer, A. The contribution of outdoor air pollution sources to premature mortality on a global scale. Nature 2015, 525, 367–371. [Google Scholar] [CrossRef] [PubMed]
  12. Andela, N.; Morton, D.C.; Giglio, L.; Chen, Y.; van der Werf, G.R.; Kasibhatla, P.S.; DeFries, R.S.; Collatz, G.J.; Hantson, S.; Kloster, S.; et al. A human–driven decline in global burned area. Science 2017, 356, 1356–1361. [Google Scholar] [CrossRef] [PubMed] [Green Version]
  13. Giglio, L.; Csiszar, I.; Restas, A.; Morisette, J.T.; Schroeder, W.; Morton, D.; Justice, C.O. Active fire detection and characterization with the advanced spaceborne thermal emission and reflection radiometer (ASTER). Remote Sens. Environ. 2008, 112, 3055–3063. [Google Scholar] [CrossRef]
  14. Schroeder, W.; Oliva, P.; Giglio, L.; Quayle, B.; Lorenz, E.; Morelli, F. Active fire detection using Landsat–8/OLI data. Remote Sens. Environ. 2016, 185, 210–220. [Google Scholar] [CrossRef] [Green Version]
  15. Yin, S. Biomass burning spatiotemporal variations over South and Southeast Asia. Environ. Int. 2020, 145, 106153. [Google Scholar] [CrossRef]
  16. Li, P.; Xiao, C.; Feng, Z.; Li, W.; Zhang, X. Occurrence frequencies and regional variations in Visible Infrared Imaging Radiometer Suite (VIIRS) global active fires. Glob. Chang. Biol. 2020, 26, 2970–2987. [Google Scholar] [CrossRef] [PubMed]
  17. Schroeder, W.; Oliva, P.; Giglio, L.; Csiszar, I.A. The New VIIRS 375 m active fire detection data product: Algorithm description and initial assessment. Remote Sens. Environ. 2014, 143, 85–96. [Google Scholar] [CrossRef]
  18. Giglio, L.; Schroeder, W.; Justice, C.O. The collection 6 MODIS active fire detection algorithm and fire products. Remote Sens. Environ. 2016, 178, 31–41. [Google Scholar] [CrossRef] [Green Version]
  19. Giglio, L.; Boschetti, L.; Roy, D.P.; Humber, M.L.; Justice, C.O. The Collection 6 MODIS burned area mapping algorithm and product. Remote Sens. Environ. 2018, 217, 72–85. [Google Scholar] [CrossRef]
  20. Aragao, L.; Anderson, L.O.; Fonseca, M.G.; Rosan, T.M.; Vedovato, L.B.; Wagner, F.H.; Silva, C.V.J.; Silva, C.H.L.; Arai, E.; Aguiar, A.P.; et al. 21st century drought–related fires counteract the decline of Amazon deforestation carbon emissions. Nat. Commun. 2018, 9, 536. [Google Scholar] [CrossRef]
  21. van Leeuwen, T.T.; van der Werf, G.R.; Hoffmann, A.A.; Detmers, R.G.; Rucker, G.; French, N.H.F.; Archibald, S.; Carvalho, J.A.; Cook, G.D.; de Groot, W.J.; et al. Biomass burning fuel consumption rates: A field measurement database. Biogeosciences 2014, 11, 7305–7329. [Google Scholar] [CrossRef] [Green Version]
  22. Giglio, L.; Descloitres, J.; Justice, C.O.; Kaufman, Y.J. An enhanced contextual fire detection algorithm for MODIS. Remote Sens. Environ. 2003, 87, 273–282. [Google Scholar] [CrossRef]
  23. Hantson, S.; Padilla, M.; Corti, D.; Chuvieco, E. Strengths and weaknesses of MODIS hotspots to characterize global fire occurrence. Remote Sens. Environ. 2013, 131, 152–159. [Google Scholar] [CrossRef]
  24. Yaduvanshi, A.; Srivastava, P.K.; Pandey, A.C. Integrating TRMM and MODIS satellite with socio–economic vulnerability for monitoring drought risk over a tropical region of India. Phys. Chem. Earth Parts A/B/C 2015, 83–84, 14–27. [Google Scholar] [CrossRef]
  25. Vadrevu, K.; Lasko, K. Intercomparison of MODIS AQUA and VIIRS I–band fires and emissions in an agricultural landscape–implications for air pollution research. Remote Sens. 2018, 10, 978. [Google Scholar] [CrossRef] [Green Version]
  26. Voulgarakis, A.; Field, R.D. Fire influences on atmospheric composition, air quality and climate. Curr. Pollut. Rep. 2015, 1, 70–81. [Google Scholar] [CrossRef] [Green Version]
  27. Forsythe, N.; Kilsby, C.G.; Fowler, H.J.; Archer, D.R. Assessment of runoff sensitivity in the upper indus basin to interannual climate variability and potential change using MODIS satellite data products. Mt. Res. Dev. 2012, 32, 16–29. [Google Scholar] [CrossRef]
  28. Ke, H.B.; Gong, S.L.; He, J.J.; Zhou, C.H.; Zhang, L.; Zhou, Y.K. Spatial and temporal distribution of open bio–mass burning in China from 2013 to 2017. Atmos. Environ. 2019, 210, 156–165. [Google Scholar] [CrossRef]
  29. Mueller, D.; Suess, S.; Hoffmann, A.A.; Buchholz, G. The value of satellite–based active fire data for monitoring, reporting and verification of REDD+ in the Lao PDR. Hum. Ecol. 2013, 41, 7–20. [Google Scholar] [CrossRef]
  30. Zhou, Y.; Han, Z.; Liu, R.; Zhu, B.; Li, J.; Zhang, R. A modeling study of the impact of crop residue burning on PM2.5 concentration in Beijing and Tianjin during a severe autumn haze event. Aerosol Air Qual. Res. 2018, 18, 1558–1572. [Google Scholar] [CrossRef]
  31. Cheng, Z.; Wang, S.; Fu, X.; Watson, J.G.; Jiang, J.; Fu, Q.; Chen, C.; Xu, B.; Yu, J.; Chow, J.C.; et al. Impact of biomass burning on haze pollution in the Yangtze River delta, China: A case study in summer 2011. Atmos. Chem. Phys. 2014, 14, 4573–4585. [Google Scholar] [CrossRef] [Green Version]
  32. Qin, X.; Yan, H.; Zhan, Z.; Li, Z. Characterising vegetative biomass burning in China using MODIS data. Int. J. Wildland Fire 2014, 23, 69–77. [Google Scholar] [CrossRef] [Green Version]
  33. Tian, X.; Zhao, F.; Shu, L.; Wang, M. Distribution characteristics and the influence factors of forest fires in China. For. Ecol. Manag. 2013, 310, 460–467. [Google Scholar] [CrossRef]
  34. Wei, X.; Wang, G.; Chen, T.; Hagan, D.F.T.; Ullah, W. A spatio–temporal analysis of active fires over China during 2003–2016. Remote Sens. 2020, 12, 1787. [Google Scholar] [CrossRef]
  35. Zhuang, Y.; Li, R.Y.; Yang, H.; Chen, D.L.; Chen, Z.Y.; Gao, B.B.; He, B. Understanding temporal and spatial distribution of crop residue burning in China from 2003 to 2017 using MODIS data. Remote Sens. 2018, 10, 17. [Google Scholar] [CrossRef] [Green Version]
  36. Xie, H.; Du, L.; Liu, S.; Chen, L.; Gao, S.; Liu, S.; Pan, H.; Tong, X. Dynamic monitoring of agricultural fires in China from 2010 to 2014 using MODIS and GlobeLand30 data. ISPRS Int. Geo–Inf. 2016, 5, 172. [Google Scholar] [CrossRef] [Green Version]
  37. Yang, G.; Zhao, H.; Tong, D.Q.; Xiu, A.; Zhang, X.; Gao, C. Impacts of post-harvest open biomass burning and burning ban policy on severe haze in the Northeastern China. Sci. Total Environ. 2020, 716, 136517. [Google Scholar] [CrossRef]
  38. Tian, Y.; Wu, Z.; Bian, S.; Zhang, X.; Wang, B.; Li, M. Study on spatial–distribution characteristics based on fire–spot data in Northern China. Sustainability 2022, 14, 6872. [Google Scholar] [CrossRef]
  39. Davies, D.K.; Ilavajhala, S.; Min Minnie, W.; Justice, C.O. Fire information for resource management system: Archiving and distributing MODIS active fire data. IEEE Trans. Geosci. Remote Sens. 2009, 47, 72–79. [Google Scholar] [CrossRef]
  40. Justice, C.O.; Townshend, J.R.G.; Vermote, E.F.; Masuoka, E.; Wolfe, R.E.; Saleous, N.; Roy, D.P.; Morisette, J.T. An overview of MODIS Land data processing and product status. Remote Sens. Environ. 2002, 83, 3–15. [Google Scholar] [CrossRef]
  41. Miettinen, J.; Shi, C.; Liew, S.C. Fire Distribution in Peninsular Malaysia, Sumatra and Borneo in 2015 with special emphasis on peatland fires. Environ. Manag. 2017, 60, 747–757. [Google Scholar] [CrossRef] [PubMed]
  42. Zhu, J.; Zhang, M.; Zhang, Y.; Zeng, X.; Xiao, X. Response of tropical terrestrial gross primary production to the Super El Nino event in 2015. J. Geophys. Res.–Biogeosci. 2018, 123, 3193–3203. [Google Scholar] [CrossRef]
  43. Tansey, K.; Beston, J.; Hoscilo, A.; Page, S.E.; Hernandez, C.U.P. Relationship between MODIS fire hot spot count and burned area in a degraded tropical peat swamp forest in Central Kalimantan, Indonesia. J. Geophys. Res.–Atmos. 2008, 113, D23112. [Google Scholar] [CrossRef] [Green Version]
  44. Cui, S.; Song, Z.; Zhang, L.; Shen, Z.; Hough, R.; Zhang, Z.; An, L.; Fu, Q.; Zhao, Y.; Jia, Z. Spatial and temporal variations of open straw burning based on fire spots in northeast China from 2013 to 2017. Atmos. Environ. 2021, 244, 117962. [Google Scholar] [CrossRef]
  45. Yi, K.P.; Bao, Y.L.; Zhang, J.Q. Spatial distribution and temporal variability of open fire in China. Int. J. Wildland Fire 2017, 26, 122–135. [Google Scholar] [CrossRef] [Green Version]
  46. Zhao, Y.; Xu, R.; Xu, Z.; Wang, L.; Wang, P. Temporal and spatial patterns of biomass burning fire counts and carbon emissions in the Beijing–Tianjin–Hebei (BTH) region during 2003–2020 based on GFED4. Atmosphere 2022, 13, 459. [Google Scholar] [CrossRef]
Figure 1. Maps of the (a) topographic features and (b) average rainfall and temperature in China.
Remotesensing 15 00054 g001
Figure 2. Maps of the (a) spatial distribution of the annual average number and (b) patterns of hotspot density (1 km × 1 km) of MODIS active fires in China during 2001–2020.
Remotesensing 15 00054 g002
Figure 3. Total occurrence frequencies derived from MODIS C6 active fire data in (a) China, (b) Northeast China, (c) South China, (d) East China, (e) North China, (f) Southwest China, and (g) Northwest China during 2001–2020.
Remotesensing 15 00054 g003
Figure 4. The monthly average number of active fire occurrence frequencies and its 95% confidence interval (purple area) in (a) China, (b) Northeast China, (c) South China, (d) East China, (e) North China, (f) Southwest China, and (g) Northwest China during 2001–2020.
Remotesensing 15 00054 g004
Figure 5. The total (a) occurrence frequencies of active fires over the study period, (b) monthly average number of active fire occurrence frequencies and their 95% confidence intervals (purple area), (c) average rainfall and temperature, (d) geographical position of Heilongjiang in China, (e) spatial difference in hotspot density of active fires during 2001–2020, and (f) spatial difference in land cover in Heilongjiang in 2020.
Remotesensing 15 00054 g005
Figure 6. The total (a) occurrence frequencies of active fires over the study period, (b) monthly average number of active fire occurrence frequencies and their 95% confidence intervals (purple area), (c) average rainfall and temperature, (d) geographical position of Yunnan in China, (e) spatial difference in hotspot density of active fires during 2001– 2020, and (f) spatial difference in land cover in Yunnan in 2020.
Remotesensing 15 00054 g006
Figure 7. The total (a) occurrence frequencies of active fires over the study period, (b) monthly average number of active fire occurrence frequencies and their 95% confidence intervals (purple area), (c) average rainfall and temperature, (d) geographical position of Anhui in China, (e) spatial difference in hotspot density of active fires during 2001– 2020, and (f) spatial difference in land cover in Anhui in 2020.
Remotesensing 15 00054 g007
Disclaimer/Publisher’s Note: The statements, opinions and data contained in all publications are solely those of the individual author(s) and contributor(s) and not of MDPI and/or the editor(s). MDPI and/or the editor(s) disclaim responsibility for any injury to people or property resulting from any ideas, methods, instructions or products referred to in the content.

