Technical Note

Extraction of Winter Wheat Planting Area Based on Multi-Scale Fusion

1
College of Agricultural Engineering, Jiangsu University, Zhenjiang 212013, China
2
Institute of Agricultural Information, Jiangsu Academy of Agricultural Sciences, Nanjing 210014, China
3
Fluid Machinery Engineering Technology Research Center, Jiangsu University, Zhenjiang 212013, China
4
Institute of International Education, Nanjing University of Information of Science and Technology, Nanjing 210044, China
*
Author to whom correspondence should be addressed.
Remote Sens. 2023, 15(1), 164; https://doi.org/10.3390/rs15010164
Submission received: 3 December 2022 / Revised: 25 December 2022 / Accepted: 25 December 2022 / Published: 28 December 2022

Abstract

:
It is difficult to accurately identify the winter wheat acreage in the Jianghuai region of China, and the fusion of high-resolution images and medium-resolution image data can improve the image quality and facilitate the identification and acreage extraction of winter wheat. Therefore, the objective of this study is to improve the accuracy of China’s medium-spatial resolution image data (environment and disaster monitoring and forecasting satellite data, HJ-1/CCD) in extracting the large area of winter wheat planted. The fusion and object-oriented classification of the 30 m × 30 m HJ-1/CCD multispectral image and 2 m × 2 m GF-1 panchromatic image (GF-1/PMS) of winter wheat at the jointing stage in the study area were studied. The GF-1/PMS panchromatic images were resampled at 8 m, 16 m and 24 m to produce panchromatic images with four spatial resolutions, including 2 m. They were fused with HJ-1/CCD multispectral images by Gram Schmidt (GS). The quality of the fused images was evaluated to pick adequate scale images for the field pattern of winter wheat cultivation in the study area. The HJ-1/CCD multispectral image was resampled to obtain an image with the same scale as the suitable scale fused image. In the two images, the training samples SFI (samples of fused image) and SRI (samples of resampled image) containing spectral and texture information were selected. The fused image (FI) and resampled image (RI) were used for winter wheat acreage extraction using an object-oriented classification method. The results indicated that the fusion effect of 16 m × 16 m fused image was better than 2 m × 2 m, 8 m × 8 m and 24 m × 24 m fused images, with mean, standard deviation, average gradient and correlation coefficient values of 161.15, 83.01, 4.55 and 0.97, respectively. After object-oriented classification, the overall accuracy of SFI for the classification of resampled image RI16m was 92.22%, and the Kappa coefficient was 0.90. The overall accuracy of SFI for the classification of fused image FI16m was 94.44%, and the Kappa coefficient was 0.93. The overall accuracy of SRI for the classification of resampled image RI16m was 84.44%, and the Kappa coefficient was 0.80. The classification effect of SFI for the fused image FI16m was the best, indicating that the object-oriented classification method combined with the fused image and the extraction samples of the fused image (SFI) could extract the winter wheat planting area with precision. In addition, the object-oriented classification method combining resampled images and the extraction samples of fused images (SFI) could extract the winter wheat planting area more effectively. These results indicated that the combination of medium spatial resolution HJ-1/CCD images and high spatial resolution GF-1 satellite images could effectively extract the planting area information of winter wheat in large regions.

Graphical Abstract

1. Introduction

The traditional methods for gathering information on the growth of artificial field crops are time-consuming and labor-intensive, and the monitoring area is restricted. Satellite remote sensing has the benefit of being suitable for large-area, dynamic and accurate monitoring. It provides effective tools for crop identification and monitoring via the extraction of crop planting area, inversion of growth metrics, and estimation of grain yield and pests, and it has been extensively utilized in crop information production management and research [1,2]. Currently available remote sensing data are from other countries, such as the Landsat series satellite data from the United States, the Sentinel series satellite data from Europe, the SPOT series satellite data from France, etc. There are also satellite data produced in China, which can be downloaded through the data platform China Centre for Resources Satellite Data and Application, such as the HJ-1, GF series data images, etc. The HJ-1/CCD satellite images have a large width, high temporal resolution and medium spatial resolution at 30 m x 30 m. The spaceborne sensor (Charge Coupled Device, CCD) contains four bands of blue, green, red and near-infrared, with rich spectral information, and is suitable as a data source for large-scale extraction of winter wheat area [3,4]. The GF-1/PMS panchromatic images have a high spatial resolution (2 m × 2 m) and high temporal resolution, rich in details and texture information, but their image width is limited [5,6]. Fusion of medium and high spatial resolution remote sensing images can obtain useful spectral and spatial information, which is beneficial to crop identification and planting area extraction [7]. There has been a lot of research based on this, such as Li et al.’s [8], which fused GF-1/PMS panchromatic image and HJ-1/CCD multispectral image to effectively monitor the spatial fluctuation of winter wheat scab in Jiangsu Province, China. Li et al. [9] used the GS method to fuse Landsat-8/OLI multispectral image and Sentinel-1A/SAR image and used the support vector machine method to classify the fused image of Zunhua City, Hebei Province, China. Seo et al. [10] fused Landsat-8/OLI multispectral image and KOMPSAT-5/SAR image to efficiently monitor land use changes in Seoul, South Korea. Image fusion can synthesize the benefits of both remote sensing images and makes-up for the shortcomings of a single remote sensing image. It not only expands the application scope of image information but also significantly improves the accuracy of remote sensing monitoring.
Due to the combined influence of the sensor’s own conditions and environmental factors, the “same object with different spectrum” and “different objects with the same spectrum” are rather typical phenomena in remote sensing images. Traditional remote sensing image classification methods are pixel-based supervised and unsupervised classification, such as the maximum likelihood method [11], ISODATA (Iterative Self Organizing Data Analysis Techniques Algorithm) [12], SVM (Support Vector Machine) [13,14] and so on. The pixel-based classification method only uses the spectral grayscale feature of a single pixel for classification, ignoring the information features, such as space, texture and context of the data, and the “salt and pepper phenomenon” in the classification results is serious [15,16]. Although artificial visual interpretation has high classification accuracy, it is labor-intensive, inefficient, and prone to subjectivity and non-quantifiability [17]. In recent years, scholars at home and abroad have examined remote sensing classification methods from the perspective of image segmentation, and the object-oriented classification methods proposed are mostly used in high-precision image classification research [18,19]. The object-oriented classification method is not based on a single pixel but on the image object. The image is divided into multiple object features according to the spectral heterogeneity of adjacent pixels, and then space, texture and other features are added to the object for auxiliary classification, effectively avoiding the “salt and pepper phenomenon” [20,21]. There is a lot of research on this, such as Zhang et al.’s [22], which fused Sentinel-1/SAR data and Sentinel-2/MSI data and used the object-oriented classification method to classify and extract crops in Jining City, Shandong Province, China. Zhou et al. [23] took Suixi County in the north of Leizhou Peninsula, Guangdong Province, China, as the study area and used HJ-1/CCD remote sensing images to classify sugarcane by object-oriented method. In the Jianghuai wheat area of China, the farmland is densely covered with a water network, the fields are broken, and the distribution is scattered. It is difficult to accurately identify the crop information of the field with a single image of medium and low resolution. Fusion of HJ-1/CCD images and GF-1/PMS images, first perform local small area image fusion and establish fused image training samples, then resample large-scale HJ-1/CCD images, and use the fused image training samples to perform object-oriented classification of it. This method is beneficial to improve the extraction accuracy of winter wheat planting areas.
In this study, Shuyang County, Suqian City, Jiangsu Province, China, was used as the research area, and we conducted the following two aspects of research: image fusion of different scales and object-oriented classification of different combinations of training samples and images. (1) On the basis of resampled GF-1/PMS panchromatic images, multi-scale image fusion was performed with HJ-1/CCD multispectral images. For the comparison of spectral features, the scale fused image suitable for winter wheat planting fields in the Jiangsu region was chosen, and the HJ-1/CCD multispectral image was resampled to the same scale as the appropriate scale image. (2) The fused image classification samples were used to classify the resampled images and compare the classification results with the fused image classification results using the fused image classification samples and the resampled image classification results using the resampled image classification samples so as to clarify the impact of different classification sample sets on remote sensing. The purpose of this study is to determine the effect of image object-oriented classification accuracy on a method suited for large-scale winter wheat planting area extraction based on multi-source data fusion. This paper proposes the following research hypotheses: (1) Using two images of HJ-1/CCD image and GF-1/PMS image to fuse images of different scales (2 m × 2 m, 8 m × 8 m, 16 m × 16 m and 24 m × 24 m), it can be considered that the spectral information and texture features of the 16 m × 16 m fused images have been significantly improved, which facilitates the extraction of winter wheat planting area in the study area. (2) Different classification combinations of training samples and images for object-oriented classification will result in classification results with different accuracy. Using fused image classification samples is optimal for fused image combination classification, and the overall area extraction accuracy can reach more than 90%, which is conducive to the application of satellite remote sensing images in the Jianghuai region of China.

2. Materials and Methods

2.1. Study Area Selection

The research area is located in Shuyang County, Suqian City, Jiangsu Province, China. The spring crops are mainly winter wheat and rape, and it is covered by towns, rivers, lakes, etc., which has a certain regional representativeness. The geographical coordinate range—33°56′20″–34°6′59″ N, 118°36′55″–118°55′25″ E—is the location shown in Figure 1.

2.2. Remote Sensing Image Data Acquisition and Preprocessing

The GF-1/PMS panchromatic image taken on 26 March 2021 and the HJ-1/CCD multispectral image taken on 25 March 2021 were selected when the winter wheat was in the jointing stage. The image data were downloaded from the China Centre for Resources Satellite Data and Application (https://data.cresda.cn/#/home (accessed on 21 March 2021)). The GF-1/PMS panchromatic image has a width of 60 km × 60 km and a spatial resolution of 2 m × 2 m. The HJ-1/CCD multispectral image has a width of 360 km × 360 km, a spatial resolution of 30 m × 30 m, and a total of four bands (blue, green, red and near-infrared).
The GPS (global position system) receiver was used to select 480 sample points in various parts of the study area for geometric fine-tuning and classification. Before extraction of the planting area, the two images were subjected to radiometric calibration, atmospheric correction and geometric correction, respectively. The DN (digital number) of the satellite image pixel is converted into the radiance based on the calibration coefficient provided by the China Centre for Resources Satellite Data and Application. The projection parameter for geometric correction is Universal Transverse Mercator Grid System projection (UTM WGS-1984 50N), with a precision of 0.5 pixels. The FLAASH atmospheric correction module is used to correct the image, eliminate the factors, such as atmosphere and light, that affect the reflection of ground objects and obtain a more realistic ground object reflectivity. The two images are cropped to obtain remote-sensing images of the same research area.

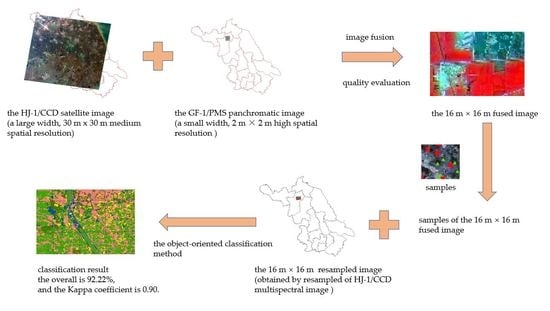
2.3. Remote Sensing Image Fusion

The GS (Gram–Schmidt) fusion method is a pixel-level image fusion method. The multispectral image is used to simulate the panchromatic image, and the simulated image and the multispectral image are subjected to GS forward transformation, and then the high spatial resolution panchromatic image is used to replace the first component of the orthogonal transformation, and finally, the GS inverse transformation is performed to obtain the fusion image [24].
The 2 m × 2 m GF-1/PMS panchromatic image was resampled to form panchromatic images with spatial resolutions of 8 m × 8 m, 16 m × 16 m, and 24 m × 24 m. The panchromatic band images of four scenes (including 2 m × 2 m) and the HJ-1/CCD multispectral image of 30 m × 30 m were fused by the GS method to obtain 2 m × 2 m, 8 m × 8 m, 16 m and 24 m × 24 m multispectral fusion images.

2.4. Spectral Reflectance of Ground Objects

By calculating the blue band (B), green band (G), red band (R) and near-infrared band (NIR) reflectance values of different types of ground objects (water bodies, buildings and roads, winter wheat, rape and other vegetation) and sample points in the HJ-1/CCD multispectral image of the study area after preprocessing and calculating the mean value, and the curve of the spectral mean value of each object in different bands is drawn.

2.5. Fused Image Quality Evaluation

In this study, the mean, standard deviation, average gradient and correlation coefficient of four evaluation indicators were used to evaluate the fusion image quality of fusion images. The calculation formula is listed in Table 1. The average value of the fused images is moderate. The larger the standard deviation, the larger the average gradient, and the closer the correlation coefficient is to 1, the more effective the image fusion effect.

2.6. Object-Oriented Classification

The processing unit for object-oriented classification is an image object composed of adjacent pixels with similar structures. In the process of classification, the classification hierarchy is established according to the feature information of the object, the definition of the ground object and its subclasses, and the relationship between the ground objects and the ground objects’ structures [26]. The whole process can be divided into 3 steps: (1) image segmentation; (2) feature selection; and (3) establishment of classification rules and classification. First, the appropriate scale for multi-scale segmentation is selected, and the image is divided into several objects; then, the spectral characteristics of different objects and the NDVI (Normalized Difference Vegetation Index) were used to separate the vegetation and non-vegetation areas. After that, in the vegetation area, different types of membership functions (rules) were established to extract winter wheat based on the spectral characteristics, NDVI and texture information of different vegetation (winter wheat, rape, bushes and grasslands, etc.).

2.6.1. Sample Establishment and Utilization

Using the 480 positioning sample points collected by the GPS receiver, the standard sample set was extracted from the image (Figure 2). Among them, 300 samples are selected as training samples to participate in the classification. The training samples extracted from the fused images are SFI (samples of fused image), and the training samples extracted from the resampled images are SRI (samples of resampled image). The remaining 180 samples were used as test samples for accuracy evaluation. The study area is divided into five types of ground objects, including water, buildings and roads, winter wheat, rape and other vegetation.
In object-oriented classification, the training samples are used to classify two images, which are divided into three different combinations of training samples and image classification. Combination one: using SFI to classify the resampled image; combination two: using SFI to classify the fused image; and combination three: using SRI to classify the resampled image. After the object-oriented classification, the test samples are used to evaluate the accuracy of the three combinations of object-oriented classification results.

2.6.2. Determination of Segmentation Factors and Image Segmentation

The segmentation scale determines the maximum degree of heterogeneity allowed to segment objects [27,28]; two factors, spectral heterogeneity and shape heterogeneity, need to be considered, and the sum of their weights is 1. The calculation formula is:
f = ω color h color + ω shape h shape
ω color + ω shape = 1
where f is the degree of heterogeneity, hcolor is the spectral heterogeneity, hshape is the shape heterogeneity, ωcolor is the weight of the spectral heterogeneity, and ωshape is the weight of the shape heterogeneity. Spectral heterogeneity is the primary condition for determining the object, which is related to the number of object pixels and the standard deviation of the gray value of the band before and after merging. The shape heterogeneity factor also needs to be introduced in the segmentation process. Shape heterogeneity is calculated from two indices of smoothness and compactness. Smoothness can smooth the object boundary and reduce the fragmentation of the boundary; compactness can optimize the compactness of the object, and the sum of the two weights is also 1.
A smaller scale is used to segment ground item categories with smaller areas and more complex distributions; a larger scale is used to segment ground object categories with larger areas, regular textures and more obvious spatial characteristics. When selecting segmentation parameters, the preliminary segmentation scale can be selected through the ESP2 scale optimization tool [29,30], then the best segmentation parameters can be determined through trial and error.

2.6.3. Extraction of Spectral Information Features

This article’s spectral information feature relates to the normalized difference vegetation index (NDVI) [31], which may be determined using Equation (3):
NDVI = NIBR RBR NIBR + RBR
where NIBR is near-infrared band reflectance, and RBR is red band reflectance. According to the value of NDVI, it can help to distinguish non-vegetation and vegetation [32]. Non-vegetation includes water bodies, buildings and roads. The main vegetation types in vegetation are winter wheat, rape and trees and grasslands (hereafter referred to as other vegetation).

2.6.4. Extraction of Texture Information Features

Four parameters of homogeneity, entropy, angular second-order distance and contrast are selected for feature extraction of image texture information [33,34,35]; the calculation formula is shown in Table 2. The bigger the homogeneity value, the smaller and more uniform the texture change in the local area. The bigger the entropy value, the greater the amount of texture information; the bigger the angular second-order distance value. The rougher the texture and the smaller the value, the finer the texture. The higher contrast value means that the texture is more striking and clearer. The texture information of three types of vegetation categories is extracted in a 3× window.

3. Results

3.1. Analysis of Spectral Characteristics of Different Ground Objects

Figure 3 shows the spectral characteristic curves of different types of ground objects. In the B band, the reflectivity of water, buildings and roads, winter wheat, rape and other vegetation are 0.095, 0.13, 0.081, 0.103 and 0.099, respectively. In the G band, the reflectivity of water, buildings and roads, winter wheat, rape and other vegetation are 0.109, 0.168, 0.104, 0.13 and 0.117, respectively. In the R band, the reflectivity of water, buildings and roads, winter wheat, rape and other vegetation are 0.105, 0.17, 0.09, 0.114 and 0.124, respectively. In the NIR band, the reflectivity of water, buildings and roads, winter wheat, rape and other vegetation are 0.152, 0.26, 0.382, 0.32 and 0.239, respectively. It can be seen from the figure that the spectral characteristics of vegetation and non-vegetation are significantly different, and the water has high absorption of the four bands, so the reflectivity is low. The reflectivity of buildings and roads to the four bands is relatively high. Due to the absorption of chlorophyll of vegetation (winter wheat, rape and other vegetation) on the B, G, and R bands, the reflectivity of vegetation in the B, G, and R band intervals is low, but the NIR band has a higher reflectivity. Among the four bands, the difference in reflectance between vegetation and non-vegetation in the B band is the smallest, and the difference in the NIR band is the most significant. Therefore, the band combination is selected as NIR-R-G, which is convenient for fused image quality evaluation and image segmentation.
In the NIR band in Figure 3, the reflectivity of water and other ground objects differs greatly and is strongly separated. In the range from the B to R band, the reflectivity value of buildings and roads is higher than that of water, winter wheat, rape and other vegetation, allowing them to be identified. However, for winter wheat, rapes and other vegetation, there is a certain degree of mixed pixels in the B to NIR band, and it is difficult to separate them only by the reflectance value of the NIR band. Therefore, in the object-oriented classification, specific and representative NDVI will be selected to identify different types of vegetation and then distinguish winter wheat, rape and other vegetation.

3.2. Subjective Evaluation of Fused Image Quality at Different Spatial Scales

Subjective quality evaluation was performed on the multispectral fused images (Figure 4) of 2 m × 2 m, 8 m × 8 m, 16 m × 16 m and 24 m × 24 m obtained by the GS fusion method. The same local image area was selected in the study area image for comparison, and the local area includes five types of ground objects, including water, buildings and roads, winter wheat, rape and other vegetation. The fused images of 2 m × 2 m, 8 m × 8 m, 16 m × 16 m and 24 m × 24 m have better clarity, spectral and texture features than HJ-1/CCD 30 m multispectral image. Small objects, such as houses and roads, can be clearly distinguished in the 2 m × 2 m fused image and the 8 m × 8 m fused image. The sharpness of the 16 m×16 m fused image is reduced, but the field boundaries can still be identified. The 24 m × 24 m fused image has a lower resolution, serious pixel mixing and unclear field borders. After visual interpretation, the 2 m × 2 m fused image, the 8 m × 8 m fused image and the 16 m × 16 m fused image can identify the regional winter wheat planting fields, and the recognition effect of 24 m × 24 m fused image is poor.

3.3. Objective Evaluation of Fusion Image Quality at Different Spatial Scales

The mean, standard deviation, average gradient and correlation coefficient of fused images at four spatial scales (2 m × 2 m, 8 m × 8 m, 16 m × 16 m, 24 m × 24 m) in the local area are calculated, and the results are shown in Table 3. The mean values of the fused images of the four spatial scales are 160.98, 161.01, 161.15 and 165.03, which are similar in value, indicating that the average brightness of the four fused images is close. There are obvious differences in the standard deviation and average gradient of the four spatial scales, and the standard deviation values are 24 m × 24 m (83.59) > 16 m × 16 m (83.01) > 8 m × 8 m (82.93) > 2 m × 2 m (78.60); the average gradient value is 24 m × 24 m (6.13) > 16 m × 16 m (4.55) > 8 m × 8 m (2.97) > 2 m × 2 m (1.81). This shows that the 24 m × 24 m fused image has the most information, and the 16 m × 16 m fused image is second. The order of the correlation coefficient values is 16 m × 16 m (0.97) > 8 m × 8 m (0.96) > 2 m × 2 m (0.95) > 24 m × 24 m (0.85), indicating that the spectral fidelity of the 16 m×16 m fused image is the best. Combined with subjective evaluation, the 16 m × 16 m fused image is more suitable for the distribution characteristics of winter wheat planting fields in the Jiangsu Province, which is conducive to the identification of winter wheat and the extraction of planting area. In the following subsections of the paper, the object-oriented classification of different combinations of FI16m (16 m × 16 m fused image) of the study area and the resampled image of the study area obtained by resampled 16 m × 16 m of HJ-1/CCD multispectral image RI16m (resampled image) will be performed using the training samples.

3.4. Selection of Remote Sensing Image Segmentation Parameters

Using the fused image FI16m from the study area and NIR-R-G band combination, the segmentation scale was chosen based on the spatial distribution of distinct ground items in the image and visual interpretation. Due to the medium resolution of the image, the spectral characteristics of the ground objects are relatively prominent, and the shape and texture characteristics are not obvious. However, the distribution of the different species of vegetation in the study area is complex. Therefore, based on the segmentation of winter wheat fields, the preliminary segmentation scale was selected through the ESP2 scale optimization tool and then combined with visual interpretation to determine the segmentation scale to be 62. Then trial and error yielded a spectral heterogeneity weight of 1, a tightness of 0.4 and a smoothness of 0.6. This type of scale can distinguish vegetation from non-vegetation, and vegetation categories can be better distinguished.

3.5. Classification Rules for Combining Spectral and Texture Information Features

Spectral and texture information features for object-oriented classification were extracted from the FI16m in the study area (Table 4). The spectral information feature (NDVI) can be used to distinguish vegetation from non-vegetation. The NDVI value of the non-vegetation area is less than 0.20, and the NDVI value of the vegetation area is more than or equal to 0.20. Among the vegetation, the NDVI values for winter wheat were 0.54–0.65, the values for rape were 0.42–0.56, and the values for other vegetation were 0.20–0.43. By using NDVI, it is possible to distinguish between vegetation and non-vegetation areas, winter wheat and other vegetation. However, the NDVI of rape overlaps with other vegetation and winter wheat, and it is difficult to distinguish only by NDVI. Therefore, it is necessary to add texture information features for auxiliary classification, to calculate the gray level co-occurrence matrix of the image using a 3 × 3 window and to extract the texture information of winter wheat, rape and other vegetation.
It can be seen from Table 4 that the order of homogeneity is winter wheat > rape > other vegetation, indicating that the distribution of winter wheat is relatively regular, the field is larger and the texture structure is single, followed by rape and other vegetation is scattered. The entropy of winter wheat is the largest, which is 1.39, and the amount of information is the highest, but the contrast is the lowest, which is 0.66, indicating that the image lacks rich details, and the grooves are not clearly visible. The other vegetation (bush and grass) was a patch of cloth, irregularly shaped, and had the highest contrast at 1.33. The entropy of rape is the smallest, which is 1.12, but the angular second distance is the largest, which is 0.32. The field is slightly smaller than that of winter wheat, and the texture is more uniform and finer, but it contains less information. The winter wheat, rape and other vegetation can be distinguished by using the above four texture feature indicators.

3.6. Distribution Characteristics of Winter Wheat Planting Area

In object-oriented classification, the classification rules established by combining spectral and texture information features are used to classify three different training sample and image combinations.
It can be seen from Figure 5 that the area distribution of winter wheat extracted by the three classification combinations is basically the same. The classification results in Figure 5b are the most detailed, and the five ground objects can be well separated, even the roads, small rivers and ditches in the farmland. In Figure 5a, winter wheat fields, houses, main roads and rivers can be classified correctly, but the narrower roads are not classified correctly. Most of the ground objects in Figure 5c are correctly classified, but some winter wheat fields, houses and other vegetation are also wrongly classified. The areas of winter wheat, rape and other vegetation extracted by the three classification combinations are shown in Table 5.
It can be seen from Table 5 that the planting areas of winter wheat, rape and other vegetation extracted by the three classification combinations are different. Comparing the area of winter wheat extracted by classification combination one with the extraction results of classification combination two, the area of winter wheat increased from 21,117 hm2 to 22,783 hm2, indicating that other types of ground objects were misclassified into winter wheat. The differences between the winter wheat area, rape area and other vegetation areas extracted by classification combination one and classification combination two are 1666 hm2, 74 hm2 and 147 hm2, respectively, which are smaller than the area gap between classification combination three and classification combination two, and their values are 2031 hm2, 291 hm2 and 1404 hm2. This shows that the vegetation extraction result of classification combination one is close to classification combination two.

3.7. Accuracy Evaluation of Object-Oriented Classification Results

Using 180 test samples to evaluate the accuracy of the classification results of the three classification combinations, the evaluation results are shown in Table 6.
It can be seen from Table 6 that the overall classification accuracy of classification combination one is 92.22%, and the Kappa coefficient is 0.90. The overall classification accuracy of classification combination two is 94.44%, and the Kappa coefficient is 0.93. The overall classification accuracy of classification combination three is 84.44%, and the Kappa coefficient is 0.80. Rape has lower producer and user accuracy than the other four types of ground objects, as well as a greater proportion of misclassification and omission. The error is mainly due to the large spectral cross range of rape and other vegetation and winter wheat. The subdivision of vegetation types causes serious mixed pixels, while a large number of training samples makes rape and winter wheat areas with poor growth and some other vegetation misclassified and confused. The overall classification accuracy and Kappa coefficient of classification combination one were significantly higher than those of classification combination three and were relatively close to classification combination two.

4. Discussion

Remote sensing image fusion is a data processing method that processes image data obtained by different sensors through arithmetic rules to generate synthetic images with new spatial scale, time and spectral characteristics. The application of single-source remote sensing images will inevitably have some shortcomings (such as low spatial resolution, small width or less spectral information), and the image fusion methods can make better use of the complementary advantages of multi-source image data, which is conducive to crop identification and planting area extraction. In previous studies, good progress has been made in the fusion of satellite optical images and radar images [36], satellite optical images fusion [37] and the fusion of UAV (unmanned aerial vehicle) images and satellite optical images [38]. Many remote sensing image fusion studies use foreign satellite images, and the spatial scale of image fusion is relatively simple. In recent years, the development of China’s satellite remote sensing technology has accelerated, and remote sensing satellite image data, such as HJ and GF-1, which are convenient, multi-scale, and rich in spectral information, have attracted more industry research and application attention. Compared with the research of Lin et al. [6] and Li et al. [9], only single-scale images were obtained by fusion. In this paper, the nationally produced HJ star and GF-1 remote sensing images are used to conduct multi-spatial scale fusion research to suitability explore for the crop field broken area of China. The remote sensing image data fusion method of winter wheat planting spatial pattern has obvious research characteristics. After the quality evaluation of the multi-spatial scale fused images, the visual effect of 16 m × 16 m fusion images are better, and the mean, standard deviation, average gradient and correlation coefficient of the 16 m × 16 m fused image were 161.15, 83.01, 4.55 and 0.97, respectively. After the comprehensive evaluation, it is concluded that its fusion effect is better than that of other scale fusion images, indicating that the image scale of 16 m × 16 m is suitable for the distribution characteristics of winter wheat planting plots in the study area, which is conducive to the extraction of winter wheat planting information. Similar tests were conducted in this field by other researchers in different years. The research results show that the remote sensing images with a spatial resolution of 16 m × 16 m are more suitable for the field distribution characteristics of the Jianghuai region in China [7,8], and the results of this study are consistent with it. In future research, 16 m × 16 m images can be downloaded directly from the remote sensing data platform, or 16 m × 16 m fused images can be formed by fusion methods for crop growth monitoring research in the crop field broken area, which is conducive to improving crop monitoring and information extraction accuracy.
Object-oriented classification introduces features, such as spectrum and texture, to assist classification of segmented objects, which can better solve the problem of mixed pixels in image classification. For training samples and images in object-oriented classification, some scholars only use single-source image data for research [39], while others use the training samples extracted from the fused images to classify the fused images. Wan et al. [40] used the object-oriented method to classify the ground objects of the fused image, and the research results showed that the classification accuracy was significantly higher than that of the single image. Classification accuracy for fused images varies based on the training examples utilized. In this paper, the training samples were extracted from the fused image and non-fused image, respectively, then combined different training samples and different images. There is good research innovation in the study of the effect of training samples on the accuracy of remote sensing image classification and exploring diversified object-oriented classification methods. Among the three different training samples and image combination classification, the overall accuracy of the fused image sample (SFI) extracted from FI16m for FI16m classification is 94.44%, and the Kappa coefficient is 0.93. The classification samples in this combined classification are extracted from the fused image, and the quality of the samples is good, which reduces the confusion among samples of ground object types. The classification image is also a fusion image, and the image spectrum is rich in information, which is conducive to the recognition of ground object types [41,42]. Therefore, the classification effect is the best, which is consistent with the research results of Zhang et al. [22], Li et al. [28] and Wan et al. [40]. The effect of SFI on the classification of resampled image RI16m is similar to that of the former. The object-oriented classification method of combining fused image samples and fused images can accurately extract winter wheat planting areas. The object-oriented classification method combining fused image samples and resampled images can also better extract the planting area of winter wheat, and the extraction effect is similar to that of fused image samples and fused images. This study provides a reference method for the diversified classification research of the combination of medium spatial resolution remote sensing images and high spatial resolution remote sensing images. In the future, when using medium spatial resolution images and high spatial resolution images for large-scale crop identification and planting area extraction, first perform local small area image fusion and establish fused image training samples, and then resample large-scale medium spatial resolution images and classify it by object-oriented classification method, it can achieve better extraction effect of crop planting area. The accuracy of object-oriented classification is affected by the optimal segmentation scale of images, training samples, and classification features. Image segmentation is the basis and core problem of classification. Appropriate segmentation scales can improve classification accuracy. The next step is to optimize the selection of suitable segmentation scales. Depending on the quantity and quality of training samples, classification accuracy will vary. It is also very important to select an appropriate number of high-quality samples. A small number of classification features will reduce the accuracy of classification, whereas an excessive number of features will have a negative impact on classification speed. The establishment of suitable number characteristics also remains to be studied.

5. Conclusions

The HJ-1/CCD image and GF-1/PMS image were fused at multiple spatial scales by the GS method. Among them, the fusion effect of the 16 m × 16 m fused image is better than that of 2 m × 2 m, 8 m × 8 m and 24 m × 24 m fused images. The visual effect is better, and its mean, standard deviation, average gradient and correlation coefficient are 161.15, 83.01, 4.55 and 0.97, respectively. The image scale of 16 m × 16 m was suitable for the distribution characteristics of winter wheat plots in the study area.
The SFI had the best classification effect on FI16m. The overall accuracy was 94.44%, the Kappa coefficient was 0.93, and the area of extracted winter wheat was 21,117 hm2. The classification effect of SFI on RI16m is second. The combination of two object-oriented classification methods, the fused image extraction sample and the fused image, the fused image extraction sample and resampled image, is conducive to the effective recognition and planting area extraction of winter wheat in the crop field broken area.

Author Contributions

All the authors (W.L. (Weiguo Li), H.Z., W.L. (Wei Li) and T.M.) have contributed substantially to this manuscript. Conceptualization, W.L. (Weiguo Li) and W.L. (Wei Li); methodology, W.L. (Weiguo Li); validation, H.Z.; formal analysis, H.Z. and T.M.; investigation, H.Z. and T.M.; writing—original draft preparation, W.L. (Weiguo Li) and H.Z.; writing—review and editing, W.L. (Weiguo Li); project administration, W.L. (Weiguo Li) and W.L. (Wei Li); funding acquisition, W.L. (Weiguo Li) and W.L. (Wei Li). All authors have read and agreed to the published version of the manuscript.

Funding

This study was supported by the National Key Research and Development Program of China (International Technology Cooperation Project) (Funding No. 2021YFE0104400) and the Jiangsu Agricultural Science and Technology Innovation Fund (Funding No. CX (20) 2037).

Data Availability Statement

Not report any data.

Conflicts of Interest

The authors declare no conflict of interest.

References

  1. Li, W.; Wang, J.; Zhao, C.; Liu, L. A model of estimating winter wheat yield based on tm image and yield formation. J. Triticeae Crops 2007, 5, 904–907. [Google Scholar]
  2. Li, W.; Liu, Y.; Chen, H.; Zhang, C. Estimation model of winter wheat disease based on meteorological factors and spectral information. Food Prod. Process. Nutr. 2020, 2, 5. [Google Scholar] [CrossRef]
  3. Li, X.; Meng, Q.; Gu, X.; Jancso, T.; Yu, T.; Wang, K.; Mavromatis, S. A hybrid method combining pixel-based and object-oriented methods and its application in Hungary using Chinese HJ-1 satellite images. Int. J. Remote Sens. 2013, 34, 4655–4668. [Google Scholar] [CrossRef] [Green Version]
  4. Li, W.; Gu, X.; Ge, G.; Chen, H.; Zhang, C. Development of remote sensing monitoring information system for county scale winter wheat diseases. Jiangsu J. Agric. Sci. 2019, 35, 302–306. [Google Scholar] [CrossRef]
  5. Zhou, Q.; Yu, Q.; Liu, J.; Wu, W.; Tang, H. Perspective of Chinese GF-1 high-resolution satellite data in agricultural remote sensing monitoring. J. Integr. Agr. 2017, 16, 242–251. [Google Scholar] [CrossRef]
  6. Li, Z.; Li, W.; Shen, S.; Ma, J. Application of HJ and GF1 image data to extract rice planting area. Jiangsu J. Agric. Sci. 2016, 32, 111–117. [Google Scholar] [CrossRef]
  7. Jin, Z.; Li, W.; Jing, Y. Appropriate extraction scale of winter wheat planting area based on image fusion. Jiangsu J. Agric. Sci. 2015, 31, 1312–1317. [Google Scholar] [CrossRef]
  8. Li, W.; Chen, H.; Jin, Z.; Zhang, C.; Ge, G.; Ji, F. Remote sensing monitoring of winter wheat scab based on suitable scale selection. J. Triticeae Crops 2018, 38, 1374–1380. [Google Scholar] [CrossRef]
  9. Li, X.; Ma, B.; Zhang, S.; Chen, Y.; WU, L. Study on classification of ground objects with multispectral and SAR images. Map. Spa. Geogr. Inform. 2019, 42, 55–58. [Google Scholar]
  10. Seo, D.K.; Kim, Y.H.; Eo, Y.D.; Lee, M.H.; Park, W.Y. Fusion of SAR and multispectral images using random forest regression for change detection. ISPRS Int. J. Geo-Inf. 2018, 7, 401. [Google Scholar] [CrossRef] [Green Version]
  11. Li, S.; Zheng, D. Applications of artificial neural networks to geosciences: Review and prospect. Adv. Earth Sci. 2003, 1, 68–76. [Google Scholar]
  12. Li, W.; Li, Z.; Wang, J.; Huang, W.; Guo, W. Classification monitoring of grain protein contents of winter wheat by TM image based on ISODATA. Jiangsu J. Agric. Sci. 2009, 25, 1247–1251. [Google Scholar]
  13. Li, N.; Zhu, X.; Pan, Y.; Zhan, P. Optimized SVM based on artificial bee colony algorithm for remote sensing image classification. J. Remote Sens. 2018, 22, 559–569. [Google Scholar] [CrossRef]
  14. Izquierdo-Verdiguier, E.; Laparra, V.; Gomez-Chova, L.; Camps-Valls, G. Encoding invariances in remote sensing image classification with SVM. IEEE Geosic. Remote Sens. Lett. 2013, 10, 981–985. [Google Scholar] [CrossRef]
  15. Zhou, C.; Wang, P.; Zhang, Z.; Qi, C. Classification of urban land based on object-oriented information extraction technology. Remote Sens. Technol. Appl. 2008, 1, 31–35+123. [Google Scholar]
  16. Mo, L.; Cao, Y.; Hu, Y.; Liu, M.; Xia, D. Object-oriented Classification for Satellite Remote Sensing of Wetlands: A Case Study in Southern Hangzhou Bay Area. Wetland Sci. 2012, 10, 206–213. [Google Scholar]
  17. Li, Z.; Li, W.; Shen, S. A classification of wheat yield by remote-monitoring based on optimization ISODATA. Jiangsu J. Agric. Sci. 2009, 2, 301–302. [Google Scholar]
  18. Shackelford, A.K.; Davis, C.H. A combined fuzzy pixel-based and object-based approach for classification of high-resolution multispectral data over urban areas. IEEE Trans. Geosci. Remote 2003, 41, 2354–2363. [Google Scholar] [CrossRef] [Green Version]
  19. Song, M. Object-oriented urban land classification with GF-2 remote sensing image. Remote Sens. Technol. Appl. 2019, 34, 547–553+629. [Google Scholar] [CrossRef]
  20. Liu, Y.; Li, M.; Mao, L.; Xu, F.; Huang, S. Review of remotely sensed imagery classification patterns based on object-oriented image analysis. Chinese Geogr. Sci. 2006, 16, 282–288. [Google Scholar] [CrossRef]
  21. Cui, W.; Zheng, Z.; Zhou, Q.; Huang, J.; Yuan, Y. Application of a parallel spectral-spatial convolution neural network in object-oriented remote sensing land use classification. Remote Sens. Lett. 2018, 9, 334–342. [Google Scholar] [CrossRef]
  22. Zhang, Y.; He, Z.; Wu, Z. Crop classification and extraction based on multi-source remote sensing image. J. Shandong Agric. Univ. (Nat. Sci.) 2021, 52, 615–618. [Google Scholar] [CrossRef]
  23. Zhou, Z.; Huang, J.; Wang, J.; Zhang, K.; Kuang, Z.; Zhong, S.; Song, X. Object-oriented classification of sugarcane using time-series middle-resolution remote sensing data based on AdaBoost. PLoS ONE 2015, 10, e0142069. [Google Scholar] [CrossRef] [PubMed] [Green Version]
  24. Gao, Y.; Hu, Z.; Fan, R. Effect of high-resolution image fusion algorithm on the classification precision of land utilization in coastal wetland. Bull. Surv. Map. 2022, 1, 116–120. [Google Scholar] [CrossRef]
  25. Wang, F.; Yang, W.; Wang, J.; Chen, A. Chinese high-resolution satellite pixel level image fusion and its quality evaluation. Sci. Surv. Map. 2021, 46, 73–80. [Google Scholar] [CrossRef]
  26. Wang, Z.; Nie, C.; Wang, H.; Ao, Y.; Jin, X.; Yu, X.; Bai, Y.; Liu, Y.; Shao, M.; Cheng, M.; et al. Detection and analysis of degree of maize lodging using UAV-RGB image multi-feature factors and various classification methods. ISPRS Int. J. Geo-Inf. 2021, 10, 309. [Google Scholar] [CrossRef]
  27. Jin, B.; Ye, P.; Zhang, X.; Song, W.; Li, S. Object-Oriented method combined with deep convolutional neural networks for land-use-type classification of remote sensing images. J. Indian Soc. Remote 2019, 47, 951–965. [Google Scholar] [CrossRef]
  28. Li, W.; Jiang, N. Extraction of Winter Wheat Planting Area by Object-oriented Classification Method. J. Triticeae Crops 2012, 32, 701–705. [Google Scholar]
  29. Zhao, B.; Wang, X.; Yan, S.; Zhang, Y.; Zhang, T. Application of object-oriented classification method in the extraction of soil and water conservation measures. Sci. Soil Water Conserv. 2022, 20, 122–127. [Google Scholar] [CrossRef]
  30. Li, Q.; Liu, J.; Mi, X.; Yang, J.; Yu, T. Object-oriented crop classification for GF-6 WFV remote sensing images based on Convolutional Neural Network. J. Remote Sens. 2021, 25, 549–558. [Google Scholar] [CrossRef]
  31. Li, W.; Huang, W.; Dong, Y.; Chen, h.; Wang, J.; Shan, J. Estimation on winter wheat scab based on combination of temperature, humidity and remote sensing vegetation index. Trans. Chin. Soc. Agric. Eng. 2017, 33, 203–210. [Google Scholar] [CrossRef]
  32. Gu, X.; Li, W.; Wang, L. Understanding vegetation changes in northern China and Mongolia with change vector analysi. Springer Plus 2016, 5, 1780–1793. [Google Scholar] [CrossRef] [PubMed] [Green Version]
  33. Pei, H.; Sun, T.; Wang, X. Object-oriented land use/cover classification based on texture features of Landsat 8 OLI image. Trans. Chin. Soc. Agric. Eng. 2018, 34, 248–255. [Google Scholar] [CrossRef]
  34. Regniers, O.; Bombrun, L.; Lafon, V.; Germain, C. Supervised classification of very high resolution optical images using wavelet-based textural features. IEEE Trans. Geosci. Remote 2016, 54, 3722–3735. [Google Scholar] [CrossRef] [Green Version]
  35. Wen, X.; Jia, M.; Li, X.; Wang, Z.; Zhong, C.; Feng, E. Identification of mangrove canopy species based on visible unmanned aerial vehicle images. J. Fores. Environ. 2020, 40, 486–496. [Google Scholar] [CrossRef]
  36. Wang, Y.; Fan, W.; Liu, C. An object-based fusion of QUICKBIRD data and RADARSAT SAR data for classification analysis. J. Northeast Fores. Univ. 2016, 44, 44–49. [Google Scholar] [CrossRef]
  37. Wu, Z.; Mao, Z.; Wang, Z.; Qiu, Y.; Shen, W. Shallow water depth retrieval from multi-scale multi-spectral satellite data: Take Sentinel-2A and Resource 3 as an example. Map. Spa. Geogr. Inform. 2019, 42, 12–16. [Google Scholar]
  38. Zhao, F.; Wu, X.; Wang, S. Object-oriented Vegetation Classification Method based on UAV and Satellite Image Fusion. Procedia Comput. Sci. 2020, 174, 609–615. [Google Scholar] [CrossRef]
  39. Nie, Q.; Qi, K.; Zhao, Y. Object-oriented classification of high resolution image combining super-pixel segmentation. Bull. Surv. Map. 2021, 6, 44–49. [Google Scholar] [CrossRef]
  40. Wan, J.; Zang, J.; Liu, S. Fusion and classification of SAR and optical image with consideration of polarization characteristics. Acta Opt. Sin. 2017, 37, 292–301. [Google Scholar] [CrossRef]
  41. Weng, Y.; Tian, Q. Analysis and Evaluation of Method on Remote Sensing Data Fusion. Remote Sens. Inform. 2003, 3, 49–54. [Google Scholar]
  42. LI, W.; Jiang, N.; GE, G. Analysis of Spectral Characteristics Based on Optical Remote Sensing and SAR Image Fusion. Agric. Sci. Technol. 2014, 15, 2035–2038+2040. [Google Scholar] [CrossRef]
Figure 1. Study area of winter wheat planting area extraction based on object-oriented classification.
Remotesensing 15 00164 g001
Figure 2. Training samples and test samples for object-oriented classification.
Remotesensing 15 00164 g002
Figure 3. The reflectivity of main objects in HJ satellite image.
Remotesensing 15 00164 g003
Figure 4. Intuitive comparison between fused images at different scales and original images of local area. (a) GF-1/PMS 2 m panchromatic image; (b) 2 m × 2 m fused image; (c) 8 m × 8 m fused image; (d) 16 m × 16 m fused image; (e) 24 m × 24 m fused image; (f) HJ-1/CCD 30 m multispectral image.
Remotesensing 15 00164 g004
Figure 5. Object-oriented classification results for different combinations of training samples and images. (a) classification combination 1, using SFI to classify RI16m; (b) classification combination 2, using SFI to classify FI16m; (c) classification combination 3, using SRI to classify RI16m.
Remotesensing 15 00164 g005
Table 1. Fused image quality evaluation indicators.
Evaluation IndicatorsFormulaReference
Mean Value 1 M × N i = 1 M j = 1 N F ( i , j ) [6]
Standard Deviation 1 M × N i = 1 M j = 1 N ( F ( i , j ) - μ ) 2 [8]
Average Gradient 1 M × N i = 1 M j = 1 N [ ( F ( i , j ) x ) 2 + ( F ( i , j ) y ) 2 ] / 2 [25]
Correlation Coefficient i = 1 M j = 1 N ( F 1 ( i , j ) - μ 1 ) ( F 2 ( i , j ) - μ 2 ) ( i = 1 M j = 1 N ( F 1 ( i , j ) - μ 1 ) 2 ) ( i = 1 M j = 1 N ( F 2 ( i , j ) - μ 2 ) 2 ) [25]
M: row number of the image; N: column number of the image; F: gray value of the fused image; i: row number of each pixel in the image of the same band; j: column number of each pixel in the image of the same band; “μ”: mean image value; ∂F(i,j)/∂x: horizontal gradient of the fused image; ∂F(i,j)/∂y: vertical gradient of the fused image; F1 and: gray values before image fusion; F2: gray values after image fusion; μ1: mean values before image fusion; μ2: mean values after image fusion.
Table 2. Texture feature indicators of object-oriented classification.
Texture Feature
Indicators
FormulaReference
Homogeneity i = 0 N - 1 j = 0 N - 1 P ( i , j ) 1 + ( i - j ) 2 [28]
Entropy i = 0 N - 1 j = 0 N - 1 P ( i , j ) [ - lnP ( i , j ) ] [28]
Angular Second Moment i = 0 N - 1 j = 0 N - 1 P ( i , j ) 2 [28]
Contrast i = 0 N - 1 j = 0 N - 1 P ( i , j ) ( i - j ) 2 [28]
P (i, j): gray value of the image at pixel (i, j); N: gray level of the image.
Table 3. Evaluation indices of different scale fused images of local area.
Scale of FusionMean ValueStandard DeviationAverage GradientCorrelation Coefficient
2 m × 2 m160.9878.601.810.95
8 m × 8 m161.0182.932.970.96
16 m × 16 m161.1583.014.550.97
24 m × 24 m165.0383.596.130.85
Table 4. Statistics of texture characteristics of three vegetation types in FI16m.
Vegetation TypeHomogeneityEntropyAngular Second MomentContrast
winter wheat0.801.390.310.66
rape0.721.120.320.70
other vegetation0.601.270.211.33
Table 5. Vegetation area information extracted from different classification combinations of training samples and images.
Classification CombinationsTraining SampleImageWinter Wheat
(hm2)
Rape
(hm2)
Other Vegetation
(hm2)
Combination OneSFIRI16m22,78329957386
Combination TwoSFIFI16m21,11730697239
Combination ThreeSRIRI16m23,14833605835
Table 6. Classification accuracy evaluation of different classification combinations of training samples and images.
Classification CombinationsTraining SampleImageAccuracyWater
(%)
Buildings and Roads
(%)
Winter Wheat
(%)
Rape
(%)
Other Vegetation
(%)
Overall Accuracy
(%)
Kappa Coefficient
Combination OneSFIRI16mProducer Accuracy90.0092.0097.7885.0091.4392.220.90
User Accuracy96.4393.8891.6789.4788.89
Combination TwoSFIFI16mProducer Accuracy93.3396.0097.7890.0091.4394.440.93
User Accuracy10090.5710085.7194.12
Combination ThreeSRIRI16mProducer Accuracy83.3386.0093.3370.0080.0084.440.80
User Accuracy83.3382.7091.3073.6884.85
Disclaimer/Publisher’s Note: The statements, opinions and data contained in all publications are solely those of the individual author(s) and contributor(s) and not of MDPI and/or the editor(s). MDPI and/or the editor(s) disclaim responsibility for any injury to people or property resulting from any ideas, methods, instructions or products referred to in the content.

