
A Framework for Survey Planning Using Portable Unmanned Aerial Vehicles (pUAVs) in Coastal Hydro-Environment


Abstract
:1. Introduction
2. Materials and Methods
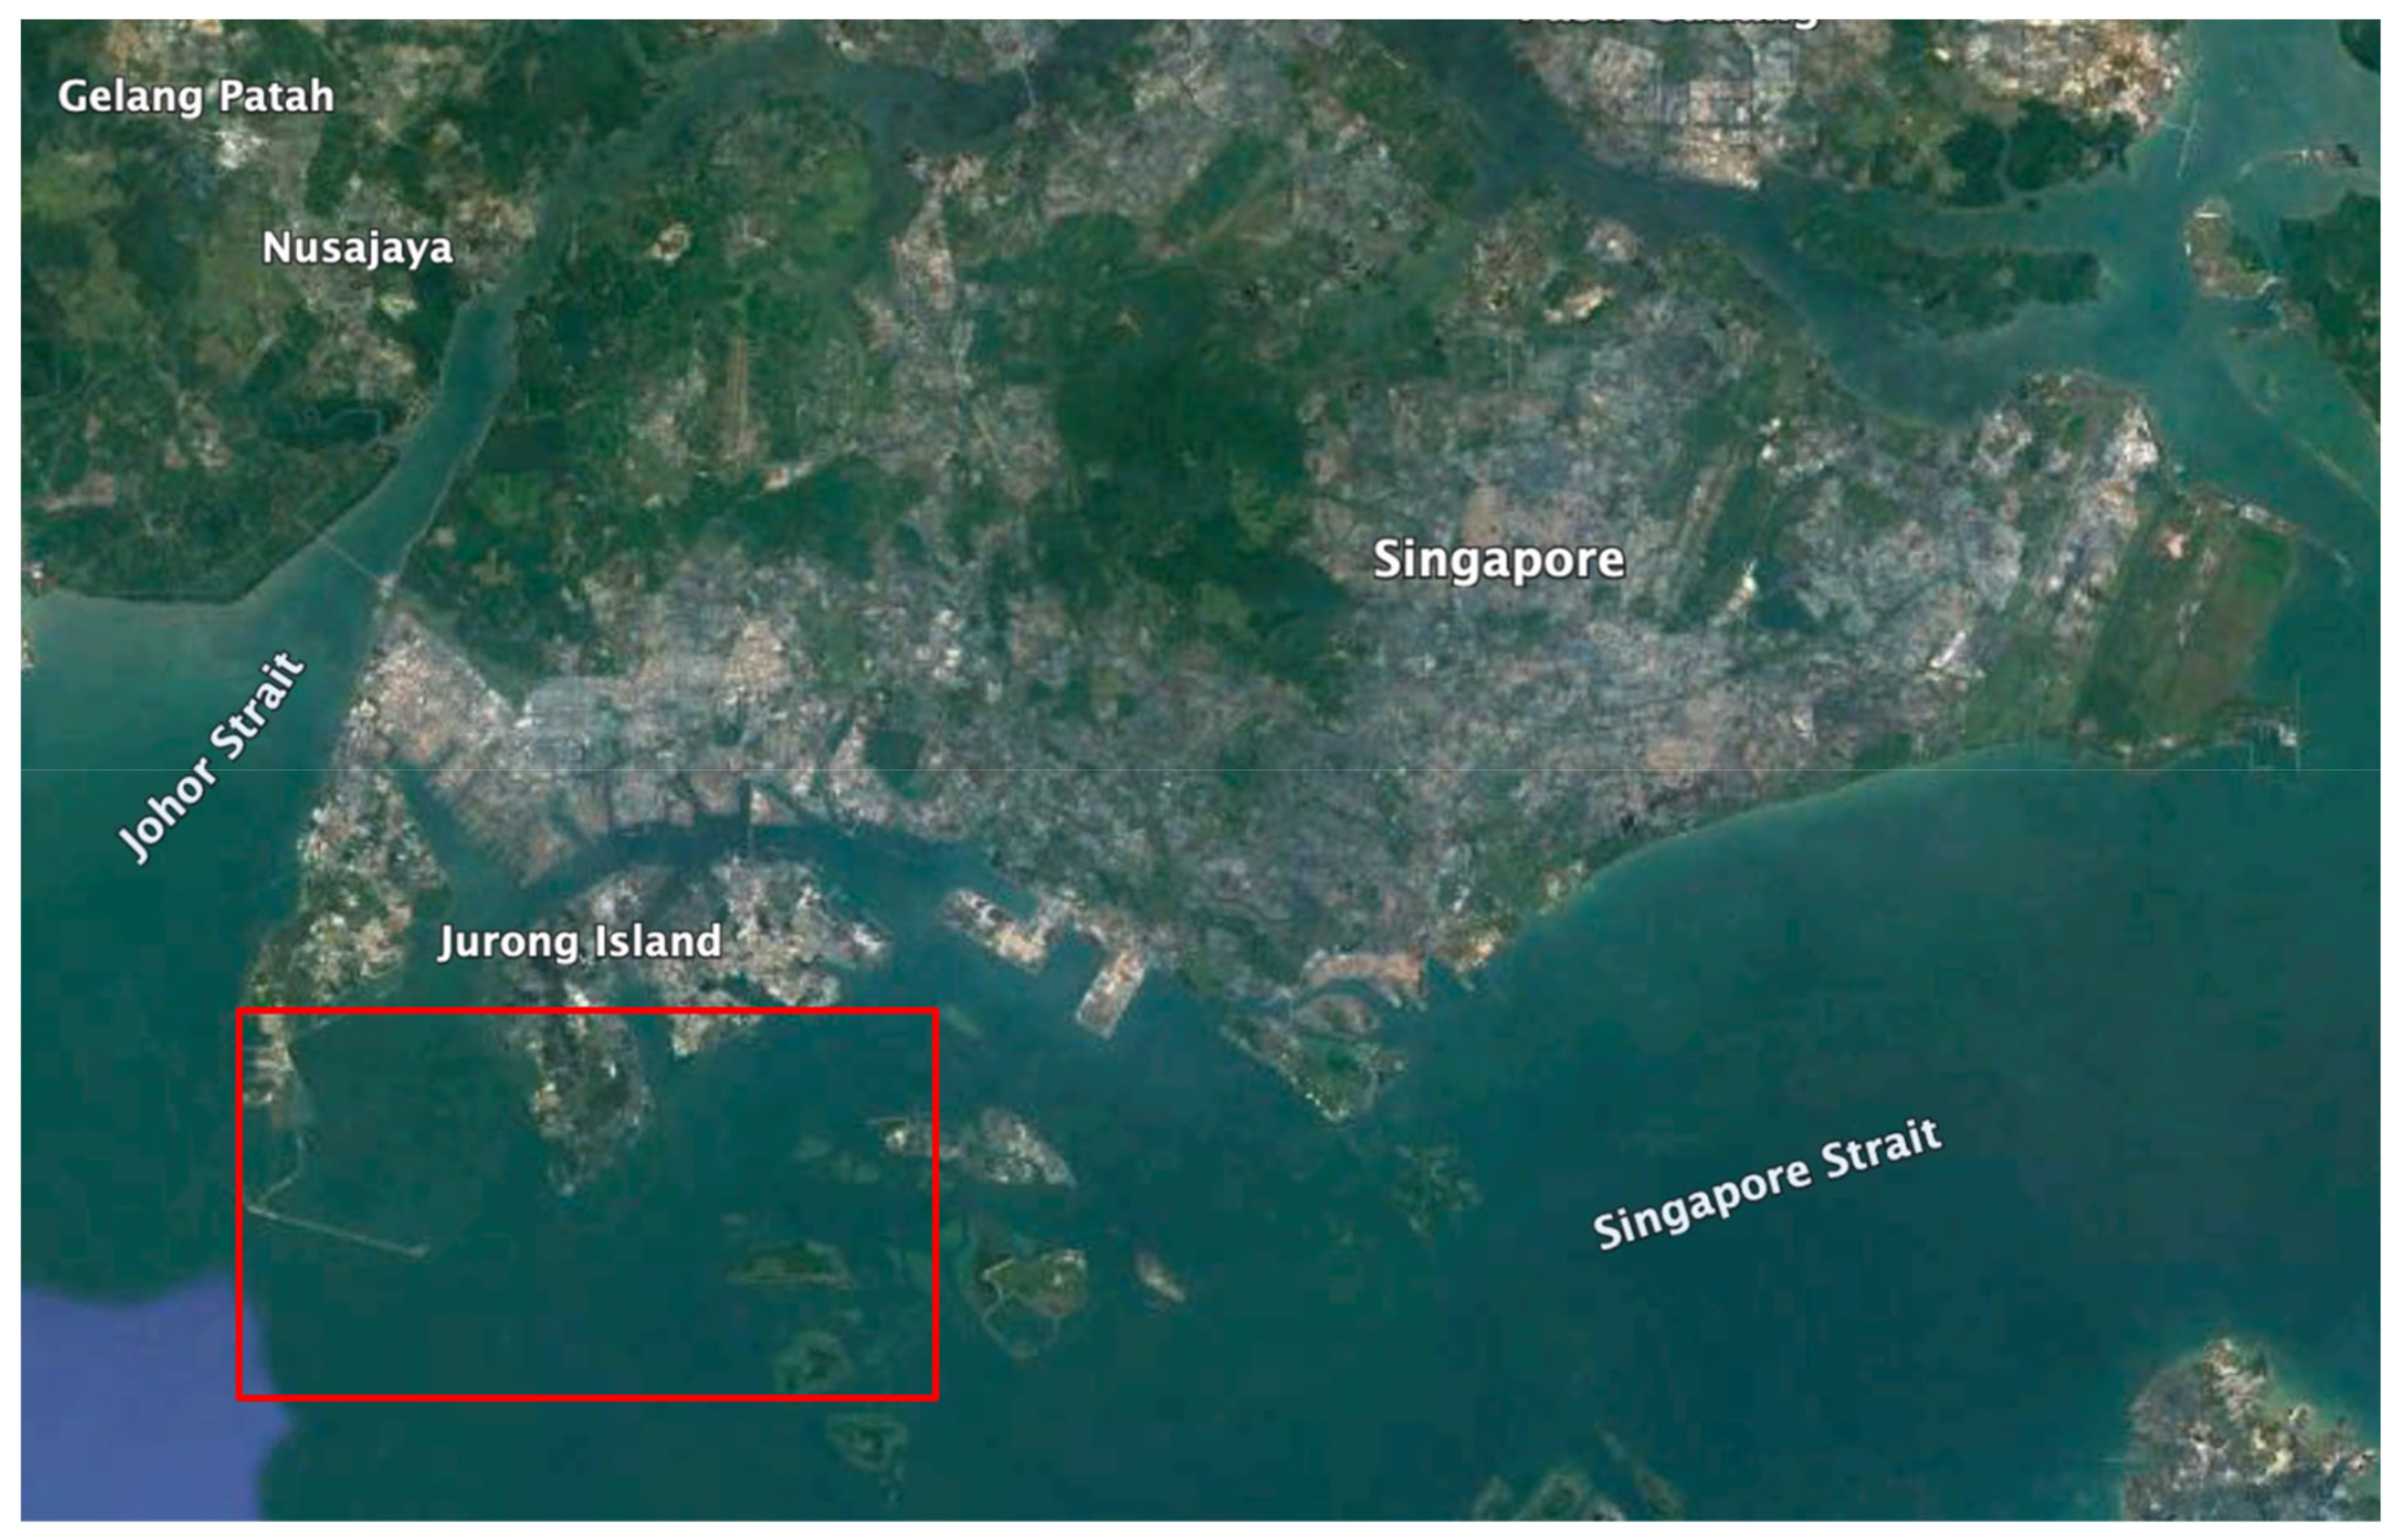
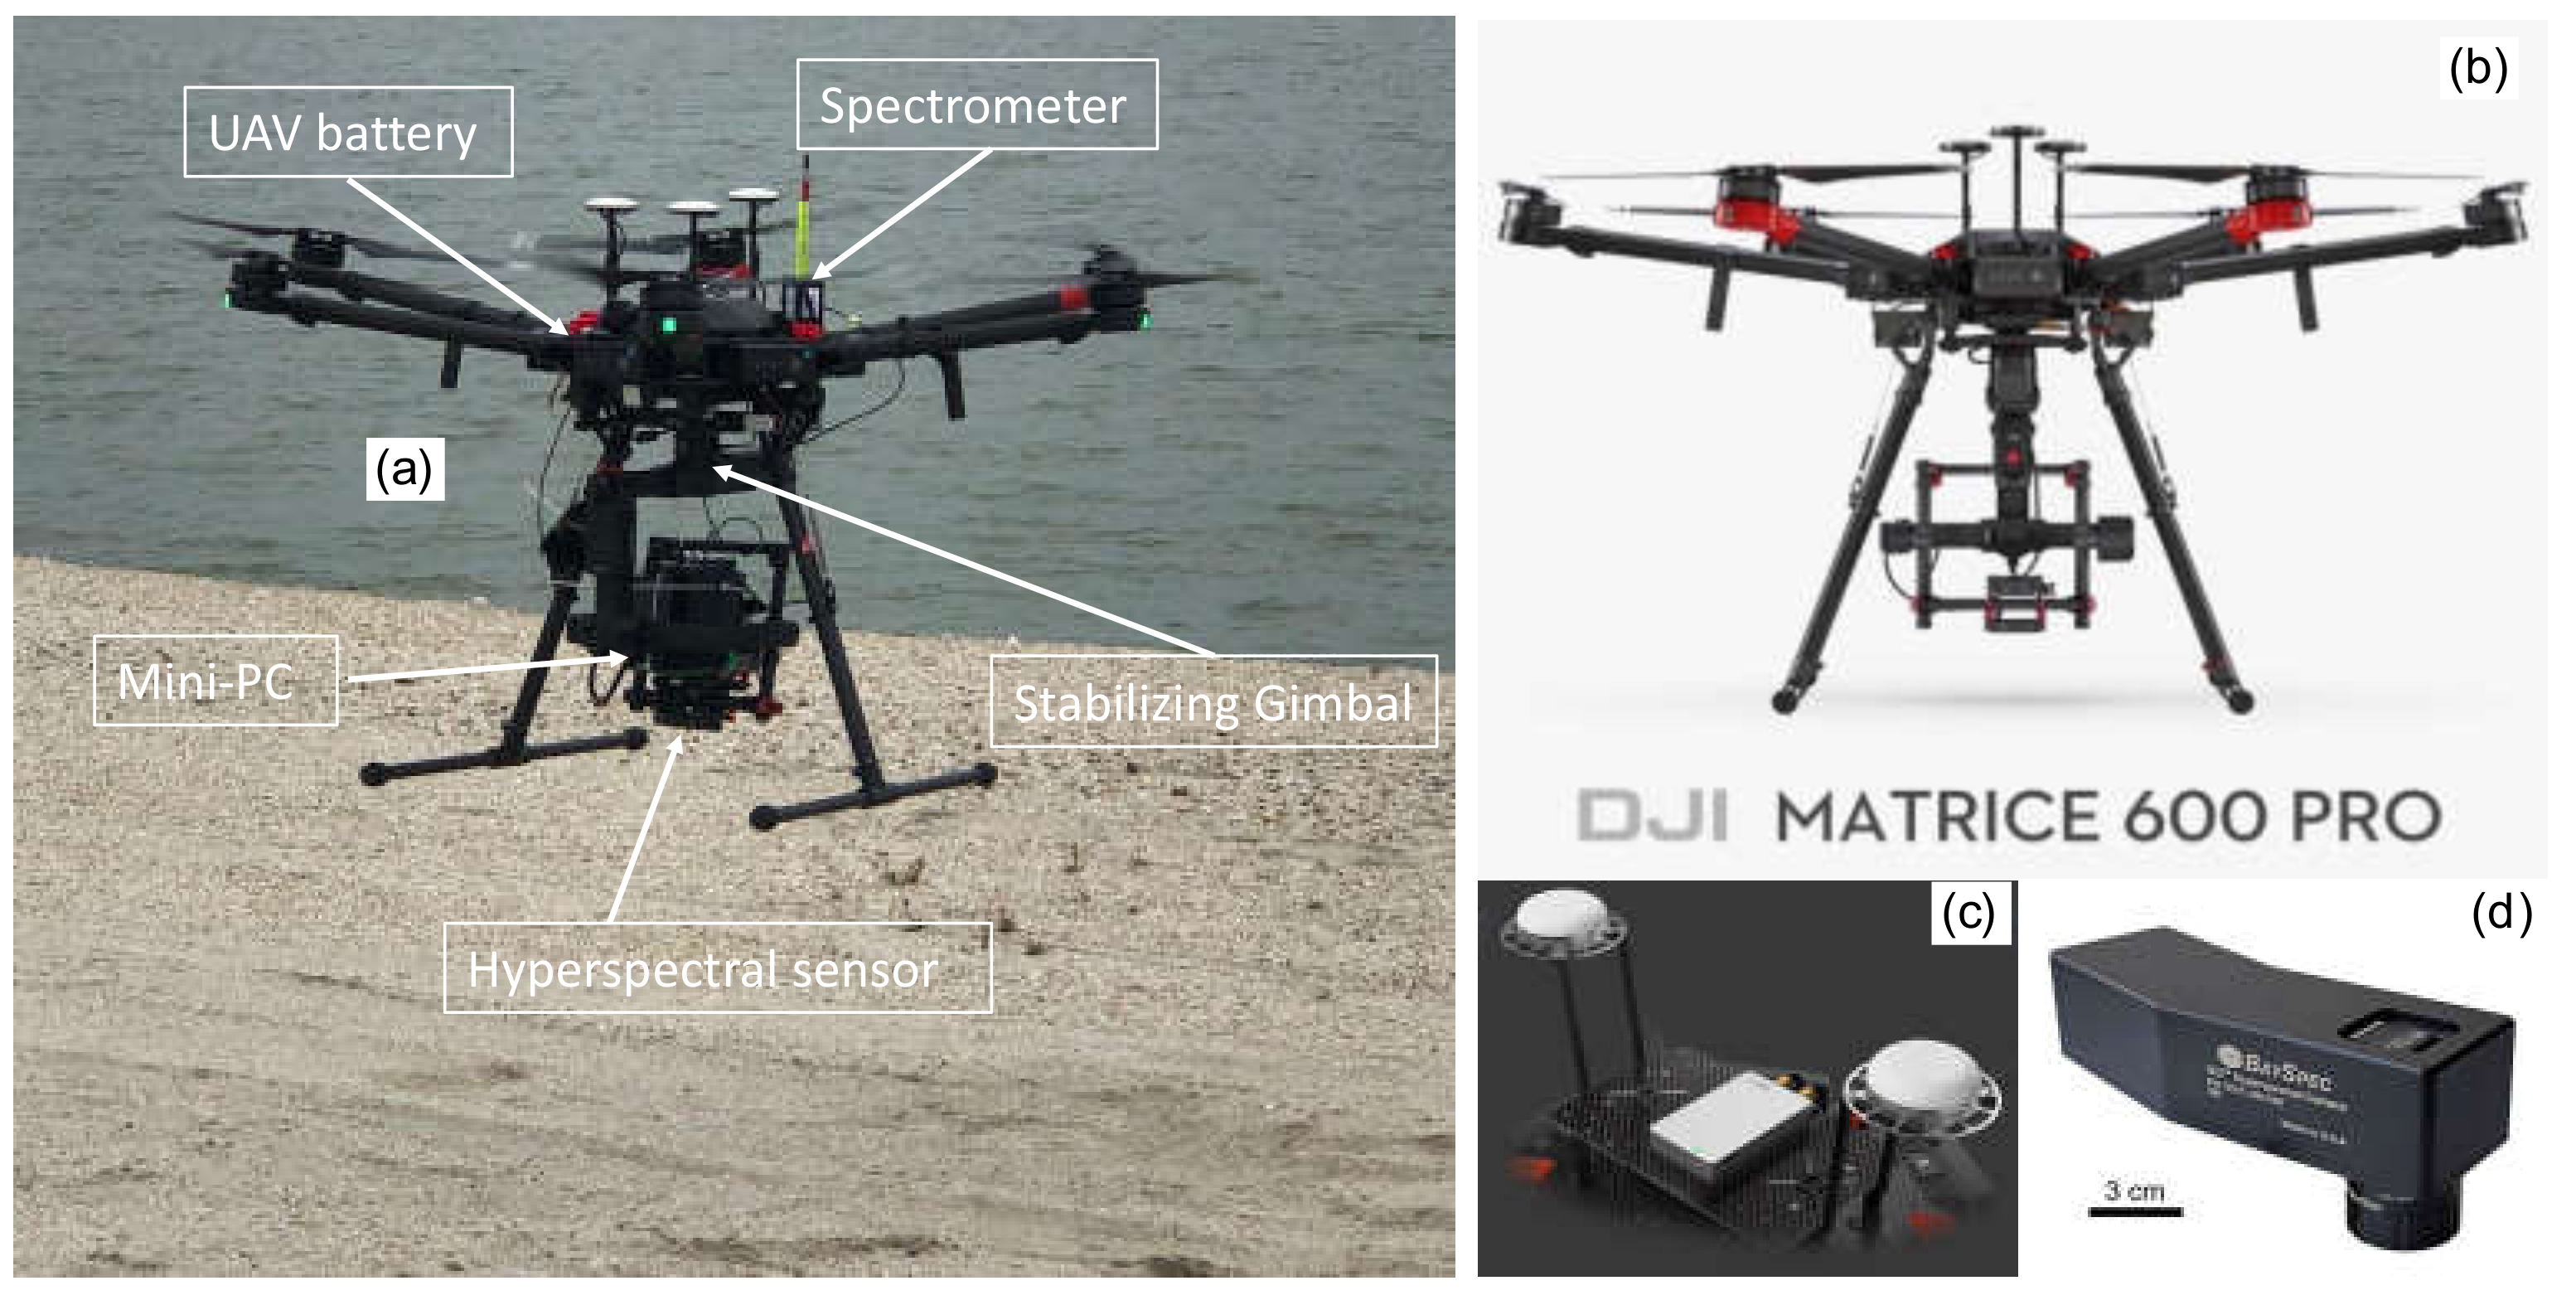
2.1. Case Study and Equipment
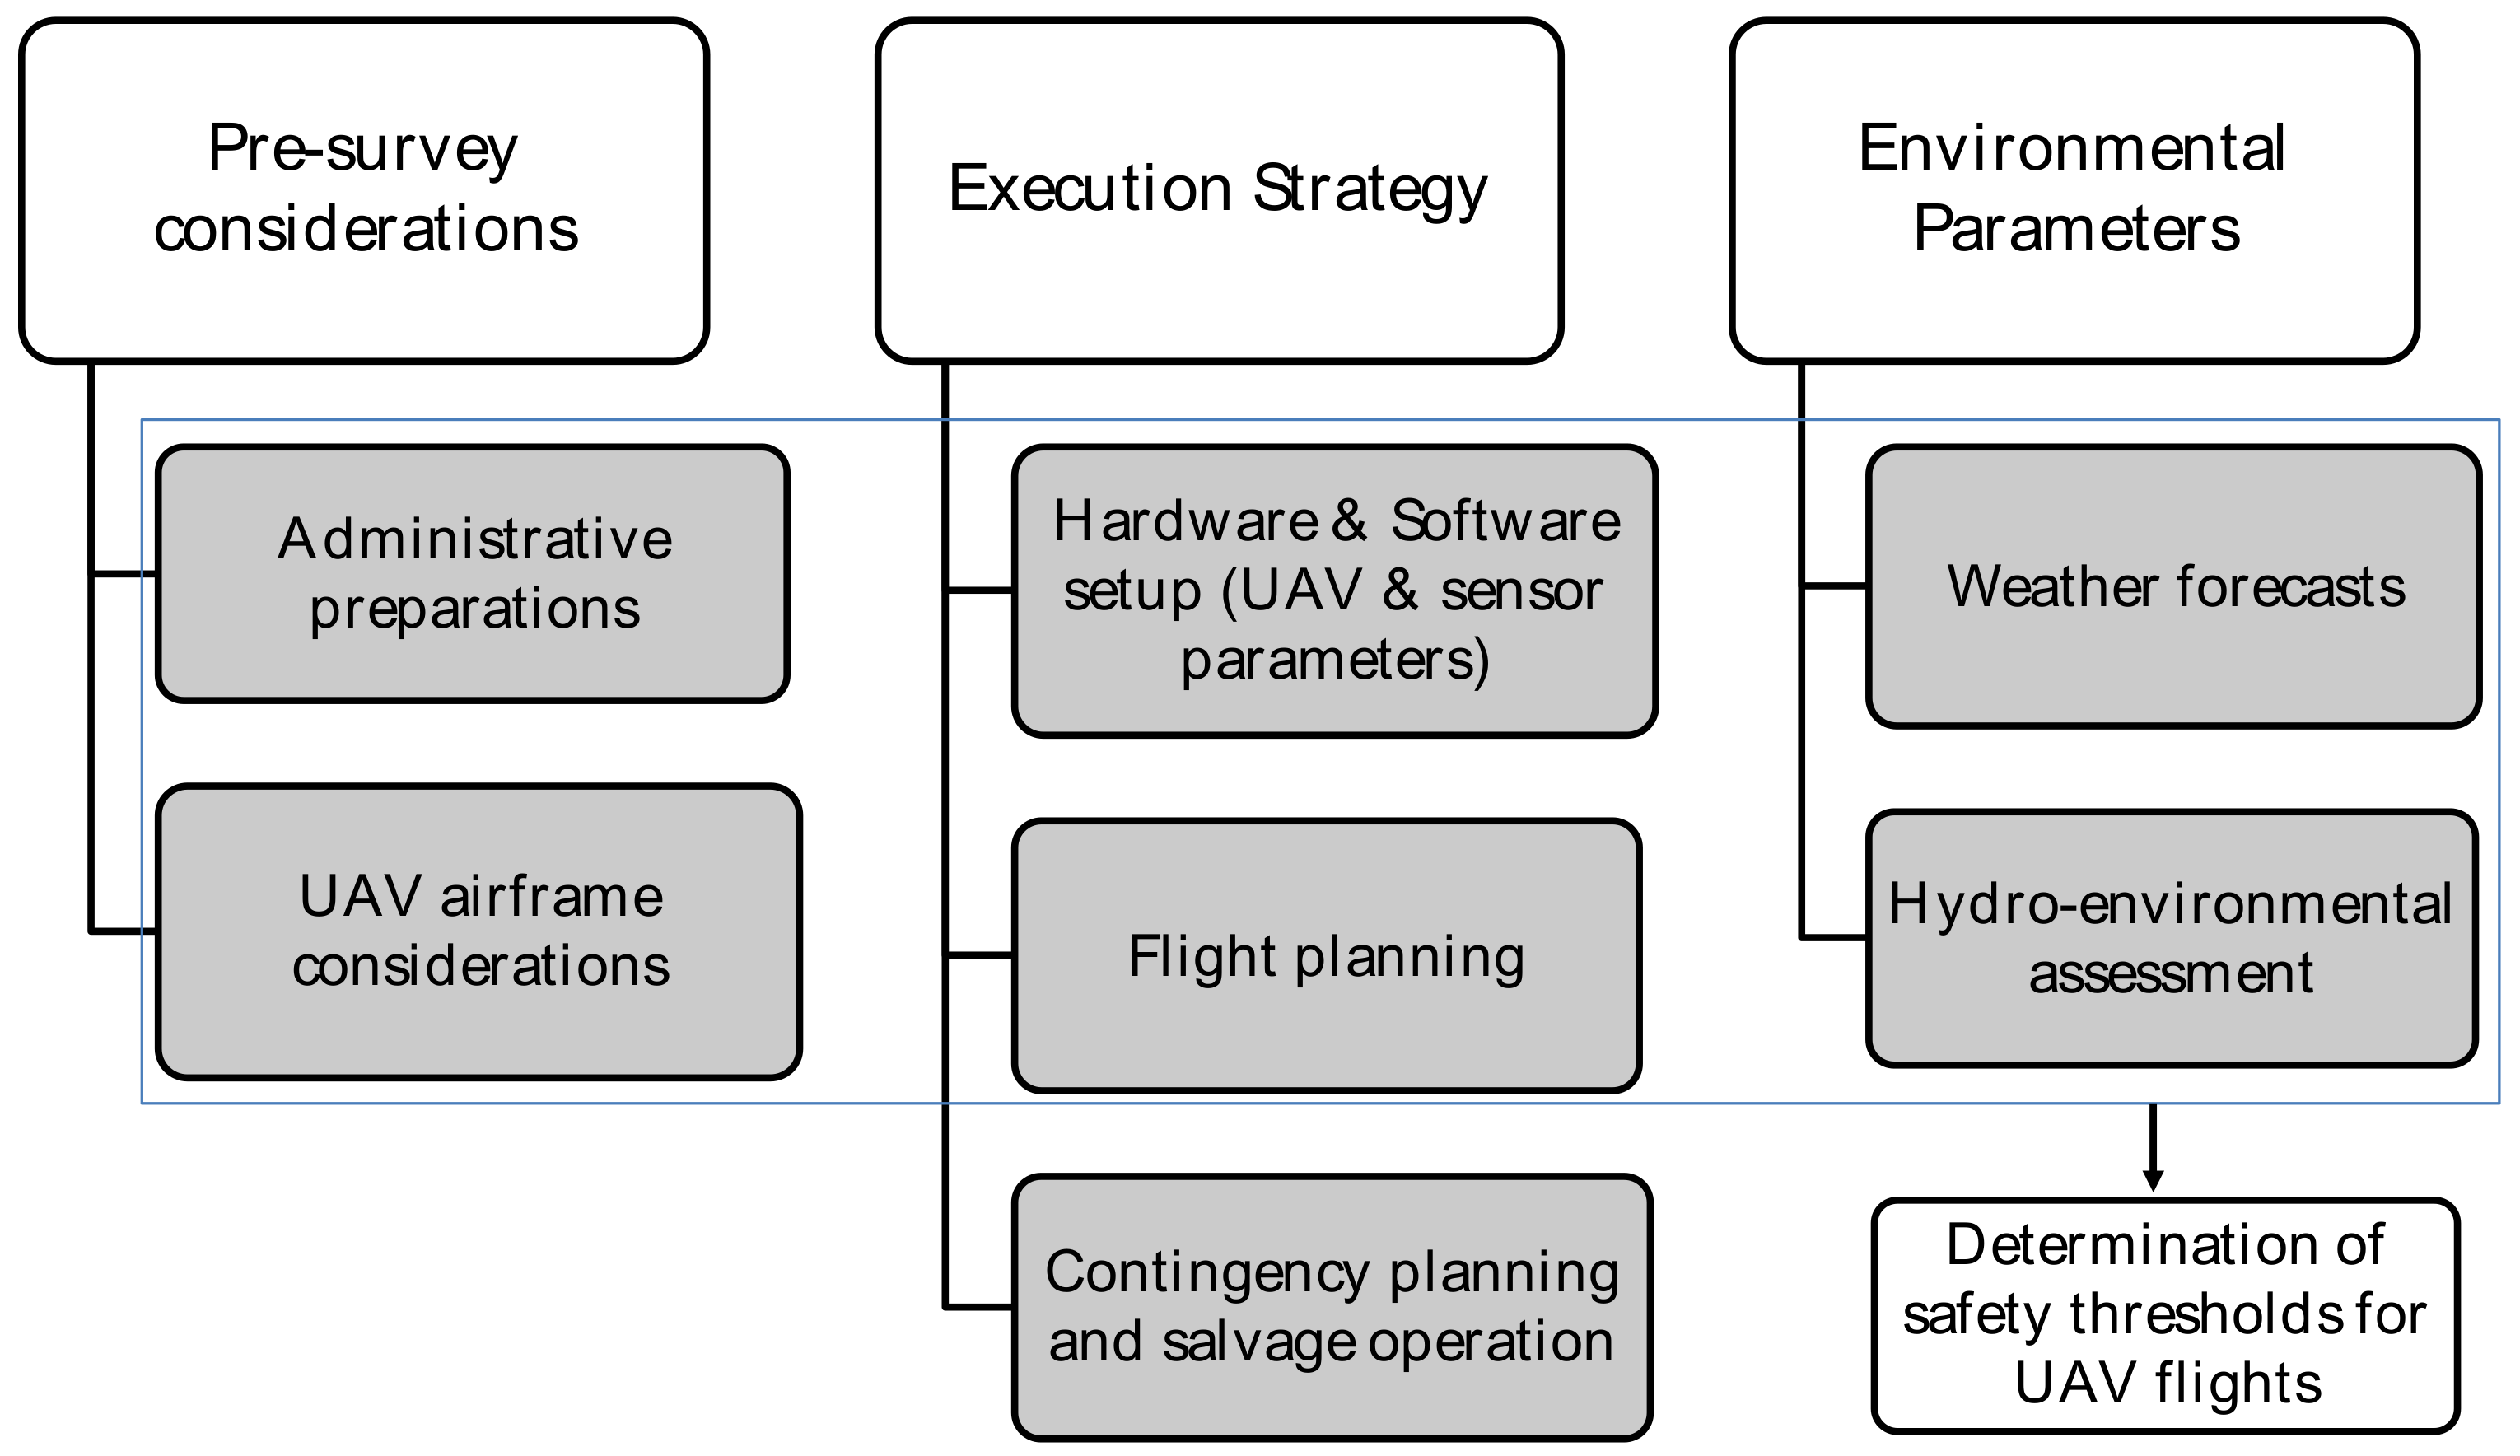
2.2. UAV-Based Remote Sensing Framework
3. Pre-Survey Considerations
3.1. Administrative Preparation
3.1.1. Permits and Licenses
3.1.2. UAV Regulations
- UAPL holders should consult the OneMap app (www.Onemap.sg, accessed on 10 March 2022) in permissible areas to operate a UAV. Areas such as controlled airspace or within 5 km of a registered aerodrome disallow drone operation without prior approval;
- UAVs must always fly within visual line-of-sight of the operator (400 m);
- UAVs must be clear of any members of the public who are not associated with the flight operation;
- UAVs should fly below 200 ft above mean sea level (AMSL), which is equivalent to 60 m;
- All UAVs with a total weight exceeding 250 g must be registered with CAAS before operation.
3.2. UAV Airframe Considerations
3.2.1. Airframe Configuration
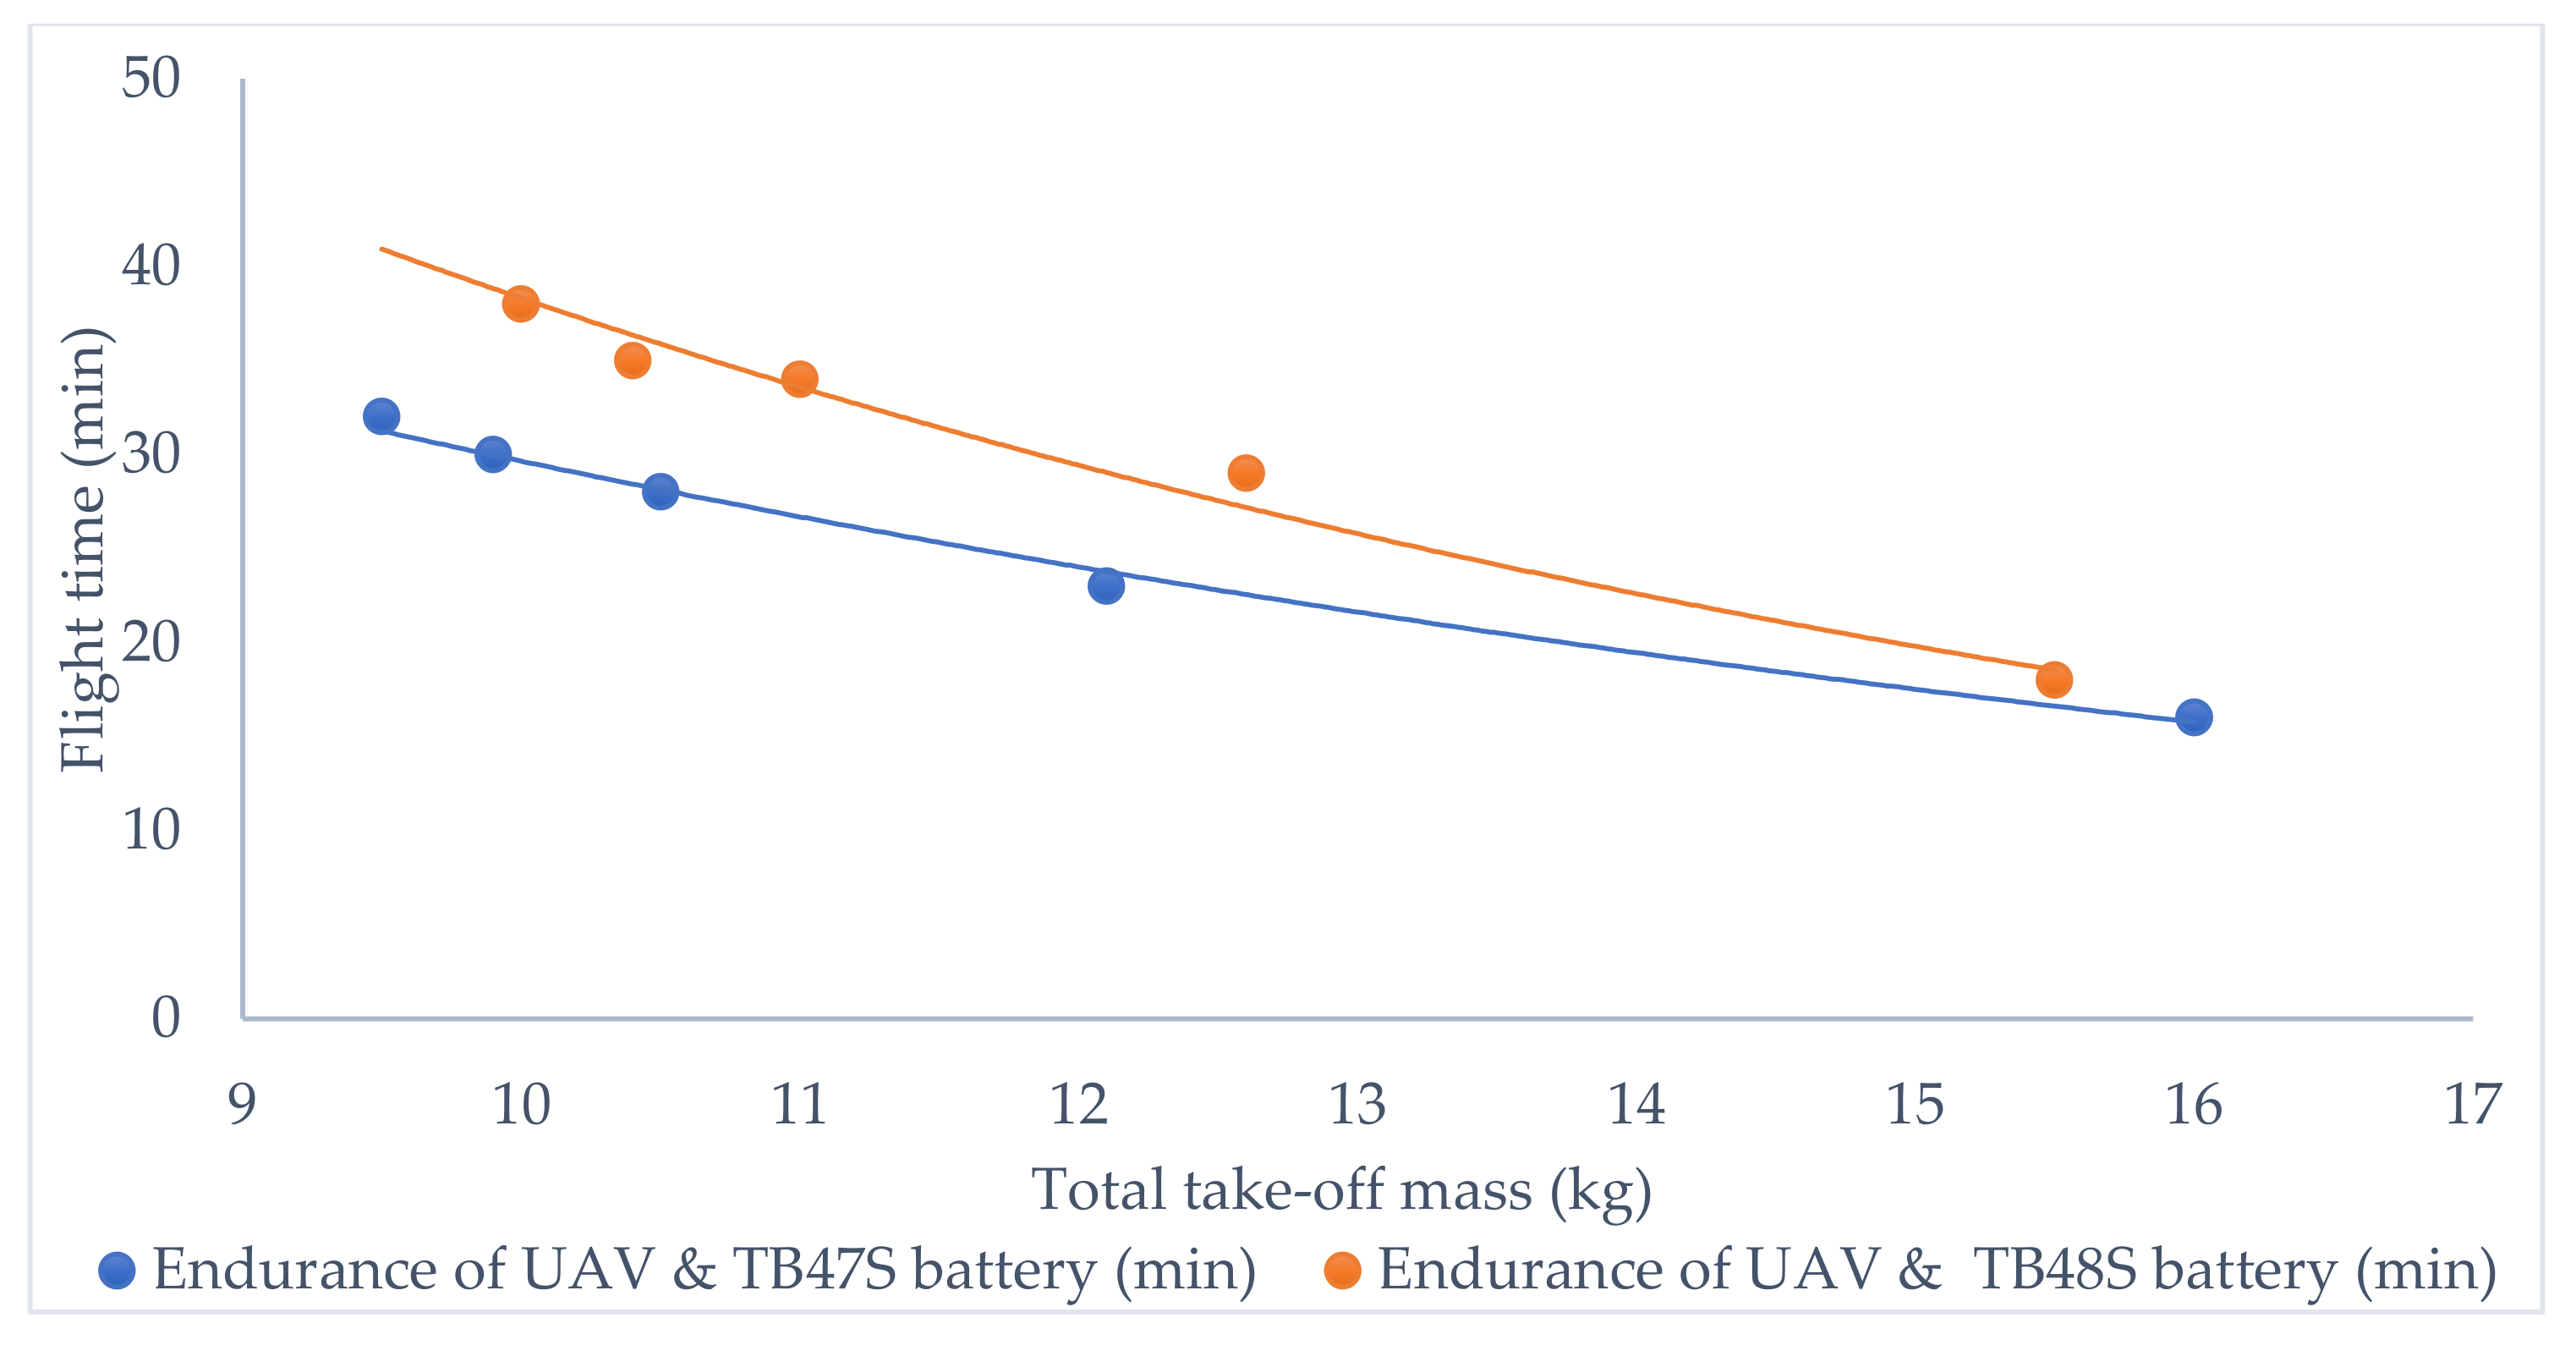
3.2.2. Payload and Maximal Endurance
4. Execution Strategy
4.1. Parameters for Flight Planning
4.1.1. UAV and Sensor Parameters
- Place white reference paper under the camera and ensure that it covers the entire field of view of the camera;
- No shadow should be cast on the white reference paper. When necessary, the angle of the drone should be adjusted to ensure that the camera and the white reference paper are pointing toward the source of light;
- During the calibration, auto-exposure should be performed when illumination is the brightest. However, the exposure time should be fine-tuned by adjusting camera gain according to the light conditions;
- When the exposure time is more than 10 m/s, camera gain should be increased to lower the exposure time. However, when camera gain is already at the maximum, exposure time should be manually set at ~10 m/s to minimize interference;
- Calibrate with dark reference (e.g., using the camera cover) after calibrating with the white reference, while maintaining the gain and exposure time;
- The Global Positioning System (GPS) of the sensors must be connected and its flight altitude set to the same height as the height of the UAV in the flight planning app;
- Ensure that the focus of the camera is set to infinity.
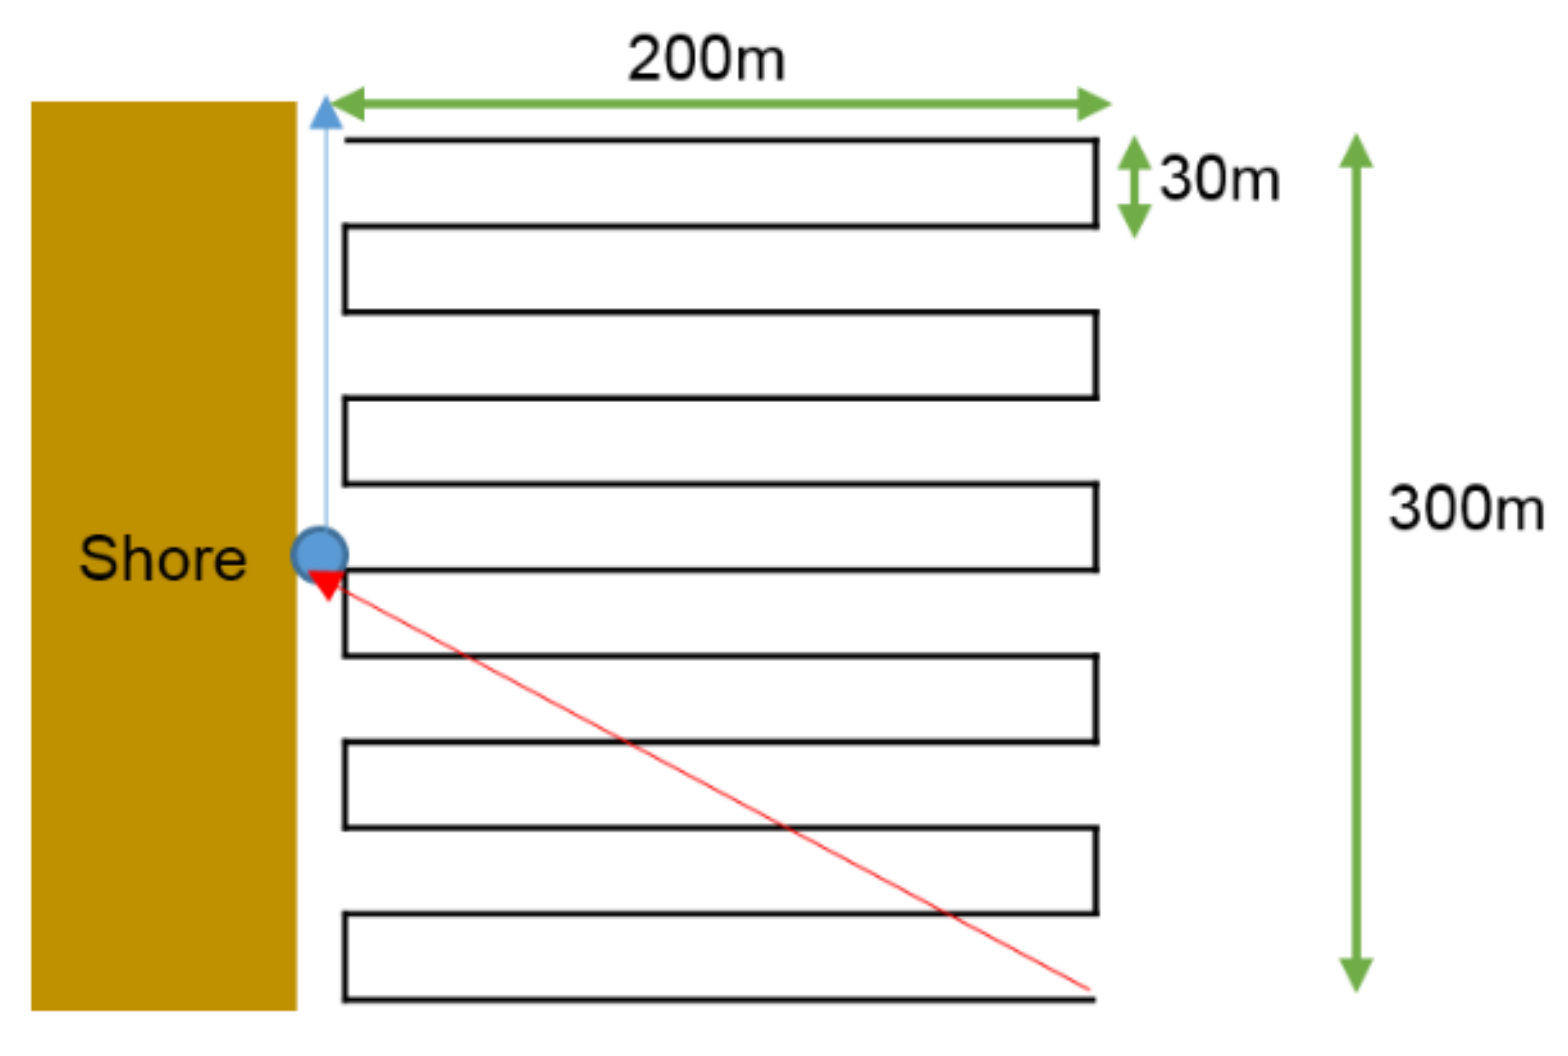
4.1.2. Flight Parameters
4.2. Contingency Planning and Salvage Preparation
5. Environmental Factors
5.1. Weather Forecasts
5.1.1. Wind Speed Fluctuations
5.1.2. Cloud Conditions
5.1.3. Rain and Humidity
5.2. Hydro-Environmental Assessments
5.2.1. Sun Position and Angles
5.2.2. Tidal and Wave Conditions
5.2.3. Movement of Marine Vehicles
6. Results and Discussion
6.1. Results
6.2. Discussion
7. Conclusions
Author Contributions
Funding
Institutional Review Board Statement
Informed Consent Statement
Data Availability Statement
Acknowledgments
Conflicts of Interest
Appendix A

| Component | Model/Number | Specification | Weight (kg) |
|---|---|---|---|
| Portable Rotary- UAV (Battery included) | DJI Matrice M600 Pro [14] |
| 9.5 (With six TB47S batteries)10 (With six TB48S batteries) |
| Hyperspectral Sensor | BaySpec OCI-F Hyperspectral Camera [15] |
| 0.6 |
| Gimbal Stabilizer | DJI Ronin MX Gimbal [28] |
| 4.5 |
| Georeferencing System | D-RTK GNSS System [29] |
| 0.14 |
| Onboard Calibration Spectrometer | Ocean Optics Flame-SVIS-NIR Spectrometer |
| 0.3 |
| Mini PC for Data Storage | Intel NUC |
| 0.48 |
| Power Supply for Spectral Sensor | Omni Mobile 25600 Charger [30] |
| 0.58 |
| TOTAL WEIGHT | 15.5–16 | ||
Appendix B


References
- Cillero Castro, C.; Domínguez Gómez, J.A.; Delgado Martín, J.; Hinojo Sánchez, B.A.; Cereijo Arango, J.L.; Cheda Tuya, F.A.; Díaz-Varela, R. An UAV and Satellite Multispectral Data Approach to Monitor Water Quality in Small Reservoirs. Remote Sens. 2020, 12, 1514. [Google Scholar] [CrossRef]
- Klemas, V.V. Coastal and environmental remote sensing from unmanned aerial vehicles: An overview. J. Coast. Res. 2015, 31, 1260–1267. [Google Scholar] [CrossRef] [Green Version]
- Johansen, K.; Dunne, A.F.; Tu, Y.-H.; Almashharawi, S.; Jones, B.H.; McCabe, M.F. Dye tracing and concentration mapping in coastal waters using unmanned aerial vehicles. Sci. Rep. 2022, 12, 1141. [Google Scholar] [CrossRef] [PubMed]
- Finkbeiner, M.; Stevenson, B.; Seaman, R. Guidance for Benthic Habitat Mapping: An Aerial Photographic Approach; NOAA: Washington, DC, USA, 2001.
- Vize, S.; Coggan, R. Review of Standards and Protocols for Seabed Habitat Mapping; MESH 2.1; European Commission: Brussels, Belgium, 2005. [Google Scholar]
- Duffy, J.P.; Cunliffe, A.M.; DeBell, L.; Sandbrook, C.; Wich, S.A.; Shutler, J.D.; Myers-Smith, I.H.; Varela, M.R.; Anderson, K. Location, location, location: Considerations when using lightweight drones in challenging environments. Remote Sens. Ecol. Conserv. 2018, 4, 7–19. [Google Scholar]
- Ratcliffe, N.; Guihen, D.; Robst, J.; Crofts, S.; Stanworth, A.; Enderlein, P. A protocol for the aerial survey of penguin colonies using UAVs. J. Unmanned Veh. Syst. 2015, 3, 95–101. [Google Scholar] [CrossRef] [Green Version]
- Doukari, M.; Batsaris, M.; Papakonstantinou, A.; Topouzelis, K. A protocol for aerial survey in coastal areas using UAS. Remote Sens. 2019, 11, 1913. [Google Scholar] [CrossRef] [Green Version]
- Cheng, L.; Tan, X.; Yao, D.; Xu, W.; Wu, H.; Chen, Y. A Fishery Water Quality Monitoring and Prediction Evaluation System for Floating UAV Based on Time Series. Sensors 2021, 21, 4451. [Google Scholar] [CrossRef] [PubMed]
- Koparan, C.; Koc, A.B.; Privette, C.V.; Sawyer, C.B. In situ water quality measurements using an unmanned aerial vehicle (UAV) system. Water 2018, 10, 264. [Google Scholar] [CrossRef] [Green Version]
- Cheng, K.; Chan, S.N.; Lee, J.H. Remote sensing of coastal algal blooms using unmanned aerial vehicles (UAVs). Mar. Pollut. Bull. 2020, 152, 110889. [Google Scholar] [CrossRef] [PubMed]
- McEliece, R.; Hinz, S.; Guarini, J.-M.; Coston-Guarini, J. Evaluation of Nearshore and Offshore Water Quality Assessment Using UAV Multispectral Imagery. Remote Sens. 2020, 12, 2258. [Google Scholar] [CrossRef]
- Koparan, C. UAV-Assisted Water Quality Monitoring; Clemson University: Clemson, SC, USA, 2020. [Google Scholar]
- DJI Matrice 600 Pro. Available online: https://www.dji.com/sg/matrice600-pro (accessed on 10 March 2022).
- BaySpec Inc. OCITM-F Hyperspectral Imager (VIS-NIR, SWIR). Available online: https://www.bayspec.com/spectroscopy/oci-f-hyperspectral-imager/ (accessed on 10 March 2022).
- Turner, I.L.; Harley, M.D.; Drummond, C.D. UAVs for coastal surveying. Coast. Eng. 2016, 114, 19–24. [Google Scholar] [CrossRef]
- Vélez-Nicolás, M.; García-López, S.; Barbero, L.; Ruiz-Ortiz, V.; Sánchez-Bellón, Á. Applications of unmanned aerial systems (UASs) in hydrology: A review. Remote Sens. 2021, 13, 1359. [Google Scholar] [CrossRef]
- Kieu, H.T.; Law, A.W.-K. Remote sensing of coastal hydro-environment with portable unmanned aerial vehicles (pUAVs) a state-of-the-art review. J. Hydro-Environ. Res. 2021, 37, 32–45. [Google Scholar] [CrossRef]
- Kwan, C.; Ayhan, B. Enhancing Safety of UAVs in National Airspace. In Proceedings of the 2019 IEEE 9th Annual Computing and Communication Workshop and Conference (CCWC), Las Vegas, NV, USA, 7–9 January 2019; pp. 617–622. [Google Scholar]
- Koparan, C.; Koc, A.B.; Privette, C.V.; Sawyer, C.B.; Sharp, J.L. Evaluation of a UAV-Assisted Autonomous Water Sampling. Water 2018, 10, 655. [Google Scholar] [CrossRef] [Green Version]
- Becker, R.H.; Sayers, M.; Dehm, D.; Shuchman, R.; Quintero, K.; Bosse, K.; Sawtell, R. Unmanned aerial system based spectroradiometer for monitoring harmful algal blooms: A new paradigm in water quality monitoring. J. Great Lakes Res. 2019, 45, 444–453. [Google Scholar] [CrossRef]
- Bushnaq, O.M.; Kishk, M.A.; Celik, A.; Alouini, M.-S.; Al-Naffouri, T.Y. Optimal deployment of tethered drones for maximum cellular coverage in user clusters. IEEE Trans. Wirel. Commun. 2020, 20, 2092–2108. [Google Scholar] [CrossRef]
- Kishk, M.A.; Bader, A.; Alouini, M.-S. On the 3-D placement of airborne base stations using tethered UAVs. IEEE Trans. Commun. 2020, 68, 5202–5215. [Google Scholar] [CrossRef]
- Doukari, M.; Papakonstantinou, A.; Batsaris, M.; Topouzelis, K. Preview of a protocol for UAV data collection in coastal areas. In Proceedings of the Sixth International Conference on Remote Sensing and Geoinformation of the Environment (RSCy2018), Paphos, Cyprus, 26–29 March 2018; p. 1077314. [Google Scholar]
- Doukari, M.; Batsaris, M.; Topouzelis, K. UASea: A Data Acquisition Toolbox for Improving Marine Habitat Mapping. Drones 2021, 5, 73. [Google Scholar] [CrossRef]
- Liu, H.; Yu, T.; Hu, B.; Hou, X.; Zhang, Z.; Liu, X.; Liu, J.; Wang, X.; Zhong, J.; Tan, Z.; et al. UAV-Borne Hyperspectral Imaging Remote Sensing System Based on Acousto-Optic Tunable Filter for Water Quality Monitoring. Remote Sens. 2021, 13, 4069. [Google Scholar] [CrossRef]
- Jaud, M.; Le Dantec, N.; Ammann, J.; Grandjean, P.; Constantin, D.; Akhtman, Y.; Barbieux, K.; Allemand, P.; Delacourt, C.; Merminod, B. Direct georeferencing of a pushbroom, lightweight hyperspectral system for mini-UAV applications. Remote Sens. 2018, 10, 204. [Google Scholar] [CrossRef] [Green Version]
- DJI Ronin MX. Available online: https://www.dji.com/sg/ronin-mx (accessed on 10 March 2022).
- DJI D-RTK GNSS. Available online: https://www.dji.com/sg/d-rtk/info (accessed on 10 March 2022).
- OmniCharger Inc. Omni Mobile 25600. Available online: https://www.omnicharge.co/products/omni-mobile-25600 (accessed on 10 March 2022).


| Multi-Rotor Platform (pUAV) | Fixed-Wing Platform (fUAV) | |||
|---|---|---|---|---|
| Vélez-Nicolás et al. [17] | Device used in this study (i.e., DJI M600 Pro) | Vélez-Nicolás et al. [17] | Device for reference (i.e., Sensefly eBee) | |
| Wingspan | 35 to 150 cm | 167 cm | 157cm | 96 to 116cm |
| Maximum Take-off Mass | 15.5 kg (Including payload) | 1.7 kg (Including payload) | ||
| Maximum Endurance | 15 to 50 min | 18 min | 15 to 50 min | 40 to 45 min |
| Crush Speed (No wind) | Max 18 m/s | 12 to 25 m/s | ||
| Wind Resistivity | 10 to 15 m/s | 8 m/s | 8 to 20 m/s | 12.8 m/s |
| Spatial Coverage | 20 to 40 ha | 4 ha (Flight altitude: 60 m) | 80 to 320 ha | 30 ha (Flight altitude: 60 m) |
| Maneuverability | High | Medium | ||
| Take-off/Landing Capability | Able to take-off or land vertically (VTOL) | Require a runway (e.g., 100 m) or catapult or hand launch | ||
| UAV Airborne System: DJI M600 Pro and BaySpec OCI™-F Hyperspectral Imager | |
|---|---|
| Flight Mode | Waypoints (Scan mode perpendicular to course) |
| Flight Duration | ~11 min |
| Velocity | 5 m/s |
| Flight Height | 60 m AMSL |
| Image Overlap | ~30 |
| Flight Lines | ~1 line/10 m of the dimension |
| Flight Angle | 107 degrees |
| Causes | Challenges | Measures | |
|---|---|---|---|
| Loss of Communication |
|
|
|
| Failure of UAV Engines |
|
|
| Measures | Pros | Cons |
|---|---|---|
| Tethered Drone Station |
|
|
| Water Rescue Device (i.e., float, buoy, etc.) |
|
|
| Diver and Safety Boat |
|
|
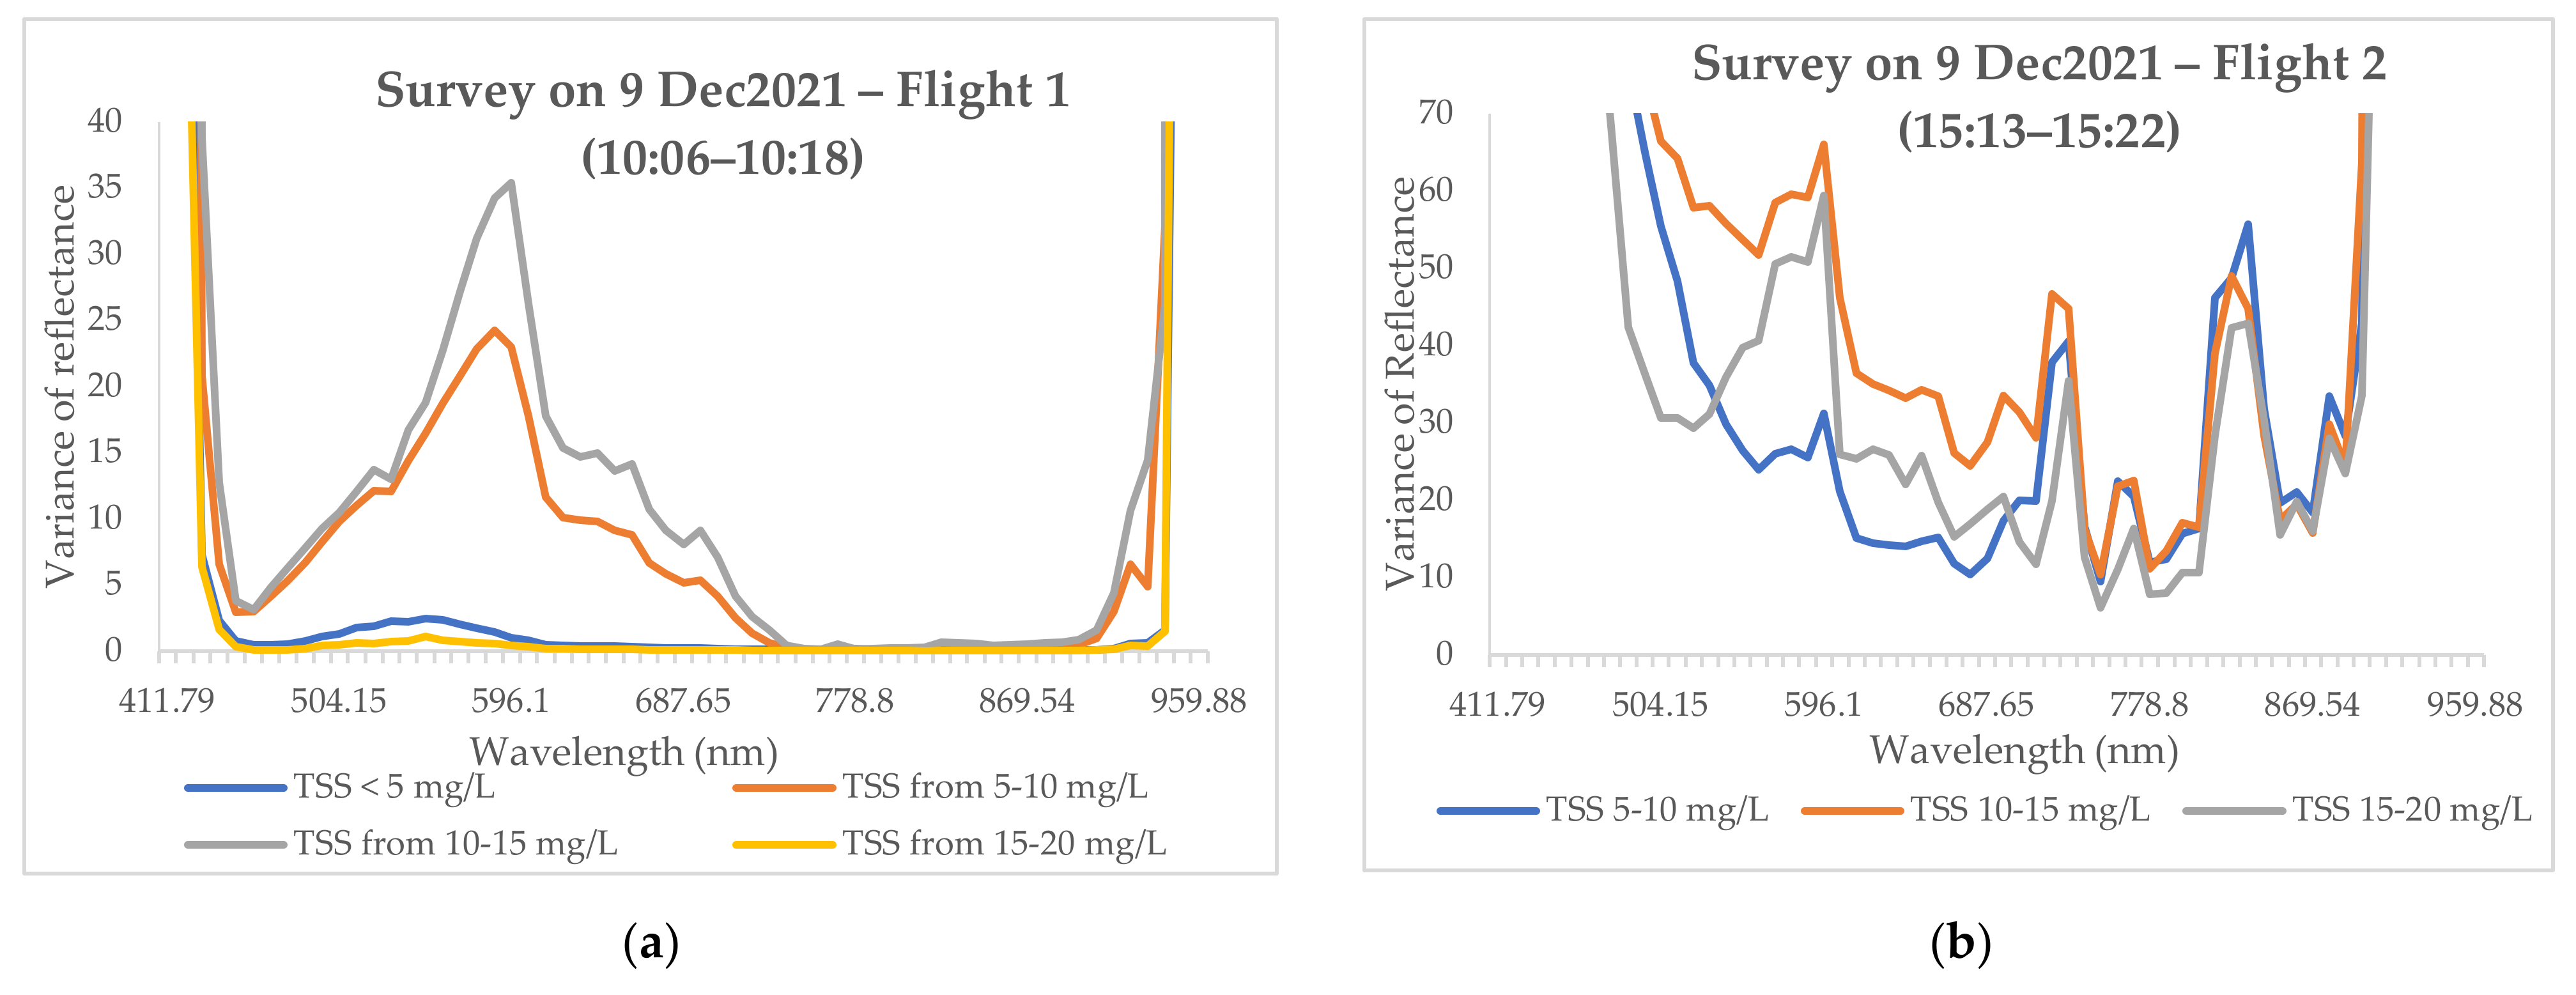
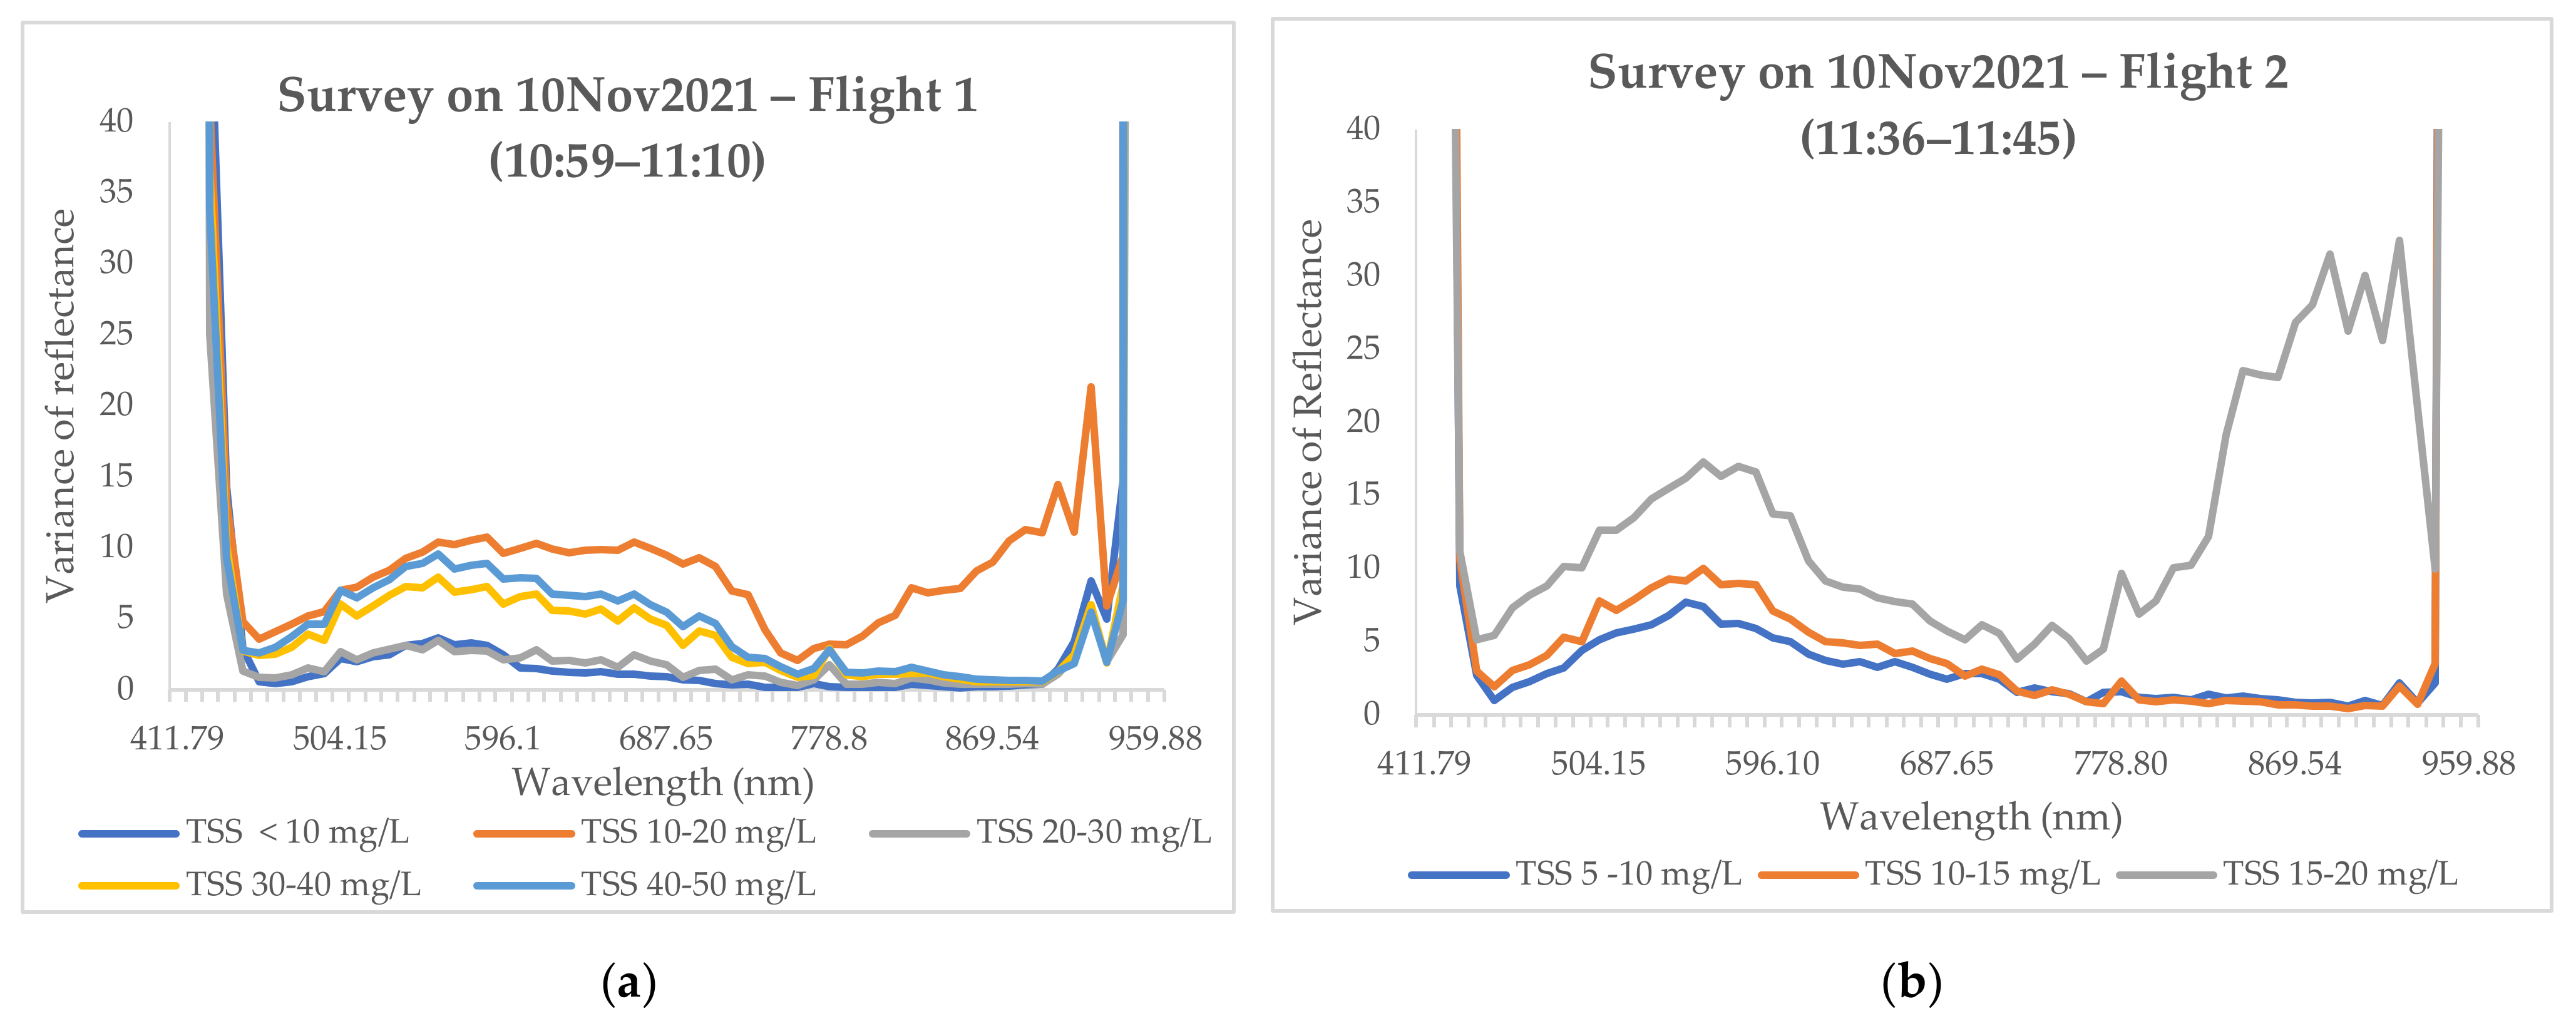
| Flight Time of UAV Survey | 10 November 2021 | 9 December 2021 | 13 January 2022 | |||
|---|---|---|---|---|---|---|
| 10:59–11:10 | 11:36–11:45 | 10:06–10:18 | 16:13–16:22 | 16:04–16:11 | 16:28–16:36 | |
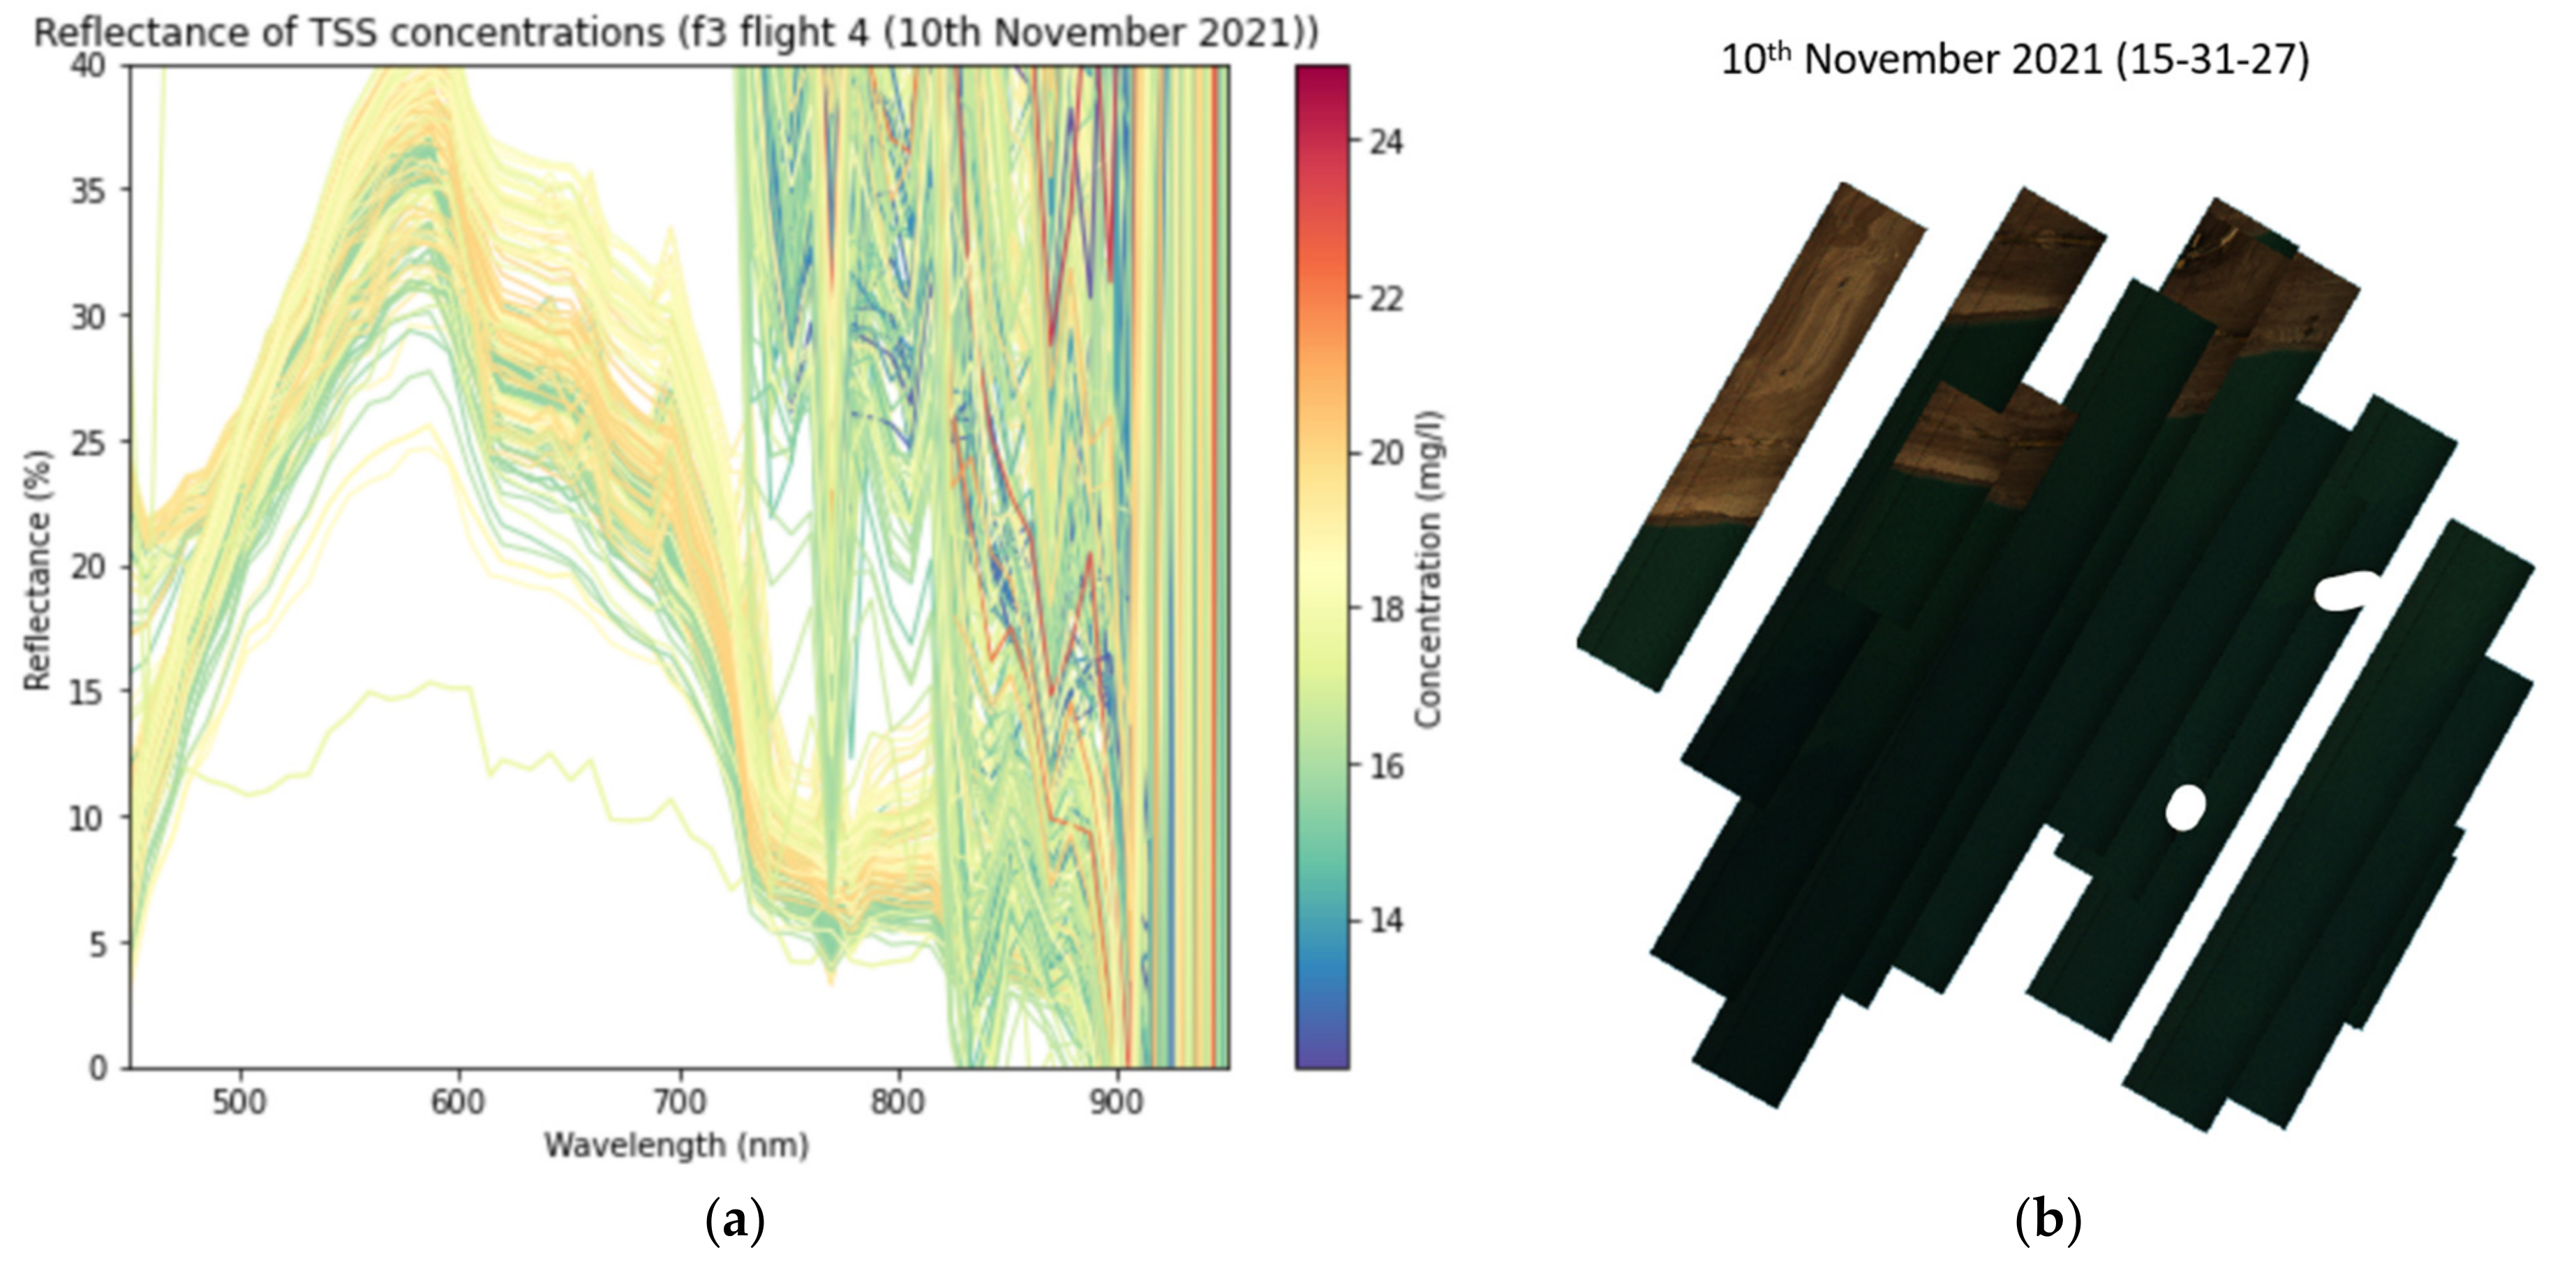
| TSS Concentration (mg/L) | 8.3–43.9 | 5.9–19.89 | 3.7–11.7 | 6.3–16.8 | 4.4–53.9 | 4.9–122.1 |
| Air Temperature (°C) | 27–28 | 27–28 | 28–29 | 26–27 | 32–33 | 31–32 |
| Water Temperature (°C) | 29.5–30 | 29.5–30 | 29–30 | 29–30 | 28–29.5 | 28–29 |
| Relative Humidity (%) | 83–85 | 80–81 | 71–73 | 88–94 | 44–49 | 43–51 |
| Wind Speed (m/s) | 2.3–3.2 | 3.9–4.2 | 0.4–4.0 | 0.9–2.8 | 1.3–3.9 | 1.7–3.6 |
| Sun Angle * (degree) | 68–70 | 71–72 | 53–56 | 35–37 | 28–33 | 35–39 |
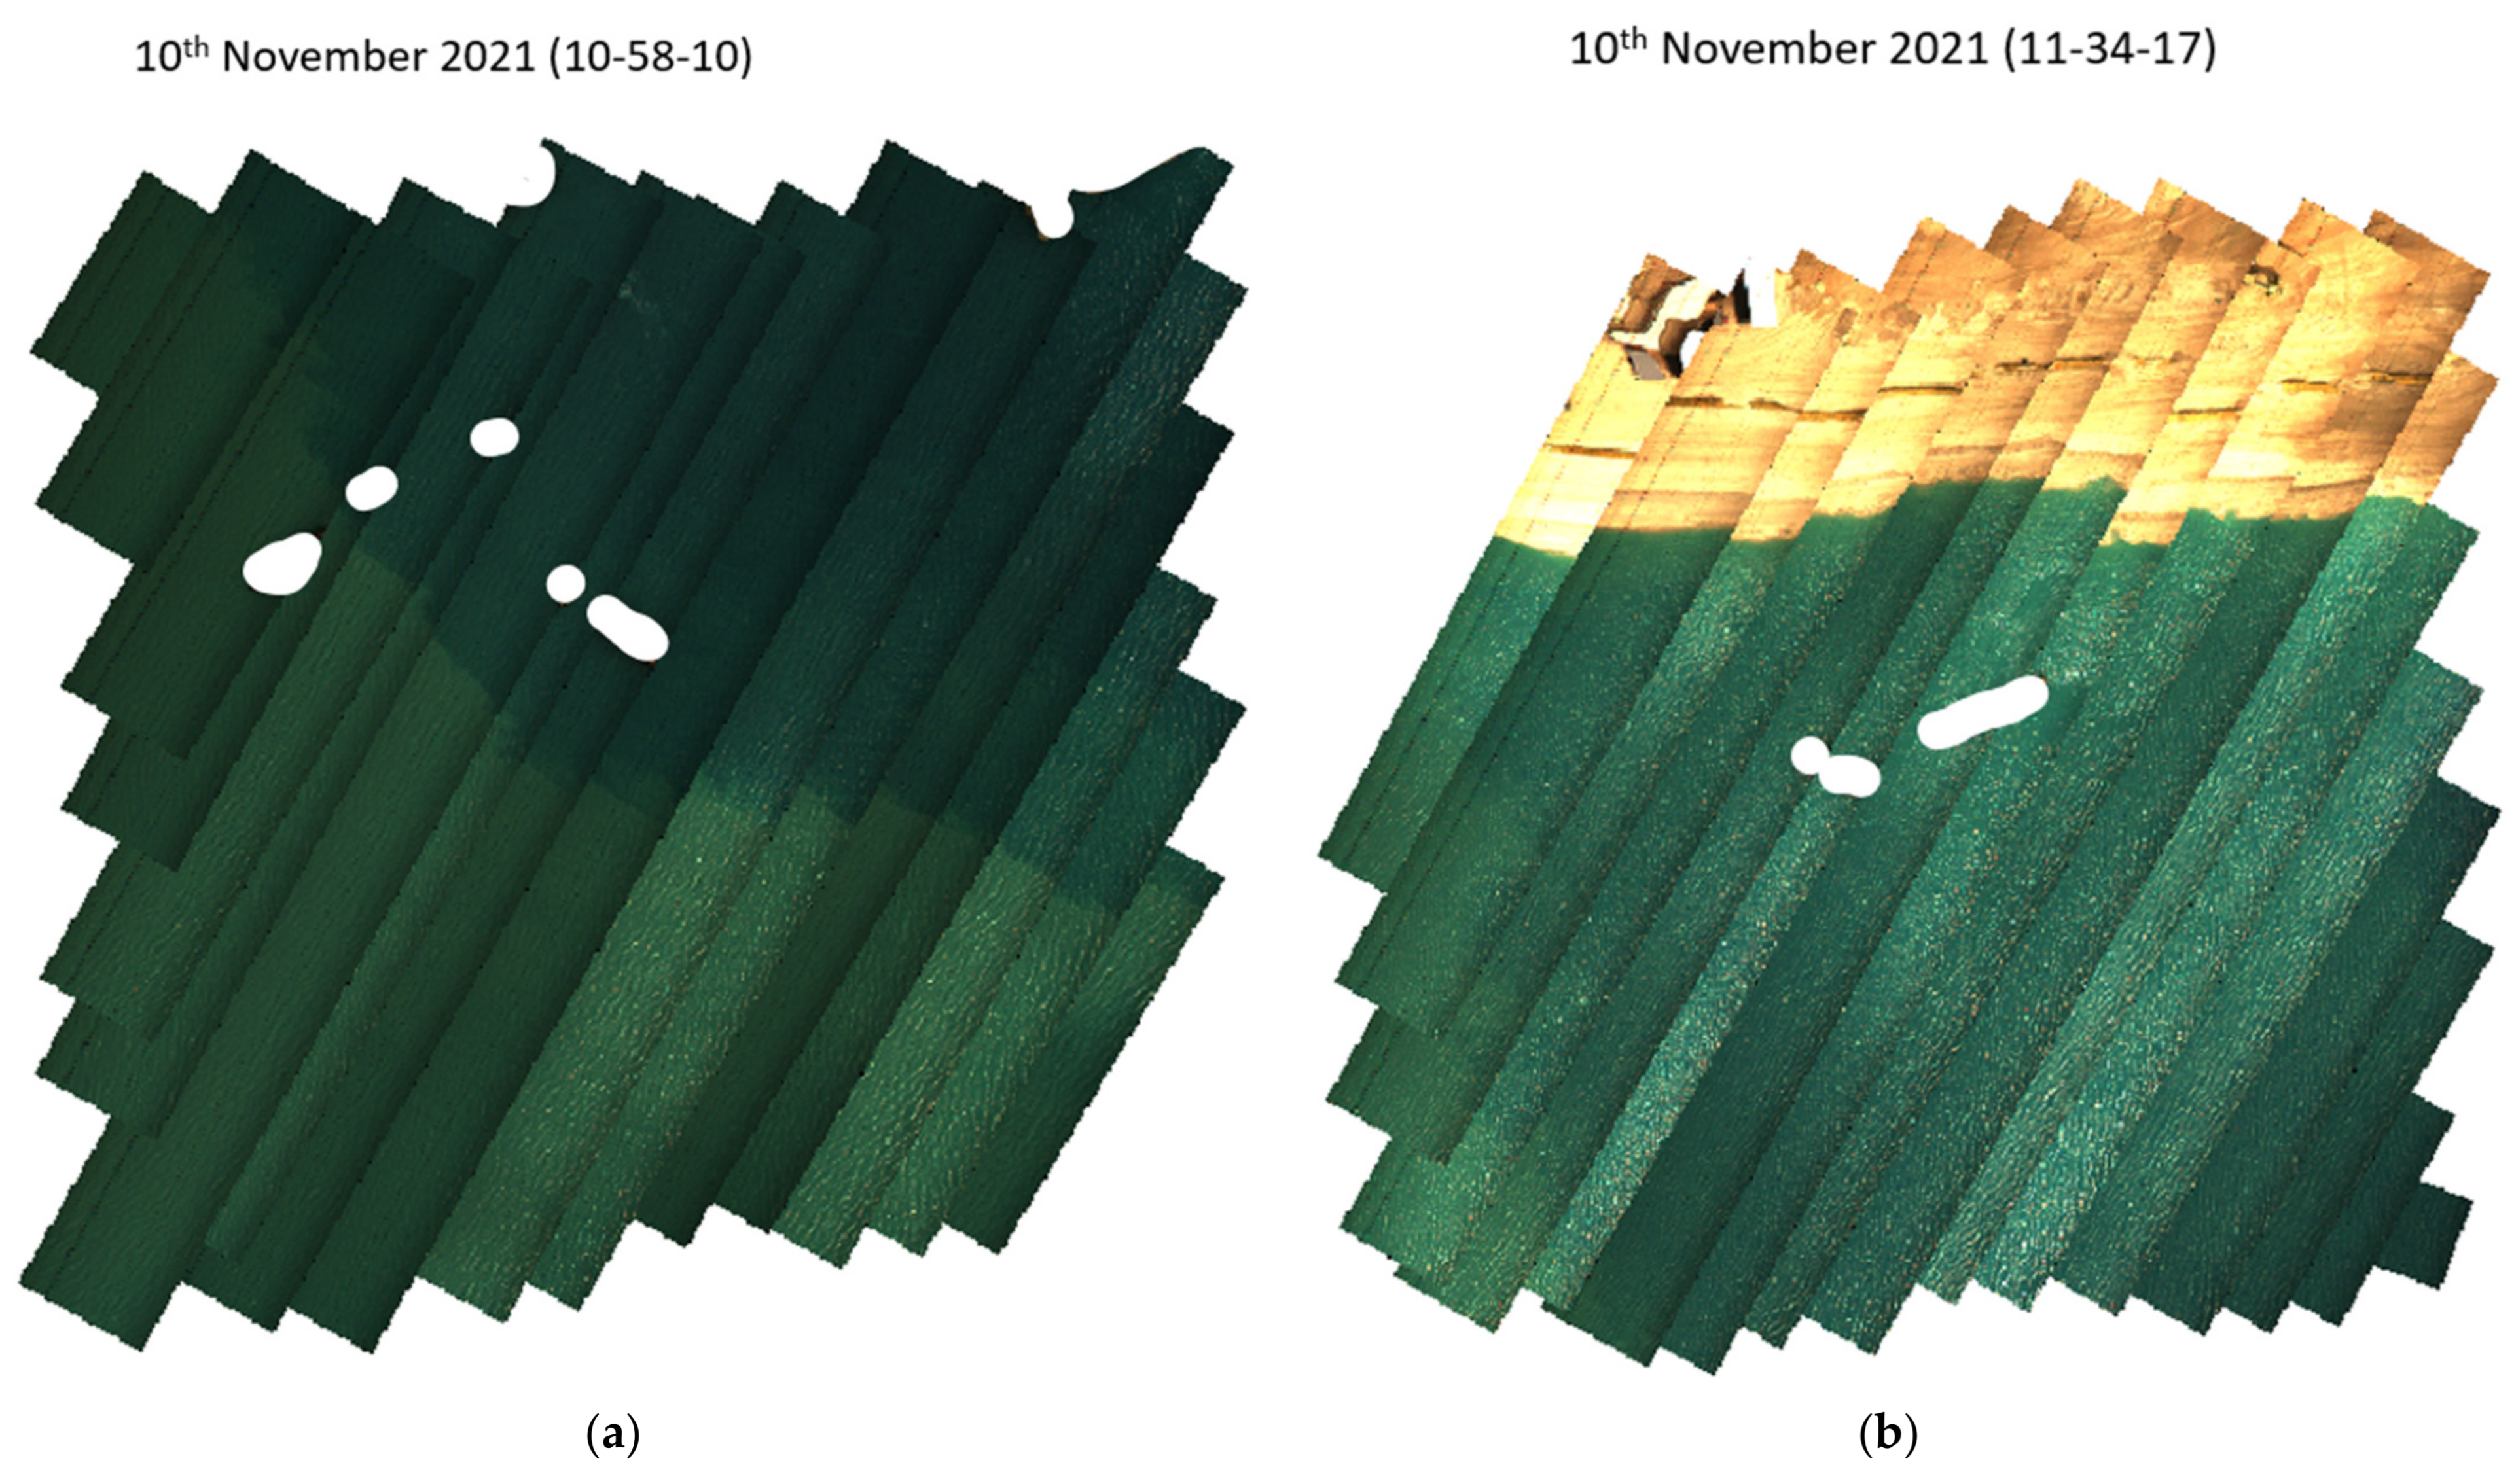
| Weather Conditions ** | Sunny after rain in the early morning | Strong sunlight with sun glint effect | Sunny | Heavy cloud cover and slight rain | Sunny | Cloudy |
| Variance of Reflectance (Wavelength in the range of 430–930 nm) *** | 0.15–50.1 | 0.46–32.4 | 0.015–38.8 | 6.12–19,947 | 0.08–4.556 | 1.14–4.945 |
| Parameters | Thresholds |
|---|---|
| Wind Speed (m/s) * | <8 |
| Air Temperature (Celsius) | <35 |
| Water Temperature (Celsius) | <30 |
| Relative Humidity (%) | <85 |
| Sun Angle (degree) | 35–75 |
| Tidal Height (m) | >0.5 |
Publisher’s Note: MDPI stays neutral with regard to jurisdictional claims in published maps and institutional affiliations. |
© 2022 by the authors. Licensee MDPI, Basel, Switzerland. This article is an open access article distributed under the terms and conditions of the Creative Commons Attribution (CC BY) license (https://creativecommons.org/licenses/by/4.0/).
Share and Cite
Trinh, H.L.; Kieu, H.T.; Pak, H.Y.; Pang, D.S.C.; Cokro, A.A.; Law, A.W.-K. A Framework for Survey Planning Using Portable Unmanned Aerial Vehicles (pUAVs) in Coastal Hydro-Environment. Remote Sens. 2022, 14, 2283. https://doi.org/10.3390/rs14092283
Trinh HL, Kieu HT, Pak HY, Pang DSC, Cokro AA, Law AW-K. A Framework for Survey Planning Using Portable Unmanned Aerial Vehicles (pUAVs) in Coastal Hydro-Environment. Remote Sensing. 2022; 14(9):2283. https://doi.org/10.3390/rs14092283
Chicago/Turabian StyleTrinh, Ha Linh, Hieu Trung Kieu, Hui Ying Pak, Dawn Sok Cheng Pang, Angel Anisa Cokro, and Adrian Wing-Keung Law. 2022. "A Framework for Survey Planning Using Portable Unmanned Aerial Vehicles (pUAVs) in Coastal Hydro-Environment" Remote Sensing 14, no. 9: 2283. https://doi.org/10.3390/rs14092283