Article

Oriented Ship Detector for Remote Sensing Imagery Based on Pairwise Branch Detection Head and SAR Feature Enhancement

Electronic Information School, Wuhan University, Wuhan 430072, China
*
Author to whom correspondence should be addressed.
Remote Sens. 2022, 14(9), 2177; https://doi.org/10.3390/rs14092177
Submission received: 12 March 2022 / Revised: 13 April 2022 / Accepted: 27 April 2022 / Published: 1 May 2022

Abstract

:
Recently, object detection in natural images has made a breakthrough, but it is still challenging in oriented ship detection for remote sensing imagery. Considering some limitations in this task, such as uncertain ship orientation, unspecific features for locating and classification in the complex optical environment, and multiplicative speckle interference of synthetic aperture radar (SAR), we propose an oriented ship detector based on the pairwise branch detection head and adaptive SAR feature enhancement. The details are as follows: (1) Firstly, the ships with arbitrary directions are described with a rotated ground truth, and an oriented region proposal network (ORPN) is designed to study the transformation from the horizontal region of interest to the rotated region of interest. The ORPN effectively improved the quality of the candidate area while only introducing a few parameters. (2) In view of the existing algorithms that tend to perform classification and regression prediction on the same output feature, this paper proposes a pairwise detection head (PBH) to design parallel branches to decouple classification and locating tasks, so that each branch can learn more task-specific features. (3) Inspired by the ratio-of-average detector in traditional SAR image processing, the SAR edge enhancement (SEE) module is proposed, which adaptively enhances edge pixels, and the threshold of the edge is learned by the channel-shared adaptive thresholds block. Experiments were carried out on both optical and SAR datasets. In the optical dataset, PBH combined with ORPN improved recall by 5.03%, and in the SAR dataset, the overall method achieved a maximum F1 score improvement of 6.07%; these results imply the validity of our method.

1. Introduction

Target detection is to calibrate the coordinates and categories of objects in a given image, which has important research value in aerospace, satellites, face recognition, and other fields. Ships in remote sensing images (RSIs) comprise an important detection target. RSI ship detection is of great significance in both military and civil scenarios, such as military detection, urban planning, illegal resource exploitation, and so on, so it is a hotspot in the field of remote sensing research.
With the continuous progress of imaging technology, rapid, accurate, and automatic detection of ships is required. However, as remote sensing images are shot from a top-down perspective, the image size is large and the scene is extremely complex, which brings some difficulties to ship target detection. Traditional algorithms have difficulty dealing with environmental interference such as cloud, sea clutter, etc. [1,2]. Secondly, ship targets are densely arranged in uncertain directions and have variable sizes. Therefore, RSI ship detection is still a challenging research direction.
In addition to the design of algorithms, datasets also have an impact on detection performance. According to different imaging principles, these can be roughly divided into two types: optical and synthetic aperture radar (SAR). Among them, SAR is not affected by cloud cover or weather conditions and can be used for all-weather Earth observation. It has become a necessary tool for spaceborne and airborne Earth observation. It is helpful to analyze the characteristics of real targets from SAR images. Before deep learning technology matured, the SAR object detection was mainly through artificially designed feature extraction methods. Researchers have tried and proposed many schemes. Wang [3] proposed water body segmentation through GLCM combined with wavelet texture data, and Dellinger proposed the SAR-SIFT algorithm [4], which is widely used in artificial feature combination for SAR data processing. However, with the continuous updating of hardware such as GPUs, the computing power of computers has been continuously improved, and the method of extracting features through neural networks has become the mainstream choice in the detection field. Some mature detection network perform well on optical image datasets, but applying them directly to SAR images will have problems of incompatibility.
The grayscale characteristic in SAR imagery is quite different from that of optical imagery, and the information of images is less. A single target in the SAR image is usually represented as a collection of discrete backscattering points, resulting in unclear target geometry and semantics. In addition, due to the coherence imaging mechanism, SAR images often have strong speckle noise, which further reduces the detection effect of the depth learning algorithm. Therefore, it is necessary to design a CNN-based feature extraction method suitable for SAR imagery characteristics.
In this paper, considering the above difficulties in ship detection in remote sensing images, the ship is represented by the rotated ground truth, and a two-stage detection framework is proposed by improving the basic feature extraction module, rotation candidate region extraction, and detection head of the oriented ship detection network.

1.1. Related Work

1.1.1. Deep Learning Object Detection

CNN-based object detection methods usually adopt a network structure used in classification tasks as the feature extraction backbone, such as AlexNet [5], ZF-Net [6], googleNet [7], vggNet [8], ResNet [9], and other networks, and ResNet is the most commonly used backbone for object detection. According to the difference in construction, the CNN-based object detector can be roughly divided into the following three types: two-stage detector, one-stage detector, and anchor-free detector.
Two-stage detectors first obtain the candidate area that may cover targets and then complete the category identification and location prediction. RCNN [10] is the pioneering work of two-stage detectors. He et al. [11] proposed SPP-Net, which solves the limitation of the full connection layer. In 2015, Grishick et al. proposed Fast RCNN, which can train classification and regression at the same time [12]. In the same year, Ren et al. designed the real end-to-end method Faster RCNN [13]. In 2016, Dai et al. [14] introduced FCN [15] to propose a novel region-based full convolution network (R-FCN), which designed the location-sensitive ROI pooling.
On the other hand, the speed of single-stage detectors is greatly improved. They abandoned the region proposal stage and directly predict the location and category at once. You Only Look Once (YOLO)v1–v3 [16,17,18] are the most classic one-stage algorithms. They continuously promote the performance through the improvement of the backbone and different settings of the preset anchors. In addition, the single-shot multibox detector (SSD) [19] and DSSD [20] use multi-scale features for detection. Aiming at the imbalance between positive and negative samples, retinanet [21] introduces focal loss for difficult sample mining.
In 2018, Law et al. [22] proposed CornerNet based on key point detection and opened the design paradigm of anchor-free detectors. CenterNet [23] seeks the center point of the target candidate box through a heat map. Tian et al. [24] built a highly accurate FCOS network, and the predicted bounding box far from the target center is suppressed through the CenterNetstrategy. FoveaBox [25] simulates how the human visual system perceives the world and predicts category-related semantic maps to represent the probability of targets.

1.1.2. Ship Detection

The mainstream methods of ship detection in remote sensing images are mainly divided into traditional and depth-learning-based methods. The traditional algorithm is based on a large number of artificial design features, and the main strategy is coarse-to-fine multi-stage detection [26,27,28]; ship targets are identified by extracting features [29,30,31] such as the edge, corner, color, and texture of candidate positions.
In recent years, with the gradual development of deep learning technology, many convolutional neural networks for ship target detection have appeared. Zhang et al. [32] referred to the design idea of RCNN and built detection frameworks for ships of different sizes in different scenes. Zou et al. [33] tried to integrate CNN with the idea of singular-value decomposition (SVD) and proposed SVD-Net to detect ships. Tang et al. [34] introduced extreme learning machine into the CNN detection architecture. Lin et al. [35] used the full convolution neural network to detect the presence of remotely sensed ships and then obtained the accurate position of ship targets through the visual attention mechanism.
Most detection methods in the field of natural images rely on the horizontal bounding box for feature extraction. However, Liu et al. [36] pointed out that the horizontal region of interest (HRoI) contains multiple densely arranged objects or background areas, so it is difficult to extract accurate features for classification and regression. In the field of ship detection in remote sensing imagery, in order to accurately detect ships with an arbitrary orientation, an oriented target detection framework is adopted.
First of all, in order to accurately describe the multi-direction target, a rotated ground truth is used to model the target with a specific angle. Secondly, the rotating region proposal network is used to obtain multi-direction candidate regions. Then, rotation-invariant regional features are extracted for fine classification. Finally, the detection head is introduced to further predict the category and position of the candidate region. RRPN [37] added an angle constraint into the anchor generation mechanism, set the combination of three scales, three ratios, and six angles for any feature point, and generated RoIs directly from the rotated anchors. RoI Transformer [38] learns the conversion from the HRoI to the RRoI through the RoI Learner module and generates rotation-invariant features by PS RoI Align.

1.2. Problem Description and Motivations

There are many differences between remote sensing images and natural images, and the target representation is also different in the two types of imagery. The problems described below make the CNN-based algorithm designed for natural images not be directly applicable to remote sensing imagery.
Firstly, the scenes of remote sensing images are complex and diverse. Ships are generally distributed in any direction, and most of them are densely distributed in nearshore ports. Although CNN has a certain degree of translation invariance, it lacks rotation invariance. As the target orientation is uncertain, the consistency of similar target features will be weakened by directly using the general detector to train the data with rotation angle information. Some existing rotated object detectors set dense anchors to obtain multi-directional candidate regions for the prediction of additional directional parameters, resulting in high model complexity and computational cost.
Secondly, a target detector usually consists of two tasks, target classification recognition and boundary box regression positioning, which share the same features extracted from the backbone network. Object classification should correctly identify the category of an object regardless of its position, size, and orientation, and the regression task predicts a tight bounding box related to the geometric configuration of the instance. Classification confidence is usually used to reflect the positioning accuracy of the post-processing stage (such as NMS [39]). Although a bounding box has a high confidence, it may still have a low one with the ground truth it matches. Similarly, some bounding boxes close to the ground truth with high positioning accuracy may be inhibited in the NMS stage due to low confidence. Therefore, the features suitable for classification and localization are inconsistent. Current rotated object detectors often fail to take this into account. As a result, when ships are densely arranged, the positioning of the correctly classified bounding box may be inaccurate.
Furthermore, SAR is a coherent system, and speckle noise is its inherent property. Coherent speckles appear as many high-intensity noises in an image. A single target is represented as a collection of discrete or isolated backscattering points, which is distorted from the original physical form. The edge of an image is the boundary between one region and another region, which contains rich information, and extracting the edge can distinguish the target from the background. In view of the multiplicative noise in SAR images, edge detection is usually carried out by using the ratio operator [40,41] in traditional SAR image processing. However, the traditional ratio operator needs to manually set the threshold with experience, which is inefficient. Moreover, the threshold set has no specificity for each image, and the effective edge of each image cannot be extracted in batches.

1.3. Contributions and Structure

This paper has carried out a series of research on the problems of RSI ship detection. The main contents and innovations are as follows:
(1)
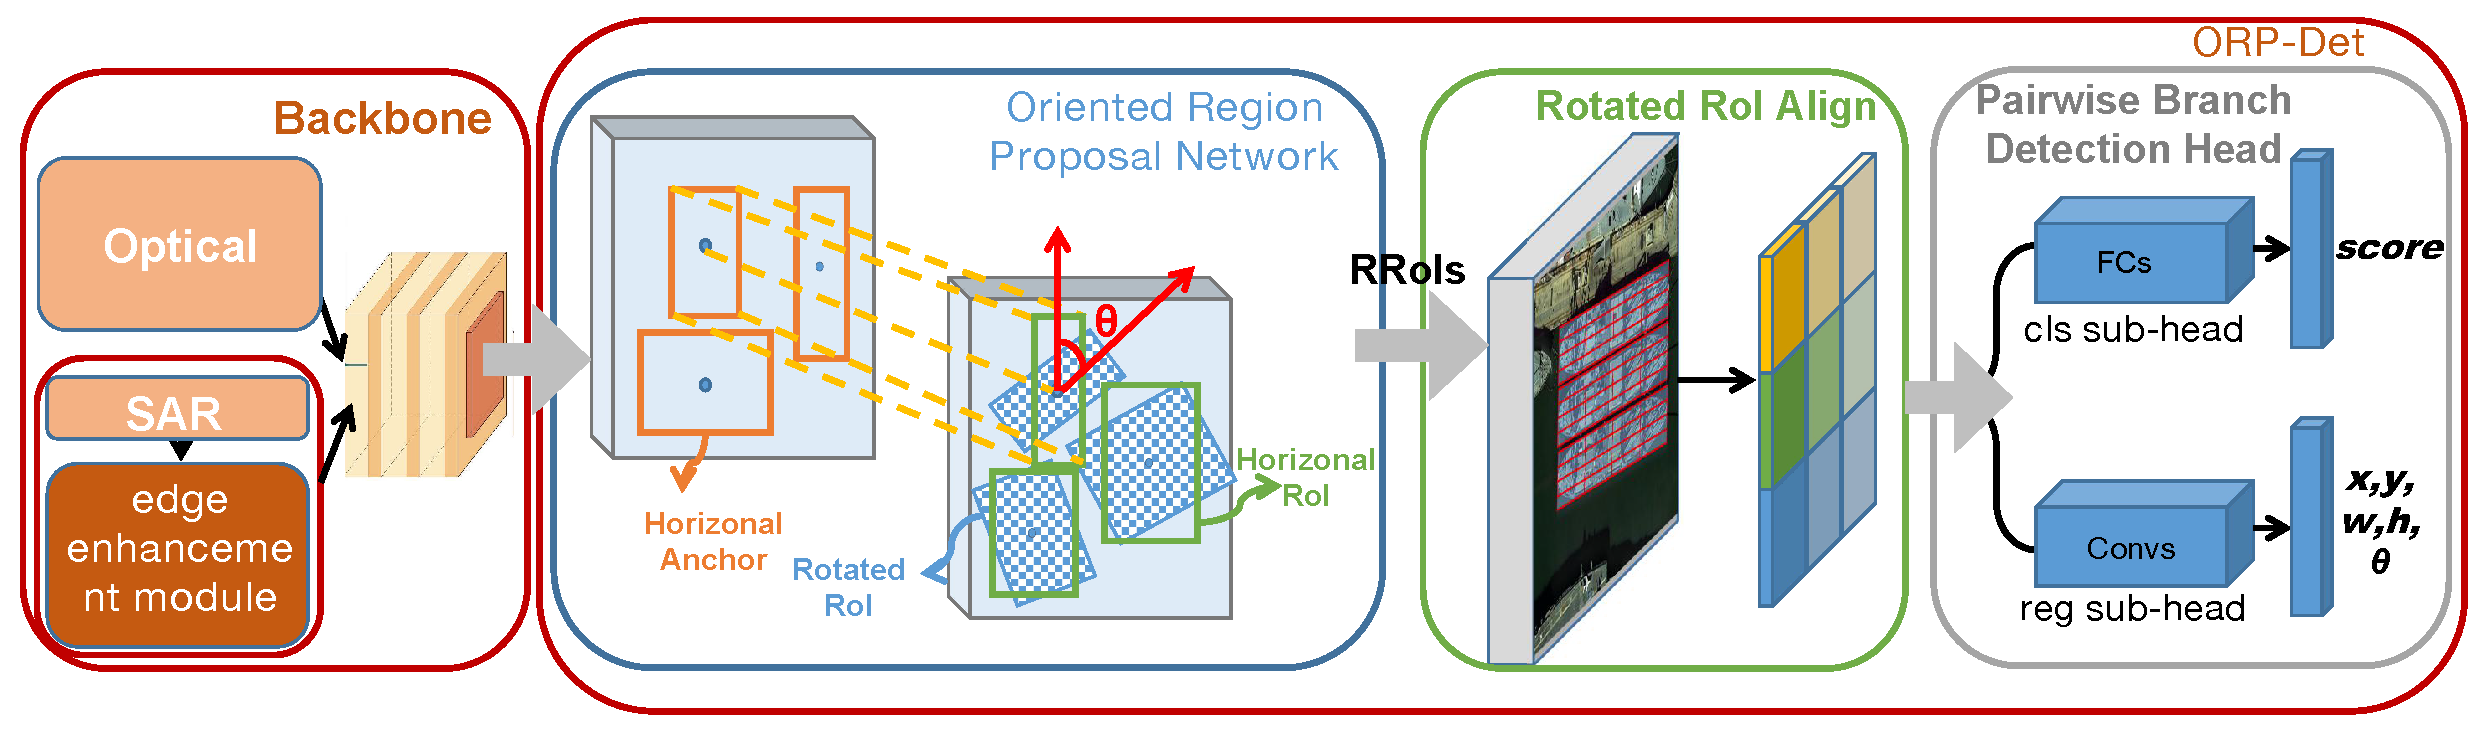
Aiming at the problem of high complexity caused by preset multi-oriented anchors, we propose an oriented region proposal network (ORPN). In generating the candidate regions, ORPN has abandoned artificial oriented anchors and instead designs a branch that learns the projective transformation from the HRoI to the RRoI, capturing high levels of the RRoIs while only a few parameters are added.
(2)
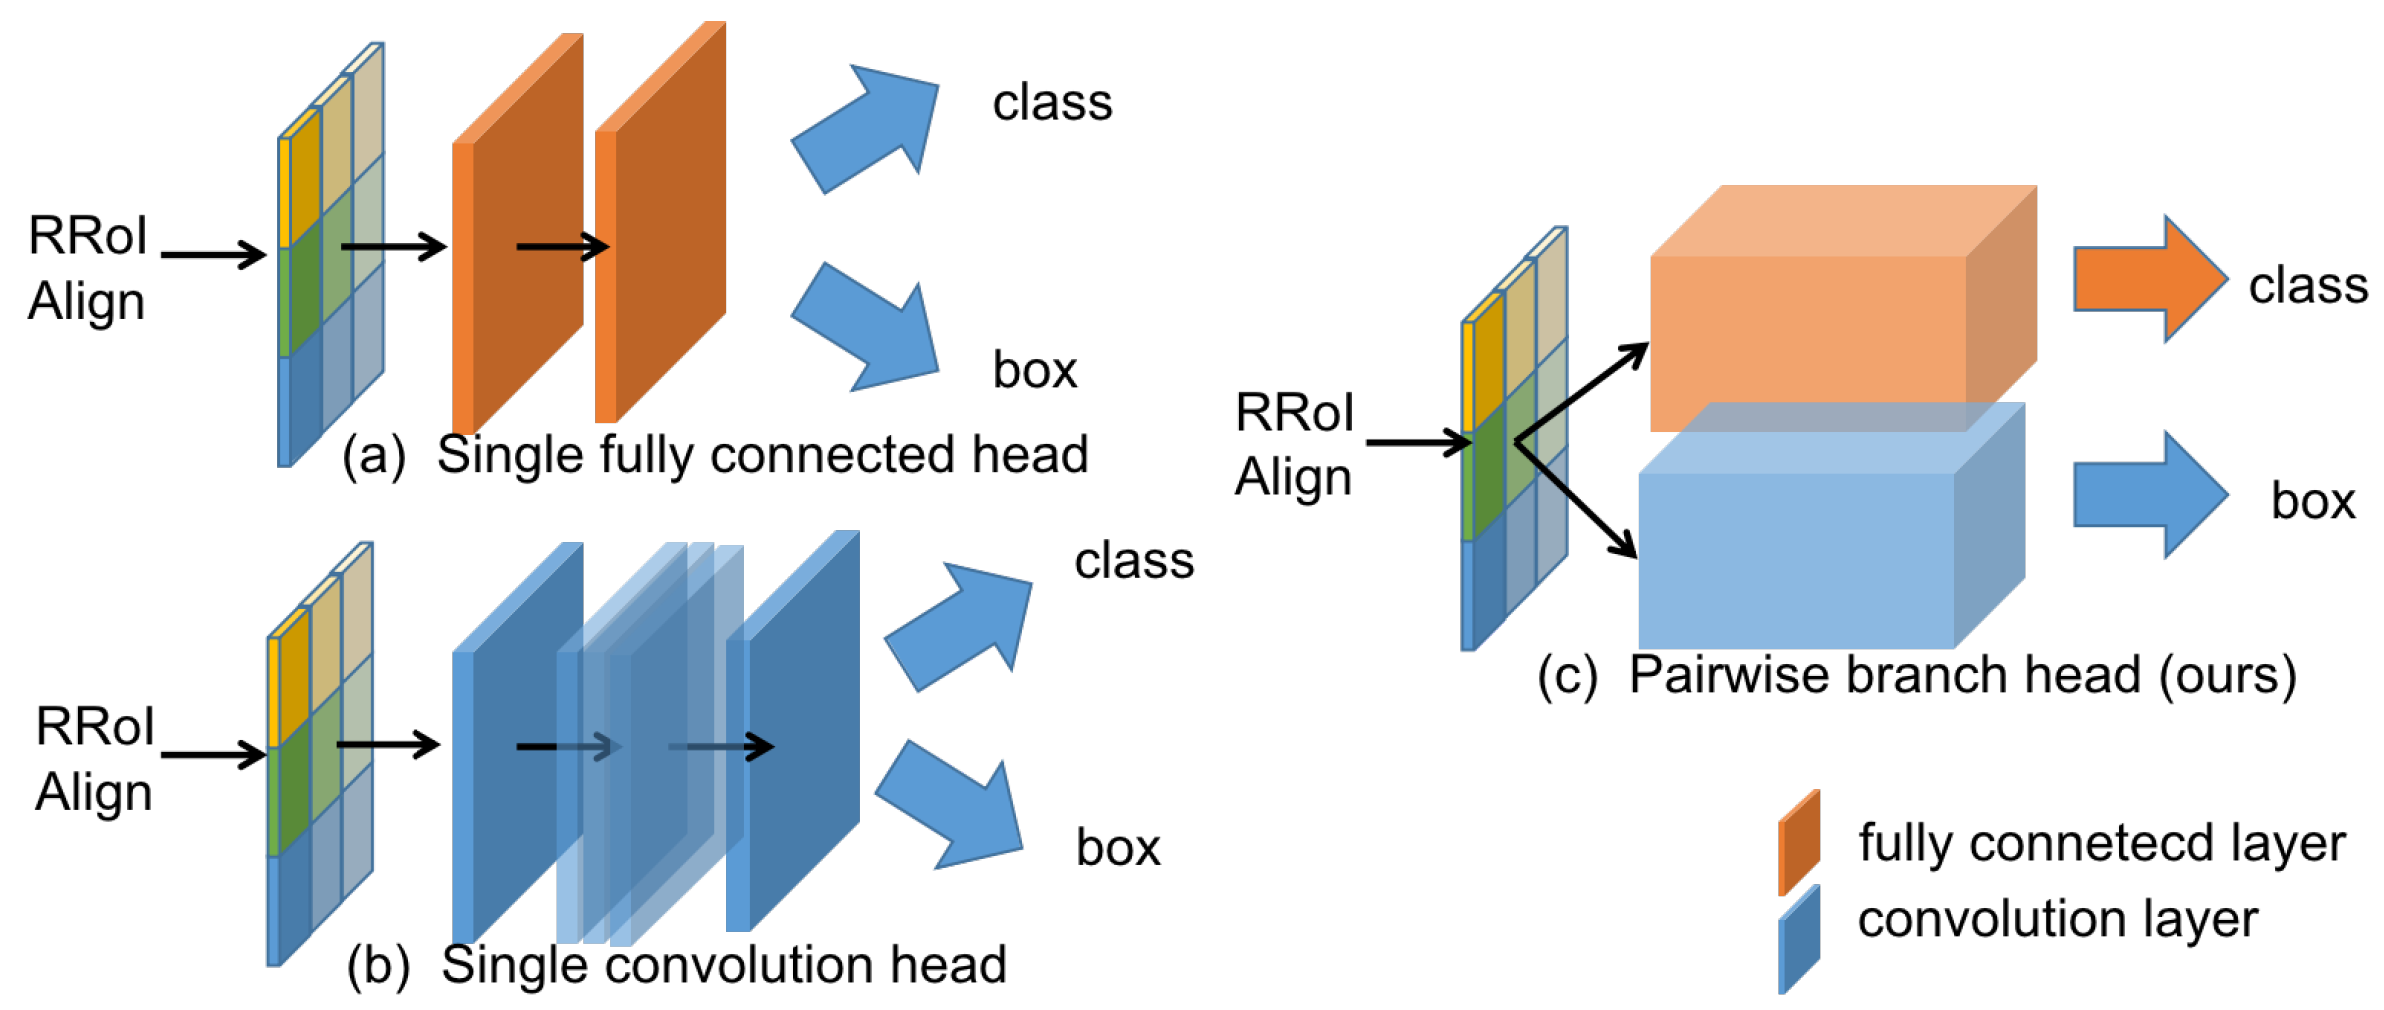
Aiming at the inconsistency of features suitable for classification and localization, this paper proposes the pairwise branch detection head (PBH). By analyzing the respective characteristics of the fc-head and conv-head, separate branches are set for classification and localization tasks. Each branch is specifically designed to learn the appropriate features for the corresponding task.
(3)
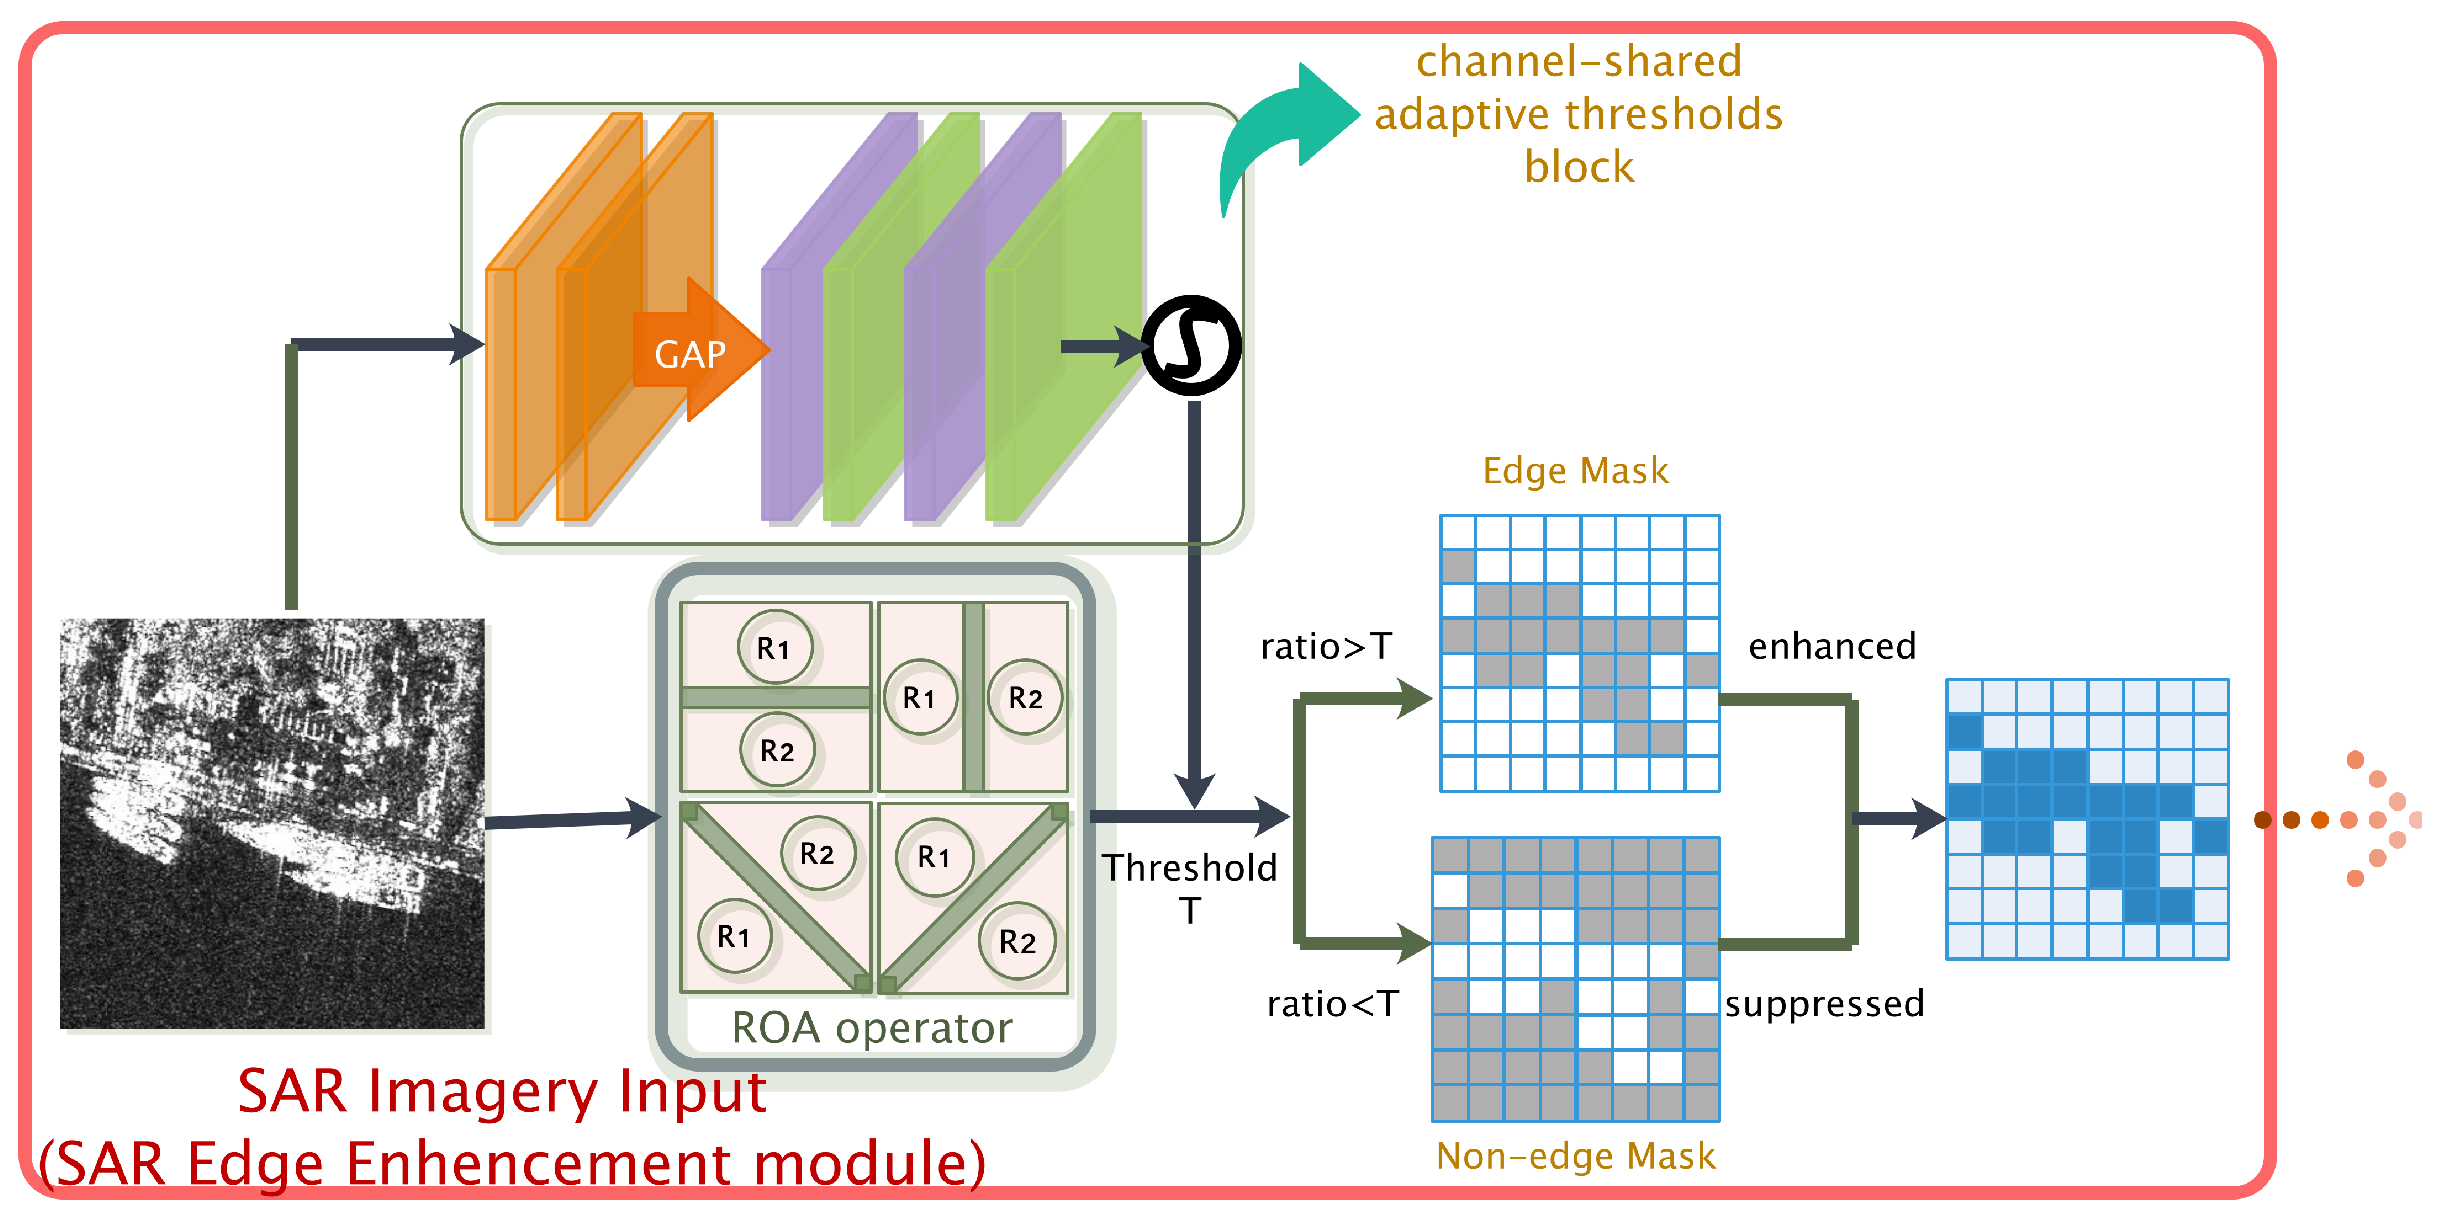
To reduce the negative impact of the multiplicative coherent speckle on SAR ship feature extraction, we combine traditional SAR edge detection algorithms with the CNN framework to propose an adaptive threshold SAR edge enhancement (SEE) module. The SEE module combines the mean ratio operator to effectively remove the influence of coherent speckles and enhances the edge adaptively. The threshold value is adaptively learned by the network after setting the initial value, which enables the module to have better generality for different datasets.
This article is organized as follows: Section 2 briefly introduces some existing methods that have inspired our work. The next Section 3 describes the principle and significance of the three proposed modules. The description of the datasets and experimental results are shown in Section 4, and the final conclusion is stated in Section 5.

2. Preliminaries

Ratio-of-Averages Edge Detector for SAR Image Processing

The edge of an image is an important clue for visual perception. In the computer vision system, image edge detection affects the overall effect to a great extent. Classic gradient-based edge detection operators usually rely on the assumption that the image is contaminated by additive noise, but the noise of SAR images is multiplicative. The edges obtained by gradient detectors are not constant false alarms, but vary with the local average intensity of the image, so that false edges are easily detected in bright areas, while many real edges are lost in dark areas.
In actual physical scenarios, SAR images have inherent multiplicative speckle characteristics. A single-channel SAR image I ( x , y ) can be represented by its backscatter coefficients S ( x , y ) and speckle noise ε ( x , y ) . Under the premise that S ( x , y ) is not related to ε ( x , y ) , which is also the correct assumption in most scenarios, this image can be expressed by the following formula:
I ( x , y ) = S ( x , y ) ε ˙ ( x , y )
where x , y are the horizontal and vertical coordinates of the pixel. If the number of looks is 1, the statistical model of ε ( x , y ) is a negative exponential distribution; the speckle noise of a multi-look SAR image follows a gamma distribution.
Different from the classical edge detector based on the image gradient, the ratio-of-averages (ROA) detector is defined as the ratio of the average pixel values of two non-overlapping neighborhoods on opposite sides of the point.
In practice, a window centered at a given point is split into two contiguous neighborhoods R 1 , R 2 . The grey value of pixel s is denoted I s , so that the mean μ i of a given region R i having n i pixels is:
μ i = 1 / n i s R i I s , i 1 , 2
Thus, along the specified direction, the ratio γ may be formed as:
γ = min μ 1 μ 2 , μ 2 μ 1
It can be known from Equation (3) that when γ is closer to 0, it means that the difference between the gray levels of the two regions is greater, and the detection point is more likely to be an edge point; on the contrary, if the γ is closer to 1, the windows on both sides are more likely to belong to the same homogeneous region. Therefore, the final response of the ratio detector is then compared to a predetermined threshold T. If γ < T , then an edge is deemed to be present at coordinate ( x , y ) .
Considering the multi-directionality of edges, the ROA operator adopts four-direction edge detection, and all considered directions must ultimately be judged using the same threshold. Obviously, each direction corresponds to a different ratio γ . The minimum ratio is taken as the final value γ = min γ 1 , γ 2 , γ 3 , γ 4 , and the corresponding direction is the most probable edge direction of the considered point.
The conditional probability density function (pdf) of the ratio in the above scenarios is expressed as follows:
p ( r / ( P 1 / P 2 ) ) = n Γ ( 2 N L ) Γ ( N L ) 2 ( P 1 / P 2 ) N L r n + P 1 / P 2 2 N L + ( P 2 / P 1 ) N L r n + P 2 / P 1 2 N L r n N L 1 r [ 0 , 1 ]
where P 1 and P 2 respectively represent the average value of pixels in the neighborhoods immediately to the right and left of the considered point, L is the number of looks, and N is the number of pixels in each area. n is set to 1, 2 depending on whether the data are intensity or magnitude.
It can be noticed that the performance of the ROA edge detector is only related to the size of neighborhoods, the number of looks, and the ratio of two mean values, and the probability of false alarms does not depend on the mean value. Therefore, the ROA edge detector is a constant false alarm rate (CFAR) operator suitable for radar images.
In recent years, detection methods based on the ROA have been proposed one after another. Most of these methods use thresholding to extract edges. It needs to preset two thresholds: high threshold and low threshold, these two thresholds being usually set manually through experiments. This not only increases the tedious process of parameter tuning, but also, the obtained threshold may not be the optimal threshold. To avoid these problems, many methods use adaptive threshold selection. Liu et al. [42] proposed a simple and fast automatic threshold selection method, and they used the maximum entropy to calculate the optimal threshold for edge detection in SAR images. Ibrahim et al. [43] and Setiawan et al. [44] used the Otsu threshold selection method instead of manual threshold selection to calculate the optimal threshold. However, these methods are still within the category of manual operators, and the calculation process is often complicated and cannot be integrated into the deep learning framework. Therefore, this paper further improves the threshold selection method and obtains the threshold through neural network training, which effectively avoids the process of setting the threshold by repeated experiments.

3. Proposed Method

3.1. The Overall Framework

Figure 1 is the workflow of the proposed detection method, and the method in this paper mainly consists of two parts: one is the input image enhancement module for the SAR image, and the other is an oriented region detector with a pairwise head (ORP-Det).
Aiming at the problem of inconsistent features suitable for classification and regression in detection and the multi-directional characteristics of remote sensing objects, an oriented region detector with a pairwise head (ORP-Det) is proposed. In the region proposal generation stage, ORP-Det proposes an improved oriented region proposal network (ORPN) to learn the mapping from the horizontal region of interest (HRoI) to the rotated region of interest (RRoI) and generates high-quality RRoIs while only adding a small number of parameters. Subsequently, each RRoI will participate in rotated RoI align (RROI Align) to fully extract the rotation-invariant spatial information of the target to obtain regional features. Finally, ORP-Det designs a pairwise branch detection head (PBH) to disentangle the classification and regression tasks.

3.2. SAR Image Edge Enhancement Module

The multiplicative noise in the SAR image can be suppressed by the ROA algorithm. However, the performance of the traditional ROA algorithm is very sensitive to the setting of the threshold, and it is usually difficult to set a suitable value for the threshold. In addition, the optimal value varies depending on the input data. In view of this problem, as shown in Figure 2, this paper first proposes a channel-shared adaptive threshold (CSAT) block to achieve automatic threshold setting, avoiding the trouble of manual operation. At the same time, a CNN-based image enhancement strategy combined with the ROA edge detection results is designed; the edge information is adjusted and weighted through the network; the edge is enhanced as the input of the subsequent backbone network.

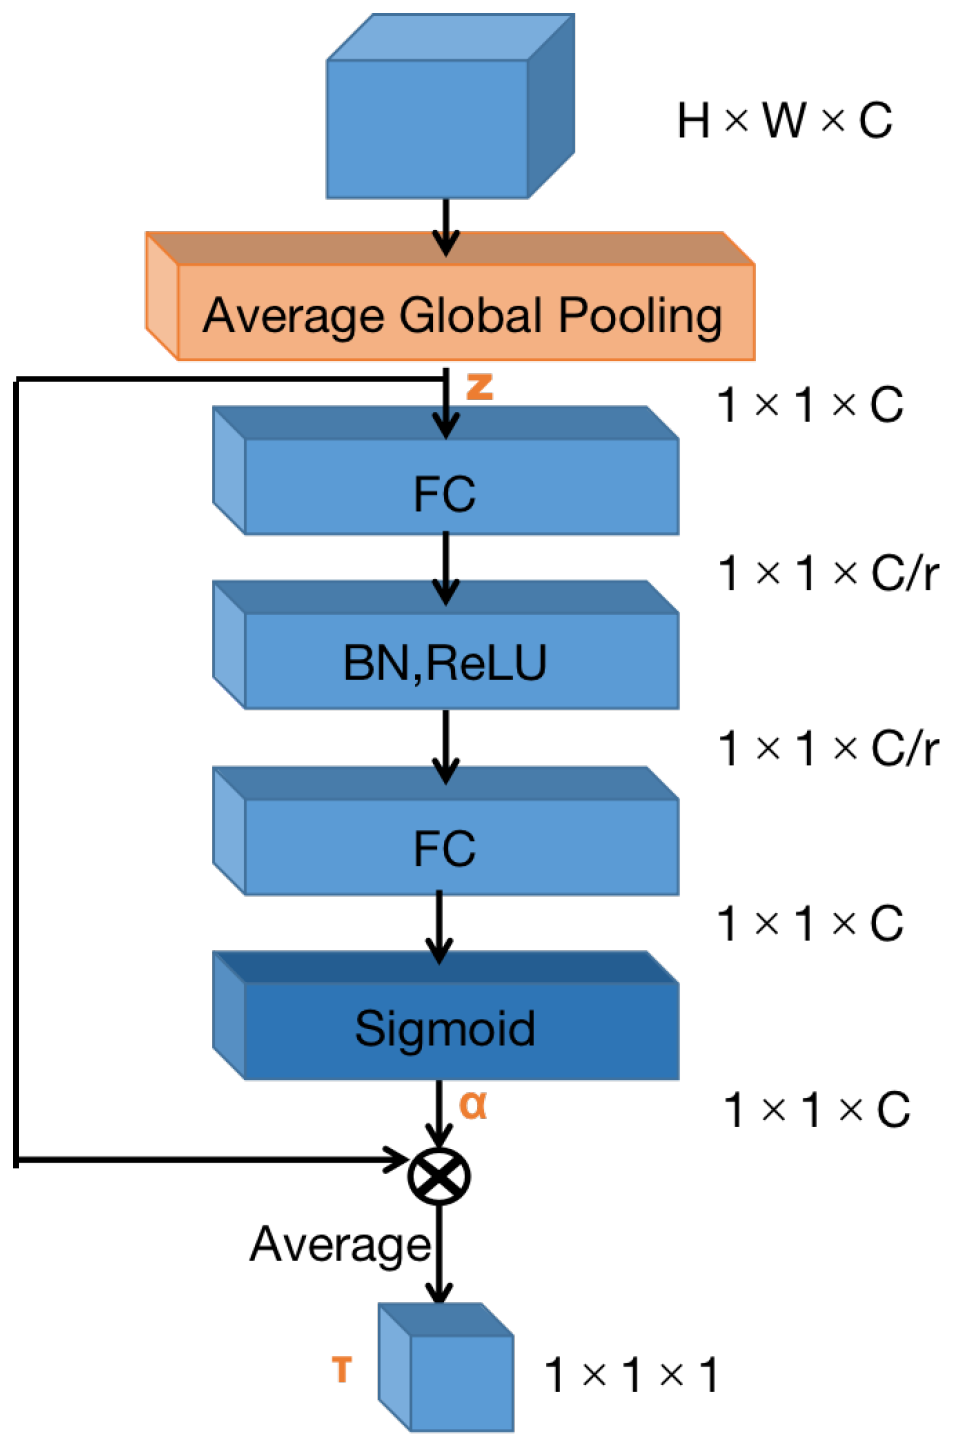
3.2.1. Channel-Shared Adaptive Threshold Block

In the developed channel-shared adaptive threshold block, the original image is first input to convolutional layers to obtain feature maps U R H × W × C , where H and W are the length and width of the feature map and C is the number of channels. In order to reflect the role of all positions in the feature map, it is necessary to extract the overall information of a single channel. Therefore, global average pooling (GAP) is first adopted to calculate the spatial average value of each feature map, and a one-dimensional vector z R 1 × 1 × C is obtained.
z c = F G A P u c = 1 H × W i = 1 H j = 1 W u c ( i , j )
The 1D vector is then propagated into two consecutive fully connected layers. Figure 3 depicts the schema of the CSAT block. To limit the complexity of the model, the first fully connected layer is used as a dimensionality reduction layer, which reduces the number of feature channels by reduction ratio r, and this parameter choice is discussed in Section 4.3.1: setting r = 8 strikes a good balance between accuracy and complexity. The second fully connected layer restores the channel dimension to the original number and applies the sigmoid function at the end of this layer to output a scaling parameter α . This process can be expressed as:
α = σ W 2 δ W 1 z
where z is the output of GAP, δ and σ are the R e L U and sigmoid function, respectively, and α is the corresponding coefficient of the output, which is limited in the range of (0,1). For simplicity, the B N layer between the two fully connected layers is not reflected in the above equation.
The final output of the block is obtained by multiplying z by α and then averaging over the channel dimension to obtain the final threshold. In summary, the thresholds learned in CSAT are expressed as follows:
τ = average c α c · z c
where τ is the final threshold and c is the index of the channel of the z . Through the above operations, the thresholds are automatically learned by the deep architecture rather than manually set by experts. At the same time, these network layers are trained by the back-propagation algorithm, and each input image can have different thresholds in the inference process.

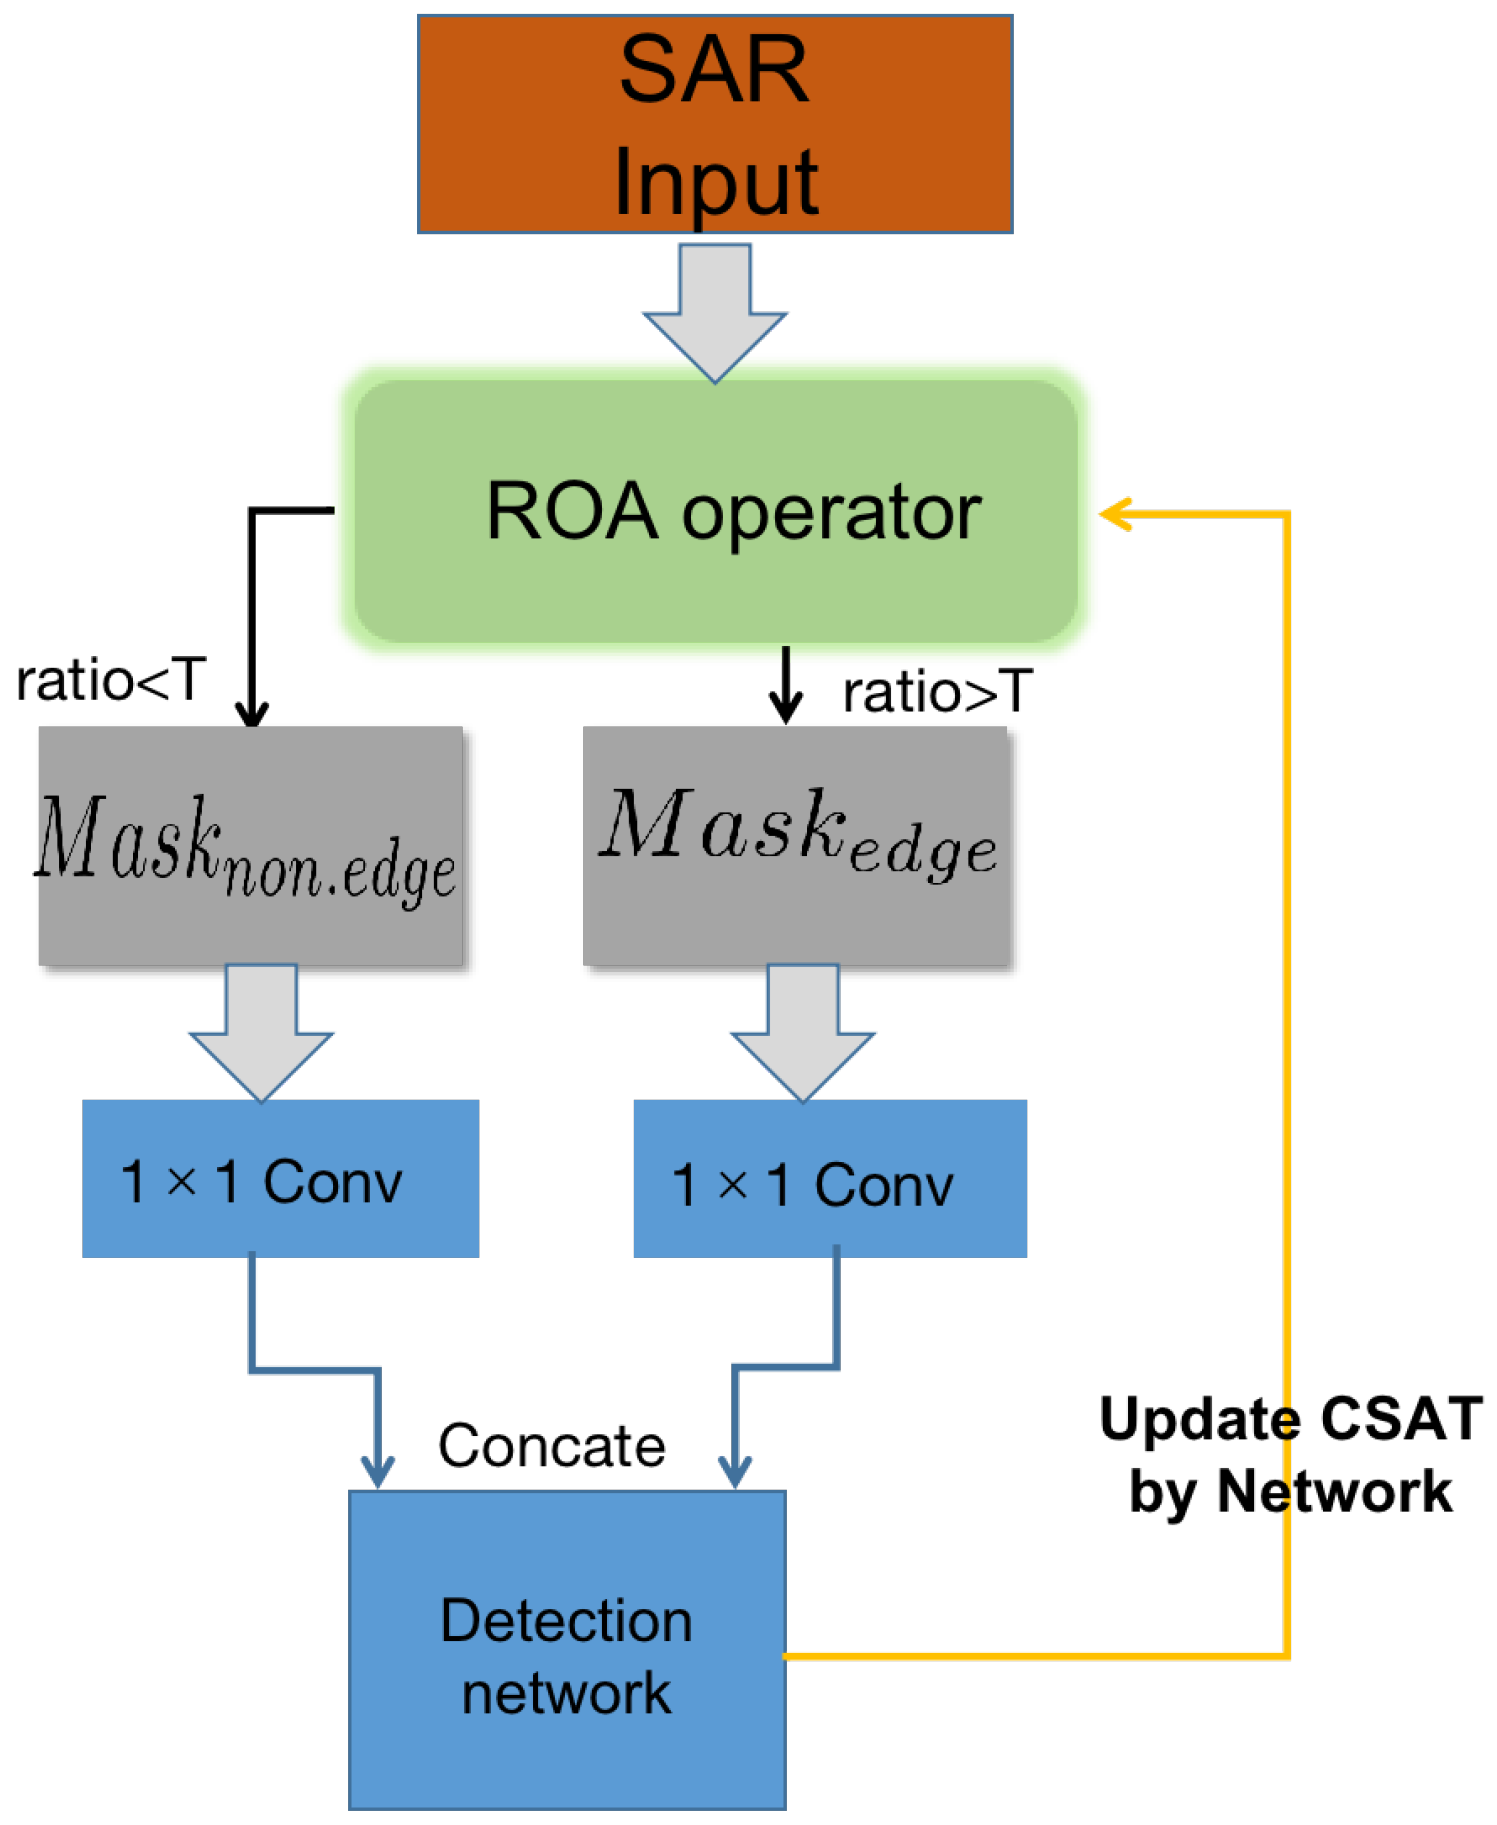
3.2.2. Feature Discrimination and Image Processing Strategy

In addition to the automatic learning of the ratio threshold in the ROA algorithm, a new feature discrimination and image processing strategy is also proposed, which is generally divided into four steps:
  • The ratio-of-averages value of each pixel of the input image is calculated according to the ROA operator;
  • The threshold τ is compared with the ratio-of-averages values, and the pixels are judged as edge points and non-edge points, respectively. The original image is then divided into two mask images M a s k e d g e and M a s k n o n - e d g e ;
  • The grayscale of edge pixels in M a s k e d g e is enhanced; the grayscale of non-edge pixels in M a s k n o n - e d g e is suppressed;
  • M a s k e d g e and M a s k n o n - e d g e are concatenated and then input into the subsequent detection network.
The flow of this structure is shown in Figure 4. First taking M a s k e d g e as an example, if the ratio value of a pixel is greater than τ , then copy the pixel value of this point to the corresponding position of M a s k e d g e . Finally, all pixels on Mask1 are enhanced by a 1 × 1 convolution. In M a s k n o n - e d g e , the calculated ratio is less than τ , and a 1 × 1 convolution is also used to suppress non-edge information. The threshold τ for positive samples of edges in the experiment was initially set to 0.9.

3.3. Oriented Region Detector with a Pairwise Head

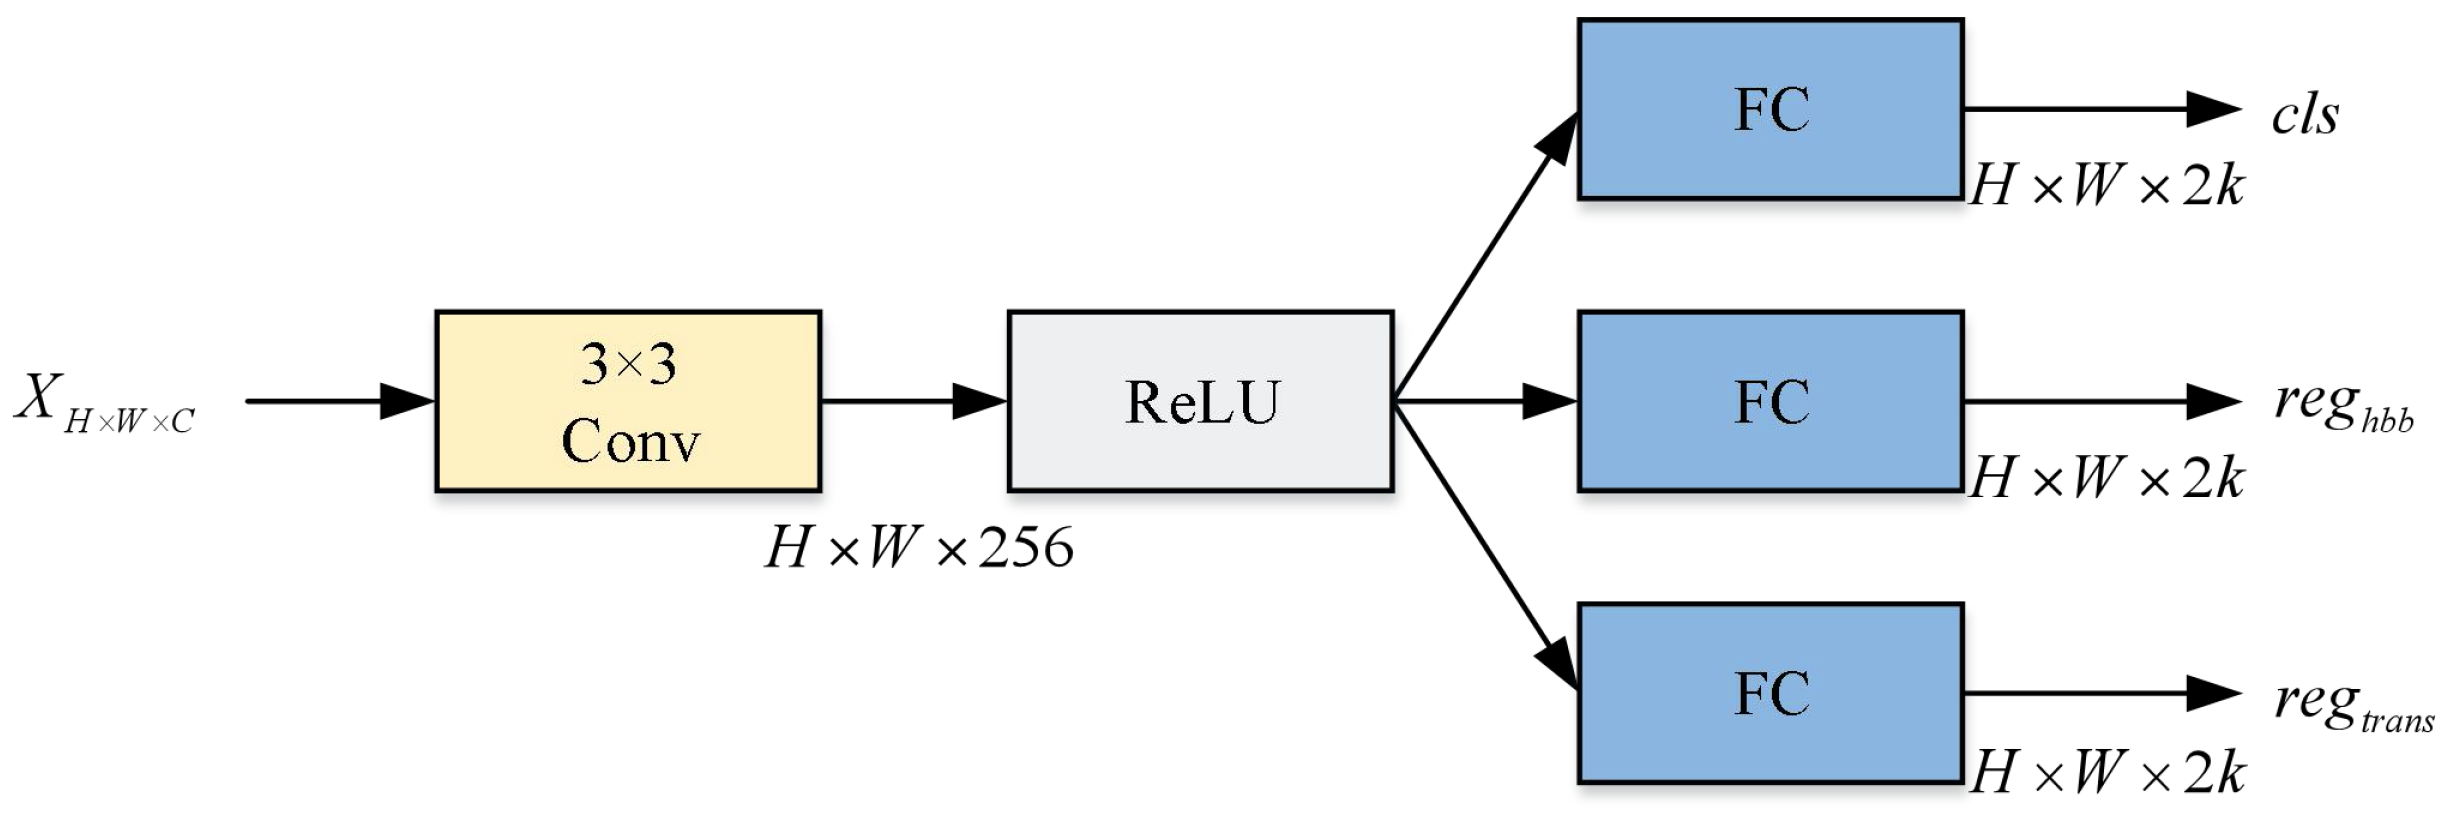
3.3.1. Oriented Region Proposal Network

In order to detect ships with a dense arrangement, arbitrary orientation, and different scales, ORP-Det adopts the oriented bounding box (OBB) modeling method. The representation of the HRoI is defined as ( x , y , w , h ) , where ( x , y ) represents the geometric center. A five-dimensional vector ( x r , y r , w r , h r , θ r ) is used to represent the RRoI, where θ r is the minimum angle that rotates from the HRoI to the RRoI, defined as the angle with the positive x axis, that is θ r ( π / 2 , π / 2 ) . Rearrange the order of the four vertices of the bounding box to minimize the angle as follows:
θ r = θ i i = arg min 0 j < 4 θ j θ
Since the HRoI and RRoI representing the same object have the same geometric center, i.e., ( x , y ) = ( x r , y r ) , the transformation from horizontal to arbitrary orientation bounding boxes can be performed only by learning the scaling and rotation parameters. P i = x i , y i ( 0 i < 4 ) are the four vertices of the HRoI, while P i = x i , y i ( 0 i < 4 ) are those of the RRoI. The transformation parameters can be calculated as:
M θ = cos θ r sin θ r sin θ r cos θ r
M s = w r w 0 0 h r h
x i y i = M θ M s x i x y i y + x y
M θ represents the rotation parameter of parametric transformation, and M s represents the parameter of size scaling. As shown in Figure 5, ORPN is a multi-task network whose design follows RPN. The input of this module is a feature layer X R H × W × C , which is then converted into H × W × 256 through a set of 3 × 3 convolutional kernels and finally passed in three branches after activated by the ReLU function.
Each point on the feature map corresponds to k preset anchors. Therefore, the c l s classification branch outputs 2 k parameters for predicting the score of the presence of the foreground; the r e g h b b regression branch outputs 4 k parameters u x , u y , u h , u w for predicting the parameters of the horizontal bounding box; in addition, a r e g t r a n s branch for predicting the transformation matrix is added, for which 4 k transformation parameters ( v 1 , v 2 , v 3 , v 4 ) are output for completing the affine transformation from the HRoI to the RRoI. Finally, the overall loss function of ORPN is as follows:
L p i , u i , v i = 1 N c l s i L c l s p i , p i * + λ 1 1 N r e g i p i * L r e g u i , u i * + λ 2 1 N r e g i p i * L r e g v i , v i *
where i is the index of the anchor box and p i , u i , and v i represent the outputs of the three branches, respectively. p i * represents the positive softmax probability, and when p i = 0 , it represents the background. u i , u i * represent the predicted HRoI and the corresponding ground truth, respectively, and v i and v i * represent the predicted RRoI and the ground truth with angle information. λ 1 and λ 2 are balance parameters that were both set to 1. N c l s represents the number of anchors participating in the classification, and N r e g represents the number of anchors assigned as positive samples. The c l s branch uses the cross-entropy loss function to calculate the classification loss, and the r e g h b b and r e g t r a n s branches use the smooth L1 loss function. The transformation parameter vector v is defined as follows:
v 1 * = w r w cos θ r θ , v 2 * = h r h sin θ r θ v 3 * = w r w sin θ r θ , v 4 * = h r h cos θ r θ
ORPN generates RRoIs oriented in any direction without increasing the number of anchors. Compared with RPN, ORPN only adds a 1 × 1 convolutional layer to learn the affine transformation parameters from the HRoI to the RRoI and only adds a small amount of parameters. During training, ORPN assigns positive samples based on the IoU between the anchor and the minimum circumscribed rectangle of the rotated ground truth. ORPN first estimates the four parameters ( x , y , w , h ) of the HRoI and then obtains v * through the r e g t r a n s branch as the input of Equation (11) to estimate the position of the RRoI ( x r , y r , w r , h r , θ r ) .

3.3.2. Rotated RoI Align

Since the RRoI generated from ORPN contains different directions, the RoI pooling operation in the traditional detector will make the features represented by the RoI not have geometric robustness, so a rotation transformation matrix is used to convert the features of targets in different directions into a unified one, so that the features have rotation invariance. Furthermore, we learned the ideas in position-sensitive score maps [15] and RoI Align to improve the quality of the extracted features.
We used rotated region of interest align (RRoI Align) to extract features from the RRoI. By RRoI Align, the regions corresponding to the RoIs of different sizes on feature maps are mapped into output features with a fixed size, and the oriented features are corrected to the horizontal direction.
For an input feature map F of size H × W × C and a five-dimensional vector of the RRoI ( x r , y r , w r , h r , θ r ) , RRoI Align first divides the RRoI into K × K bins, and the size of each bin is ( w r K , h r K ) . Then, in each bin b i n ( i , j ) ( 0 i , j < K ) , k s × k s sampling points are set. The local coordinates for the sampling points in b i n ( i , j ) are:
i h r K + i h + 0.5 h r K k s × j w r K + j w + 0.5 w r K k s i h , j w = 0 , 1 , , k s 1
For each local coordinate ( x l , y l ) in b i n ( i , j ) , it is converted to the global coordinate ( x g , y g ) through the transformation matrix. After the corresponding feature regions are obtained, bilinear interpolation and average pooling are applied to each b i n ( i , j ) , and finally, a feature map of shape K × K × C is generated. Compared with the HRoI, ORRN cooperates with RRoI Align to further eliminate the complex background interference, which is closer to describing real objects, so it can provide better initialization features for the subsequent detection head.

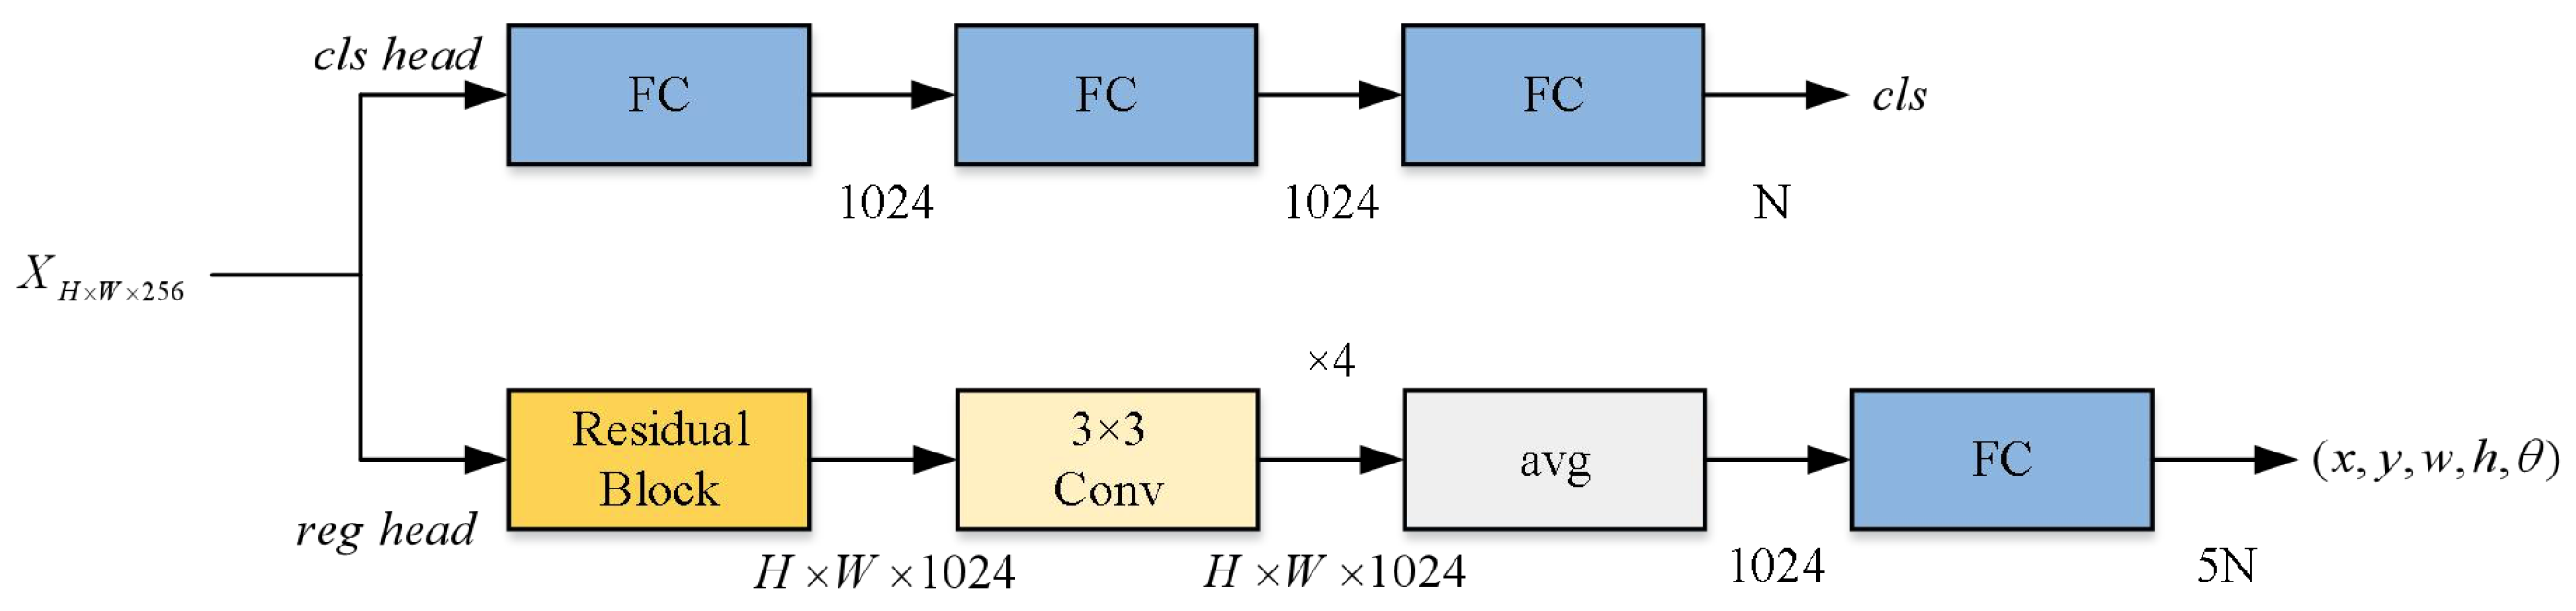
3.3.3. Pairwise Branch Detection Head

Two mainstream detection head structures commonly used in two-stage detectors are the fully connected detection head (fc-head) and convolution detection head (conv-head). The experiments in Wu et al. [45] showed that the fc-head and conv-head have the opposite advantages towards the classification and regression tasks. Compared with the conv-head, the fc-head assigns higher classification confidence to the RoIs with a higher IoU, which is also proven by the Pearson correlation coefficient between classification confidence and the IoU. The experiment also found that when the IoU is higher than 0.4, the conv-head has a better regression effect. Since the fc-head is more sensitive to the spatial position, it applies non-shared changes in different positions of the proposal feature map, giving the fc-head the sensitivity of spatial information and the ability to detect the whole and local object. Therefore, in the category identification task, the effect of the fc-head is better than the conv-head. However, the conv-head shares the convolution filter parameters at different positions of the proposal, and it has stronger robustness in the object regression task.
Figure 6 is the illustration of two different detection heads for common detection. After the above discussion, it is necessary to decouple the classification task from the regression task for better detection results. According to the characteristics of the fc-head and conv-head, a pairwise branch detection head (PBH) is proposed, in which a special fc-branch is used for target classification, while designing a conv-branch responsible for position regression.
As shown in Figure 7, PBH is a two-branch structure, including a classification branch (cls-head) and a multi-directional regression branch (reg-head). Finally, PBH integrates and decodes the predicted results of the above two detection branches into the final predicted OBB five-dimensional vector ( x p r e , y p r e , w p r e , h p r e , θ p r e ) . In the cls-head, the features extracted by RRoI Align are first passed through two 1024-dimensional fully connected layers and an N-dimensional fully connected layer to predict the category score of the RRoI. In the reg-head, a residual block is added to further extract the depth features, and then, four 3 × 3 convolutional layers are connected. Two implementations of the residual block network architecture are shown in Figure 8. After the convolution operation, the fully connected layer predicts the scale-invariant offset encoded by the relative coordinate system. The predicted output obtained from the reg-head are ( t x , t y , t h , t w , t θ ) , where ( t x , t y ) is the center position, ( t h , t w ) is the scaling factor of the length and width, and t θ is the angle offset. Finally, the prediction parameters and regression parameters can be decoded according to the following formula:
t x = 1 w r x p r e x r cos θ r + y p r e y r sin θ r t y = 1 h r x p r e x r sin θ r + y p r e y r cos θ r t h = log h p r e h r , t w = log w p r e w r , t θ = θ p r e θ r
where x r , x p r e represent the RRoI and the predicted OBB, respectively. The overall loss function is weighted by the cross-entropy loss function of the classification branch and the smooth L1 loss function of the regression branch. In the final stage of detection, multi-directional non-maximum suppression (Rotated-NMS) is used to suppress the repeated rotated boxes to obtain the output prediction box of the final network.

4. Experiments and Analysis

4.1. Introduction to SAR Ship Dataset

The datasets used in experiments were derived from ship images captured by remote sensing satellites. In order to better verify the effectiveness of our work, the optical datasets D O T A - S h i p and SAR datasets H R S I D and A I R - S A R S h i p - 1.0 were used for verification:
(1) H R S I D : HRSID is a high-resolution SAR remote sensing image ship dataset released by Wei et al. [46]. The dataset contains three annotation formats of ships: horizontal rectangle annotation, rotated rectangle annotation, and pixel-level segmentation annotation. In the HRSID dataset, 136 panoramic high-resolution SAR images with resolutions ranging from 1 m to 5 m are cropped to a pixel size of 800 × 800, resulting in a total of 5604 high-resolution SAR images. It includes different scenarios such as various sea conditions, large-scale sea areas, and near-shore ports. According to the statistics, there are a total of 16951 ships of various sizes. Examples of the dataset are shown in Figure 9. After randomly dividing the dataset, the training set contained 3643 images and the validation set contained 1961 images.
(2) A I R - S A R S h i p - 1.0 : The AIR-SARShip-1.0 dataset has a total of 31 SAR images of Gaofen-3, and the training set and test set have been specified. The image resolution includes 1 m and 3 m, and the polarization mode is single polarization. The dataset is annotated in VOC format and only labeled with horizontal boxes. The scene types include ports, islands and reefs, and sea surfaces with different levels of sea conditions. The background covers various scenes such as nearshore and distant seas, and the scene is the most complex, as shown in Figure 10. The size of the original image of the dataset is generally around 3000 × 3000, and the ship targets are mostly small. In the experiment, we intercepted the target area in the large image to form 180 small images with a size of about 500 × 500, of which 126 images were used for training and 54 images were used for testing.
(3) D O T A - S h i p d a t a s e t : The optical ship dataset DOTA-Ship comes from DOTA-v1.0, which is a large-scale geospatial object detection dataset open sourced by the Key Laboratory of Remote Sensing of Wuhan University. The images come from Google Earth, the Gaofen-2 satellite, airborne aerial images, etc. The resolution of satellite and airborne images is between 0.1 m and 1 m, and the resolution of images derived from Google Earth is between 0.1 m and 4.5 m. DOTA-v1.0 contains a total of 15 categories. DOTA-Ship built a dataset based on images containing ship categories in the DOTA-v1.0 dataset. A total of 573 images were selected, including ship targets of various sizes and directions, and covering many potentially complex scenarios, as shown in Figure 11. In the experiment, the original image was cropped to form a total of 8063 images with a resolution of 1024 × 1024, and the dataset was randomly divided into two parts as follows: one group included 5644 images for training, and a group of 2419 images was used for testing. The position of objects in the dataset were determined by rotated boxes.

4.2. Experimental Setting

The experimental section mainly verifies the effect of the SAR image edge enhancement (SEE) module and oriented region detector with the pairwise head (ORP-Det) proposed in this paper. Since SEE is a method specifically for SAR images, the verification experiment of SEE was carried out on the AIR-SARShip-1.0 dataset. In order to verify the difference between the background area of the image and the target area, the target uses a horizontal bounding box. In addition, the verification experiments of ORP-Det were carried out on DOTA-Ship and HRSID, and finally, the ablation experiments and joint experiments of the two modules were carried out on HRSID.
The experiments used Faster RCNN as the baseline network and chose ResNet-50 as the backbone with ImageNet pre-trained weights. The number of training iterations was 36 epochs, and the mini batch was set to 2. All experiments were performed in mmdetection-2.6.
In order to better compare the effectiveness of the detection algorithm proposed in this paper, the algorithm benchmark was firstly constructed, including four algorithms:
(1) Baseline: Faster RCNN with ResNet-50 as the backbone network, which was pre-trained by ImageNet.
(2) Faster RCNN (OBB): Based on Faster RCNN, the RPN part was retained, and the HBB detection branch and RoI Pooling were replaced with the OBB detection branch and RRoI Align.
(3) Faster RCNN + RRPN: Based on Faster RCNN, RPN was replaced with rotating region proposal network (RRPN).
(4) Mask RCNN (OBB): Based on Mask RCNN, the predicted mask of the Mask branch was input into the post-processing step to obtain the OBB represented by the smallest enclosing rectangle.

4.3. Experimental Results and Analysis

4.3.1. Experiment Evaluation of SEE

To evaluate the effect of the proposed SAR image edge enhancement module, this section analyzes the experimental results from both qualitative and quantitative perspectives.
It is worth noting that the two SAR datasets A I R - S A R S h i p - 1.0 and H R S I D both use horizontal ground truth as predicted targets for performance analysis in this section.
First, we analyze the impact of parameters in the SEE module on the network performance. r introduced in the SEE module is an important hyperparameter, which directly affects the capacity and computational complexity of the SEE module. To investigate this relationship, we conducted experiments with different r-values based on the baseline. The results in Table 1 show that detection performance is not always positively correlated with network complexity. In particular, we found that setting r = 16 struck a good balance between accuracy and complexity, and this value was used in all subsequent experiments.
The proposed SEE module was added in the initial stage of the network to realize the enhancement of image edges and the suppression of non-edge parts. It learns the discriminative threshold of the ROA operator through network back-propagation. In this section, the adaptability of the SEE module on different types of detectors is first judged by the experimental results. The SEE module was embedded on three representative networks in the field of two-stage, single-stage, and anchor-free algorithms. Table 2 shows the performance improvement of the SEE module on the three representative networks on two SAR datasets.
From the above table, it can be seen that the network after adding the SEE module was improved in both the AP and AR, and the difference between them was not obvious: the AP improvement on HRSID was 0.8%, 1.1%, and 0.7%, respectively; the AR increased by 0.9%, 0.7%, and 1.3%, respectively. Since the increase was reflected in both the AP and AR, we concluded that the SEE module enhances the network’s ability to correctly classify the target area and reduces the misdetections of the network by inhibiting noise and enhancing edge information. Meanwhile, after adding the SEE module to the three detectors, the AP improvement on the AIR-SARShip-1.0 was 1.9%, 1.8%, and 1.4%, while the improvement on the AR was 2.5%, 1.4%, and 0.9%. This shows that the SEE module alleviates the insufficient feature extraction of SAR images in the case of small datasets and complex scenes and improves the adaptability to different scene. Finally, the detection effect on AIR-SARShip-1.0 of the SEE module improved more than HRSID.

4.3.2. Experiment Evaluation of ORP-Det

This section mainly carries out the quantitative experimental analysis of the proposed oriented region proposal network (ORPN), pairwise branch detection head (PBH), and combined ORP-Det. Faster RCNN (OBB) was used as the baseline, and Precision, Recall, and F1 scores with a confidence level of 0.5 were used as the evaluation criteria in the experiment. The optical and SAR datasets in this section use rotated annotation boxes for network training and testing.
(1)
Experiment Evaluation of ORPN
The effect of ORPN is first verified, and the RRPN proposed in [37] was used as a comparison method. The results on the two datasets are shown in the following Table 3.
Compared with the baseline results, the F1 score of ORPN on the DOTA-Ship and HRSID increased by 2.24 and 4.35, which are more stable than that of RRPN. This proves that the strategy of learning the transition from the HRoI to the RRoI through additional branches in ORPN is beneficial to multi-directional detection accuracy, and the RRoI obtained by ORPN can better provide regression initialization positions. At the same time, the improvement of the recall rate shows that ORPN can have a better ability to avoid misdetections, especially in densely arranged scenarios. HRoIs may surround multiple ship targets, and the redundant features will interfere with the regression, while RRoIs can effectively avoid the above situation.
(2)
Experiment Evaluation of PBH
After replacing the detection head in the baseline with BPH, the results in Table 4 reflect that the precision on DOTA-Ship increased by 0.56%, the recall rate increased by 1.92%, and the F1 score increased by 1.28. In HRSID, the recall rate increased the most (2.68%), followed by the F1 score (2.56%) and precision (2.42%). It can be seen that the strategy of using the fc detection branch for classification and the conv branch for regression is effective, and its detection effect is better than using a single fc detection head to complete the classification and regression at the same time.
(3)
Experiment Evaluation of ORP-Det
Table 5 integrates the comparison performance of ORP-Det and its sub-modules with the baseline. It can be seen that ORP-Det achieved an F1 score of 92.50 on DOTA-Ship, which was 3.58 higher than the baseline; on HRSID, the F1 score increased by 4.44 to 86.75. This result shows that the ORP-Net proposed in this paper has a more obvious improvement in SAR ship detection. At the same time, the detection effect of ORPN combined with PBH is better than that of either of them alone. ORPN learns the mapping from the HRoI to the RRoI, which can generate a more accurate RRoI to provide a better initialization position for PBH; for rotation-invariant features, PBH can play the respective advantages of fully connected layers and convolutions for classification and regression.

4.3.3. Comparison of Performance between the Proposed Overall Framework and the State-of-the-Art

The proposed detection framework is compared to several detectors in this section. Table 6 shows the overall evaluation of the detector on the two datasets.
After the RRPN was added to Faster RCNN, the F1 score on DOTA-Ship improved by 0.86, while the recall on the SAR dataset HRSID reduced by 0.48%, and the F1 score was almost unchanged. On the one hand, this indicates that RRPN can achieve some limited effects by the preset anchor generation mechanism of six angles. Compared with the HRoI output of RPN, the RRoI had a better regression fitting effect on the rotated ground truth (RGT). On the other hand, the reduced recall may be due to the fact that many manually set anchors were judged as negative samples, which led to a more serious unbalance in positive and negative samples. Therefore, the aforementioned RRPN adding the artificial multi-angle prior is not the best method for modeling oriented anchors.
Compared with the baseline, the precision, recall, and F1 scores of Mask RCNN (OBB) on the SAR dataset improved by 2.38%, 2.72%, and 2.56, respectively. This may be attributed to the semantic information introduced by the full convolutional segmentation branch of Mask RCNN, which provides more location information for the SAR dataset with less semantic information, proving that the conv-head is helpful for target localization. However, the introduction of the segmentation branch causes more computation, and the post-processing stage also requires additional masks to convert to OBB, which is not an end-to-end algorithm. On the contrary, our PBH designs independent f c - h e a d and c o n v - h e a d , realizing end-to-end information integration, and achieves better detection effect. We also verified the effect of using both the SEE module and ORP-Det on SAR dataset. The results show that our overall method can further improve the precision by 1.75% and recall by 1.52%. In general, our overall approach respectively achieved 6.98% and 5.21% for the precision and recall compared to the baseline.

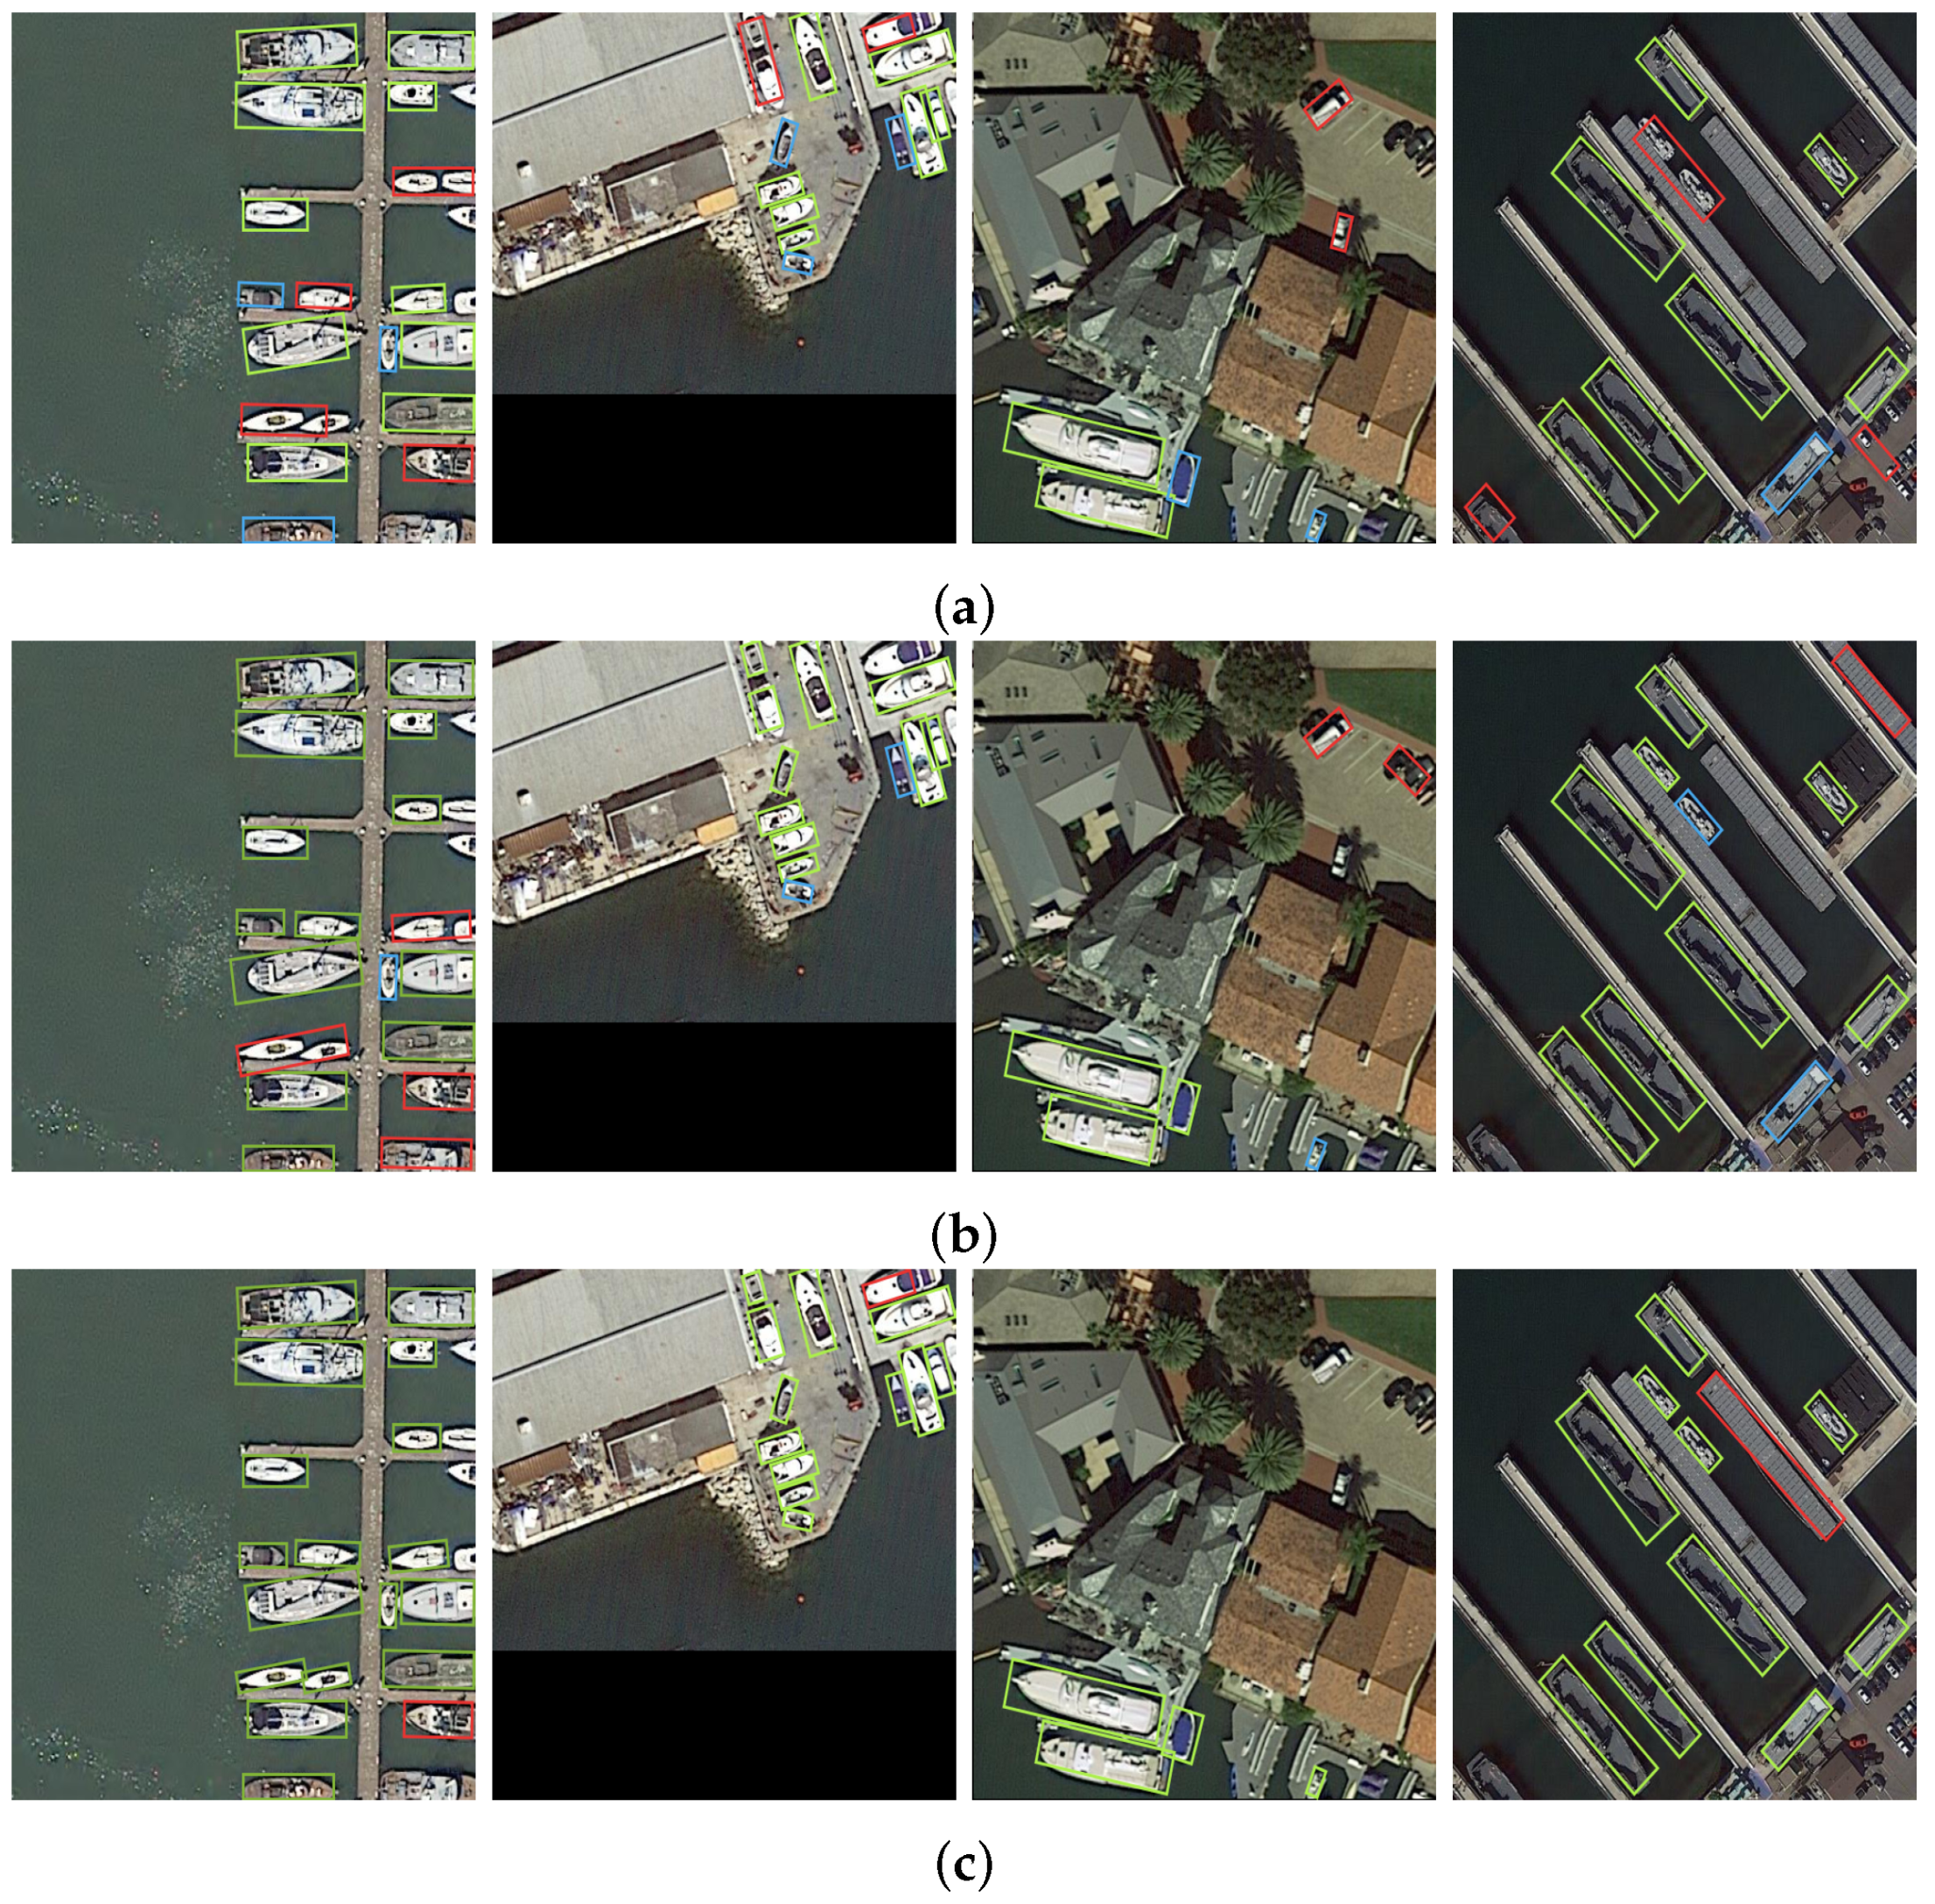
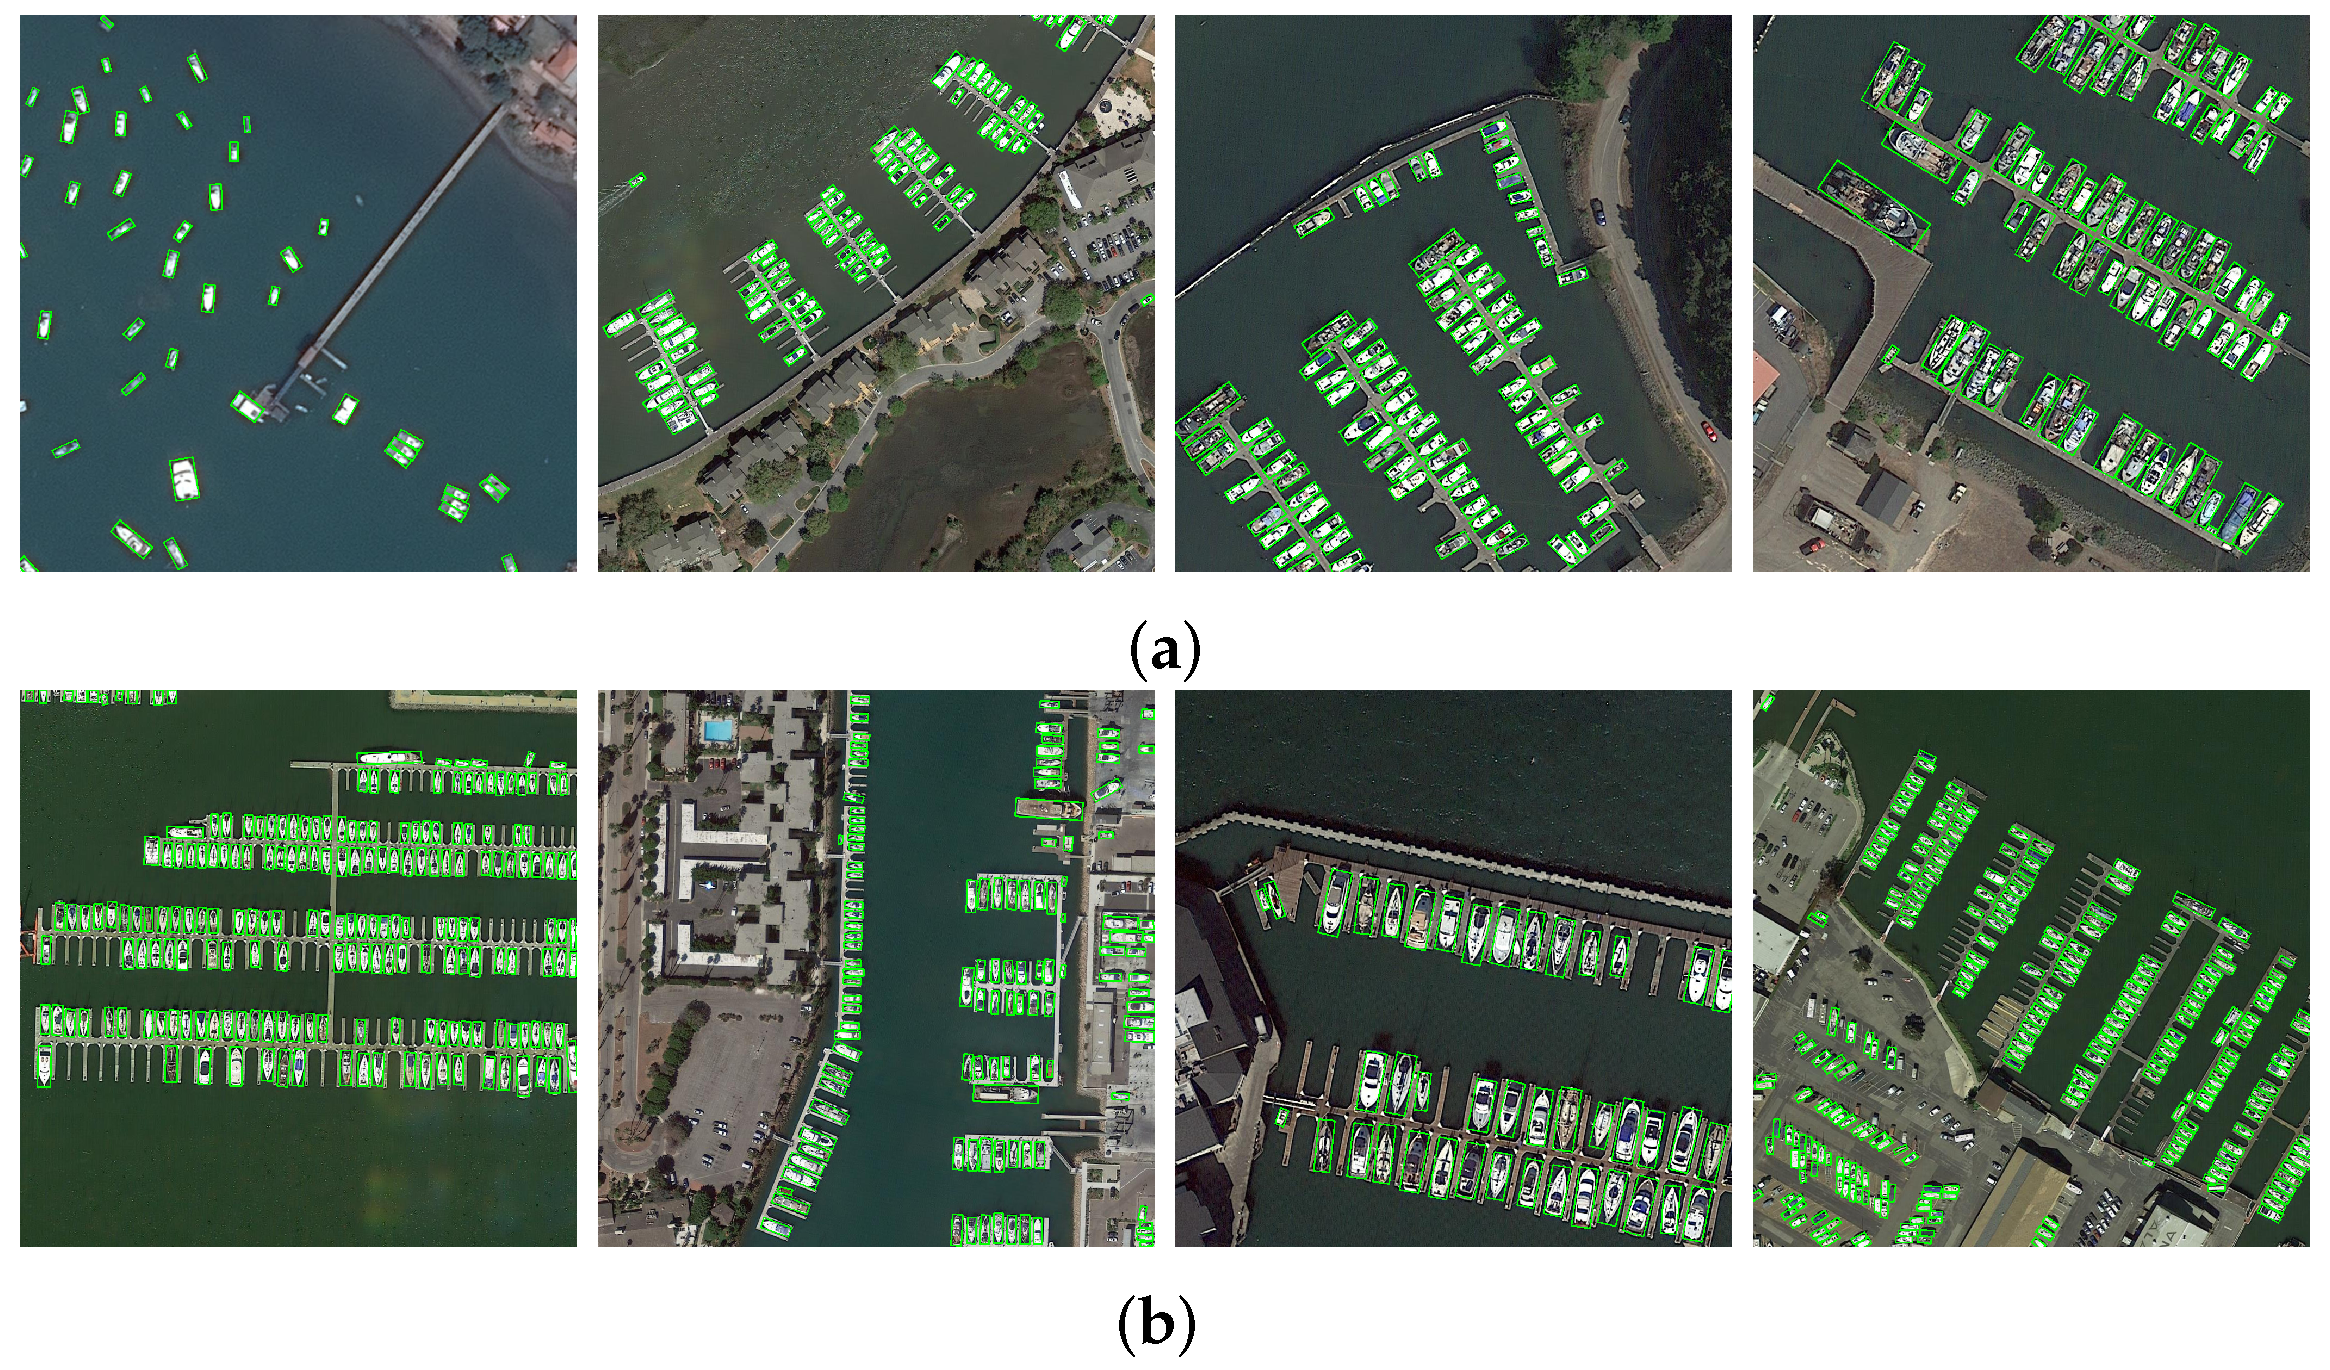
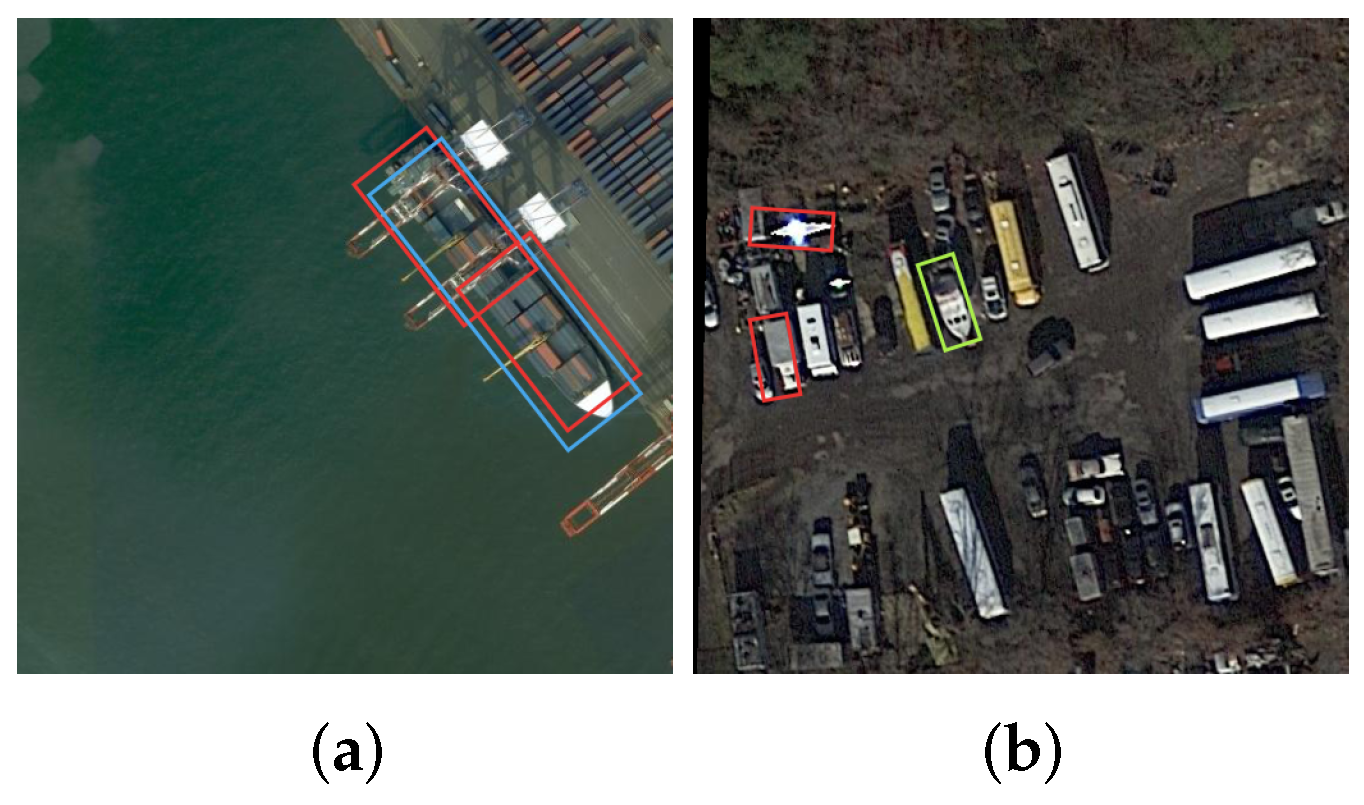
4.3.4. Visualization and Analysis of the Detection Results

To demonstrate the advantages of our method over previous ones, some visual comparison results are necessary. First, the visual contrast of the SEE module is given in Figure 12, and we give some qualitative analysis of ORP-Det on DOTA-Ship in Figure 13.
During the training process, the output of the SEE module is extracted and compared with the original image, and some visual comparison results are shown in Figure 12. It can be seen from the figure that the non-edge part of the original image is suppressed and the edge is enhanced. The interference of speckles in the background is effectively removed, while the severe speckle is blurred effectively, which weakens the interference to the gray pixel distribution.
Figure 14 shows the detection results of ORP-Det on ship targets in various scenarios. It can be seen from the figure that the algorithm proposed in this paper can accurately detect the ship target no matter whether in the monotonous offshore area, the nearshore area with land interference, or in the complex scene with a dense arrangement and strong interference.
However, because the method in this paper does not consider the utilization of the semantic information of image context, the ORP-Net also had some misdetection and false alarm problems. For example, the failure cases are given in Figure 15. In Figure 15a, a ship is detected as two targets; in Figure 15b, because objects such as the dock container and vehicles on land are close to the ship in shape, some vehicles are judged to be ships.

5. Conclusions

In this article, we proposed an accurate ORP-Det for RSI ship detection and a powerful SEE module for SAR images’ enhancement. In ORP-Det, the oriented region proposal network was designed to achieve high-quality performance for rotated ship RoIs. A pairwise branch detection head was proposed to overcome the features’ deviation to be suitable for classification and regression tasks. It enables the head to perform prediction in a more flexible manner. Furthermore, the SEE module was proposed to better enhance SAR edge features and greatly reduce the speckle noise. Experiments on both optical and SAR datasets showed that the proposed method can achieve state-of-the-art ship detection performance, and the highest precision improvement was 6.98% on HRSID, while the highest recall improvement was 5.21% on the same dataset. However, the method in this paper did not give too much consideration to the semantic extraction of the image context, and it is still inadequate for dealing with the false alarm of land similarity, which will be the focus of our future research.

Author Contributions

Conceptualization, B.H.; methodology, B.H.; software, M.T.; validation, B.H. and Q.Z.; writing—original draft preparation, B.H.; writing—review and editing, Q.Z. and C.H. All authors have read and agreed to the published version of the manuscript.

Funding

This research was funded by the National Key Research and Development Program of China (No. 2016YFC0803000) and the National Natural Science Foundation of China (No. 41371342).

Data Availability Statement

Not applicable.

Conflicts of Interest

The authors declare no conflict of interest.

Abbreviations

The following abbreviations are used in this manuscript:
SARSynthetic aperture radar
RSIRemote sensing images
CNNConvolutional neural network
SVDSingular value decomposition
CFARConstant false alarm rate
HRoIHorizontal region of interest
RRoIRotated region of interest
IOUIntersection over union
ROARatio-of-averages
GAPGlobal average pooling
HBBHorizontal bounding box
OBBOriented bounding box
ORPNOriented region proposal network
PBHPairwise detection head
SEESAR edge enhancement

References

  1. Yang, X.; Sun, H.; Fu, K.; Yang, J.; Sun, X.; Yan, M.; Guo, Z. Automatic ship detection in remote sensing images from google earth of complex scenes based on multiscale rotation dense feature pyramid networks. Remote Sens. 2018, 10, 132. [Google Scholar] [CrossRef] [Green Version]
  2. Zhang, S.; Wu, R.; Xu, K.; Wang, J.; Sun, W. RCNN-based ship detection from high resolution remote sensing imagery. Remote Sens. 2019, 11, 631. [Google Scholar] [CrossRef] [Green Version]
  3. Wang, M.; Zhou, S.d.; Bai, H.; Ma, N.; Ye, S. SAR water image segmentation based on GLCM and wavelet textures. In Proceedings of the 2010 6th International Conference on Wireless Communications Networking and Mobile Computing (WiCOM), Chengdu, China, 23–25 September 2010; pp. 1–4. [Google Scholar]
  4. Dellinger, F.; Delon, J.; Gousseau, Y.; Michel, J.; Tupin, F. SAR-SIFT: A SIFT-like algorithm for SAR images. IEEE Trans. Geosci. Remote Sens. 2014, 53, 453–466. [Google Scholar] [CrossRef] [Green Version]
  5. Krizhevsky, A.; Sutskever, I.; Hinton, G.E. Imagenet classification with deep convolutional neural networks. Adv. Neural Inf. Process. Syst. 2012, 25, 84–90. [Google Scholar] [CrossRef]
  6. Zeiler, M.D.; Fergus, R. Visualizing and understanding convolutional networks. In Proceedings of the European Conference on Computer Vision, Zurich, Switzerland, 6–12 September 2014; pp. 818–833. [Google Scholar]
  7. Szegedy, C.; Liu, W.; Jia, Y.; Sermanet, P.; Reed, S.; Anguelov, D.; Erhan, D.; Vanhoucke, V.; Rabinovich, A. Going deeper with convolutions. In Proceedings of the IEEE Conference on Computer Vision and Pattern Recognition, Boston, MA, USA, 7–12 June 2015; pp. 1–9. [Google Scholar]
  8. Simonyan, K.; Zisserman, A. Very deep convolutional networks for large-scale image recognition. arXiv 2014, arXiv:1409.1556. [Google Scholar]
  9. He, K.; Zhang, X.; Ren, S.; Sun, J. Deep residual learning for image recognition. In Proceedings of the IEEE Conference on Computer Vision and Pattern Recognition, Las Vegas, NV, USA, 27–30 June 2016; pp. 770–778. [Google Scholar]
  10. Girshick, R.; Donahue, J.; Darrell, T.; Malik, J. Rich feature hierarchies for accurate object detection and semantic segmentation. In Proceedings of the IEEE Conference on Computer Vision and Pattern Recognition, Columbus, OH, USA, 23–28 June 2014; pp. 580–587. [Google Scholar]
  11. He, K.; Zhang, X.; Ren, S.; Sun, J. Spatial pyramid pooling in deep convolutional networks for visual recognition. IEEE Trans. Pattern Anal. Mach. Intell. 2015, 37, 1904–1916. [Google Scholar] [CrossRef] [Green Version]
  12. Girshick, R. Fast RCNN. In Proceedings of the IEEE International Conference on Computer Vision, Santiago, Chile, 7–13 December 2015; pp. 1440–1448. [Google Scholar]
  13. Ren, S.; He, K.; Girshick, R.; Sun, J. Faster RCNN: Towards real-time object detection with region proposal networks. IEEE Trans. Pattern Anal. Mach. Intell. 2016, 39, 1137–1149. [Google Scholar] [CrossRef] [Green Version]
  14. Dai, J.; Li, Y.; He, K.; Sun, J. R-fcn: Object detection via region-based fully convolutional networks. Adv. Neural Inf. Process. Syst. 2016, 29, 379–387. [Google Scholar]
  15. Long, J.; Shelhamer, E.; Darrell, T. Fully convolutional networks for semantic segmentation. In Proceedings of the IEEE Conference on Computer Vision and Pattern Recognition, Boston, MA, USA, 7–12 June 2015; pp. 3431–3440. [Google Scholar]
  16. Redmon, J.; Divvala, S.; Girshick, R.; Farhadi, A. You only look once: Unified, real-time object detection. In Proceedings of the IEEE Conference on Computer Vision and Pattern Recognition, Las Vegas, NV, USA, 27–30 June 2016; pp. 779–788. [Google Scholar]
  17. Redmon, J.; Farhadi, A. YOLO9000: Better, faster, stronger. In Proceedings of the IEEE Conference on Computer Vision and Pattern Recognition, Honolulu, HI, USA, 21–26 July 2017; pp. 7263–7271. [Google Scholar]
  18. Redmon, J.; Farhadi, A. Yolov3: An incremental improvement. arXiv 2018, arXiv:1804.02767. [Google Scholar]
  19. Liu, W.; Anguelov, D.; Erhan, D.; Szegedy, C.; Reed, S.; Fu, C.Y.; Berg, A.C. Ssd: Single shot multibox detector. In Proceedings of the European Conference on Computer Vision, Amsterdam, The Netherlands, 8–16 October 2016; pp. 21–37. [Google Scholar]
  20. Fu, C.Y.; Liu, W.; Ranga, A.; Tyagi, A.; Berg, A.C. Dssd: Deconvolutional single shot detector. arXiv 2017, arXiv:1701.06659. [Google Scholar]
  21. Lin, T.Y.; Goyal, P.; Girshick, R.; He, K.; Dollár, P. Focal loss for dense object detection. In Proceedings of the IEEE International Conference on Computer Vision, Venice, Italy, 22–29 October 2017; pp. 2980–2988. [Google Scholar]
  22. Law, H.; Deng, J. Cornernet: Detecting objects as paired keypoints. In Proceedings of the European Conference on Computer Vision (ECCV), Munich, Germany, 8–14 September 2018; pp. 734–750. [Google Scholar]
  23. Duan, K.; Bai, S.; Xie, L.; Qi, H.; Huang, Q.; Tian, Q. Centernet: Keypoint triplets for object detection. In Proceedings of the IEEE/CVF International Conference on Computer Vision, Seoul, Korea, 27 October–2 November 2019; pp. 6569–6578. [Google Scholar]
  24. Tian, Z.; Shen, C.; Chen, H.; He, T. Fcos: Fully convolutional one-stage object detection. In Proceedings of the IEEE/CVF International Conference on Computer Vision, Seoul, Korea, 27 October–2 November 2019; pp. 9627–9636. [Google Scholar]
  25. Kong, T.; Sun, F.; Liu, H.; Jiang, Y.; Li, L.; Shi, J. Foveabox: Beyound anchor-based object detection. IEEE Trans. Image Process. 2020, 29, 7389–7398. [Google Scholar] [CrossRef]
  26. Zhu, C.; Zhou, H.; Wang, R.; Guo, J. A novel hierarchical method of ship detection from spaceborne optical image based on shape and texture features. IEEE Trans. Geosci. Remote Sens. 2010, 48, 3446–3456. [Google Scholar] [CrossRef]
  27. Yang, G.; Li, B.; Ji, S.; Gao, F.; Xu, Q. Ship detection from optical satellite images based on sea surface analysis. IEEE Geosci. Remote Sens. Lett. 2013, 11, 641–645. [Google Scholar] [CrossRef]
  28. Qi, S.; Ma, J.; Lin, J.; Li, Y.; Tian, J. Unsupervised ship detection based on saliency and S-HOG descriptor from optical satellite images. IEEE Geosci. Remote Sens. Lett. 2015, 12, 1451–1455. [Google Scholar]
  29. Heikkilä, M.; Pietikäinen, M.; Schmid, C. Description of interest regions with local binary patterns. Pattern Recognit. 2009, 42, 425–436. [Google Scholar] [CrossRef] [Green Version]
  30. Dalal, N.; Triggs, B. Histograms of oriented gradients for human detection. In Proceedings of the 2005 IEEE Computer Society Conference on Computer Vision and Pattern Recognition (CVPR’05), San Diego, CA, USA, 20–25 June 2005; pp. 886–893. [Google Scholar]
  31. Lowe, D.G. Distinctive image features from scale-invariant keypoints. Int. J. Comput. Vis. 2004, 60, 91–110. [Google Scholar] [CrossRef]
  32. Zhang, R.; Yao, J.; Zhang, K.; Feng, C.; Zhang, J. S-CNN-based ship detection from high-resolution remote sensing images. Int. Arch. Photogramm. Remote Sens. Spat. Inf. Sci. 2016, 41, 423–430. [Google Scholar] [CrossRef] [Green Version]
  33. Zou, Z.; Shi, Z. Ship detection in spaceborne optical image with SVD networks. IEEE Trans. Geosci. Remote Sens. 2016, 54, 5832–5845. [Google Scholar] [CrossRef]
  34. Tang, J.; Deng, C.; Huang, G.B.; Zhao, B. Compressed-domain ship detection on spaceborne optical image using deep neural network and extreme learning machine. IEEE Trans. Geosci. Remote Sens. 2014, 53, 1174–1185. [Google Scholar] [CrossRef]
  35. Lin, H.; Shi, Z.; Zou, Z. Fully convolutional network with task partitioning for inshore ship detection in optical remote sensing images. IEEE Geosci. Remote Sens. Lett. 2017, 14, 1665–1669. [Google Scholar] [CrossRef]
  36. Liu, Z.; Wang, H.; Weng, L.; Yang, Y. Ship rotated bounding box space for ship extraction from high-resolution optical satellite images with complex backgrounds. IEEE Geosci. Remote Sens. Lett. 2016, 13, 1074–1078. [Google Scholar] [CrossRef]
  37. Ma, J.; Shao, W.; Ye, H.; Wang, L.; Wang, H.; Zheng, Y.; Xue, X. Arbitrary-oriented scene text detection via rotation proposals. IEEE Trans. Multimed. 2018, 20, 3111–3122. [Google Scholar] [CrossRef] [Green Version]
  38. Ding, J.; Xue, N.; Long, Y.; Xia, G.S.; Lu, Q. Learning roi transformer for oriented object detection in aerial images. In Proceedings of the IEEE/CVF Conference on Computer Vision and Pattern Recognition, Long Beach, CA, USA, 15–20 June 2019; pp. 2849–2858. [Google Scholar]
  39. Bodla, N.; Singh, B.; Chellappa, R.; Davis, L.S. Soft-NMS–improving object detection with one line of code. In Proceedings of the IEEE International Conference on Computer Vision, Venice, Italy, 22–29 October 2017; pp. 5561–5569. [Google Scholar]
  40. Touzi, R.; Lopes, A.; Bousquet, P. A statistical and geometrical edge detector for SAR images. IEEE Trans. Geosci. Remote Sens. 1988, 26, 764–773. [Google Scholar] [CrossRef]
  41. Bovik, A.C. On detecting edges in speckle imagery. IEEE Trans. Acoust. Speech Signal Process. 1988, 36, 1618–1627. [Google Scholar] [CrossRef]
  42. Wei, Q.R.; Yuan, M.D.; Feng, D.Z. Automatic local thresholding algorithm for SAR image edge detection. In Proceedings of the IET International Radar Conference 2013, Xi’an, China, 14–16 April 2013. [Google Scholar] [CrossRef]
  43. Ibrahim, N.; Sari, S. Comparative Assessment of Carotid Lumen Edges Using Canny Detection and Canny-Otsu Threshold Methods. Adv. Sci. Lett. 2017, 23, 4005–4008. [Google Scholar] [CrossRef]
  44. Setiawan, B.D.; Rusydi, A.N.; Pradityo, K. Lake edge detection using Canny algorithm and Otsu thresholding. In Proceedings of the 2017 International Symposium on Geoinformatics, Malang, Indonesia, 24–25 November 2017. [Google Scholar] [CrossRef]
  45. Wu, Y.; Chen, Y.; Yuan, L.; Liu, Z.; Wang, L.; Li, H.; Fu, Y. Rethinking classification and localization for object detection. In Proceedings of the IEEE/CVF Conference on Computer Vision and Pattern Recognition, Seattle, WA, USA, 13–19 June 2020; pp. 10186–10195. [Google Scholar]
  46. Wei, S.; Zeng, X.; Qu, Q.; Wang, M.; Su, H.; Shi, J. HRSID: A high-resolution SAR images dataset for ship detection and instance segmentation. IEEE Access 2020, 8, 120234–120254. [Google Scholar] [CrossRef]
Figure 1. Overview of the proposed framework for ship detection.
Remotesensing 14 02177 g001
Figure 2. Description of the SAR image edge enhancement (SEE) module.
Remotesensing 14 02177 g002
Figure 3. Description of the channel-shared adaptive threshold (CSAT) block.
Remotesensing 14 02177 g003
Figure 4. Pipeline of the feature discrimination and image processing strategy.
Remotesensing 14 02177 g004
Figure 5. Description of the oriented region proposal network.
Remotesensing 14 02177 g005
Figure 6. Structure of different detection heads.
Remotesensing 14 02177 g006
Figure 7. Description of the pairwise branch detection head.
Remotesensing 14 02177 g007
Figure 8. (a,b) Schematic of two different kinds of resblocks in conv-head.
Remotesensing 14 02177 g008
Figure 9. Some samples from HRSID.
Remotesensing 14 02177 g009
Figure 10. Some samples from the AIR-SARShip-1.0 dataset.
Remotesensing 14 02177 g010
Figure 11. Some samples from DOTA-Ship.
Remotesensing 14 02177 g011
Figure 12. Some of the enhanced results obtained by the SAR image edge enhancement (SEE) module. (a) Original input images. (b) SEE outputs.
Remotesensing 14 02177 g012
Figure 13. Some of the detection results of different methods on DOTA-Ship. The green, red, and blue boxes indicate the correctly detected ships, false alarms, and the missing ships. (a) R2CNN. (b) Faster RCNN. (c) Our proposed ORP-Det.
Remotesensing 14 02177 g013
Figure 14. (a,b) Some of the detection results of a complex environment on DOTA-Ship. The green boxes indicate the correctly detected ships.
Remotesensing 14 02177 g014
Figure 15. Examples of some failure cases on DOTA. (a) Single object. (b) Easily confused objects on land.
Remotesensing 14 02177 g015
Table 1. AP, AR, and network parameter amount on AIR-SARShip-1.0 at different r. Here, original refers to Faster RCNN with ResNet-50.
rAP (%)AR (%)Million Parameters
475.090.953.7
874.490.549.6
1673.990.145.4
3272.688.343.5
Original72.087.641.4
The best results are in bold.
Table 2. Experiment results for the SEE module on two SAR datasets.
DetectorAIR-SARShip-1.0HRSID
AP(%)AR(%)AP(%)AR(%)
YOLO v370.386.985.991.2
YOLO v3 w. SEE72.188.387.091.9
FCOS65.584.386.889.1
FCOS w. SEE66.986.287.590.4
Faster RCNN72.087.688.590.6
Faster RCNN w. SEE73.990.189.391.5
The best results are in bold.
Table 3. Evaluation experiments for oriented region proposal network.
DetectorDOTA-Ship (Optical)HRSID (SAR)
Precision (%)Recall (%)F1Precision (%)Recall (%)F1
Baseline91.5586.4388.9283.281.4582.31
+RRPN [37]91.9887.6989.7883.6980.9782.3
+ORPN93.2788.5290.8386.3784.9285.64
The best results are in bold.
Table 4. Evaluation experiments for pairwise branch detection head.
DetectorDOTA-Ship (Optical)HRSID (SAR)
Precision (%)Recall (%)F1Precision (%)Recall (%)F1
Baseline91.5586.4388.9283.281.4582.31
+PBH92.1188.3590.285.6284.1384.87
The best results are in bold.
Table 5. Ablation experiments for ORP-Det.
DetectorDOTA-Ship (Optical)HRSID (SAR)
Precision (%)Recall (%)F1Precision (%)Recall (%)F1
Baseline91.5586.4388.9283.281.4582.31
+ORPN93.2788.5290.8386.3784.9285.64
+PBH92.1188.3590.285.6284.1384.87
ORP-Det93.5791.4692.5088.4385.1486.75
The best results are in bold.
Table 6. Experimental results of the overall framework on HRSID and DOTA-Ship.
DetectorBackboneDOTA-Ship (Optical)HRSID (SAR)
Precision
(%)
Recall
(%)
F1Precision
(%)
Recall
(%)
F1
Anchor-Free Method
FCOS (OBB)R-50-FPN86.5384.1185.3079.6576.5478.06
FCOS (OBB)R-101-FPN86.4283.1084.7378.4575.5276.96
Single-Stage Method
RetinaNet (OBB)R-101-FPN72.6770.1471.8583.1872.5672.07
DRNH-10485.4883.7982.9672.6672.8572.75
R3DetR-101-FPN77.4574.5475.9770.1369.5569.84
Two-Stage Method
Faster RCNN (OBB)R-101-FPN91.5586.4388.9283.281.4582.31
Mask RCNN (OBB)R-101-FPN92.0388.1490.0485.5884.1784.87
R2CNNR-101-FPN55.7652.3253.9850.151.550.81
R2CNN++R-101-FPN66.7964.0765.4059.860.7760.28
SCRDetR-101-FPN72.3469.8871.0969.9168.5769.23
RoI TransformerR-101-FPN92.7690.2291.4787.3283.2485.23
Faster RCNN+ORPNR-101-FPN93.2788.5290.8386.3784.9285.64
Faster RCNN+PBHR-101-FPN92.1188.3590.285.6284.1384.87
ORP-DetR-101-FPN93.5791.4692.5088.4385.1486.75
ORP-Det w. SEER-101-FPN90.1886.6688.38
The best results are in bold.
Publisher’s Note: MDPI stays neutral with regard to jurisdictional claims in published maps and institutional affiliations.

