Article

Resolution-Sensitive Added Value Analysis of CORDEX-CORE RegCM4-7 Past Seasonal Precipitation Simulations over Africa Using Satellite-Based Observational Products

by
Gnim Tchalim Gnitou
1,
Guirong Tan
2,*,
Yan Hongming
3,
Isaac Kwesi Nooni
1,4 and
Kenny Thiam Choy Lim Kam Sian
1
1
Binjiang College, Nanjing University of Information Science & Technology, Wuxi 214105, China
2
Collaborative Innovation Center on Forecast and Evaluation of Meteorological Disasters, Key Laboratory of Meteorological Disaster, Ministry of Education, Nanjing University of Information Science and Technology, Nanjing 210044, China
3
Yunnan Climate Center, Kunming 650034, China
4
School of Geographical Sciences, Nanjing University of Information Science & Technology, Nanjing 210044, China
*
Author to whom correspondence should be addressed.
Remote Sens. 2022, 14(9), 2102; https://doi.org/10.3390/rs14092102
Submission received: 2 March 2022 / Revised: 16 April 2022 / Accepted: 25 April 2022 / Published: 27 April 2022
(This article belongs to the Special Issue Remote Sensing for Climate Change)

Abstract

:
This study adopts a two-way approach to CORDEX-CORE RegCM4-7 seasonal precipitation simulations’ Added Value (AV) analysis over Africa, which aims to quantify potential improvements introduced by the downscaling approach at high and low resolution, using satellite-based observational products. The results show that RegCM4-7 does add value to its driving Global Climate Models (GCMs) with a positive Added Value Coverage (AVC) ranging between 20 and 60% at high resolution, depending on the season and the boundary conditions. At low resolution, the results indicate an increase in the positive AVC by up to 20% compared to the high-resolution results, with an up to 8% decrease for instances where an increase is not observed. Typical climate zones such as West Africa, Central Africa, and Southern East Africa, where improvements by Regional Climate Models (RCMs) are expected due to strong dependence on mesoscale and fine-scale features, show positive AVC greater than 20%, regardless of the season and the driving GCM. These findings provide more evidence for confirming the hypothesis that the RCMs AV is influenced by their internal physics rather than being the product of a mere disaggregation of large-scale features provided by GCMs. Although the results show some dependencies to the driving GCMs relating to their equilibrium climate sensitivity nature, the findings at low resolutions similar to the native GCM resolutions make the influence of internal physics more important. The findings also feature the CORDEX-CORE RegCM4-7 precipitation simulations’ potential in bridging the quality and resolution gap between coarse GCMs and high-resolution remote sensing datasets. Even if further post-processing activities, such as bias correction, may still be needed to remove persistent biases at high resolution, using upscaled RCMs as an alternative to GCMs for large-scale precipitation studies over Africa can be insightful if the AV and other performance statistics are satisfactory for the intended application.

1. Introduction

The distillation of regional climate information is crucial for anticipating the potential threats of regional-to-local climate change and formulating actionable adaptation and mitigation plans [1]. Carrying out these activities with primary climate models, known as Global Climate Models (GCMs), has been prohibitive due to the relatively coarse resolutions at which they are produced and the subsequent computational burden that could arise from increasing such resolutions. Moreover, the regional nature of decision-making expected from these activities demands the accountability of fine-scale atmospheric phenomena and heterogeneity of surface properties not explicitly resolved by GCMs [2].
To address this central issue, limited-area nested Regional Climate Models (RCMs) are used as a tool to downscale large-scale boundary conditions from GCMs or reanalysis data. The expectation from the RCMs is to serve as a “magnifying glass” to reveal fine-scale details that are hampered by the impossibility of running the GCMs at the desired high resolution [3]. This one-way nesting approach to dynamical downscaling has been the backbone of the three decade’s worth of researching and developing RCMs, with substantial applications and use cases for various scientific problems worldwide [4,5]. Although limited-area two-way nesting models have been introduced for understanding feedback from a regional to a global scale, which one-way models do not consider, their results remained inconclusive and sometimes difficult to obtain due to their computationally demanding nature [4].
The large adoption of the one-way nesting methods for the production of RCMs also contributed to a paradigm shift in climate model evaluation and validation methods. Unlike traditional validation methods where the skill of the climate model output is directly assessed by comparison with observations, the one-way nesting method has triggered the need to quantify the improvement by the downscaling process, known as Added Value (AV) methods [6]. Since then, the AV concept has undergone many refinements and precondition relaxation to accommodate various validation scenarios. These scenarios range from a conjectural and subjective expectation of an AV to a more objective quantification based on observations [7].
Sticking with the principal aim of RCMs, which is to produce reliable high-resolution data for regional to local decision-making, AV studies remained mostly observational, with a one-way perspective of quantifying improvements by downscaling models from the coarse resolution GCMs to the high-resolution RCM outputs. Consequently, less interest was shown in a second type of observational AV, which could complementarily quantify in a two-way manner the AV feedback from a regional to a global scale [6]. Such a secondary metric could constitute a reliable way of quantifying the resolution-sensitivity of the AV results and disentangling results due to the RCMs’ internal physics from the ones due to a mere disaggregation of the boundary condition [8].
The availability of RCM data in the public domain has served as a good playground for exploring the AV by one-way nested high-resolution RCMs [9]. This was made possible thanks to the World Research Climate Program (WRCP) under the Coordinated Regional Downscaling Experiment (CORDEX) [10,11,12], which made available a series of reanalysis and GCM-driven RCM outputs at approximately 50 km resolution in its first phase, while giving the highest priority to the African continent. Recently, the second phase, which aims at guaranteeing the availability of a homogeneous set of simulations over all the regions of the world, called the Common Regional Experiment Framework (CORDEX-CORE) [13,14,15,16], was launched by making available for its first experiments a set of simulations at an unprecedented resolution of 25 km and, thus, reaching common satellite-based observational products scale.
For Africa, which is a priority region in the context of CORDEX, the production of highly resolved simulations has not been followed by an increase in the resolution of local or global ground-based observational datasets. This situation is detrimental to observational AV studies. In practice, one has to rely on satellite-based observational datasets produced at similar resolutions by keeping in mind that they might also have some biases. Moreover, RCMs AV studies over Africa [17,18,19,20,21] were conducted under the one-way paradigm, except for the recent work by Dosio et al. [19], where a two-way approach is adopted in the context of precipitation climate change projections. These studies show that the evaluated RCMs add value to their boundary conditions over Africa. Still, the extent to which such an AV could be sensitive to the resolution is usually not analyzed.
Beyond the valuable information that could be obtained using a two-way approach to AV analysis over Africa, the use of satellite-based observational products as a reference for such analysis offers the opportunity to explore the potential of dynamical downscaling to bridge the resolution and quality gap between GCMs and observational products based on remote sensing technology. These newly emerging needs are highly relevant for both the climate modelling and the remote sensing communities, especially for the precipitation variable over Africa, where a consensual and unified characterization is needed [22,23,24].
In this context, the AV metrics can represent reliable quantitative metrics for estimating how the downscaling approach improves the driving GCMs towards reproducing observed features by remotely sensed datasets. Such applications of the AV analysis could be valuable for climate data distillation [1] and for exploring the possibility of using highly resolved RCMs as proxies for satellite-based observations in climate projections, where observations are not available. Additionally, the AV analysis could be instrumental in choosing post-processing methods such as bias correction if the RCMs’ performances are inadequate for the intended application [21,25].
In this study, we propose an analysis of the CORDEX-CORE RegCM4-7 past precipitation simulations over Africa, with a perspective on the contribution of the resolution to AV results. The AV by the RCM simulations over the driving GCMs is computed and analyzed at fine- and large-scale resolutions to represent an improvement at a regional and global scale and to further understand AV sensitivity to resolution. The study results are also used to distinguish the role of the resolution from the role of the physics parameterizations used for the downscaling experiment of CORDEX-CORE RegCM4-7 over Africa and quantify its contribution to bridging the gap between GCMs and satellite-based observational precipitation products.

2. Study Area, Data, and Methods
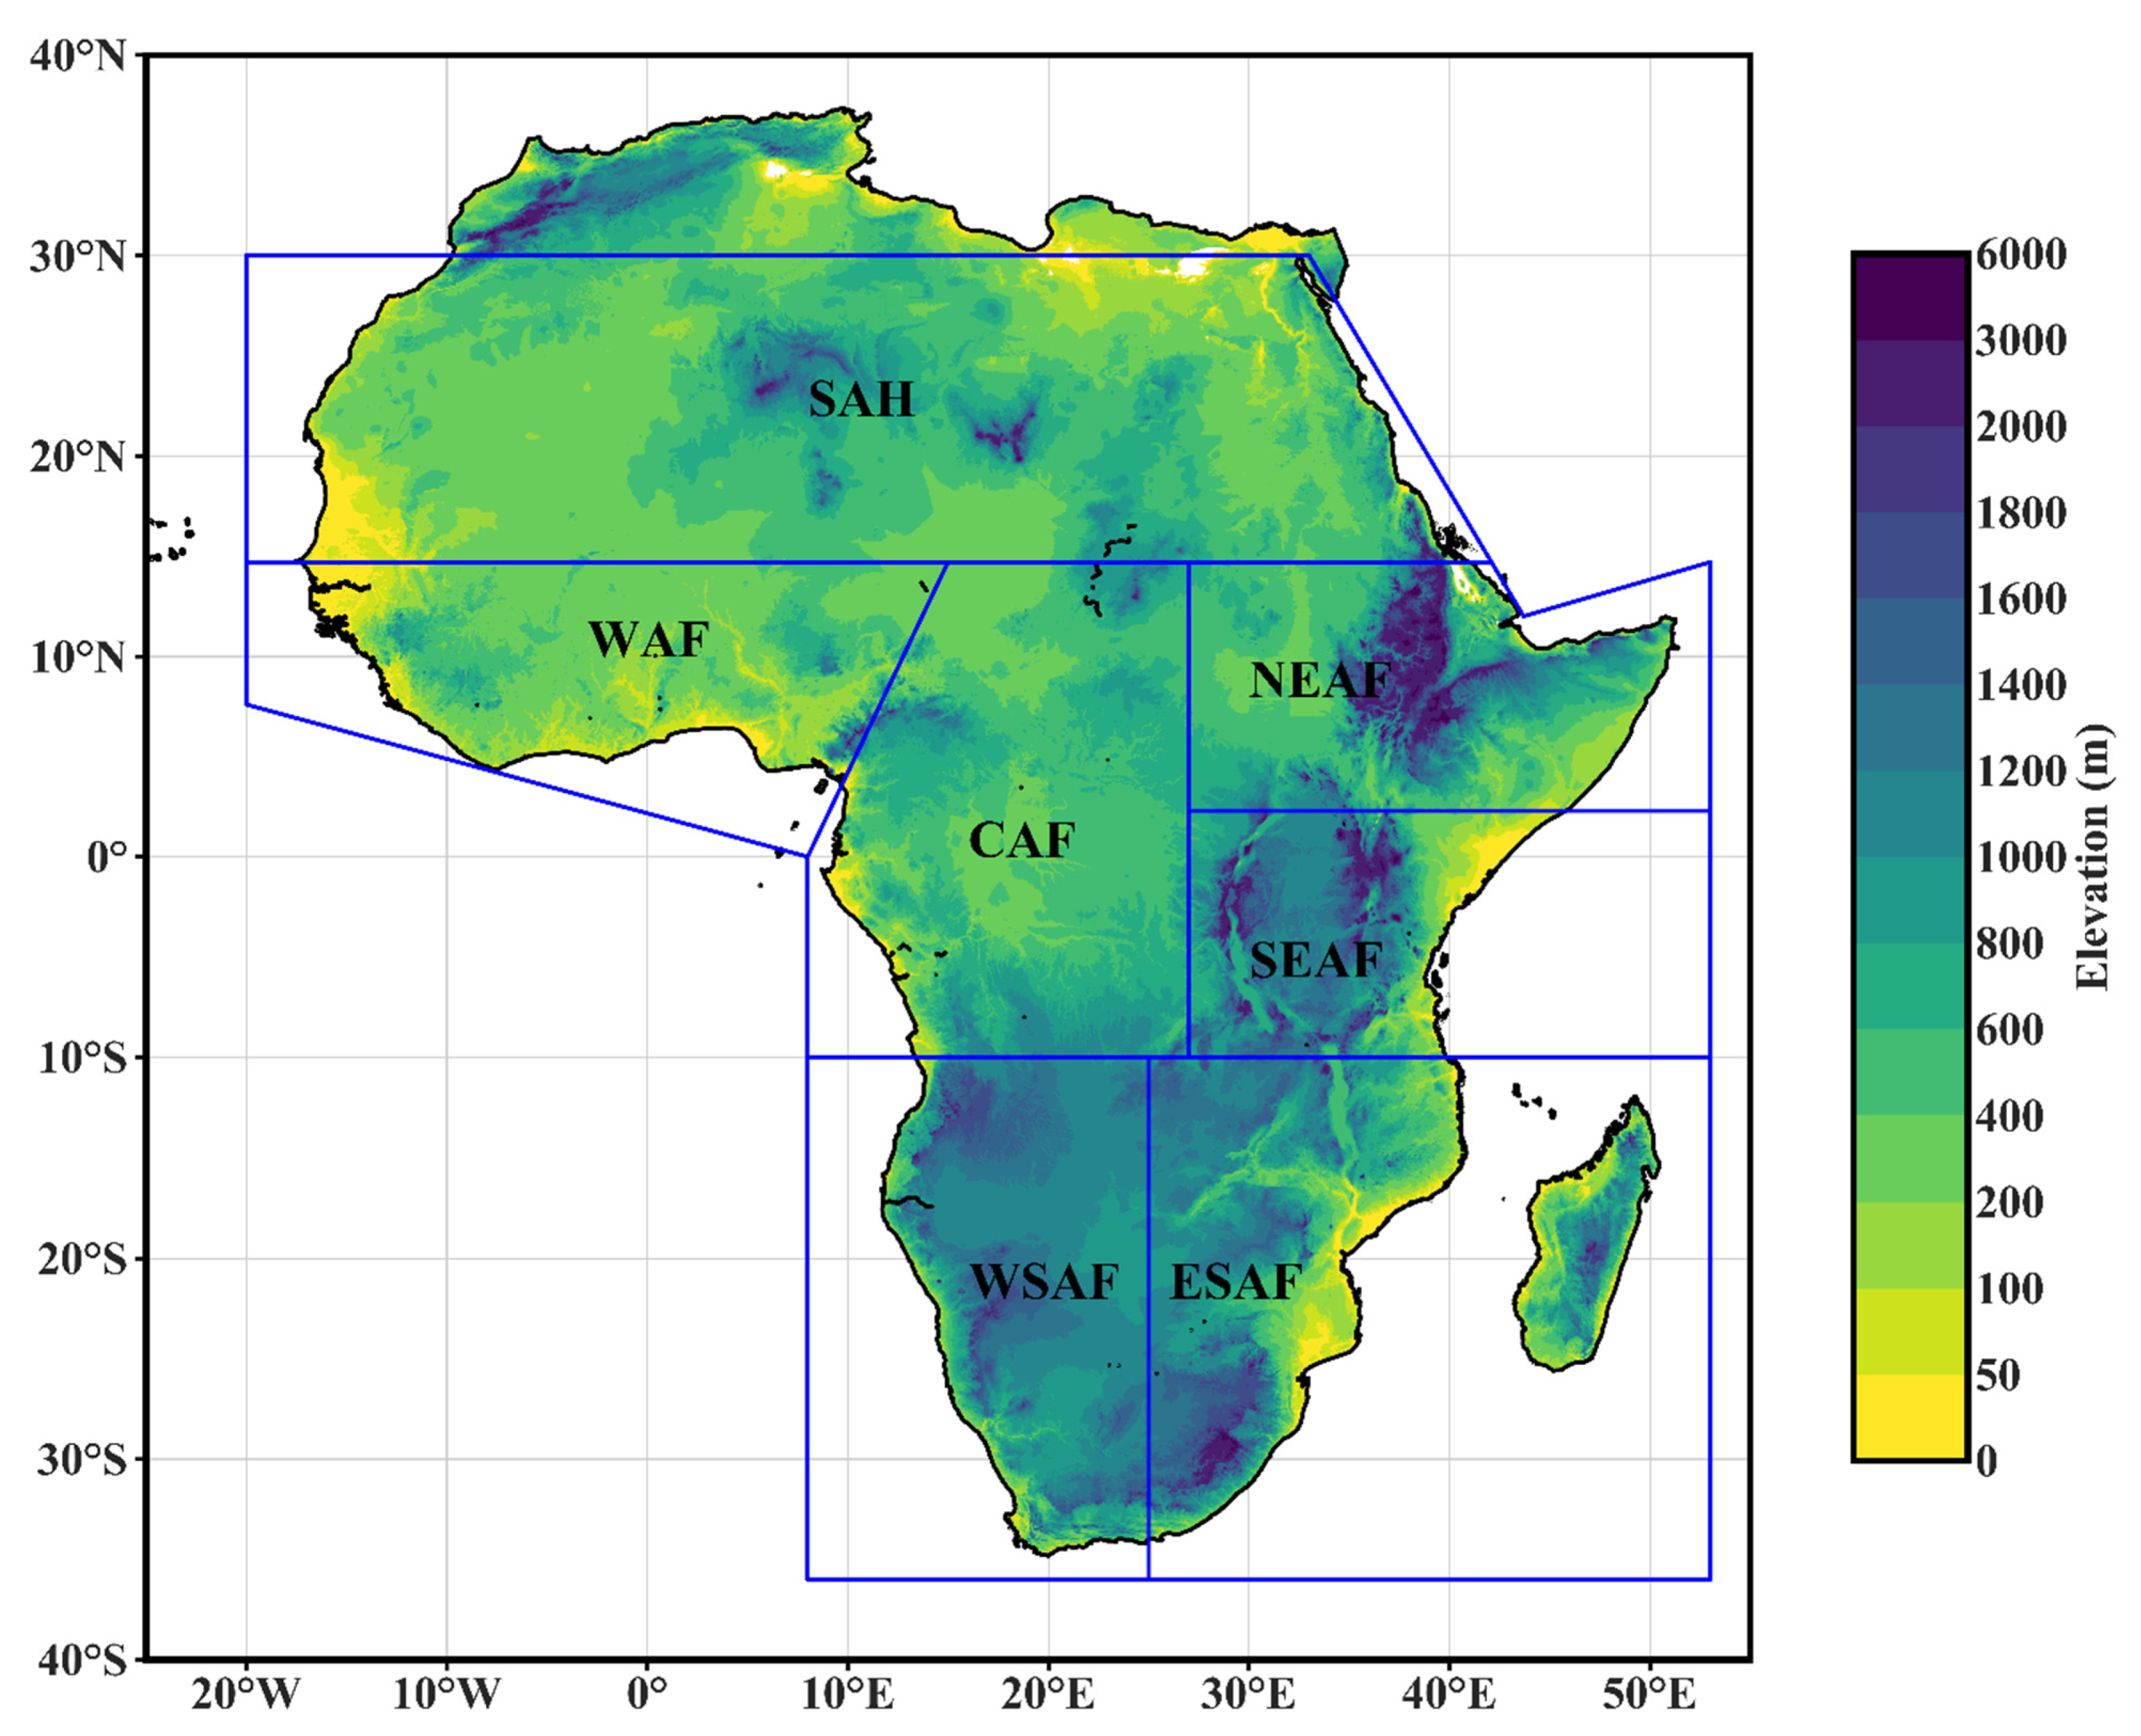
2.1. Study Area

The African continent was designated as the highest priority region in the context of the CORDEX framework, owing to its vulnerability to global warming and its deficit of infrastructural resources needed to carry out climate projection modeling activities [13]. Africa represents a key domain of the 9 out of 14 continental CORDEX domains considered for the resolution doubling CORDEX-CORE simulations [16], and an undeniable testbed region for typical improvement expected from highly resolved RCMs, especially for fine scale-dependent variables such as precipitation [7,9,13]. This is particularly true concerning Africa’s complex topographic structure, and its unique and homogeneous climate zones such as the Sahara (SAH), West Africa (WAF), Central Africa (CAF), Northern East Africa (NEAF), Southern East Africa, Eastern South Africa (ESAF) and Western South Africa (WSAF) (see Figure 1).
Moreover, Africa is a hotspot for large-scale precipitation patterns, which are still not adequately reproduced by state-of-the-art GCMs [26,27]. Although the AV by RCMs is usually expected at a finer scale, the extent to which such improvements can cumulatively enhance large-scale precipitation patterns and represent a large-scale AV at GCMs resolutions is an open question [6,7,28]. Addressing such a question for Africa is critical, especially from the model users’ perspective, given the increasing availability of various climate models over the continent and the possible risk of data misuse [1]. Additionally, such a distinction between AVs at large- and fine-scale can be resourceful in disentangling the role of resolution from the RCMs internal physics and reveal how sensitive the AV is to resolution.
Last but not least, the production of precipitation estimates complementing existing ones, such as satellite-based products, reanalysis data and traditional climate model data, has been recommended as a prerequisite toward unifying and further understanding rainfall over Africa [29]. This alternative to rainfall stations observation data is becoming unavoidable given the serious decline in the very few stations that have been operating for the past few decades [22]. The presence of an AV by CORDEX-CORE RegCM4-7 could be instrumental, not only to address the need for a consensus on rainfall over Africa, but also for a process-based understanding of decades of satellite-based climate data records available over the continent [24,30]. Another opportunity for the African modeling community could be the potential collaborations with the remote sensing community in order to leverage the gigantesque amount of literature available on data processing [31] and use it to enhance RCMs quality.

2.2. Data and Method

The resolution-sensitive analysis of the AV by RCMs output, proposed in the present study, is mainly based on the CORDEX-CORE RegCM4-7 past precipitation simulations over the African domain. The RegCM4-7 RCM [32] is developed by the Abdus Salam International Center for Theoretical Physics (ITCP), located in Trieste, Italy. As part of the CORDEX-CORE’s first experiment, the RegCM4-7 was used to downscale the ERA-Interim (ERA-INT) reanalysis data [33] for evaluation runs and 3 GCMs of the Coupled Model Intercomparison Project, phase 5 (CMIP5) [34] for the historical runs. HadGEM2-ES [35], MPI-ESM-MR [36], and NorESM1-M [37] GCMs, respectively, corresponding to high, medium and low equilibrium climate sensitivity, were used for the historical runs to capture the sensitivity range of the CMIP5 ensemble given the computational limitations related to downscaling a larger ensemble of simulations [38]. The AV sensitivity analysis is carried out using the 25 km resolution satellite-based product of the Climate Hazard Group InfraRed Precipitation with Station data version 2 (CHIRPS-2.0) [39] to represent fine-scale observations and its upscaled version at 250 km resolution to represent large-scale observation. The 250 km resolution used for the upscaling process is obtained from the Global Precipitation Climatology Project monthly data version 2.3(GPCPv2.3) [40,41], which is widely used for large-scale climate analysis. Although not directly presented in the results, GPCPv2.3 is used as a supplement to show potential uncertainty implications that may prevail at low resolutions in the context of resolution-sensitive AV studies. Further details about the different datasets used are provided in Table 1.
Both the climate simulations and observations datasets are acquired from 1981 to 2005. The driving GCMs datasets and the RegCM4-7 outputs are first interpolated at CHIRPS’ 25 km grid resolution for high-resolution analysis and then upscaled to 250 km resolution to match CHIRPS’ upscaled grids for large-scale analysis. The analysis focuses on the seasonal mean bias pattern of the GCM-driven RegCM4-7 precipitation outputs and their consistency with observations and structural biases from ERA-INT driven simulations, considering both high resolution (25 km) and coarse resolution (250 km). The analysis is carried out for the December–January–February (DJF), the March–April–May (MAM), the June–July–August (JJA), and the September–October–November (SON) seasons. The potential improvement of the RegCM4-7 outputs as compared to the driving GCMs at higher and coarser resolution is also analyzed, using the AV metric proposed by Dosio et al., [17], for which the formula is given as follows:
A V = ( X G C M X O B S ) 2 ( X R C M X O B S ) 2 M a x ( ( X G C M X O B S ) 2 , ( X R C M X O B S ) 2 )
where X G C M , X R C M , X O B S represent, respectively, the GCM, the RCM and the observation’s statistics for which the AV is evaluated. The AV values vary between −1 and 1 to capture possible improvement or degradation of the RCM over the GCM.
The seasonal precipitation bias patterns of the GCMs and RegCM4-7 outputs and the subsequent AV outcomes are aggregated using the different climate zones over Africa (see Figure 1). Specifically, the Added Value Coverage (AVC), representing the percentage of grid cells showing a positive, negative, or non-significant AV is computed for each climate zone. The AVC provides a general figure of the improvement by the RegCM4-7 RCM, and allows adequate comparison among different zones, seasons and resolutions. The AVC formula is given as follows:
A V C p o s / n e g / n s = N p o s / n e g / n s N t o t × 100
where A V C p o s / n e g / n s represents the positive, negative, or non-significant AV coverage, N p o s / n e g / n s , the number of pixels with a positive, negative, or non-significant AV and N t o t , the total number of pixels over the region considered.
Following previous use of the AVC [20,21], we use a threshold of 0.1 for significant positive AV and −0.1 for significant negative AV. This means that any pixel with an AV > 0.1 is considered a pixel with significant positive AV, and any pixel with an AV < −0.1 is considered a pixel with significant negative AV. Any pixel with an AV between −0.1 and 0.1 is considered non-significant.

3. Results

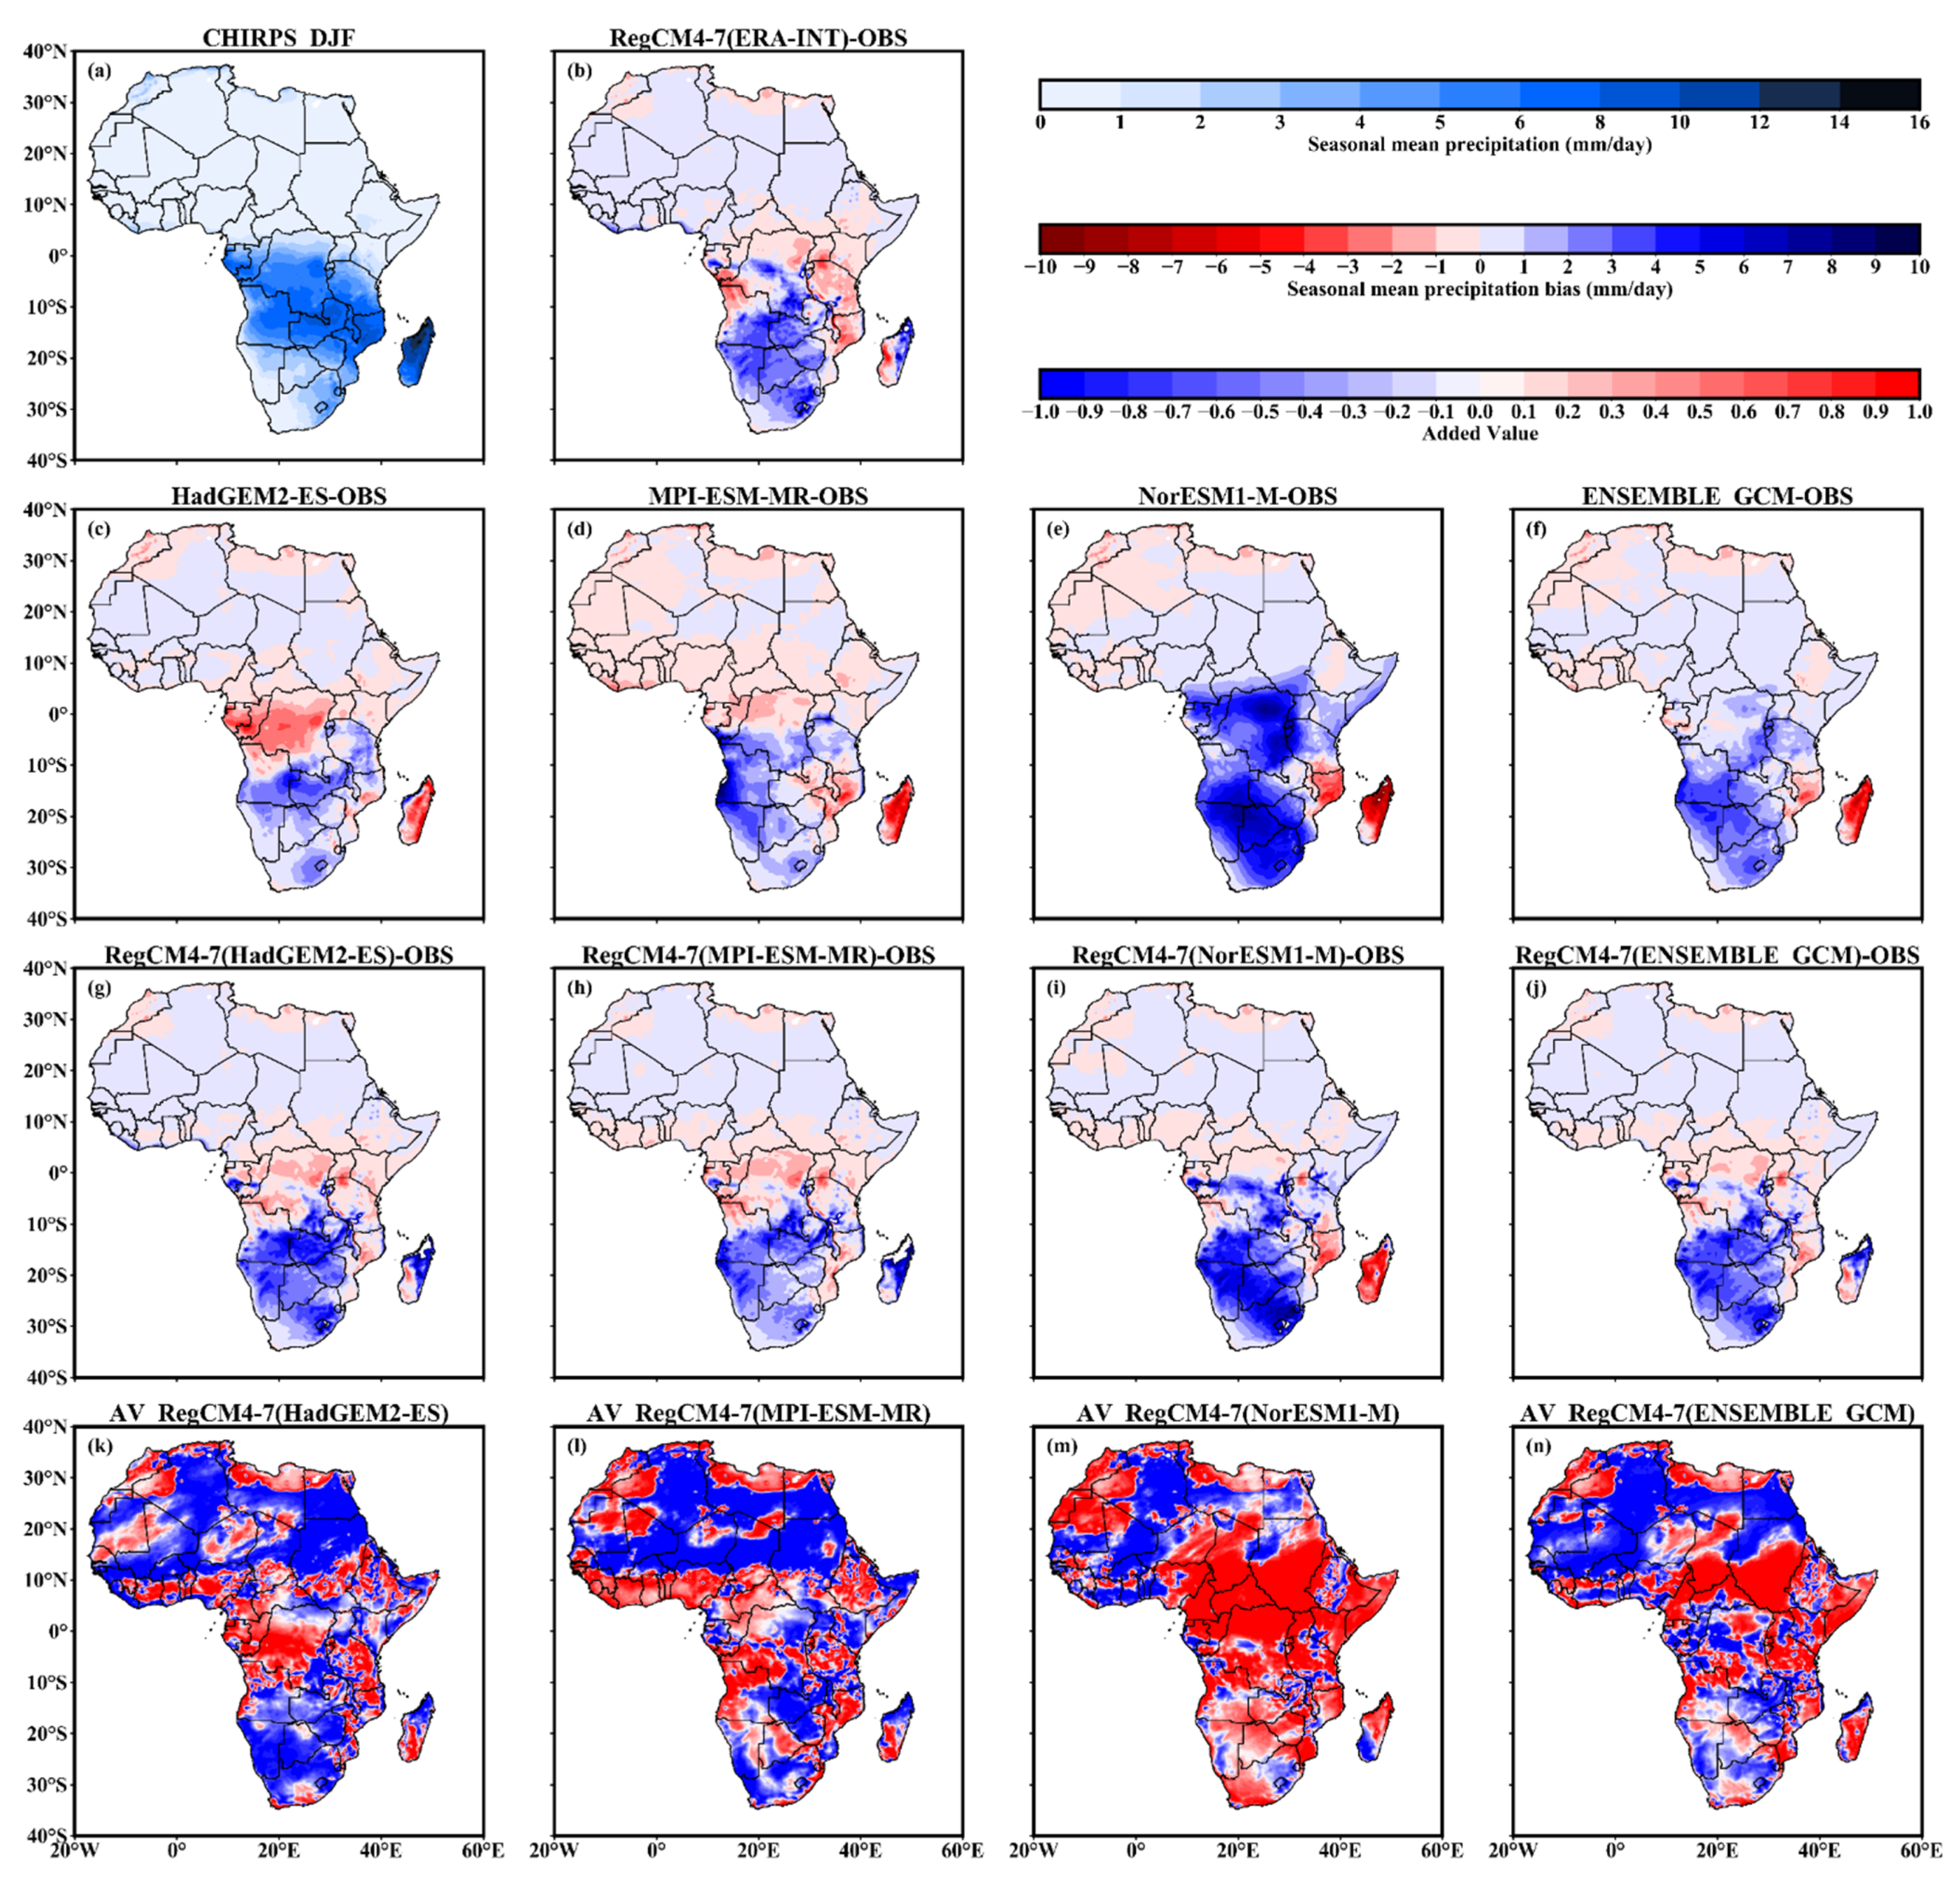
3.1. Evaluation Results for DJF Season

Figure 2 and Figure S1 depict the DJF season’s mean bias results by the driving GCMs and their RegCM4-7 dynamically downscaled outputs at a high resolution (25 km) and coarse resolution (250 km), using CHIRPS observations. Rain-abundant areas such as the southern CAF, SEAF, northern WSAF, and ESAF show similar patterns at high and coarse resolutions (Figure 2a and Figure S1a). The driving GCMs (Figure 2c–f and Figure S1c–f) tend to show wet biases of 1 to 10 mm/day over WSAF, ESAF, and parts of CAF with pronounced quantities of more than 6 mm/day in NorESM1-M (Figure 2d and Figure S1d). Over northern CAF and NEAF, a dominance of dry biases ranging from 0 to −4 mm/day is observed with HadGEM2-ES (Figure 2c and Figure S1c) and MPI-ESM-MR (Figure 2d and Figure S1d), while wet biases of 0 to 8 mm/day are depicted by NorESM1-M (Figure 2d and Figure S1d).
In accordance with RegCM4-7 evaluation runs by ERA-INT (Figure 2b and Figure 3b), the dynamically downscaled outputs (Figure 2g–j and Figure S1g–j) show persisting wet biases of about 1 to 8 mm/day, both at high and coarse resolution over Southern Africa (SAF), resulting in degraded AV for most simulations such as HadGEM2-ES (Figure 2k and Figure S1k) and MPI-ESM-MR (Figure 2l and Figure S1l) driven RegCM4-7 outputs. The presence of generally wet biases in the dynamically downscaled outputs compared to mainly dry biases in the driving GCMs is confirmed by the spatially averaged bias results reported in Table 2.
Over CAF, SEAF, and NEAF, reduced intensity of the dry biases by HadGEM2-ES and MPI-ESM-MR is observed in the downscaled outputs, with a sign shift from wet biases to slightly dry biases in NorESM1-M downscaled output. Consequently, a positive AV is observed for all simulations and their ensemble mean (Figure 2k–n and Figure S1k–n) over CAF. The positive AV is extended to other dry areas such as WAF, NEAF and SAH. The relatively similar AV patterns at high and low resolutions are further confirmed by the AVC results (see Table 3), which report an increase/decrease of roughly 8%. Other differences are also observed in the error amplitude, which tends to show a systematic reduction from high- to low-resolution (see Table 2).

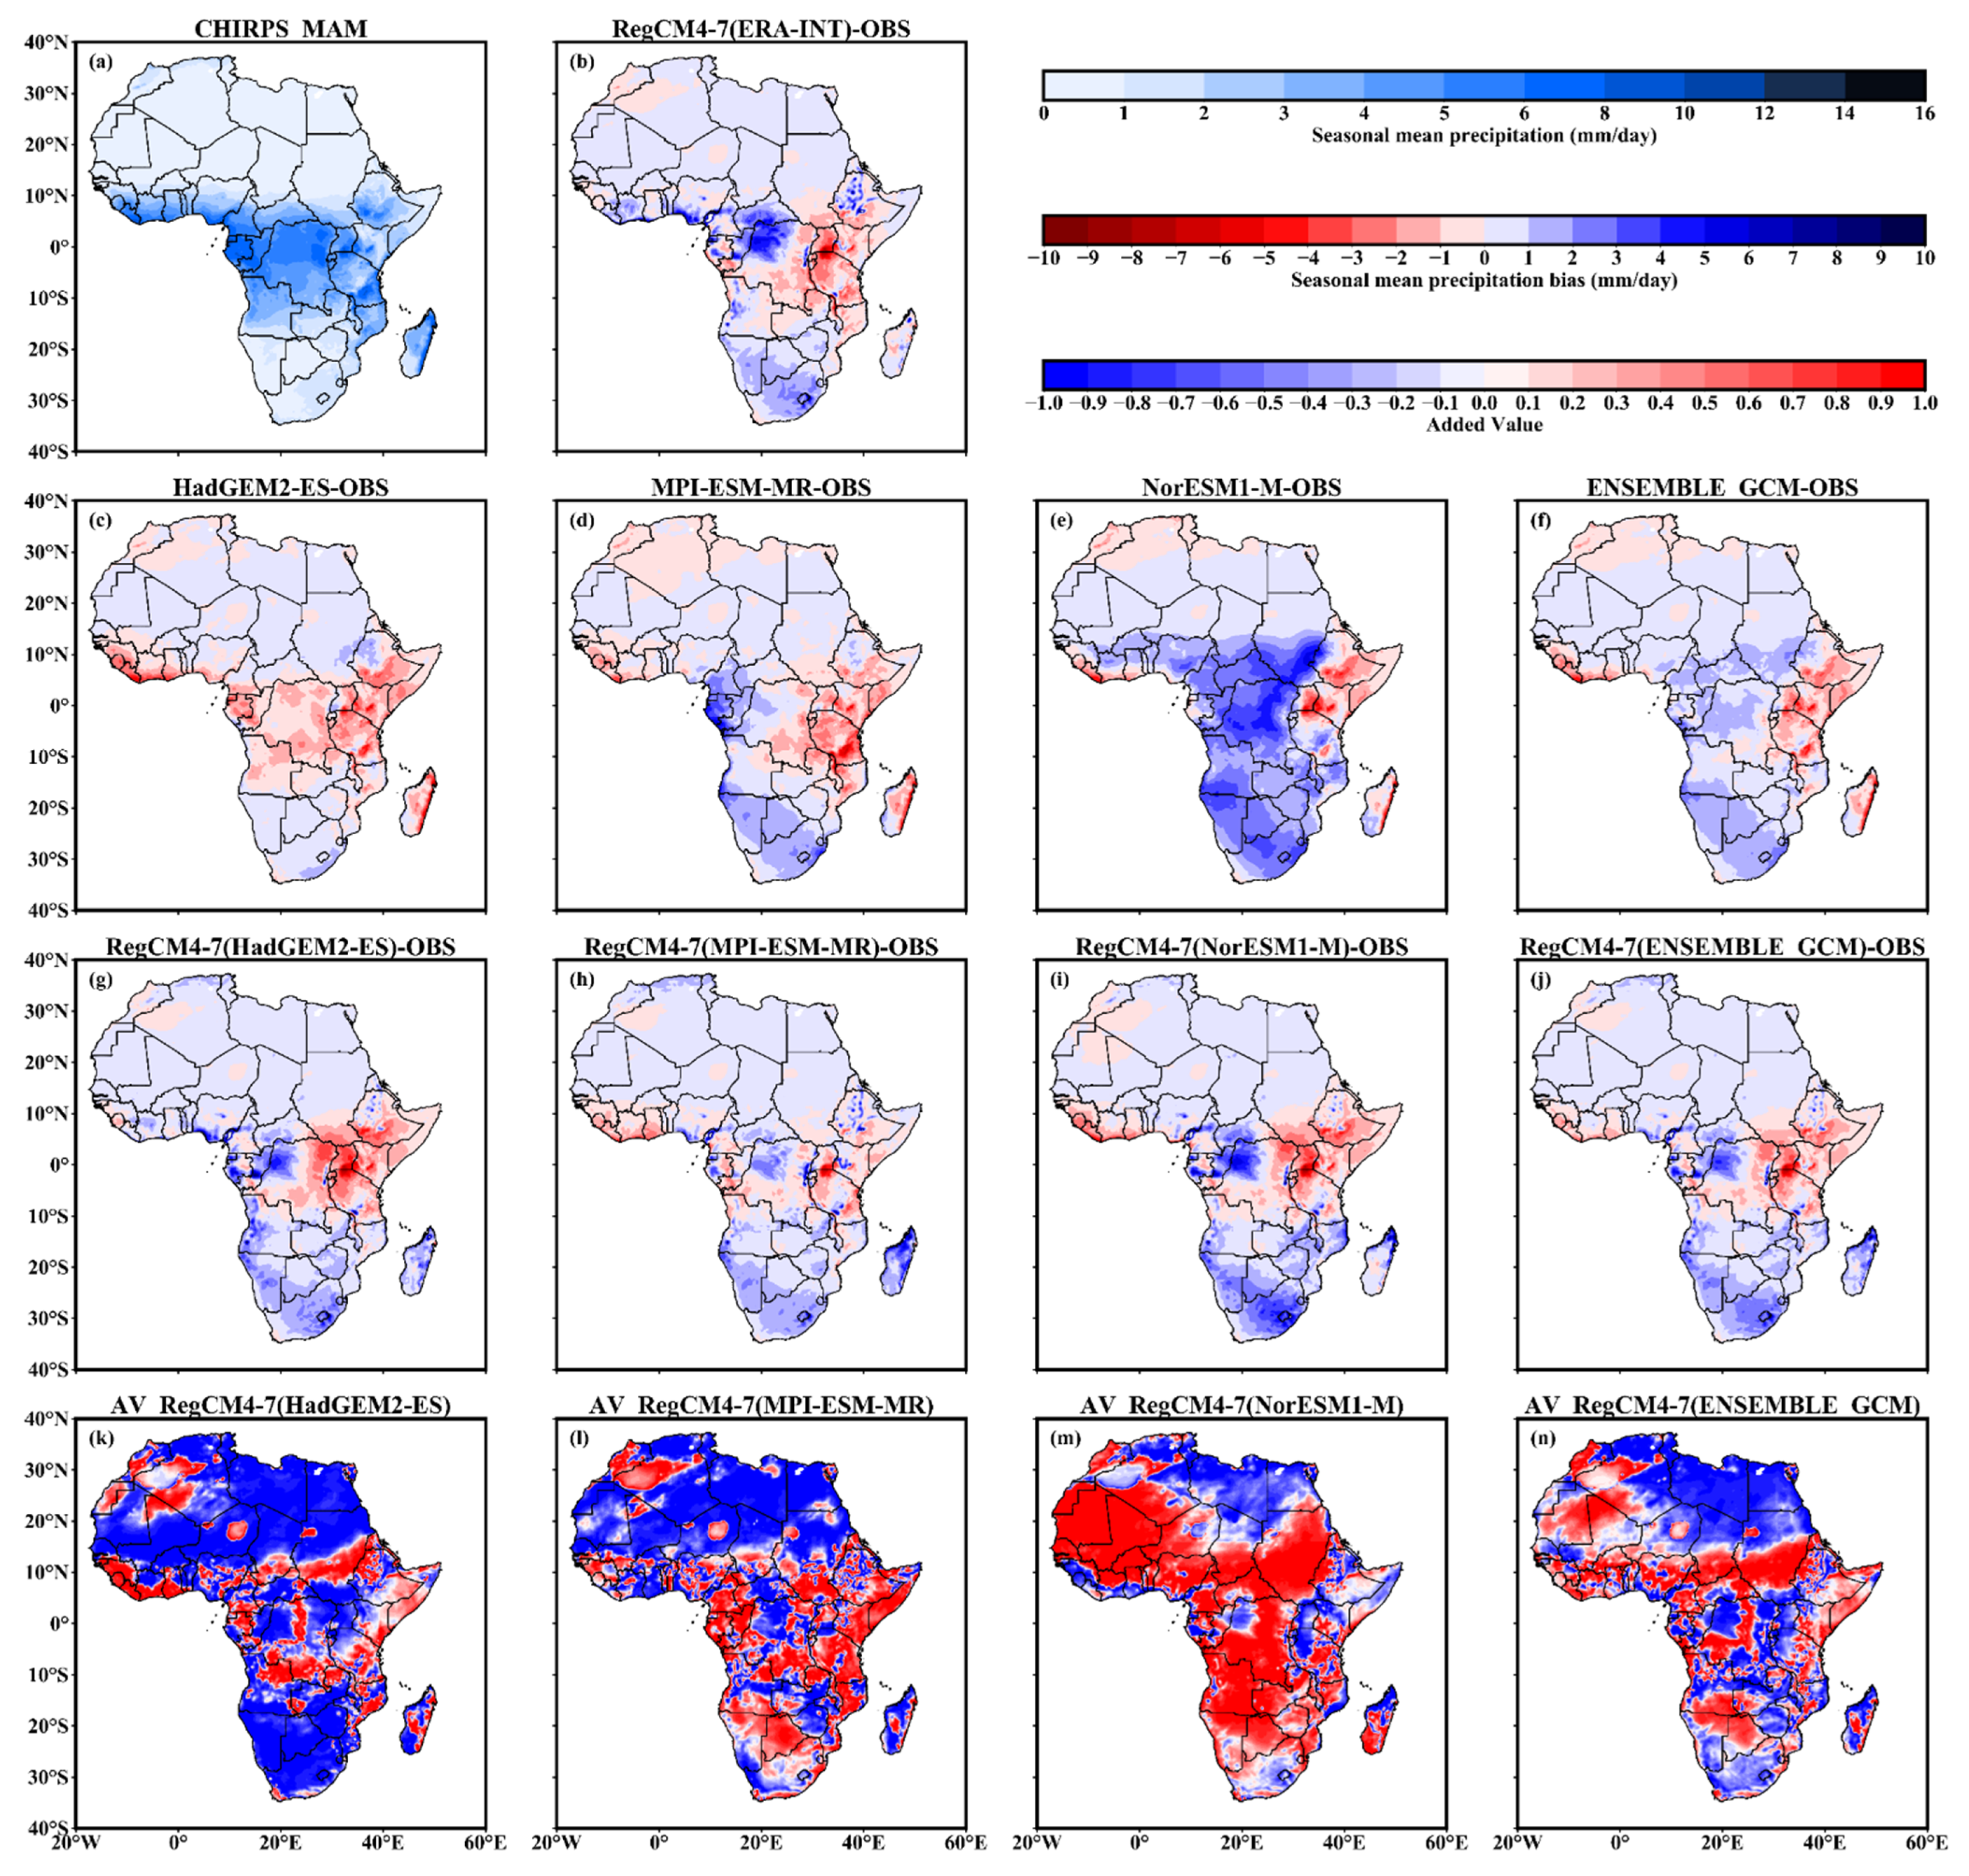
3.2. Evaluation Results for MAM Season

In the MAM season, the performances of the RegCM4-7 outputs and their boundary forcing at downscaled and upscaled resolutions are shown in Figure 3 and Figure S2. At high and low resolution, CHIRPS (Figure 3a and Figure S2a) show similar rain belt expansion patterns over both WAF and NEAF in addition to rain-abundant areas such as CAF.
An underestimation of rainfall quantities of 0 to −4 mm/day is mostly found over NEAF and SEAF in all the driving GCMs (Figure 3c–f and Figure S2c–f) and their dynamically downscaled outputs (Figure 3g–j and Figure S2g–j). These biases tend to be identical except for MPI-ESM-MR (Figure 3h and Figure S2h) driven RegCM4-7 output, which shows a reduction and a subsequent positive AV (Figure 3m and Figure S2m). Although the biases in the driving GCMs (Figure 3c–f and Figure S2c–f) over WAF and CAF show unique patterns based on the model used, their dynamically downscaled simulations (Figure 3g–j and Figure S2g–j) share unique features that are highly similar to the evaluation runs driven by ERA-INT (Figure 3b and Figure S2b).
An intensification of HadGEM2-ES’s (Figure 3c and Figure S2c) slightly wet biases (0–1 mm/day) in its downscaled output (Figure 3g and Figure S2g) is observed over SAF, leading to negative AV (Figure 3k and Figure S2k). A general dominance of dry biases for the driving GCMs and slightly wet biases for RegCM4-7 outputs are observed as reported in Table 2, which is similar to the DJF season results. The positive AVC results in Table 3 show an increase from high- to low-resolution results for MPI-ESM-MR, NorESM1-M and the ensemble mean downscaled outputs. At the same time, the HadGEM2-ES-based RegCM4-7 simulations report a decrease. Compared to the DJF season results, the results during MAM season are still within the 8% increase/decrease range, except for the downscaled NorESM1-M results, which show an increase of nearly 15%. The systematic reduction in the averaged error from high to low resolution remains the same as in DJF, even if the error amplitudes are lower (see Table 2).

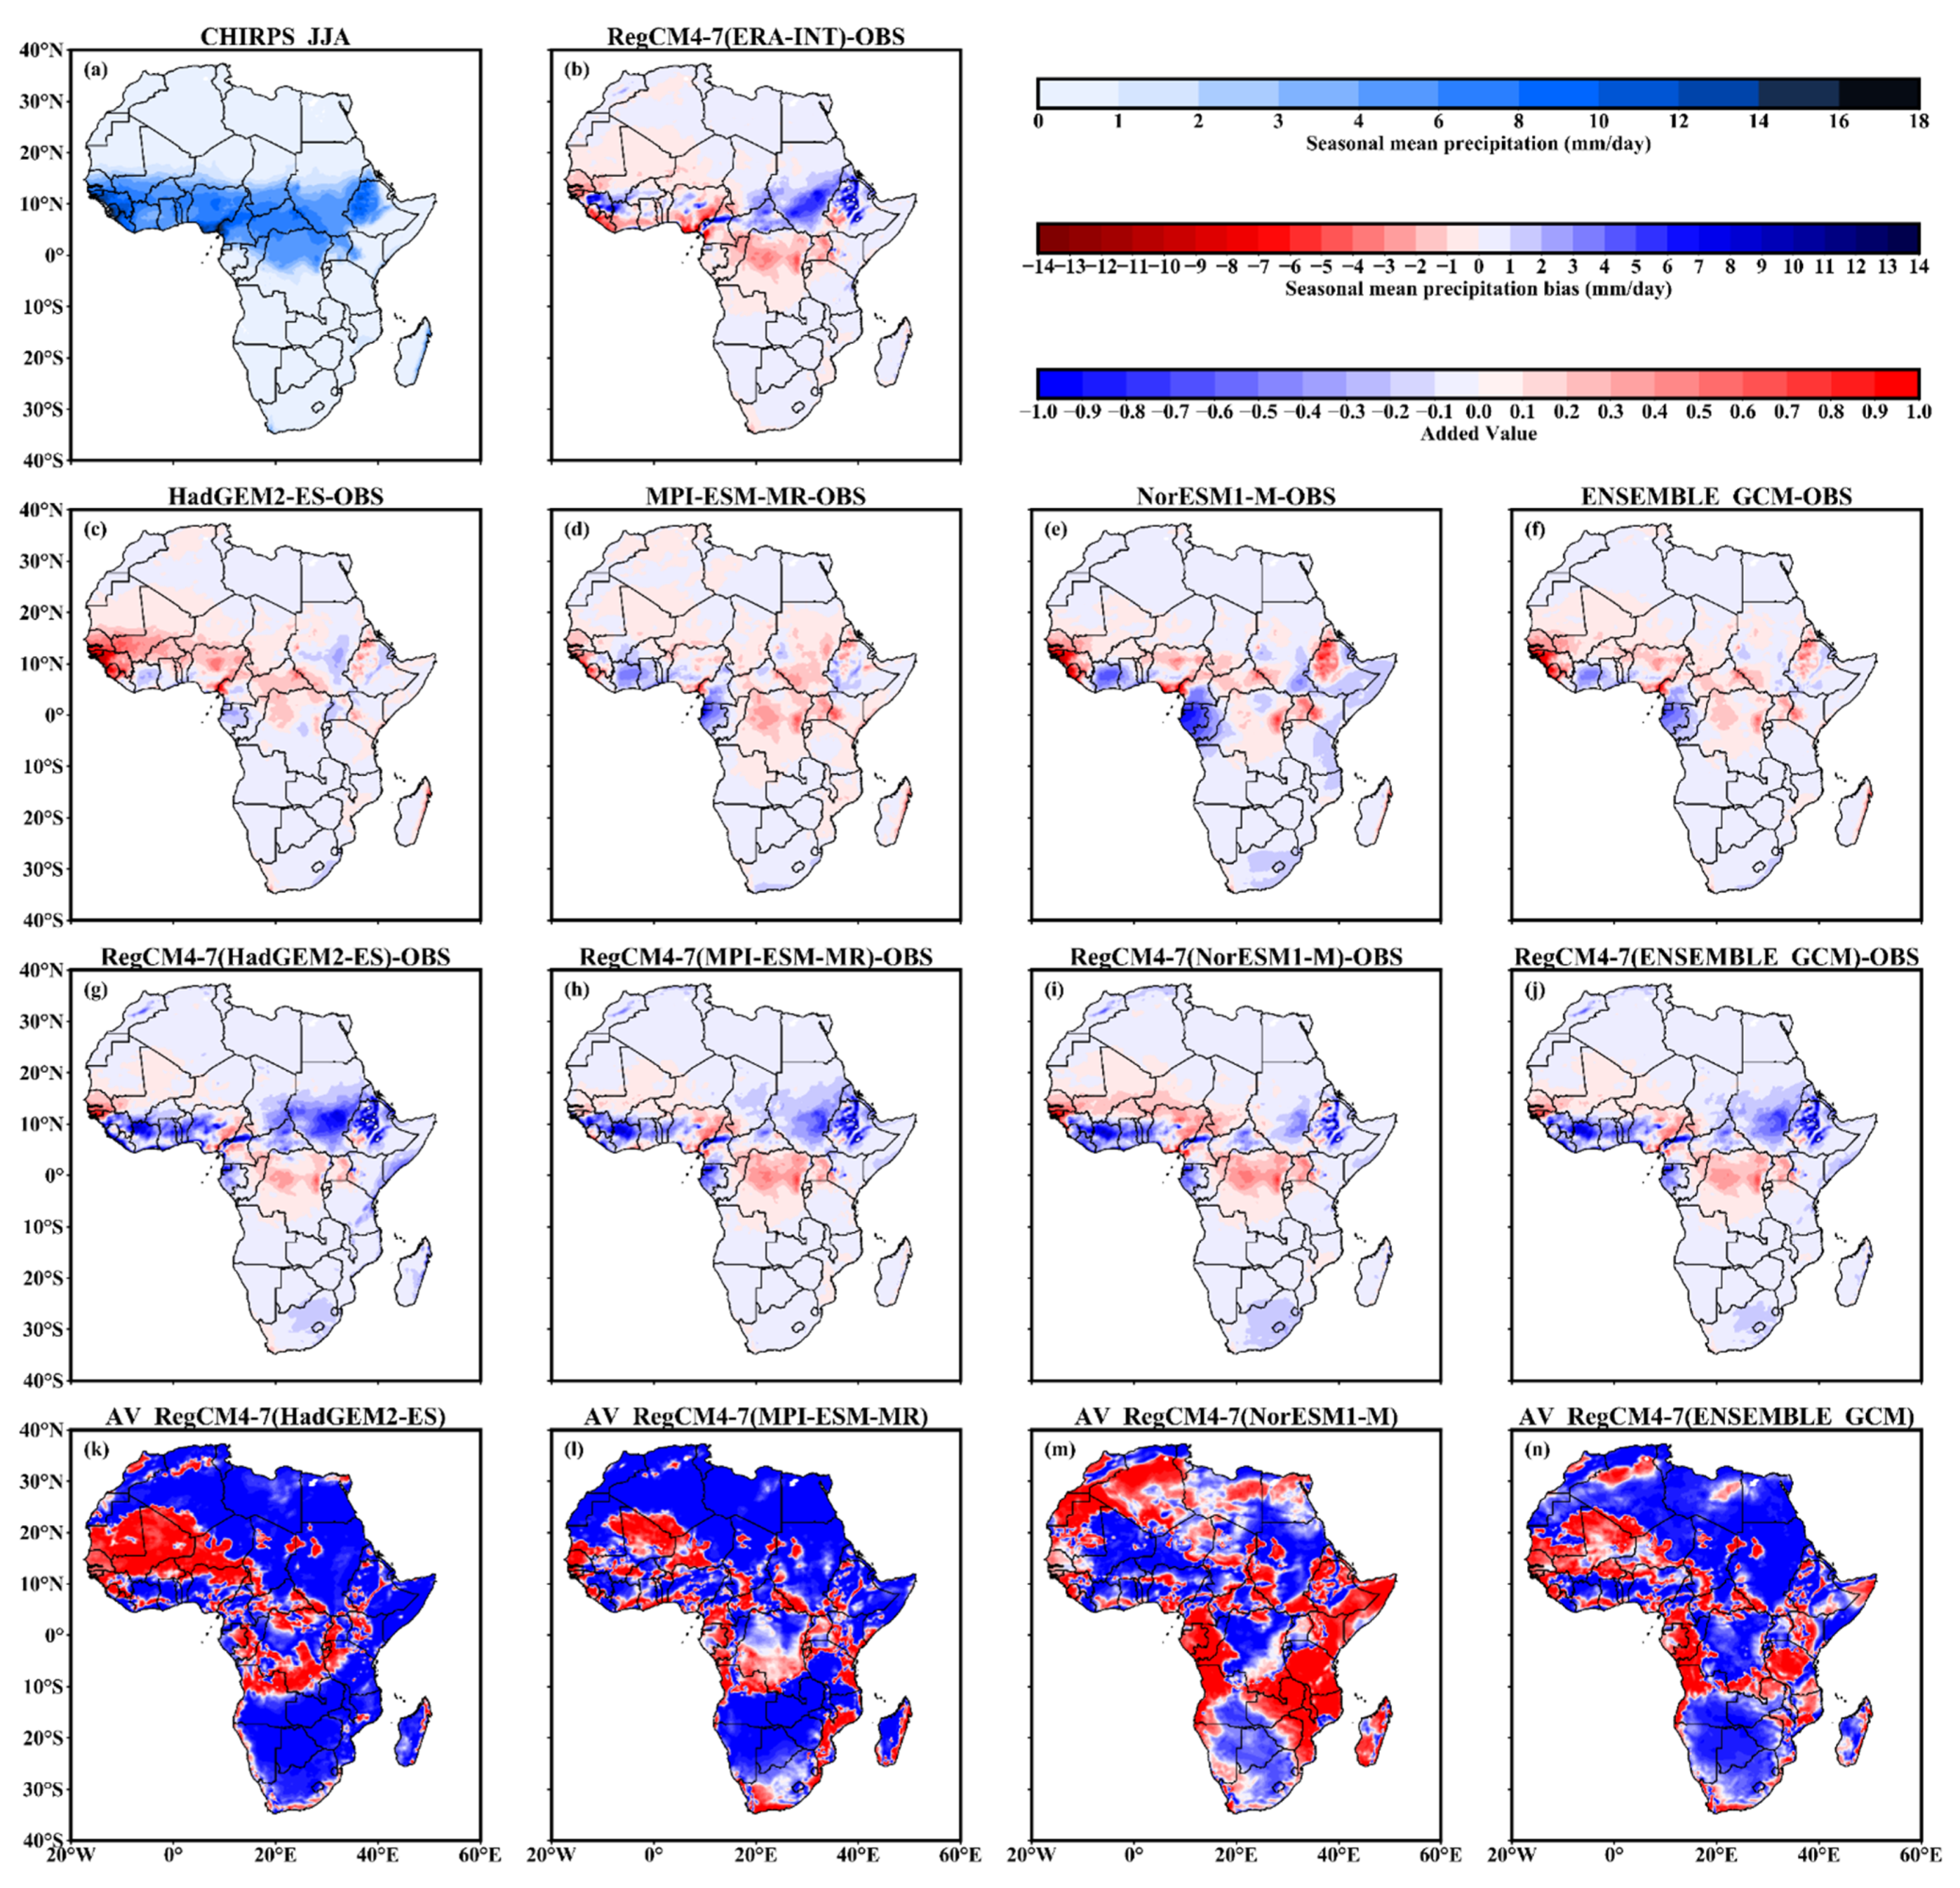
3.3. Evaluation Results for JJA Season

In the JJA season, the mean biases of RegCM4-7 simulations and their driving GCMs at high and low resolutions are summarized in Figure 4 and Figure S3. The results show dry and wet bias signals in all the climate simulations along the rain belt depicted over WAF, northern CAF and NEAF by CHIRPS (Figure 4a and Figure S3a) at both resolutions. Dry biases of about 0–4 mm/day are observed over CAF and southern SAH, and wet biases of about 1–8 mm/day are observed along the remaining part of the rain belt over NEAF, SEAF and ESAF, in both the driving GCMs (Figure 4c–f and Figure S3c–f) and the RegCM4-7 downscaled simulations (Figure 4g–j and Figure S3g–j).
The spatially averaged bias results (Table 2) show a systematic reduction in the RegCM4-7 averaged bias, regardless of the driving GCM, with the ensemble mean reporting improvement over some parts of CAF for all the GCM-based downscaled outputs (Figure 4g–j and Figure S3g–j), compared to individual simulations. A positive AV is observed over parts of WAF for RegCM4-7 simulations driven by HadGEM2-ES and MPI-ESM-MR, while NorESM1-M-driven RegCM4-7 simulation depicts a positive AV over SAH, NEAF, SEAF and parts of ESAF and WSAF.
At a high resolution, RegCM4-7 reports a positive AVC of 33.94% for the simulation driven by HadGEM2-ES, 47.33% for the simulation driven by MPI-ESM-MR and 59.98% for NorESM1-M-driven simulation. The change from high to low resolution ranges between roughly 12 and 20% for all RegCM4-7 simulations, except the one driven by NorESM1-M, which decreases by 0.89% (Table 3). The error amplitude reduction from high to low resolution is also observed in the JJA season, as shown in Table 2.

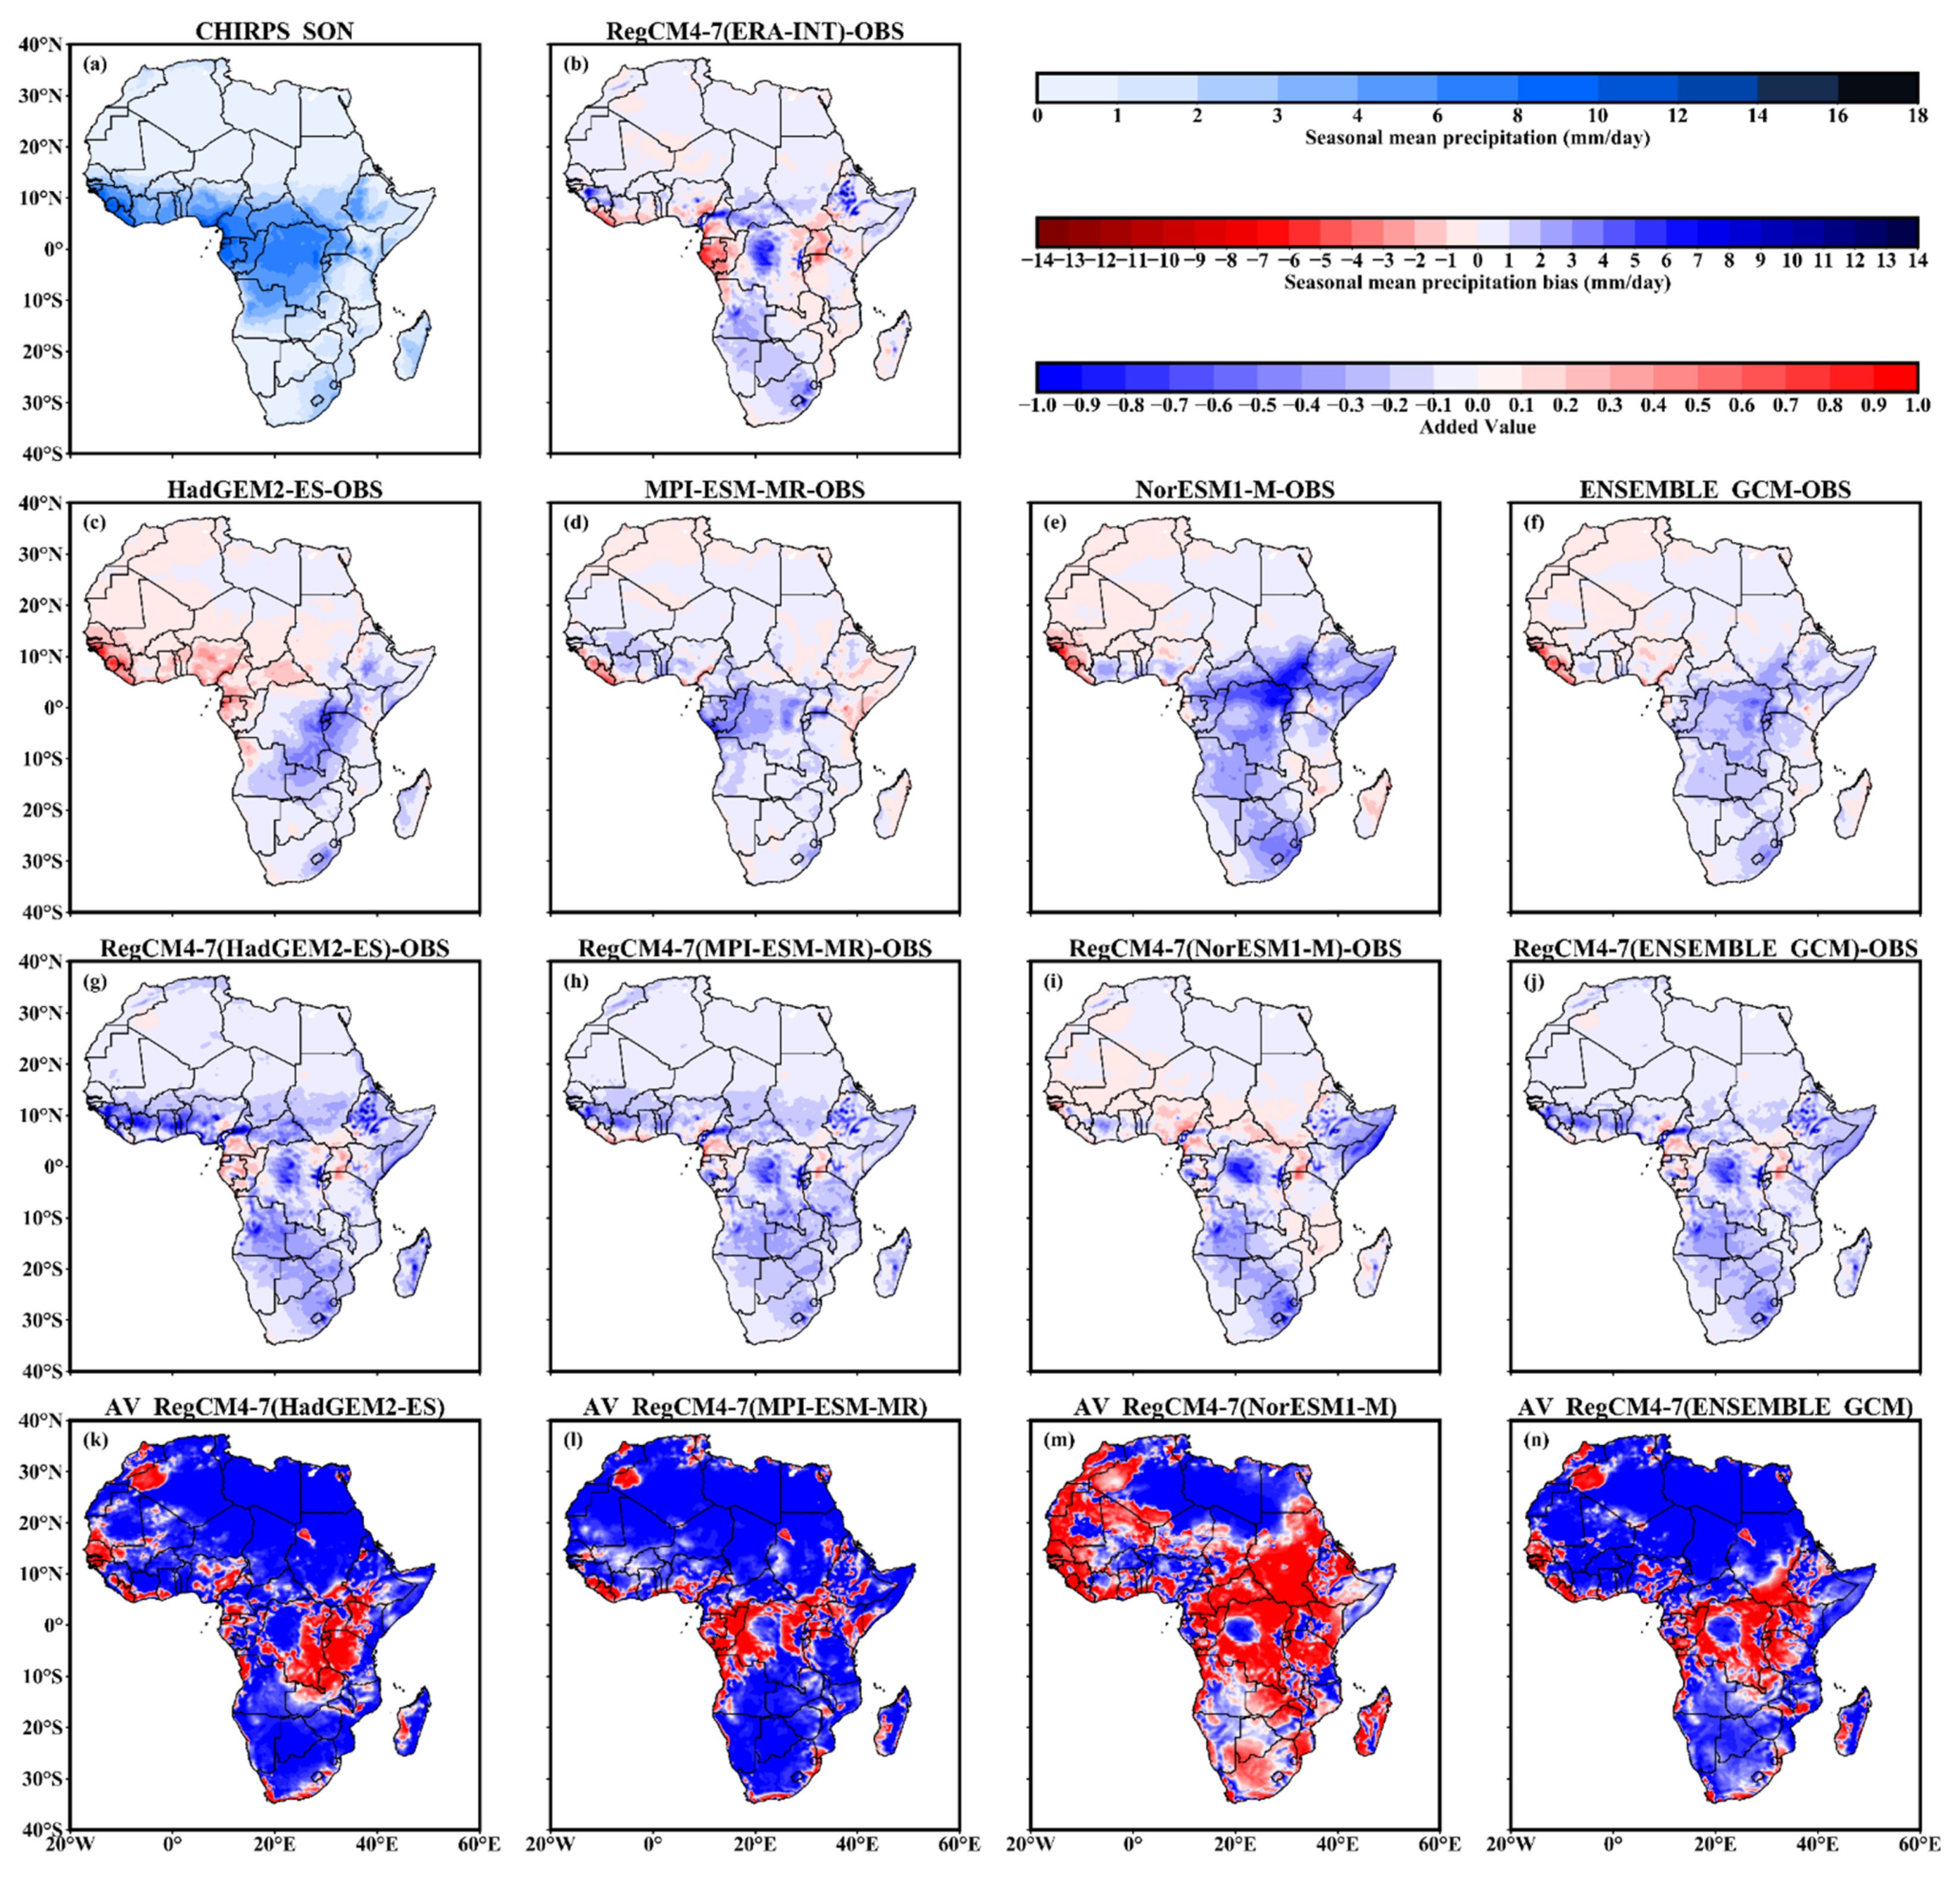
3.4. Evaluation Results for SON Season

The evaluation and historical runs of RegCM4-7 and their driving GCMs results for SON season over Africa at high and low resolution are given in Figure 5 and Figure S4. High resolution and upscaled CHIRPS observations (Figure 5a and Figure S4a) show a retreat of the monsoonal belt toward coastal WAF and CAF with lightweight rain quantities over NEAF.
The driving GCMs (Figure 5c–f and Figure S4c–f) exhibit wet biases ranging from 1 to 8 mm/day, mostly over CAF, with an extension to NEAF, SEAF and SAF in NorESM1-M results. Dry biases of −4 to 0 mm/day are observed, especially over WAF in the HadGEM2-ES results. The historical runs of RegCM4-7 (Figure 5g–j and Figure S4g–j) depict wet biases, which tend to represent substantial reduction compared to the driving GCM results (Figure 5c–f and Figure S4c–f) over parts of CAF and some parts of NEAF and SEAF. However, the downscaled simulations also show a second type of wet biases over most parts of WAF, ESAF and WSAF, particularly in the HadGEM2-ES- and MPI-ESM-MR-driven RegCM4-7 results, which tend to degrade the driving GCMs’ results.
The spatially averaged bias results from Table 2 show a dominance of wet and relatively high biases in the RegCM4-7 simulations compared to dry and relatively low biases for the driving GCMs, when HadGEM2-ES and MPI-ESM-MR are considered. For NorESM1-M-based results, a systematic reduction in the driving GCM dry biases in the downscaled outputs is observed. These findings are reflected in the AV results (Figure 5k–n and Figure S4k–n), with positive AV pixels observed mostly over CAF and SEAF for all RegCM4-7 simulations and their ensemble mean, and a higher positive AVC for NorESM1-M at both high and low resolution. The positive AVC of the simulations (see Table 3) indicates an increasing tendency from high- to low-resolution results of, at most, 11%, except MPI-ESM-MR, which demonstrates a dynamically downscaled output with a 22.71% positive AVC at high resolution and a 22.53% positive AVC at low resolution. Similar to the previous seasons’ results, the SON season spatially averaged results (see Table 2) indicate a decrease in the error amplitude from high to low resolution.

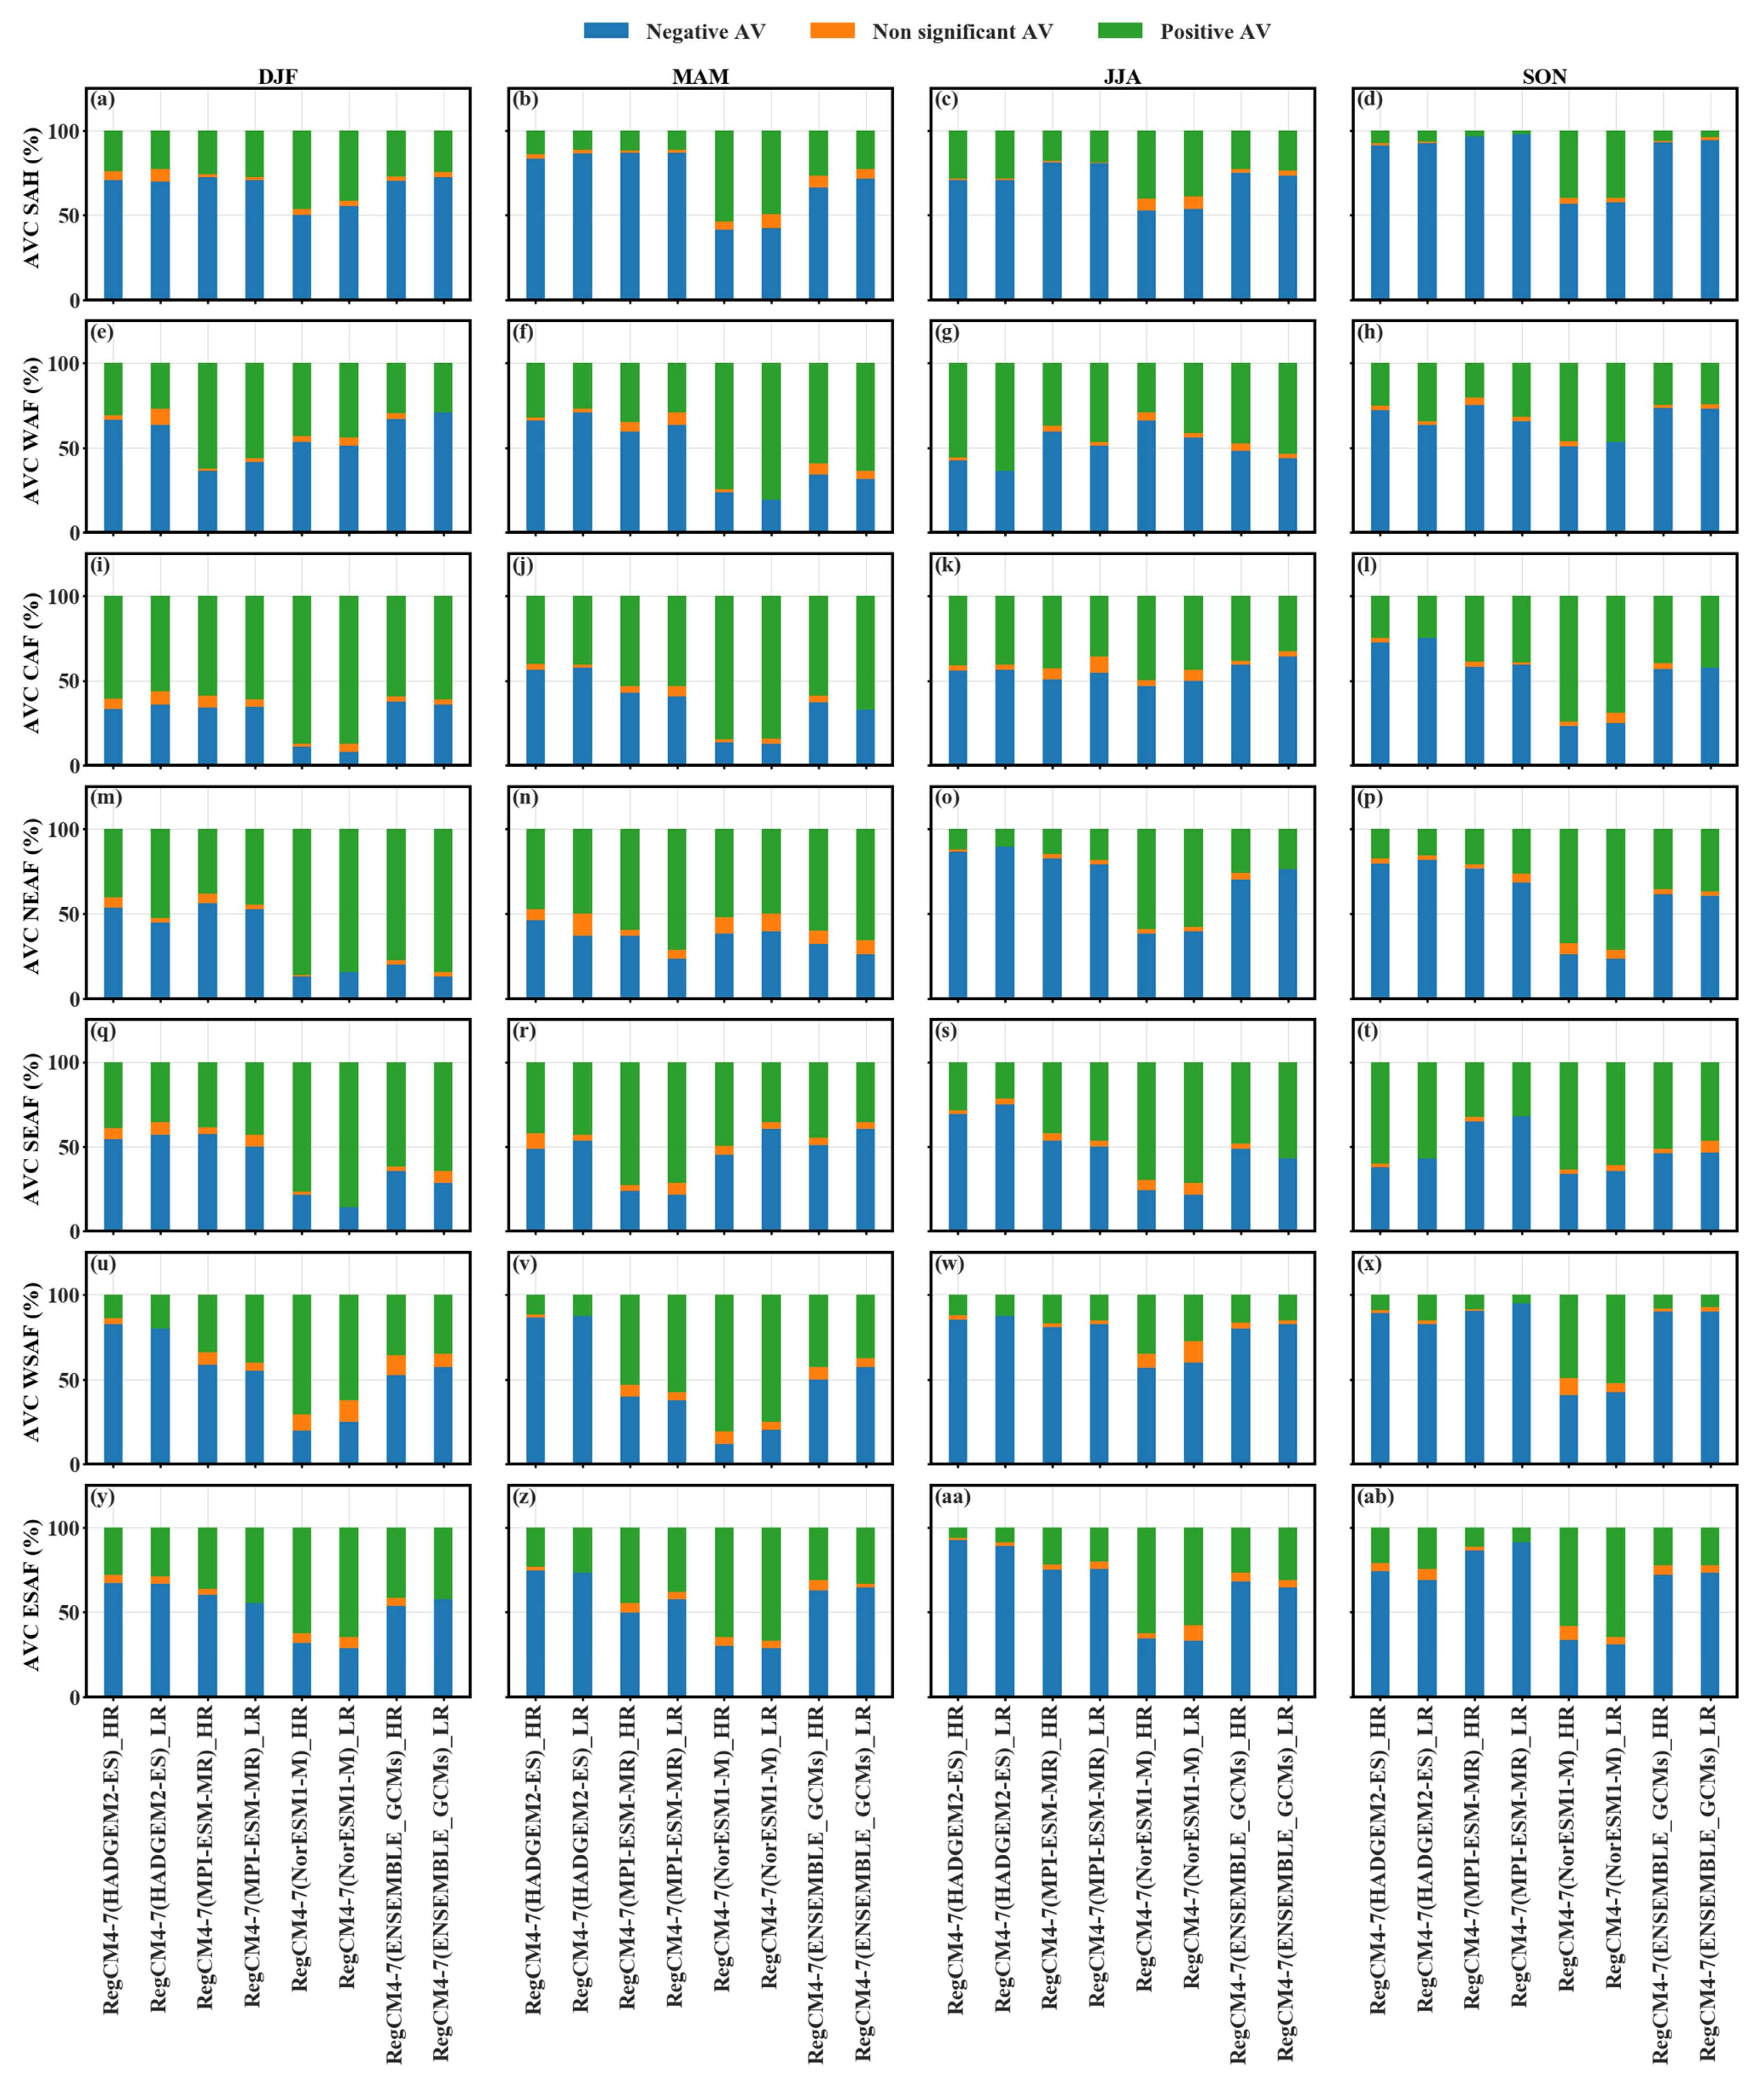
3.5. Unified Season, Sub-Area and Resolution-Based Results

The seasonal performances of the RegCM4-7 historical runs over continental Africa indicate a clear similarity pattern between the results at low and high resolution, even if a wide range of differences in terms of AVC and error amplitude are reported in Table 2 and Table 3. Due to the heterogeneous nature of the results over continental Africa, climate zones and seasons-based partition of the overall AVC findings are further presented in Figure 6. Overall, the AVC results show various outcomes based on the season, sub-area, and driving GCM. NorESM1-M-dynamically downscaled RegCM4-7 output tends to show the highest positive AVC for all sub-regions and seasons, with few exceptions such as WAF in DJF (Figure 6e) and JJA (Figure 6g), and NEAF in MAM (Figure 6n).
The positive AVC changes from high to low resolution are mostly in line with the overall seasonal results from Table 3. CAF (Figure 6i–l), NEAF (Figure 6m–p) and SEAF (Figure 6q–t) represent areas with the most consistent positive AVC (mostly >50%), regardless of the driving GCMs, especially in DJF and MAM seasons. RegCM4-7 ensemble mean provides an acceptable performance tradeoff but can be less satisfactory in terms of positive AVC in some specific regions and seasons. Typical examples are the SAH and WSAF regions in SON season (Figure 6d,x), where the positive AVC is less than 10%. In general, sub-regions such as WAF (Figure 6e–h), CAF (Figure 6i–l), and SEAF (Figure 6q–t) show a positive AVC greater than 20%, regardless of the season and driving GCMs.

4. Discussion

The potential applicability of climate models in different climate studies is highly constrained by model resolution. Beyond the ability of RCMs to integrate fine-scale features, their relatively high resolution compared to GCMs often influences data user preferences [7,9]. The expectation of an AV by RCMs at high resolution owing to their fundamental design choices constitutes another incentive for RCM data use. AV issues have been central to the past few decades of research and development of RCMs [4,5]. Still, their discussions were tailored using the one-way paradigm, where the information flow from the driving GCMs to the RCM is prioritized.
Although sufficient to prove the presence of improvement in a statistical sense, this perspective of the AV gives fewer insights into the attribution of such improvements [7]. Moreover, GCMs are still useful for large-scale studies, but using RCMs as alternatives is still an active research question, especially for data-scarce parts of the world such as Africa. The methodological choices of the present study were mainly motivated by these mentioned issues and the need to provide valuable information towards a better understanding of the resolution-sensitivity of AV by RCMs over Africa, and their potential to bridge resolution and quality gaps between the GCMs and the high-resolution satellite-based products.
The results mainly indicate AV by RegCM4-7 simulations at their native resolution, with a typical dependence on the driving GCM, the season, and the sub-area. Similar results have been highlighted by Gnitou et al., [21] in the context of other CORDEX-CORE precipitation simulations. Moreover, other challenges related to CORDEX-CORE precipitation simulations over Africa, such as the persistence of dry and wet biases at noticeably high amplitudes along the seasonal rain belt, were also found in the RegCM4-7 results. The historical run biases have shown clear consistency with the evaluation run driven by ERA-INT, thus suggesting that the RCM internal model physics might have more influence than the driving GCMs, particularly along the seasonal rain belt. Reasons for such deficiencies may be similar to previously known ones, including missing or misrepresented processes and regional model transferability issues [42,43].
Although the influence of RegCM4-7 internal model physics appears to be consistent with the dynamically downscaled outputs, typical dependencies to the driving GCMs are found in terms of AV. For instance, the NorESM1-M dynamically downscaled output shows significantly higher positive AVC coverage as compared to other driving GCMs. These performances may be due to the high, medium and low equilibrium climate sensitivity criteria under which the driving GCMs were chosen [16,38]. The typically low equilibrium climate sensitivity nature of the NorESM1-M driving GCM may explain the higher positive AVC performances. Since the low sensitivity relates to relatively low performances and high error, the downscaled NorESM1-M results reinforce early conclusions by Diaconescu and Laprise [28] on the fact that RCMs can bring substantial error reduction when the driving lateral boundary condition contains errors.
Beyond considerations related to the AV by regional climate models seen from a one-way perspective, adopting a second type of AV based on upscaled results from high resolution yielded supplementary results and insights. At low resolution, a typical increase in the positive AVC is observed with some exceptions. These exceptions are related to cases with a decrease in the positive AVC from high to low resolution. In the worst case, however, these exceptions represent a reduction of 8% and therefore indicate that RegCM4-7 simulations could be used for large-scale precipitation applications over Africa when sufficient AV is observed or considered enough for the intended application. These results make the RCMs influential contribution hypothesis to the AV more plausible than the idea of an AV due to a mere disaggregation of the driving GCMs. Previous findings by Gnitou et al. [21] and Sørland et al. [8] led to similar conclusions.
The resolution-sensitivity results also revealed that the improvement of the positive AVC from high to low resolution occurs in a climate zone where consistent and uniformly distributed spatial positive AV patterns are observed at high resolution. This general tendency is also true for areas with large negative AVC. Therefore, the AV at fine scale probably represents a precondition to the expectation of improved large-scale features by RCM outputs. In the context of climate change projection over Africa, some studies [19,44] documented such major differences between GCMs and RCMs known under the concept of potential or conjectural AV [6,7] since observations are not available to confirm it. The findings from the present study bring more arguments to the possibility that at least part of such GCM-RCM differences is due to salient positive AV of the RCMs that could not, however, be measured in the context of future projections.
The influential impact of the RCMs internal physics as compared to the driving GCMs is further confirmed by the regional results, which feature the WAF, CAF and SEAF for all seasons, and NEAF for DJF and MAM seasons, as the best performing sub-region with a positive AVC greater than 20%. For instance, the WAF and CAF sub-regions are known for mesoscale activities and land-atmosphere interactions, and the SEAF and NEAF for their topographic influence on rainfall quantities [19]. The significant positive AVC over these sub-areas represents additional evidence for the hypothesis that the observed AV originates from mesoscale and fine-scale features resolved by RCMs [2,4].
Despite the encouraging results obtained at low resolution and their dependence on the AV at high resolution considering CHIRPS data, cautionary considerations of the present study results are still needed regarding observational uncertainties. Although the availability of CHIRPS data produced at a resolution similar to CORDEX-CORE simulations motivated the present resolution-sensitivity study, alternative datasets widely used at low resolutions may provide different estimates compared to CHIRPS upscaled results and therefore represent a source of uncertainty for AV results at such resolutions. For instance, as shown in Table S1, the AVC values at low resolution using GPCP data show some differences compared to upscaled CHIRPS estimates used in this study. The upscaling of CHIRPS at the GPCP grid for the present study is motivated by these reasons. This implies that more due diligence is needed from users in their data choices to avoid misuses, as suggested by Giorgi [1].
Overall, the AV results by the CORDEX-CORE RegCM4-7 precipitation simulations and their highly likely attribution to internal RCM physics opens a wide range of opportunities for both the climate modeling and the satellite remote sensing communities. For the former community, these results will be instrumental for improving RCMs simulations, and therefore, continuously bridging the resolution and quality gap between traditional climate models and high-resolution satellite-based precipitation products. For the latter, these results expand the remote sensing data applications spectrum, emphasizing on climate change applications and opening new avenues toward a process-based understanding of remotely sensed earth observations [30,31].

5. Conclusions

This study evaluates the AV by CORDEX-CORE RegCM4-7 seasonal precipitation simulations over Africa, using both high- and low-resolution satellite-based observations, with the aim of quantifying large- and fine-scale improvements by the downscaled outputs in comparison to their driving GCMs. The study yielded substantial results, which can be summarized as follows:
  • At high-resolution, pixels with at least 10% improvement by the CORDEX-CORE RegCM4-7 downscaling approach represent 20 to 60% of the overall African domain depending on the driving GCM and the season.
  • The results obtained at low resolution mostly show an increase in the improvement coverage, with at most 8% spatial coverage reduction for cases where a decrease is observed as compared to high-resolution findings.
  • A relatively high improvement coverage of NorESM1-M downscaled results is found for nearly all seasons and climate zones, with West Africa, Central Africa, and Southern East Africa showing the overall best performances for all seasons and driving GCMs.
  • The results appear to be mostly influenced by the RCMs internal physics, with a typical highlight over sub-regions where fine-scale features-driven AV is expected. A better or nearly similar AV pattern is also observed at low resolution, suggesting an enhancement of the driving GCMs by sub-grid processes resolved by the RCM physics.
  • Observational uncertainty is found to have a significant influence, as one should have expected, given observational data scarcity over Africa.
  • For the first attempt to produce RCM data at a resolution similar to common satellite-based products resolution, the AV results are relatively good. They feature the potential of dynamical downscaling tools in filling resolution and quality gaps between GCMs and remotely sensed technology-based datasets.
In comparison with the 60 years of research and development of earth observation satellites [31], it is fair to say that the present study’s results represent a remarkable achievement of the RCM community, which is only 30 years old [4,5]. For instance, the AV results from this study bring new pieces of evidence on the ability of dynamical downscaling to bridge the resolution and quality gap between coarse GCMs and high-resolution satellite-based precipitation products. For Africa, the opportunities ahead are enormous in the context of unifying multi-source precipitation estimates and undertaking process-based climate assessments and projections, especially for applications where high-resolution data is needed [24].
Overall, RegCM4-7 outputs will still need further processing, such as bias correction, by leveraging available historical high-resolution satellite-based products for more plausible future projection analysis due to the persistent biases observed in the present study [21,25], until new developments and improvements become available. This is true for alternative tools such as Empirical Statistical Downscaling (ESD) [45] and convection-permitting simulations [46], which constitute the next step toward further understanding regional climates. The second component of the CORDEX phase II framework, named Flagship Pilot Studies (FPSs), will provide a coordinated setting for testing these emerging tools [13]. Upcoming studies looking at Vulnerability, Impacts and Adaptation (VIA) assessments are to be expected in the near future to explore other CORDEX-CORE data applications.

Supplementary Materials

The following supporting information can be downloaded at: www.mdpi.com/article/10.3390/rs14092102/s1, Figure S1 Performance of African precipitation in DJF season at low resolution compared to (a) CHIRPS, for (b) RegCM4-7 evaluation run driven by ERA-INT, (c) driving GCM HadGEM2-ES, (d) driving GCM MPI-ESM-MR, (e) driving GCM NorESM1-M, (f) ensemble mean of the driving GCMs, (g) RegCM4-7 historical run driven by HadGEM2-ES, (h) RegCM4-7 historical run driven by MPI-ESM-MR, (i) RegCM4-7 historical run driven by NorESM1-M, (j) RegCM4-7 historical runs’ ensemble mean, (k) Added Value by RegCM4-7 to HadGEM2-ES, (l) Added Value by RegCM4-7 to MPI-ESM-MR, (m) Added Value by RegCM4-7 to NorESM1-M, (n) Added Value by RegCM4-7 to the ensemble mean of the driving GCMs. Figure S2 Performance of African precipitation in MAM season at low resolution compared to (a) CHIRPS, for (b) RegCM4-7 evaluation run driven by ERA-INT, (c) driving GCM HadGEM2-ES, (d) driving GCM MPI-ESM-MR, (e) driving GCM NorESM1-M, (f) ensemble mean of the driving GCMs, (g) RegCM4-7 historical run driven by HadGEM2-ES, (h) RegCM4-7 historical run driven by MPI-ESM-MR, (i) RegCM4-7 historical run driven by NorESM1-M, (j) RegCM4-7 historical runs’ ensemble mean, (k) Added Value by RegCM4-7 to HadGEM2-ES, (l) Added Value by RegCM4-7 to MPI-ESM-MR, (m) Added Value by RegCM4-7 to NorESM1-M, (n) Added Value by RegCM4-7 to ensemble mean of the driving GCMs. Figure S3 Performance of African precipitation in JJA season at low resolution compared to (a) CHIRPS, for (b) RegCM4-7 evaluation run driven by ERA-INT, (c) driving GCM HadGEM2-ES, (d) driving GCM MPI-ESM-MR, (e) driving GCM NorESM1-M, (f) ensemble mean of the driving GCMs, (g) RegCM4-7 historical run driven by HadGEM2-ES, (h) RegCM4-7 historical run driven by MPI-ESM-MR, (i) RegCM4-7 historical run driven by NorESM1-M, (j) RegCM4-7 historical runs’ ensemble mean, (k) Added Value by RegCM4-7 to HadGEM2-ES, (l) Added Value by RegCM4-7 to MPI-ESM-MR, (m) Added Value by RegCM4-7 to NorESM1-M, (n) Added Value by RegCM4-7 to ensemble mean of the driving GCMs. Figure S4 Performance of African precipitation in SON season at low resolution compared to (a) CHIRPS, for (b) RegCM4-7 evaluation run driven by ERA-INT, (c) driving GCM HadGEM2-ES, (d) driving GCM MPI-ESM-MR, (e) driving GCM NorESM1-M, (f) ensemble mean of the driving GCMs, (g) RegCM4-7 historical run driven by HadGEM2-ES, (h) RegCM4-7 historical run driven by MPI-ESM-MR, (i) RegCM4-7 historical run driven by NorESM1-M, (j) RegCM4-7 historical runs’ ensemble mean, (k) Added Value by RegCM4-7 to HadGEM2-ES, (l) Added Value by RegCM4-7 to MPI-ESM-MR, (m) Added Value by RegCM4-7 to NorESM1-M, (n) Added Value by RegCM4-7 to ensemble mean of the driving GCMs. Table S1 Added Value Coverage results of RegCM4-7 simulations over continental Africa at low resolution for CHIRPS data (LR_C) and GPCP data (LR_G).

Author Contributions

Conceptualization, G.T.G., Y.H. and G.T.; methodology, G.T.G., Y.H. and G.T.; software, G.T.G., K.T.C.L.K.S., Y.H. and G.T.; validation, Y.H. and G.T.; formal analysis, G.T.G. and K.T.C.L.K.S.; investigation, G.T.G. and Y.H.; resources, Y.H. and G.T.; data curation, G.T.G. and K.T.C.L.K.S.; writing—original draft preparation, G.T.G.; writing—review and editing, I.K.N., K.T.C.L.K.S. and Y.H; visualization, G.T.G., K.T.C.L.K.S. and I.K.N.; supervision, Y.H. and G.T.; project administration, Y.H. and G.T.; funding acquisition, Y.H. and G.T. All authors have read and agreed to the published version of the manuscript.

Funding

The National Natural Science Foundation of China, Grant Nos: U1902209 and the National Natural Science Foundation of Yunnan Province (202201AS070069) supported this work, through the Climate Center of Yunnan Meteorological Bureau, with GST registration number 12530000431270053A.

Institutional Review Board Statement

Not applicable.

Informed Consent Statement

Not applicable.

Data Availability Statement

Data will be provided upon request from the corresponding author.

Acknowledgments

We acknowledge the producers of the CMIP5 and CORDEX-CORE precipitation datasets from the Earth System Grid Federation (ESGF), the GPCP dataset from the University of Maryland, and the CHIRPS dataset from the University of California Sancta Barbara Climate Hazard Group. These datasets were used in accordance with their respective terms and conditions.

Conflicts of Interest

The authors declare no conflict of interest.

References

  1. Giorgi, F. Producing actionable climate change information for regions: The distillation paradigm and the 3R framework. Eur. Phys. J. Plus 2020, 135, 435. [Google Scholar] [CrossRef]
  2. Gutowski, W.J.; Ullrich, P.A.; Hall, A.; Leung, L.R.; O’Brien, T.A.; Patricola, C.M.; Arritt, R.W.; Bukovsky, M.S.; Calvin, K.V.; Feng, Z.; et al. The Ongoing Need for High-Resolution Regional Climate Models: Process Understanding and Stakeholder Information. Bull. Am. Meteorol. Soc. 2020, 101, E664–E683. [Google Scholar] [CrossRef] [Green Version]
  3. Laprise, R.; de Elía, R.; Caya, D.; Biner, S.; Lucas-Picher, P.; Diaconescu, E.; Leduc, M.; Alexandru, A.; Separovic, L. Challenging some tenets of Regional Climate Modelling. Meteorol. Atmos. Phys. 2008, 100, 3–22. [Google Scholar] [CrossRef]
  4. Giorgi, F. Thirty Years of Regional Climate Modeling: Where Are We and Where Are We Going next? J. Geophys. Res. Atmos. 2019, 124, 5696–5723. [Google Scholar] [CrossRef] [Green Version]
  5. Tapiador, F.J.; Navarro, A.; Moreno, R.; Sánchez, J.L.; García-Ortega, E. Regional climate models: 30 years of dynamical downscaling. Atmos. Res. 2020, 235, 104785. [Google Scholar] [CrossRef]
  6. Di Luca, A.; de Elía, R.; Laprise, R. Potential for added value in precipitation simulated by high-resolution nested Regional Climate Models and observations. Clim. Dyn. 2012, 38, 1229–1247. [Google Scholar] [CrossRef] [Green Version]
  7. Di Luca, A.; de Elía, R.; Laprise, R. Challenges in the Quest for Added Value of Regional Climate Dynamical Downscaling. Curr. Clim. Chang. Rep. 2015, 1, 10–21. [Google Scholar] [CrossRef]
  8. Sørland, S.L.; Schär, C.; Lüthi, D.; Kjellström, E. Bias patterns and climate change signals in GCM-RCM model chains. Environ. Res. Lett. 2018, 13, 074017. [Google Scholar] [CrossRef]
  9. Rummukainen, M. Added value in regional climate modeling. Wiley Interdiscip. Rev. Clim. Chang. 2016, 7, 145–159. [Google Scholar] [CrossRef]
  10. Giorgi, F.; Jones, C.; Asrar, G. Addressing climate information needs at the regional level: The CORDEX framework. World Meteorol. Organ. Bull. 2009, 58, 175. [Google Scholar]
  11. Jones, C.; Giorgi, F.; Asrar, G. The Coordinated Regional Downscaling Experiment: CORDEX, an International Downscaling Link to CMIP5. CLIVAR Exch. 2011, 16, 34–39. [Google Scholar]
  12. Gutowski, J.W.; Giorgi, F.; Timbal, B.; Frigon, A.; Jacob, D.; Kang, H.S.; Raghavan, K.; Lee, B.; Lennard, C.; Nikulin, G.; et al. WCRP COordinated Regional Downscaling EXperiment (CORDEX): A diagnostic MIP for CMIP6. Geosci. Model Dev. 2016, 9, 4087–4095. [Google Scholar] [CrossRef] [Green Version]
  13. Giorgi, F.; Gutowski, W.J. Coordinated Experiments for Projections of Regional Climate Change. Curr. Clim. Chang. Rep. 2016, 2, 202–210. [Google Scholar] [CrossRef] [Green Version]
  14. Teichmann, C.; Jacob, D.; Remedio, A.R.; Remke, T.; Buntemeyer, L.; Hoffmann, P.; Kriegsmann, A.; Lierhammer, L.; Bülow, K.; Weber, T.; et al. Assessing mean climate change signals in the global CORDEX-CORE ensemble. Clim. Dyn. 2020, 57, 1269–1292. [Google Scholar] [CrossRef]
  15. Ciarlo, J.M.; Coppola, E.; Fantini, A.; Giorgi, F.; Gao, X.J.; Tong, Y.; Glazer, R.H.; Torres Alavez, J.A.; Sines, T.; Pichelli, E.; et al. A new spatially distributed added value index for regional climate models: The EURO-CORDEX and the CORDEX-CORE highest resolution ensembles. Clim. Dyn. 2020, 57, 1403–1424. [Google Scholar] [CrossRef]
  16. Giorgi, F.; Coppola, E.; Jacob, D.; Teichmann, C.; Abba Omar, S.; Ashfaq, M.; Ban, N.; Bülow, K.; Bukovsky, M.; Buntemeyer, L.; et al. The CORDEX-CORE EXP-I initiative: Description and highlight results from the initial analysis. Bull. Am. Meteorol. Soc. 2021, 103, E293–E310. [Google Scholar] [CrossRef]
  17. Dosio, A.; Panitz, H.J.; Schubert-Frisius, M.; Lüthi, D. Dynamical downscaling of CMIP5 global circulation models over CORDEX-Africa with COSMO-CLM: Evaluation over the present climate and analysis of the added value. Clim. Dyn. 2015, 44, 2637–2661. [Google Scholar] [CrossRef] [Green Version]
  18. Gibba, P.; Sylla, M.B.; Okogbue, E.C.; Gaye, A.T.; Nikiema, M.; Kebe, I. State-of-the-art climate modeling of extreme precipitation over Africa: Analysis of CORDEX added-value over CMIP5. Theor. Appl. Climatol. 2019, 137, 1041–1057. [Google Scholar] [CrossRef]
  19. Dosio, A.; Jones, R.G.; Jack, C.; Lennard, C.; Nikulin, G.; Hewitson, B. What can we know about future precipitation in Africa? Robustness, significance and added value of projections from a large ensemble of regional climate models. Clim. Dyn. 2019, 53, 5833–5858. [Google Scholar] [CrossRef] [Green Version]
  20. Gnitou, G.T.; Tan, G.; Ma, T.; Akinola, E.O.; Nooni, I.K.; Babaousmail, H.; Al-Nabhan, N. Added value in dynamically downscaling seasonal mean temperature simulations over West Africa. Atmos. Res. 2021, 260, 105694. [Google Scholar] [CrossRef]
  21. Gnitou, G.T.; Tan, G.; Niu, R.; Nooni, I.K. Assessing past climate biases and the added value of cordex-core precipitation simulations over Africa. Remote Sens. 2021, 13, 2058. [Google Scholar] [CrossRef]
  22. Nicholson, S.E.; Klotter, D.A. Assessing the reliability of satellite and reanalysis estimates of rainfall in equatorial Africa. Remote Sens. 2021, 13, 3609. [Google Scholar] [CrossRef]
  23. Nicholson, S.E.; Klotter, D.; Zhou, L.; Hua, W. Validation of satellite precipitation estimates over the Congo Basin. J. Hydrometeorol. 2019, 20, 631–656. [Google Scholar] [CrossRef] [Green Version]
  24. Dosio, A.; Pinto, I.; Lennard, C.; Sylla, M.B.; Jack, C.; Nikulin, G. What Can We Know About Recent Past Precipitation Over Africa? Daily Characteristics of African Precipitation From a Large Ensemble of Observational Products for Model Evaluation. Earth Space Sci. 2021, 8, 8. [Google Scholar] [CrossRef]
  25. Dieng, D.; Cannon, A.J.; Laux, P.; Hald, C.; Adeyeri, O.; Rahimi, J.; Srivastava, A.K.; Mbaye, M.L.; Kunstmann, H. Multivariate Bias-Correction of High-Resolution Regional Climate Change Simulations for West Africa: Performance and Climate Change Implications. J. Geophys. Res. Atmos. 2022, 127, 127. [Google Scholar] [CrossRef]
  26. Dike, V.N.; Shimizu, M.H.; Diallo, M.; Lin, Z.; Nwofor, O.K.; Chineke, T.C. Modelling present and future African climate using CMIP5 scenarios in HadGEM2-ES. Int. J. Climatol. 2015, 35, 1784–1799. [Google Scholar] [CrossRef]
  27. Zebaze, S.; Jain, S.; Salunke, P.; Shafiq, S.; Mishra, S.K. Assessment of CMIP5 multimodel mean for the historical climate of Africa. Atmos. Sci. Lett. 2019, 20, 20. [Google Scholar] [CrossRef] [Green Version]
  28. Diaconescu, E.P.; Laprise, R. Can added value be expected in RCM-simulated large scales? Clim. Dyn. 2013, 41, 1769–1800. [Google Scholar] [CrossRef] [Green Version]
  29. Washington, R.; Harrison, M.; Conway, D.; Black, E.; Challinor, A.; Grimes, D.; Jones, R.; Morse, A.; Kay, G.; Todd, M. African climate change: Taking the shorter route. Bull. Am. Meteorol. Soc. 2006, 87, 1355–1365. [Google Scholar] [CrossRef]
  30. Yang, J.; Gong, P.; Fu, R.; Zhang, M.; Chen, J.; Liang, S.; Xu, B.; Shi, J.; Dickinson, R. The role of satellite remote sensing in climate change studies. Nat. Clim. Chang. 2013, 3, 875–883. [Google Scholar] [CrossRef]
  31. Zhao, Q.; Yu, L.; Du, Z.; Peng, D.; Hao, P.; Zhang, Y. An Overview of the Applications of Earth Observation Satellite Data: Impacts and Future Trends. Remote Sens. 2022, 14, 1863. [Google Scholar] [CrossRef]
  32. Giorgi, F.; Coppola, E.; Solmon, F.; Mariotti, L.; Sylla, M.B.; Bi, X.; Elguindi, N.; Diro, G.T.; Nair, V.; Giuliani, G.; et al. RegCM4: Model description and preliminary tests over multiple CORDEX domains. Clim. Res. 2012, 52, 7–29. [Google Scholar] [CrossRef] [Green Version]
  33. Dee, D.P.; Uppala, S.M.; Simmons, A.J.; Berrisford, P.; Poli, P.; Kobayashi, S.; Andrae, U.; Balmaseda, M.A.; Balsamo, G.; Bauer, P.; et al. The ERA-Interim reanalysis: Configuration and performance of the data assimilation system. Q. J. R. Meteorol. Soc. 2011, 137, 553–597. [Google Scholar] [CrossRef]
  34. Taylor, K.E.; Stouffer, R.J.; Meehl, G.A. An overview of CMIP5 and the experiment design. Bull. Am. Meteorol. Soc. 2012, 93, 485–498. [Google Scholar] [CrossRef] [Green Version]
  35. Collins, W.J.; Bellouin, N.; Doutriaux-Boucher, M.; Gedney, N.; Halloran, P.; Hinton, T.; Hughes, J.; Jones, C.D.; Joshi, M.; Liddicoat, S.; et al. Development and evaluation of an Earth-System model—HadGEM2. Geosci. Model Dev. 2011, 4, 485–498. [Google Scholar] [CrossRef] [Green Version]
  36. Zanchettin, D.; Rubino, A.; Matei, D.; Bothe, O.; Jungclaus, J.H. Multidecadal-to-centennial SST variability in the MPI-ESM simulation ensemble for the last millennium. Clim. Dyn. 2013, 40, 1301–1318. [Google Scholar] [CrossRef]
  37. Zhang, Z.S.; Nisancioglu, K.; Bentsen, M.; Tjiputra, J.; Bethke, I.; Yan, Q.; Risebrobakken, B.; Andersson, C.; Jansen, E. Pre-industrial and mid-Pliocene simulations with NorESM-L. Geosci. Model Dev. 2012, 5, 523–533. [Google Scholar] [CrossRef] [Green Version]
  38. Elguindi, N.; Giorgi, F.; Turuncoglu, U. Assessment of CMIP5 global model simulations over the subset of CORDEX domains used in the Phase I CREMA. Clim. Chang. 2014, 125, 7–21. [Google Scholar] [CrossRef]
  39. Funk, C.C.; Peterson, P.J.; Landsfeld, M.F.; Pedreros, D.H.; Verdin, J.P.; Rowland, J.D.; Romero, B.E.; Husak, G.J.; Michaelsen, J.C.; Verdin, A.P. A Quasi-Global Precipitation Time Series for Drought Monitoring. U.S. Geol. Surv. Data Ser. 2014, 832, 4. [Google Scholar] [CrossRef]
  40. Adler, R.F.; Huffman, G.J.; Chang, A.; Ferraro, R.; Xie, P.-P.; Janowiak, J.; Rudolf, B.; Schneider, U.; Curtis, S.; Bolvin, D.; et al. The Version-2 Global Precipitation Climatology Project (GPCP) Monthly Precipitation Analysis (1979–Present). J. Hydrometeorol. 2003, 4, 1147–1167. [Google Scholar] [CrossRef]
  41. Adler, R.F.; Sapiano, M.R.P.; Huffman, G.J.; Wang, J.J.; Gu, G.; Bolvin, D.; Chiu, L.; Schneider, U.; Becker, A.; Nelkin, E.; et al. The Global Precipitation Climatology Project (GPCP) monthly analysis (New Version 2.3) and a review of 2017 global precipitation. Atmosphere 2018, 9, 138. [Google Scholar] [CrossRef] [PubMed] [Green Version]
  42. Jacob, D.; Elizalde, A.; Haensler, A.; Hagemann, S.; Kumar, P.; Podzun, R.; Rechid, D.; Remedio, A.R.; Saeed, F.; Sieck, K.; et al. Assessing the Transferability of the Regional Climate Model. Atmosphere 2012, 3, 181–199. [Google Scholar] [CrossRef] [Green Version]
  43. Remedio, A.R.; Teichmann, C.; Buntemeyer, L.; Sieck, K.; Weber, T.; Rechid, D.; Hoffmann, P.; Nam, C.; Kotova, L.; Jacob, D. Evaluation of new CORDEX simulations using an updated köppen-trewartha climate classification. Atmosphere 2019, 10, 726. [Google Scholar] [CrossRef] [Green Version]
  44. Dosio, A.; Jury, M.W.; Almazroui, M.; Ashfaq, M.; Diallo, I.; Engelbrecht, F.A.; Klutse, N.A.B.; Lennard, C.; Pinto, I.; Sylla, M.B.; et al. Projected future daily characteristics of African precipitation based on global (CMIP5, CMIP6) and regional (CORDEX, CORDEX-CORE) climate models. Clim. Dyn. 2021, 57, 3135–3158. [Google Scholar] [CrossRef]
  45. Kreienkamp, F.; Paxian, A.; Früh, B.; Lorenz, P.; Matulla, C. Evaluation of the empirical–statistical downscaling method EPISODES. Clim. Dyn. 2019, 52, 991–1026. [Google Scholar] [CrossRef] [Green Version]
  46. Lucas-Picher, P.; Argüeso, D.; Brisson, E.; Tramblay, Y.; Berg, P.; Lemonsu, A.; Kotlarski, S.; Caillaud, C. Convection-permitting modeling with regional climate models: Latest developments and next steps. Wiley Interdiscip. Rev. Clim. Chang. 2021, 12, e731. [Google Scholar] [CrossRef]
Figure 1. Topographical features of the African domain and its key climate zones.
Remotesensing 14 02102 g001
Figure 2. Performance of African precipitation in DJF season at high resolution compared to (a) CHIRPS, for (b) RegCM4-7 evaluation run driven by ERA-INT, (c) driving GCM HadGEM2-ES, (d) driving GCM MPI-ESM-MR, (e) driving GCM NorESM1-M, (f) ensemble mean of the driving GCMs, (g) RegCM4-7 historical run driven by HadGEM2-ES, (h) RegCM4-7 historical run driven by MPI-ESM-MR, (i) RegCM4-7 historical run driven by NorESM1-M, (j) RegCM4-7 historical runs’ ensemble mean, (k) Added Value by RegCM4-7 to HadGEM2-ES, (l) Added Value by RegCM4-7 to MPI-ESM-MR, (m) Added Value by RegCM4-7 to NorESM1-M, (n) Added Value by RegCM4-7 to the ensemble mean of the driving GCMs.
Remotesensing 14 02102 g002
Figure 3. Performance of African precipitation in MAM season at high resolution compared to (a) CHIRPS, for (b) RegCM4-7 evaluation run driven by ERA-INT, (c) driving GCM HadGEM2-ES, (d) driving GCM MPI-ESM-MR, (e) driving GCM NorESM1-M, (f) ensemble mean of the driving GCMs, (g) RegCM4-7 historical run driven by HadGEM2-ES, (h) RegCM4-7 historical run driven by MPI-ESM-MR, (i) RegCM4-7 historical run driven by NorESM1-M, (j) RegCM4-7 historical runs’ ensemble mean, (k) Added Value by RegCM4-7 to HadGEM2-ES, (l) Added Value by RegCM4-7 to MPI-ESM-MR, (m) Added Value by RegCM4-7 to NorESM1-M, (n) Added Value by RegCM4-7 to the ensemble mean of the driving GCMs.
Remotesensing 14 02102 g003
Figure 4. Performance of African precipitation in JJA season at high resolution compared to (a) CHIRPS, for (b) RegCM4-7 evaluation run driven by ERA-INT, (c) driving GCM HadGEM2-ES, (d) driving GCM MPI-ESM-MR, (e) driving GCM NorESM1-M, (f) ensemble mean of the driving GCMs, (g) RegCM4-7 historical run driven by HadGEM2-ES, (h) RegCM4-7 historical run driven by MPI-ESM-MR, (i) RegCM4-7 historical run driven by NorESM1-M, (j) RegCM4-7 historical runs’ ensemble mean, (k) Added Value by RegCM4-7 to HadGEM2-ES, (l) Added Value by RegCM4-7 to MPI-ESM-MR, (m) Added Value by RegCM4-7 to NorESM1-M, (n) Added Value by RegCM4-7 to the ensemble mean of the driving GCMs.
Remotesensing 14 02102 g004
Figure 5. Performance of African precipitation in SON season at high resolution compared to (a) CHIRPS, for (b) RegCM4-7 evaluation run driven by ERA-INT, (c) driving GCM HadGEM2-ES, (d) driving GCM MPI-ESM-MR, (e) driving GCM NorESM1-M, (f) ensemble mean of the driving GCMs, (g) RegCM4-7 historical run driven by HadGEM2-ES, (h) RegCM4-7 historical run driven by MPI-ESM-MR, (i) RegCM4-7 historical run driven by NorESM1-M, (j) RegCM4-7 historical runs’ ensemble mean, (k) Added Value by RegCM4-7 to HadGEM2-ES, (l) Added Value by RegCM4-7 to MPI-ESM-MR, (m) Added Value by RegCM4-7 to NorESM1-M, (n) Added Value by RegCM4-7 to the ensemble mean of the driving GCMs.
Remotesensing 14 02102 g005
Figure 6. Added Value Coverage results for all seasons over (ad) SAH region, (eh) WAF region, (il) CAF region, (mp) NEAF region, (qt) SEAF region, (ux) WSAF region, and (y-ab) ESAF region. “_HR” and “_LR”, respectively refer to high-resolution and low-resolution results using CHIRPS observational data.
Remotesensing 14 02102 g006
Table 1. List of multi-source datasets used in this study.
Data TypeNameInstitutionResolution
Ground and satellite-blended observationsCHIRPSv2.0Climate Hazard Group of the University of California, Sancta Barbara0.25° × 0.25°
Ground, satellite, and sounding-blended observationsGPCPv2.3University of Maryland2.5° × 2.5°
Global Climate Model (GCM)HadGEM2-ESMet Office Hadley Centre (MOHC)1.25° × 1.85°
Global Climate Model (GCM)MPI-ESM-MRMax Plank Institute for Meteorology (MPI-M)1.8653° × 1.875°
Global Climate Model (GCM)NorESM1-MNorwegian Climate Centre (NCC)1.8947° × 2.5°
ReanalysisERA-InterimEuropean Centre for Medium-Range Weather Forecasts (ECMWF)0.75° × 0.75°
Regional Climate Model (RCM)RegCM4-7Abdus Salam International Center for Theoretical Physics (ITCP)0.22° × 0.22°
Table 2. Spatially averaged statistics over continental Africa at high resolution (HR) and low resolution (LR).
HadGEM2-ESRegCM4-7
(HadGEM2-ES)
MPI-ESM-MRRegCM4-7
(MPI-ESM-MR)
NorESM1-MRegCM4-7
(NorESM1-M)
ENSEMBLE_GCMRegCM4-7
(ENSEMBLE-GCM)
HRLRHRLRHRLRHRLRHRLRHRLRHRLRHRLR
DJF
BIAS−0.09−0.431.721.880.18−0.41.772.01−0.42−0.62−0.010.03−0.11−0.491.161.31
RMSE6.171.529.713.636.811.7210.443.515.19 2.157.162.495.731.548.242.47
MAM
BIAS−0.38−0.520.690.390.04−0.510.360.420−0.010.590.38−0.11−0.350.550.4
RMSE3.671.395.692.084.041.496.362.373.881.566.582.23.561.245.371.72
JJA
BIAS−1.82−1.560.77−0.26−0.8−0.660.540.3−1.47−0.87−086−0.58−1.36−1.030.15−0.18
RMSE2.352.223.622.382.081.512.662.142.162.212.752.142.081.782.691.67
SON
BIAS−0.78−0.642.831.240.140.080.960.99−0.71−0.48−0.270.07−0.45−0.351.170.76
RMSE2.781.974.252.692.621.623.632.522.181.892.451.922.31.442.831.71
Table 3. Added Value Coverage results of RegCM4-7 simulations over continental Africa at high resolution (HR) and low resolution (LR).
Negative AVCNon-Significant AVCPositive AVC
HRLRHRLRHRLR
DJFRegCM4-7(HadGEM2-ES)65.22%52.08%5.67%26.36%29.1%21.56%
RegCM4-7(MPI-ESM-MR)52.26%53.73%4.24%7.45%43.5%38.82%
RegCM4-7(NorESM1-M)46.41%43.4%5.05%0%48.55%56.6%
RegCM4-7(ENSEMBLE_GCM)62.05%60.55%2.32%2.77%35.63%35.68%
MAMRegCM4-7(HadGEM2-ES)68.16%75.43%3.66%0%28.18%24.57%
RegCM4-7(MPI-ESM-MR)63.86%56.28%5.26%5%30.89%38.72%
RegCM4-7(NorESM1-M)52.4%41.18%3.96%0.37%43.65%58.45%
RegCM4-7(ENSEMBLE_GCM)54.7%51.6%5.05%1.23%40.25%47.17%
JJARegCM4-7(HadGEM2-ES)64.47%53.52%1.6%1.16%33.94%45.32%
RegCM4-7(MPI-ESM-MR)48.32%32.3%4.35%0%47.33%67.7%
RegCM4-7(NorESM1-M)30.37%26.66%9.65%14.25%59.98%59.09%
RegCM4-7(ENSEMBLE_GCM)49.65%41.04%4.36%0.42%45.99%58.53%
SONRegCM4-7(HadGEM2-ES)61.52%49.14%2.52%4.3%35.96%46.56%
RegCM4-7(MPI-ESM-MR)73.86%77.47%3.44%0%22.71%22.53%
RegCM4-7(NorESM1-M)37.98%37.2%3.09%0.13%58.93%62.67%
RegCM4-7(ENSEMBLE_GCM)57.48%55.54%2.32%0.09%40.19%44.37%
Publisher’s Note: MDPI stays neutral with regard to jurisdictional claims in published maps and institutional affiliations.

