Article

Comparative Study on Potential Landslide Identification with ALOS-2 and Sentinel-1A Data in Heavy Forest Reach, Upstream of the Jinsha River

College of Construction Engineering, Jilin University, Changchun 130026, China
*
Author to whom correspondence should be addressed.
Remote Sens. 2022, 14(9), 1962; https://doi.org/10.3390/rs14091962
Submission received: 28 February 2022 / Revised: 14 April 2022 / Accepted: 17 April 2022 / Published: 19 April 2022
(This article belongs to the Special Issue ALOS-2/PALSAR-2 Calibration, Validation, Science and Applications)

Abstract

:
Many SAR satellites such as the ALOS-2 satellite and Sentinel-1A satellite can be used in Interferometric Synthetic Aperture Radar (InSAR) to identify landslides. As their wavelengths are different, they can perform differently in the same area. In this study, we selected the alpine canyon heavy forest area of the Baishugong–Shangjiangxiang section of the Jinsha River with a strong uplift of faults and folds as the study area. The Small Baseline Subset (SBAS)–InSAR was used for landslide identification to compare the reliability and applicability of L-band ALOS-2 data and C-band Sentinel-1A data. In total, 13 potential landslides were identified, of which 12 potential landslides were identified by ALOS-2 data, two landslides were identified by Sentinel-1A data, and the Kongzhigong (KZG) landslide was identified by both datasets. Then, the field investigation was used to verify the identification results and analyze the genetic mechanism of four typical landslides. Both the Duila (DL) and KZG landslides are bedding slip, while the Jirenhe (JRH) and Maopo (MP) landslides are creep–pull failure. Then, the difference between ALOS-2 and Sentinel-1A data on KZG landslide was compared. A total of 35,961 deformation points on the KZG landslide were obtained using ALOS-2 data, which are relatively dense. Meanwhile, a total of 7715 deformation points were obtained by Sentinel-1A data, which are relatively scattered and seriously lacking, especially in areas with dense vegetation coverage. Comparing the advantages of ALOS-2 and Sentinel-1A data and the identification results of potential landslides, the reliability and applicability of ALOS-2 data in the identification of potential landslides in areas with dense vegetation cover and complex geological conditions were confirmed from the aspects of vegetation cover, topography, field investigation, and comparative analysis of typical landslides.

Graphical Abstract

1. Introduction

Landslides are common geological disasters in mountainous areas, causing serious casualties and economic losses [1,2]. The Jinsha River Basin has dense vegetation coverage, complex geological conditions, and many deep faults. Strong tectonic activities have led to the rapid uplift of the reach, with a rate of up to 5 mm/y [3,4], resulting in frequent disasters such as landslides and debris flows [5,6]. These disasters are likely to cause blocked rivers, resulting in landslide-dammed-lake outburst floods, which seriously threaten the safety of downstream residents [7,8]. For example, the Baige landslide and river blocking occurred twice in the upper reaches of the Jinsha River, destroying hundreds of houses and causing direct economy losses of about USD 963.5 million [7]. In addition, there are many paleo-landslide deposits along the Jinsha River [9,10], which are potential hazards for residents and buildings in the downstream. Therefore, it is of great significance to identify potential landslides along the Jinsha River.
Accurate identification of potential landslides is the key to effective disaster prevention and reduction [11]. Therefore, identification and verification methods are particularly important, as they can effectively reduce the uncertainty of results. The traditional landslide identification methods are mainly field investigation and monitoring, including the macro characteristics of landslide deformation, global navigation satellite systems (GNSS), leveling measurements, and so on, and the accuracy can reach the centimeter-to-millimeter level [12]. However, these monitoring methods are point-measurement-based [13]. When the scope of the study area is large and the geological conditions are complex, there are some problems, such as being difficult for geologists and instruments to reach, the omission of geological disasters, and being relatively time consuming. Landslide susceptibility mapping is an effective method to predict landslides, and the use of a combined model can reduce the uncertainty of results [14,15,16]. The prediction result of this method is usually larger than the range of a landslide, and there will also be problems regarding the time-consuming and laborious nature of field investigation. With the development of remote sensing technology, optical remote sensing interpretation and InSAR technology have effectively solved these problems. However, there are various problems in a wide range of optical remote sensing images, such as untimely updating and it being difficult to determine the macro quantitative changes. InSAR technology has the advantages of all-weather and all-day, meaning that it is widely used. It was used to obtain deformation information as early as 1969. Then, with the continuous maturation and improvement in technology, time series InSAR technology has been proposed and applied in many fields and all over the world, such as landslide monitoring and identification [17,18], surface deformation monitoring in mined-out areas [13], land subsidence [19], earthquakes [20], glacier movement [21], and so on. When combined with optical images and field investigation, it can effectively determine and verify the accuracy of the results [12,22].
InSAR technology is the product of the combination of microwave imaging and electromagnetic wave interferometry, which uses the principle of interferometry at the macroscopic level and can monitor the surface deformation through SAR satellite images [23]. However, satellites in different bands and parameters have different penetration capabilities, resulting in different information quality. Radar satellites still in service are mainly divided into the X-, C-, and L-bands [24]. X-band SAR data have the characteristics of high resolution and short wavelength, with a wavelength of about 3.1 cm [25]. Representative satellites are COSMO-SkyMed and TerraSAR launched in June 2007. Affected by short wavelength, the influence of atmospheric phase screens (APS) on these satellites is more serious [26]. The wavelength of C-band is about 5.6 cm, between X-band and L-band, and the representative satellites are Sentinel-1 and Radarsat-2 [27]. The Sentinel-1 satellite data have the characteristics of high spatial resolution and being free, which means that they are widely used in deformation monitoring of geological hazards [12,28]. The L-band satellite has a wavelength of about 23.5 cm, with strong penetration capability, meaning that SAR images have a high coherence in the vegetation-covered areas. The representative satellites are ALOS and ALOS-2, which were launched by the Japan Aerospace Exploration Agency (JAXA) in 2006 and 2014, respectively [29]. In most studies, both ALOS-2 and Sentinel-1 data were used to obtain the land subsidence [30] and soil moisture [31,32], monitor landslides [33,34], and so on. The applicability of the two datasets was compared and analyzed, and better results were achieved [33,35]. In this study, ALOS-2 and Sentinel-1A data were used to obtain surface deformation and identify landslides.
In the alpine and canyon areas with high vegetation coverage, the long-term phase change map obtained by the ALOS-2 data is clearer, while the phase change map of the Sentinel-1A data is better in the exposed rock and soil area. A large number of vegetation and other factors will reduce the data coherence, and then produce noise points that can easily be mistaken for the deformation area, which makes the latter landslide field survey more ineffective [36]. The L-band ALOS-2 data provides better spatial coverage of landslide movements than the C-band Sentinel-1 data, especially in rural areas along lake shores [32]. Compared to the displacement signal amplitudes measured by Sentinel-1, the ALOS-2 data have higher values due to the high surface penetration of the L-band. Sentinel-1 showed better results on bare soil surfaces, while ALOS-2 was more sensitive on vegetation-covered surfaces [24,31,37]. Therefore, the accuracy of identification results can be improved by using InSAR technology to process multi-sensor satellite data [33].
The study aimed to identify potential landslides in the Baishugong–Shangjiangxiang section of the Jinsha River using ALOS-2 and Sentinel-1A data and analyze the applicability of the data. The study was conducted in three stages: (a) we used SBAS-InSAR technology to obtain the phase change and surface deformation rate of long-term series, and combined it with multi-phase Google Earth images to identify potential landslides to reduce the uncertainty of results; (b) the identification results were verified and the genetic mechanism of typical landslides was analyzed through field investigation; (c) the deformation characteristics of the KZG landslide were analyzed based on the results of ALOS-2 and Sentinel-1A data. Finally, the reliability and applicability of ALOS-2 and Sentinel-1A data were comprehensively analyzed and discussed.

2. Materials and Methods
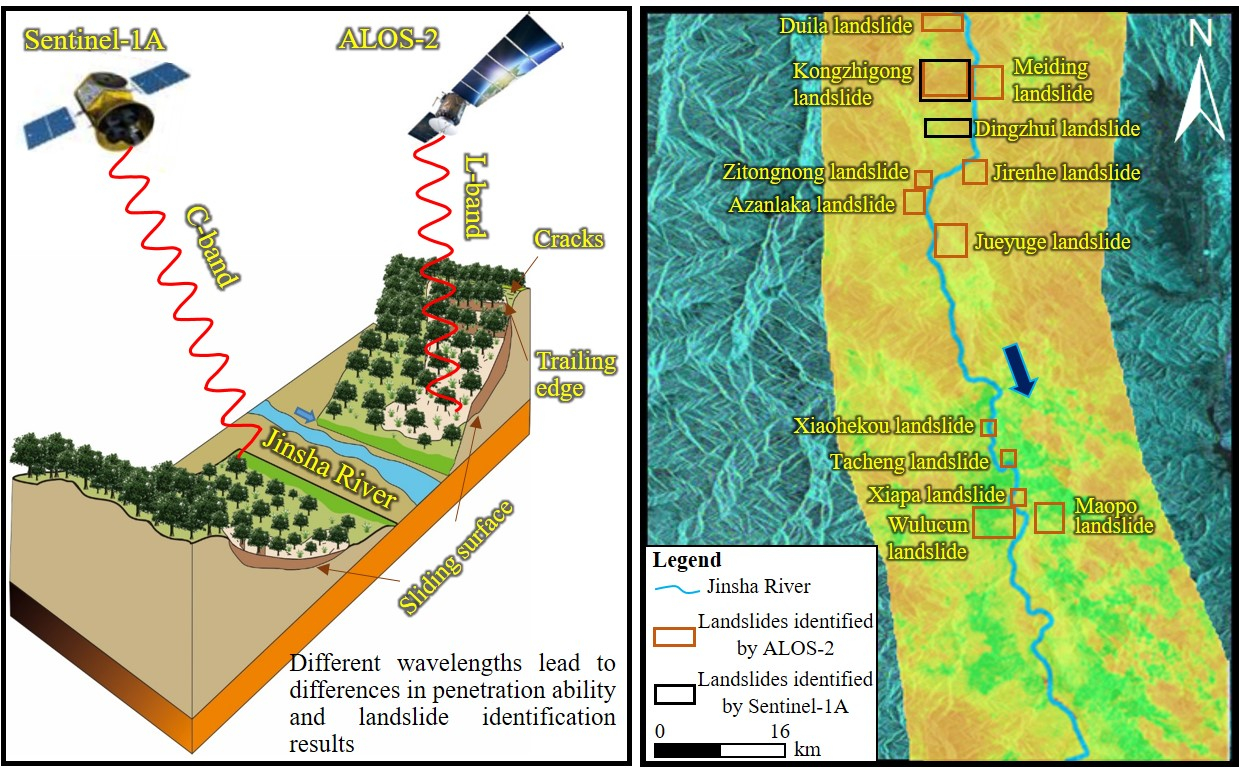
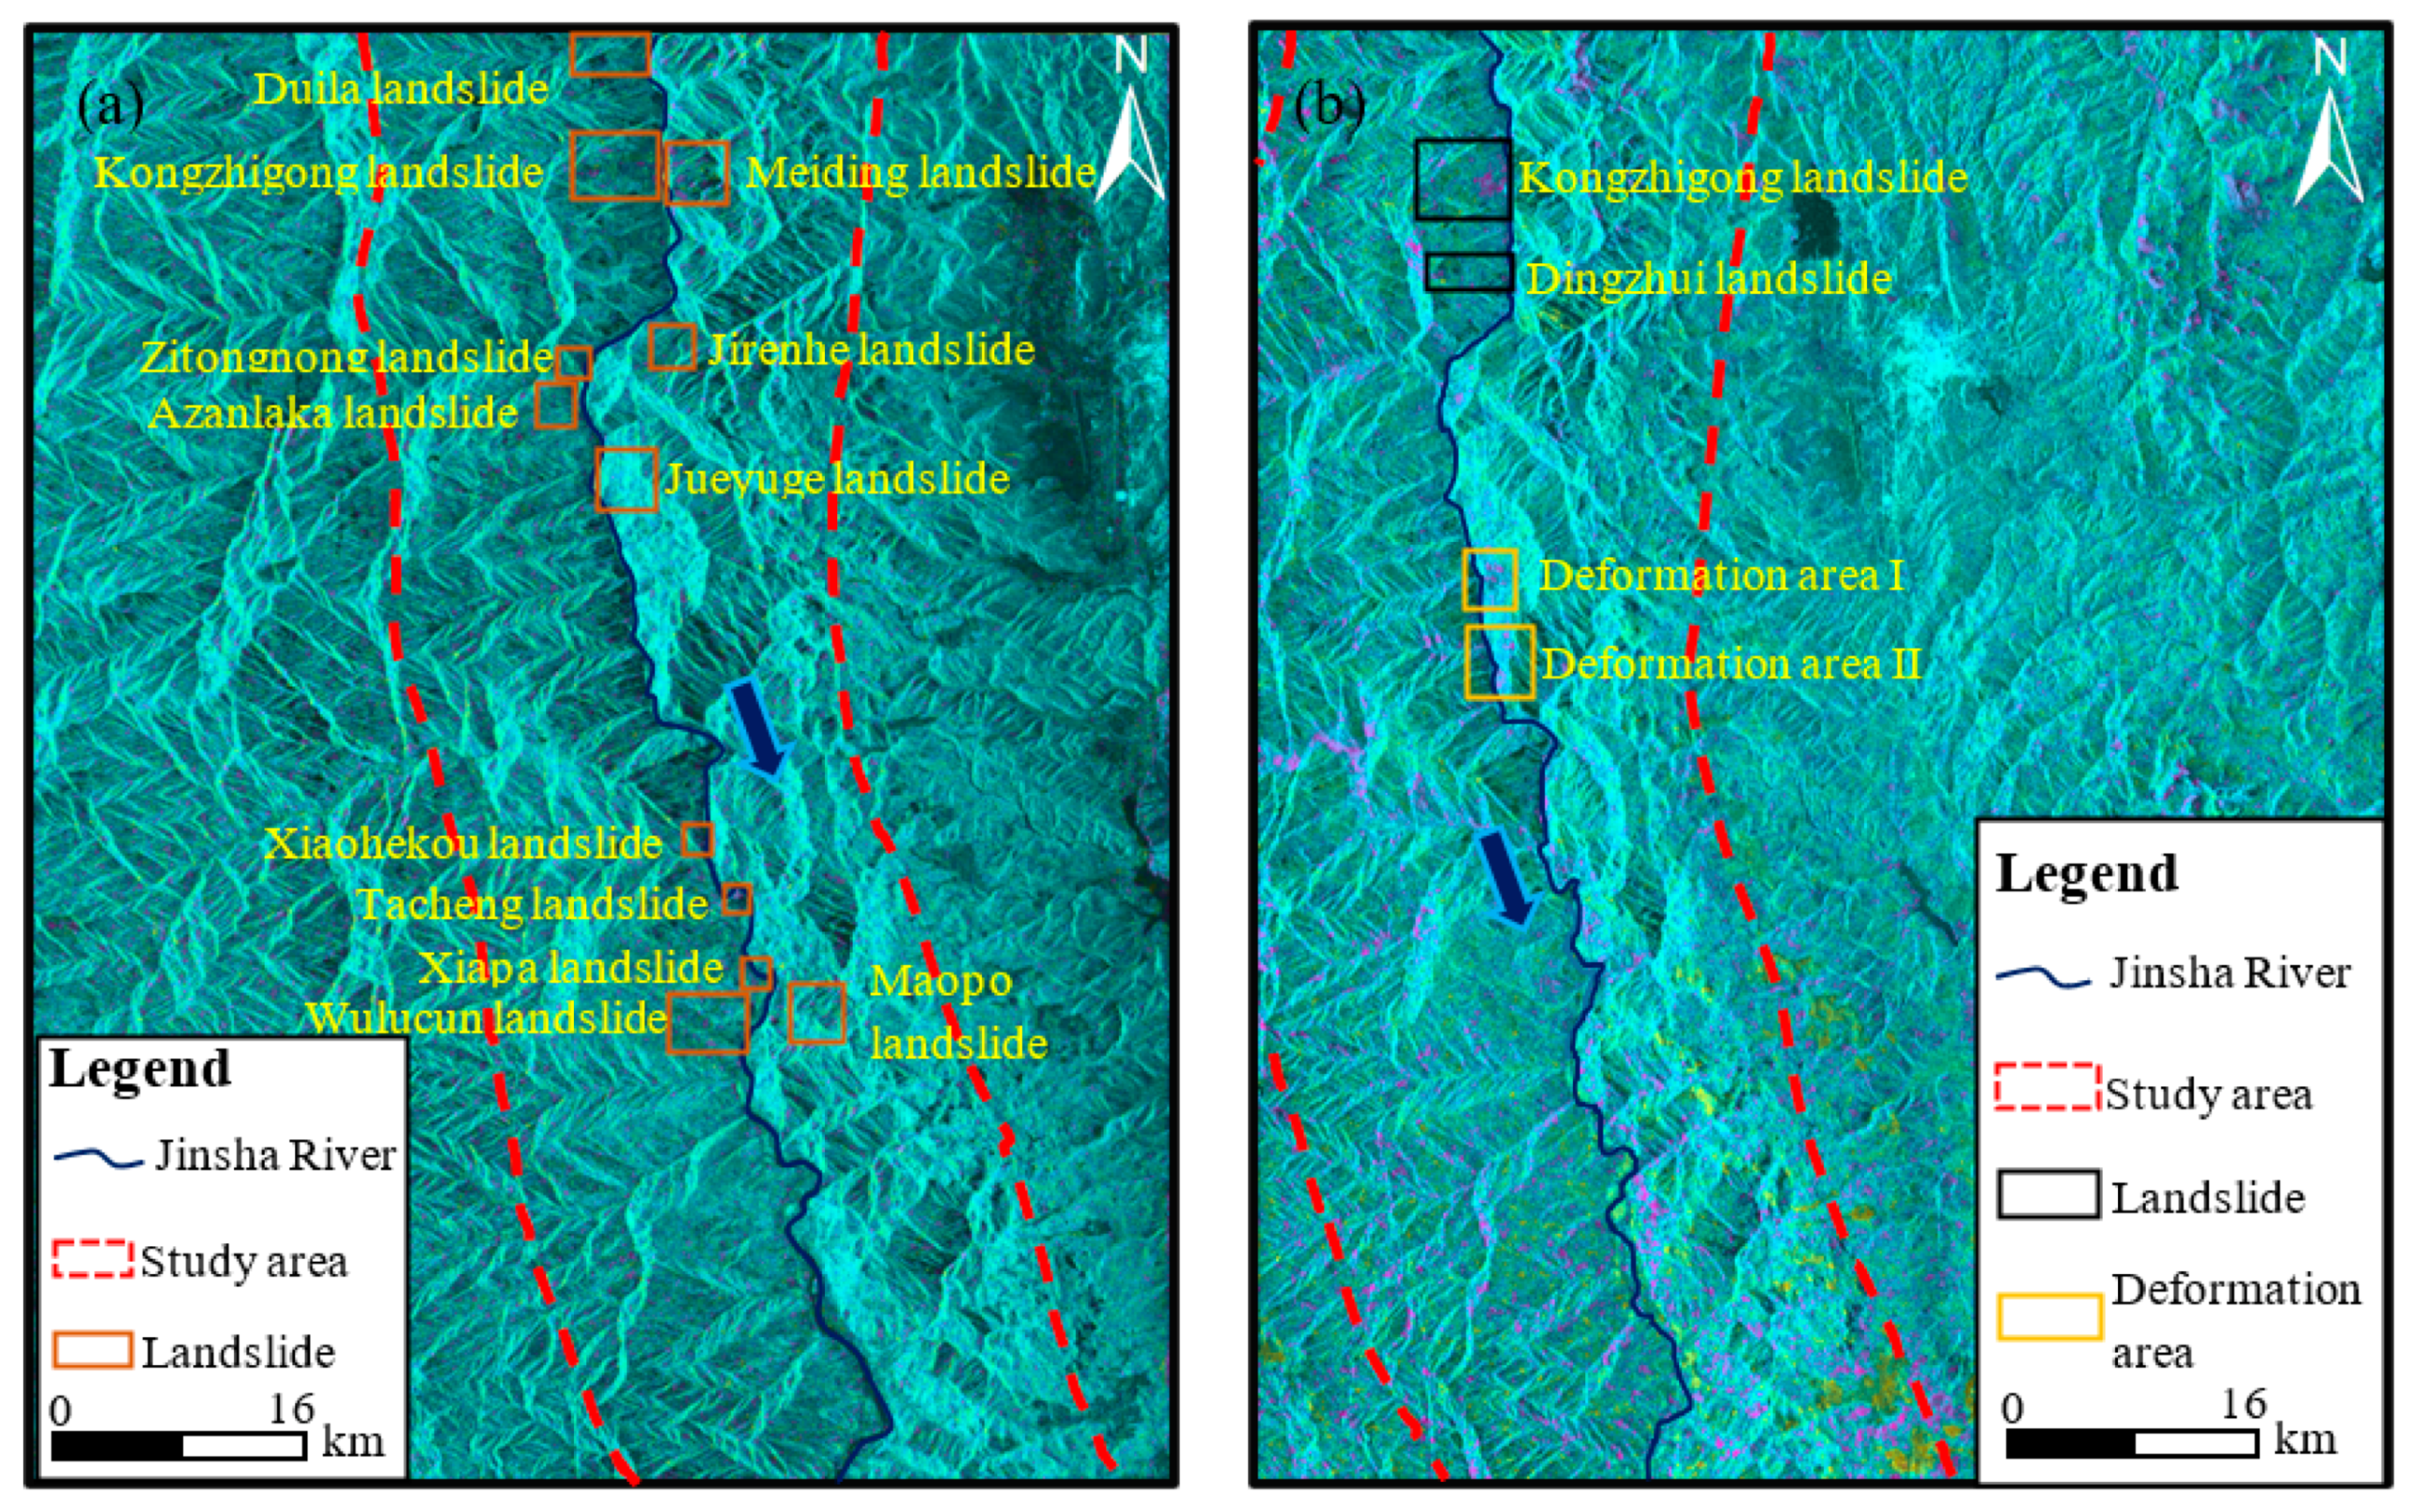
2.1. Study Area

The study area is located in the Baishugong–Shangjiangxiang section of the upper reaches of the Jinsha River, Diqing Tibetan Autonomous Prefecture, Yunnan Province, China, on the southeast edge of the Qinghai Tibet Plateau (Figure 1a). The study area covers an area of about 1171 km2, with developed vegetation, which is a heavy forest area. Under the strong uplifting action, the river is deeply incised to form a V-shaped deep and steep valley [3], and the erosion, denudation, and glacial erosion make it an alpine and canyon landform. The elevation of the study area is 1862~4502 m, and the height difference is 2640 m.
Affected by multi-stage movement, the geological structure is complex, and deep and large faults (Jinsha River East branch fault zone, Zhongdian-Longpan-Qiaohou fault zone, Daju-Lijiang fault zone, Xiaojinhe-Lijiang fault zone, Jinsha River fault zone, Heqing-Eryuan fault zone, Weixi-Qiaohou fault zone) and folds (Songpan-Ganzi geosyncline fold system of class I tectonic unit) have developed in a large area. Plate movement caused the fault zone to move and slip, forming large-scale thrust nappe and translational shear or strike slip in the region, resulting in discontinuity or loss of structural units. The exposed strata in the area from Cenozoic to Paleozoic are Quaternary (Q), Tertiary (E), Triassic (T), Permian (P), Carboniferous (C), Devonian (D), and Cambrian (∈). The quaternary stratum is dominated by sediments, and the Tertiary, Triassic, and Permian lithology is mainly sedimentary rocks, such as conglomerate, sandstone and limestone; the lithology of the Carboniferous system is mainly limestone; the lithology of the Devonian and Cambrian is mainly metamorphic rocks, such as schist and phyllite.
The study area is mainly characterized by a monsoon climate. Affected by the southwest monsoon and southeast monsoon, the rainfall is concentrated, and the rainy season is from May to October. The annual average rainfall is 954 mm and the average evaporation is 2179 mm. The annual average runoff is 1360 m3/s and the annual average temperature is 12.6 °C. Small earthquakes are frequent in the region, with peak seismic acceleration of 0.20 g, characteristic period of seismic response spectrum of 0.40 s, and seismic intensity of VIII. Strong tectonic activity, continuous river undercutting erosion, long-term weathering, a complex high ground stress field, free surface unloading, and other factors in the study area are the fundamental factors leading to the instability of slopes on both banks of the river, resulting in frequent landslides and other disasters [6].

2.2. Data Acquisition

The ascending data of ALOS-2 and Sentinel-1A satellites and digital elevation model (DEM) data were used for SBAS-InSAR technology processing. The ALOS-2 satellite images were provided by the Japan Aerospace Exploration Agency (JAXA) and launched in May 2014. Sentinel-1A satellite images were provided by the European Space Agency. It was launched in October 2014. The DEM used in the research was obtained by the Shuttle Radar Topography Mission (SRTM) sensor, with a spatial resolution of 30 m.
ALOS-2 is the only L-band SAR satellite in operation, with a wavelength of about 23.5 cm and a frequency of 1.2 GHz. The ALOS-2 satellite can obtain observation data without the influence of climate conditions and time. The L-band can penetrate vegetation, and it can be better used to monitor surface deformation in heavy forest areas. The coverage of the data is shown in Figure 1b, and the type is L1.1. The time span is from 6 October 2014 to 25 May 2020, with a total of 15 images. The resolution is 10 m and the incident angle is 36.28°. Affected by satellite shooting, the data time interval is not periodic.
Sentinel-1A is a C-band radar satellite with a wavelength of about 5.6 cm, which has certain limitations in densely vegetated areas. It can penetrate clouds and is not affected by weather and climate. It can be used to study the change in flood areas, landslides, and forest fire monitoring, and so on. The coverage of the image is shown in Figure 1b, and the data type is L1.1, slant-distance single look complex (SLC) mode. The time span is from 18 March 2017 to 21 November 2020, with a total of 29 images and a time interval of 48 days. The imaging mode is interferometric wide (IW) swath, the polarization mode is VV, the average incident angle is 33.91°, and the ground resolution is 5 × 20 m. The specific information relating to satellite data is shown in Table 1.

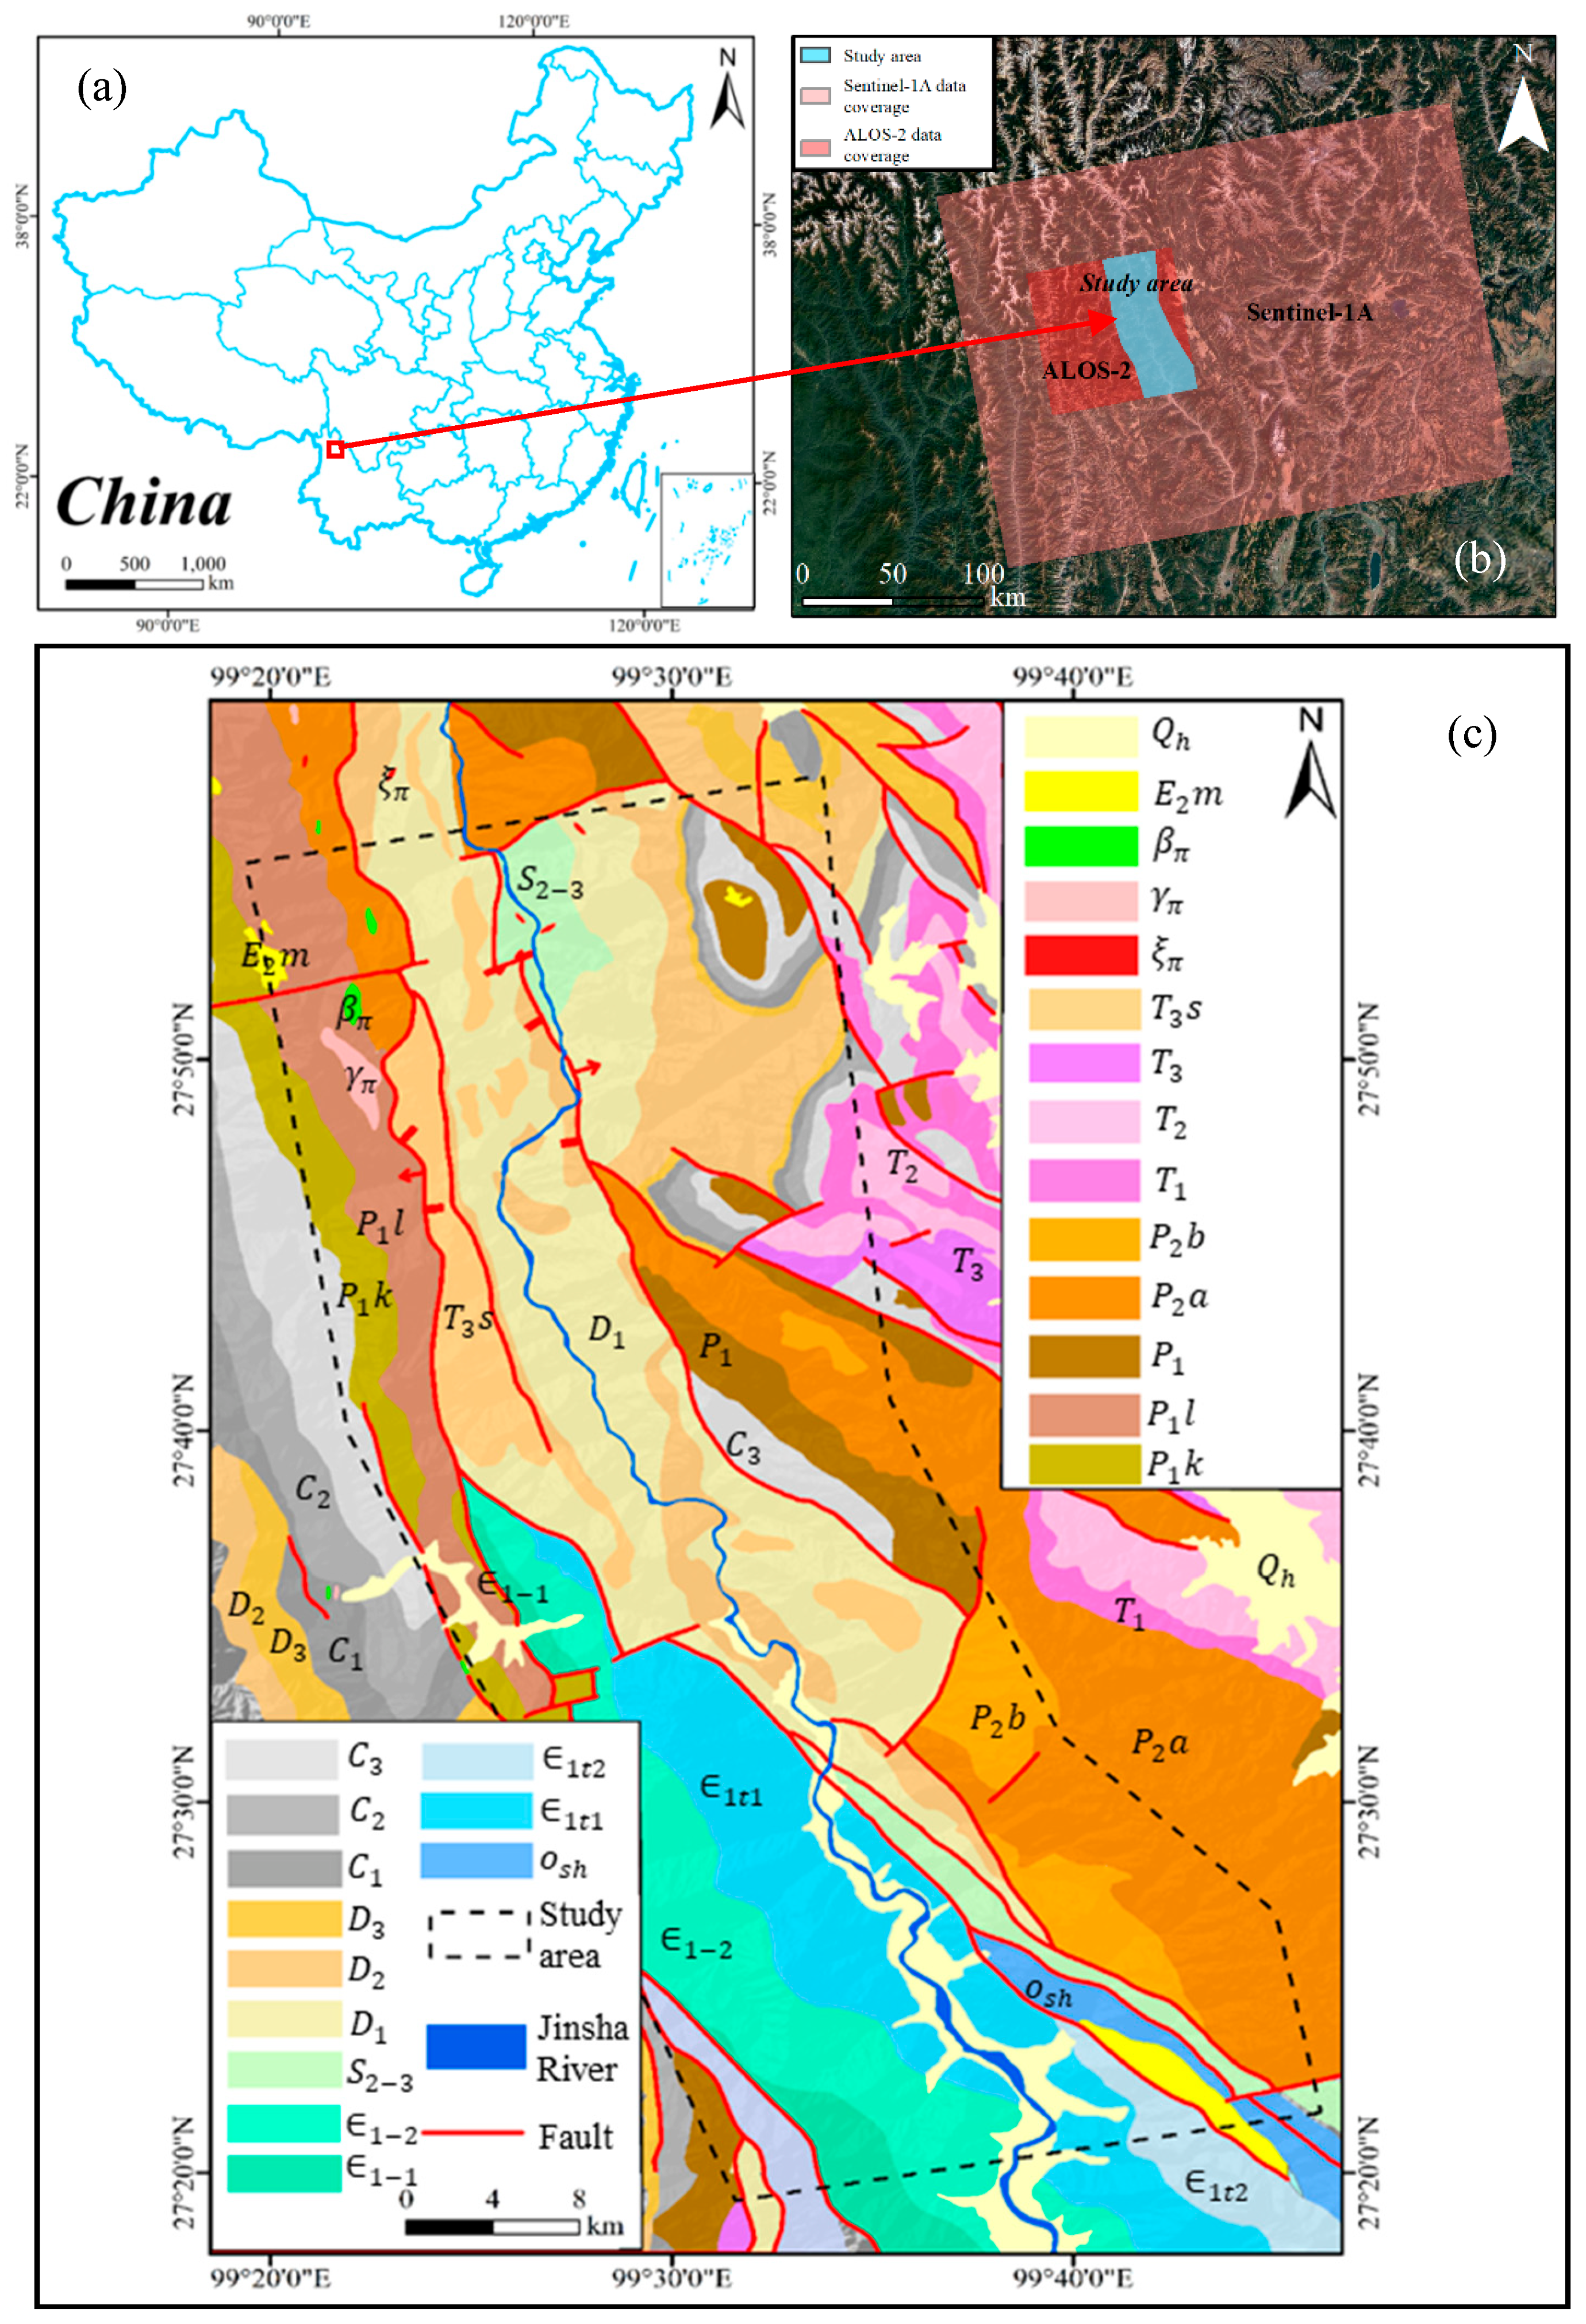
2.3. SBAS-InSAR Technology

SBAS-InSAR technology was proposed in 2002, overcoming the limitations of spatio-temporal incoherence of SAR data and vulnerability to atmospheric effects, and generates more continuous ground phase change and deformation data in time and space [38,39], with monitoring accuracy up to the millimeter level. The GAMMA software was used to process ALOS-2 and Sentinel-1A data by SBAS-InSAR technology to obtain the surface deformation phase change and deformation rate of the Baishugong–Shangjiangxiang section. The main steps included: geocoding, image registration, generating connection diagrams, differential interference processing, removing the atmospheric error and elevation residual, estimating the deformation rate by means of the singular value decomposition (SVD) method, and reverse geocoding. The flow chart is shown in Figure 2c.
Geocoding and image registration constituted the preprocessing process of SAR data. The purpose was to match the data of the same satellite to the same common reference system. Then, according to the interval of SAR data, in order to ensure the coherence of the data, the time and spatial baseline of ALOS-2 data were set to 900 d and 420 m, respectively, and 60 interferometric pairs were obtained. The time and spatial baseline of Sentinel-1A data were set to 150 d and 240 m, respectively, and 81 interferometric pairs were obtained. The baseline connection diagrams are shown in Figure 2a,b, respectively. According to the engineering geological conditions of the study area, the adaptive filtering method was selected, and the unwrapping coefficient was set to 0.2 for processing, which was used to remove the interference of factors such as atmosphere, terrain, vegetation, and diffuse reflection of ground objects, improve the accuracy of phase map and velocity, and then ensure the accuracy of landslide identification results. The processing of removing atmospheric error and elevation residual sought to analyze the time series of the interference processed data and estimate the deformation rate and the phase change map of the study area combined with the SVD method. The color change in the phase diagram represents the change in phase, and the color difference represents the phase difference. When the phase difference is large, it represents that there is the deformation of this place that experiences a large change, which can be identified as a potential landslide area. Finally, through reverse geocoding, the results are encoded into the cartographic coordinate system, and then the deformation results with geographical coordinates are obtained, which are projected onto the map to further study the landslide.

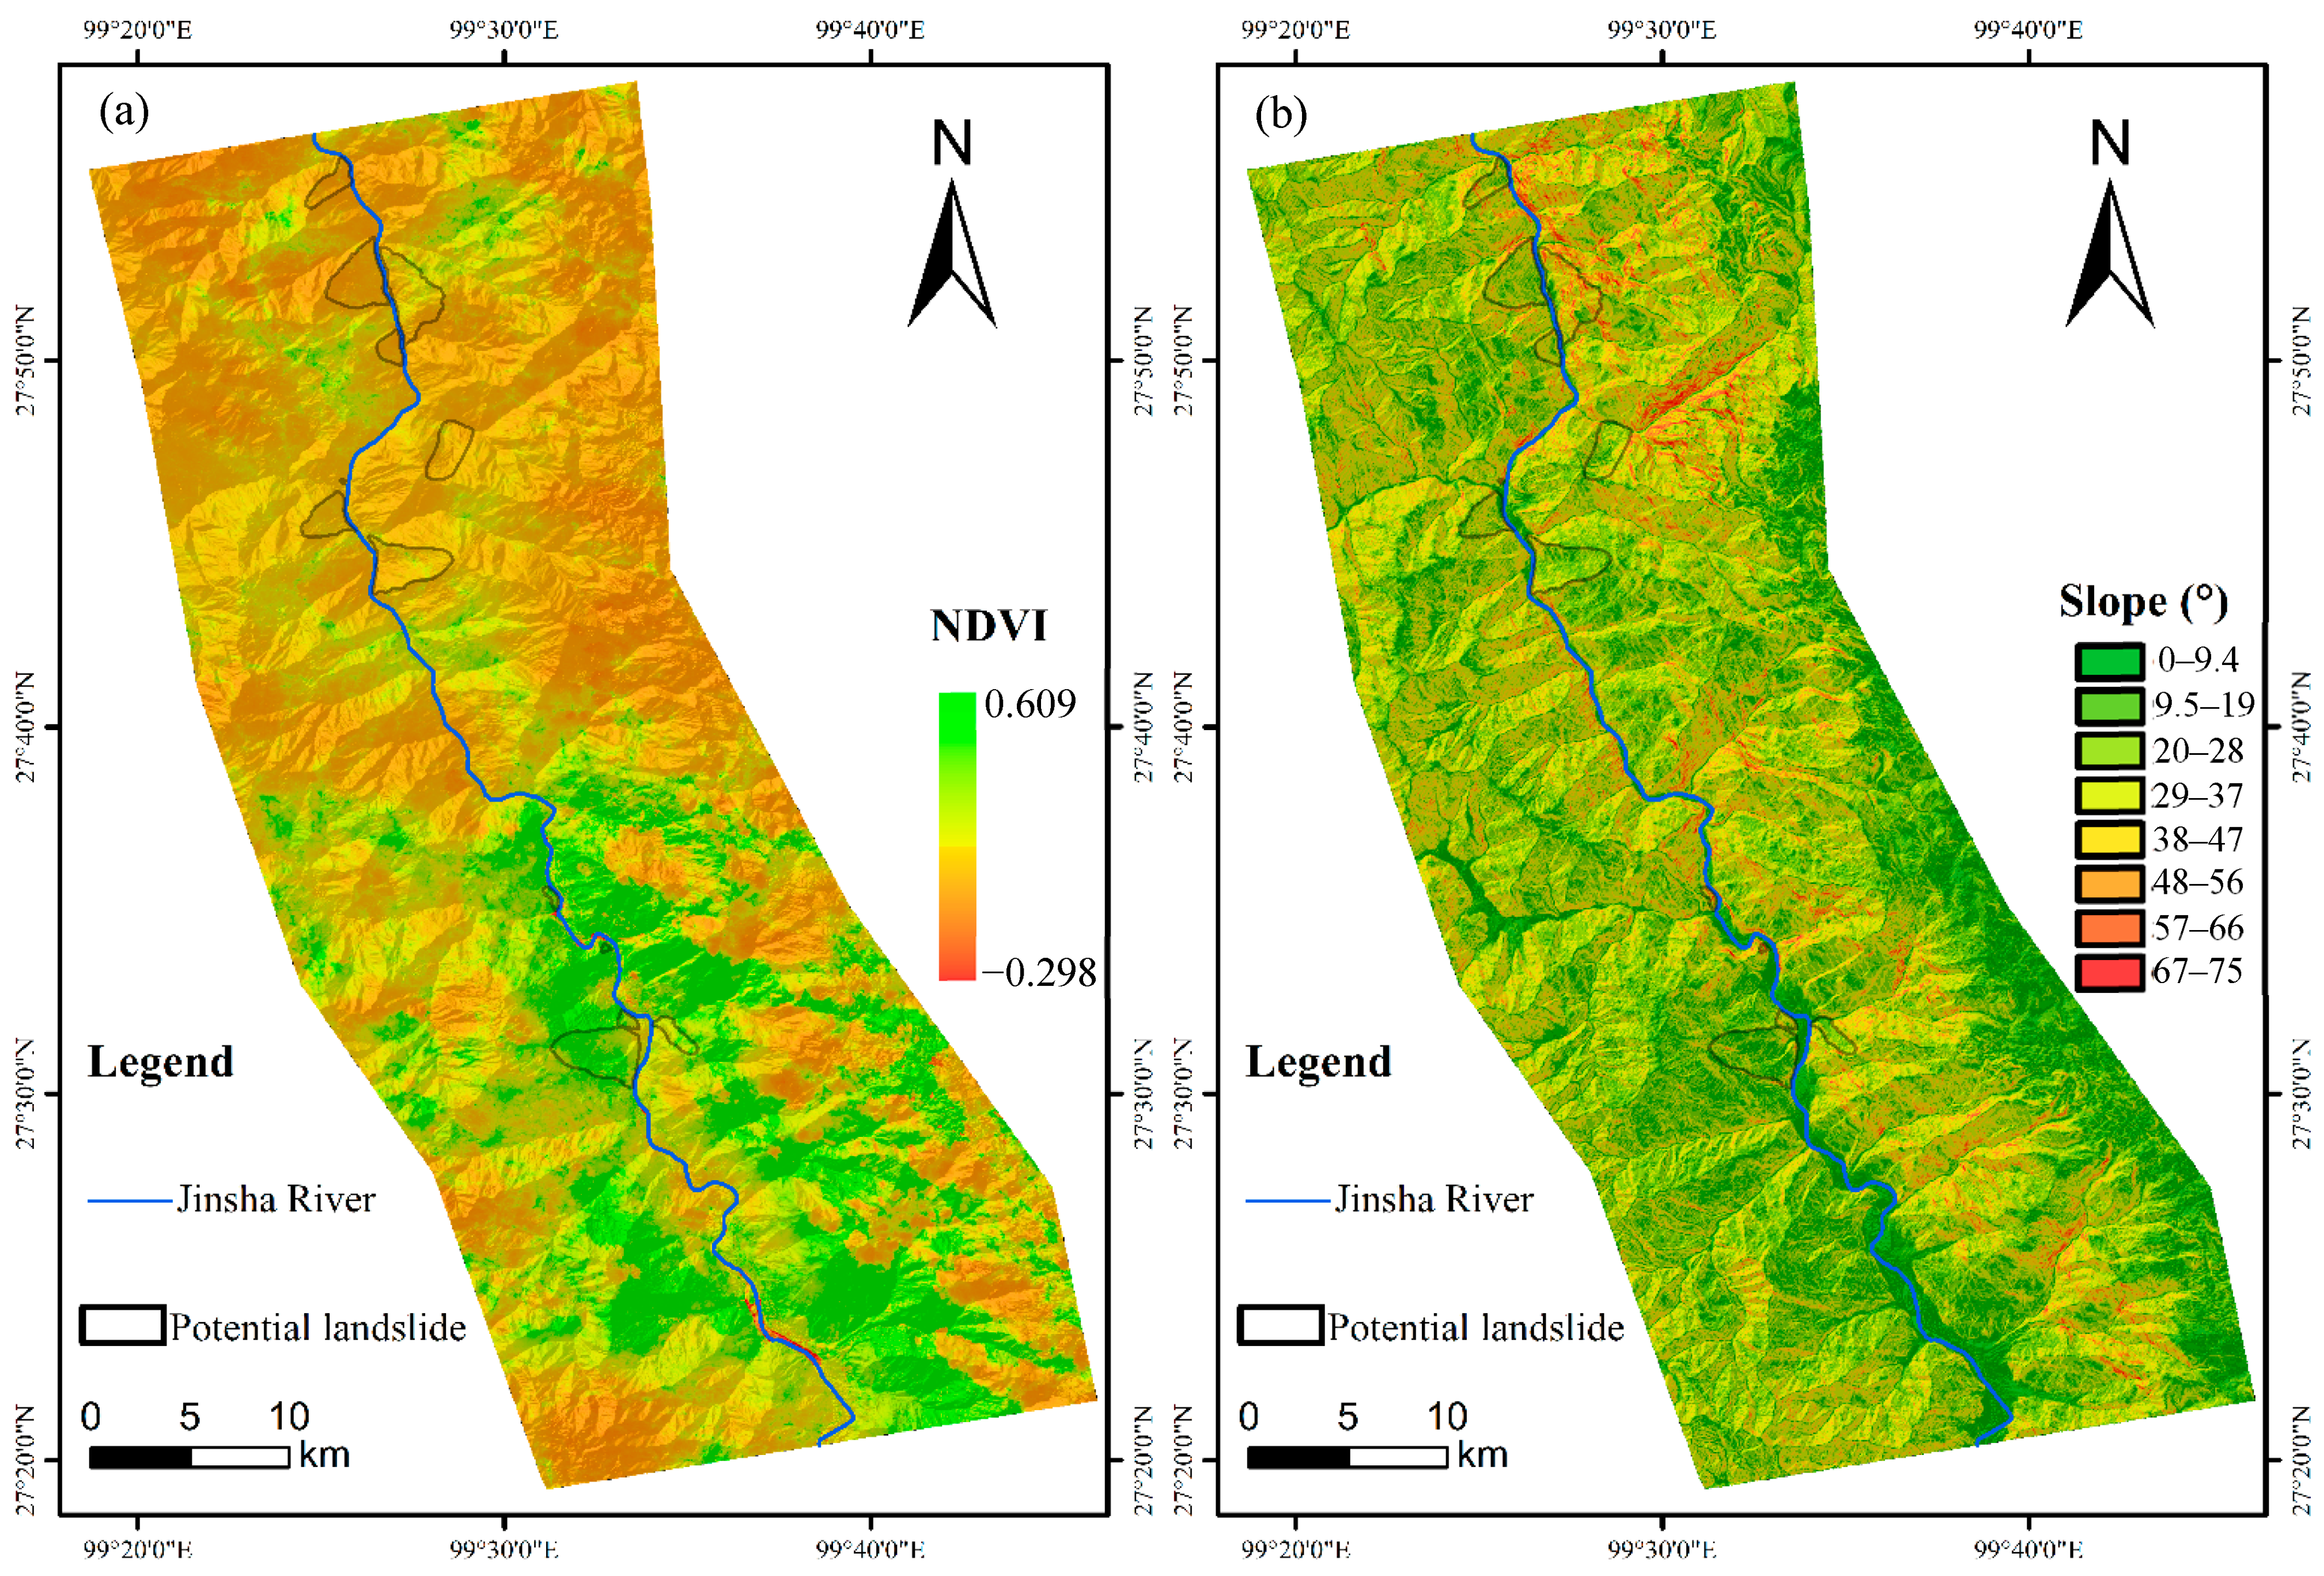
2.4. Normalized Difference Vegetation Index (NDVI)

The upper reaches of Jinsha River are heavily forested with dense vegetation. Due to the long river reach in the study area, there are differences in vegetation coverage at different locations, and the microwave signal strength and penetration ability of satellite data at different wavelengths are different. In this study, we used the normalized difference vegetation index (NDVI) to obtain the overall vegetation coverage of the study area, and then compare and analyze the applicability of ALOS-2 and Sentinel-1A data in the study area. NDVI was obtained by processing Landsat 8 satellite data with ArcGIS software. The data were accessed from http://www.gscloud.cn for free, (accessed on 9 April 2020). The calculation formula is as follows:
NDVI = (IR − R)/(IR + R)
where, R and IR are the energy reflected in the red and infrared portion of the electromagnetic spectrum, respectively [40].

3. Results

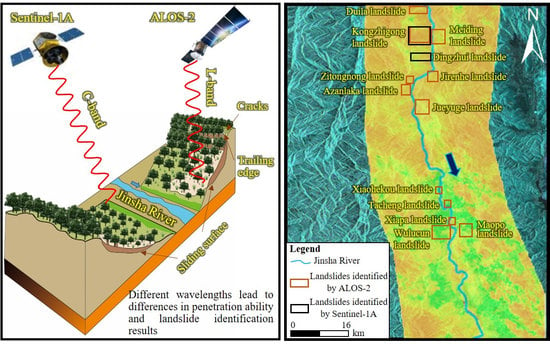
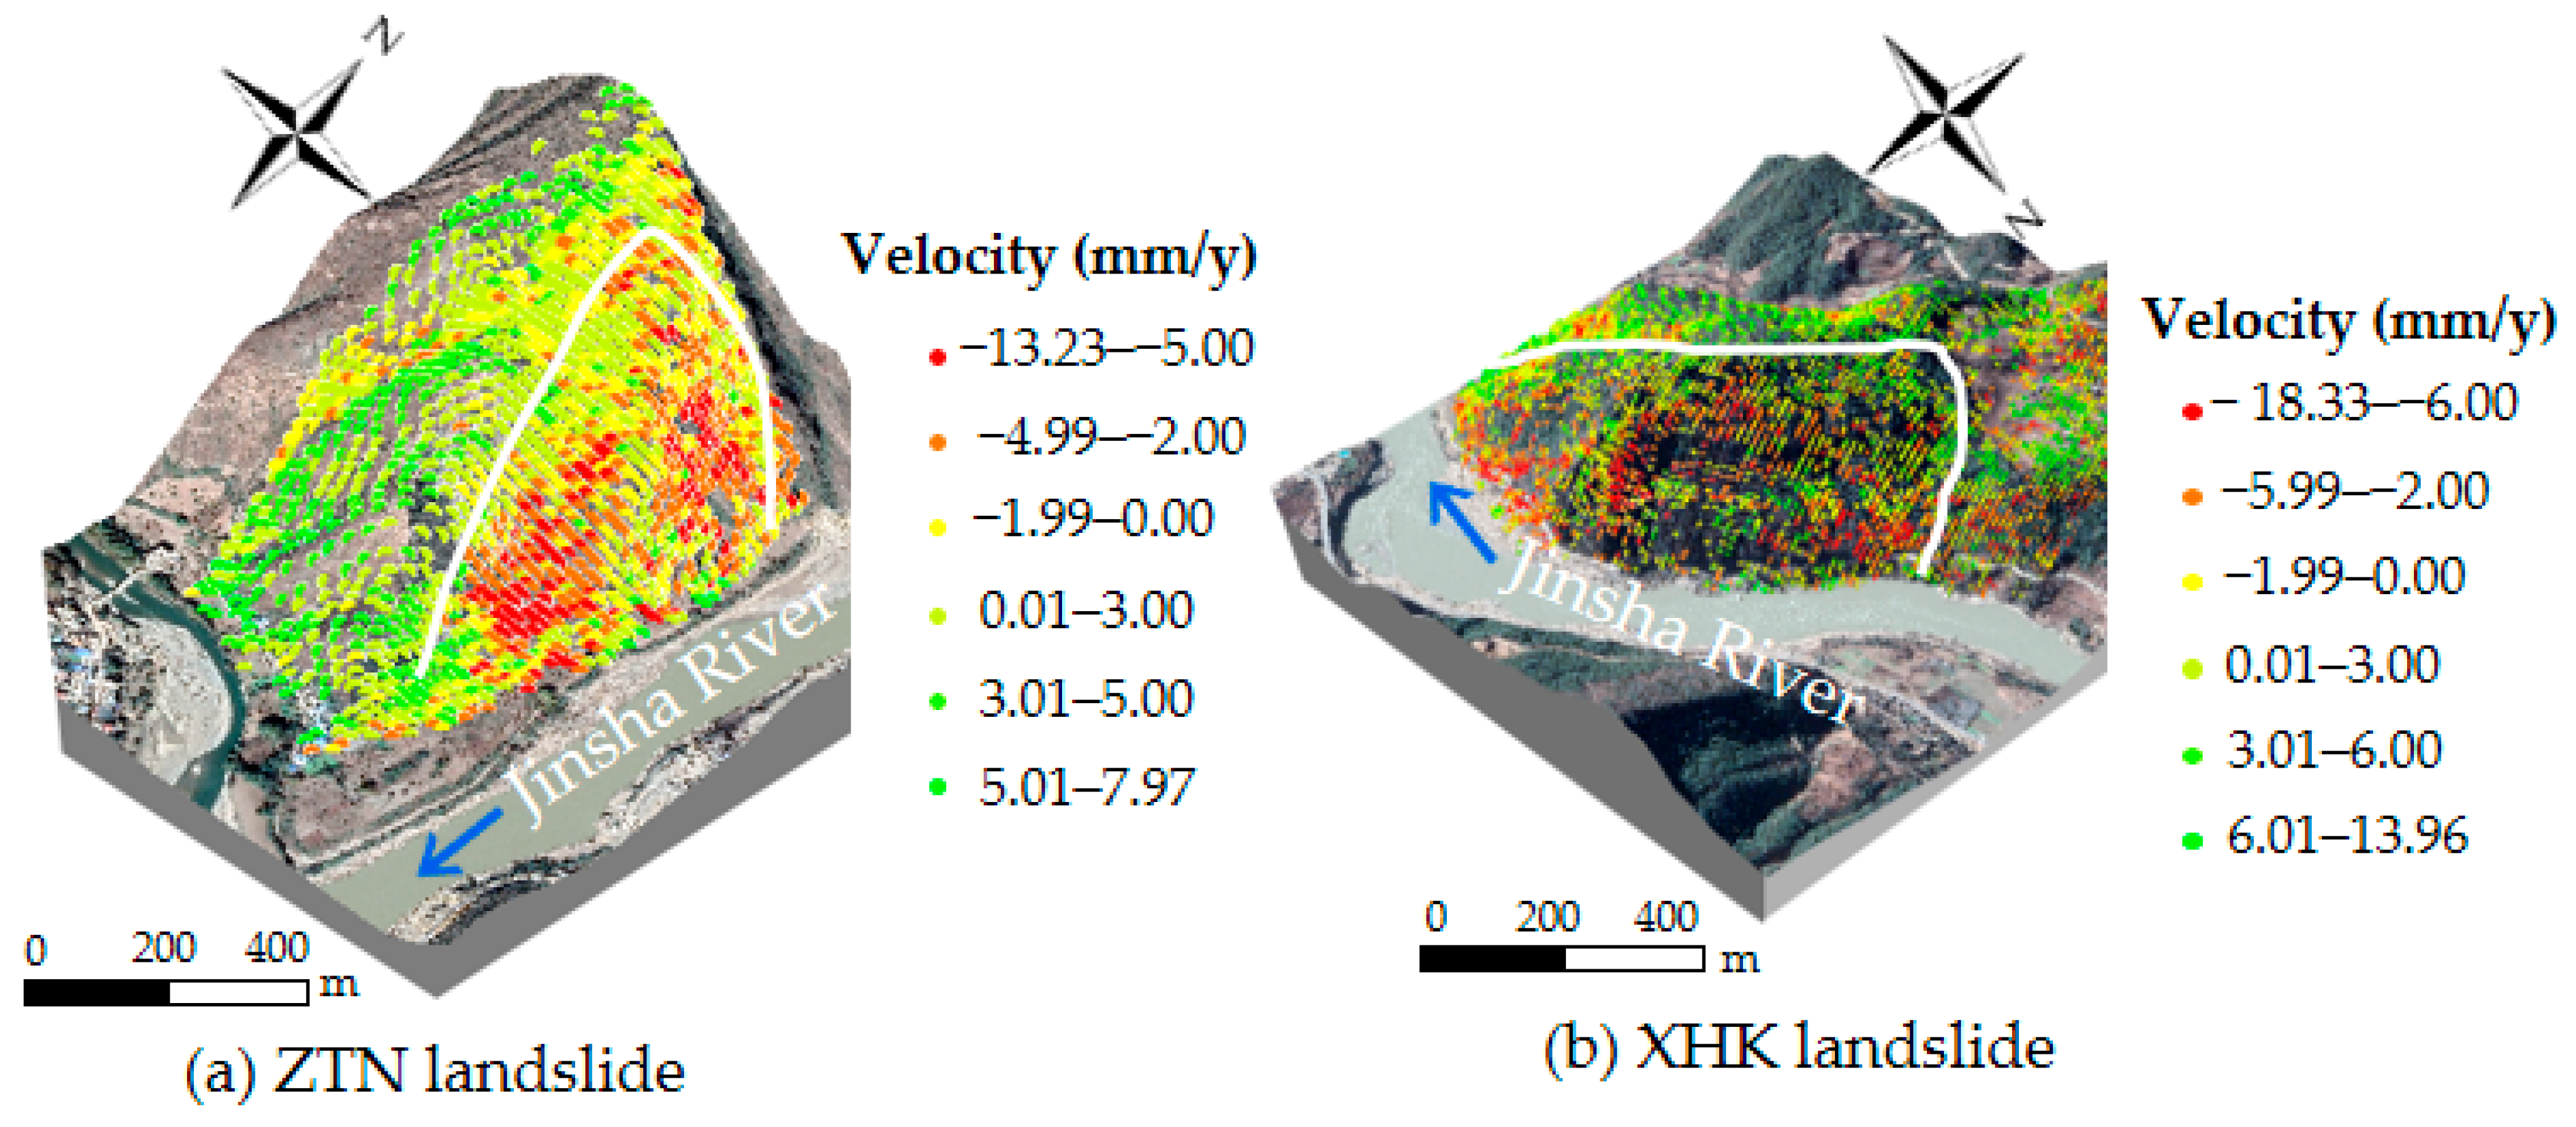
3.1. Identification of Potential Landslides

The surface phase change and deformation information of the section from Baishugong to Shangjiangxiang along the Jinsha River was obtained using SBAS-InSAR technology. The phase change of surface displacement can be represented by a continuous color band. When the color band changes rapidly, it indicates that the displacement changes greatly, and it is regarded as a potential landslide area. Therefore, the surface phase map of the study area is interpreted to obtain the potential landslide area. Then, combined with the landform, deformation rate, and Google Earth images of the study area, the basic elements of the landslide are identified, and the landslide boundary is preliminarily delineated and confirmed as the identification of a potential landslide.
By interpreting the phase change information of surface displacement obtained from ALOS-2 and Sentinel-1A data, a total of 13 potential landslides and two deformation areas were identified, and their distribution is shown in Figure 3. There are more landslides distributed on the right bank, and potential landslides are named from north to south according to the location. We can find that 12 of them were identified by ALOS-2 data and 2 potential landslides were identified by Sentinel-1A data. The KZG landslide was identified in both datasets. The NDVI of the study area obtained by using ArcGIS software (Figure 4) shows that the NDVI value in the north is small, which indicates that the vegetation is sparse and the coverage is low. The vegetation in the south is dense and the coverage is high. The NDVI value is large, which can be up to 0.609. Therefore, the number of landslides in the north is higher than that in the south. The NDVI and slope values of potential landslides are shown in Table 2. The slope of the landslide is obtained through the slope extraction function of DEM by ArcGIS software. We can find that the slope of landslides is between 20° and 40°, with a maximum slope of 39.4° (Xiaohekou landslide), and a minimum slope of 20.7° (Wulucun landslide). The vegetation coverage of the southern landslides is obviously higher than that of the northern landslides, and the vegetation coverage of the Tacheng landslide is the most intensive. The KZG landslide is easily monitored by the two datasets due to low vegetation coverage and slope.
Field investigation is the most effective way of verifying the accuracy of potential landslide identification results. Therefore, we went to the study area on 25 April 2021 to carry out a field geological survey for the identified landslide for 17 days. Through the field investigation, we found that the identified macro damage characteristics such as cracks at the trailing edge of the landslide, landslide accumulation, and gullies are obvious, and the failure position is roughly the same as that with a large deformation rate. According to the investigation results, we finally delineated the landslide boundary. These landslides are deformed and have the possibility of occurrence, and some of them are the deformation of old landslide deposits, which proves that the identification results are more accurate. Then, typical landslides were selected for detailed analysis.

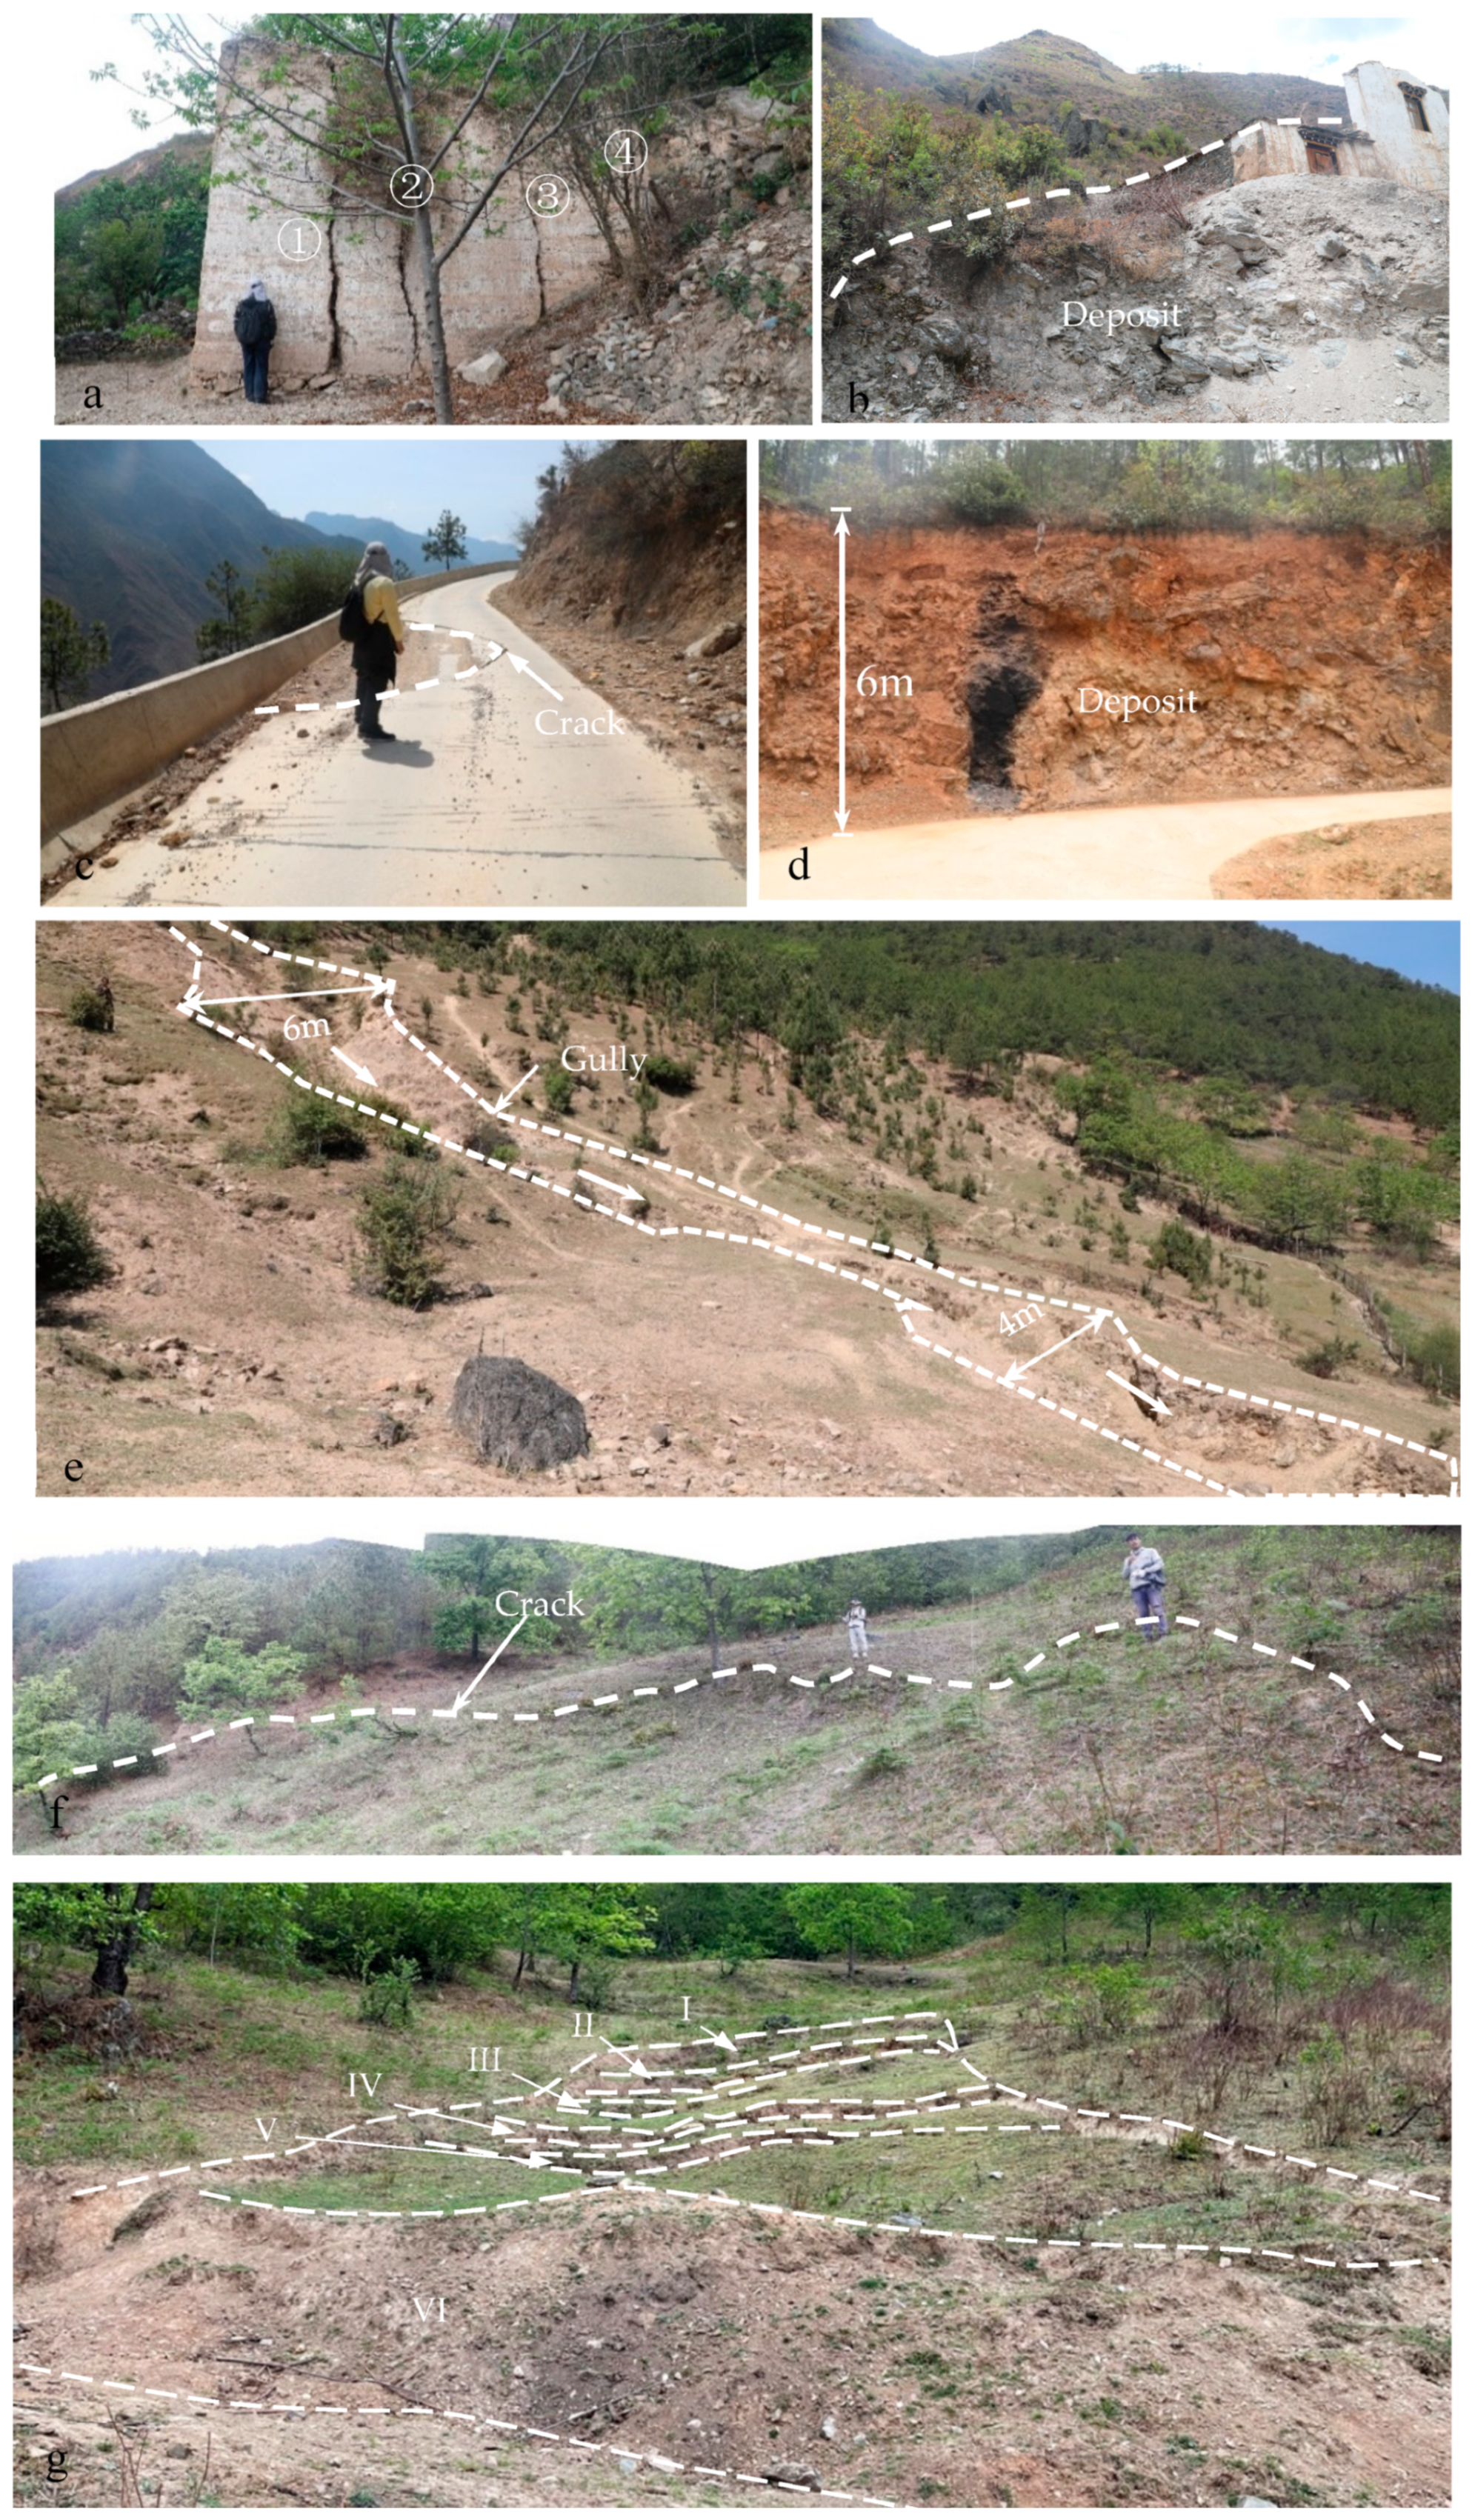
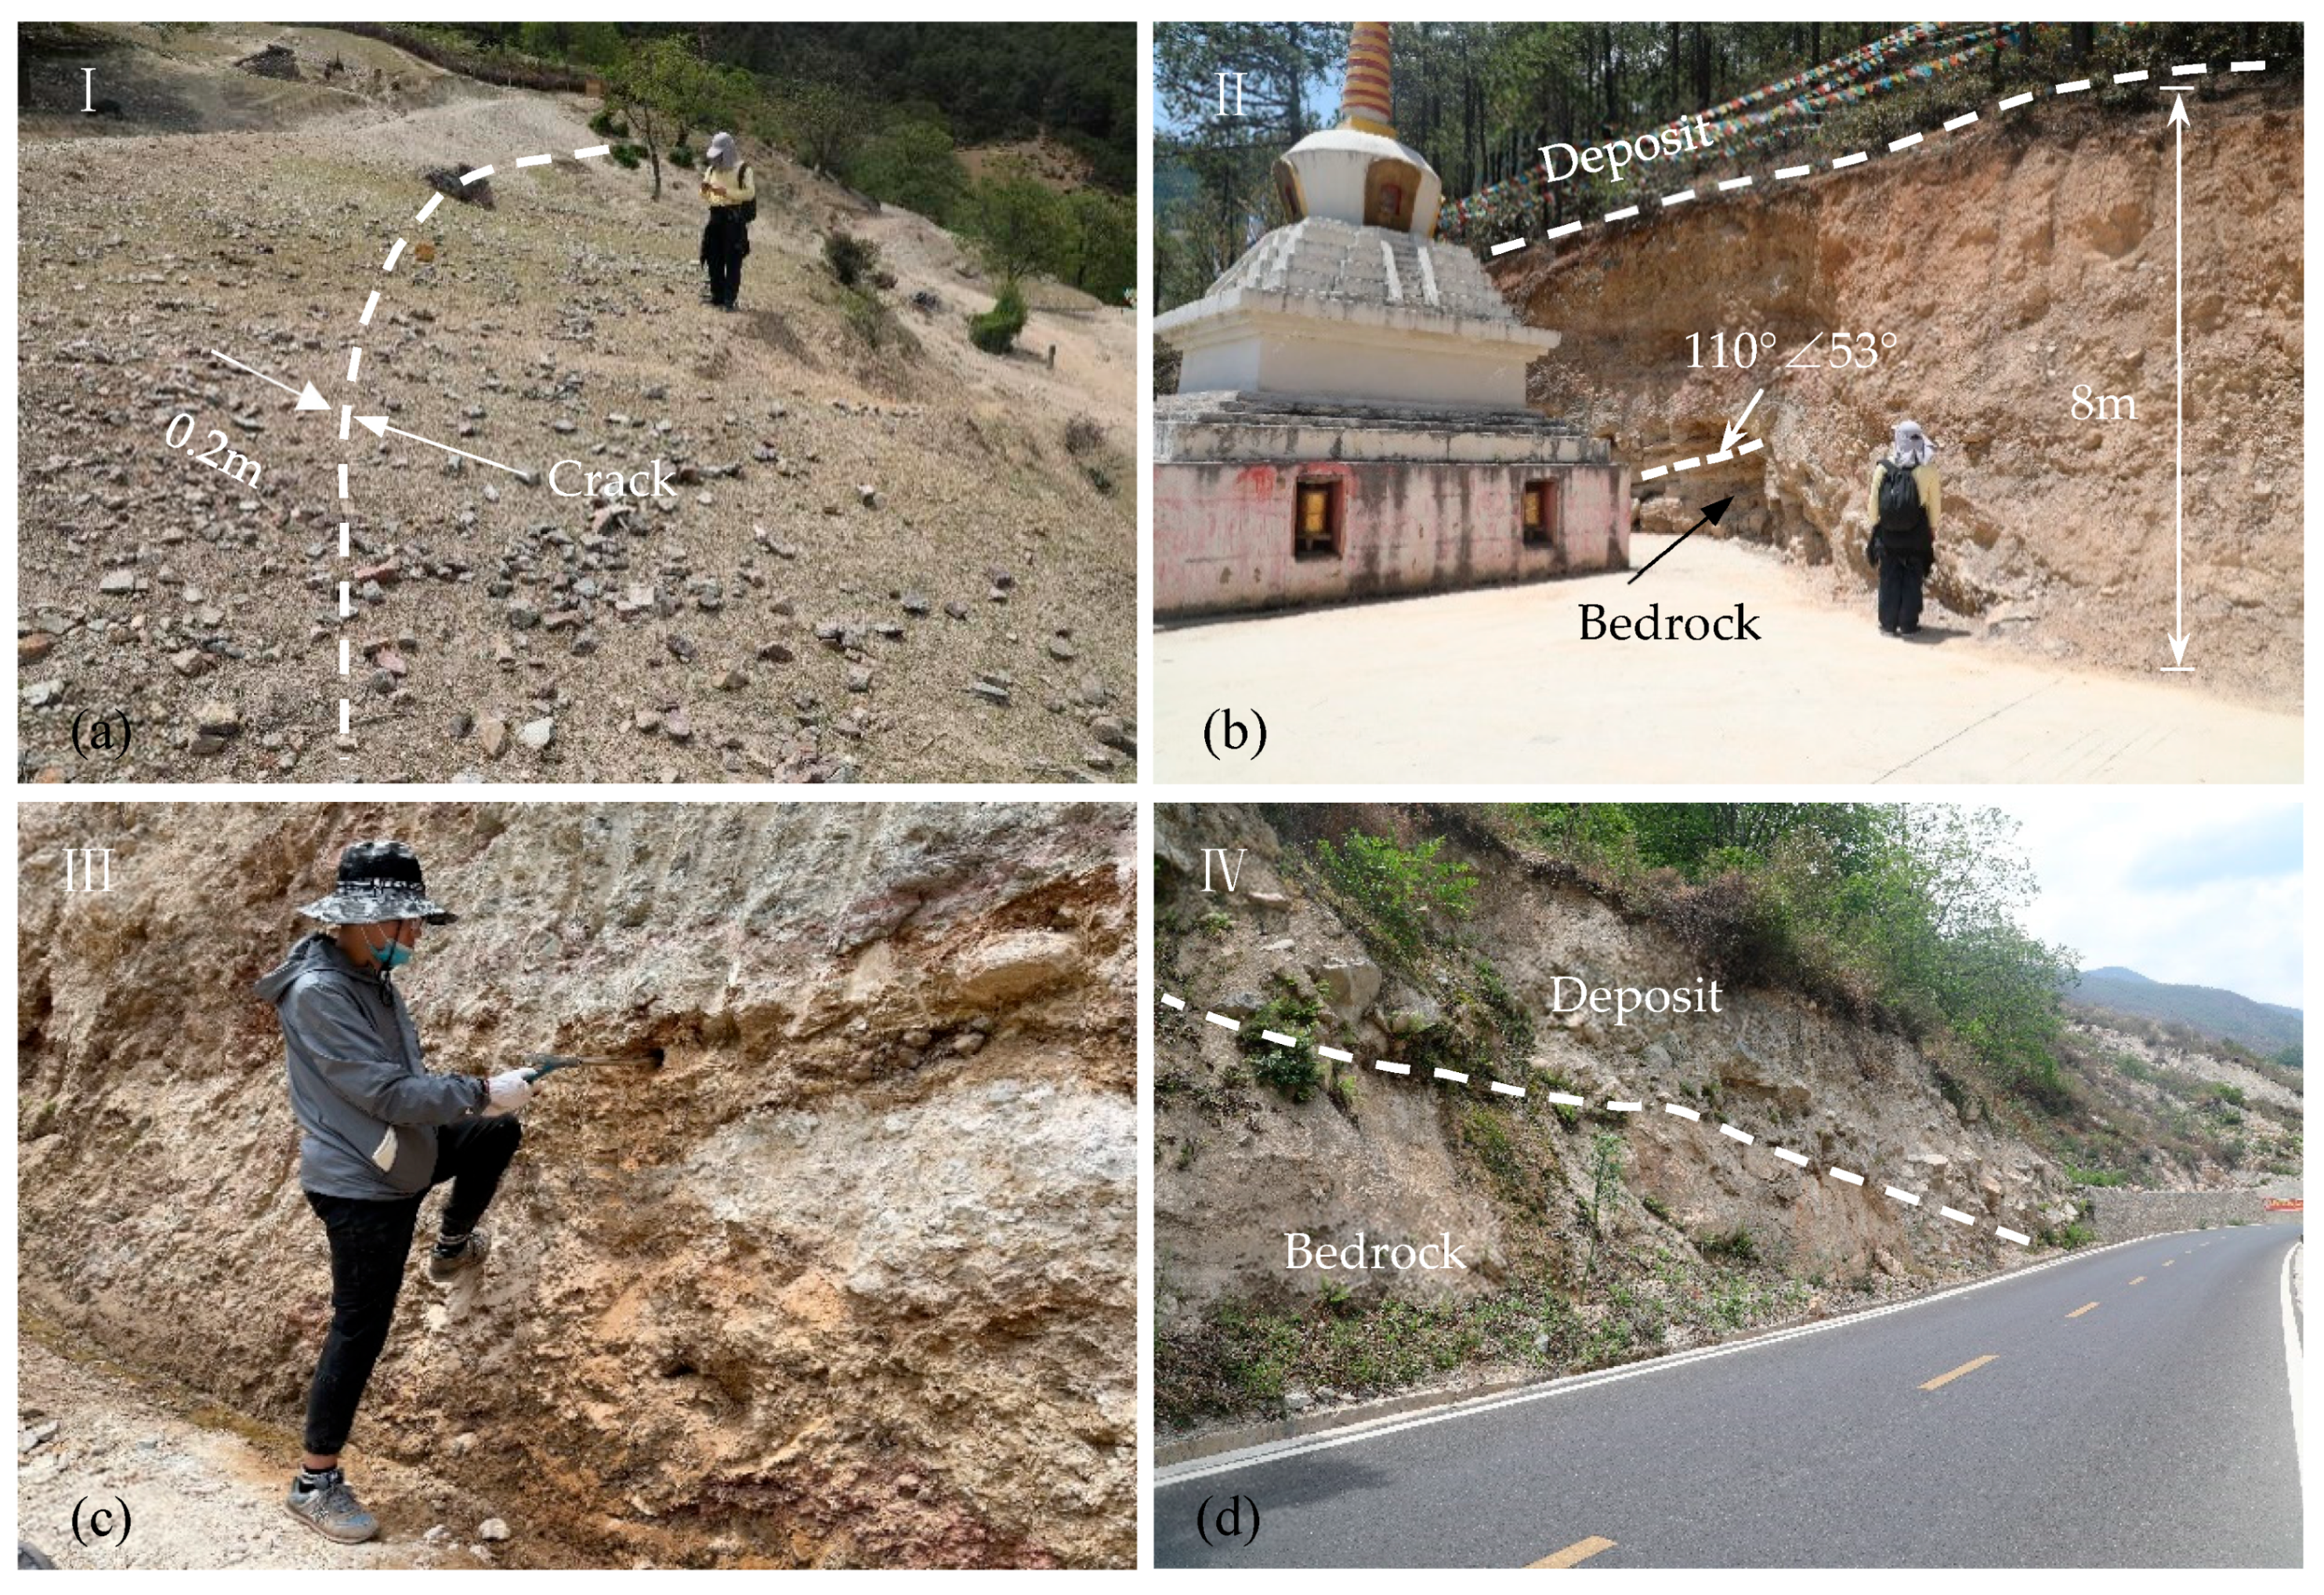
3.2. On-Site Investigation and Mechanism Analysis of Typical Landslides

Six typical landslides including Duila (DL), Kongzhigong (KZG), Jirenhe (JRH), Maopo (MP), Zitongnong (ZTN), and Xiaohekou (XHK) were selected for detailed analysis. According to the interpretation of remote sensing images and SBAS-InSAR deformation rate, DL, KZG, JRH, and MP landsides are local deformation (Figure 5). Combined with the field investigation, the deformation mechanism was further analyzed. The ZTN and XHK landslides are deforming landslides. Due to the influence of dense vegetation, it is difficult to conduct detailed geological investigation. Therefore, the deformation mechanism was preliminarily analyzed based only on the two aspects of remote sensing images and deformation rate.

3.2.1. Old Landslide Deformation Features

The DL and KZG landslides are distributed on the right bank of the Jinsha River under study, and the front edge of the landslide extends to the Jinsha River terrace. The front edge of the landslide has typical river terrace landform characteristics. The JRH and MP landslides are distributed on the left side of the Jinsha River, and the front edge of the JRH landslide extends to the bottom of the valley, while the front edge of the MP landslide is a gentle and open accumulation fan. Four landslides are located near the junction of the Zhongdian-Dagu strike–slip fault, the Tuoding-Kaiwen fault, and the Jinsha River-Honghe thrust fault zone. The KZG, JRH, and MP landslides are crossed by the faults, so the underlying bedrock in this area has poor integrity and is prone to landslides. The main strata in the study area are gray-green micromorphites, sericite micromorphites intercalated with phyllite in the Lower Cambrian System; dolomite, marble intercalated with marl in the Middle and Upper Silurian System; Lower and Middle phyllites, slates, etc.; gray-green phyllites intercalated with micromorphites and dacites in the Upper Permian; and purplish-red conglomerates intercalated with mudstones and limestones in the Upper Triassic. The field investigation found that there was almost no exposed bedrock, and the main material composition was gravel soil. Among them, the overlying strata under DL, JRH, and MP were thin-layered phyllite with low strength, showing moderate to strong weathering, with pores. The medium-thin layer of slate or dolomite in the overlying strata under the KZG landslide is moderately weathered, while the weathered phyllite and dolomite have a higher degree of weathering and lower strength. The slope direction of KZG landslide is 78°, the slope is about 28°, and the rock formation is 102°–135°∠39°–60°. It was found through on-site investigation that in the middle of the intersection of dip angles on the slope outside the steep slope, all rock layers are present. It can be inferred that the deformation mechanism of the DL and KZG landslides is bedding slip with traction failure caused by bedding phyllite slip and bending. The bedrock layer in the upper part of the JRH landslide is 130°∠20°, and the bedrock layer is almost orthogonal to the bank slope. The large angle intersects, and the deformation of the rock stratum caused by thin phyllite is mainly interlayer slip and bending. The long axis direction of the MP landslide is 317°, and the occurrence of the phyllite bedrock layer beneath the landslide body is 195°∠65°, the bedrock layer intersects with the landslide surface at a large angle and slightly inclines to the inside of the slope. Based on this, it is speculated that in the early stage of the JRH landslide and the MP landslide, the fragmentation slopes were cut by multiple groups of structural planes, meaning that the deformation of the accumulation was mainly through the deformation of the structure. The phyllite rock mass was fully disintegrated during the sliding deformation process of the landslide, which eventually leads to instability failure, and the failure mode of it was the creep–pull failure.
The middle and lower reaches of the study area are densely covered with vegetation. Figure 5 shows the landslide deformation rate obtained from ALOS-2 data. ALOS-2 data has better penetrability through vegetation and can monitor the surface deformation in the densely vegetated areas. As can be seen from Figure 5, the local deformation of the four landslides is large and obvious. According to the field investigation results, the boundary of the landslide was finally determined, as shown in the white curve in Figure 5. There are gullies developed on the surface of the DL and KZG landslides, and the deformation is distributed near the gullies. Figure 5a shows that the deformation is distributed in the middle and lower parts of DL. According to the field investigation of the DL landslide (Figure 6a), in the houses seriously damaged by the internal and external sliding of the accumulation near the gully, there are four cracks on the side wall of the house, all of which penetrate through the wall, and they have obvious characteristics of a wide bottom and narrow top. Gullies also appear in the upper part of the JRH landslide. The deformation rate of the JRH landslide is between −12.63 and 14.14 mm/y, and the deformation is mostly located in the middle of the slope (Figure 5a). The upper part of the gullies is 3–6 m wide, 2 m deep, and has a slope of 20°; the lower part is 2–4 m wide and 2 m deep and has a slope of 25.5° (Figure 6e). The material in the gully section is mainly silty sand, and the rest is phyllite crushed stone, with a crushed stone content of about 40%. After on-site verification, part of the surface deformation was found to be caused by the local sliding of the surface rock and soil mass. The sliding mostly formed surface features such as tension cracks, small accumulations, or small steps, as shown in Figure 6c for the KZG landslide. Regarding the small landslide in the direction of the highway, the width of the road is 4.5 m, and the width of the arc-shaped tensile crack at the trailing edge of the landslide is 4 cm. This belongs to the landslide formed by the local instability of the superficial soil mass, which was induced by human engineering activities. Figure 6f is the tension crack of the MP landslide, which is the trailing crack in Figure 6g, with a dislocation height difference of 30–45 cm, a length of about 40 m, a strike of roughly 335°, and an irregular arc shape. Figure 6b shows the deposit of the DL landslide. The exposed material of the deposit here is gravel soil, with crushed stone accounting for about 60%. Poor, angular–sub-angular, and low shrubs can be seen on the surface of the accumulation. Figure 6d shows an artificial excavation slope profile of the KZG landslide. The outcrop height of it is 6 m, and the material composition mainly consists of blocks of stone soil, of which the content of boulders is about 35%. The lithology of the block rock is mainly slate and limestone, the size is mixed, there is no sorting, the particle size is generally 2–10 cm, the larger ones can reach 45 cm, the rounding is poor, they are angular or sub-angular, and the vegetation on the accumulation is flourishing. Figure 6g shows a small soil landslide on MP; according to the field investigation, it is an active landslide, which slides every rainy season and forms a multi-level ledge. The height difference between the trailing edge of the landslide and the point is 12 m, the horizontal distance is 30 m, and the slope is 21.5°. There are six (I–VI) platforms from the upper part to the lower part. The staggered height difference of the I platform is 40 cm, the width of the platform between the I–II sills is 4.3 m, and the length is 9 m. The height difference of the grade III platform sill is 55cm, the width of the platform between grades III and IV is 4.9 m, and the length is 10.7 m. The platform between them is 0.75 m wide and 10.5 m long; the height difference between the V platform sills is 47 cm and the platform between the V–VI platform sills is 8.4 m wide and 25 m long; and the VI platform sills are staggered and the height difference is 2.3 m.

3.2.2. Integral Deforming Landslides

ZTN and XHK landslides (Figure 7) are distributed on the right bank of the Jinsha River. Combining NDVI and Google Earth images, it can be found that the surface vegetation of ZTN and XHK landslides is dense, and the landform of the front edge of landslides is river terrace landform. Due to the influence of vegetation, a detailed field investigation on landslides was not carried out, so the landslide boundary was comprehensively determined by Google image, landform, and SBAS-InSAR (white line in Figure 7). Because ALOS-2 data has strong penetrability through vegetation, the two landslides were identified after data processing by SBAS-InSAR technology. According to the interpretation results, it was found that both the ZTN and XHK landslides had large deformation as a whole and the deformation rate of the two landslides can reach −13 mm/y. The larger deformation area is mainly distributed in the upper and lower parts. According to the distribution of the deformation area, it is inferred that the deformation of the ZTN is caused by the lower rock and soil mass loosening and sliding downward due to the influence of precipitation or human activities, so the landslide is a retrogressive landslide; the deformation of XHK may be due to the fact that the slope is steep and the slope is affected by precipitation, causing the surface rock and soil to loosen and slide downward.

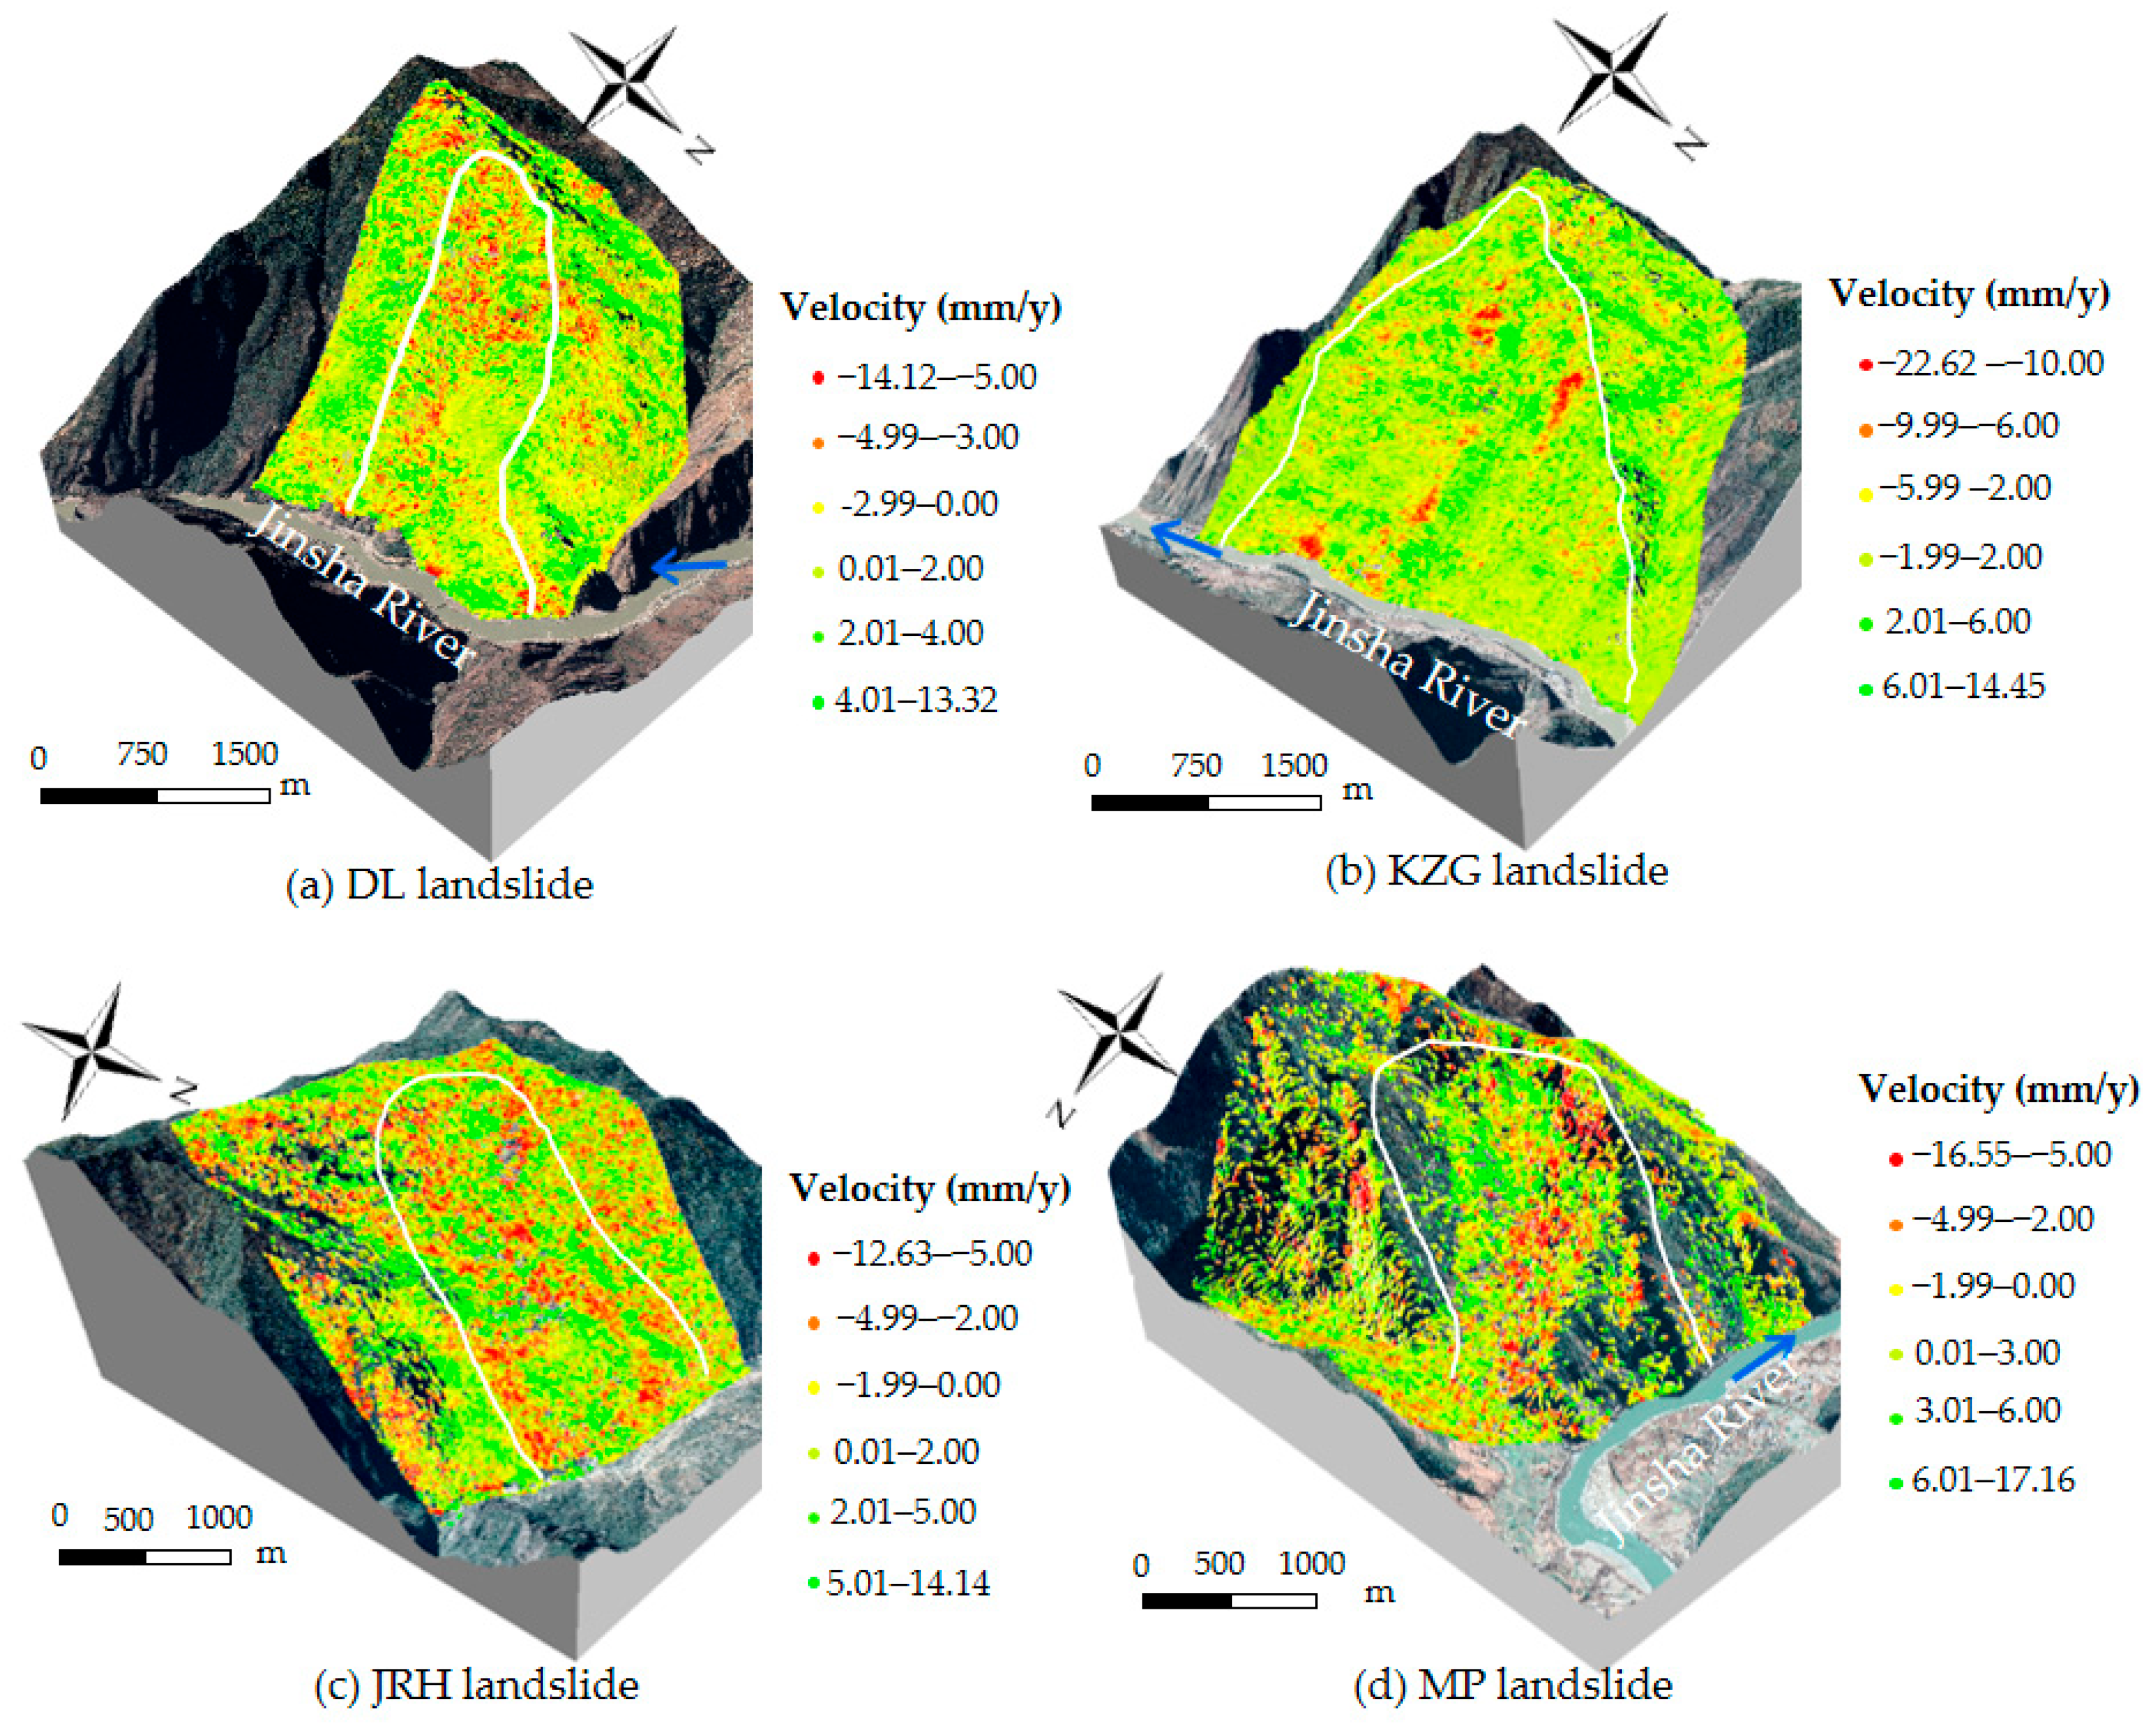
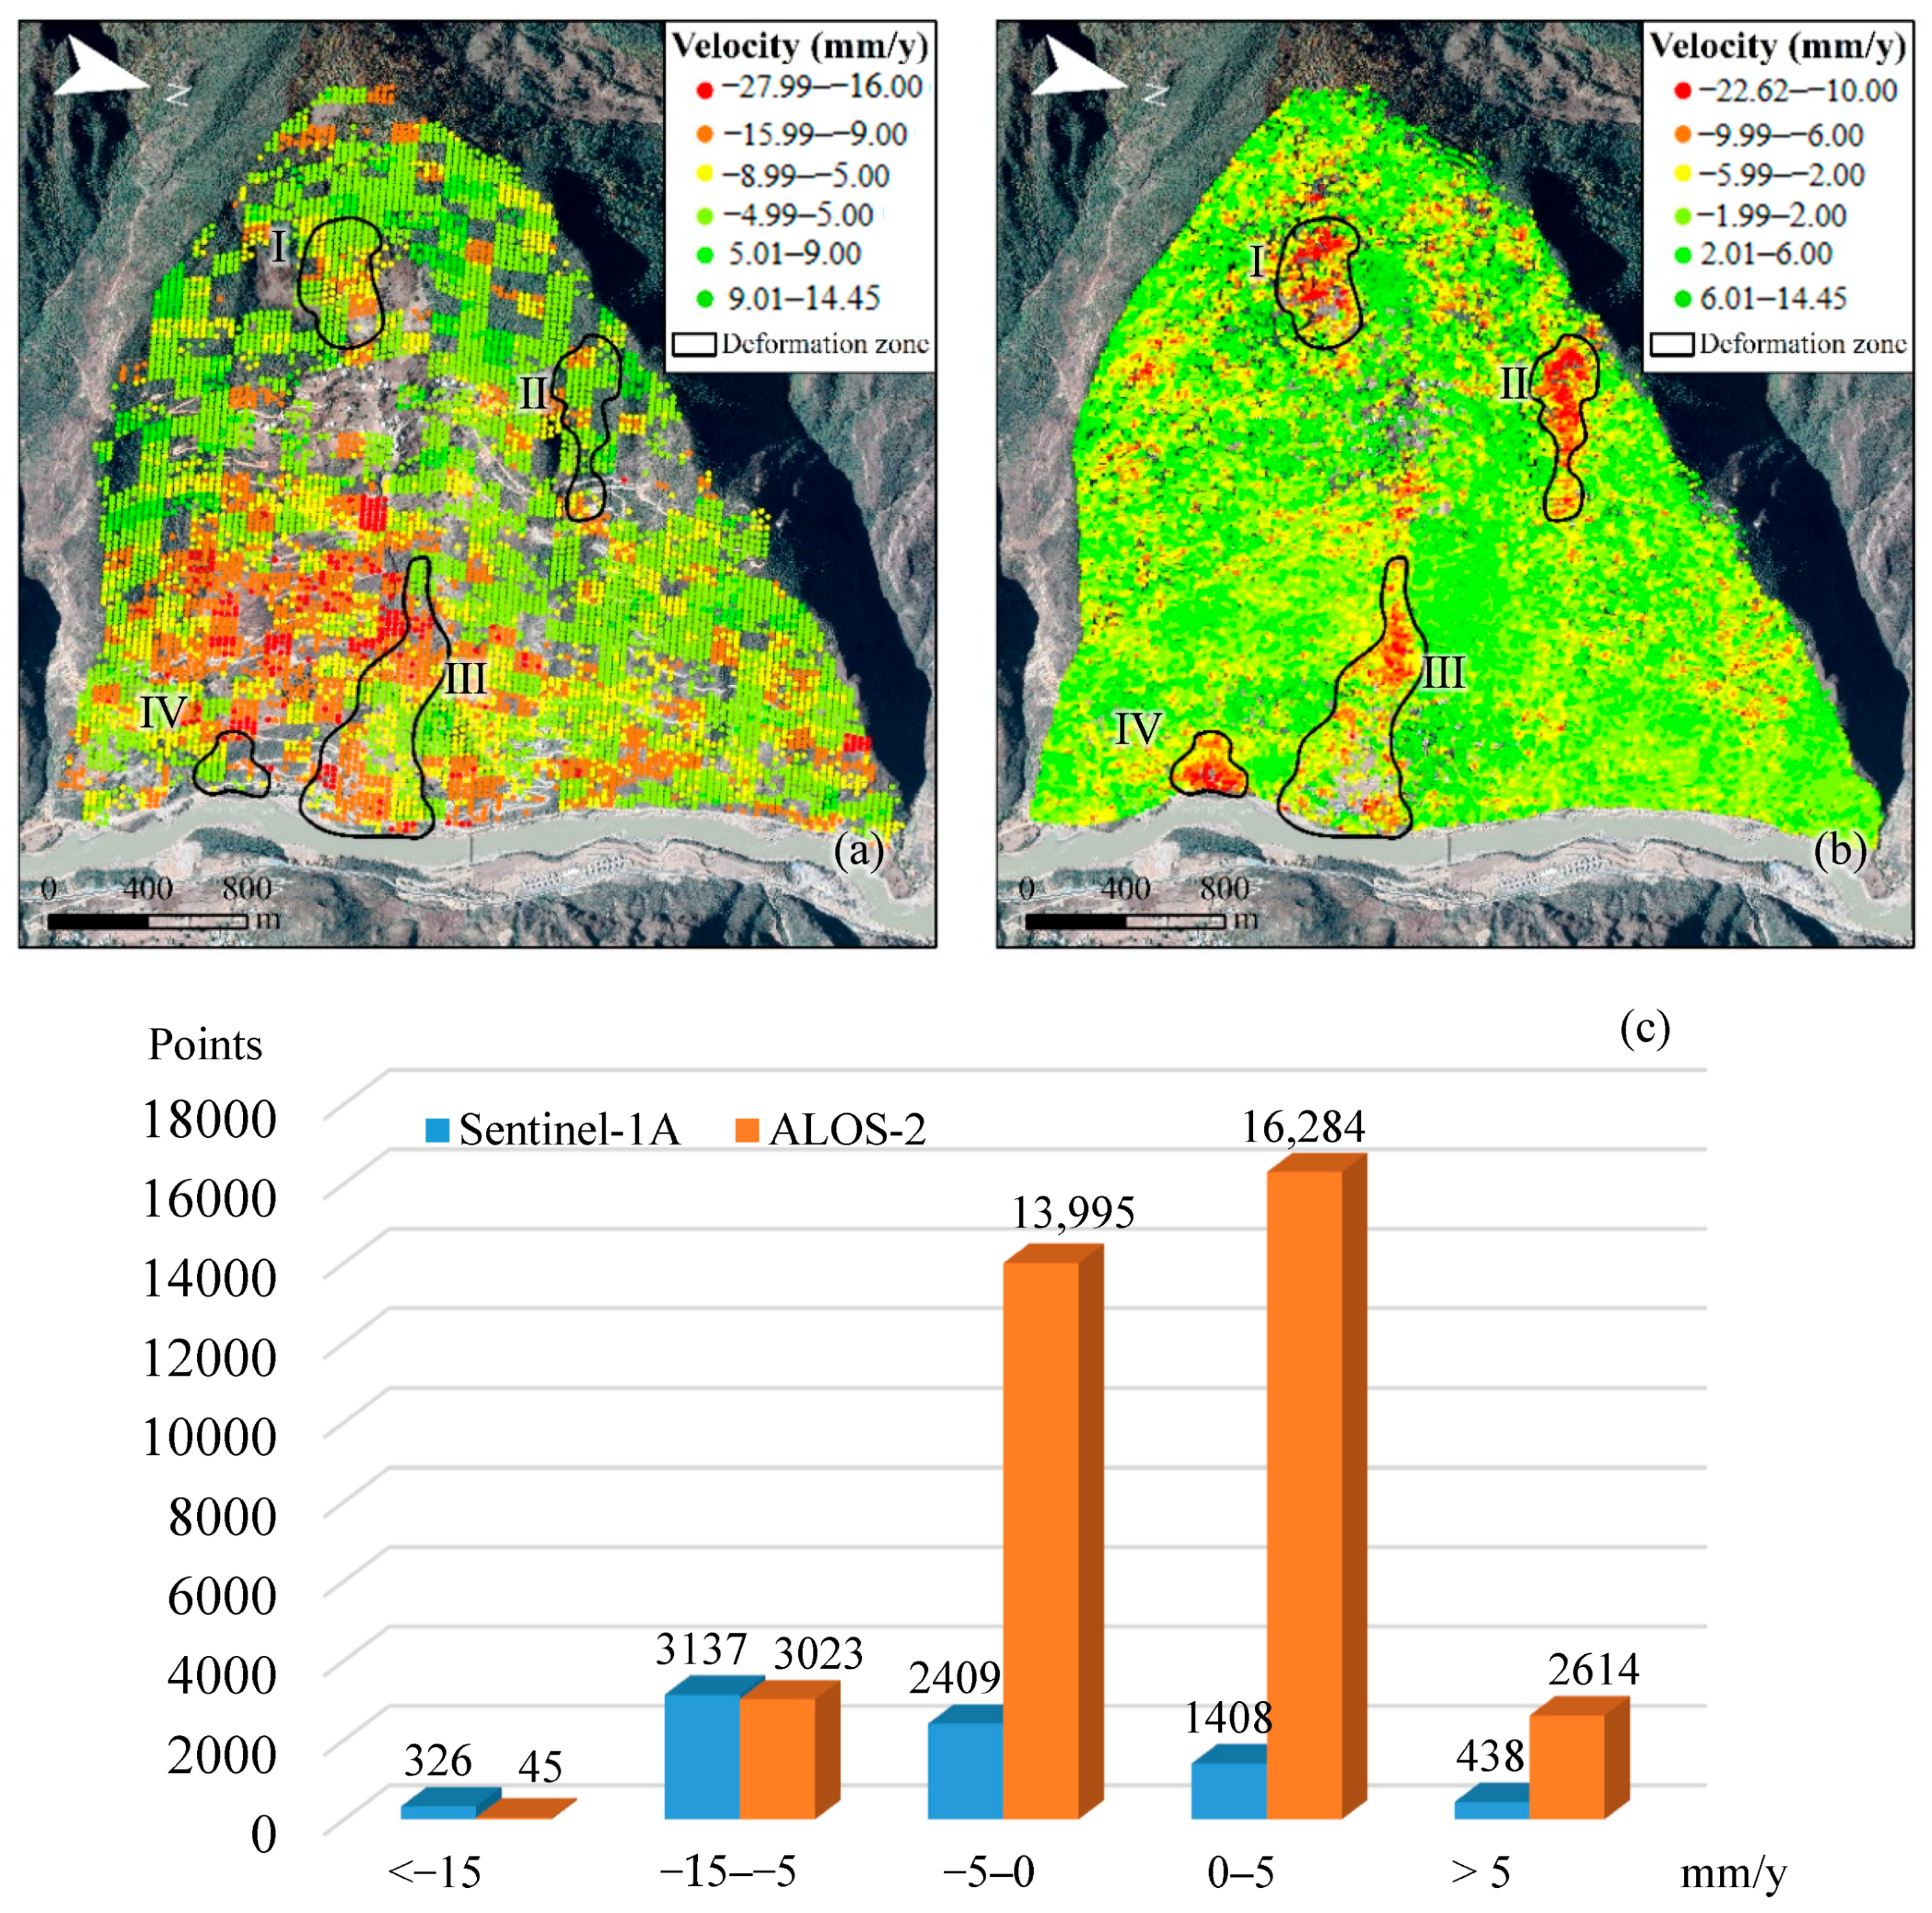
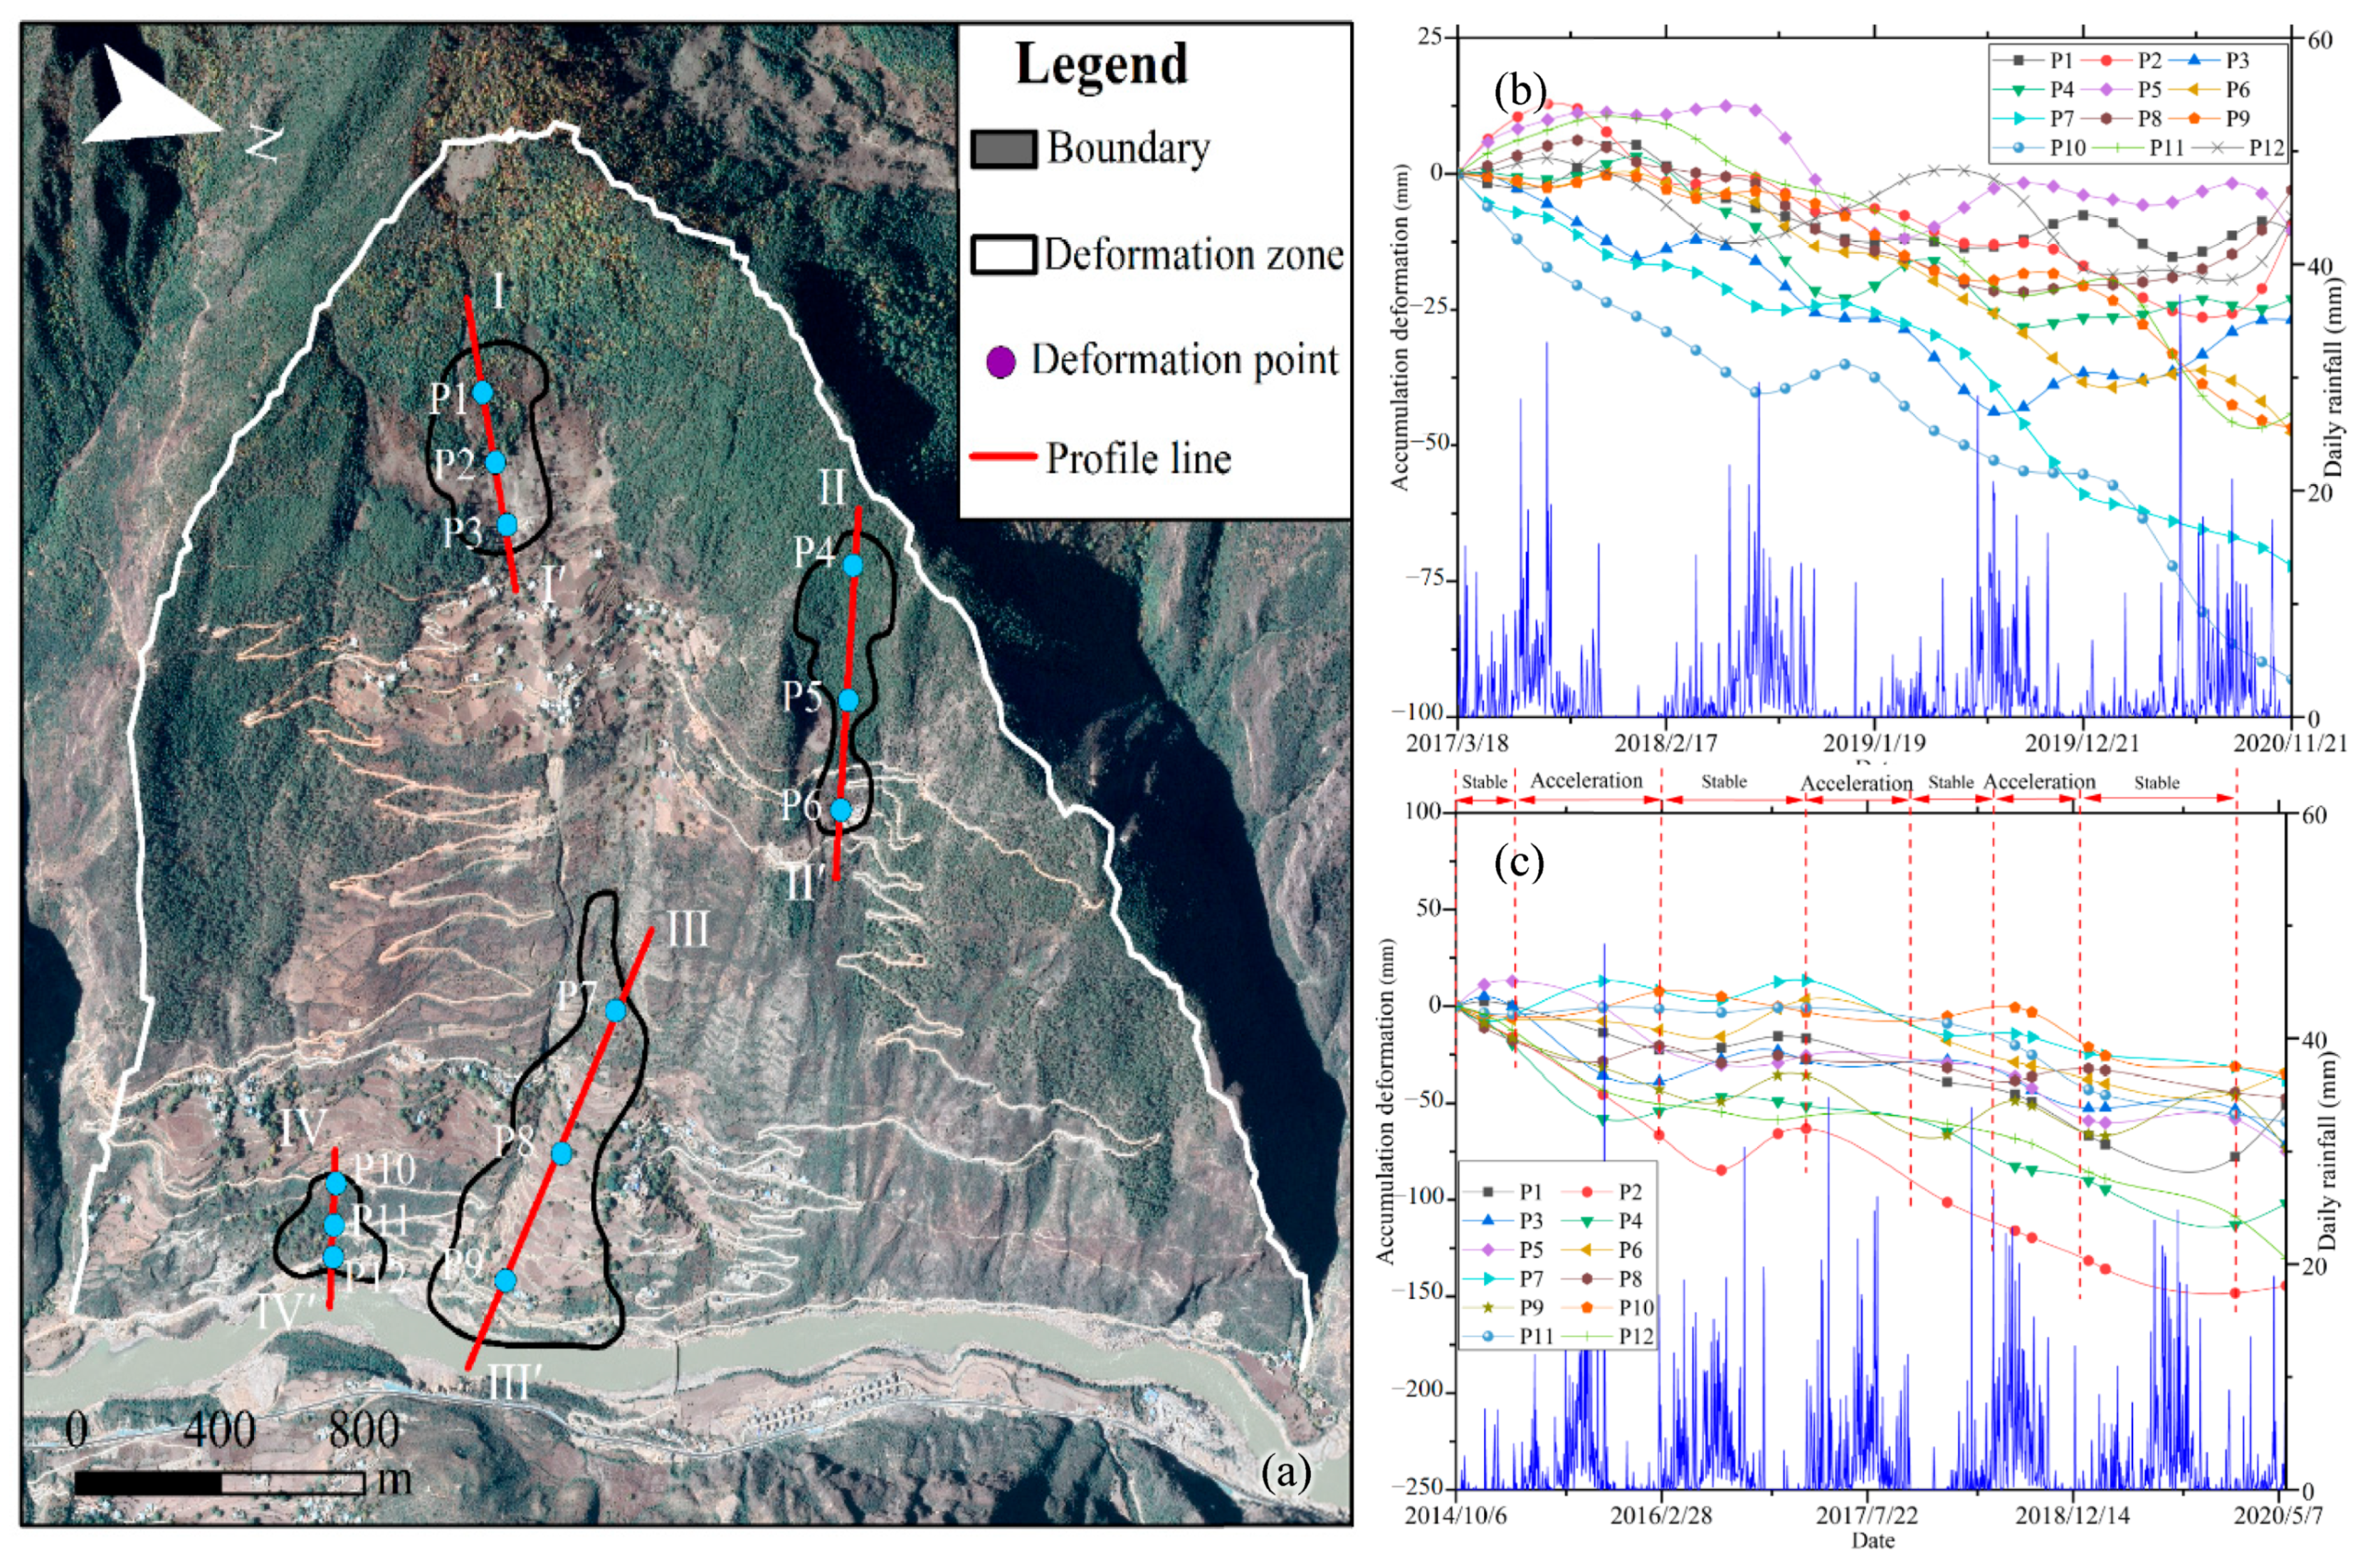
3.3. Deformation Results of KZG Landslide Based on SAR Data

The surface deformation rate of the KZG landslide was obtained by processing Sentinel-1A and ALOS-2 satellite data as shown in Figure 8. From the deformation rate map, it can be seen that the surface deformation rate obtained by Sentinel-1A data is between −27.99 and 14.28 mm/y, and the rate obtained by the ALOS-2 data is between −22.62 and 14.45 mm/y, indicating that the results obtained from the two data are roughly the same in value. In terms of the density of deformation points, the deformation points obtained by Sentinel-1A are relatively scattered and seriously lacking, especially in areas with dense vegetation coverage, with a total of 7715 deformation points, while the results of ALOS-2 data are relatively dense, with a total of 35,961 deformation points. The density of points is significantly greater than that of the Sentinel-1A data, at 4.5 times that of the Sentinel-1A data. The deformation points are counted and divided into five intervals. The statistical results are shown in Figure 8c. Except for the interval with the rate of <−5 mm/y, the number of deformation points obtained by ALOS-2 data is greater than Sentinel-1A. The deformation rate obtained by Sentinel-1A is mainly concentrated at −15–−5 mm/y, with 5546 deformation points, accounting for 71.8% of the total. The deformation rate obtained by ALOS-2 data is mainly concentrated at –5–5mm/y, with 30,278 deformation points, accounting for 84.1% of the total. The number of points is much larger than that of Sentinel-1A in this range. From the distribution of landslide deformation, the result of the ALOS-2 data shows that the deformation is mainly concentrated in four regions of the slope, numbered I to IV (in Figure 8). The deformation results obtained by Sentinel-1A data show that the landslide deformation is mainly concentrated in the middle and lower parts of the slope, and the deformation range is large, making it difficult to obtain the specific deformation area. Comparing Figure 8a,b, except for the III region, there are obvious differences in the deformation of the areas of I, II, and IV.

4. Discussion

InSAR technology is one of the most effective methods for the early identification of potential landslides. In most studies, both Sentinel-1 and ALOS-2 satellite data are used to obtain surface deformation information. In this study, we also selected these two satellite datasets to identify potential landslides in the study area.
In terms of the number of the potential landslides, more landslides can be identified in the study area using ALOS-2 data, while Sentinel-1A data were relatively less applicable, with fewer identifiable landslides. Both Sentinel-1 and ALOS-2 satellites have the advantages of penetrating clouds and all-weather observations. However, there are some different drawbacks and advantages in the identification of potential landslides in large areas. The Sentinel-1 satellite in the C-band has a wavelength of 5.6 cm, with a width of 250 km and a large coverage area. The satellite revisit time is 12 days for a single satellite [12], which ensures the coherence of the data. ALOS-2 is the only operational L-band satellite that can provide high-resolution SAR images, with a width of 70 km and a wavelength of 23.5 cm. The microwave signals of the satellite will be interfered by vegetation, resulting in the decoherence of data and the loss of deformation data [28]. Compared with other SAR sensors, the penetration ability of L-band to vegetation cover is more effective than C and X bands, and it can more accurately detect the change in the ground information [32,41]. Therefore, for the watershed with relatively sparse vegetation, it is more appropriate to use Sentinel-1A data for geological hazard identification with relatively low cost and less data. However, for the upper reaches of Jinsha River with dense vegetation (such as the section from Baishugong to Shangjiangxiang, Figure 4), the ALOS-2 data is more suitable, and the results of the deformation monitoring are more accurate. Additionally, the HH polarization used in ALOS-2 data is more sensitive to surface deformation than the VV polarization used in Sentinel-1A data [42].
Through early identification and field investigation, it was found that the ALOS-2 data, which has a strong penetrating ability through vegetation, has a strong advantage in identifying landslides in alpine and canyon areas covered with dense vegetation.
After on-site investigation and verification and deformation mechanism analysis of the landslides identified in the study area, the deformation mechanisms of the landslides identified in the upstream of the study area are all bedding sliding, and most of the landslides identified in the middle and lower reaches are slip–bending–creep–crack-type landslides, which can be seen in the downstream. Additionally, traction landslides can be found in the lower reach. It is easy to explain this in combination with the distribution of strata and lithology: most of the landslides identified in the upper reaches of the study area are distributed on the right bank of the Jinsha River. On the lateral slope outside the slope, the bedding plane directly affects the stability of the rock slope, and a shear slip plane is easily formed along the bedding plane [43]. The bedding slope is affected by factors such as precipitation and human activities. It is very easy to slip in the lower reaches of the study area; the landslides in the middle and lower reaches of the study area are mainly distributed on the left bank of the Jinsha River, and the landslide rock layers on the left bank tend to be inward, which is conducive to the stability of the slope, but because the underlying bedrock is broken, and the rocks are mostly thin layers with low-strength phyllite, soft rock (phyllite) interlayers may eventually lead to the formation of landslides, and precipitation concentration in the study area plays a key role in the formation of landslides [44], easily expanding and contracting under the action of precipitation. The existence of the phyllite interlayer leads to the reduction in its mechanical strength [45,46,47] and coupled with the steepness of the slope and the influence of human activities, it is very easy to make the surface rock mass of the slope slip. Slip bending occurs, and then develops into a creep–crack-type landslide.
The field investigation found that the areas with large deformation identified by InSAR were mostly tensile cracks, gullies, and accumulations. The small retaining wall in the MP landslide is used to surround a small landslide behind. According to the cracks distributed on the surface of the retaining wall and anti-slide pile, it can be seen that the retaining wall and anti-slide pile play a certain protective role. At the same time, the small landslide is also observed in the continuous deformation; in the large deformation area of KZG, a house with deformation damage was also found. There are four cracks on the side of the house, which are wide at the bottom and narrow at the top. The cracks are obviously caused by the deformation of the ground caused by the deformation of the lower rock and soil. A large deformation occurred in this area, which verifies the reliability of the InSAR identification results.
For the ZTN and XHK landslides, the integral deformation occurs. Due to the dense vegetation on the surface of the landslide, it is impossible to conduct on-site field investigations, and it is impossible to align the deformation mechanism for accurate analysis. According to the distribution of deformation areas obtained by InSAR, it can be seen that most areas with large deformation are concentrated in the slope body. In the lower part, combined with the steep gradient and lithological distribution, it is inferred that most of the landslides in this area are traction landslides. According to historical case studies, some large-scale landslides are the result of the evolution of degenerative landslides. Combined with remote sensing images and field surveys, it is found that the identified landslides (such as the KZG and JRH landslides, etc.) are populated by residents, and most of the identified landslide fronts are built across with carrying traffic. Since the landslides in the study area have already undergone great deformation, they will continue to deform under the influence of rainfall and human activities in the future. Therefore, local government departments need to do a good job in disaster prevention and mitigation work to avoid unnecessary losses.
Twelve deformation points were selected in the areas of I, II, III, and IV to plot the time series curves using Sentinel-1A and ALOS-2 deformation data. As shown in Figure 9b, it can be seen that the deformation of regions I and II is small and mostly maintains a stable state. The deformation occurs mostly in regions III and IV, showing a downward trend, and the deformation variable can reach −95 mm. The deformation was in a state of continuous deformation during the study period and intensified during the rainy season, which can be divided into three stages: accelerated deformation, slow deformation, and accelerated deformation again. The time series deformation curve obtained by ALOS-2 data in October 2014 to May 2020 is shown in Figure 9c; the deformation shows a certain periodicity—that is, from October 2014 to February 2015, the landslide was in a stable state. Then, affected by the rainy season, the rainfall gradually increased, and the landslide was affected by erosion, which made the slope of the curve become larger, and then it was in a state of accelerated deformation. When the rainy season ends, the landslide gradually returns to a stable state, which makes the landslide change periodically during the study period—that is, a stable state, accelerated deformation, and a stable state again. Based on the above analysis, it can be seen that the deformation of the landslide is greatly affected by the erosion of rainwater. Under the action of rainfall, the loose material source on the landslide surface slides down, which causes the slope body to show a downward trend. The results obtained by ALOS-2 data have obvious regularity, showing that the slope deformation is greatly affected by rainfall, and the greater the rainfall is, the more obvious the landslide deformation is. The results of Sentinel-1A data also show the characteristics of rainfall, but the regularity is not obvious. Therefore, ALOS-2 data can better highlight the deformation characteristics of landslides.
As observed during the field investigation, area I is located at the top of the KZG landslide. It can be found that it was a small landslide, which occurred about 5 or 6 years ago. It has an elliptical area, and many fragments are visible, with the length between 3 and 10 cm. A chair-shaped groove can be seen in the lower part of the landslide. It is speculated that this may be the tensile crack at the trailing edge of the landslide (Figure 10a), which is tens of meters long and about 20 cm wide. Affected by surface sedimentation, the crack is basically closed and difficult to identify. With the results of a rainstorm, the crack may develop again and evolve into a new trailing edge tensile fracture. When it is connected to the potential sliding surface inside the accumulation, the landslide may occur. Area II is located on the right edge of the landslide. The deformation of the area is affected by human engineering activities. There is an artificial excavation section with a height of about 8 m. There is a gray-white collapse deposit in the upper part, mostly composed of rock and soil. The bottom is slate bedrock with an occurrence of 110°∠53° and a spacing of 15cm. The bedrock is visible at about 80 m downstream of the slope, and the surface rock mass is seriously broken. Area III is a small accumulation in the middle of the front edge of the landslide. The artificial excavation section is visible inside, with a height of about 10 m. The exposed material is gray-white soil, and occasionally blocks of stones with a particle size of 10–20 cm. In addition, multiple yellow bands can be seen in the profile, which is a staggered zone. Area IV is located in the leading edge of the KZG landslide, where the bedrock lithology is medium-thick dolomitic limestone. The occurrence of the bedding plane is 47°∠58° near the upstream, and 50°∠38°, 70°∠38°, 53°∠60° near the downstream. The spacing of the bedding plane is about 30 cm. The bedding plane is rough, and its integrity is good as a whole. The local fragmentation structure is moderate-weak weathering, and the bank slope structure is a consequent slope outside the steep slope. In addition, two groups of structural planes were developed. One group was outside the steep slope, and the other group was a near-vertical structural plane in the inclined slope, both of which played a cutting role. The upper part of the bedrock is the accumulation body, and its thickness can reach 1.5 m. According to the field investigation results, the deformation in regions I to IV is serious. Therefore, from the deformation rate of slope in Figure 9, it can be seen that the landslide deformation results obtained from ALOS-2 data are more in line with the actual change in slope, and the results are more reliable.
Therefore, although Sentinel-1A data has many advantages, ALOS-2 data is more suitable for identifying potential landslides in the lower reaches of the Jinsha River with dense vegetation and complex geological conditions.

5. Conclusions

In this paper, the typical reach of the Jinsha River from Baishugong to Shangjiangxiang was selected as the study area. Landslides occurred frequently in the region, which can easily lead to river blockages. Therefore, it is necessary to identify potential landslides in the study area.
The SBAS-InSAR technology was used to obtain the surface deformation information of the study area. Then, potential landslides were identified, and the identification results were verified by field investigation. Thirteen potential landslides were identified using C-band Sentinel-1A data and L-band ALOS-2 satellite data. Most of them were distributed on the right bank of the Jinsha River, and the slope was between 20° and 40°. Twelve potential landslides were identified by ALOS-2 data, two landslides were identified by Sentinel-1A data, and KZG landslide was identified by both data. The vegetation in the north of the study area is sparse and the vegetation in the south is dense, so there are more landslides in the north, and the landslides identified by Sentinel-1A data are all in the north. Therefore, in terms of quantity and vegetation penetration ability, ALOS-2 data can identify more landslides, having good applicability.
The field investigation showed that the potential landslides were deformed, which confirmed the reliability of the results. Combined with remote sensing data and field investigation, the deformation mechanisms of the DL landslide and KZG landslide are bedding slip, and those of the JRH landslide and MP landslide are creep–pull failure. Through the analysis of the deformation results of the two datasets for the KZG landslide, it was found that the ALOS-2 data results are relatively dense, and there are four deformation zones in the landslide, while the Sentienl-1A data results are relatively dispersed, and the deformation zone is different from the ALOS-2 results, where only region III has deformation. Therefore, the field investigation and time series analysis of these areas showed that the deformation of KZG landslide is serious and still in a state of deformation, and its deformation is affected by rainfall and human activities. Areas I to IV are deformed and seriously damaged, indicating that ALOS-2 data are more reliable and more suitable for identifying potential landslides in areas with complex terrain and dense vegetation cover.
Comparing the advantages of ALOS-2 and Sentinel-1A data and the identification results of potential landslides, ALOS-2 data have higher reliability, applicability, and advantages in the identification of potential landslides in areas with dense vegetation and complex geological conditions similar to the study area. The research can provide a basis for the use and selection of satellite data for potential landslide identification in alpine and canyon areas, so as to carry out effective disaster prevention and reduction, which has important practical significance.

Author Contributions

Conceptualization, C.C. and K.Z.; methodology, T.S. and J.B.; software, K.Z.; validation, C.C., K.Z. and J.B.; formal analysis, W.Z.; investigation, J.C.; resources, C.C.; data curation, C.C.; writing—original draft preparation, K.Z., T.S. and J.B.; writing—review and editing, C.C.; visualization, C.C., K.Z., T.S. and B.J; supervision, W.Z.; project administration, C.C.; funding acquisition, C.C., W.Z., J.C. and S.S. All authors have read and agreed to the published version of the manuscript.

Funding

This research was funded by the 2nd Research Announcement on the Earth Observations (EO-RA2) (NO. ER2A2N110, 2019.04–2022.04), the Interdisciplinary Integration and Innovation Project of Jilin University (JLUXKJC2021ZZ17), and the National Nature Science Foundation of China (No. 42022053, 41877220, 42007261).

Acknowledgments

Thanks to the ALOS-2 and Sentinel-1A data provided by the Japan Aerospace Exploration Agency (JAXA) and the European Space Agency (ESA) respectively, which ensured the success of the study.

Conflicts of Interest

The authors declare no conflict of interest.

References

  1. Zhang, L.; Dai, K.; Deng, J.; Ge, D.; Liang, R.; Li, W.; Xu, Q. Identifying Potential Landslides by Stacking-InSAR in Southwestern China and Its Performance Comparison with SBAS-InSAR. Remote Sens. 2021, 13, 3662. [Google Scholar] [CrossRef]
  2. Wang, Y.; Zhao, B.; Li, J. Mechanism of the catastrophic June 2017 landslide at Xinmo Village, Songping River, Sichuan Province, China. Landslides 2018, 15, 333–345. [Google Scholar] [CrossRef]
  3. Chen, J.; Peng, W.; Sun, X.; Wang, Q.; Han, X. Comparisons of several methods for landslide susceptibility mapping: Case of the Benzilan and Waka Towns, Southwest China. Arab. J. Geosci. 2021, 14, 1622. [Google Scholar] [CrossRef]
  4. Sun, X.; Han, X.; Chen, J.; Bao, Y.; Peng, W. Numerical simulation of the Qulong Paleolandslide Dam event in the late pleistocene using the finite volume type shallow water model. Nat. Hazards 2022, 111, 439–464. [Google Scholar] [CrossRef]
  5. Larsen, I.J.; Montgomery, D.R. Landslide erosion coupled to tectonics and river incision. Nat. Geosci. 2012, 5, 468–473. [Google Scholar] [CrossRef]
  6. Li, Y.; Chen, J.; Zhou, F.; Li, Z.; Mehmood, Q. Stability evaluation and potential damage of a giant paleo-landslide deposit at the East Himalayan Tectonic Junction on the Southeastern margin of the Qinghai-Tibet Plateau. Nat. Hazards 2022, 111, 2117–2140. [Google Scholar] [CrossRef]
  7. Tian, S.; Chen, N.; Wu, H.; Yang, C.; Zhong, Z.; Rahman, M. New insights into the occurrence of the Baige landslide along the Jinsha River in Tibet. Landslides 2020, 17, 1207–1216. [Google Scholar] [CrossRef]
  8. Yao, J.M.; Lan, H.X.; Li, L.P.; Cao, Y.M.; Wu, Y.M.; Zhang, Y.X.; Zhou, C.D. Characteristics of a rapid landsliding area along Jinsha River revealed by multi-temporal remote sensing and its risks to Sichuan-Tibet railway. Landslides 2022, 19, 703–718. [Google Scholar] [CrossRef]
  9. Chen, J.; Dai, F.; Lv, T.; Cui, Z. Holocene landslide-dammed lake deposits in the Upper Jinsha River, SE Tibetan Plateau and their ages. Quat. Int. 2013, 298, 107–113. [Google Scholar] [CrossRef]
  10. Yan, J.; Chen, J.; Zhou, F.; Li, Y.; Zhang, Y.; Gu, F.; Zhang, Y.; Li, Y.; Li, Z.; Bao, Y.; et al. Numerical simulation of the Rongcharong paleolandslide river-blocking event: Implication for the longevity of the landslide dam. Landslides 2022. [Google Scholar] [CrossRef]
  11. Adnan, M.S.G.; Rahman, M.S.; Ahmed, N.; Ahmed, B.; Rabbi, M.F.; Rahman, R.M. Improving Spatial Agreement in Machine Learning-Based Landslide Susceptibility Mapping. Remote Sens. 2020, 12, 3347. [Google Scholar] [CrossRef]
  12. Zhu, K.; Xu, P.; Cao, C.; Zheng, L.; Liu, Y.; Dong, X. Preliminary Identification of Geological Hazards from Songpinggou to Feihong in Mao County along the Minjiang River Using SBAS-InSAR Technique Integrated Multiple Spatial Analysis Methods. Sustainability 2021, 13, 1017. [Google Scholar] [CrossRef]
  13. Chen, D.; Chen, H.; Zhang, W.; Cao, C.; Zhu, K.; Yuan, X.; Du, Y. Characteristics of the Residual Surface Deformation of Multiple Abandoned Mined-Out Areas Based on a Field Investigation and SBAS-InSAR: A Case Study in Jilin, China. Remote Sens. 2020, 12, 3752. [Google Scholar] [CrossRef]
  14. Sterlacchini, S.; Ballabio, C.; Blahut, J.; Masetti, M.; Sorichetta, A. Spatial agreement of predicted patterns in landslide susceptibility maps. Geomorphology 2011, 125, 51–61. [Google Scholar] [CrossRef]
  15. Guzzetti, F.; Reichenbach, P.; Ardizzone, F.; Cardinali, M.; Galli, M. Estimating the quality of landslide susceptibility models. Geomorphology 2006, 81, 166–184. [Google Scholar] [CrossRef]
  16. Rossi, M.; Guzzetti, F.; Reichenbach, P.; Mondini, A.C.; Peruccacci, S. Optimal landslide susceptibility zonation based on multiple forecasts. Geomorphology 2010, 114, 129–142. [Google Scholar] [CrossRef]
  17. Zhao, C.; Lu, Z.; Zhang, Q.; de la Fuente, J. Large-area landslide detection and monitoring with ALOS/PALSAR imagery data over Northern California and Southern Oregon, USA. Remote Sens. Environ. 2012, 124, 348–359. [Google Scholar] [CrossRef]
  18. Ren, T.; Gong, W.; Gao, L.; Zhao, F.; Cheng, Z. An Interpretation Approach of Ascending-Descending SAR Data for Landslide Identification. Remote Sens. 2022, 14, 1299. [Google Scholar] [CrossRef]
  19. Guo, L.; Gong, H.; Li, J.; Zhu, L.; Xue, A.; Liao, L.; Sun, Y.; Li, Y.; Zhang, Z.; Hu, L.; et al. Understanding Uneven Land Subsidence in Beijing, China, Using a Novel Combination of Geophysical Prospecting and InSAR. Geophys. Res. Lett. 2020, 47, e2020GL088676. [Google Scholar] [CrossRef]
  20. Liu, F.; Elliott, J.R.; Craig, T.J.; Hooper, A.; Wright, T.J. Improving the Resolving Power of InSAR for Earthquakes Using Time Series: A Case Study in Iran. Geophys. Res. Lett. 2021, 48, e2021GL093043. [Google Scholar] [CrossRef]
  21. Zhou, J.; Li, Z.; Li, X.; Liu, S.; Chen, Q.; Xie, C.; Tian, B. Movement estimate of the Dongkemadi Glacier on the Qinghai-Tibetan Plateau using L-band and C-band spaceborne SAR data. Int. J. Remote Sens. 2011, 32, 6911–6928. [Google Scholar] [CrossRef]
  22. Motagh, M.; Wetzel, H.-U.; Roessner, S.; Kaufmann, H. A TerraSAR-X InSAR study of landslides in southern Kyrgyzstan, Central Asia. Remote Sens. Lett. 2013, 4, 657–666. [Google Scholar] [CrossRef]
  23. Catani, F.; Farina, P.; Moretti, S.; Nico, G.; Strozzi, T. On the application of SAR interferometry to geomorphological studies: Estimation of landform attributes and mass movements. Geomorphology 2005, 66, 119–131. [Google Scholar] [CrossRef]
  24. Ng, A.H.-M.; Ge, L.; Du, Z.; Wang, S.; Ma, C. Satellite radar interferometry for monitoring subsidence induced by longwall mining activity using Radarsat-2, Sentinel-1 and ALOS-2 data. Int. J. Appl. Earth Obs. Geoinf. 2017, 61, 92–103. [Google Scholar] [CrossRef]
  25. Minh, D.H.T.; Tran, Q.C.; Pham, Q.N.; Dang, T.T.; Nguyen, D.A.; El-Moussawi, I.; Toan, T.L. Measuring Ground Subsidence in Ha Noi Through the Radar Interferometry Technique Using TerraSAR-X and Cosmos SkyMed Data. IEEE J. Sel. Top. Appl. Earth Obs. Remote Sens. 2019, 12, 3874–3884. [Google Scholar] [CrossRef]
  26. Hanssen, R.F.; Weckwerth, T.M.; Zebker, H.A.; Klees, R. High-resolution water vapor mapping from interferometric radar measurements. Science 1999, 283, 1297–1299. [Google Scholar] [CrossRef] [Green Version]
  27. Chen, Z.; White, L.; Banks, S.; Behnamian, A.; Montpetit, B.; Pasher, J.; Duffe, J.; Bernard, D. Characterizing marsh wetlands in the Great Lakes Basin with C-band InSAR observations. Remote Sens. Environ. 2020, 242, 111750. [Google Scholar] [CrossRef]
  28. Cao, C.; Zhang, W.; Chen, J.; Shan, B.; Song, S.; Zhan, J. Quantitative estimation of debris flow source materials by integrating multi-source data: A case study. Eng. Geol. 2021, 291, 106222. [Google Scholar] [CrossRef]
  29. Arikawa, Y.; Kankaku, Y.; Saruwatari, H.; Hatooka, Y.; Suzuki, S. ALOS-2 launch and initial checkout status. In Proceedings of the Conference on Sensors, Systems, and Next-Generation Satellites XVIII, Amsterdam, The Netherlands, 22–25 September 2014. [Google Scholar]
  30. Darwish, N.; Kaiser, M.; Koch, M.; Gaber, A. Assessing the Accuracy of ALOS/PALSAR-2 and Sentinel-1 Radar Images in Estimating the Land Subsidence of Coastal Areas: A Case Study in Alexandria City, Egypt. Remote Sens. 2021, 13, 1838. [Google Scholar] [CrossRef]
  31. Cui, H.; Jiang, L.; Paloscia, S.; Santi, E.; Pettinato, S.; Wang, J.; Fang, X.; Liao, W. The Potential of ALOS-2 and Sentinel-1 Radar Data for Soil Moisture Retrieval With High Spatial Resolution Over Agroforestry Areas, China. IEEE Trans. Geosci. Remote Sens. 2022, 60, 1–17. [Google Scholar] [CrossRef]
  32. Sekertekin, A.; Marangoz, A.M.; Abdikan, S. ALOS-2 and Sentinel-1 SAR data sensitivity analysis to surface soil moisture over bare and vegetated agricultural fields. Comput. Electron. Agric. 2020, 171, 105303. [Google Scholar] [CrossRef]
  33. Xiong, Z.; Feng, G.; Feng, Z.; Miao, L.; Wang, Y.; Yang, D.; Luo, S. Pre- and post-failure spatial-temporal deformation pattern of the Baige landslide retrieved from multiple radar and optical satellite images. Eng. Geol. 2020, 279, 105880. [Google Scholar] [CrossRef]
  34. Dong, J.; Zhang, L.; Li, M.; Yu, Y.; Liao, M.; Gong, J.; Luo, H. Measuring precursory movements of the recent Xinmo landslide in Mao County, China with Sentinel-1-and ALOS-2 PALSAR-2 datasets. Landslides 2018, 15, 135–144. [Google Scholar] [CrossRef]
  35. Bayik, C.; Abdikan, S.; Ozdemir, A.; ArIkan, M.; Sanli, F.B.; Dogan, U. Investigation of the landslides in Beylikduzu-Esenyurt Districts of Istanbul from InSAR and GNSS observations. Nat. Hazards 2021, 109, 1201–1220. [Google Scholar] [CrossRef]
  36. Chen, Y.; Sun, Q.; Hu, J. Quantitatively Estimating of InSAR Decorrelation Based on Landsat-Derived NDVI. Remote Sens. 2021, 13, 2440. [Google Scholar] [CrossRef]
  37. Vafaei, S.; Soosani, J.; Adeli, K.; Fadaei, H.; Naghavi, H.; Pham, T.D.; Bui, D.T. Improving Accuracy Estimation of Forest Aboveground Biomass Based on Incorporation of ALOS-2 PALSAR-2 and Sentinel-2A Imagery and Machine Learning: A Case Study of the Hyrcanian Forest Area (Iran). Remote Sens. 2018, 10, 172. [Google Scholar] [CrossRef] [Green Version]
  38. Berardino, P.; Fornaro, G.; Lanari, R.; Sansosti, E. A new algorithm for surface deformation monitoring based on small baseline differential SAR interferograms. IEEE Trans. Geosci. Remote Sens. 2002, 40, 2375–2383. [Google Scholar] [CrossRef] [Green Version]
  39. Lanari, R.; Mora, O.; Manunta, M.; Mallorquí, J.J.; Berardino, P.; Sansosti, E. A Small-Baseline Approach for Investigating Deformations on Full-Resolution Differential SAR Interferograms. IEEE Trans. Geosci. Remote Sens. 2004, 42, 1377–1386. [Google Scholar] [CrossRef]
  40. Sezer, E.A.; Pradhan, B.; Gokceoglu, C. Manifestation of an adaptive neuro-fuzzy model on landslide susceptibility mapping: Klang valley, Malaysia. Expert Syst. Appl. 2011, 38, 8208–8219. [Google Scholar] [CrossRef]
  41. Zhang, T.; Xie, S.; Fan, J.; Huang, B.; Wang, Q.; Yuan, W.; Zhao, H.; Chen, J.; Li, H.; Liu, G.; et al. Detection of Active Landslides in Southwest China using Sentinel-1A and ALOS-2 Data. Procedia Comput. Sci. 2021, 181, 1138–1145. [Google Scholar] [CrossRef]
  42. Holah, N.; Baghdadi, N.; Zribi, M.; Bruand, A.; King, C. Potential of ASAR/ENVISAT for the characterization of soil surface parameters over bare agricultural fields. Remote Sens. Environ. 2005, 96, 78–86. [Google Scholar] [CrossRef] [Green Version]
  43. Luo, G.; Hu, X.; Gu, C.; Wang, Y. Numerical simulations of kinetic formation mechanism of Tangjiashan landslide. J. Rock Mech. Geotech. Eng. 2012, 4, 149–159. [Google Scholar] [CrossRef] [Green Version]
  44. Zhao, J.; Yu, J.; ML, X.; HJ, C.; Tao, L.; Fan, B.; Bing, L. Physical model studies on fill embankment slope deformation mechanism under rainfall condition. Rock Soil Mech. 2018, 39, 2933–2940. [Google Scholar] [CrossRef]
  45. Skempton, A.W. Long-Term Stability of Clay Slopes. Géotechnique 1964, 14, 77–102. [Google Scholar] [CrossRef] [Green Version]
  46. Shuzui, H. Process of slip-surface development and formation of slip-surface clay in landslides in Tertiary volcanic rocks, Japan. Eng. Geol. 2001, 61, 199–219. [Google Scholar] [CrossRef]
  47. Sun, S.; Huang, R.; CJ, Z.; XJ, P. Types and formation law of structural planes of Emeishan basalt in Sichuan, China. Chengdu Univ. Technol. 2015, 42, 463–475. [Google Scholar] [CrossRef]
Figure 1. (a) The geographical location of the study area; (b) the coverage of the ALOS-2 and Sentinel-1A data; (c) the geological map of the study area.
Remotesensing 14 01962 g001
Figure 2. (a) Time−baseline of interferometric pairs of Sentinel-1A images; (b) time−baseline of interferometric pairs of ALOS-2 images; (c) SBAS-InSAR processing flow chart.
Remotesensing 14 01962 g002
Figure 3. (a) Distribution of potential landslides interpreted from ALOS-2 data and (b) distribution of potential landslides interpreted from Sentinel-1A data.
Remotesensing 14 01962 g003
Figure 4. The NDVI value (a) and slope (b) of the study area.
Remotesensing 14 01962 g004
Figure 5. Deformation features of old landslide deposits with ALOS-2 data.
Remotesensing 14 01962 g005
Figure 6. Field investigation of old landslide deposits. (a) Cracks on the surface of the house; (b) the downstream boundary of the deposit; (c) a small landslide in the free direction of the highway; (d) a typical section at the top of the downstream side of the KZG Village; (e) the gully between platform IV and platform V; (f) a tension crack in MP landslide; (g) a small soil landslide in MP landslide.
Remotesensing 14 01962 g006
Figure 7. Deformation features of potential landslides with ALOS-2 data.
Remotesensing 14 01962 g007
Figure 8. Deformation details and features of the KZG landslide with different data: (a) Sentinel-1A data, (b) ALOS-2 data, and (c) statistical diagram of deformation points.
Remotesensing 14 01962 g008
Figure 9. Time series deformation of KZG landslide, (a) the distribution map of the selected deformation points, (b) Sentinel-1A data, and (c) ALOS-2 data.
Remotesensing 14 01962 g009
Figure 10. Field photos of areas I to IV. (a) The tensile crack at the trailing edge of the small landslide in area I; (b) the artificial excavation section in area II; (c) the artificial excavation section in area III; (d) bedrock outcrop at the bottom of the KZG landslide.
Remotesensing 14 01962 g010
Table 1. Basic information of the ALOS-2 and Sentinel-1A images.
SatelliteALOS-2Sentinel-1A
Orbital directionAscendingAscending
Temporal coverage 6 October 2014–25 May 202018 March 2017–21 November 2020
LevelL1.1L1.1
BandL-bandC-band
Wavelength23.5 cm5.6 cm
Resolution10 m5 × 20 m
Average angle of incidence36.28°33.91°
PolarizationHHVV
Table 2. Vegetation coverage and slope of potential landslides.
LandslideNDVISlope (°)LandslideNDVISlope (°)
Duila0.05831Jueyuge0.09024.5
Kongzhigong0.06028.8Xiaohekou0.25239.4
Meiding0.09937.4Tacheng0.41337.9
Dingzhui0.06831.4Xiapa0.22331.9
Jirenhe0.07426.9Maopo0.21423.8
Zitongnong0.08336Wulucun0.30420.7
Azanlaka0.08927.9///
Publisher’s Note: MDPI stays neutral with regard to jurisdictional claims in published maps and institutional affiliations.

