Article

Remote Sensing Monitoring of the Spatial Pattern of Greening and Browning in Xilin Gol Grassland and Its Response to Climate and Human Activities

1
School of Land Science and Technology, China University of Geosciences, Beijing 100083, China
2
School of Public Policy and Management, China University of Mining and Technology, Xuzhou 221116, China
3
Key Lab of Land Consolidation and Rehabilitation, The Ministry of Natural Resources, Beijing 100035, China
4
Technology Innovation Center of Ecological Restoration Engineering in Mining Area, The Ministry of Natural Resources, Beijing 100083, China
*
Author to whom correspondence should be addressed.
Remote Sens. 2022, 14(7), 1765; https://doi.org/10.3390/rs14071765
Submission received: 10 March 2022 / Revised: 28 March 2022 / Accepted: 31 March 2022 / Published: 6 April 2022
(This article belongs to the Special Issue Remote Sensing for Land Degradation and Drought Monitoring)

Abstract

:
As a unique ecosystem with multiple ecological functions but high fragility, grassland in arid areas is very vulnerable to changes in the natural environment or human activities, resulting in various ecological and environmental problems. In order to study the degree and spatial extent of the influence of climatic conditions and human activities, especially mining activities, on grasslands in arid regions, we used remote sensing data to monitor the vegetation of the Xilin Gol grassland over a long period. The significant greening and browning areas of Xilin Gol grassland vegetation from 2000 to 2020 were extracted by a time series analysis. At the same time, the correlation analysis method was used to obtain the response of the Xilin Gol grassland vegetation to climatic factors and social and economic factors. In addition, we propose a new method based on buffer analysis and correlation analysis to calculate the influence range of vegetation degradation due to mining. We used this method to determine the influence range of vegetation degradation in the main mining area of the Xilin Gol grassland. The results showed that the vegetation condition of the Xilin Gol grassland were slightly improved from 2000 to 2020. Its vegetation was significantly affected by precipitation, and more than 50% of the area’s vegetation changes were highly correlated with precipitation changes. However, the area with the most serious vegetation degradation was mainly affected by human factors, and this part accounted for about 0.13% of the total area. In the form of direct damage and indirect effects (pulling population and economic growth to expand built-up areas), coal mining has become the main driving factor in the most significant areas of vegetation damage in the study area. Vegetation coverage in areas with significant greening and significant browning was highly correlated with economic factors, indicating that the vegetation changes were significantly affected by economic development. This study can reflect the vegetation changes and main driving factors in the overall and key areas of the Xilin Gol League and is a meaningful reference for the local balance of economic development and environmental protection.

1. Introduction

Grassland is the largest ecosystem in China, occupying 40% of China’s land area [1]. The grassland ecosystem has many ecological functions, such as water conservation, organic matter production, and nutrient recycling [2]. Grasslands are highly vulnerable to climate change or human activities, leading to their degradation [3], especially in arid and semi-arid regions. At present, most of the open-pit coal mines in China are distributed in its arid and semi-arid regions [4]. Coal mining will inevitably cause much damage to the local ecological environment [5], which is one of the main reasons for the degradation of arid grasslands. At present, open-pit coal mining has direct impacts on the grasslands of Inner Mongolia, such as vegetation destruction, land degradation, soil erosion, etc. [6,7]. Therefore, the monitoring of grassland vegetation in arid areas and the research on its response to natural social and economic factors are of great significance for guiding environmental protection work in arid areas, and this has become a relatively popular research field [7,8,9,10,11].
The development of remote sensing technology provides a reliable means of monitoring vegetation over a long period of time on a large scale, and it enables the visualization, mapping, and assessment of mining impacts [12]. Using vegetation indices such as the NDVI (normalized difference vegetation index) and EVI (enhanced vegetation index) to calculate the surface vegetation coverage is one of the most common remote sensing vegetation monitoring methods [13]. As one of the most commonly used remote sensing vegetation indices [14], the normalized difference vegetation index (NDVI) uses the differences in the reflectance of vegetation in the red band and the near-red band to reflect the vegetation coverage [13,15]. The NDVI has the advantages of definite numerical range, easy acquisition, and high sensitivity of monitoring in medium and low vegetation coverage, so it is used by many scholars to carry out vegetation monitoring [13,16,17,18,19,20]. Long-term vegetation monitoring using the NDVI is a common method in the fields of vegetation change [21], vegetation net primary productivity [22], and land cover change [23]. With the characteristics of high temporal resolution and moderate spatial resolution, NDVI data based on the Moderate Resolution Imaging Spectroradiometer (MODIS) sensors are ideal for large-scale long-term vegetation monitoring [24]. When studying the impact of climate elements and human activities on vegetation changes, commonly used methods are the correlation analysis (regression analysis) [15,25,26,27,28] and geographic detector models [28,29,30]. The above method comprehensively analyzes the changes of various types of data and calculates one or more indicators to quantitatively evaluate the impact of each element on the ecological environment. When analyzing the spatial size of the impact of human activities on vegetation, a common method is buffer analysis [31,32,33]. Buffer analysis separately counts the change trends of the value of each element in the buffer with different distances. However, the results of this method often lack an obvious change trend in the statistics of vegetation coverage, which is very important when studying the impact range of human activities.
Located in the arid and semi-arid regions of Northern China, the Xilin Gol League, with its fragile ecological environment, is one of Beijing’s main sources of sandstorms and an important coal-producing area in China. Therefore, the change in local vegetation cover and the impact of coal mining on its ecological environment have attracted the attention of many scholars. Studies have shown that, before 2000, the vegetation degradation of Xilin Gol grassland was very serious and caused consequences such as sandy and dusty weather [34,35], but after 2000, this trend was alleviated or even partially reversed [36]. Some scholars believe that part of the Xilin Gol grassland remains in a degraded state [37]. Regarding the reasons for the changes in vegetation coverage, some scholars believe that the influence of human activities was the main reason for the degradation of vegetation in the Xilin Gol League before 2000, but after 2000, the influence of human factors gradually decreased [38,39]. On the other hand, as an arid grassland area, the vegetation of the Xilin Gol League is significantly affected by climatic factors, especially precipitation [40]. The current research shows that the main driving factors for vegetation change in the Xilin Gol League are meteorological factors (mainly precipitation) and human activities (land use changes) [41,42].
Therefore, the main research objectives of this paper are: (1) to monitor the degree and scope of vegetation greening and browning in the grassland by remote sensing, (2) to analyze the temporal and spatial responses of vegetation change to the changes in climate factors and socioeconomic factors in the study area, and (3) to analyze the causes of significant greening and browning of vegetation in the study area, combined with social data and government policies. The monitoring of vegetation changes in the Xilin Gol League in this study can help scholars and relevant government departments to understand the temporal and spatial change characteristics and laws of Xilin Gol grassland and is a valuable reference for environmental protection research and policy formulation. The research on the driving factors of vegetation change in the Xilin Gol League in this study can reflect the scope and degree of influence of natural conditions and human activities on vegetation in arid areas and has a reference significance for balancing economic development and environmental protection. In addition, the improved calculation method of the ecological impact range of human activities based on buffer analysis and correlation analysis has a certain innovative value and reference significance for the research on the impact of human factors such as urban expansion and mining on the ecological environment.

2. Materials and Methods

2.1. Study Area and Data Source
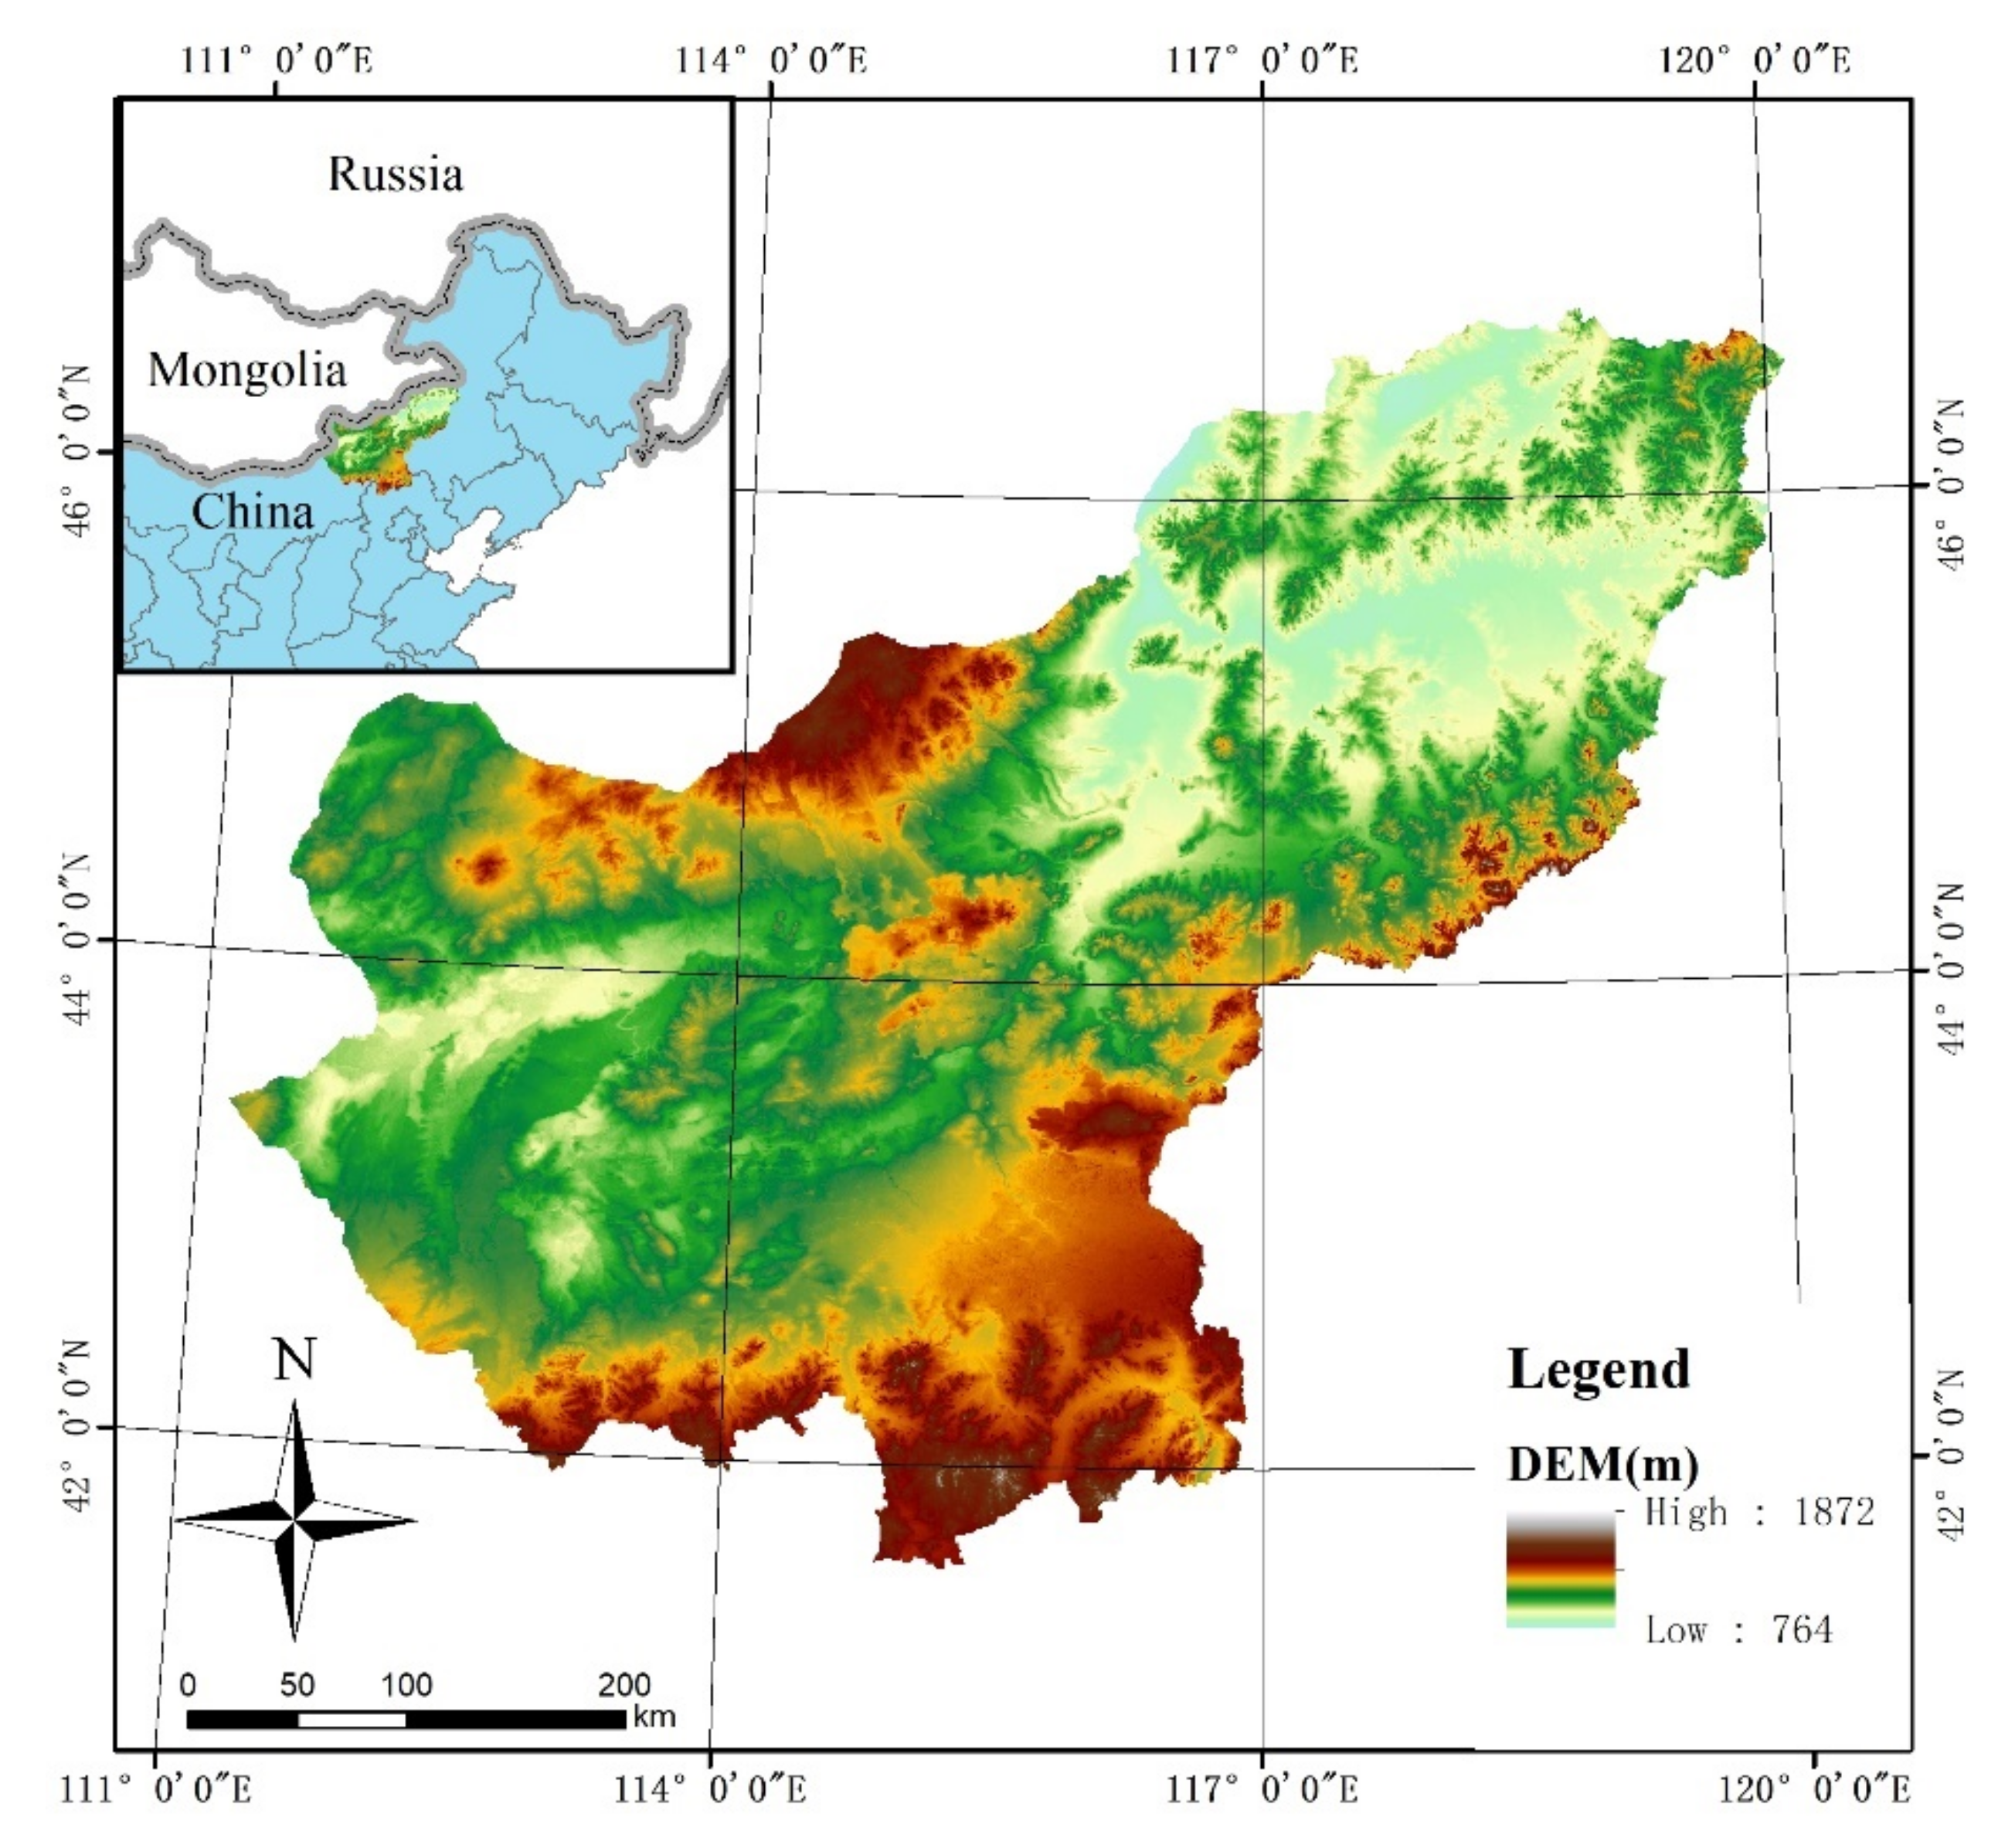
2.1.1. Study Area

The Xilin Gol League is located in the central part of the Inner Mongolia Autonomous Region of China, and the latitude range is from 42°32′ to 46°41′ north latitude and from 111°59′ to 120°00′ east longitude. Its total area is 203,000 square kilometers, of which the grassland area is 179,600 square kilometers, accounting for 89.85% of the total area. As of 2020, the total resident population was 1.11 million. The study area has a typical temperate continental climate characterized by cold and dry conditions. The annual average temperature in the study area is 0~3 °C, and the average annual precipitation is 205.5~419.5 mm, which is mainly concentrated in July, August, and September. The altitude of the study area is 764~1872 m (Figure 1), the terrain is dominated by high plains, and there are various landforms. Its terrain is high in the south and low in the north, with many low mountains and hills in the east and south, and the basins are scattered in between. The terrain in the west and north is flat, with scattered low mountains and lava terraces.
The Xilin Gol League is rich in mineral resources, where more than 80 kinds of minerals have been discovered; among which, coal resources are particularly rich. The proven and predicted coal reserves in the Xilin Gol League are 188.3 billion tons, and Shengli Coal Mine is the lignite coal field with the largest proven reserves so far. Due to economic development and exploitation, the ecological environment of the Xilin Gol League has been damaged to a certain extent. As one of the main sources of sandstorms in the Beijing–Tianjin region, the Xilin Gol League has become an important area in the research on vegetation degradation in recent years [22].

2.1.2. NDVI

Due to the large scale of the study area and its main land cover type, grassland, the NDVI is a highly suitable parameter for studying the ecological environment of the area. The selected data set is the vegetation index synthesis product of MODIS data from the Terra and Aqua satellites with the product number MOD13Q1. MOD13Q1 is a 16-day synthetic data product data set with a spatial resolution of 250 m that includes two vegetation indices, the NDVI and EVI. According to the vegetation growth characteristics of the study area, we selected the NDVI data of the annual vegetation growth season (June–September) from 2000 to 2020 to represent the surface vegetation coverage of the study area. These data were provided twice a month, a total of 8 times during the growing season each year. On the other hand, the study area could not be fully covered without 2 data points (track numbers: h25v04 and h26v04), so 16 data points per year, a total of 336 data points, were used in this study (data source: https://earthexplorer.usgs.gov/, accessed on 1 December 2021).
Using the maximum value composite (MVC) [15] method, 8 NDVI images were synthesized into one NDVI image every year. The 21 NDVI images obtained were the main parameters used to reflect the vegetation cover changes in the study area. In addition, the obtained data required other preprocessing, including projection conversion, resampling, and water masking. The above processing steps were all run on the ArcGIS (Environmental Systems Research Institute, Inc., Redlands, CA, USA) platform. Considering that some values of the synthesized NDVI images were missing, most of these parts were concentrated around the wetlands. Therefore, the missing part of the grid data in the study area was removed by manually drawn vectors.

2.1.3. Climate Data Sets

The climate data needed for the research mainly included temperature and precipitation data. Among them, the temperature and precipitation data from 2000 to 2015 came from China’s annual average precipitation and average temperature spatial interpolation data set of the Resource and Environmental Science Data Center of the Chinese Academy of Sciences.
The average annual temperature and precipitation data from 2016 to 2020 came from the statistical data of 113 meteorological stations in the Inner Mongolia Autonomous Region. The ANUSPLIN software developed by the Australian National University (Canberra, Australia) was used for the spatial interpolation of climate elements. The elevation data of the Inner Mongolia Autonomous Region were included in the abovementioned interpolation process as a covariate. The abovementioned temperature and precipitation data had a spatial resolution of 1000 m, using vector data and cropping to an appropriate size. These operations were run on ArcGIS software.

2.1.4. Other Data

Other data used in the study mainly included a digital elevation model (DEM), land cover map, vegetation type map, and high-definition remote sensing image map of the study area. Among them, the DEM data source was https://srtm.csi.cgiar.org/srtmdata/ (accessed on 1 December 2021), with a spatial resolution of 1 km, which was mainly used for the interpolation of temperature and precipitation and assistance in the subsequent research analysis. The land cover map data came from the National Basic Geographic Information Center’s global land cover data product service website (DOI: 10.11769, http://www.globallandcover.com/, accessed on 1 December 2021). This study included the land use data of 2000 and 2020 in the data set, with a spatial resolution of 30 m and an overall accuracy of over 80%. The high-definition remote sensing image was from Google Earth (https://google-earth.gosur.com/cn/, accessed on 1 December 2021).
In order to discuss the relationship between vegetation change and climate, socioeconomic development, and policy in the study area, we selected the following indicators related to climate conditions, socioeconomic development, and policy in the Xilin Gol League from 2000 to 2020 for analysis: average annual precipitation (PRE), built-up area (BA), population (POP), output value of primary production (OP), output value of secondary production (OS), output value of tertiary production (OT), number of sheep (NS), accumulative afforestation area (AA), output of raw coal (RC), and highway mileage (HM). The socioeconomic data were from the Inner Mongolia Statistical Yearbook 2001–2021, in which some data were missing or obviously wrong and were calculated by interpolation. The main purpose of selecting these data was to reflect the changes in various major production industries in the Xilin Gol League from 2000 to 2020 so as to analyze the impact of these production industries on vegetation changes in the study area. Please refer to Table A1 for details.

2.2. Methods

2.2.1. Time Series Analysis Method

The time series analysis method is a common method of studying the long-term changes in continuous data. The least squares linear regression model was used to calculate the spatial distribution of the slope (S) of the interannual change of each pixel, with the year number as the independent variable and the pixel value as the dependent variable. The calculation of S is shown in Equation (1). In addition, the F test was used to test the significance of the change trend of the NDVI, and the spatial distribution of the p-value was obtained by this method.
In fact, the study area was the area where vegetation was seriously degraded because of human activities. The natural breaks method (Jenks) [15] was used to divide the spatial distribution of S values into 7 categories. Among them, the significantly negative category was the area of most concern in this study.
S = n · i = 1 n i NDVI i i = 1 n i i = 1 n NDVI i n i = 1 n i 2 i = 1 n i 2
where S is the slope of NDVIi change; i is the order of the years in the study area, and its value is from 1 to 21; n is the maximum value of i, which is equal to 21; and NDVIi is the NDVI in the growing season of the study area in the ith year.

2.2.2. Land Cover Transfer Matrix

The transition matrix [43] is a common method to study land cover change and has been widely used by various disciplines [15]. The land cover transfer matrix can effectively measure the transformed areas of various land cover types within a certain period of time, which is important data to understand the changes of various human activities and natural elements. The land cover transfer matrix used in this paper is the same as the transfer matrix method used by Li [44] and Guan et al. [15]. We used the land cover data of the study area in 2000 and 2020 provided by the National Basic Geographic Information Center for the calculation of the land cover transfer matrix. The land cover types used are the same as the land cover data, which include FaL (Farmland), FL (Forest land), GL (Grassland), BL (Brushland), WeL (Wet land), WaA (Water area), AS (Artificial surface), and BL (Bare land). For the convenience of analysis, the area of the monitored land cover change was converted into the proportion of this area as the study area. The calculation of the above land cover matrix is based on ArcGIS software.

2.2.3. Correlation Analysis

In addition to human activities, changes in climatic elements are also important driving factors for changes in the grassland ecological environment [45]. Therefore, this study used the method of correlation analysis to analyze the impact of climatic elements in the study area on the changes in the ecological environment; that is, the Pearson correlation coefficient was used to characterize the correlation. The calculation method of Pearson’s correlation coefficient is Equation (2) [46,47,48]:
r = Σ i = 1 n X i X ¯ Y i Y ¯ Σ i = 1 n X i X ¯ Σ i = 1 n Y i Y ¯
where r is the Pearson correlation coefficient, X and Y are statistical variables, Xi is the NDVI statistical value in the ith year, and Yi is the climatic elements statistical value in the ith year. X ¯   and   Y ¯ are the arithmetic averages of the NDVI and climatic elements statistics from 2000 to 2020, respectively.
The average values of the climatic elements and the NDVI of the study area and each area of interest were calculated, respectively. The climatic elements and NDVI were used as independent variables and dependent variables, respectively, to calculate the correlation coefficient r, which represents the response degree of vegetation coverage in each area to changes in natural factors over time.

2.2.4. Improved Buffer Analysis

In order to estimate the vegetation influence range caused by human activities, this paper proposes a method combining the correlation analysis and buffer analysis to measure the vegetation conditions around the artificial surface. Its main process is (a) to vectorize areas with high human activity (such as urban built-up areas or mining areas) and establish buffers with 1 km spacing, (b) to measure the mean value of the NDVI within the range of j km from the artificial surface in the ith year, named NDVIij (It is worth noting that the measurement range here includes all areas less than or equal to j km, not the traditional j-1 km-to-j km annular area). Among them, NDVI1j, NDVI2j… constitute the sequence [NDVIj], which can represent the change of vegetation within j km from the artificial surface range since the beginning of the study, and (c) to calculate the correlation between the sequences [NDVI1], [NDVI2], and [NDVIj]. The critical value j where the correlation is not significant is the range of human activities.

3. Results

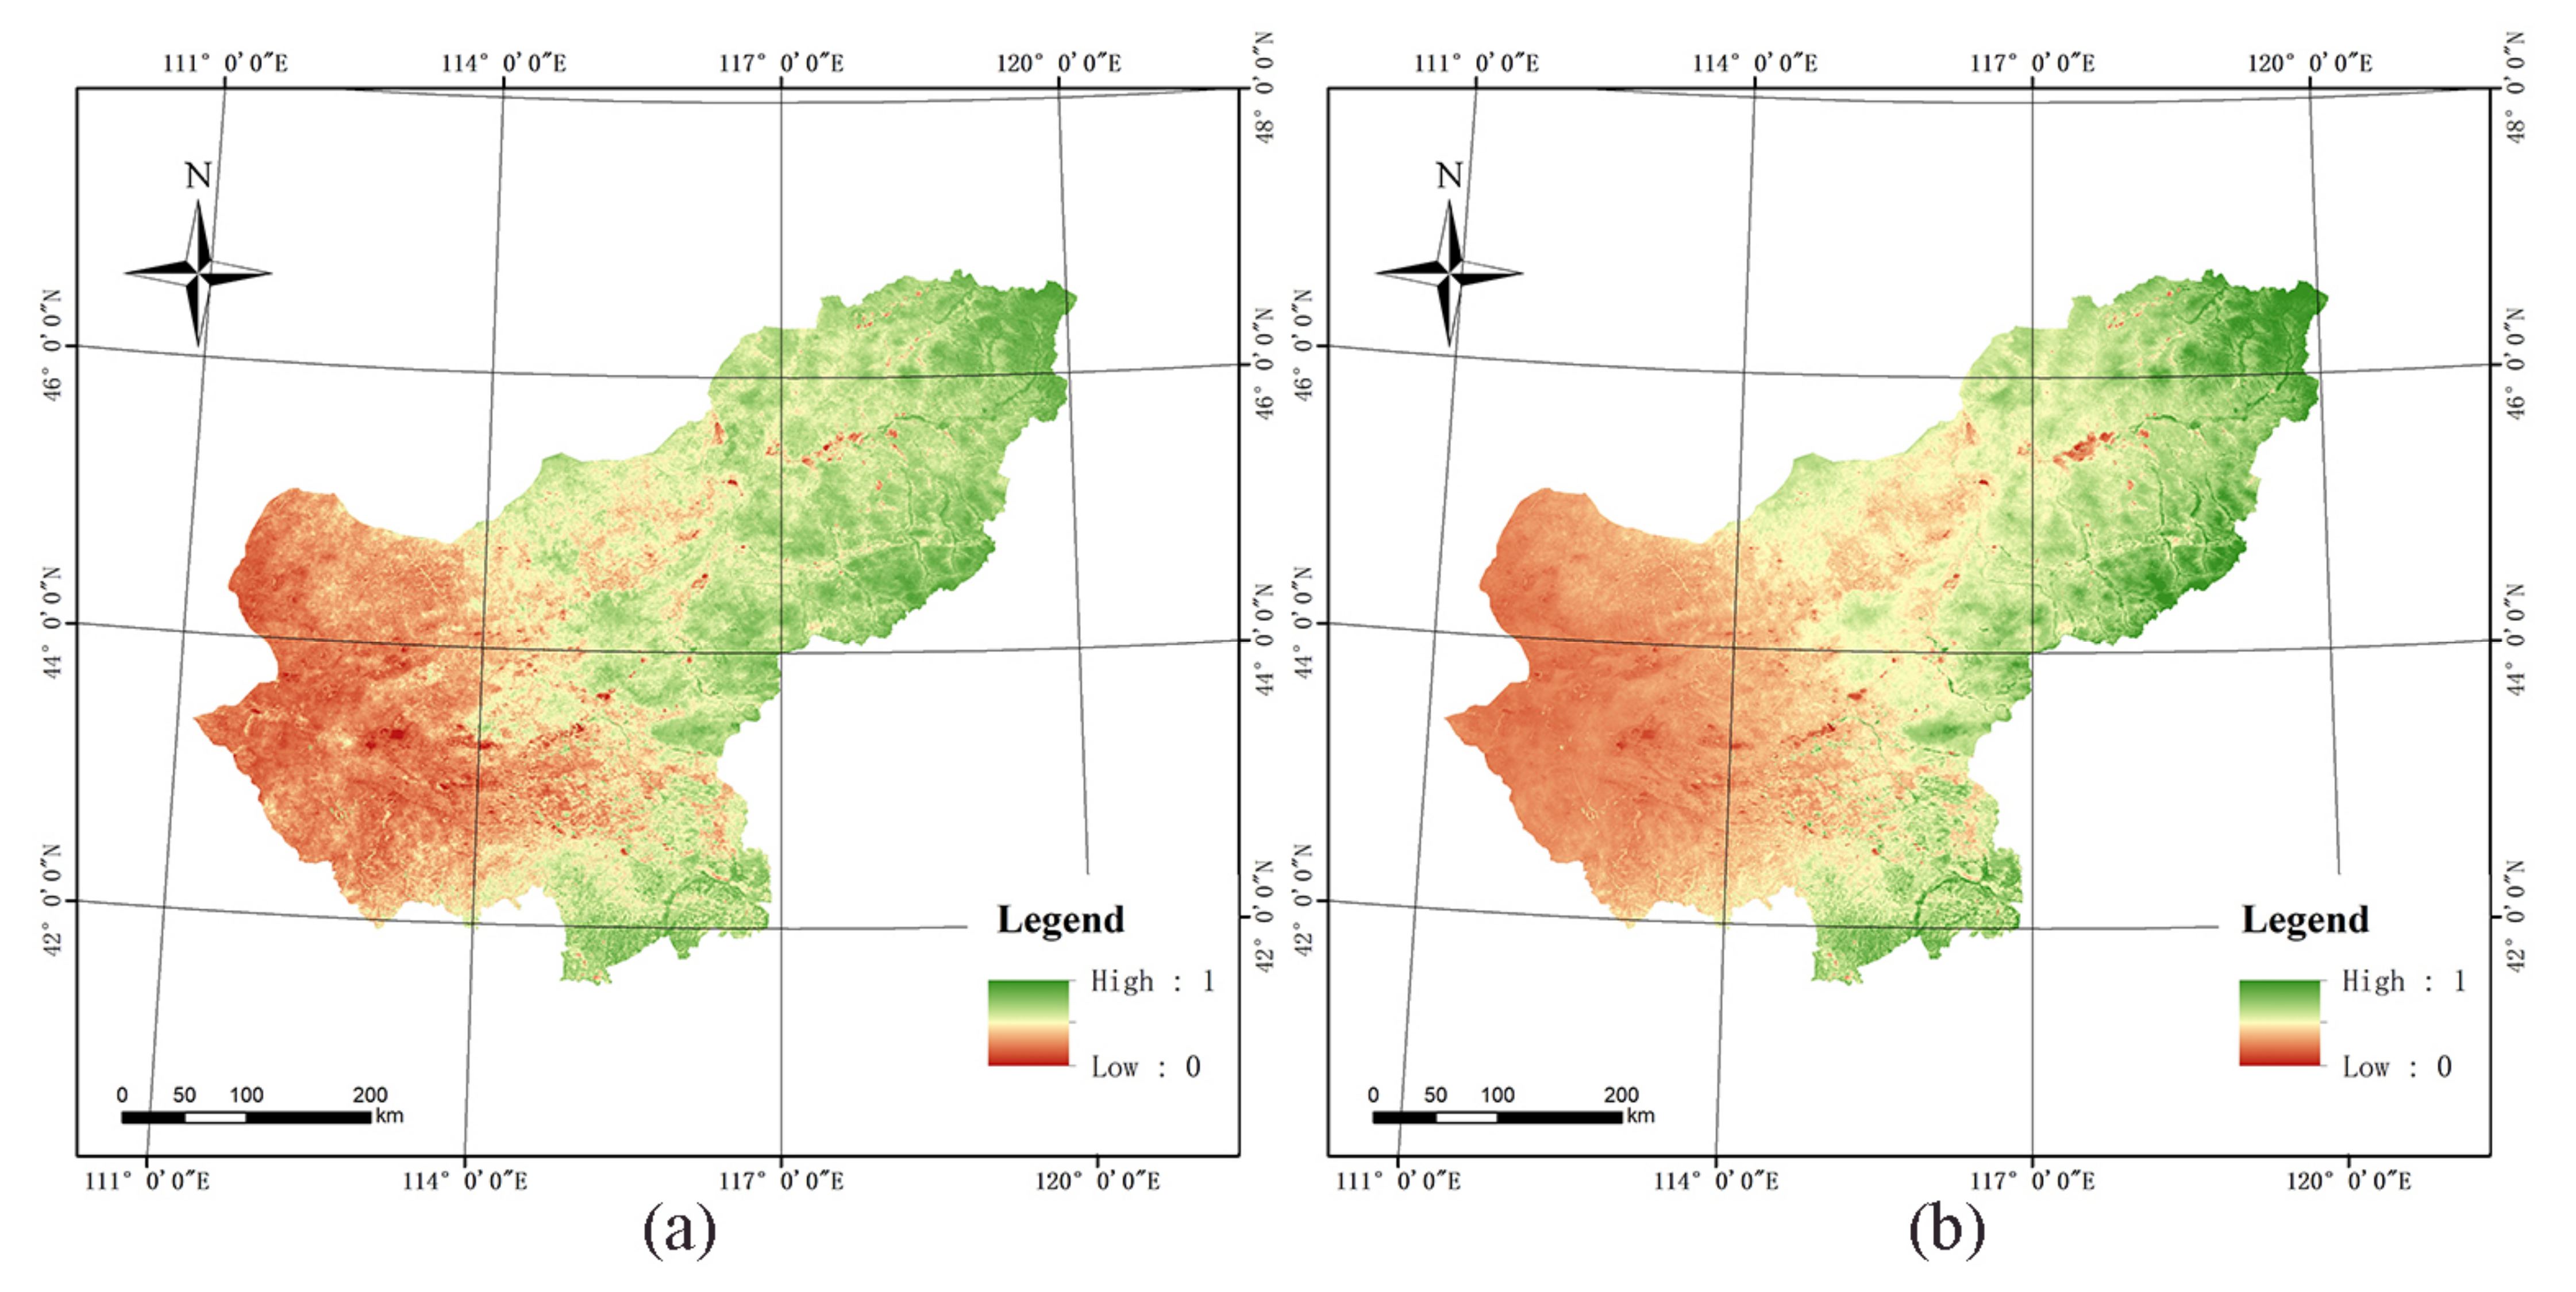
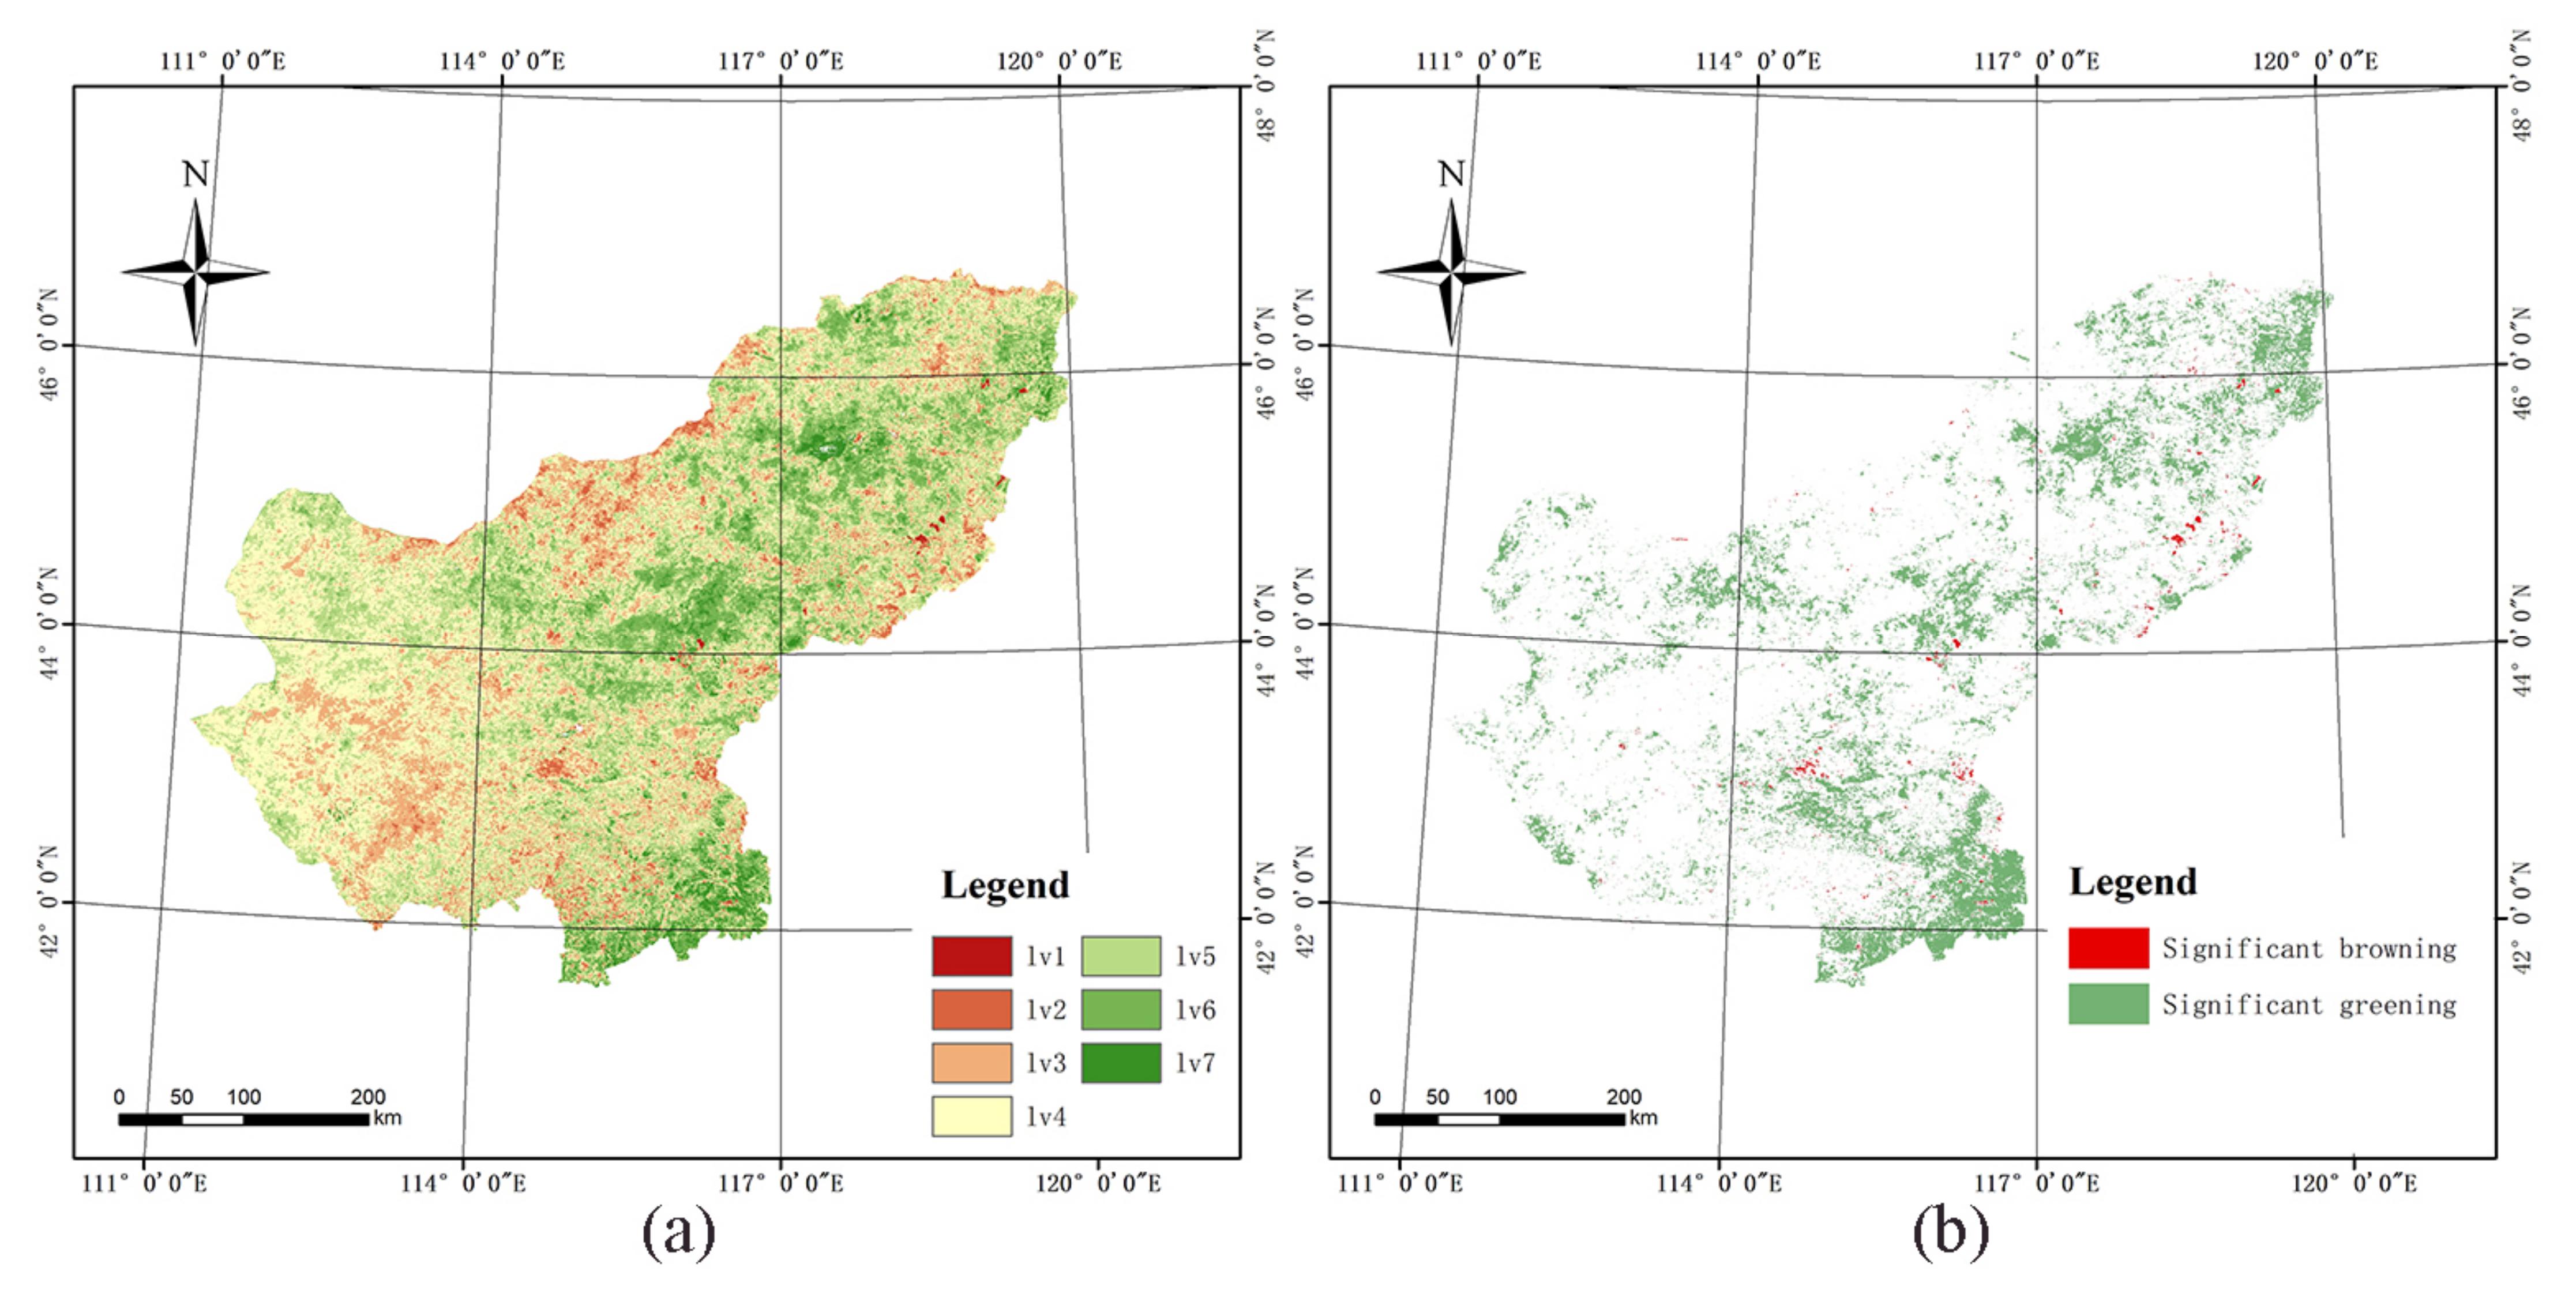
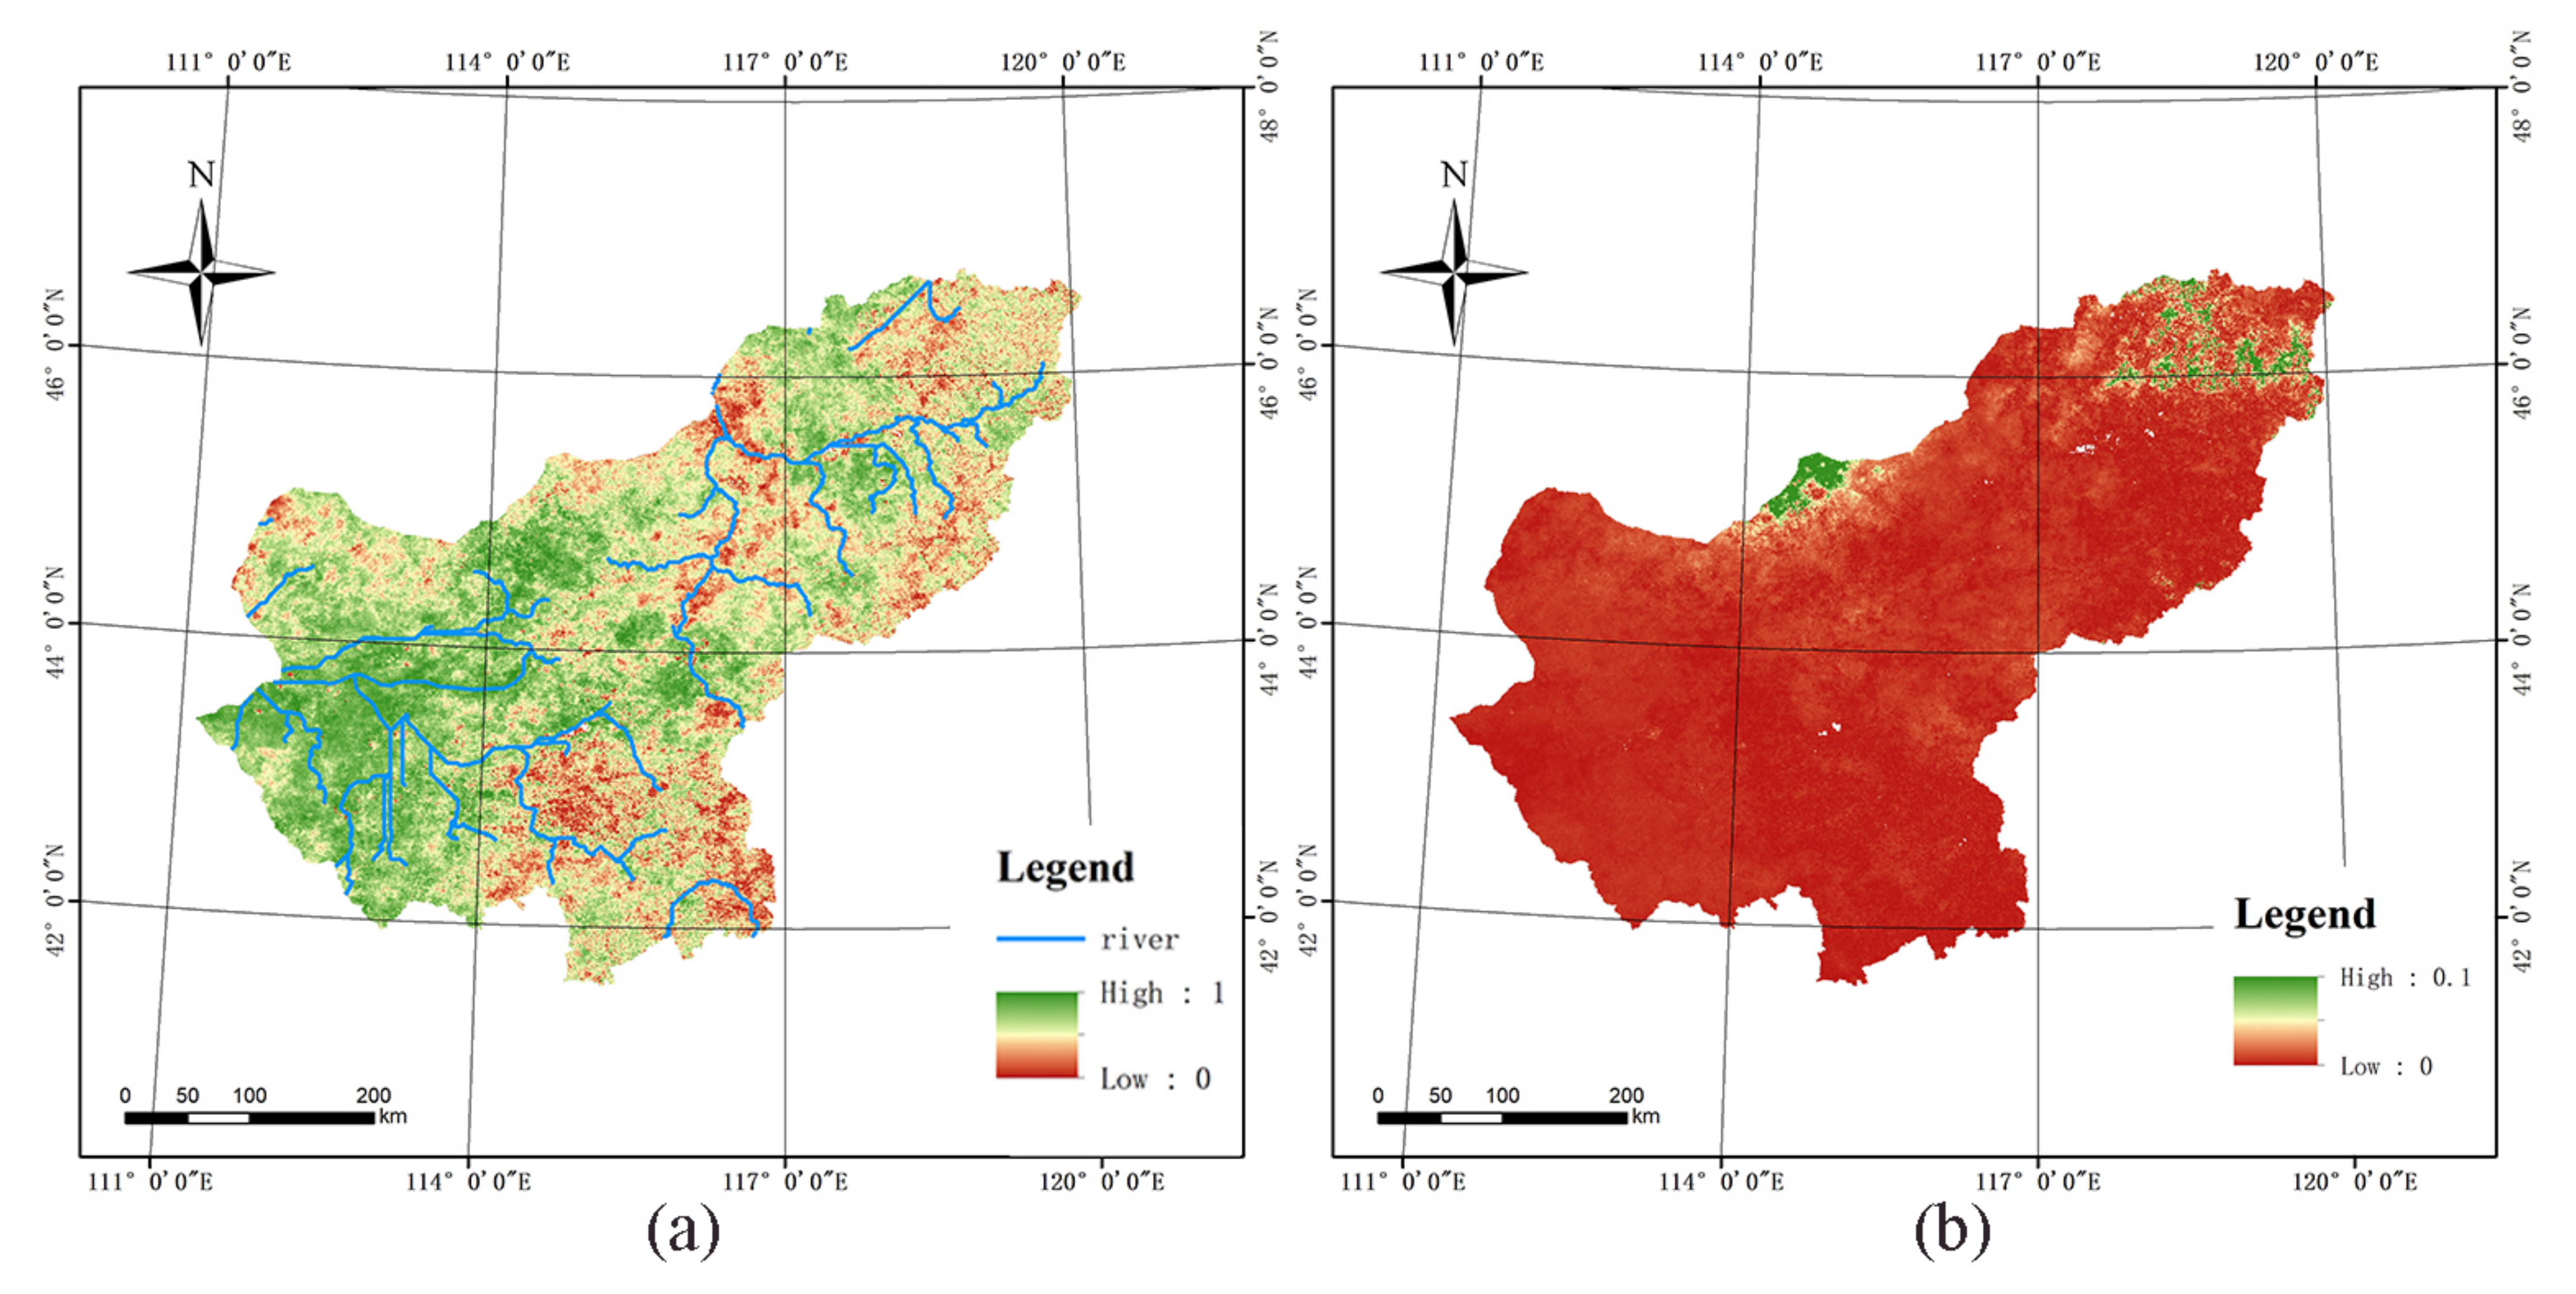
3.1. Spatial Distribution and Trend of NDVI

Before analyzing the changes in the NDVI, it was necessary to study the spatial distribution of the NDVI in the study area to understand the vegetation distribution characteristics. Figure 2a,b shows the spatial distribution of the NDVI in the study area obtained by the maximum value synthesis method and the average value synthesis method, respectively. It can be seen in Figure 2 that the vegetation distribution in the study area showed an obvious trend of high in the east and low in the west. Comparing the remote sensing images and topography of the study area, we noticed that the low-value areas of vegetation coverage were mostly located in the desert and scattered water areas on the northwest side of the study area; the high-value areas of vegetation coverage were mostly located in the east of the study area and around the river.
Using the natural breaks method (Jenks), the NDVI of each year for the study area was divided into five levels. The area of each level was calculated separately, and the proportion of each level to the total study area was calculated. The data in Figure 2 were processed in the same way.
Table 1 shows the statistical results of the NDVI area at different levels in the study area. Compared with the remote sensing images from 2000 to 2020, most of the NDVI distribution in the study area was concentrated in the range of 0.2–0.6, which means that the vegetation coverage in those areas was relatively low. The vegetation type there was mainly grassland, which was widely distributed throughout the study area. There were only a few areas with high vegetation coverage (0.6–1.0) in the study area, where the main vegetation type was woodland distributed in the mountains in the southern part of the study area, and its area only accounted for less than 5% of the total study area. As for the area with an NDVI of <0.2, it mainly included most of the water area and a small section of bare land. The magnitude of the change in its area was very large, which meant that the local water area was very unstable (affected by precipitation) [49].
Figure 3 is the spatial distribution of the slope change of the NDVI in the study area from 2000 to 2020. Using the natural breakpoint method (Jenks), the slope S is divided into 7 levels and shown in Figure 3a. The meaning and statistics of each level are shown in Table 2. It can be seen in Table 2 that the slightly negative, stable, and slightly positive areas comprised nearly 80% of the total study area. The moderately positive area was more than three times the moderately negative area. The significantly positive area was also much larger than the significantly negative area. The above data indicated that the NDVI in the growing season in the study area possessed stable and improved characteristics in general during the period from 2000 to 2020.
According to the results of the slope S and F tests, the range of significant greening (S > 0, p < 0.05) and significant browning (S < 0, p < 0.05) in the study area are shown in Figure 3b. It can be seen from Figure 3b that the area of significant greening in the study area (about 900 km2) is much larger than the area of significant browning (about 30,000 km2). Among them, the significant green areas are contiguously distributed in the areas with high precipitation in the east and south of the study area. Significant browning is sporadically distributed throughout the study area. Compared with the remote sensing images of Google Earth, the surface coverage of the significant browning area is mainly coal mines, towns and water areas, and a very small part of the surface coverage is grassland and unused land.

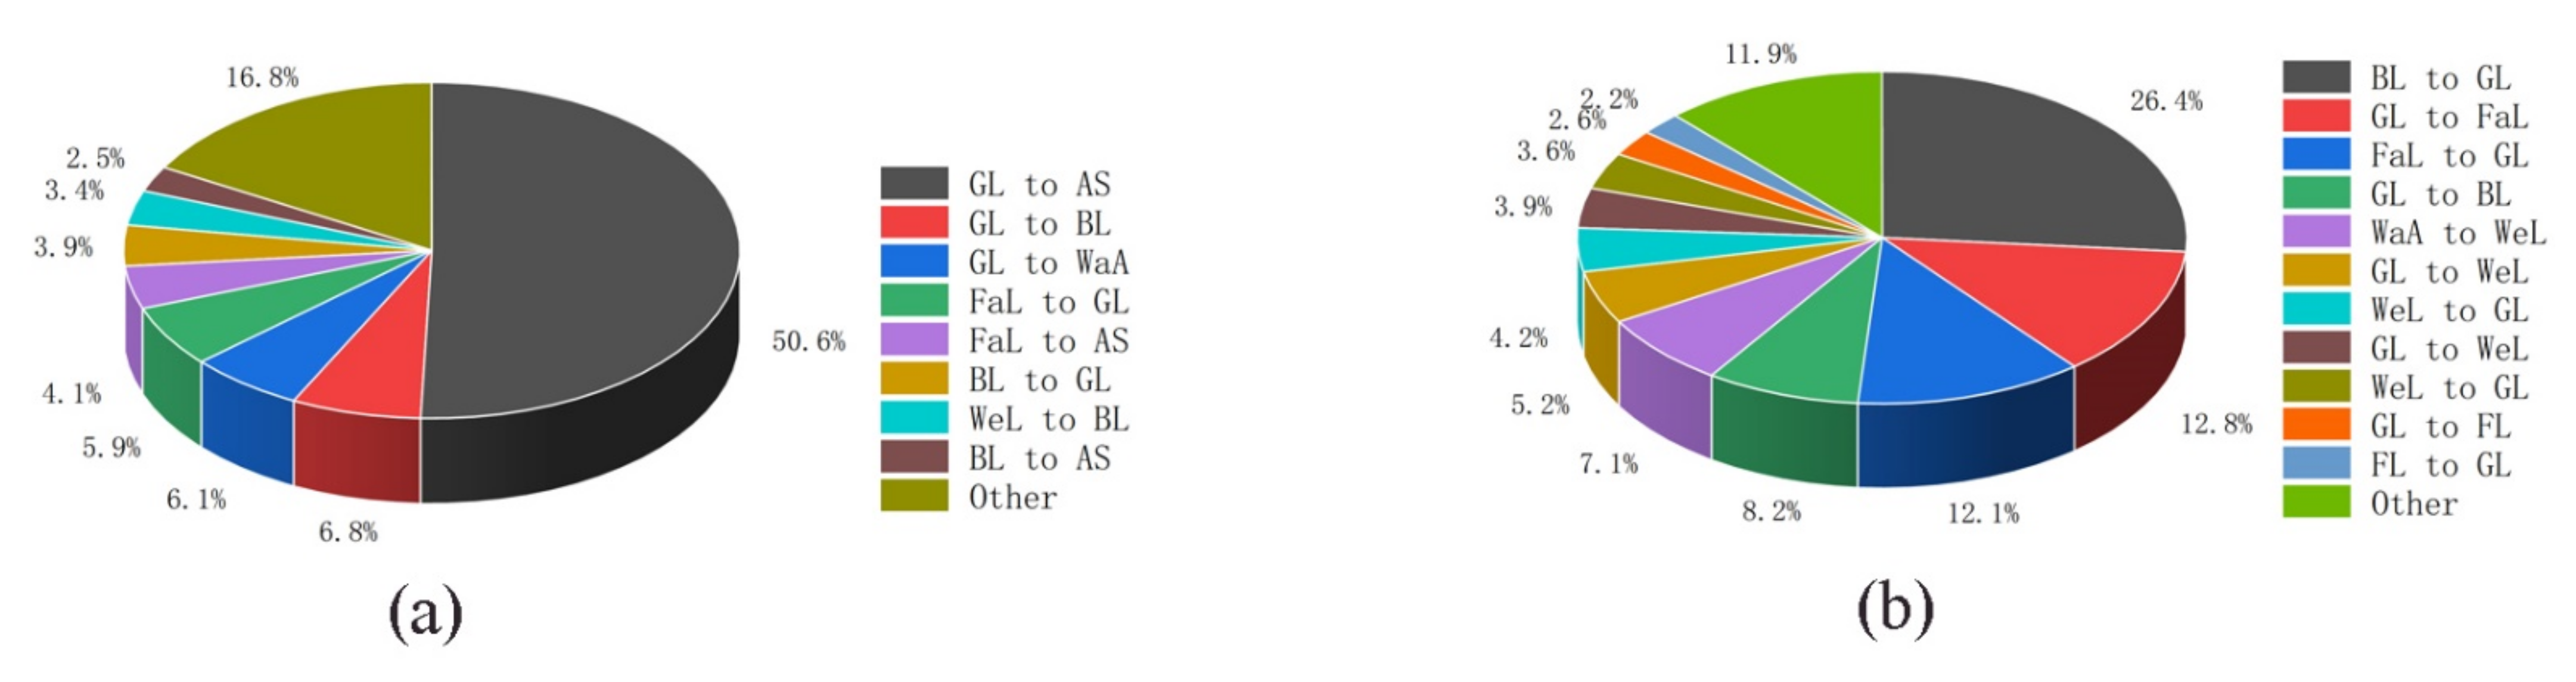
3.2. The Relationship between NDVI Change and Land Cover Change

Land cover change is the direct cause of land cover and an important factor in vegetation optimization and degradation. This paper uses the current land cover map of the Xilin Gol League in 2000 and 2020 to calculate the land cover transition matrix in the study area. The results are shown in Table 3. From Table 3, it can be seen that, from 2000 to 2020, about 11.212% of the land cover underwent significant changes. The land type changes that can cause greening and browning in the study area are mainly concentrated in the mutual transformation between grassland, cultivated land and bare land, artificial surface, and water area, which are also the concerns of this study. The most obvious changes were the conversion of bare land to grassland (4.699%) and the conversion of grassland to bare land (1.703%), which were an order of magnitude larger than the other land types. These two transformations are direct manifestations of grassland growth and degradation in the study area, and the data indicate that the grassland conditions in the study area are generally improving. In all land type transformations, the expansion of artificial surfaces and bare land is the direct manifestation of grassland browning. From Table 3, it can be seen that the expansion area of bare land (1.999%) is much larger than that of artificial surfaces (0.419%). This indicates that, compared with natural elements, the impact area of anthropogenic factors on grassland vegetation is relatively small. Although the artificial surface has a limited effect on the browning area of the grassland, the area of the artificial surface is expanding rapidly. The expansion area of the artificial surface (0.419%) is even much larger than the area of the artificial surface that has not changed significantly (0.134%); that is to say, the surface area of the artificial surface has expanded by nearly three times. With the rapid expansion of the artificial surface area, its impact on grassland browning is also gradually accelerating.
The areas of land cover change in the significant greening and significant browning areas in Figure 3b were counted separately, and the area percentage of each land type change in all the changed land types was calculated. The main part of it is shown in Figure 4.
Figure 4a shows that the manmade surface is most worthy of attention in the significant browning area. Among them, the conversion of grassland to artificial surfaces accounted for more than 50% of the total area, and the area of cultivated land and bare land converted to grassland was also considerable, which shows the main driver of the significant degradation of vegetation by human activities in areas with significant browning areas. In addition to artificial surfaces, there is also cultivated land that deserves attention. The significant browning area caused by the conversion of cultivated land to grassland and artificial surface also reached about 5%. The greening caused by these transformations is also an integral part of the significant contribution of human activities to the browning of the study area. It can be seen from Figure 4b that, among the major land type changes in the significantly green areas, the most noteworthy was the conversion of bare land to grassland, the conversion of grassland to shrub forest, and the conversion of grassland to woodland. The areas in the transformations are ranked first, fourth, and tenth. These transformations are greatly affected by climate, especially precipitation, which indicates that the main influencing factor for the significant greening in the study area is climate. In the significant greening area, the area of mutual conversion between cultivated land and grassland is similar, which indicates that the mutual conversion of cultivated land and grassland can contribute to the greening of grassland. Therefore, the continuous greening of the study area requires appropriate planning of the area of cultivated land. In addition, the significant green area contains a large number of water changes, and water resources play an important role in the growth of grassland vegetation.

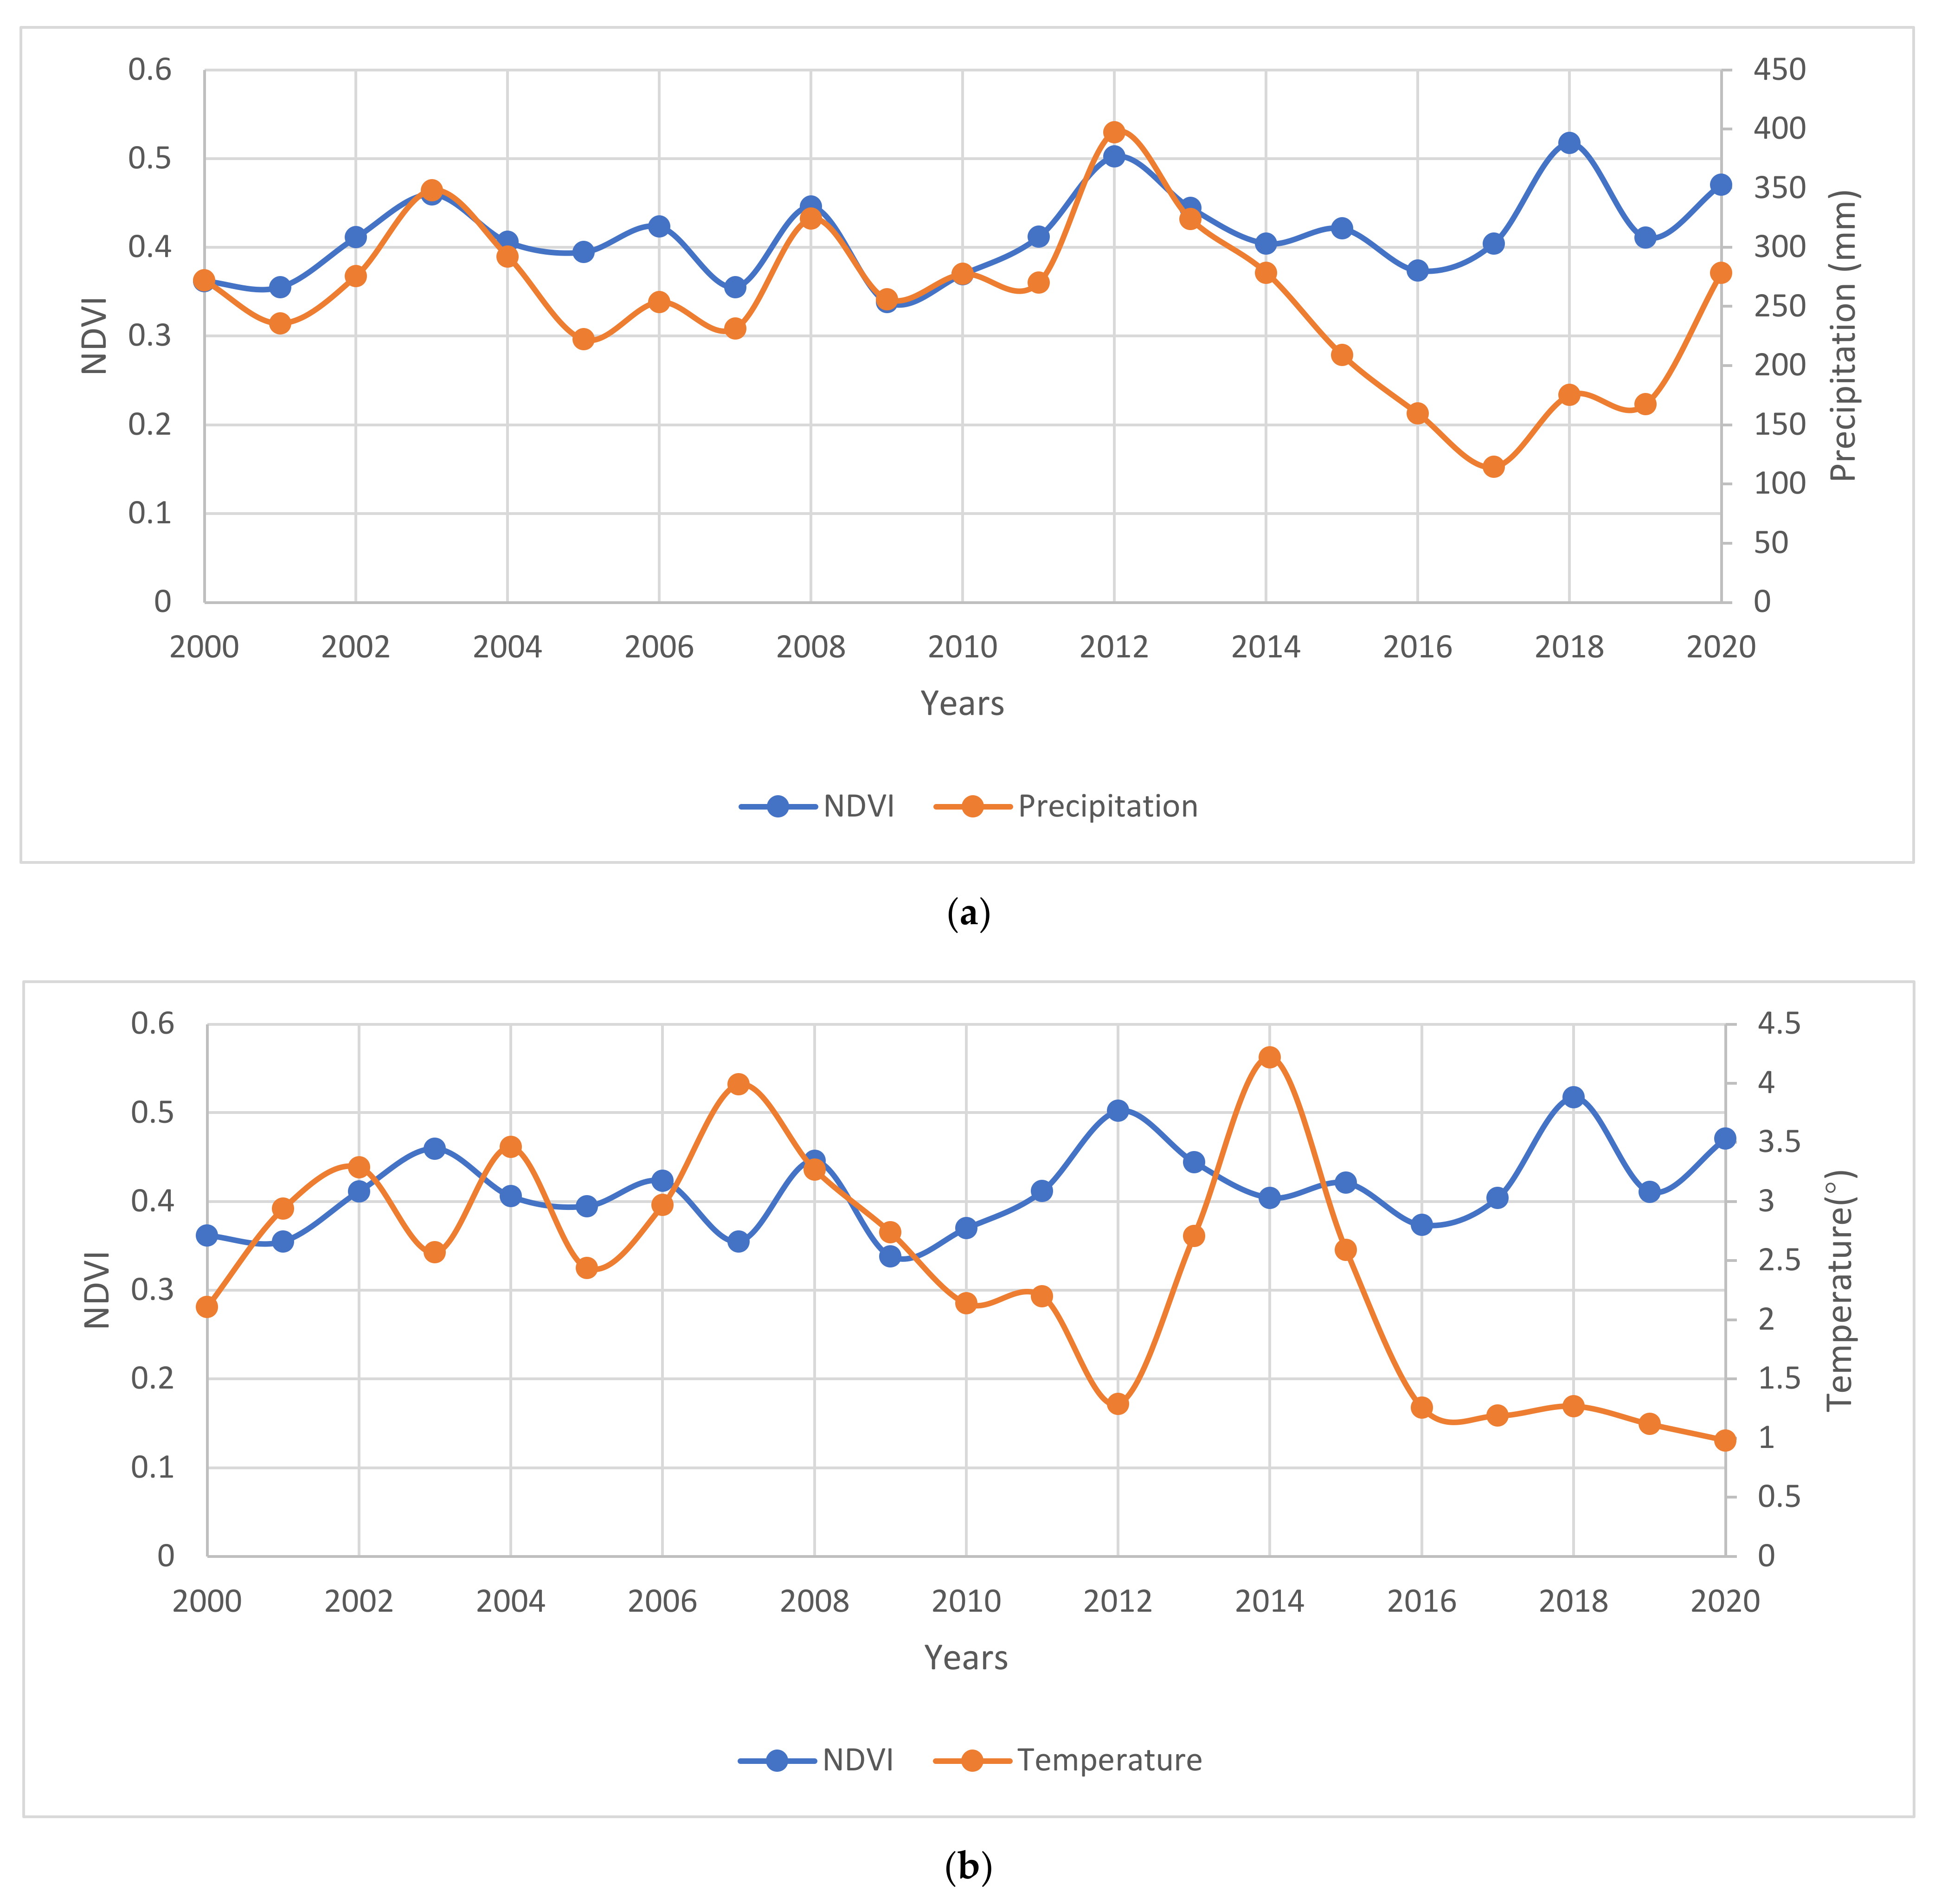
3.3. The Relationship between the NDVI and Climatic Elements

Figure 5 shows the spatial distribution of the correlations between the NDVI and meteorological elements in the study area. In addition, for ease of analysis, the main river channels of the study area were added to Figure 5a, which was generated from the DEM data of the study area using Arc Hydro software. According to the Google Earth remote sensing images, some of the generated river channels were edited and corrected. Comparing Figure 5a,b, an obvious feature was identified where the correlation between the NDVI and precipitation was much higher than that between the NDVI and temperature in the study area. It can be seen in Figure 5b that, in most areas, the absolute value of the correlation between the NDVI and temperature elements was less than 0.1. There was a relatively highly positive correlation only in the northeastern part of the study area, and there was a relatively highly negative correlation in the north and northeast parts of the study area. However, the absolute values of the correlation coefficients of these regions were also much lower than 0.5, which meant that there were no regions with moderate correlations. In the study area, the change in the interannual temperature elements had little effect on the change in the interannual NDVI.
It can be seen in Figure 5a that the interannual NDVI variation in the study area was significantly correlated with the interannual precipitation. According to the correlation coefficient, Figure 5a is divided into four categories: uncorrelated (|r| < 0.3), weak correlation (0.3 < |r| < 0.5), medium correlation (0.5 < |r| < 0.8), and strong correlation (0.8 < |r|). The proportions of each category to the total area of the study area were: 14.39, 34.04, 50.17, and 1.40%. The areas with a moderate degree of correlation and above accounted for 85.61% of the total study area.
On the other hand, when combined with the hydrological analysis results, an obvious feature was observed in that both the low and high values of the correlations in the study area had obvious correlations with the wetlands in the study area. Areas with high correlations were mainly distributed around seasonal rivers and wetlands northwest of the study area. With less precipitation and a flat terrain, a large number of seasonal rivers and small wetlands can form in these areas. The water volumes of these rivers and wetlands are significantly affected by rainfall, so the vegetation conditions around them have a strong correlation with the rainfall. In contrast, the regions with low correlation were mainly distributed in the perennial river basins in the central, eastern, and southern parts of the study area. These areas have relatively large elevation differences and precipitation, where the stable surface runoff required for vegetation growth is generated. Therefore, the vegetation conditions in these areas showed weak or no correlation with precipitation.
Another notable feature was the low correlation between the NDVI and precipitation in the areas with high human activity, with mean correlation coefficients of 0.30 and 0.44, respectively. It has been shown that the main driver of vegetation cover changes in the MDA is human activities rather than changes in the natural environment.

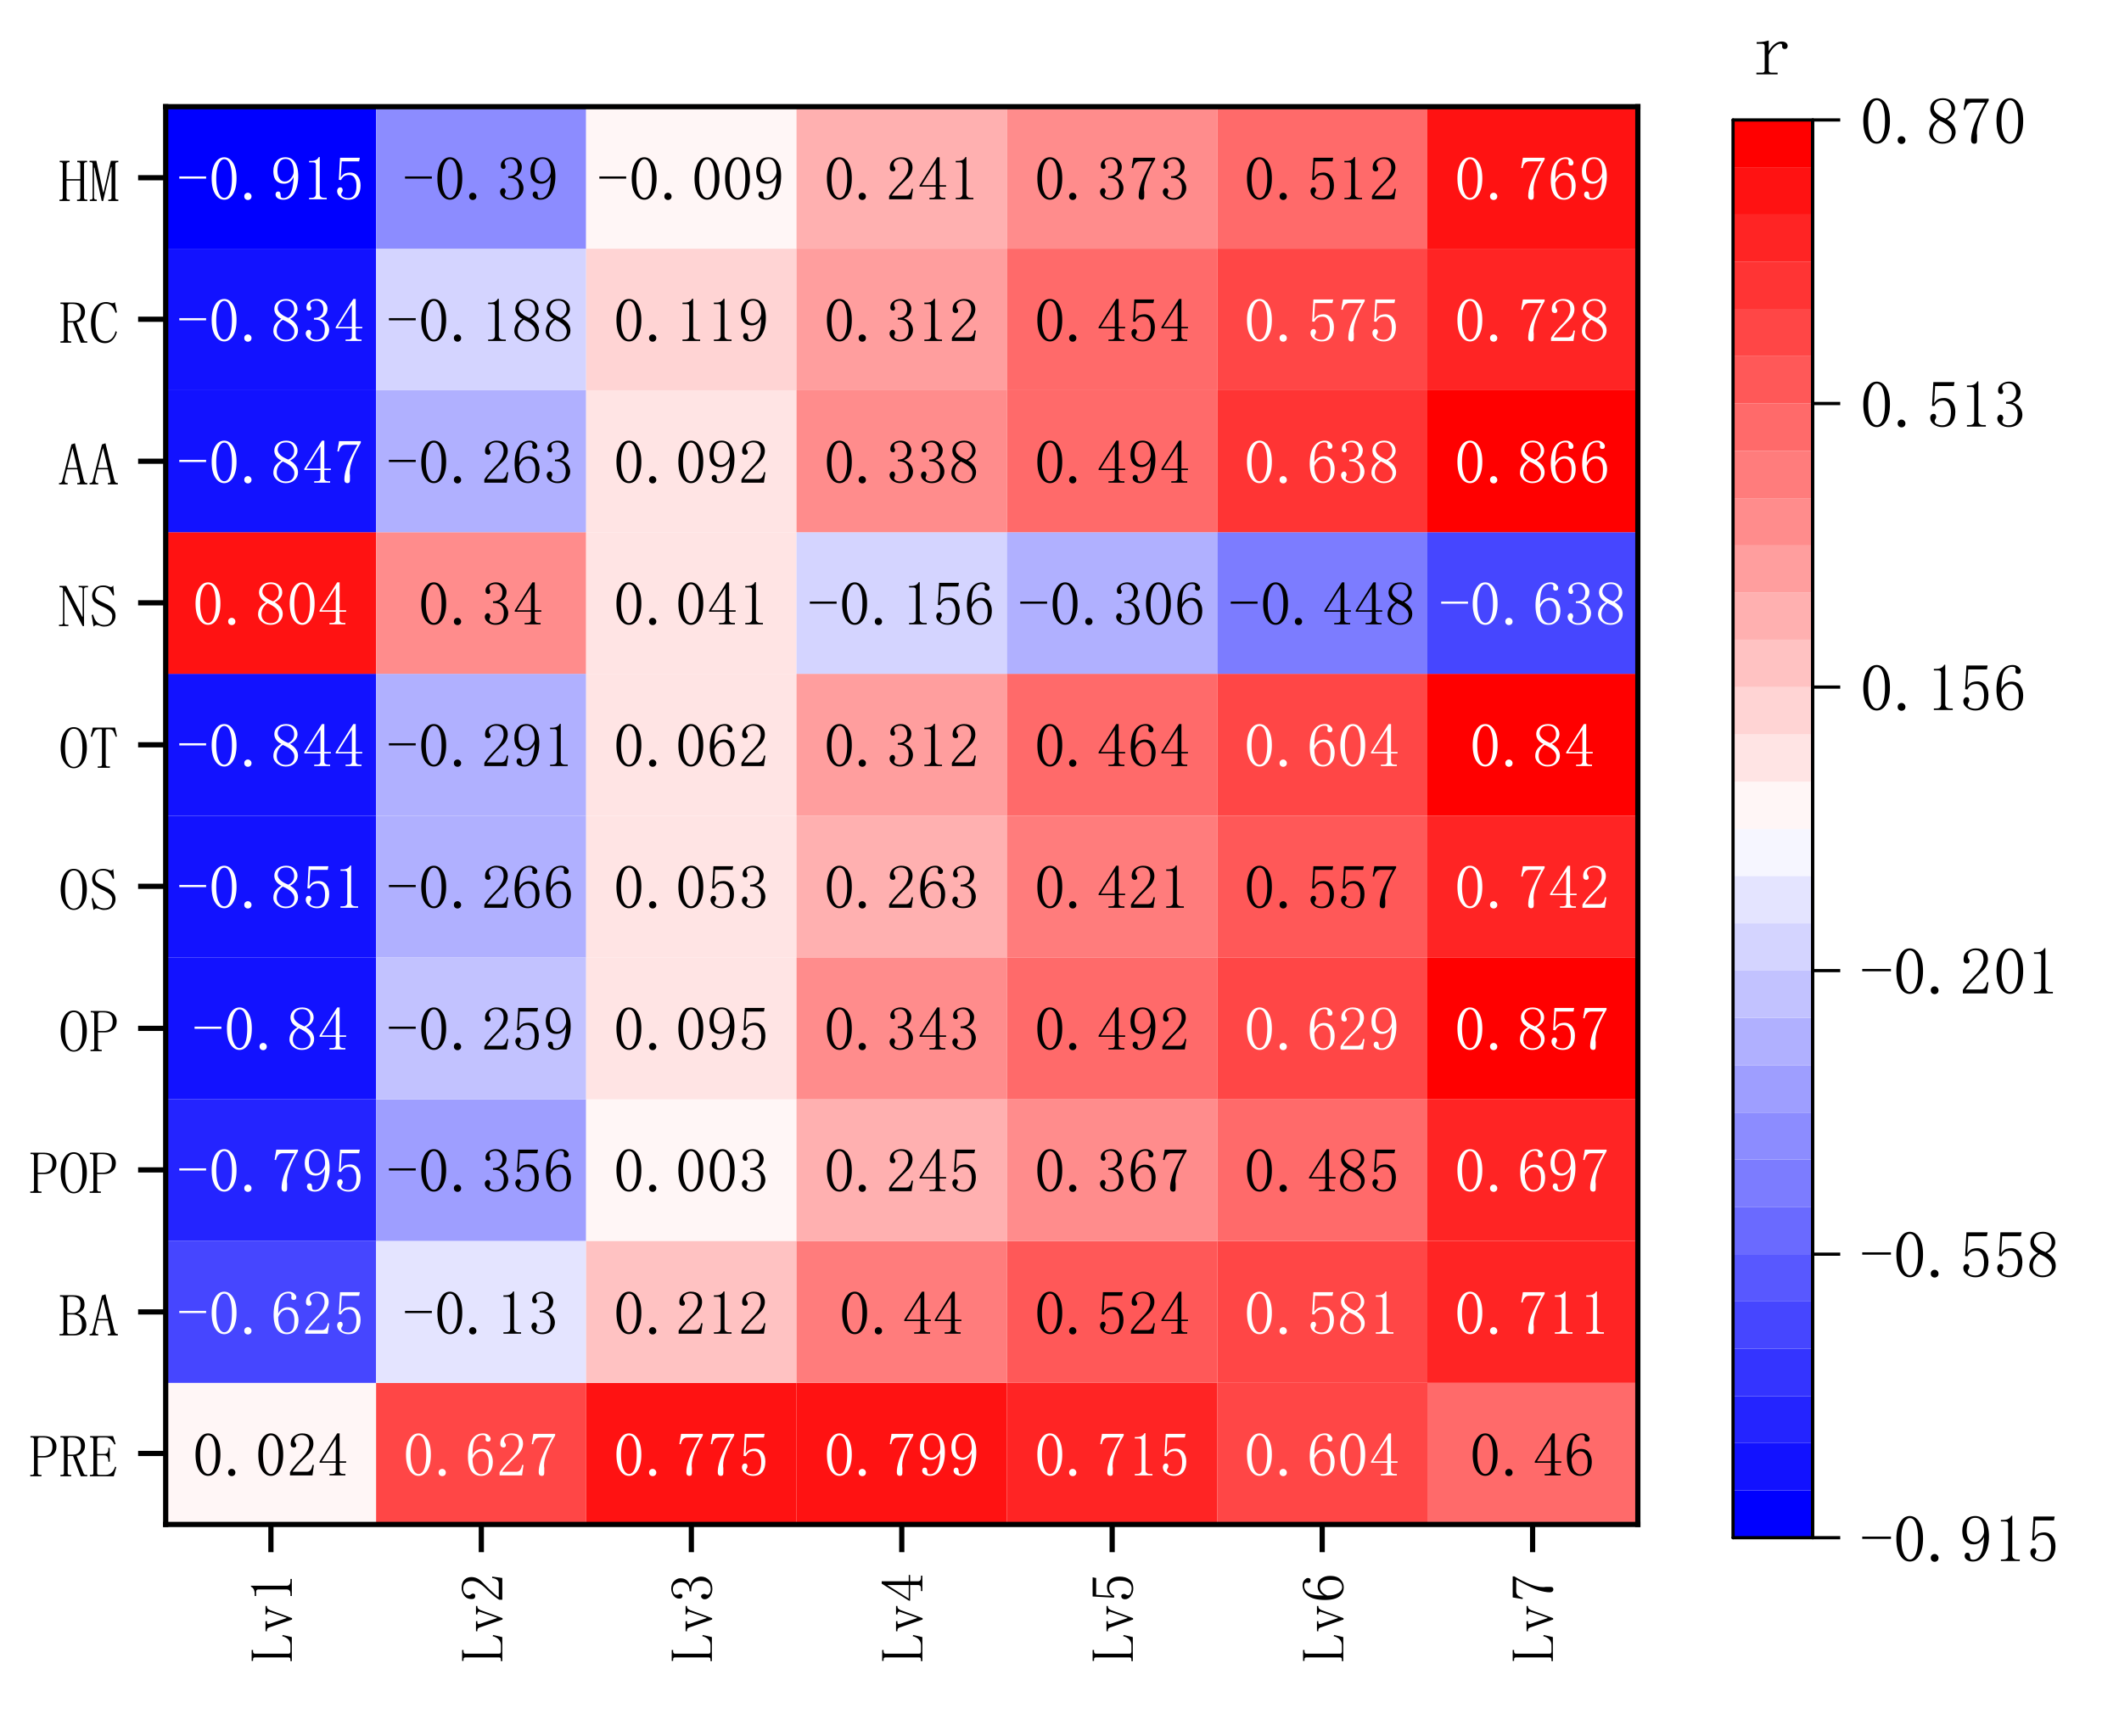
3.4. The Relationship between the NDVI and Socioeconomic Elements

The correlations of the NDVIS and all other indicators were calculated separately, and the results showed that there was no significant correlation between the NDVIS and all the elements except precipitation. Therefore, the correlation coefficients of the average NDVI for the seven regions in Table 2 and all the indicators mentioned above were calculated and are displayed in Figure 6.
It can be seen in Figure 6 that the output value of the primary industry (OP), the output value of the secondary industry (OS), and the output value of the tertiary industry (OT), which represent the level of economic development, had a significant negative correlation with the NDVI of lv1, and the secondary industry had the largest correlation. The economic development of the Xilin Gol League played a pivotal role in the degradation of grassland vegetation. The correlation between the output of raw coal (RC) and lv1 was also significant because excavation, surface subsidence, and surface occupation caused by coal production are direct causes of vegetation degradation [50]. The correlation coefficient of coal production was at the same level as the correlation coefficient of the tertiary output value, which showed the dominant position of the coal industry in the Xilin Gol League economic system. Population (POP) did not show high correlations with the NDVI of lv1, similar to economic factors. Considering the population base and economic growth rate of the Xilin Gol League, this represents a very slow population growth rate, and negative growth in a population often occurs. The population of the Xilin Gol League is far below the speed of its economic development. Compared with the mining activities, the impact of population growth on vegetation degradation was relatively small. The built-up area (BA) had an obvious negative correlation with the NDVI of lv1, but compared with the other indicators, the absolute value of its correlation coefficient was relatively small. Although the expansion of the urban scale is a direct factor in vegetation degradation, the scale of built-up areas calculated by the government is often affected by factors such as urban development plans, resulting in the poor accuracy of statistical data. Combined with the existence of urban green spaces and other factors, the built-up area did not show a significant impact on vegetation degradation.
Unexpectedly, the metric showing the highest correlation with the NDVI of lv1 was highway mileage (HM), which was the only correlation coefficient higher than 0.9. First of all, highway construction is a direct factor affecting vegetation degradation, because it often causes damage to the surrounding vegetation [51]. On the other hand, highway mileage can represent the level of economic development and industrial development in a region, both of which are important factors in vegetation destruction [52]. Therefore, the highway mileage is an ideal indicator to measure the speed of vegetation destruction in arid and semi-arid grassland mining areas.

4. Discussion

4.1. The Influence of Climatic Factors on Grassland

Figure 7 is a statistical graph of the mean value of the NDVI, precipitation, and temperature in the study area from 2000 to 2020. It can be seen in Figure 5 that the average NDVI in the study area showed a fluctuating upward trend, which means that the vegetation coverage was slowly improving year by year. Of these years, 2003, 2008, 2012, and 2018 were the relative peaks of NDVI variation in the study area, which happened to be the years with more precipitation.
Another obvious feature that can be seen in Figure 7 is, in most years, the trends of the NDVI and precipitation were the same, but the trend of temperature was the opposite. If the data from 2000 to 2020 were used to calculate the correlation of the NDVI with each element separately, the correlation of the NDVI with neither temperature nor precipitation would be significant. Considering that the data sources used for 2015 were different, the data from 2000 to 2015 were used for recalculation. The results showed that there was a significant correlation between the NDVI and precipitation at the 0.01 level (two-tailed), with a correlation coefficient of 0.745, but there was an insignificant correlation between the NDVI and temperature, with a correlation coefficient of −0.335. This suggested that the ability of precipitation to affect vegetation growth in arid and semi-arid regions is greater than that of temperature, and similar conclusions can be found from other sources [53]. However, precipitation was not positively correlated with vegetation in all arid and semi-arid regions. This correlation was related to vegetation type; that is, different types of vegetation have different demands for precipitation, and the hysteresis of vegetation growth will also affect it [28].

4.2. Significant Browning of Grassland Driven by Human Activities

According to the statistics of the proportion of each land type in the significant browning range in 2020, the main results from large to small are grassland (52.42%), artificial surface 23.93%, and bare land (12.25%). Considering that the proportion of grassland in the entire study area is as high as 88.17%, and the proportion of artificial ground surface area is only 0.553% (Table 3), the artificial ground surface area in the significant browning area has reached a very considerable level. Comparing the significant browning area in Figure 3b with the Google Earth image, it can be found that the artificial surfaces within the significant browning range mainly include urban built-up areas, coal mines, and industrial squares. Urban expansion and coal mining have been the main anthropogenic factors for the degradation of the Xilin Gol grassland, a conclusion that can be found in other studies [54]. Comparing the remote sensing images of Google Earth, the proportions of mining land and urban built-up areas that are both within the manmade surface range and within the significantly degraded range in 2020 were calculated. The results showed that the urban built-up area (33.45%) were much smaller than the mining land (65.54%). The area of browning caused by mining land in the study area has far exceeded the expansion of urban built-up areas.
On the other hand, the main drivers for the expansion of urban built-up areas are economic development and population growth [55]. The population growth rate in the study area has been extremely rapid. From 2000 to 2020, the net population growth rate was 11.62% (Appendix A), while this data was only 0.89% in the Inner Mongolia Autonomous Region, its superior administrative unit. Population growth brought sufficient driving force for the expansion of the Xilin Gol League built-up areas, resulting in the browning of grasslands. However, the main reason for the population growth of the Xilin Gol League is not natural growth. It can be seen from the attached Table A1 that the population of the Xilin Gol League experienced a sudden increase from 2003 to 2004. The number of population growth reached nearly 60,000, but the number of births in the area was only 9713, and the number of deaths was 6218. The local population growth has obvious characteristics of population migration driven by the coal industry, which can be verified in the “National Strategic Positioning of the Social and Economic Development of Xilingol League” issued by the Inner Mongolia Autonomous Region Social and Economic Development Research Center in 2004. It shows that, with the development of the coal mining industry, the population of the Xilin Gol League has increased significantly, thus promoting the continuous expansion of the city. On the other hand, the excavation, collapse, and occupation of the surface grassland caused by coal mining will cause direct grassland damage and accelerate the process of grassland desertification and soil erosion [56]. In conclusion, the vegetation degradation in the significantly browned areas in the study area is characterized by obvious anthropogenic effects. Coal mining, as the most important pillar industry in the local area, not only directly caused the significant degradation of vegetation but also brought about an extraordinary increase in the number of people, which led to the further degradation of grasslands. The improved buffer analysis method was used to calculate the vegetation influence range of several mining areas that were most seriously affected by human beings in the study area. Among them, Shengli Coal Mine and Baiyinhua Coal Mine, with larger areas, have vegetation influence ranges of about 9 km, while the smaller Wulagai Coal Mine has a vegetation influence range of about 4 km.

4.3. Greening of Grasslands and Its Driving Factors

The Xilin Gol League is an arid and semi-arid area with an average annual precipitation of less than 400 mm, where the main vegetation types are mainly grassland meadows with a fragile ecological environment. The distribution of vegetation cover in the study area showed the obvious characteristics of high levels in the east and low levels in the west, which were similar to the spatial distribution of the precipitation. It can be seen in Figure 6 that precipitation had a significant positive correlation with the NDVI of most of the study areas and had no correlation only with the NDVI of lv1, indicating that precipitation can affect the vegetation coverage in most areas.
It can be seen in Figure 6 that most indicators showed a significant positive correlation with the NDVI of lv7. Lv7, as the obviously optimized part of the vegetation in the study area, was mainly concentrated in the farmland or artificial grassland around the town. Figure 6 shows that the indicators of the highest correlation with the NDVI of lv7 were the accumulative afforestation area (AA), the output value of the primary industry (OP), and the output value of the tertiary industry (OT).
Since 2000, the Chinese government has implemented the policy of returning farmland to forests and grasslands. The Inner Mongolia Autonomous Region has implemented this policy since 2002. Since 2000, the cumulative afforestation area of the Xilin Gol League has reached 14,300 km2. Afforestation is one of the direct causes of greening in the study area, and a correlation coefficient as high as 0.866 proves that artificially guided afforestation plays an important role in the restoration of vegetation in the study area. Policy guidance is of great significance to the ecological environment construction in arid and semi-arid regions.
The Xilin Gol League is currently facing the problem of overreliance on the coal-dominated secondary industry for economic development, which is as high as 62% during the peak period of coal production. Under the pressure of environmental protection policies and resource depletion, industrial transformation is the main problem facing the current economic construction of the Xilin Gol League. It can be seen in Figure 6 that the correlation between the NDVI of lv7 and the output value of the primary and tertiary industries was much greater than that between the NDVI and the secondary industry. This indicated that protection of the ecological environment is of great significance to the development of the primary and tertiary industries in the study area and the realization of industrial upgrading and transformation.
Another noteworthy policy is the grass–animal balance policy, which was enacted in 2000 in the form of local regulations. Under the influence of this policy, the number of sheep in the study area has declined continuously from 2000 to 2020. Therefore, the number of sheep showed a low level of negative correlation with the NDVI of lv7 but no significant correlation with the NDVIS. Considering that lv7 is dominated by grassland and farmland around the city, we judged that the decrease in the number of sheep driven by policy and economy has a significant effect on the vegetation greening in the study area.

5. Conclusions

The vegetation changes in the Xilin Gol League have the following characteristics: (1) The study area has obvious greening as a whole, but the greening degree is limited. (2) Significant green areas and significant deterioration areas are scattered throughout the study area, and the significantly optimized area is about three times that of the significantly deteriorated area. (3) Most of the significant green areas are related to grassland, woodland, and cultivated land, and most of the significant brown areas are related to artificial surface and bare land. (4) The area of vegetation change dominated by human factors is small but significant.
The vegetation of the Xilin Gol League in the study area has the characteristics of a typical dry steppe area, and the land vegetation coverage rate is low. From 2000 to 2020, NDVI values of more than 70% of the land area were less than 0.6 in most years, and this proportion will increase significantly in years with sparse rainfall. The NDVI in the study area showed a decreasing trend from southeast to northwest. Using the time series analysis method, a total area of 4905.43 km2 was identified as significantly positive vegetation, and 257.43 km2 was identified as significantly negative vegetation.
The area significantly browned is much smaller than the significantly optimized area. The distribution of significant browning areas is highly influenced by human factors. Coal mining has a clear driving effect on the significant browning of the study area through direct destruction and population economic development.
The variation of the NDVI in the study area showed an obvious correlation with precipitation elements, but no correlation with temperature. Spatially, the area where the NDVI and precipitation showed significant correlation in the study area accounted for more than 50% of the total study area. In terms of time, before 2015, during the years with more precipitation, the mean value of vegetation in the study area showed an obvious upward trend. This means that the correlation between the mean value of the NDVI and the mean value of precipitation reached 0.745, and the response of vegetation to precipitation in the study area was very obvious.
From 2000 to 2020, the vegetation conditions in the study area showed a slight improvement in general, which is consistent with the findings of many scholars. The areas with significantly optimized vegetation had a high correlation with the primary and tertiary industries, which means that ecological environmental protection is an important means for the economic transformation and development of the Xilin Gol League. Areas with significantly degraded vegetation were significantly correlated with secondary industry and coal production, indicating that mining activities have a very significant impact on vegetation degradation in the study area.

Author Contributions

Conceptualization, J.H. and B.Y.; methodology, J.H. and B.Y.; software, J.H. and C.S.; validation, B.Y., Z.C. and C.S.; formal analysis, J.H.; investigation, J.H.; resources, J.H.; data curation, J.H.; writing—original draft preparation, J.H. and Z.C.; writing—review and editing, B.Y. and Z.C.; visualization, J.H. and C.S.; supervision, Z.B.; project administration, Z.B. and B.Y.; and funding acquisition, Z.B. and B.Y. All authors have read and agreed to the published version of the manuscript.

Funding

This research was funded by the Inner Mongolia Autonomous Region Science and Technology Major Special Project “Inner Mongolia Typical Mining Area Ecological Restoration Technology Integration and Demonstration” (2020ZD0020).

Institutional Review Board Statement

Not applicable.

Informed Consent Statement

Not applicable.

Data Availability Statement

The vegetation index data used in this paper is publicly available and can be found at (https://earthexplorer.usgs.gov/, accessed on 1 December 2021) The land cover map data in this paper is publicly available and came from the National Basic Geographic Information Center’s global land cover data product service website (DOI: 10.11769, http://www.globallandcover.com/, accessed on 1 December 2021). The high-definition remote sensing image is publicly available and can be found at (https://google-earth.gosur.com/cn/, accessed on 1 December 2021).

Conflicts of Interest

The authors declare no conflict of interest.

Appendix A

Table A1. Statistics of the Xilin Gol League from 2000 to 2020.
PER 1BA 1POP 1OP 1OS 1OT 1NS 1AA 1RC 1HM 1
2000272.1028.0099.3423.6925.7819.74920.611.92122.838023
2001235.8029.0691.8321.9829.2722.99840.434.223128.337233
2002275.8032.0093.3123.1532.4826.27899.449.861152.727498
2003348.3034.0093.9728.5442.4829.65861.912.92198.487571
2004292.3036.8099.5932.4362.5738.46837.327.55373.477758
2005222.3041.40100.6033.1082.0154.11765.6111.837693.828005
2006253.9041.40100.9035.71115.3964.34742.333.92112112,587
2007231.4043.60101.6839.10170.2380.12743.119.3022104.1114,703
2008324.1050.60102.7147.09250.5296.54622.1316.654665.5215,586
2009256.2070.00103.6052.14316.36116.50603.584.927216.0216,161
2010277.6073.50102.8659.60398.87133.58544.3513.925210,793.7317,318
2011270.1064.50103.3171.87463.01161.80534.8026.139112,79017,536
2012397.4068.00104.0681.58549.76188.86534.815.9214,631.6317,896
2013323.9068.00103.8991.50590.10220.80591.7423.235114,113.5518,097
2014278.6068.00104.0498.49589.52252.58576.0725.996112,134.4219,111
2015209.1069.00104.26105.50611.12283.48622.1631.16558365.6419,212
2016159.5670.05104.69115.30613.71316.50580.7038.00558137.119,518
2017114.3573.05105.16120.84618.62341.50616.8647.45559360.9719,875
2018175.22177.12105.48127.36646.64363.32653.0152.353510,584.8420,242
2019167.34179.07105.83123.16323.81351.62631.0058.683511,043.0124,055
2020278.60179.68110.88134.90357.99346.95588.3163.993510,971.9422,515
1 Unit: PER (mm), BA (km2), POP (ten thousand), OP (hundred million RMB), OS (hundred million RMB), OT (hundred million RMB), NS (ten thousand), AA (thousand hectares), RC (ten thousand tons), and HM (km).

References

  1. Shi, Y.; Cai, Y.; Zhao, M. Social interaction effect of rotational grazing and its policy implications for sustainable use of grassland: Evidence from pastoral areas in Inner Mongolia and Gansu, China. Land Use Policy 2021, 111, 105734. [Google Scholar] [CrossRef]
  2. Costanza, R.; D’Arge, R.; de Groot, R.; Farber, S.; Grasso, M.; Hannon, B.; Limburg, K.; Naeem, S.; O’Neill, R.V.; Paruelo, J.; et al. The value of the world’s ecosystem services and natural capital. Nature 1997, 387, 253–260. [Google Scholar] [CrossRef]
  3. Yu, D.; Li, Y.; Yin, B.; Wu, N.; Ye, R.; Liu, G. Spatiotemporal variation of net primary productivity and its response to drought in Inner Mongolian desert steppe. Glob. Ecol. Conserv. 2022, 33, e01991. [Google Scholar] [CrossRef]
  4. Wu, Z. Study on Landscape Pattern Optimization of Large-Scale Surface Coal Base in Semi-arid Steppe Based on 3S Integrated Technology. Ph.D. Thesis, China University of Mining and Technology, Xuzhou, China, 2020. [Google Scholar]
  5. Choudhury, A.; Lahkar, J.; Saikia, B.K.; Singh, A.K.A.; Chikkaputtaiah, C.; Boruah, H.P.D. Strategies to address coal mine-created environmental issues and their feasibility study on northeastern coalfields of Assam, India: A review. Environ. Dev. Sustain. 2021, 23, 9667–9709. [Google Scholar] [CrossRef]
  6. Bian, Z.; Yu, H.; Hou, J.; Mu, S. Influencing factors and evaluation of land degradation of 12 coal mine areas in Western China. J. China Coal Soc. 2020, 45, 338–350. [Google Scholar]
  7. Ma, Q.; Wu, J.; He, C.; Fang, X. The speed, scale, and environmental and economic impacts of surface coal mining in the Mongolian Plateau. Resour. Conserv. Recycl. 2021, 173, 105730. [Google Scholar] [CrossRef]
  8. Qian, T.N.; Bagan, H.; Kinoshita, T.; Yamagata, Y. Spatial-Temporal Analyses of Surface Coal Mining Dominated Land Degradation in Holingol, Inner Mongolia. IEEE J. Sel. Top. Appl. Earth Obs. Remote Sens. 2014, 7, 1675–1687. [Google Scholar] [CrossRef]
  9. Wu, Z.H.; Lei, S.G.; Lu, Q.Q.; Bian, Z.F. Impacts of Large-Scale Open-Pit Coal Base on the Landscape Ecological Health of Semi-Arid Grasslands. Remote Sens. 2019, 11, 1820. [Google Scholar] [CrossRef] [Green Version]
  10. Zou, Y.; He, X.; Zhao, J.; Li, Z.; Feng, Y.; Bao, H. The effect of open-pit coal mining on the surrounding grassland communities in north China-Case of West Second Open-Pit Mine in Xilin Hot. J. Arid Land Resour. Environ. 2019, 33, 199–203. [Google Scholar]
  11. Guangjun, W.; Zhenqi, H.U.; Haiqing, D.U.; Mingyi, D.U.; Qiuji, C. Analysis of Grassland Desertification Due to Coal Mining Based on Remote SensingAn Example from Huolinhe Open-cast Coalmine. J. Remote Sens. 2006, 10, 917–925. [Google Scholar]
  12. McKenna, P.B.; Lechner, A.M.; Phinn, S.; Erskine, P.D. Remote Sensing of Mine Site Rehabilitation for Ecological Outcomes: A Global Systematic Review. Remote Sens. 2020, 12, 3535. [Google Scholar] [CrossRef]
  13. Chen, B.; Xu, G.; Coops, N.; Ciais, P.; Innes, J.; Wang, G.; Myneni, R.; Wang, T.; Krzyzanowski, J.; Li, Q.; et al. Changes in vegetation photosynthetic activity trends across the Asia–Pacific region over the last three decades. Remote Sens. Environ. 2014, 144, 28–41. [Google Scholar] [CrossRef]
  14. Schell, J.A. Monitoring vegetation systems in the great plains with ERTS. Nasa Spec. Publ. 1973, 351, 309. [Google Scholar]
  15. Guan, Q.; Yang, L.; Pan, N.; Lin, J.; Xu, C.; Wang, F.; Liu, Z. Greening and Browning of the Hexi Corridor in Northwest China: Spatial Patterns and Responses to Climatic Variability and Anthropogenic Drivers. Remote Sens. 2018, 10, 1270. [Google Scholar] [CrossRef] [Green Version]
  16. He, P.; Xu, L.; Liu, Z.; Jing, Y.; Zhu, W. Dynamics of NDVI and its influencing factors in the Chinese Loess Plateau during 2002–2018. Reg. Sustain. 2021, 2, 36–46. [Google Scholar] [CrossRef]
  17. Das, P. 20 years MODIS-NDVI monitoring suggests that vegetation has increased significantly around Tehri Dam reservoir, Uttarakhand, India. Remote Sens. Appl. Soc. Environ. 2021, 24, 100610. [Google Scholar] [CrossRef]
  18. Liu, L.; Wang, Y.; Wang, Z.; Li, D.; Zhang, Y.; Qin, D.; Li, S. Elevation-dependent decline in vegetation greening rate driven by increasing dryness based on three satellite NDVI datasets on the Tibetan Plateau. Ecol. Indic. 2019, 107, 105569. [Google Scholar] [CrossRef]
  19. Zhumanova, M.; Mönnig, C.; Hergarten, C.; Darr, D.; Wrage-Mönnig, N. Assessment of vegetation degradation in mountainous pastures of the Western Tien-Shan, Kyrgyzstan, using eMODIS NDVI. Ecol. Indic. 2018, 95, 527–543. [Google Scholar] [CrossRef]
  20. Chu, H.; Venevsky, S.; Wu, C.; Wang, M. NDVI-based vegetation dynamics and its response to climate changes at Amur-Heilongjiang River Basin from 1982 to 2015. Sci. Total Environ. 2019, 650, 2051–2062. [Google Scholar] [CrossRef]
  21. Bian, J.; Li, A.; Zhang, Z.; Zhao, W.; Lei, G.; Yin, G.; Jin, H.; Tan, J.; Huang, C. Monitoring fractional green vegetation cover dynamics over a seasonally inundated alpine wetland using dense time series HJ-1A/B constellation images and an adaptive endmember selection LSMM model. Remote Sens. Environ. 2017, 197, 98–114. [Google Scholar] [CrossRef]
  22. Sun, B.; Li, Z.; Gao, Z.; Guo, Z.; Wang, B.; Hu, X.; Bai, L. Grassland degradation and restoration monitoring and driving forces analysis based on long time-series remote sensing data in Xilin Gol League. Acta Ecol. Sin. 2017, 37, 219–228. [Google Scholar] [CrossRef]
  23. Li, C.; Xian, G.; Zhou, Q.; Pengra, B.W. A novel automatic phenology learning (APL) method of training sample selection using multiple datasets for time-series land cover mapping. Remote Sens. Environ. 2021, 266, 112670. [Google Scholar] [CrossRef]
  24. Ahmed, T.; Singh, D. Probability density functions based classification of MODIS NDVI time series data and monitoring of vegetation growth cycle. Adv. Space Res. 2020, 66, 873–886. [Google Scholar] [CrossRef]
  25. Xu, L.; Yu, G.; Tu, Z.; Zhang, Y.; Tsendbazar, N.-E. Monitoring vegetation change and their potential drivers in Yangtze River Basin of China from 1982 to 2015. Environ. Monit. Assess. 2020, 192, 642. [Google Scholar] [CrossRef] [PubMed]
  26. Stevens, C.J.; Ceulemans, T.; Hodgson, J.G.; Jarvis, S.; Grime, J.P.; Smart, S.M. Drivers of vegetation change in grasslands of the Sheffield region, northern England, between 1965 and 2012/13. Appl. Veg. Sci. 2016, 19, 187–195. [Google Scholar] [CrossRef] [Green Version]
  27. Erli, W.; Junqi, Z. Analysis of NDVI Changes and Its Climate Factor Drivers in Ebinur Lake Basin from 1998 to 2012. J. Appl. Sci. 2015, 33, 59–69. [Google Scholar]
  28. Zhang, L.F.; Yan, H.W.; Qiu, L.S.; Cao, S.P.; He, Y.; Pang, G.J. Spatial and Temporal Analyses of Vegetation Changes at Multiple Time Scales in the Qilian Mountains. Remote Sens. 2021, 13, 5046. [Google Scholar] [CrossRef]
  29. Wang, J.F.; Li, X.H.; Christakos, G.; Liao, Y.L.; Zhang, T.; Gu, X.; Zheng, X.Y. Geographical Detectors-Based Health Risk Assessment and its Application in the Neural Tube Defects Study of the Heshun Region, China. Int. J. Geogr. Inf. Sci. 2010, 24, 107–127. [Google Scholar] [CrossRef]
  30. Yin, Q.; Wang, J.; Ren, Z.; Li, J.; Guo, Y. Mapping the increased minimum mortality temperatures in the context of global climate change. Nat. Commun. 2019, 10, 4640. [Google Scholar] [CrossRef] [PubMed] [Green Version]
  31. Bujalsky, L.; Jirka, V.; Zemek, F.; Frouz, J. Relationships between the normalised difference vegetation index and temperature fluctuations in post-mining sites. Int. J. Min. Reclam. Environ. 2018, 32, 254–263. [Google Scholar] [CrossRef]
  32. Li, Z.J.; Yao, X.L.; Yu, J.S.; Sun, W.C.; Li, H. Analysis of Vegetation Changes along the Roadsides Based on Remote Sensing. In Proceedings of the 3rd International Conference on Photonics and Image in Agriculture Engineering (PIAGENG), Sanya, China, 27–28 January 2013. [Google Scholar]
  33. Chen, H.; Li, S.C.; Zhang, Y.L. Impact of Road Construction on Vegetation alongside Qinghai-Xizang Highway and railway. Chin. Geogr. Sci. 2003, 13, 340–346. [Google Scholar] [CrossRef]
  34. Li, Q.; Hu, C.; Wang, M. Analysis on the Causes of Eco-environmental Deterioration in Xilinguole Typical Grassland Region and Counter Measures. Acta Sci. Nat. Univ. Neimongol 2003, 34, 166–172. [Google Scholar]
  35. Ye, D.; Chou, J.; Liu, J.; Zhang, Z.; Wang, Y.; Zhou, Z.; Ju, H.; Huang, Q. Causes of Sand-stormy Weather in Northern China and Contral Measures. Acta Geogr. Sin. 2000, 55, 513–521. [Google Scholar]
  36. Liu, Y.; Shi, L.; Chang, H.; Xie, Y. Analysis of driving factors that influence the pattern and quality of the ecosystem in Xilingol League. Acta Prataculturae Sin. 2021, 30, 17–26. [Google Scholar]
  37. Yan, Y.; Hu, Y.F.; Liu, Y.; Yu, G.M.; Haimei, W. The Tendency and its Spatial Pattern of Grassland Changes in the East Xilin Gol from 1975 to 2009. J. Geo Inf. Sci. 2011, 13, 1975–2009. [Google Scholar] [CrossRef]
  38. Batunacun; Wieland, R.; Lakes, T.; Yunfeng, H.; Nendel, C. Identifying drivers of land degradation in Xilingol, China, between 1975 and 2015. Land Use Policy 2019, 83, 543–559. [Google Scholar] [CrossRef]
  39. Zhang, R.; Yeh, E.T.; Tan, S. Marketization induced overgrazing: The political ecology of neoliberal pastoral policies in Inner Mongolia. J. Rural Stud. 2021, 86, 309–317. [Google Scholar] [CrossRef]
  40. Tian, Z.; Zhang, A.; Wang, H.; Cao, Y.; Fan, Q. Temporal and spatial variations of EVI and its response to influence of climate with different grassland types in Xilin Gol League. Pratacultural Sci. 2019, 36, 346–358. [Google Scholar]
  41. Kang, Y.; Guo, E.; Wang, Y.; Bao, Y.; Bao, Y.; Mandula, N. Monitoring Vegetation Change and Its Potential Drivers in Inner Mongolia from 2000 to 2019. Remote Sens. 2021, 13, 3357. [Google Scholar] [CrossRef]
  42. Feng, J.; Shi, N.-N.; Xiao, N.-W.; Wang, Q.; Gao, X.-Q.; Han, Y.; Quan, Z.-J. Spatio-temporal dynamics of normalized differential vegetation index and its driving factors in Xilin Gol, China. Chin. J. Plant Ecol. 2019, 43, 331–341. [Google Scholar] [CrossRef]
  43. Xu, J.; Zha, K. Mathematical Methods in Modern Geography, 3rd ed.; Higher Education Press: Beijing, China, 2002. [Google Scholar]
  44. Li, Y.; Cao, Z.; Long, H.; Liu, Y.; Li, W. Dynamic analysis of ecological environment combined with land cover and NDVI changes and implications for sustainable urban–rural development: The case of Mu Us Sandy Land, China. J. Clean. Prod. 2017, 142, 697–715. [Google Scholar] [CrossRef]
  45. Shahriar Pervez, M.; Budde, M.; Rowland, J. Mapping irrigated areas in Afghanistan over the past decade using MODIS NDVI. Remote Sens. Environ. 2014, 149, 155–165. [Google Scholar] [CrossRef] [Green Version]
  46. Pearson, K. On Further Methods of Determining Correlation; Dulau and Company: London, UK, 1907; Volume 16. [Google Scholar]
  47. Zafer, A.; Nawaz, R.; Iqbal, J. Face recognition with expression variation via robust ncc. In Proceedings of the 2013 IEEE 9th International Conference on Emerging Technologies (ICET), Islamabad, Pakistan, 9–10 December 2013; pp. 1–5. [Google Scholar]
  48. De Winter, J.C.; Gosling, S.D.; Potter, J. Comparing the Pearson and Spearman correlation coefficients across distributions and sample sizes: A tutorial using simulations and empirical data. Psychol. Methods 2016, 21, 273–290. [Google Scholar] [CrossRef] [PubMed]
  49. Jiangwen, F.A.N.; Huaping, Z.; Libo, C.; Wenyan, Z. Some Scientific Problems of Grassland Degradation in Arid and Semi-arid Regions in Northern China. Chin. J. Grassl. 2007, 29, 95–101. [Google Scholar]
  50. Bai, Z.; Zhou, W.; Wang, J.; Zhao, Z.; Cao, Y.; Zhou, Y. Rethink on Ecosystem Restoration and Rehabilitation of Mining Areas. China Land Sci. 2018, 32, 1–9. [Google Scholar]
  51. Coffin, A.W. From roadkill to road ecology: A review of the ecological effects of roads. J. Transp. Geogr. 2007, 15, 396–406. [Google Scholar] [CrossRef]
  52. Sun, J.X.; Li, Z.N.; Lei, J.Q.; Teng, D.X.; Li, S.Y. Study on the Relationship between Land Transport and Economic Growth in Xinjiang. Sustainability 2018, 10, 135. [Google Scholar] [CrossRef] [Green Version]
  53. Rousta, I.; Olafsson, H.; Moniruzzaman, M.; Zhang, H.; Liou, Y.-A.; Mushore, T.D.; Gupta, A. Impacts of Drought on Vegetation Assessed by Vegetation Indices and Meteorological Factors in Afghanistan. Remote Sens. 2020, 12, 2433. [Google Scholar] [CrossRef]
  54. Rong, A.; Bi, Q.; Dong, Z. Change of grassland vegetation and driving factors based on MODIS/NDVI in Xilingol, China. Resour. Sci. 2019, 41, 1374–1386. [Google Scholar]
  55. Zhou, Y.; Huang, X.; Xu, G.; Li, J. The coupling and driving forces between urban land expansion and population growth in Yangtze River Delta. Geogr. Res. 2016, 35, 313–324. [Google Scholar]
  56. Yao, F.; Guli, J.; Bao, A.; Zhang, J.; Li, C.; Liu, J. Damage assessment of the vegetable types based on remote sensing in the open coalmine of arid desert area. China Environ. Sci. 2013, 33, 707–713. [Google Scholar]
Figure 1. Location and terrain of the Xilin Gol League.
Remotesensing 14 01765 g001
Figure 2. Spatial distribution of the NDVI in the Xilin Gol League: (a) maximum value composite (MVC) and (b) mean.
Remotesensing 14 01765 g002
Figure 3. Spatial distribution of the NDVI variation slope in the study area. (a) Grading by the natural breakpoint method (Jenks). (b) Significance test.
Remotesensing 14 01765 g003
Figure 4. Main land type transformations in areas with significant vegetation changes. (a) Significant browning. (b) Significant greening.
Remotesensing 14 01765 g004
Figure 5. Spatial distribution of the correlations between the interannual variations of the NDVI and the interannual variations of the climate elements (a) precipitation and (b) temperature.
Remotesensing 14 01765 g005
Figure 6. Correlation coefficients between each indicator and the mean value of the NDVI in each area from 2000 to 2020.
Remotesensing 14 01765 g006
Figure 7. Fluctuation of the mean value of the NDVI and the mean value of the climatic elements in the study area from 2000 to 2020: (a) precipitation and (b) temperature.
Remotesensing 14 01765 g007
Table 1. The proportions of the area covered by different NDVI categories in the Xilin Gol League between 2000 and 2020.
YearNDVI (<0.2)NDVI (0.2–0.4)NDVI (0.4–0.6)NDVI (0.6–0.8)NDVI (0.8–1.0)
200010.19%56.13%25.30%7.78%0.61%
200125.14%36.86%26.80%9.73%1.47%
200212.58%39.27%29.89%16.27%1.99%
20032.62%38.87%34.60%22.27%1.65%
200414.35%38.04%29.60%16.11%1.90%
200524.19%27.95%30.22%14.99%2.65%
20068.11%42.57%30.14%16.67%2.51%
200711.92%55.71%26.61%5.26%0.51%
20088.67%35.36%32.71%20.11%3.15%
200915.83%56.46%20.93%5.71%1.06%
201016.57%43.82%29.90%8.53%1.17%
201115.92%36.20%27.06%18.63%2.19%
20121.51%32.45%32.46%29.75%3.84%
201311.32%33.11%31.48%20.59%3.51%
201421.32%29.58%31.21%14.58%3.31%
201514.60%34.39%31.21%16.20%3.60%
201610.33%54.24%25.10%8.33%1.99%
201716.19%38.70%25.23%17.76%2.12%
20182.18%27.67%33.55%32.21%4.39%
201910.10%42.29%30.59%14.21%2.82%
20201.55%36.88%38.28%20.03%3.28%
Mean7.84%41.18%37.54%12.15%1.30%
Max0.29%22.78%28.27%40.70%7.95%
Table 2. Statistics of different classifications of the interannual changes of the NDVI in the study area from 2000 to 2020.
LevelClassification Area (km2)Percentage Range of S
Lv1Significantly negative257.430.13%−0.054523 to −0.009223
Lv2Moderately negative9444.754.73%−0.009223 to −0.001361
Lv3Slightly negative41,352.1920.70%−0.001361–0.001259
Lv4Stable60,636.5630.35%0.001259–0.003131
Lv5Slightly positive56,135.9428.09%0.003131–0.005752
Lv6Moderately positive27,084.0013.55%0.005752–0.00987
Lv7Significantly positive4905.432.45%0.00987–0.040943
Table 3. The Xilin Gol League land transfer matrix from 2000 to 2020 (%).
2000 2020
FaL 1FL 1GL 1BL 1WeL 1WaA 1AS 1BL 1Total (2000)LossNet Gain
FaL2.1570.0040.9380.0010.0050.0010.0410.0053.1530.996−0.425
FL0.0040.4180.2680.0050.0030.0010.0020.0010.7010.283−0.068
GL0.5450.19681.4050.5050.3600.0740.3311.70385.1193.7143.053
BL0.0020.0030.4090.3160.0070.0010.0010.0460.7850.4690.073
WeL0.0030.0080.2960.0130.1560.0370.0080.1330.6520.4970.082
WaA0.0020.0040.1060.0040.1850.1570.0060.1100.5750.418−0.297
AS0.0070.0000.0510.0000.0000.0000.1340.0010.1930.0600.359
BL0.0070.0004.6990.0140.0170.0080.0304.0468.8214.775−2.776
Total (2020)2.7280.63388.1720.8580.7340.2770.5536.045100.000
Gain0.5710.2166.7660.5420.5790.1210.4191.99911.212
1 Note: FaL (Farmland), FL (Forest land), GL (Grassland), BL (Brushland), WeL (Wet land), WaA (Water area), AS (Artificial surface), and BL (Bare land).
Publisher’s Note: MDPI stays neutral with regard to jurisdictional claims in published maps and institutional affiliations.

