1. Introduction
The 2007 Earth Science Decadal Survey [
1] prioritized the need for improved flood prediction and drought monitoring, improved weather forecasting, and an enhanced understanding of the role of surface water in the energy and carbon cycles. This led to the launch of the Soil Moisture Active Passive (SMAP) mission in 2015. The mission included both radiometer and radar observations.
Radar measures microwave radar scattering off the Earth’s surface [
2] which is sensitive to soil moisture. Radiometry uses passive observations of thermal emissions which are closely related to soil moisture. The SMAP team created and validated algorithms to convert the radar and/or radiometer measurements to volumetric soil moisture measurements which were found to be accurate within the mission goal of 0.04 cm
/cm
error [
3,
4]. However, due to the failure of the SMAP radar, the baseline spatial resolution of the soil moisture measurements dropped from 9 km to 36 km. To address this, the Backus–Gilbert (BG) [
5,
6] algorithm is used to improve the effective resolution of the radiometer brightness temperature [
7,
8,
9,
10].
An alternate resolution enhancement technique is used in this paper. The radiometer form of the Scatterometer Image Reconstruction algorithm (rSIR) is faster than BG and has the potential to provide even higher resolution images than BG [
11,
12]. In this paper, we further the discussion in [
12] by applying the rSIR technique to several months of SMAP radiometer observations, and comparing the derived soil moisture product to other SMAP project products, L2_SM_SP and L2_SM_P.
In the following sections, we first briefly describe the SMAP mission and instrument. Then, a brief description of the rSIR algorithm is presented as applied to SMAP brightness temperature data. Third, the algorithm used to extract soil moisture from the brightness temperature radiometer data is briefly summarized. Then, the results are analyzed and compared to the separately validated data sets. Finally, conclusions are provided.
2. SMAP Instruments
The SMAP platform is unique in that it was designed with both a radar and radiometer for soil moisture retrieval, which enable the exploitation of the benefits of both active and passive soil moisture retrieval. While the radar failed shortly after the mission began, the radiometer continues to operate.
The SMAP instrument includes a rotating six-meter deployable mesh reflector antenna that is used by both the radiometer and radar instruments which share a single feed horn [
9,
13]. SMAP is also the first spaceborne radiometer to include a dedicated subsystem for detecting and correcting radio frequency interference (RFI) [
4,
14]. The conically scanning antenna rotates at approximately 13.0 rpm which maintains the overlap of measurements in the along-track direction. The measurements also overlap in the along-scan (rotation) direction [
12]. Both the radiometer and the radar receive signals at an incidence angle of approximately 40° over a 1000 km wide swath [
4,
7]. The radiometer retrieves brightness temperature measurements at vertical and horizontal polarizations, as well as the third and fourth Stokes parameters, which are mapped to a 36 km resolution Equal-Area Scalable Earth grid (EASE-2) grid [
15] using inverse distance gridding [
4,
7]. The total-power radiometer operates in the L-band (1.41 GHz center frequency) with a 24 MHz bandwidth.
3. rSIR Algorithm
The rSIR algorithm [
11] takes advantage of irregular sampling theory and knowledge of the measurement response function (MRF) to construct an image of the brightness temperature measurements at a finer resolution than the baseline 36 km [
12]. For SMAP, the MRF is primarily defined by the antenna pattern. rSIR is a signal reconstruction algorithm which assumes that the original signal to be reconstructed in the image is bandlimited, the irregular sampling meets generalized Nyquist requirements, and the frequency response of the MRF is non-zero over the signal bandwidth [
16]. The rSIR algorithm is described in detail in [
11] and its performance as applied to SMAP brightness temperature measurements is given in [
12]. It provides up to a 30% improvement in the effective resolution compared to the drop-in-the-bucket (DIB) gridding. In the following, we provide a brief overview the rSIR algorithm. The input radiometer measurements were obtained from SMAP product LPL1BTB [
17].
The rSIR algorithm is an iterative method to solve for the vector of actual surface brightness temperatures (
) in the equation:
where
is the observed brightness temperature measurements and
is the discrete samples of the MRF for each measurement [
12]. The MRF includes the effects of integration over the measurement period. rSIR results in an approximate maximum-entropy solution if the system is underdetermined, and a least-squares solution if it is overdetermined. In the zero-noise case with appropriate sampling, rSIR can exactly estimate the original signal [
11].
Unfortunately, since real brightness temperature measurements are not noise free, the reconstruction also enhances the noise. To reduce the noise effects, the processing is regularized by stopping the iteration before full reconstruction is achieved [
11,
12]. The goal of regularization is to find a balance between signal reconstruction accuracy and noise enhancement [
11], and can be varied for different applications. The optimization of rSIR for SMAP is given in [
12].
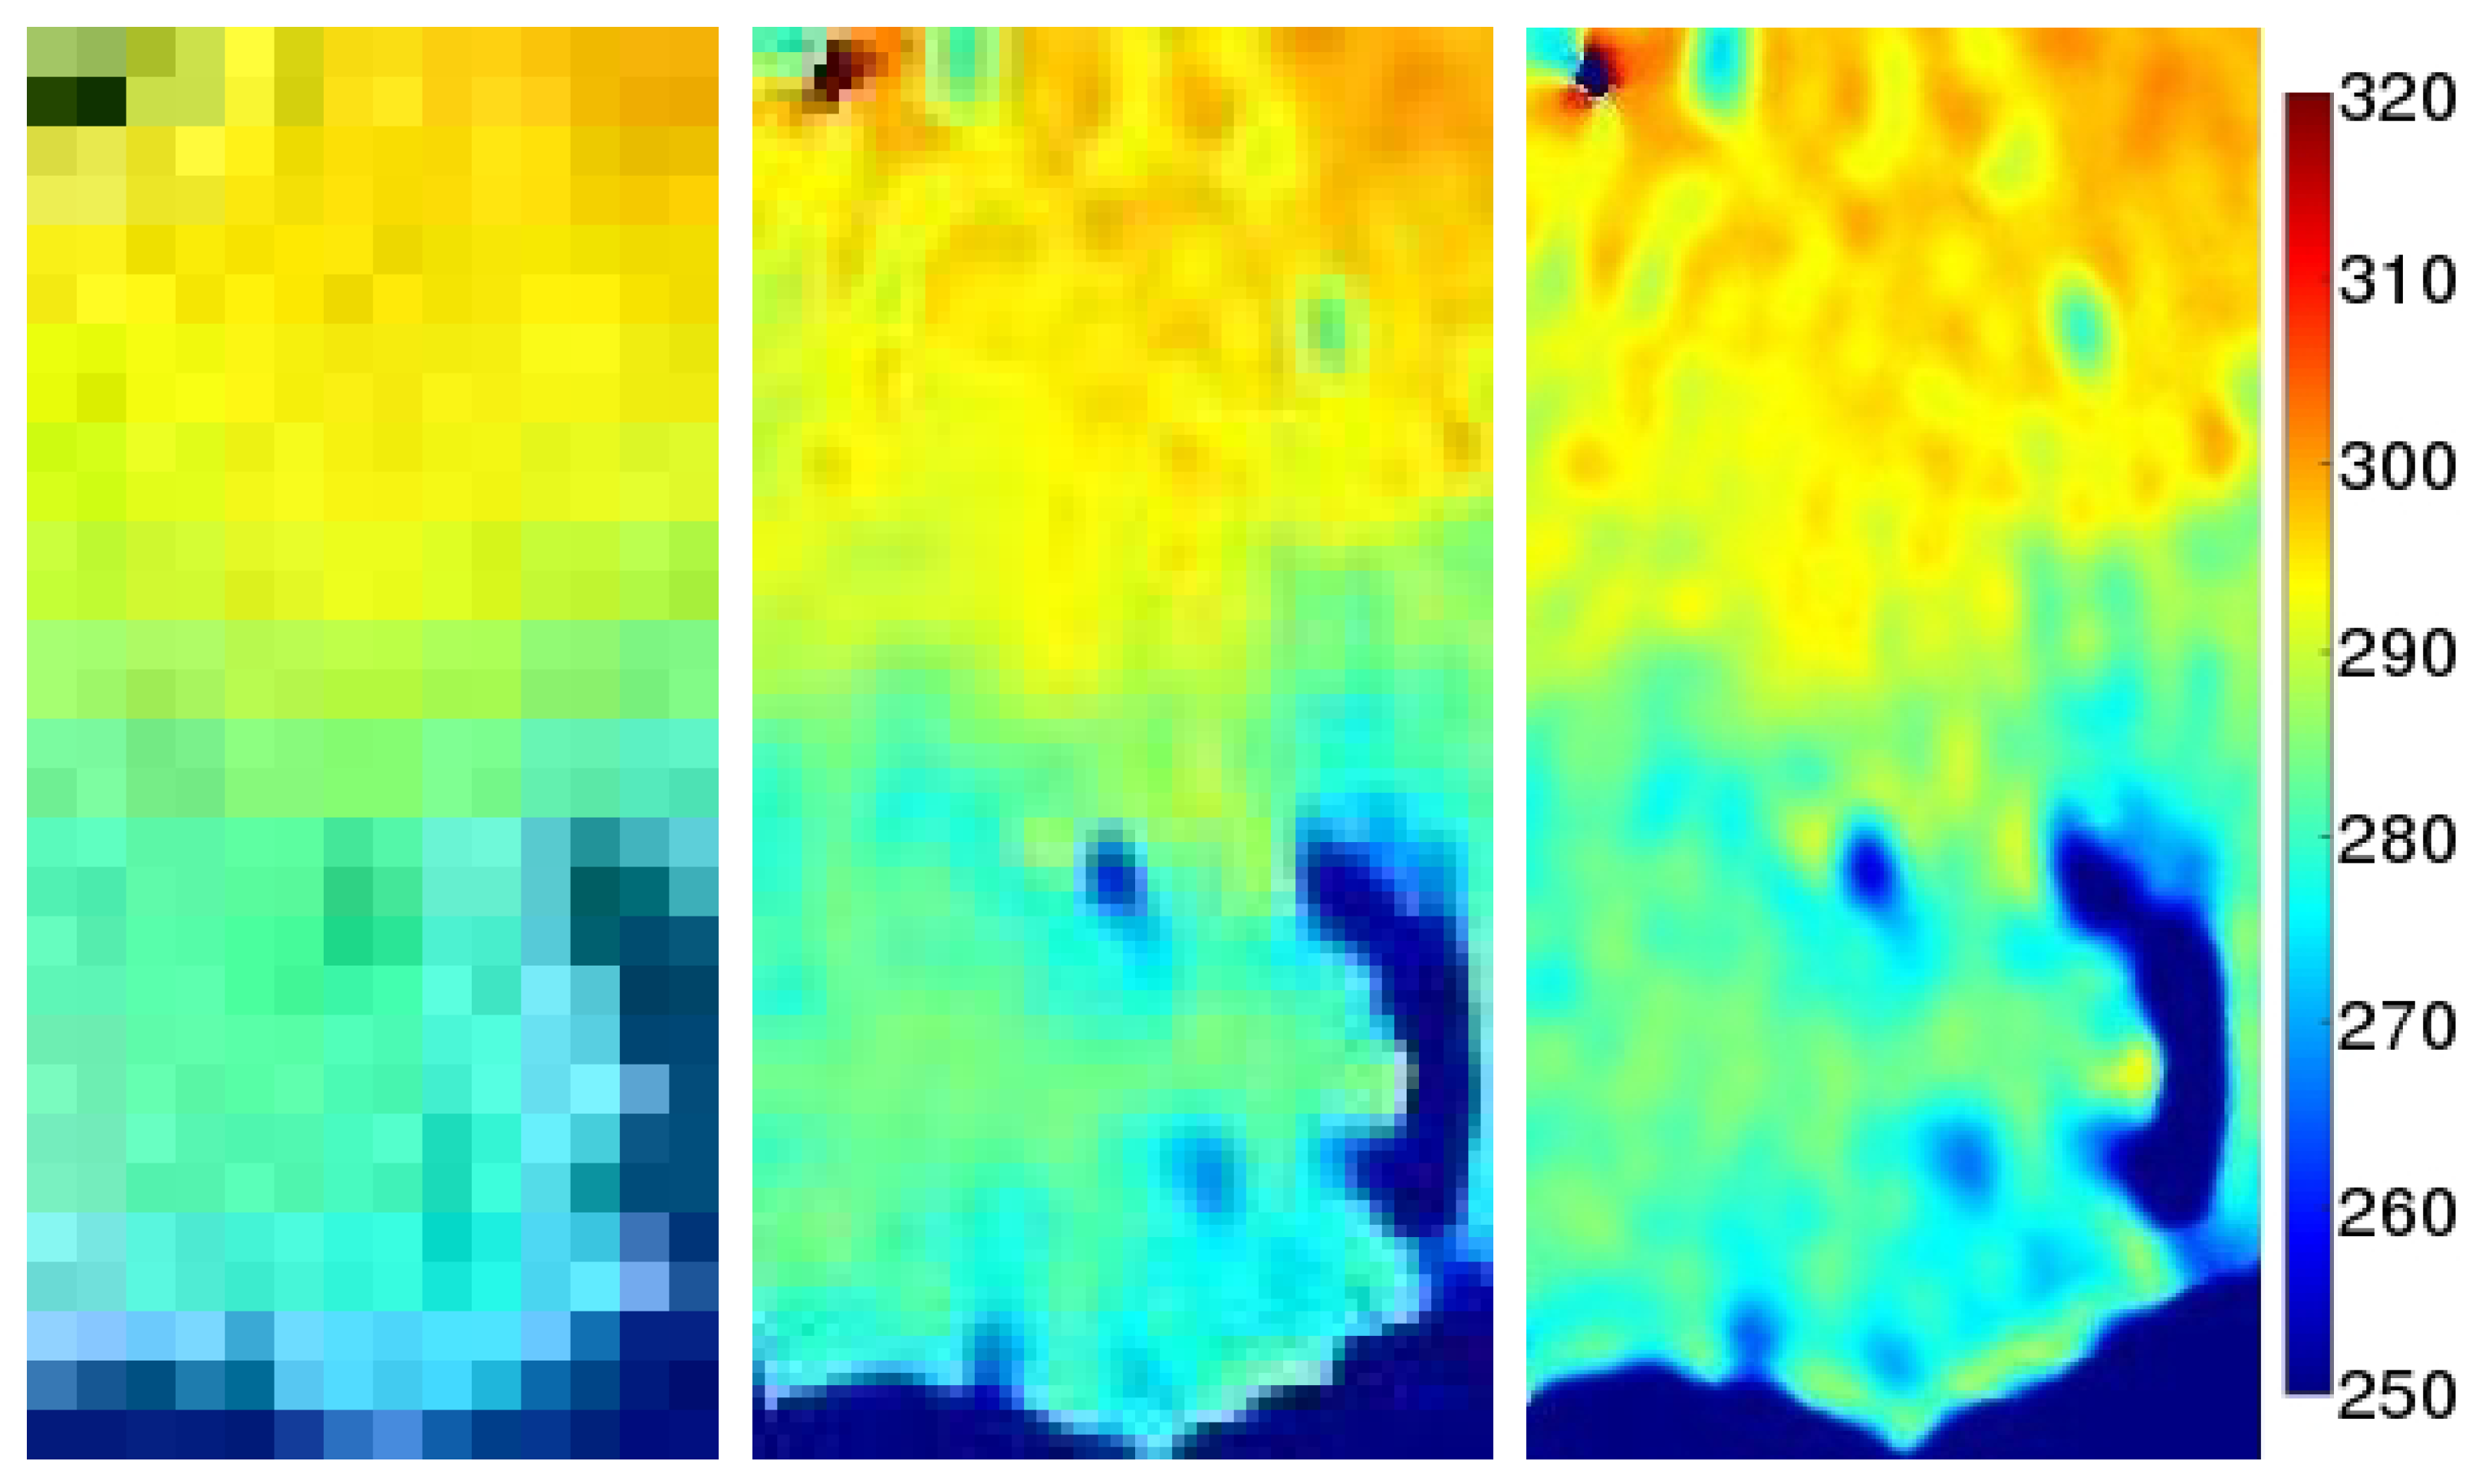
To illustrate the effectiveness of the fine resolution reconstruction,
Figure 1 shows an example of a single-pass brightness temperature image in a study region of west Africa at the original 36 km resolution created using the standard DIB gridding technique, and rSIR-enhanced resolution images produced at posting resolutions [
12] of 9 km and 3 km. The improvement in the effective resolution of the rSIR images is evident. The validation of the rSIR to SMAP radiometer measurements and comparison of rSIR and BG can be found in [
12], where rSIR is shown to have finer effective resolution than BG. We note that to meet the sampling requirements, the rSIR images are computed on oversampled grids and as expected and required, the effective resolution is less than the grid spacing.
While it is visibly apparent that finer-scale details are revealed in higher resolution images using the rSIR algorithm, it is instructive to also look at the pixel spatial response function (PRF), sometimes also called the impulse response function. The spatial extent of PRF determines the details resolvable in the images. The PRF is a combination of the measurement locations, the MRF, and the imaging algorithm employed [
12].
In practice, the PRF varies from location to location due to variations in the geometry over the swath. However, the PRF can be estimated using overlapping measurements of a small, bright target on a darker background using a simulation [
11,
12].
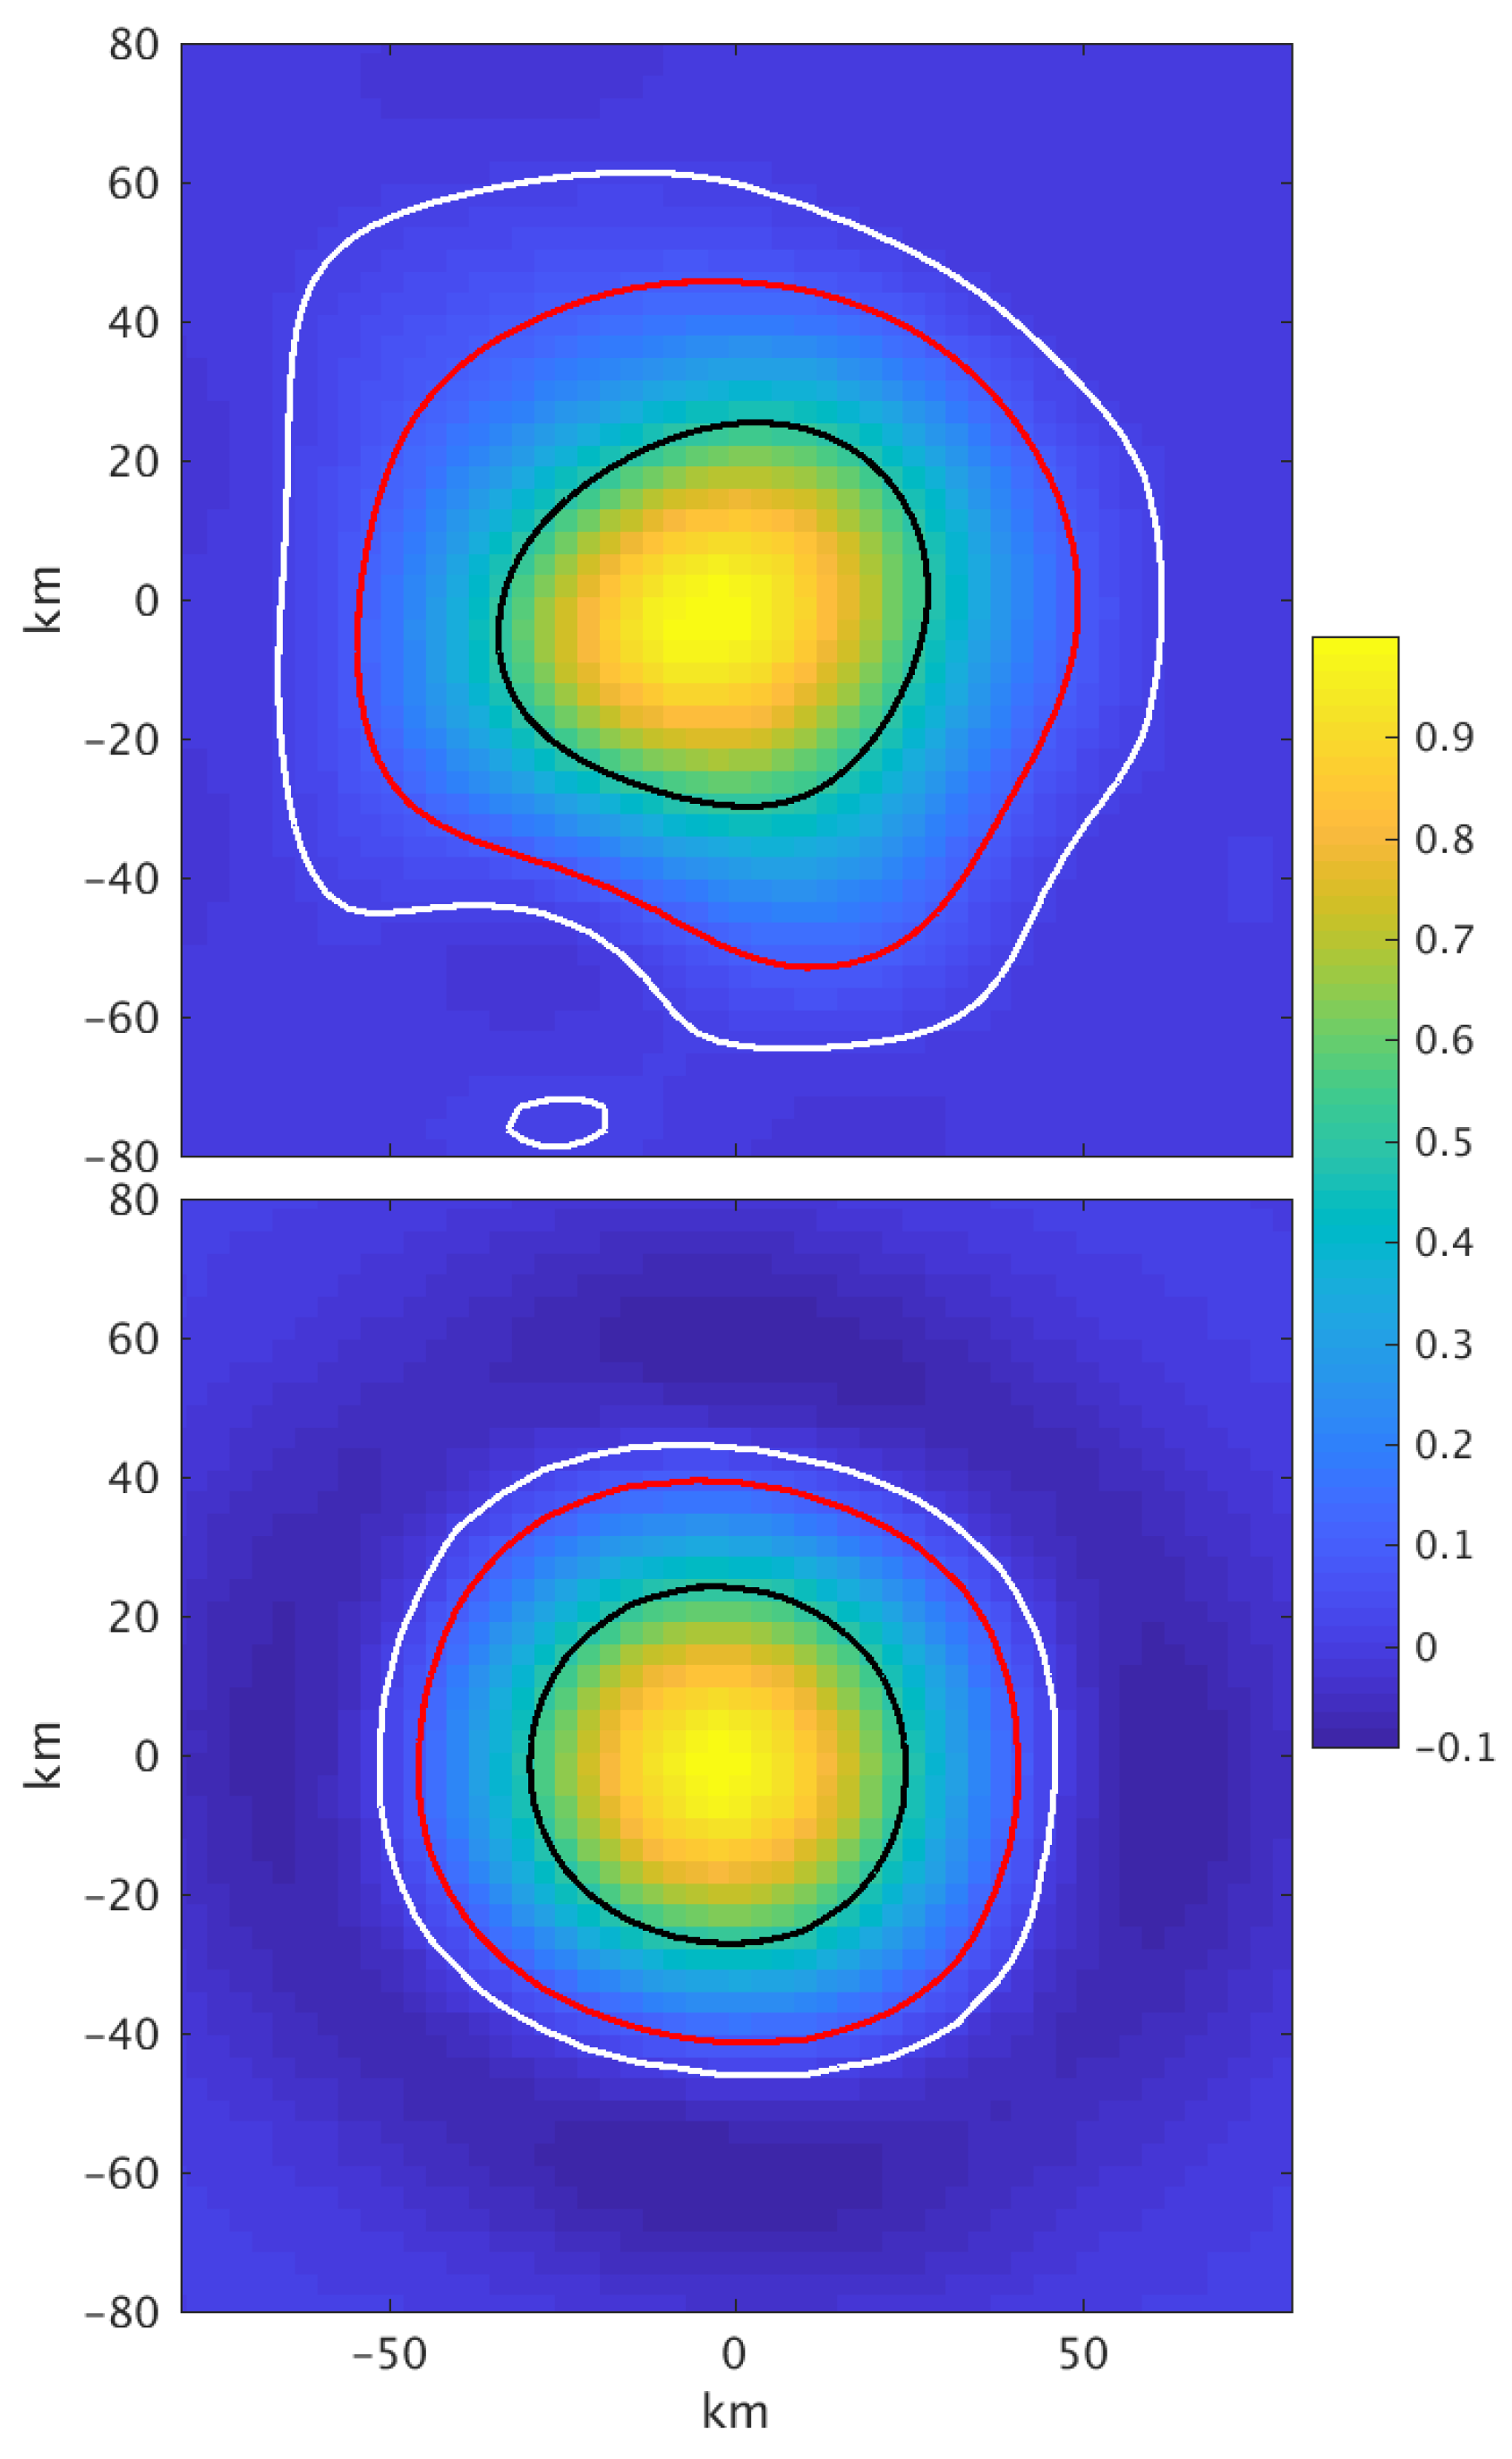
Figure 2 illustrates the nominal single-pass SMAP PRF for conventional and rSIR imaging. Though the improvement is limited in the single-pass case, note the tighter contours of the rSIR PRF compared to the conventional gridded PRF. Comparisons of rSIR and BG PRFs are shown in [
12].) The multi-pass PRF provides more improvement and potentially finer resolution [
11]. The half-power resolution of the enhanced brightness temperature images, as determined by the PRF derived from actual single-pass data, is approximately 18 km [
12], but finer details can be apparent. Regardless of the algorithm, radiometer-derived soil moisture estimates the benefit from the use of high resolution ancillary data in the estimation algorithm and so the soil moisture can exhibit finer effective resolution than the brightness temperature data [
7].
4. Soil Moisture Algorithm
This section briefly details the algorithm to retrieve rSIR-enhanced soil moisture from the brightness temperature values in this paper. It is the same as the JPL SMAP passive soil moisture extraction algorithm [
8], but does not include some antenna pattern corrections which we could not exactly replicate. The algorithm uses ancillary data included in the SMAP soil moisture products [
4,
18]. The following is a high-level description with some of the lower-level details left to documentation in [
8,
19]. The original active soil moisture extraction algorithm and methods to combine the active and passive measurements are described in [
7,
13,
20,
21].
4.1. Algorithm Description
The soil moisture retrieval algorithm overall flow is as follows: first, over a range of soil moistures, compute the corresponding emissivity using theoretical soil dielectric mixing model based on the soil composition given in ancillary products and the soil moisture. The value of emissivity which minimizes the error between the theoretically calculated emissivity and the observation-calculated emissivity is then selected, and the corresponding soil moisture value is reported. This algorithm is separately repeated for each pixel.
The first part of this process, estimating emissivity from the brightness temperature observation, requires several ancillary data sets. We use the ancillary data provided in the standard SMAP products [
4,
18]. These were mapped to the same grid as the products, simplifying calculation on a per pixel basis. After antenna pattern correction, the emissivity was calculated by converting brightness temperature (
) into total emissivity (
) according to:
where
T represents the surface temperature in the target pixel. Then, using information about the local single scattering albedo, vegetation opacity, and measurement incidence angle, we remove the estimated effects of the vegetation on the observed emissivity. Finally, the effects of soil roughness are estimated and removed to yield the final estimate of the smooth surface soil emissivity. Details of the steps to account for vegetation and soil roughness are described in [
7,
8].
The second part of the process, calculating a theoretical soil emissivity from a mixing model, starts with a range of possible soil moisture values (evenly spread from 0.02 to 0.50 cm
cm
for most SMAP soil moisture products) as well asthe local soil clay fraction value provided from an ancillary data set that is included in standard products [
18]. The soil moisture values are passed into a soil dielectric mixing model which calculates a dielectric value for soil with a specified composition. The specific model used is known as the mineralogy-based soil dielectric model (MBSDM), which is described and validated in [
22]. With the range of possible dielectric values after MBSDM, we calculate a range of possible theoretical emissivities using Fresnel’s equations. Following current SMAP passive data products, only vertically polarized brightness temperature measurements are used [
8].
Finally, the soil composition and corresponding soil moisture which minimize the error between the theoretically based emissivity and the observation-based smooth surface emissivity are selected. An example global brightness temperature and corresponding soil moisture map calculated with this algorithm are shown in
Figure 3.
4.2. Algorithm Limitations
In this study, there are circumstances under which brightness temperature is observed but soil moisture is not extracted. This especially occurs in the far northern regions of the globe due to the soil freeze state. Other factors which result in poor performance of the retrieval algorithm include brightness temperature measurement quality and land cover type: if the target pixel has excessively noisy measurements, a nearby water body, frozen ground, or excessively dense foliage covering the ground, the soil moisture accuracy is not trusted and is thus not reported. In general, however, consistent, reliable retrieval are obtained between 45° North and 45° South [
8].
5. Enhanced Resolution Soil Moisture Images
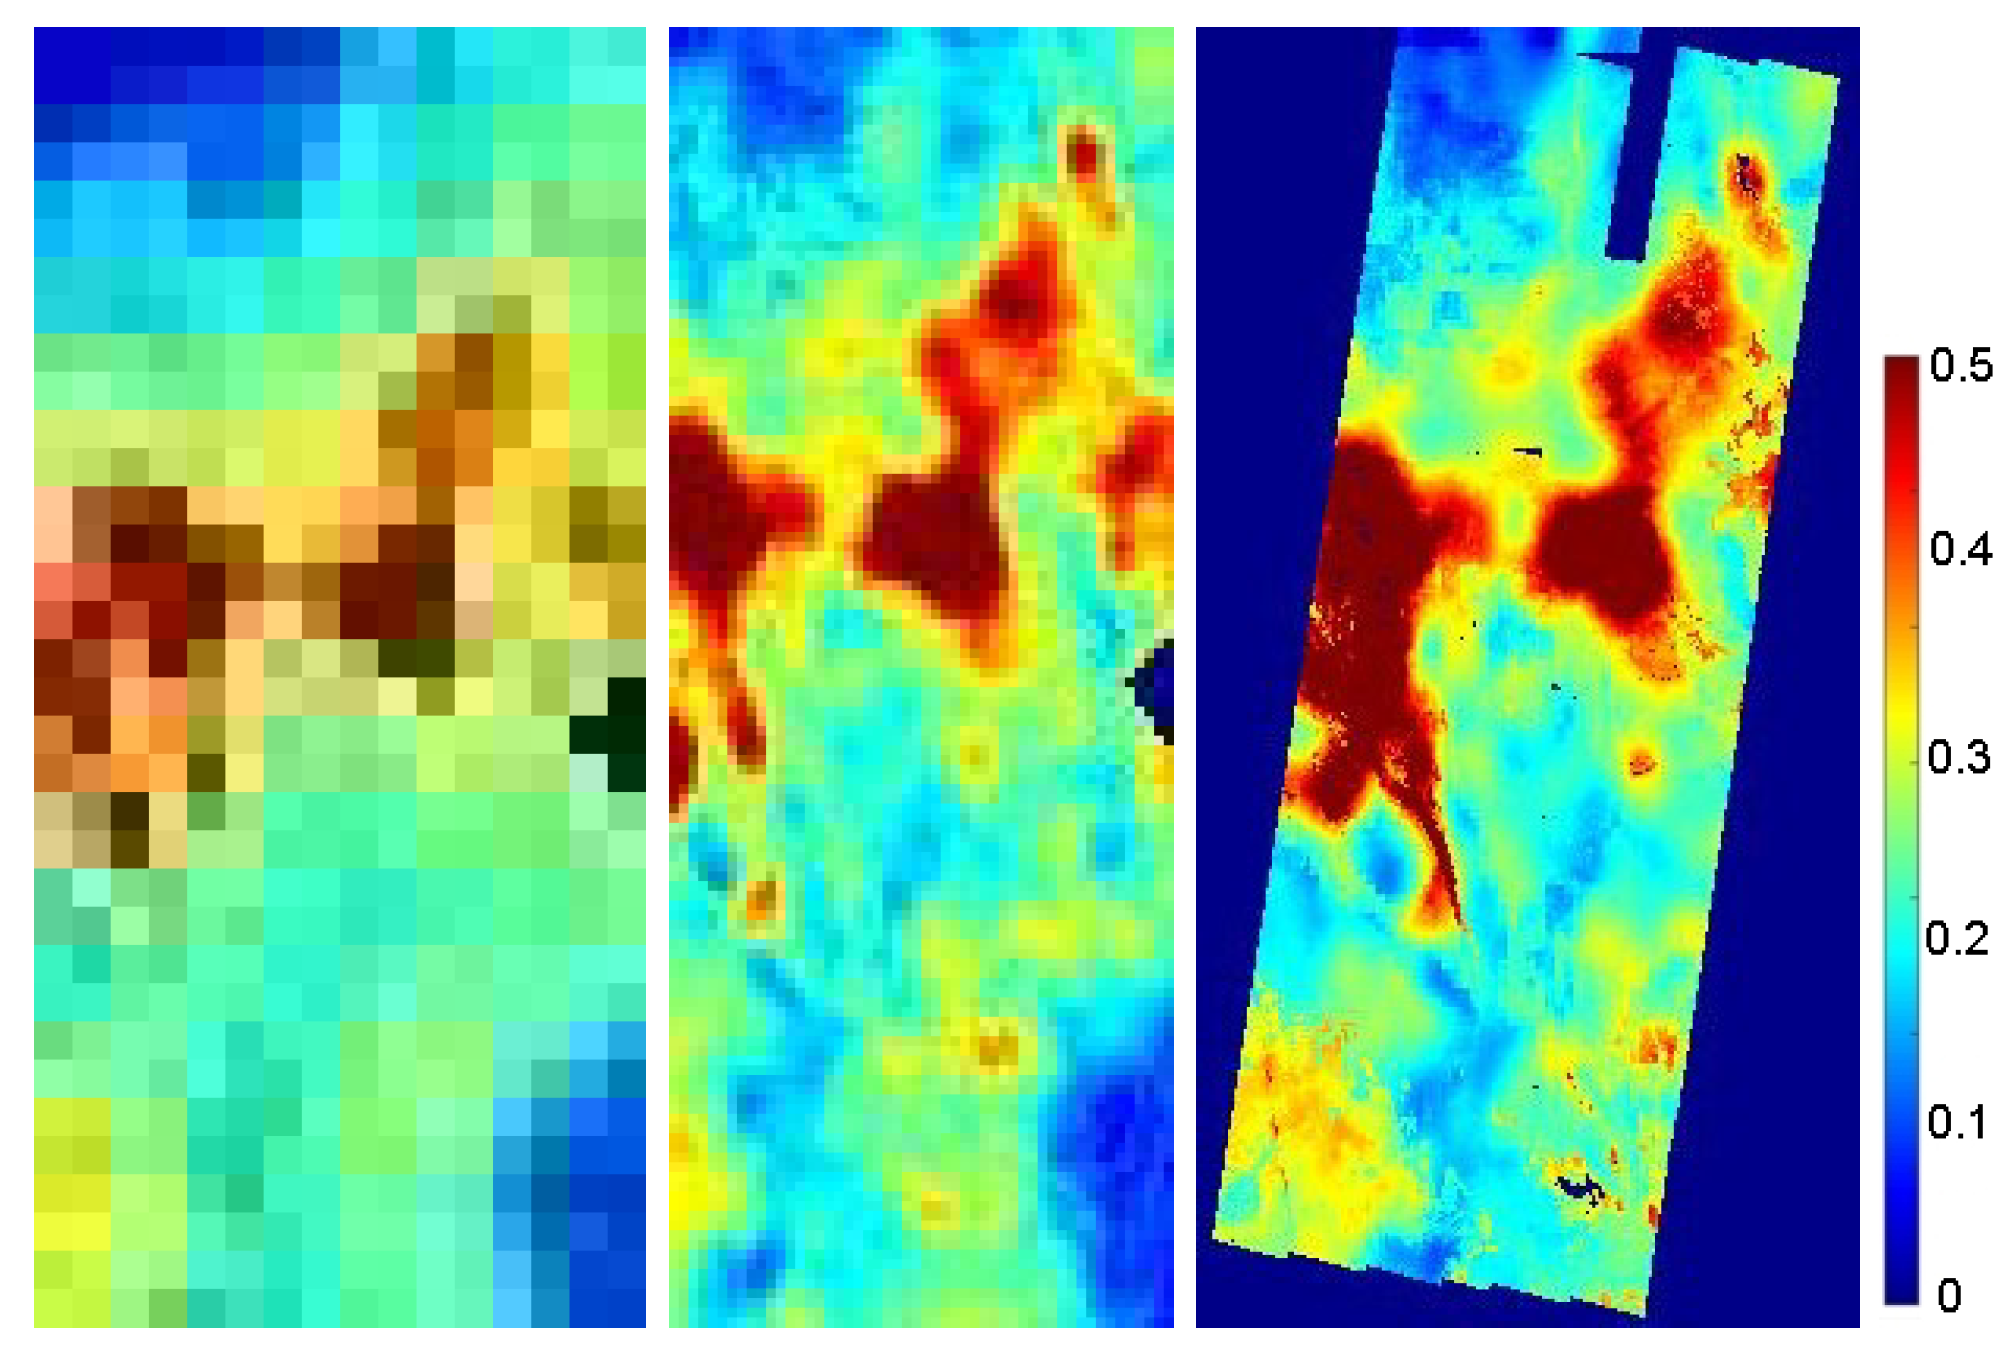
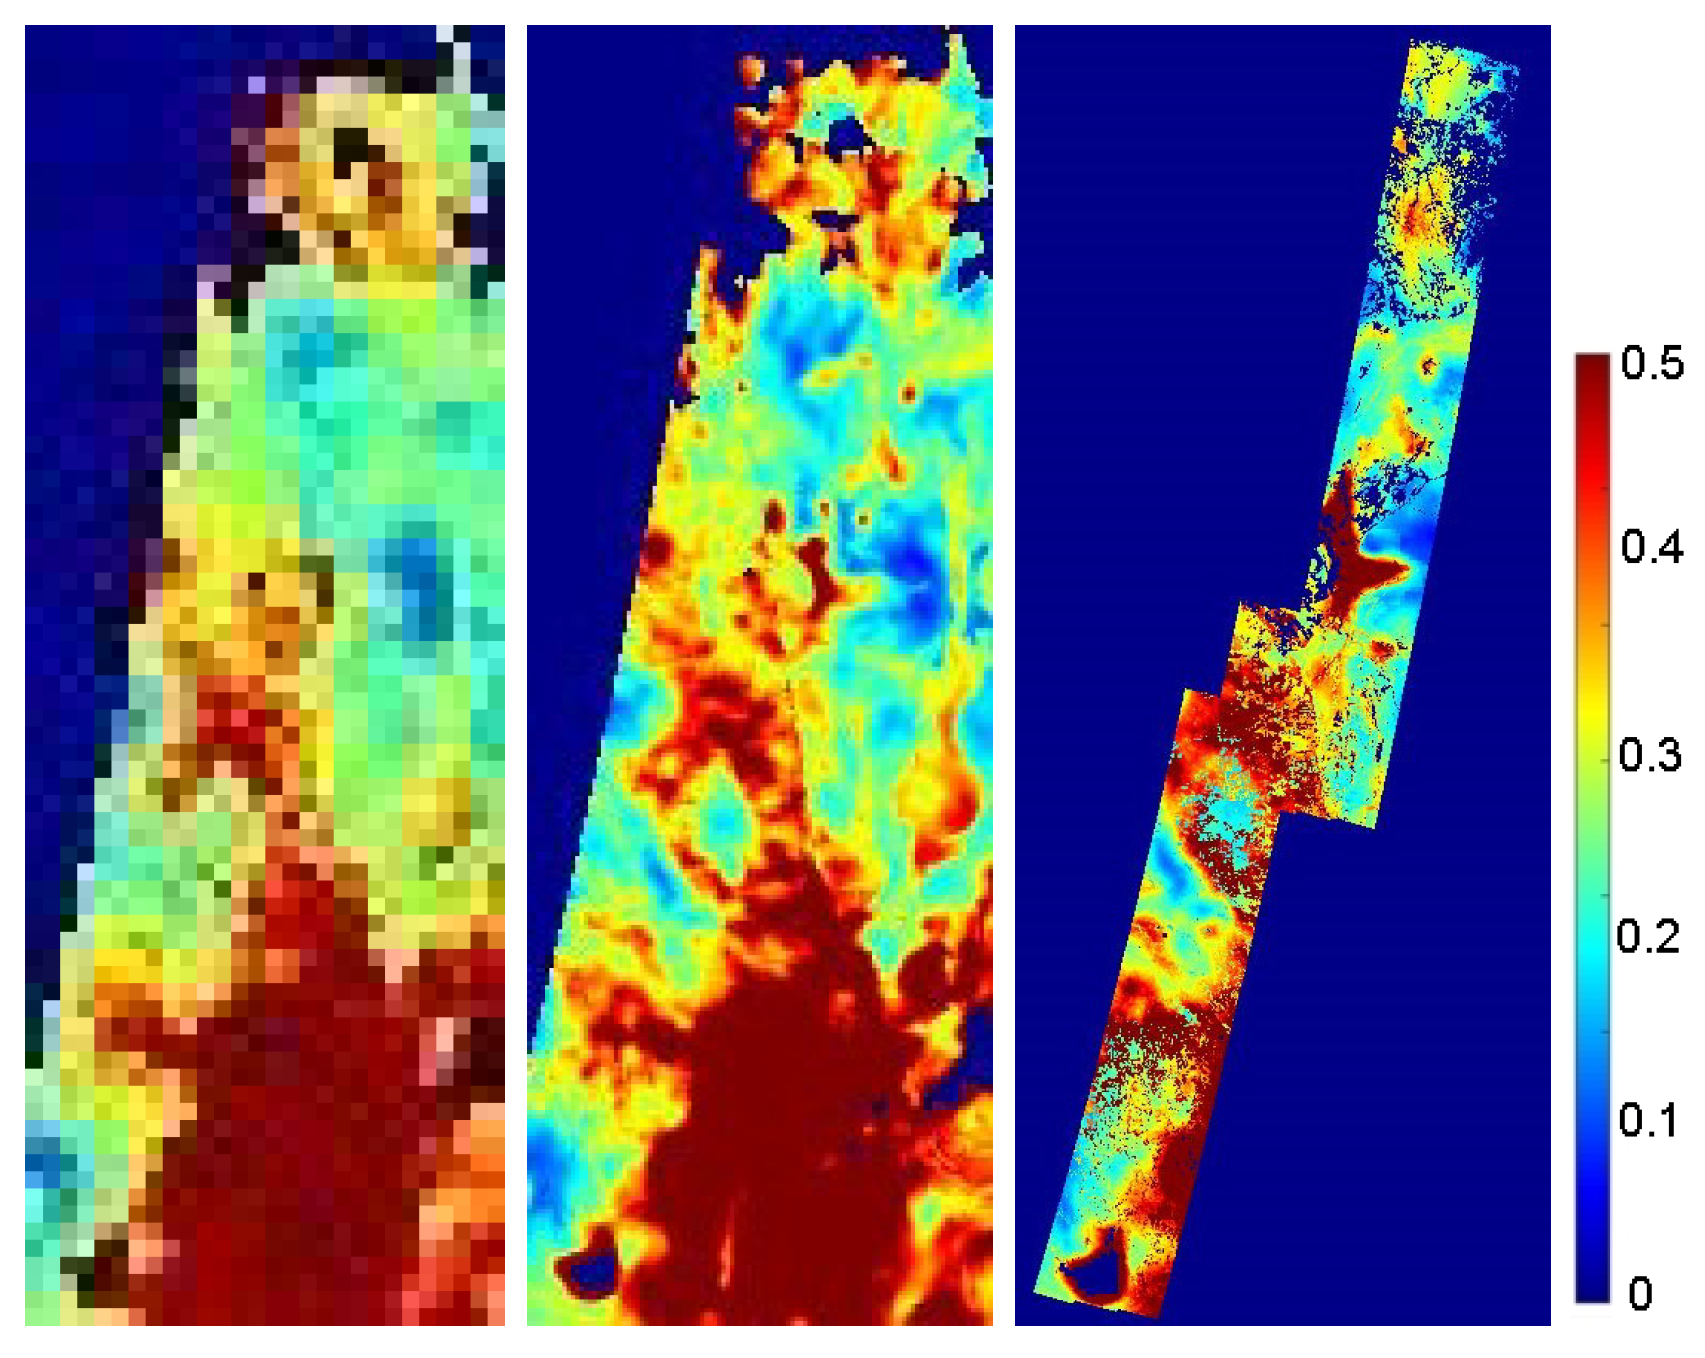
Examples of the results of different resolution enhanced soil moisture images from rSIR-enhanced brightness temperature can be seen in
Figure 4 and
Figure 5. The figures show the 36 km, 9 km, and 3 km soil moisture for parts of eastern Africa and central South America, respectively.
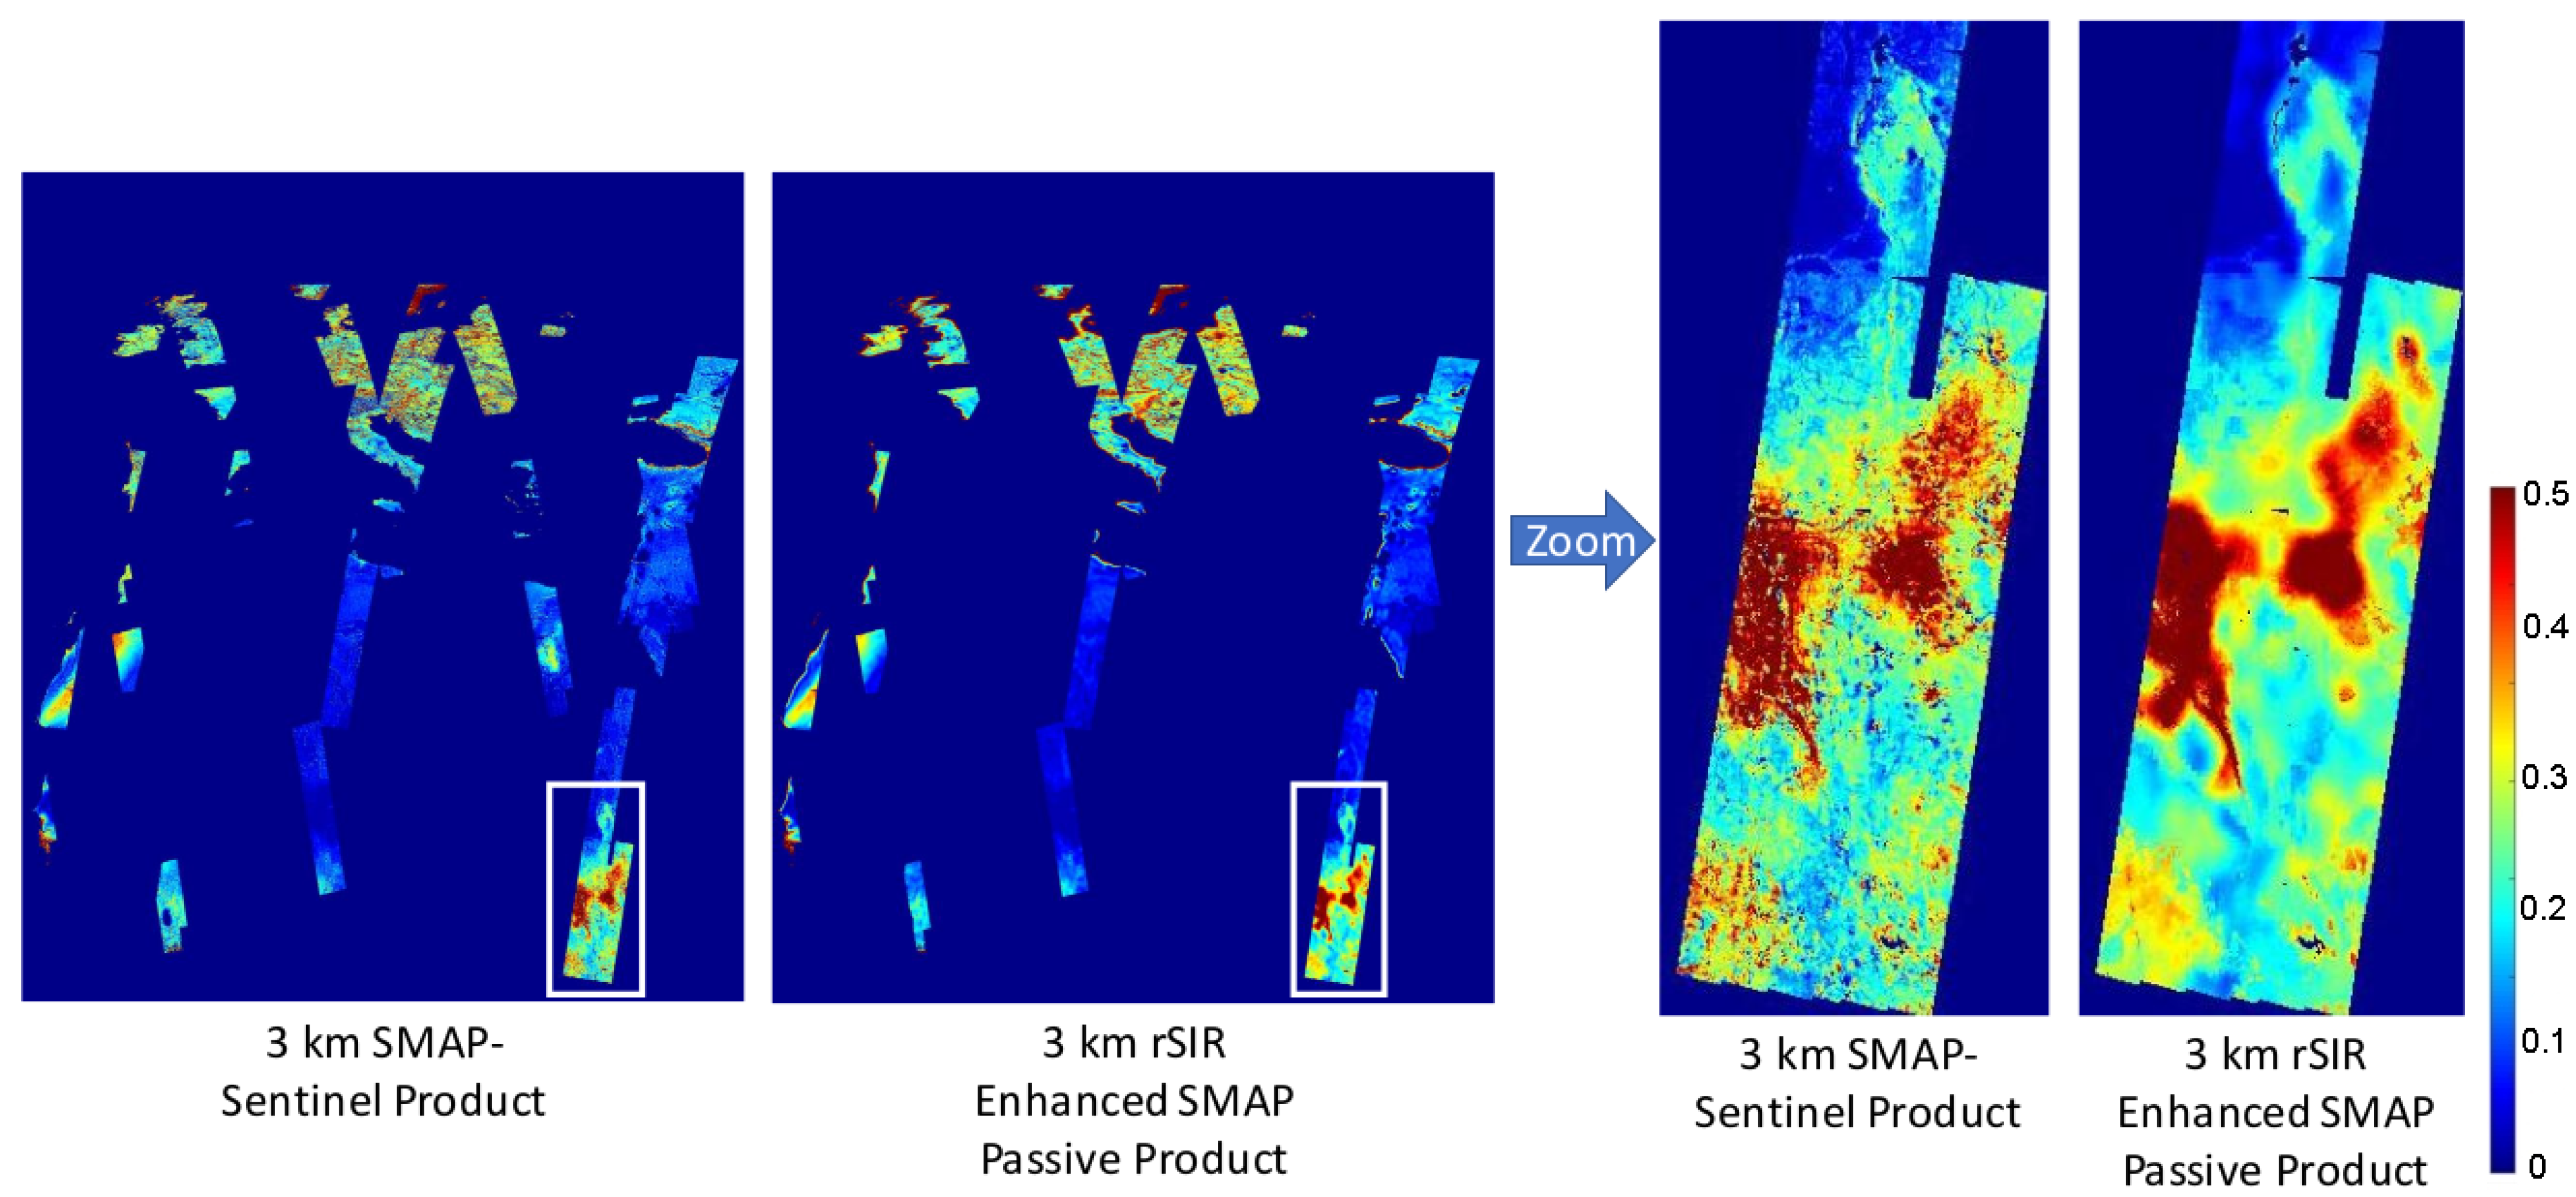
Figure 6 shows 3 km resolution images for the Sentinel-derived reference data set (described later in
Section 5.1) compared with the rSIR-enhanced data set. A visual inspection of these images shows that resolution enhancement using rSIR can reveal fine scale soil moisture features and details that are over-smoothed or hidden in lower-resolution images and that correlate well with the Sentinel product. The higher resolution features of the enhanced resolution soil moisture images with respect to the 36 km product is visibly apparent, with some fine scale features visible in the 3 km product even though the brightness temperature images have a coarser resolution. The accuracy of the enhanced resolution estimates is examined in the rest of this section.
5.1. Inter-Comparison
In this section, we compare the rSIR-enhanced results with previously validated data products, as in
Figure 6. For the 36 km and 9 km resolution grids, the SMAP radiometer-only soil moisture products are used [
7,
23,
24]. These products have reported accuracies of 0.04 cm
cm
compared to in situ measurements [
8]. For the 3 km pixel resolution comparison, a recently released product that combines the SMAP radiometer and Sentinel radar data [
25,
26] is used. This product has a quoted accuracy of 0.05 cm
cm
[
27].
To produce the Sentinel-SMAP combined product, the Sentinel radar data are used as a replacement for the SMAP radar in the active-passive merged soil moisture algorithm [
21]. Sentinel is a C-band synthetic aperture radar and has several differences from the original SMAP radar, but one key advantage is that Sentinel provides backscatter data at a higher resolution than SMAP that enables production of a merged soil moisture product at 3 km, albeit with limited coverage. Due to the narrow swath width of the Sentinel system, there are relatively few SMAP and Sentinel measurements which correspond in time and location closely enough to provide accurate results in soil moisture extraction [
27]. Thus, the SMAP/Sentinel combined soil moisture product comes in small 30-second scenes (as in the 3 km pixel images in
Figure 4,
Figure 5 and
Figure 6). Though noisy, the high resolution Sentinel-SMAP combined product is helpful in analyzing key fine resolution features of the rSIR product.
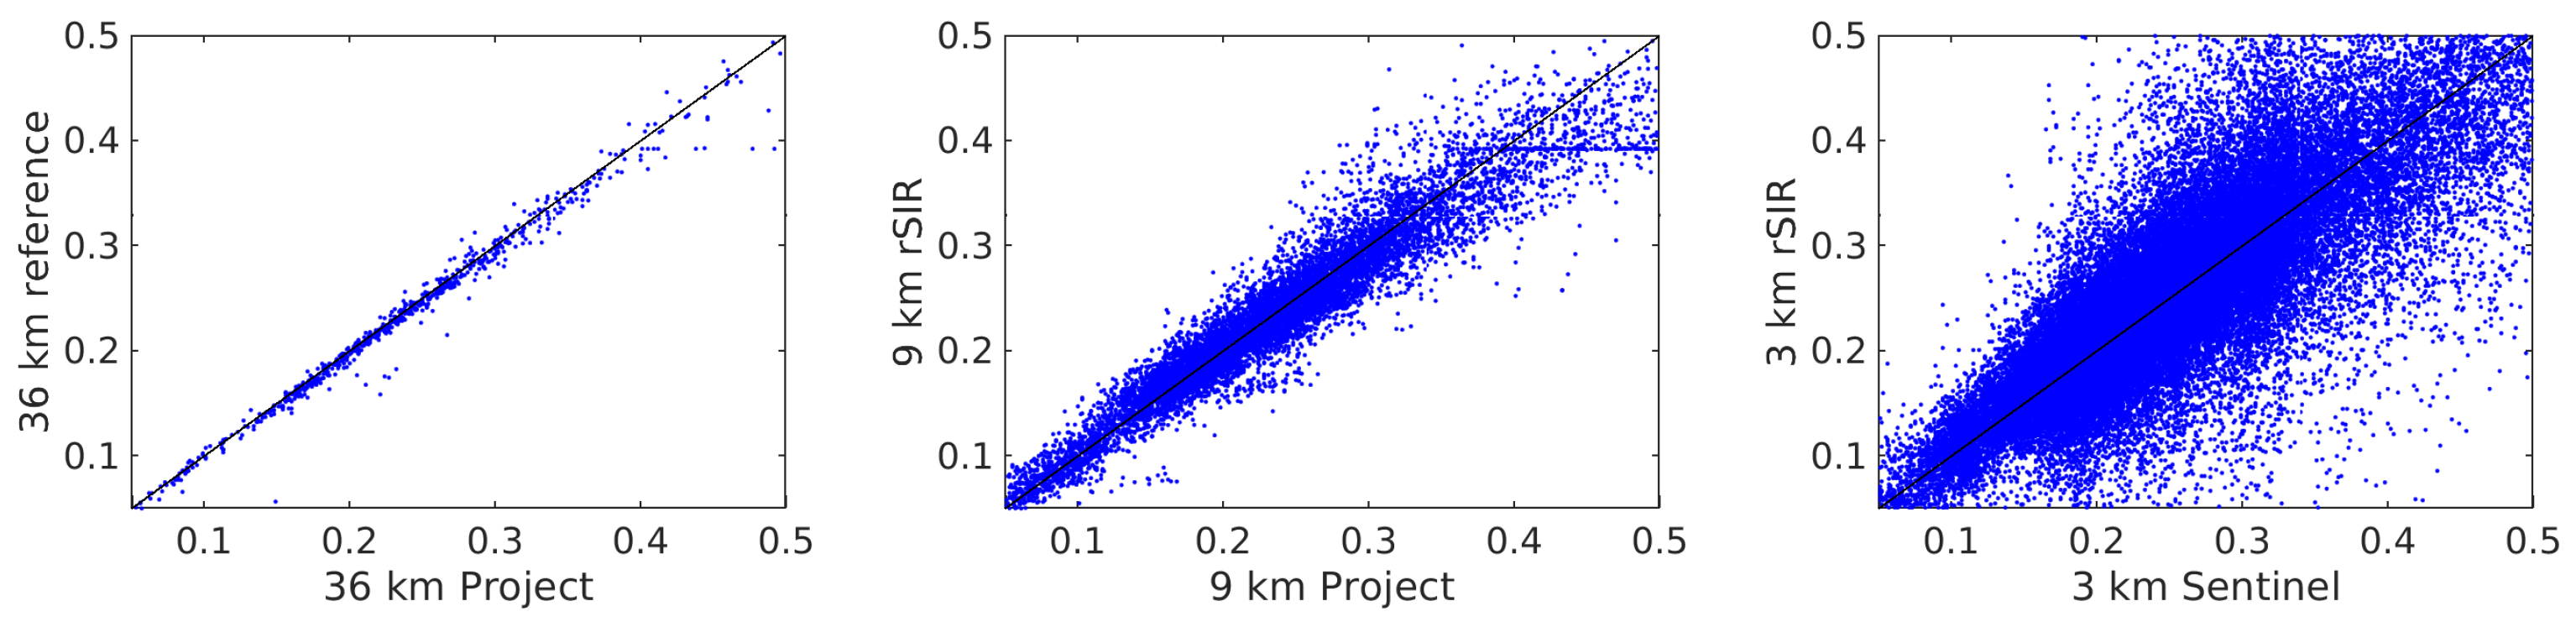
Figure 7 presents scatter plots of rSIR-derived soil moisture compared to the 9 km JPL and the 3 km Sentinel products for day 300 in 2016 in South Sudan (
Figure 4 and
Figure 6). The correlation coefficients are 0.99 for 36 km; 0.96 for 9 km; and 0.80 for 3 km with difference standard deviations of 0.0107; 0.0254; and 0.0526, respectively. As subsequently discussed, as the resolution is made finer, noise increases. However, the products remain correlated.
5.2. Comparison Results and Analysis
To further inter-compare the rSIR-enhanced soil moisture, four months of global data are analyzed spread across the year in order to include seasonal variability. Only pixels with valid values are included in the comparison.
Summary results from the global inter-comparison are presented in
Table 1 and
Table 2. These tables list RMS and mean difference values for four separate months of soil moisture data between the rSIR-enhanced products and the validated reference sets. We note that these values are the
differences between the two soil moisture products, not the accuracy of the soil moisture measurement.
At 36 km resolution, there is no resolution enhancement, and thus the difference level of 0.0125 RMS mostly results from differences in the soil moisture extraction calculations. The application of the JPL antenna pattern correction methods to the rSIR brightness temperature inputs would likely improve this baseline difference. We noted that rSIR exhibits a small positive brightness temperature bias when generating enhanced resolution images [
12], which adds to the small positive bias in the baseline estimates.
Using the 36 km RMS values in
Table 1 and
Table 2 as a reference, the enhanced resolution 9 km and 3 km products allow us to observe the effects of the increased brightness temperature noise. First, the mean difference reveals a tendency of the rSIR enhancement and soil moisture algorithm (as implemented here) to slightly overestimate soil moisture compared to the validated product.
Then, observing the RMS difference table, it is seen that the RMS level increases as the resolution is enhanced. This is expected since the spatial enhancement tends to act as a high pass filter. However, part of the difference is the result of the inability of the coarser products to reproduce the finer details visible in the enhanced resolution product. The increased RMS difference in the 3 km product is at least partly due to the higher noise level in the SMAP-Sentinel Data. As mentioned in previous sections, the 9 km SMAP passive product was verified to within 0.04 cm cm, whereas the SMAP-Sentinel combined product was only verified to within 0.05 cm cm. The 3 km products also have a larger dynamic range of 0.02–0.6 cm cm, whereas the values of 9 km and 36 km range from 0.02 to 0.5 cm cm. Nonetheless, the overall difference performance at all three resolution levels remains below 0.045 cm cm. The increase in overall noise in the soil moisture product as the resolution is made finer is a classic tradeoff: spatial resolution versus noise which must be determined for each particular application. The key advantage of the rSIR result is its global availability compared to the limited coverage of the SMAP-Sentinel product.


