Article

Spatiotemporal Analysis of NO2 Production Using TROPOMI Time-Series Images and Google Earth Engine in a Middle Eastern Country

1
School of Computer Science and CeADAR, University College Dublin (UCD), D04 V1W8 Dublin, Ireland
2
Department of Remote Sensing and GIS, Faculty of Earth Sciences, Shahid Chamran University of Ahvaz, Ahvaz 61357-43136, Iran
3
School of Surveying and Geospatial Engineering, College of Engineering, University of Tehran, Tehran 14174-66191, Iran
4
Department of Surveying and Geomatics Engineering, University of Isfahan, Isfahan 81746-73441, Iran
*
Author to whom correspondence should be addressed.
Remote Sens. 2022, 14(7), 1725; https://doi.org/10.3390/rs14071725
Submission received: 17 February 2022 / Revised: 23 March 2022 / Accepted: 29 March 2022 / Published: 2 April 2022

Abstract

:
Like many developing countries, Iran faces air pollution, especially in its metropolises and industrial cities. Nitrogen dioxide (NO2) is one of the significant air pollutants; therefore, this study aims to investigate the spatiotemporal variability of NO2 using Tropospheric Monitoring Instrument (TROPOMI) sensor mounted on the Sentinel-5P (S5P) satellite and the Google Earth Engine (GEE) platform over Iran. In addition, we used ground truth data to assess the correlation between data acquired by this sensor and ground stations. The results show that there is a strong correlation between products of the TROPOMI sensor and data provided by the Air Quality Monitoring Organization of Iran. The results also display that the correlation coefficient (R) of NO2 between ground truth data and the TROPOMI sensor varies in the range of 0.4 to 0.92, over three years. Over an annual period (2018 to 2021) and wide area, these data can become valuable points of reference for NO2 monitoring. In addition, this study proved that the tropospheric NO2 concentrations are generally located over the northern part of Iran. According to the time and season, the concentration of the tropospheric NO2 column shows higher values during winter than in the summertime. The results show that a higher concentration of the tropospheric NO2 column is in winter while in some southern and central parts of the country more NO2 concentration can be seen in the summertime. This study indicates that these urban areas are highly polluted, which proves the impact of pollutants such as NO2 on the people living there. In other words, small parts of Iran are classified as high and very highly polluted areas, but these areas are the primary location of air pollution in Iran. We provide a code repository that allows spatiotemporal analysis of NO2 estimation using TROPOMI time-series images within GEE. This method can be applied to other regions of interest for NO2 mapping.

1. Introduction

The World Health Organization (WHO) has defined air pollution as a factor that disrupts the balance in society [1], as well as population and technological growth; moreover, improper use of natural resources can cause adverse consequences such as air quality degradation [2]. Deliberate release of air pollutants because of the origin and evolution of humankind has intensively changed the face of the Earth, and in some aspects, it has reduced air quality [3]. Urbanization and economic growth result in rapid change and noticeable air pollution in countries [4]. Urban air pollution is impacted by several factors such as temperature, wind, precipitation, population, pollutants, excessive use of fossil fuels, and inefficient urban transportation systems [5]. Motor vehicles are one of the most significant sources of air pollution and release different chemical gases, among which is NO2, one of the most well-known air pollutants that significantly impact atmospheric chemistry.
Ozone (O3) is another pollutant in the atmosphere. O3 is caused mainly by reactions between photochemical nitrogen oxide (NOx = NO + NO2) and volatile organic compounds (VOCs), and a high concentration of NOx is combined with very fine particles. As a result, fog, photochemical smoke, and acid rain are produced, which endanger human health [6]. Apart from these effects, NOx absorbs some part of solar irradiance, reduces atmospheric visibility, and can lead to climate change [7]. In addition, NO2, as one of the most important pollutants in the troposphere, directly or indirectly impacts human health (respiratory or cardiovascular diseases) and changes the ecosystem destructively [8,9]. Consumption of fossil fuels, biomass burning, and lightning are the primary sources of NO2 production [10,11]. Vehicles, power plants, and industries are other sources that produce NO2 [12]. The highest amounts of nitrogen are found in the most populous and industrialized regions of the world, such as eastern regions of China, western countries of Europe, eastern parts of the United States, and India [13,14]. A severe increase in NO2 pollution is because of the growing number of industrial sites and traffic volume [15].
Many factors might cause NO2 concentration over space and time [16,17]. Air pollution monitoring is one of the essential issues that should be considered in monitoring and managing air pollutants in metropolises and countries. However, the installation and maintenance of many monitoring stations impose high costs on municipalities and governments. Furthermore, air pollution is rapidly varying over space and time; in other words, it is a spatiotemporal problem. As a result, researchers are looking for a method to simultaneously monitor air quality that covers high temporal and spatial resolution. Although ground stations can measure air quality in high spatial and temporal resolution, they can measure limited areas close to their locations, and their numbers directly impact the final results [18]. In recent decades, remote sensing (RS) has become a reliable source for earth observations such as soil erosion [19], land use and land cover change maps [20,21,22], and urban study [23,24,25]. Remotely sensed data can usually provide global coverage and make it possible to measure various parameters such as air pollution, emission of gases, and suspended particles in the atmosphere, without direct contact with these phenomena [26].
In the last two decades, numerous studies have been performed to monitor NO2 pollutants using RS [6,7,27,28,29,30,31,32,33]. The temporal and spatial changes in NO2 were monitored in China from 2005 to 2018 using the Ozone Monitoring Instrument (OMI) sensors [6]. The annual concentration of NO2 was studied in southeastern Ukraine using a Scanning Imaging Absorption Spectrometer for Atmospheric Cartography (SCIAMACHY) [34]. In addition for studying the spatiotemporal variations in this pollutant, several studies have been conducted on the origin of these gases in different world regions. Based on analyzing the Airborne PRISM Experiment (APEX) sensor data in the city of Zurich, a highly NO2-polluted area was observed in the central urban area and landfill areas [35]. Another study in China introduced industrial activities as the main factor behind NO2 production, and power plants, traffic, and residential resources are other factors producing this gas [36]. In another study, NO2 concentration was studied in China between 1996 and 2005 using SCIAMACHY and Global Ozone Monitoring Experiment (GOME) sensors. The results of this study indicate that the concentration of the tropospheric NO2 column in the eastern part of China is higher than that in the western part of this country due to the high density of population and industrial sites [37].
Given that NO2 is one of the most critical components of air pollution in metropolitan areas and industrial cities and sites, the assessment of this pollutant at the national level in developing and industrialized countries such as Iran is very important for monitoring air pollution [38]. Iran is one of the developing countries in which the level of air pollutants has gradually increased since the beginning of the industrialization of the country in the 1970s until now. The air pollution level has reached a critical level in some of its major cities, such as Tehran, Mashhad, Tabriz, Isfahan, Ahvaz, and Arak [39,40]. Despite the importance of monitoring pollutants such as nitrogen, limited studies have been conducted in this area to investigate spatiotemporal variations. The analysis of NO2 for air quality monitoring requires higher spatiotemporal resolution data. In recent years, TROPOMI has become an effective sensor for assessing the concentration of many gaseous air pollutants in the atmosphere, e.g., NO2, O3, sulfur dioxide (SO2), and formaldehyde (HCHO) [41], and providing more accurate data to study these gaseous air pollutants [42,43].
Despite the importance of NO2 gas monitoring, no study for spatiotemporal monitoring of monthly and seasonal fluctuations of the tropospheric NO2 column with the TROPOMI sensor data has been conducted using the case of Iran. Therefore, in this study, we monitored the concentration of the tropospheric column NO2 from 2018 to 2021. In addition, we assessed the accuracy of the TROPOMI sensor NO2 product in Iran. We also studied the relationship between population density and air pollutant concentrations.
The remainder of this article is organized as follows: Section 2 describes the materials and methods. It explains the input variables, preprocessing stages, and regression method. Section 2 also describes test data for validation, as well as implementation details. Section 3 presents the obtained NO2 concentration results based on the TROPOMI sensor data. Finally, Section 4 presents the conclusions of this paper and future research.

2. Materials and Methods
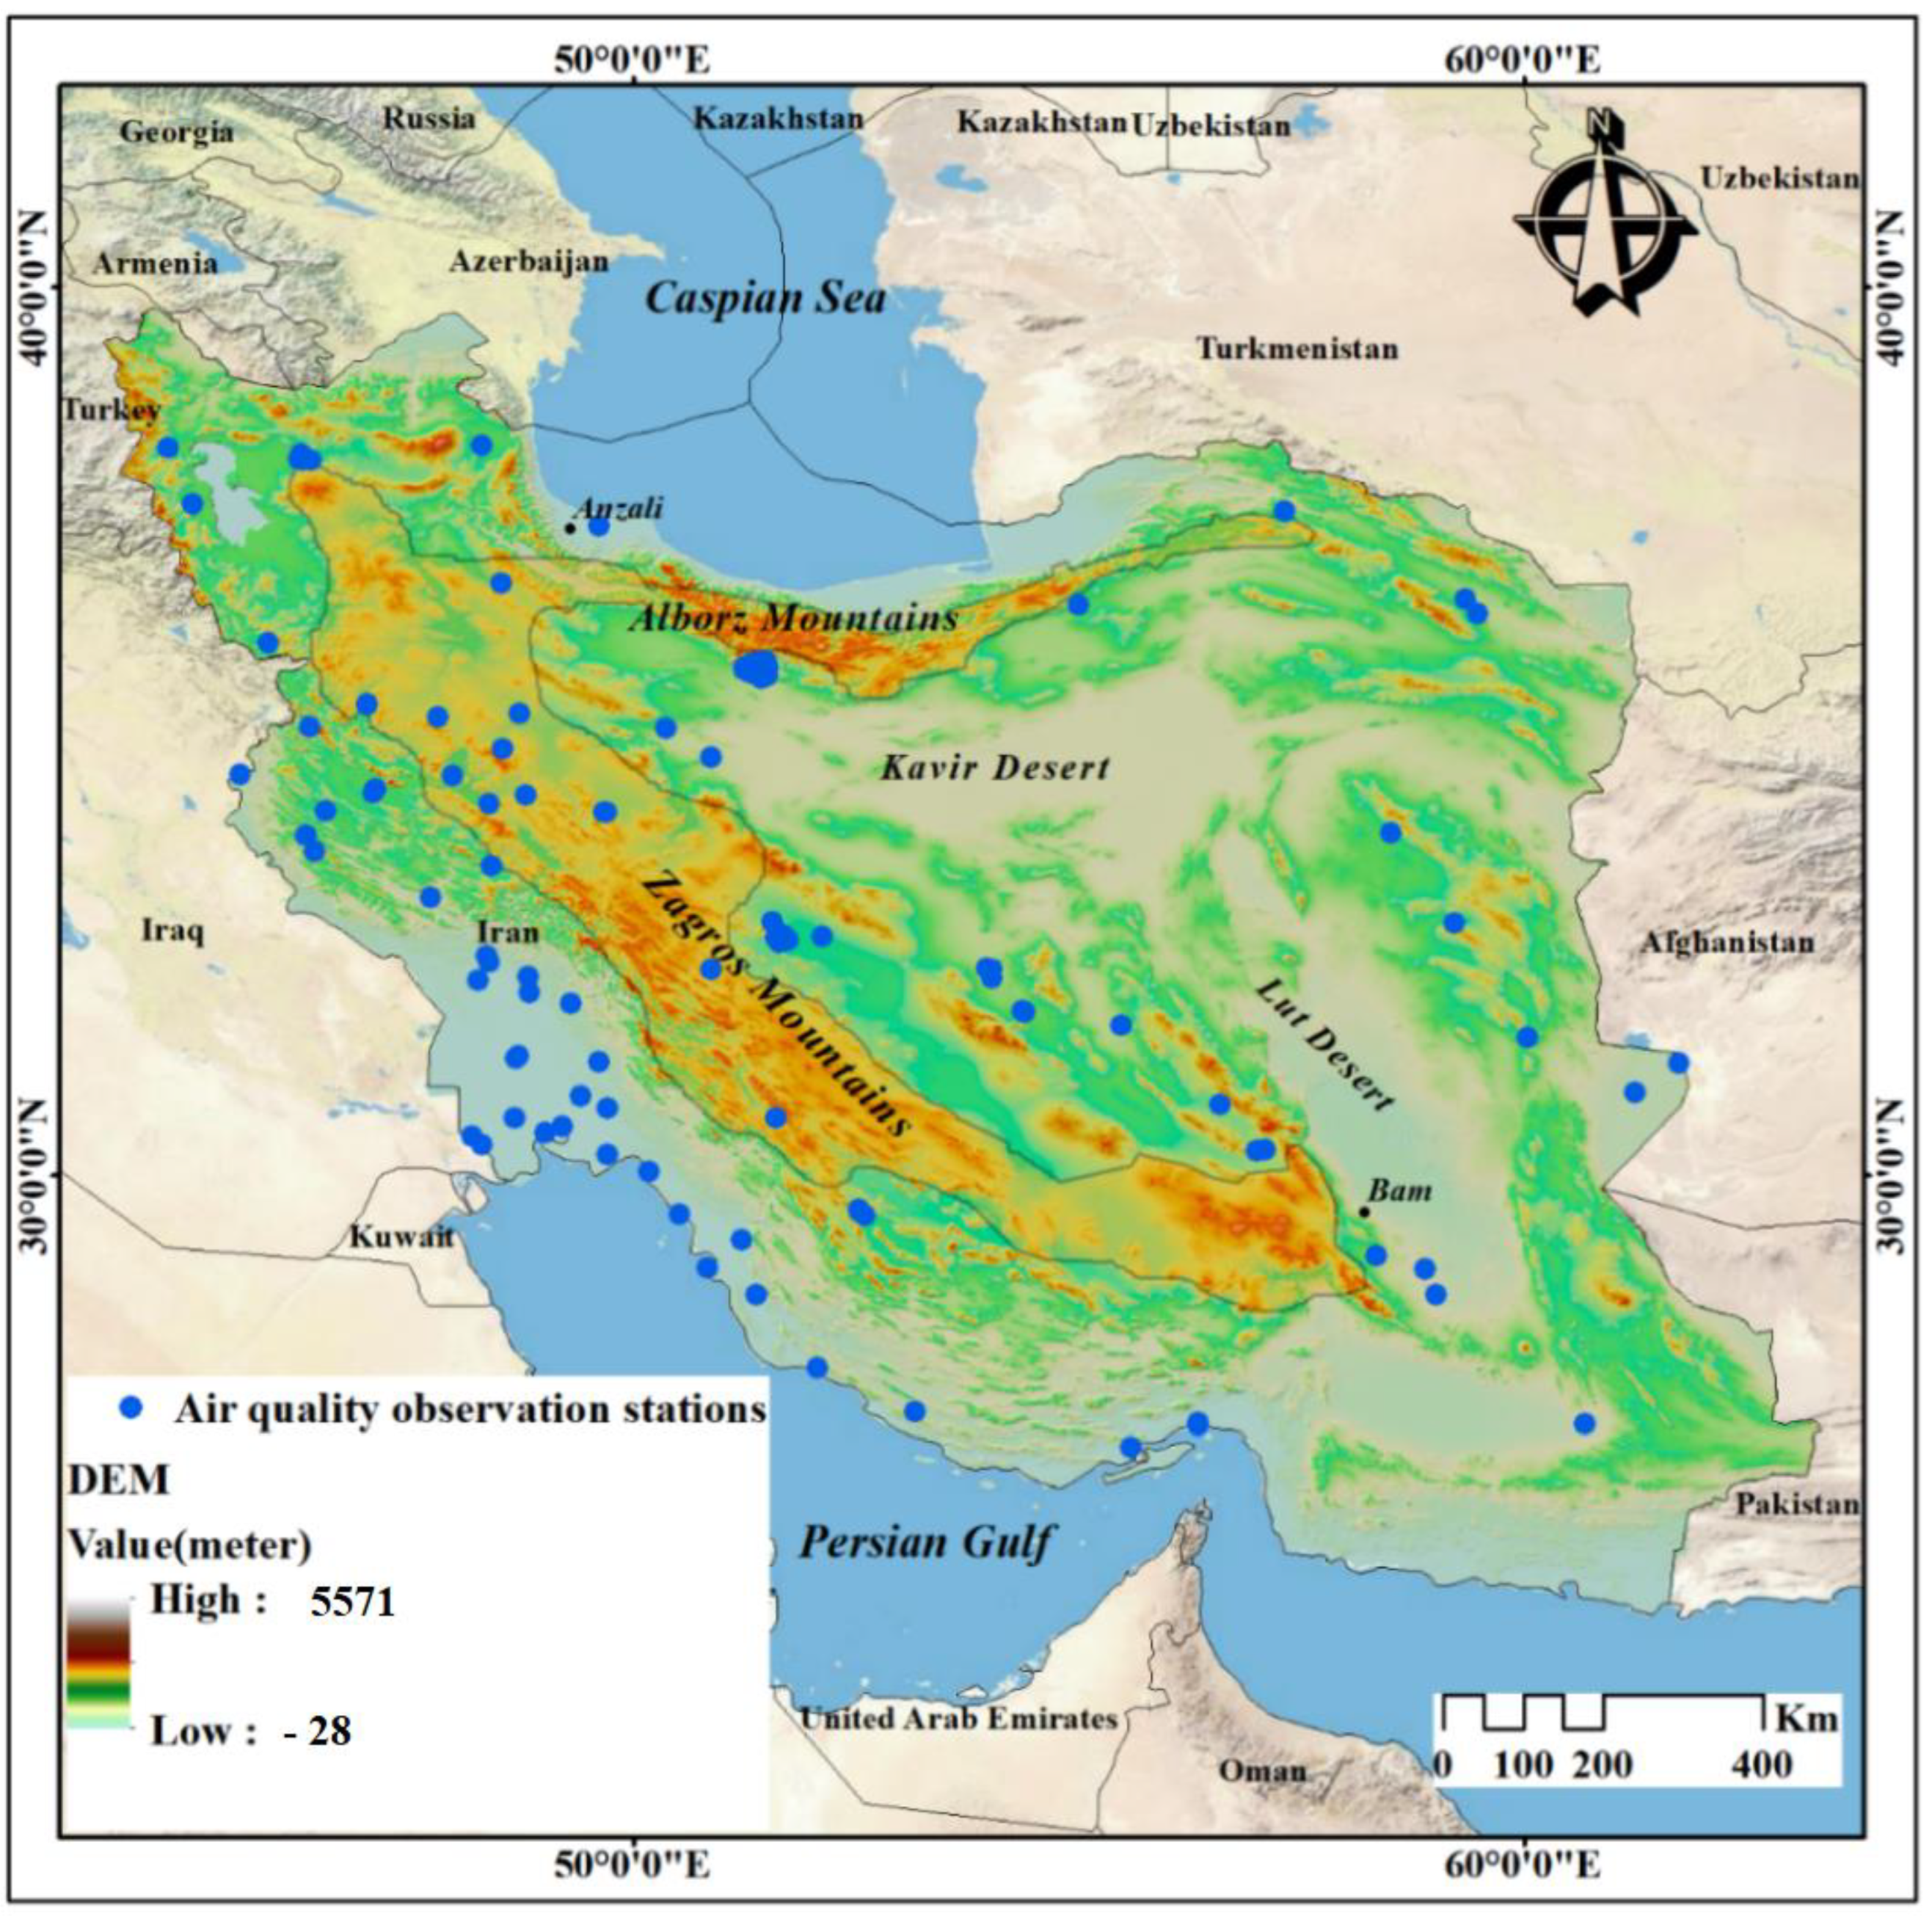
2.1. Study Area

Iran is an oil-based economy. The country is 1.87 million km2 and is located in the Middle East. Figure 1 shows the digital elevation model (DEM) and air pollution measuring stations. The range of temperature spans from −36 to 60 centigrade. The precipitation range varies from less than 25 mm in Bam city to more than 2000 mm in Anzali, and the long-term mean precipitation value is about 250 mm. The climate of the country is mainly covered by an arid and semi-arid climate, and the Zagros and Alborz Mountain ranges have a semi-arid environment. Iran is the first country responsible for climate change in the Middle East, approximately releasing up to 616,741 million tons of carbon dioxide (CO2) yearly [44]. The high-level contribution of Iran to greenhouse gas emissions is because of significant rapid urbanization and the production of gas and oil [44].

2.2. Data Description

In this study, we used TROPOMI, ground station data between 2018 and 2021, population data, and the location of industrial cities and sites. More details about these datasets are described in Table 1. Additionally, the thematic maps of population density and the number of industrial units in each county can be seen in Figure 2.

2.2.1. TROPOMI (S5P)

In recent years, the TROPOMI instrument mounted on the S5P satellite has become one of the most used sensors for air pollution monitoring. S5P was launched on 13 October 2017 as a part of the Copernicus space program series of the European Space Agency (ESA). TROPOMI sensor monitors Earth in ultraviolet and visible (270–495 nm), near-infrared (675–775 nm), and short-infrared wavelength intervals (2305–2385 nm), using a push-broom scanner [45,46]. NO2, O3, SO2, and HCHO can be retrieved using this sensor’s ultraviolet and visible range. This sensor provides high spatial resolution, global coverage, and a low signal-to-noise ratio (SNR). It also provides high spatial, temporal, and spectral resolution than previously launched sensors such as OMI and SCIAMACHY [47,48].

2.2.2. Ground Air Quality Data

In this study, we obtained air quality data provided by the Iran Air Pollution Monitoring System (APMS), which are publicly available through their website (see https://aqms.doe.ir (accessed on 15 October 2021 for details)). In total, 130 stations are available in Iran, and most of these stations are located in megacities of Iran (e.g., Tehran, Isfahan, Tabriz, and Ahvaz). In general, Middle Eastern countries have a limited number of air quality stations, and the distribution of these stations does not match land use, dispersion dynamics of each pollutant. These stations are mainly limited to major metropolitan cities in these countries. The statistics in Table 2 show that nearly half of these stations in our study area are, Iran, located in metropolitan cities. Therefore, air pollution assessment using terrestrial data alone cannot be representative of the pollution situation in the whole country. Therefore, using RS products along with ground station observations data can play an important role in monitoring and completing the data. The locations of these stations are depicted in Figure 1 with blue markers. We compared the retrieved NO2 using TROPOMI data with ground air quality data. Table 2 displays more details about the validation data used in this study. In total, the number of ground observations taken for atmospheric NO2 validation was equal to 1188 observations, of which 161, 378, 398, and 256 observations were belonged to the years, 2018, 2019, 2020, and 2021, respectively.

2.3. NO2 Retrieval Using TROPOMI

Satellite RS is a widely used approach to monitor NO2 pollution worldwide [49]. TROPOMI is one of the newest sensors capable of monitoring the amount of NO2 in the atmosphere. The TROPOMI NO2 data used in this research are based on the algorithm developed for the DOMINO-2 product and the EU QA4ECV NO2 [50]. In this study, the concentration of the tropospheric NO2 column was processed using the GEE platform. Additionally, we used the GEE platform (see https://earthengine.google.com (accessed on 15 October 2021 for details)) for part of our processing that includes resampling of pixels (nearest-neighbor methods used by default), converting the format, clipping data, filtering the data, retrieving time series, and generating monthly averaged data.

2.4. Accuracy Assessment

Accuracy validation is an essential part of any RS research project. We compared the satellite product with available ground air quality stations [51]. In this study, validation was performed using the correlation coefficient (R) of ground truth data with the TROPOMI product. The R formula compares our fitted regression line with a baseline model. Equation (1) is a mathematical formula for calculating the coefficient of determination index [52], which is defined as
R   = 1 i = 1 N ( y i y ^ i )   i = 1 N ( y i y ¯ i )
where y i is the actual value,   y ^ is the predicted value of y i (S5P data), and y ¯ i is the mean of the y i values.
Figure 3 illustrates the research workflow. This workflow consists of the following four parts: (1) processing data from the GEE Database, APMS, and OSM; (2) accuracy validation; (3) processing data, including extracting time series and calculating monthly average tropospheric NO2 column using coding in GEE platform; (4) investigating the relationship between NO2 pollution, location of industrial cities and sites, and population density.

3. Results

In this research, we used the GEE platform to preprocess and analysis monthly average images of tropospheric NO2 column concentration from September 2018 to August 2021. We used ground air quality stations to evaluate our results. For validating TROPOMI NO2, we calculated the correlation between the tropospheric NO2 column data retrieved by TROPOMI (unit of values are 1015 molecules cm−2) and ground station data for each month. We then estimated the spatiotemporal variation in NO2 over Iran using the GEE platform.

3.1. Correlation between NO2 Surface Concentration (APMS) and TROPOMI NO2

Thus far, several studies have been performed to prove the correlation of the tropospheric NO2 column concentration from RS data with terrestrial data. Correlation coefficients greater than 0.91 were obtained in this research, which indicates that satellite images and products have reasonable accuracy. They can describe the characteristics of the atmosphere (such as cloud cover, aerosol, and air pollutants) with reasonable accuracy [11,53,54].
To evaluate the results, we used the APMS data in Iran as a surface NO2 data source. For this purpose, we calculated the correlation between terrestrial and satellite data in four seasons, and the results are presented in Figure 4. The results showed that the highest and lowest correlations between RS images and terrestrial data were observed in spring and autumn, respectively. The results showed that the seasonal and monthly correlation between terrestrial data and satellite observations fluctuates from 0.74 to 0.90 and 0.4 to 0.92, respectively. The results in Figure 4 show that the concentration of the tropospheric NO2 column data extracted using the TROPOMI sensor is highly correlated with the air quality monitoring stations data. In the autumn season, fewer ground-level monitoring stations were active; so there were fewer observations for calculating correlation and this issue caused lower correlation values (especially in October and November).

3.2. Spatiotemporal Characteristics of Tropospheric NO2 Columns

Figure 5 shows the monthly map of the tropospheric NO2 columns from September 2018 to August 2021. In Iran, the concentration of the tropospheric NO2 column is significant in the northern areas and drops in the southern parts. The results indicate that most regions of the study area have less concentrations than 1015 molecules cm−2 (such as Sistan and Baluchestan, Kerman, Hormozgan, and South Khorasan). These areas are mainly located in the southern and central parts of Iran and have low rainfall, hot and dry climate, severe temperature changes, and are often located in flat and low plains. In addition, due to the lack of urban development and climate conditions, these areas are less populated, and industrial activities are very low. Therefore, in these areas, the tropospheric NO2 column concentration is often small.
Figure 6 shows seasonal variations in the tropospheric NO2 column concentrations. Considering the climatic condition as well as the location of Iran in the Northern Hemisphere, the seasons in this paper are as follows: Spring (March, April, and May), Summer (June, July, and August), Autumn (September, October, and November) and Winter (December, January, and February). As Figure 6 shows, the seasonal average of the tropospheric NO2 column concentration is high in winter and low in summer and spring. This part of the results is consistent with other studies [53,54,55,56]. Because of various factors such as the type of air pollution, some results might be different [57]. The results also indicate that the lowest values of NO2 concentration were observed in May and April (0.16 × 10¹⁵ molecules cm−2), and the lowest values were detected during December and January (0.3 × 10¹⁵ molecules cm−2), the values of which are shown in Table 3. Additionally, examination of changes in monthly values of tropospheric NO2 columns in Iran shows that significant changes in the amount of this gas are observed in different months (Table 3).
For monitoring monthly NO2 change during 2018 and 2021, we selected 12 provinces (Figure 7), because they were suitable candidates for air quality monitoring. The results indicate that air pollution is at the maximum level in industrial and densely populated cities in winter (December, January, and February). In sparsely populated and non-industrial cities, changes in air pollution in different months and seasons are not significant, and the maximum amount of pollution is often observed in summertime.
The monthly average concentration of tropospheric NO2 column data obtained using the TROPOMI sensor was extracted for each county. The NO2 map was classified into five classes: very low, low, medium, high, and very high. Finally, the area and population of each class were extracted, and the results are listed in Table 4. As can be seen from the results, less than 0.5% of the area of cities are in the severe and very severe classes of tropospheric NO2 column, and 15% of the total population of Iran (more than 13 million people) live in this area. This shows the importance of population density in increasing air pollution. In addition, Table 4 shows about 73% of the population of Iran lives in the low and very low air pollution classes.

3.3. Correlation Analysis

In this study, we calculated the correlation between this pollutant, the population density of each county, and industrial units’ density, and the results are presented in Figure 8. The results show a significant relationship between two parameters of population density and industrial units’ density with NO2. The value of linear correlation between NO2 and population density, and the industrial density is 0.6–0.92 and 0.56–0.87, respectively. In conclusion, the amount of NO2 air pollution concentration in each region directly and strongly relates to its population size and urbanization, which has been mentioned in similar studies [13,56].

4. Discussion

Validation of the results confirms the reliability of the data and methodology employed in NO2 pollution monitoring. The tropospheric NO2 column concentration of the satellite-based S5P products (1015 molecules cm−2) were statistically correlated with independent datasets of ground station observations of NO2 concentrations (µg/cm3). After validating the accuracy of the data and the spatio-temporal monitoring of this pollutant in Iran, it is necessary to discuss the cause and severity of this pollutant in more detail. In several other regions in Iran, there is a high concentration of NO2 in small cities, including Quds, Fardis, Khomeini Shahr, Falavarjan, Abyek, Assaluyeh, and Binalood (Figure 9). This is generally due to the activity of industries and the pollution caused by vehicles. Rapid economic development and population growth have led to increased human NO2 emissions around urban areas. For this reason, in most provinces in Iran, the concentration of NO2 gas in urban centers is higher than the average NO2 gas in the corresponding province [57,58,59,60,61]. Similar to the results of [58], in the northern parts and metropolitan areas of Iran, the concentration of the tropospheric NO2 column is more than 2 × 10¹⁵ molecules cm−2, including cities such as Tehran, Rasht, Sari, Isfahan, Karaj, Tabriz, and Mashhad. In these areas, air pollution has risen because of a growing number of power plants and industries and an increase in urbanization, transportation, and population density. Tehran is one of the main centers of NO2 production in the world due to its high population density and the number of vehicles [59]. The results of a study on carbon monoxide (CO) using the TROPOMI sensor on a global scale, indicated that Tehran, Isfahan, Mashhad, and Qom are among the cities suffering from severe air pollution [62]. In a study, NO2 pollutant was investigated using the OMI satellite in the country, and the results of this study showed that the capital of the provinces, including the cities of Tehran, Mashhad, Tabriz, Ahvaz, and Arak, are in a critical situation in terms of air pollution [58]. Ahvaz, Mahshahr, and Abadan, industrial cities of Khuzestan Province, are the main centers of petrochemicals and refineries with severe air pollution. Industrial activities could be known as the main cause of NO2 air pollution in Mahshahr port [63].
It can be inferred that human activities have a significant impact on air pollution. Generally, air pollution due to human activities and increased use of fossil fuels in wintertime is more than in summertime. However, the temporal behavior of pollution may not be the same in all areas. Depending on the source of pollution, the minimum and maximum levels of pollution in different places, and times may show different behavior. However, factors such as increased use of heating devices, fossil fuels, lack of direct radiation, and temperature inversion phenomena are very influential in intensifying and continuing pollution in wintertime. The results of this study can be viewed in the GEE environment at: https://code.earthengine.google.com/?accept_repo=users/MohsenSaber/SP5_NO2_Monitoring (accessed on 1 December 2021).

5. Conclusions

In this paper, we investigated spatiotemporal characteristics and factors affecting the concentration of tropospheric NO2 columns over Iran between 2018 and 2021. For this purpose, we used NO2 products of the TROPOMI sensor data mounted on the S5P satellite. These results showed that the products of this sensor have high correlations with the data published by the Iran APMS, and the range of correlation changes in different seasons varies from 0.4 to 0.92 (as discussed in Section 3.1). The following observations were made in our analysis of spatio-temporal characteristics of tropospheric NO2 column concentration:
(a)
Monthly fluctuations of the tropospheric NO2 column concentration over the study area are significant;
(b)
The pattern of spatial changes in NO2 concentration in the troposphere shows that the amount of NO2 gaseous air pollutants in the study area’s northern part is more than in the central and southern regions;
(c)
The results show that about 15% of the population of Iran (about 13 million people) who live in 0.5% of the total area of Iran live in areas with severe air pollution.
The results of this study can be used for effective planning to reduce NO2 emissions and air pollution in Iran and countries with similar environmental and socioeconomic conditions. In the first stage, NO2 pollution in Iran has significant spatial differences that should be considered in future planning to tackle NO2 pollution. The number of industries and companies producing air pollutants should be limited in cities, such as Tehran, Karaj, Mashhad, Isfahan, Tabriz, Ahvaz, Mahshahr, Abadan, Arak, and Qom. At the same time, the government should urge industries to increase their investment in new technologies to minimize the direct emission of NO2 gaseous air pollutants (such as optimization of combustion conditions of the vehicle and using renewable energy). The results and outputs of this research can be used in industrial site selection and other studies on environmental inequality and justice. Although the pattern of spatiotemporal changes and the factors affecting the distribution of the tropospheric NO2 column concentrations over Iran were analyzed. We are fully aware that this article has some limitations and shortcomings. Among these limitations, we can mention the incompleteness and relative lack of socioeconomic statistics, which severely limit the analysis of the factors affecting NO2 pollution. Therefore, in future studies, the effect of these factors on the concentration of air pollutants should be investigated. Since only data from 2018 onwards was available, it was not possible to study changes, such as annual changes, over longer periods of time in Iran with this sensor. Collecting the tropospheric NO2 column concentration data and analyzing air pollutant fluctuations in the longer term, especially during the COVID-19 pandemic, will also be of interest to future researchers.
The GEE repository is publicly available at: https://code.earthengine.google.com/?accept_repo=users/MohsenSaber/SP5_NO2_Monitoring (accessed on 1 December 2021). As the code is available publicly, future improvements to this methodology may be implemented based on user feedback. We also provided an overview of the results of this study in the GEE environment. All the results via GEE view are accessible at: https://mohsensaber.users.earthengine.app/view/iranno2sp5 (accessed on 1 December 2021).

Author Contributions

Conceptualization, H.R.-D., S.M. and S.A.; methodology, S.M., H.R.-D., S.A. and M.S.; software, M.S.; validation, S.M.; writing—original draft preparation, S.A.; writing—review and editing, H.R.-D., S.M., S.A. and G.M.; visualization, S.A. and M.S.; supervision, H.R.-D. and S.M.; project administration, H.R.-D. All authors have read and agreed to the published version of the manuscript.

Funding

Hamidreza Rabiei-Dastjerdi is a Marie Skłodowska-Curie Career-FIT Fellow at the UCD School of Computer Science and CeADAR (Ireland’s National Center for Applied Data Analytics and AI). Career-FIT has received funding from the European Union’s Horizon 2020 research and innovation program under the Marie Skłodowska-Curie Grant Agreement No. 713654.

Acknowledgments

The authors would like to thank net friends from the website gis.stackexchange.com (accessed on 8 September 2017) for the GEE operation’s generously professional instruction. The authors would also like to thank the four anonymous reviewers and the assigned editor for constructive comments and suggestions.

Conflicts of Interest

The authors declare no conflict of interest.

Abbreviations

The following abbreviations are used in this manuscript:
AQGAir quality guideline
AQMOAir quality monitoring organization
APEXAirborne PRISM experiment
CO2Carbon dioxide
COCarbon monoxide
DEMDigital elevation model
ESAEuropean Space Agency
GEEGoogle Earth Engine
GOMEGlobal Ozone Monitoring Experiment
HCHOFormaldehyde
HNO3Nitric acid
NO2Nitrogen dioxide
O3Ozone
OMIOzone Monitoring Instrument
OSMOpenStreetMap
RSRemote sensing
SCIAMACHYScanning Imaging Absorption Spectrometer for Atmospheric Cartography
S5PSentinel-5P
SNRSignal-to-noise-ratio
SO2Sulfur dioxide
TROPOMITropospheric Monitoring Instrument
VOCSVolatile organic compounds
WHOWorld Health Organization

References

  1. World Health Organization. Report of the Regional Director: The Work of WHO/Europe in 2019–2020; World Health Organization, Regional Office for Europe: Geneva, Switzerland, 2020.
  2. Begum, A.; Ramaiah, M.; Khan, I.; Veena, K. Analysis of heavy metals concentration in soil and litchens from various localities of Hosur road, Bangalore, India. E-J. Chem. 2009, 6, 13–22. [Google Scholar] [CrossRef]
  3. Freitas, M.; Costa, N.; Rodrigues, M.; Marques, J.; Da Silva, M.V. Lichens as bio indicators of atmospheric pollution in Porto, Portugal. J. Biodivers. Ecol. Sci. 2011, 1, 29–39. [Google Scholar]
  4. Cohen, A.J.; Anderson, H.R.; Ostro, B.; Pandey, K.D.; Krzyzanowski, M.; Künzli, N.; Gutschmidt, K.; Pope III, C.A.; Romieu, I.; Samet, J.M. Urban air pollution. In Comparative Quantification of Health Risks: Global and Regional Burden of Disease Attributable to Selected Major Risk Factors; World Health Organization: Geneva, Switzerland, 2004; Volume 2, pp. 1353–1433. [Google Scholar]
  5. Bernard, S.M.; Samet, J.M.; Grambsch, A.; Ebi, K.L.; Romieu, I. The potential impacts of climate variability and change on air pollution-related health effects in the United States. Environ. Health Perspect. 2001, 109, 199–209. [Google Scholar] [PubMed] [Green Version]
  6. Hou, Y.; Wang, L.; Zhou, Y.; Wang, S.; Liu, W.; Zhu, J. Analysis of the tropospheric column nitrogen dioxide over China based on satellite observations during 2008–2017. Atmos. Pollut. Res. 2019, 10, 651–655. [Google Scholar] [CrossRef]
  7. Diao, B.; Ding, L.; Su, P.; Cheng, J. The spatial-temporal characteristics and influential factors of NOx emissions in China: A spatial econometric analysis. Int. J. Environ. Res. Public Health 2018, 15, 1405. [Google Scholar] [CrossRef] [PubMed] [Green Version]
  8. Bell, J.N.B.; Treshow, M. Air Pollution and Plant Life; John Wiley & Sons: Hoboken, NJ, USA, 2002; ISBN 0471490911. [Google Scholar]
  9. Brunekreef, B.; Holgate, S.T. Air pollution and health. Lancet 2002, 360, 1233–1242. [Google Scholar] [CrossRef]
  10. Boersma, K.F.; Eskes, H.J.; Brinksma, E.J. Error analysis for tropospheric NO2 retrieval from space. J. Geophys. Res. Atmos. 2004, 109. [Google Scholar] [CrossRef]
  11. Bucsela, E.J.; Perring, A.E.; Cohen, R.C.; Boersma, K.F.; Celarier, E.A.; Gleason, J.F.; Wenig, M.O.; Bertram, T.H.; Wooldridge, P.J.; Dirksen, R. Comparison of tropospheric NO2 from in situ aircraft measurements with near-real-time and standard product data from OMI. J. Geophys. Res. Atmos. 2008, 113. [Google Scholar] [CrossRef]
  12. Heue, K.-P.; Richter, A.; Bruns, M.; Burrows, J.P.; Friedeburg, C.v; Platt, U.; Pundt, I.; Wang, P.; Wagner, T. Validation of SCIAMACHY tropospheric NO2-columns with AMAXDOAS measurements. Atmos. Chem. Phys. 2005, 5, 1039–1051. [Google Scholar] [CrossRef] [Green Version]
  13. Krotkov, N.A.; McLinden, C.A.; Li, C.; Lamsal, L.N.; Celarier, E.A.; Marchenko, S.V.; Swartz, W.H.; Bucsela, E.J.; Joiner, J.; Duncan, B.N. Aura OMI observations of regional SO2 and NO2 pollution changes from 2005 to 2015. Atmos. Chem. Phys. 2016, 16, 4605–4629. [Google Scholar] [CrossRef] [Green Version]
  14. Schneider, P.; Lahoz, W.A.; van der A, R. Recent satellite-based trends of tropospheric nitrogen dioxide over large urban agglomerations worldwide. Atmos. Chem. Phys. 2015, 15, 1205–1220. [Google Scholar] [CrossRef] [Green Version]
  15. Streets, D.G.; Yarber, K.F.; Woo, J.; Carmichael, G.R. Biomass burning in Asia: Annual and seasonal estimates and atmospheric emissions. Glob. Biogeochem. Cycles 2003, 17. [Google Scholar] [CrossRef] [Green Version]
  16. Matos, E.P.; Reisen, V.A.; Serpa, F.S.; Filho, P.R.P.; De Fátima Silva Leite, M. Space-time analysis of the effect of air pollution on children’s health. Cad. Saude Publica 2019, 35, 1–8. [Google Scholar] [CrossRef]
  17. Viatte, C.; Petit, J.E.; Yamanouchi, S.; Van Damme, M.; Doucerain, C.; Germain-Piaulenne, E.; Gros, V.; Favez, O.; Clarisse, L.; Coheur, P.F.; et al. Ammonia and pm2.5 air pollution in paris during the 2020 covid lockdown. Atmosphere 2021, 12, 160. [Google Scholar] [CrossRef]
  18. Ahmadian, A.; Mobasheri, M.R.; Matkan, A.A. Distribution of atmospheric NO2 in the industrial cities using OMI and MODIS images (Case study: Tehran metropolis). Eng. J. Geospat. Inf. Technol. 2018, 6, 171–184. [Google Scholar] [CrossRef] [Green Version]
  19. Mohammadi, S.; Balouei, F.; Haji, K.; Khaledi Darvishan, A.; Karydas, C.G. Country-scale spatio-temporal monitoring of soil erosion in Iran using the G2 model. Int. J. Digit. Earth 2021, 14, 1019–1039. [Google Scholar] [CrossRef]
  20. Alimohammadi, A.; Rabiei, H.R.; Firouzabadi, P.Z. A new approach for modeling uncertainty in remote sensing change detection process. In Proceedings of the 12th International Conference on Geomatics, Gävle, Sweden, 7–9 June 2004; pp. 503–508. [Google Scholar]
  21. Alqurashi, A.F.; Kumar, L. Investigating the Use of Remote Sensing and GIS Techniques to Detect Land Use and Land Cover Change: A Review. Adv. Remote Sens. 2013, 2, 193–204. [Google Scholar] [CrossRef] [Green Version]
  22. Alam, A.; Bhat, M.S.; Maheen, M. Using Landsat satellite data for assessing the land use and land cover change in Kashmir valley. GeoJournal 2020, 85, 1529–1543. [Google Scholar] [CrossRef] [Green Version]
  23. Bhatta, B.; Saraswati, S.; Bandyopadhyay, D. Urban sprawl measurement from remote sensing data. Appl. Geogr. 2010, 30, 731–740. [Google Scholar] [CrossRef]
  24. Rabiei-Dastjerdi, H.; Amini, S.; McArdle, G.; Homayouni, S. City-region or city? That is the question: Modelling sprawl in Isfahan using geospatial data and technology. GeoJournal 2022, 1–21. [Google Scholar] [CrossRef]
  25. Rabiei-Dastjerdi, H.; Matthews, S.A. Who gets what, where, and how much? Composite index of spatial inequality for small areas in Tehran. Reg. Sci. Policy Pract. 2021, 13, 191–205. [Google Scholar] [CrossRef]
  26. Martin, R. V Satellite remote sensing of surface air quality. Atmos. Environ. 2008, 42, 7823–7843. [Google Scholar] [CrossRef]
  27. Ai, J.; Sun, Y.; Zheng, F.; Ni, C.; Gui, K.; Zhang, X.; Jiang, W.; Liao, T. The spatial temporal variation and factor analysis of the tropospheric NO2 columns in the Sichuan Basin from 2005 to 2016. Atmos. Pollut. Res. 2018, 9, 1157–1166. [Google Scholar] [CrossRef]
  28. Bechle, M.J.; Millet, D.B.; Marshall, J.D. Remote sensing of exposure to NO2: Satellite versus ground-based measurement in a large urban area. Atmos. Environ. 2013, 69, 345–353. [Google Scholar] [CrossRef]
  29. Cai, K.; Zhang, Q.; Li, S.; Li, Y.; Ge, W. Spatial–Temporal variations in NO2 and PM2. 5 over the Chengdu–Chongqing economic zone in china during 2005–2015 based on satellite remote sensing. Sensors 2018, 18, 3950. [Google Scholar] [CrossRef] [PubMed] [Green Version]
  30. Popp, C.; Brunner, D.; Damm, A.; Buchmann, B. Mapping of high resolution nitrogen dioxide vertical column densities with the Airborne Prism EXperiment (APEX) imaging spectrometer over Zurich, Switzerland. In Proceedings of the 2012 IEEE International Geoscience and Remote Sensing Symposium, Munich, Germany, 22–27 July 2012; IEEE: New York, NY, USA, 2012; pp. 3646–3649. [Google Scholar]
  31. Ting, W.; Pu-Cai, W.; Hendrick, F.; Huan, Y.U.; Van Roozendael, M. The spatial and temporal variability of tropospheric NO2 during 2005–14 over China observed by the OMI. Atmos. Ocean. Sci. Lett. 2015, 8, 392–396. [Google Scholar]
  32. Ma, C.; Ju, T.; Wang, Q.; Li, F.; Zhang, Y.; Zhang, G. Spatiotemporal variations of tropospheric NO2 in Lanzhou for the period 2009–2018 based on satellite remote sensing. Atmos. Pollut. Res. 2020. [Google Scholar] [CrossRef]
  33. Judd, L.M.; Al-Saadi, J.A.; Szykman, J.J.; Valin, L.C.; Janz, S.J.; Kowalewski, M.G.; Eskes, H.J.; Pepijn Veefkind, J.; Cede, A.; Mueller, M.; et al. Evaluating Sentinel-5P TROPOMI tropospheric NO2 column densities with airborne and Pandora spectrometers near New York City and Long Island Sound. Atmos. Meas. Tech. 2020, 13, 6113–6140. [Google Scholar] [CrossRef]
  34. Kharytonov, M.M.; Khlopova, V.M.; Stankevich, S.A.; Titarenko, O.V. Remote and ground-based sensing of air polluted by nitrogen dioxide in the Dnepropetrovsk region (Ukraine). In Disposal of Dangerous Chemicals in Urban Areas and Mega Cities; Springer: Berlin/Heidelberg, Germany, 2013; pp. 291–298. [Google Scholar]
  35. Popp, C.; Brunner, D.; Damm, A.; Van Roozendael, M.; Fayt, C.; Buchmann, B. High-resolution NO2 remote sensing from the Airborne Prism EXperiment (APEX) imaging spectrometer. Atmos. Meas. Tech. 2012, 5, 2211–2225. [Google Scholar] [CrossRef] [Green Version]
  36. Li, M.; Liu, H.; Geng, G.; Hong, C.; Liu, F.; Song, Y.; Tong, D.; Zheng, B.; Cui, H.; Man, H. Anthropogenic emission inventories in China: A review. Natl. Sci. Rev. 2017, 4, 834–866. [Google Scholar] [CrossRef]
  37. Van Der A, R.J.; Peters, D.; Eskes, H.; Boersma, K.F.; Van Roozendael, M.; De Smedt, I.; Kelder, H.M. Detection of the trend and seasonal variation in tropospheric NO2 over China. J. Geophys. Res. Atmos. 2006, 111. [Google Scholar] [CrossRef] [Green Version]
  38. Hosseini, V.; Shahbazi, H. Urban air pollution in Iran. Iran. Stud. 2016, 49, 1029–1046. [Google Scholar] [CrossRef]
  39. Ghorani-Azam, A.; Riahi-Zanjani, B.; Balali-Mood, M. Effects of air pollution on human health and practical measures for prevention in Iran. J. Res. Med. Sci. Off. J. Isfahan Univ. Med. Sci. 2016, 21, 65. [Google Scholar]
  40. Shahsavani, A.; Naddafi, K.; Haghighifard, N.J.; Mesdaghinia, A.; Yunesian, M.; Nabizadeh, R.; Arahami, M.; Sowlat, M.H.; Yarahmadi, M.; Saki, H. The evaluation of PM10, PM2. 5, and PM1 concentrations during the Middle Eastern Dust (MED) events in Ahvaz, Iran, from April through September 2010. J. Arid. Environ. 2012, 77, 72–83. [Google Scholar] [CrossRef]
  41. Showstack, R. Sentinel satellites initiate new era in earth observation. EOS 2014, 95, 239–240. [Google Scholar] [CrossRef]
  42. Berger, M.; Moreno, J.; Johannessen, J.A.; Levelt, P.F.; Hanssen, R.F. ESA’s sentinel missions in support of Earth system science. Remote Sens. Environ. 2012, 120, 84–90. [Google Scholar] [CrossRef]
  43. Guanter, L.; Aben, I.; Tol, P.; Krijger, J.M.; Hollstein, A.; Köhler, P.; Damm, A.; Joiner, J.; Frankenberg, C.; Landgraf, J. Potential of the TROPOspheric Monitoring Instrument (TROPOMI) onboard the Sentinel-5 Precursor for the monitoring of terrestrial chlorophyll fluorescence. Atmos. Meas. Tech. 2015, 8, 1337–1352. [Google Scholar] [CrossRef] [Green Version]
  44. Mansouri Daneshvar, M.R.; Ebrahimi, M.; Nejadsoleymani, H. An overview of climate change in Iran: Facts and statistics. Environ. Syst. Res. 2019, 8, 7. [Google Scholar] [CrossRef] [Green Version]
  45. Köhler, P.; Frankenberg, C.; Magney, T.S.; Guanter, L.; Joiner, J.; Landgraf, J. Global retrievals of solar-induced chlorophyll fluorescence with TROPOMI: First results and intersensor comparison to OCO-2. Geophys. Res. Lett. 2018, 45, 10–456. [Google Scholar] [CrossRef] [PubMed] [Green Version]
  46. Zeng, J.; Vollmer, B.; Ostrenga, D.; Gerasimov, I. Air quality satellite monitoring by TROPOMI on Sentinel-5P. In Proceedings of the AGU Fall Meeting 2018, Washington, DC, USA, 10–14 December 2018. [Google Scholar]
  47. Borsdorff, T.; Pandey, S.; Hasekamp, O.; Aben, I.; Houweling, S.; Landgraf, J. Carbon monoxide air pollution on sub-city scales and along arterial roads detected by the Tropospheric Monitoring Instrument. Atmos. Chem. Phys. 2019, 19, 3579–3588. [Google Scholar] [CrossRef] [Green Version]
  48. Veefkind, J.P.; Aben, I.; McMullan, K.; Förster, H.; De Vries, J.; Otter, G.; Claas, J.; Eskes, H.J.; De Haan, J.F.; Kleipool, Q. TROPOMI on the ESA Sentinel-5 Precursor: A GMES mission for global observations of the atmospheric composition for climate, air quality and ozone layer applications. Remote Sens. Environ. 2012, 120, 70–83. [Google Scholar] [CrossRef]
  49. Liu, L.; Zhang, X.; Xu, W.; Liu, X.; Lu, X.; Wei, J.; Li, Y.; Yang, Y.; Wang, Z.; Wong, A.Y.H. Reviewing global estimates of surface reactive nitrogen concentration and deposition using satellite retrievals. Atmos. Chem. Phys. 2020, 20, 8641–8658. [Google Scholar] [CrossRef]
  50. Van Geffen, J.; Folkert Boersma, K.; Eskes, H.; Sneep, M.; Ter Linden, M.; Zara, M.; Pepijn Veefkind, J. S5P TROPOMI NO2 slant column retrieval: Method, stability, uncertainties and comparisons with OMI. Atmos. Meas. Tech. 2020, 13, 1315–1335. [Google Scholar] [CrossRef] [Green Version]
  51. Congalton, R.G. Accuracy assessment and validation of remotely sensed and other spatial information. Int. J. Wildland Fire 2001, 10, 321–328. [Google Scholar] [CrossRef] [Green Version]
  52. Zhong, Y.; Fei, F.; Liu, Y.; Zhao, B.; Jiao, H.; Zhang, L. SatCNN: Satellite image dataset classification using agile convolutional neural networks. Remote Sens. Lett. 2016, 8, 136–145. [Google Scholar] [CrossRef]
  53. Huijnen, V.; Eskes, H.J.; Poupkou, A.; Elbern, H.; Boersma, K.F.; Foret, G.; Sofiev, M.; Valdebenito, A.; Flemming, J.; Stein, O. Comparison of OMI NO2 tropospheric columns with an ensemble of global and European regional air quality models. Atmos. Chem. Phys. 2010, 10, 3273–3296. [Google Scholar] [CrossRef] [Green Version]
  54. Kramer, L.J.; Leigh, R.J.; Remedios, J.J.; Monks, P.S. Comparison of OMI and ground-based in situ and MAX-DOAS measurements of tropospheric nitrogen dioxide in an urban area. J. Geophys. Res. Atmos. 2008, 113. [Google Scholar] [CrossRef]
  55. Chen, T.-H.K.; Qiu, C.; Schmitt, M.; Zhu, X.X.; Sabel, C.E.; Prishchepov, A.V. Mapping horizontal and vertical urban densification in Denmark with Landsat time-series from 1985 to 2018: A semantic segmentation solution. Remote Sens. Environ. 2020, 251, 112096. [Google Scholar] [CrossRef]
  56. Xu, J.; Lindqvist, H.; Liu, Q.; Wang, K.; Wang, L. Estimating the spatial and temporal variability of the ground-level NO2 concentration in China during 2005–2019 based on satellite remote sensing. Atmos. Pollut. Res. 2020, 12, 57–67. [Google Scholar] [CrossRef]
  57. Zheng, Z.; Yang, Z.; Wu, Z.; Marinello, F. Spatial variation of NO2 and its impact factors in China: An application of sentinel-5P products. Remote Sens. 2019, 11, 1939. [Google Scholar] [CrossRef] [Green Version]
  58. Zhu, Y.; Zhan, Y.; Wang, B.; Li, Z.; Qin, Y.; Zhang, K. Spatiotemporally mapping of the relationship between NO2 pollution and urbanization for a megacity in Southwest China during 2005–2016. Chemosphere 2019, 220, 155–162. [Google Scholar] [CrossRef] [PubMed]
  59. Wang, C.; Wang, T.; Wang, P. The spatial–temporal variation of tropospheric no2 over china during 2005 to 2018. Atmosphere 2019, 10, 444. [Google Scholar] [CrossRef] [Green Version]
  60. Sun, C.; Luo, Y.; Li, J. Urban traffic infrastructure investment and air pollution: Evidence from the 83 cities in China. J. Clean. Prod. 2018, 172, 488–496. [Google Scholar] [CrossRef]
  61. Shariepour, Z.; Aliakbari Bidokhti, A. An Investigation on the status of troposphere NO2 over Iran during 2004 to 2012. J. Environ. Stud. 2014, 40, 65–78. [Google Scholar]
  62. Borsdorff, T.; Hu, H.; Hasekamp, O.; Sussmann, R.; Rettinger, M.; Hase, F.; Gross, J.; Schneider, M.; Garcia, O.; Stremme, W. Mapping carbon monoxide pollution from space down to city scales with daily global coverage. Atmos. Meas. Tech. 2018, 11, 5507–5518. [Google Scholar] [CrossRef] [Green Version]
  63. Maroufnejad, A.; Reis Ghanavati, K. The Effect of Urban Management on Reducing Industrial Pollutants in the City of Mahshahr. J. Urban Econ. Manag. 2014, 2, 19–35. [Google Scholar]
Figure 1. Study area.
Remotesensing 14 01725 g001
Figure 2. Data used: (a) the population density (person per km2) and (b) the number of industrial units in Iran.
Remotesensing 14 01725 g002
Figure 3. The flowchart methodology of this research.
Remotesensing 14 01725 g003
Figure 4. The regression between ground NO2 data (µg/m3) and TROPOMI tropospheric NO2 column concentration (1015 molecules cm−2) at different times of the year. (a) Spring. (b) Summer. (c) Autumn. (d) Winter. (e) monthly scale (black line in the chart is the trend line for NO2).
Remotesensing 14 01725 g004
Figure 5. Iran’s monthly tropospheric NO2 column concentration (1015 molecules cm−2) (2018–2021).
Remotesensing 14 01725 g005
Figure 6. Seasonal tropospheric NO2 column concentration (1015 molecules cm−2) in Iran (2018–2021), Spring (March, April, and May); Summer (June, July, and August); Autumn (September, October, and November); Winter (December, January, and February).
Remotesensing 14 01725 g006
Figure 7. Monthly fluctuation of tropospheric NO2 columns (1015 molecules cm−2) in some industrial and densely populated provinces (Tehran and Isfahan) and some non-industrial and sparsely populated provinces (Sistan and Baluchestan). (Red lines in the charts are trend lines for NO2).
Remotesensing 14 01725 g007aRemotesensing 14 01725 g007b
Figure 8. (a) Correlation between population density and tropospheric NO2 columns concentration (1015 molecules cm−2); (b) correlation between industrial units’ density and tropospheric NO2 columns concentration (1015 molecules cm−2).
Remotesensing 14 01725 g008
Figure 9. Spatial distribution of ground truth data points in the study area.
Remotesensing 14 01725 g009
Table 1. Description of datasets included in the study.
NameDataset ProviderDataset AvailabilityRange
Copernicus Sentinel-5P OFFL NO2European Union/ESA/Copernicus2018 to 20210 to 20
(1015 molecules cm−2)
Ground air quality dataAir Quality Control Monitoring Organization2018–20210 to 120 µg/m3
PopulationStatistical Center of Iran20167402 to 8,737,510 persons per county
IndustryOpenStreetMap (OSM)20200 to 114 industrial units in the counties
Table 2. Statistics of validation points.
City NameNumber of StationsNumber of Observations (2018 to 2021)Average NO2
(µg/m3)
Standard Deviation
(µg/m3)
Tehran234785925
Isfahan1622139
Tabriz8363113
Ahvaz5152221
Total525513117
Table 3. Statistical values of NO2 using S5P in 2018–2021.
MonthJulyAugustSeptemberOctoberNovemberDecemberJanuaryFebruaryMarchAprilMayJune
Min0.010.040.050.190.000.000.000.000.000.000.000.00
Max2.972.904.807.9515.0019.0015.8012.049.003.874.003.20
Mean0.200.230.220.190.250.280.300.240.180.160.170.18
STD0.110.110.150.200.330.400.410.280.240.110.120.11
Table 4. Specifications of population statistics using NO2 (1015 molecules cm−2) classes.
Pollution ClassValue
(1015 Molecules cm−2)
Cities
Count
Area
(km2)
Percentage of
Area
PopulationPercentage of
Population
Very Low<0.21941,048,152.264.318,948,29523.7
Low0.2–0.5193544,494.733.439,106,08848.9
Moderate0.5–12728,341.21.748,582,95210.7
High1–295102.40.312,894,3143.6
Very High>262704.90.1610,394,62113.1
Sum 4291,628,79510079,926,270100
Publisher’s Note: MDPI stays neutral with regard to jurisdictional claims in published maps and institutional affiliations.

