
Multi-Frequency Interferometric Coherence Characteristics Analysis of Typical Objects for Coherent Change Detection

 , , , and
Abstract
:1. Introduction
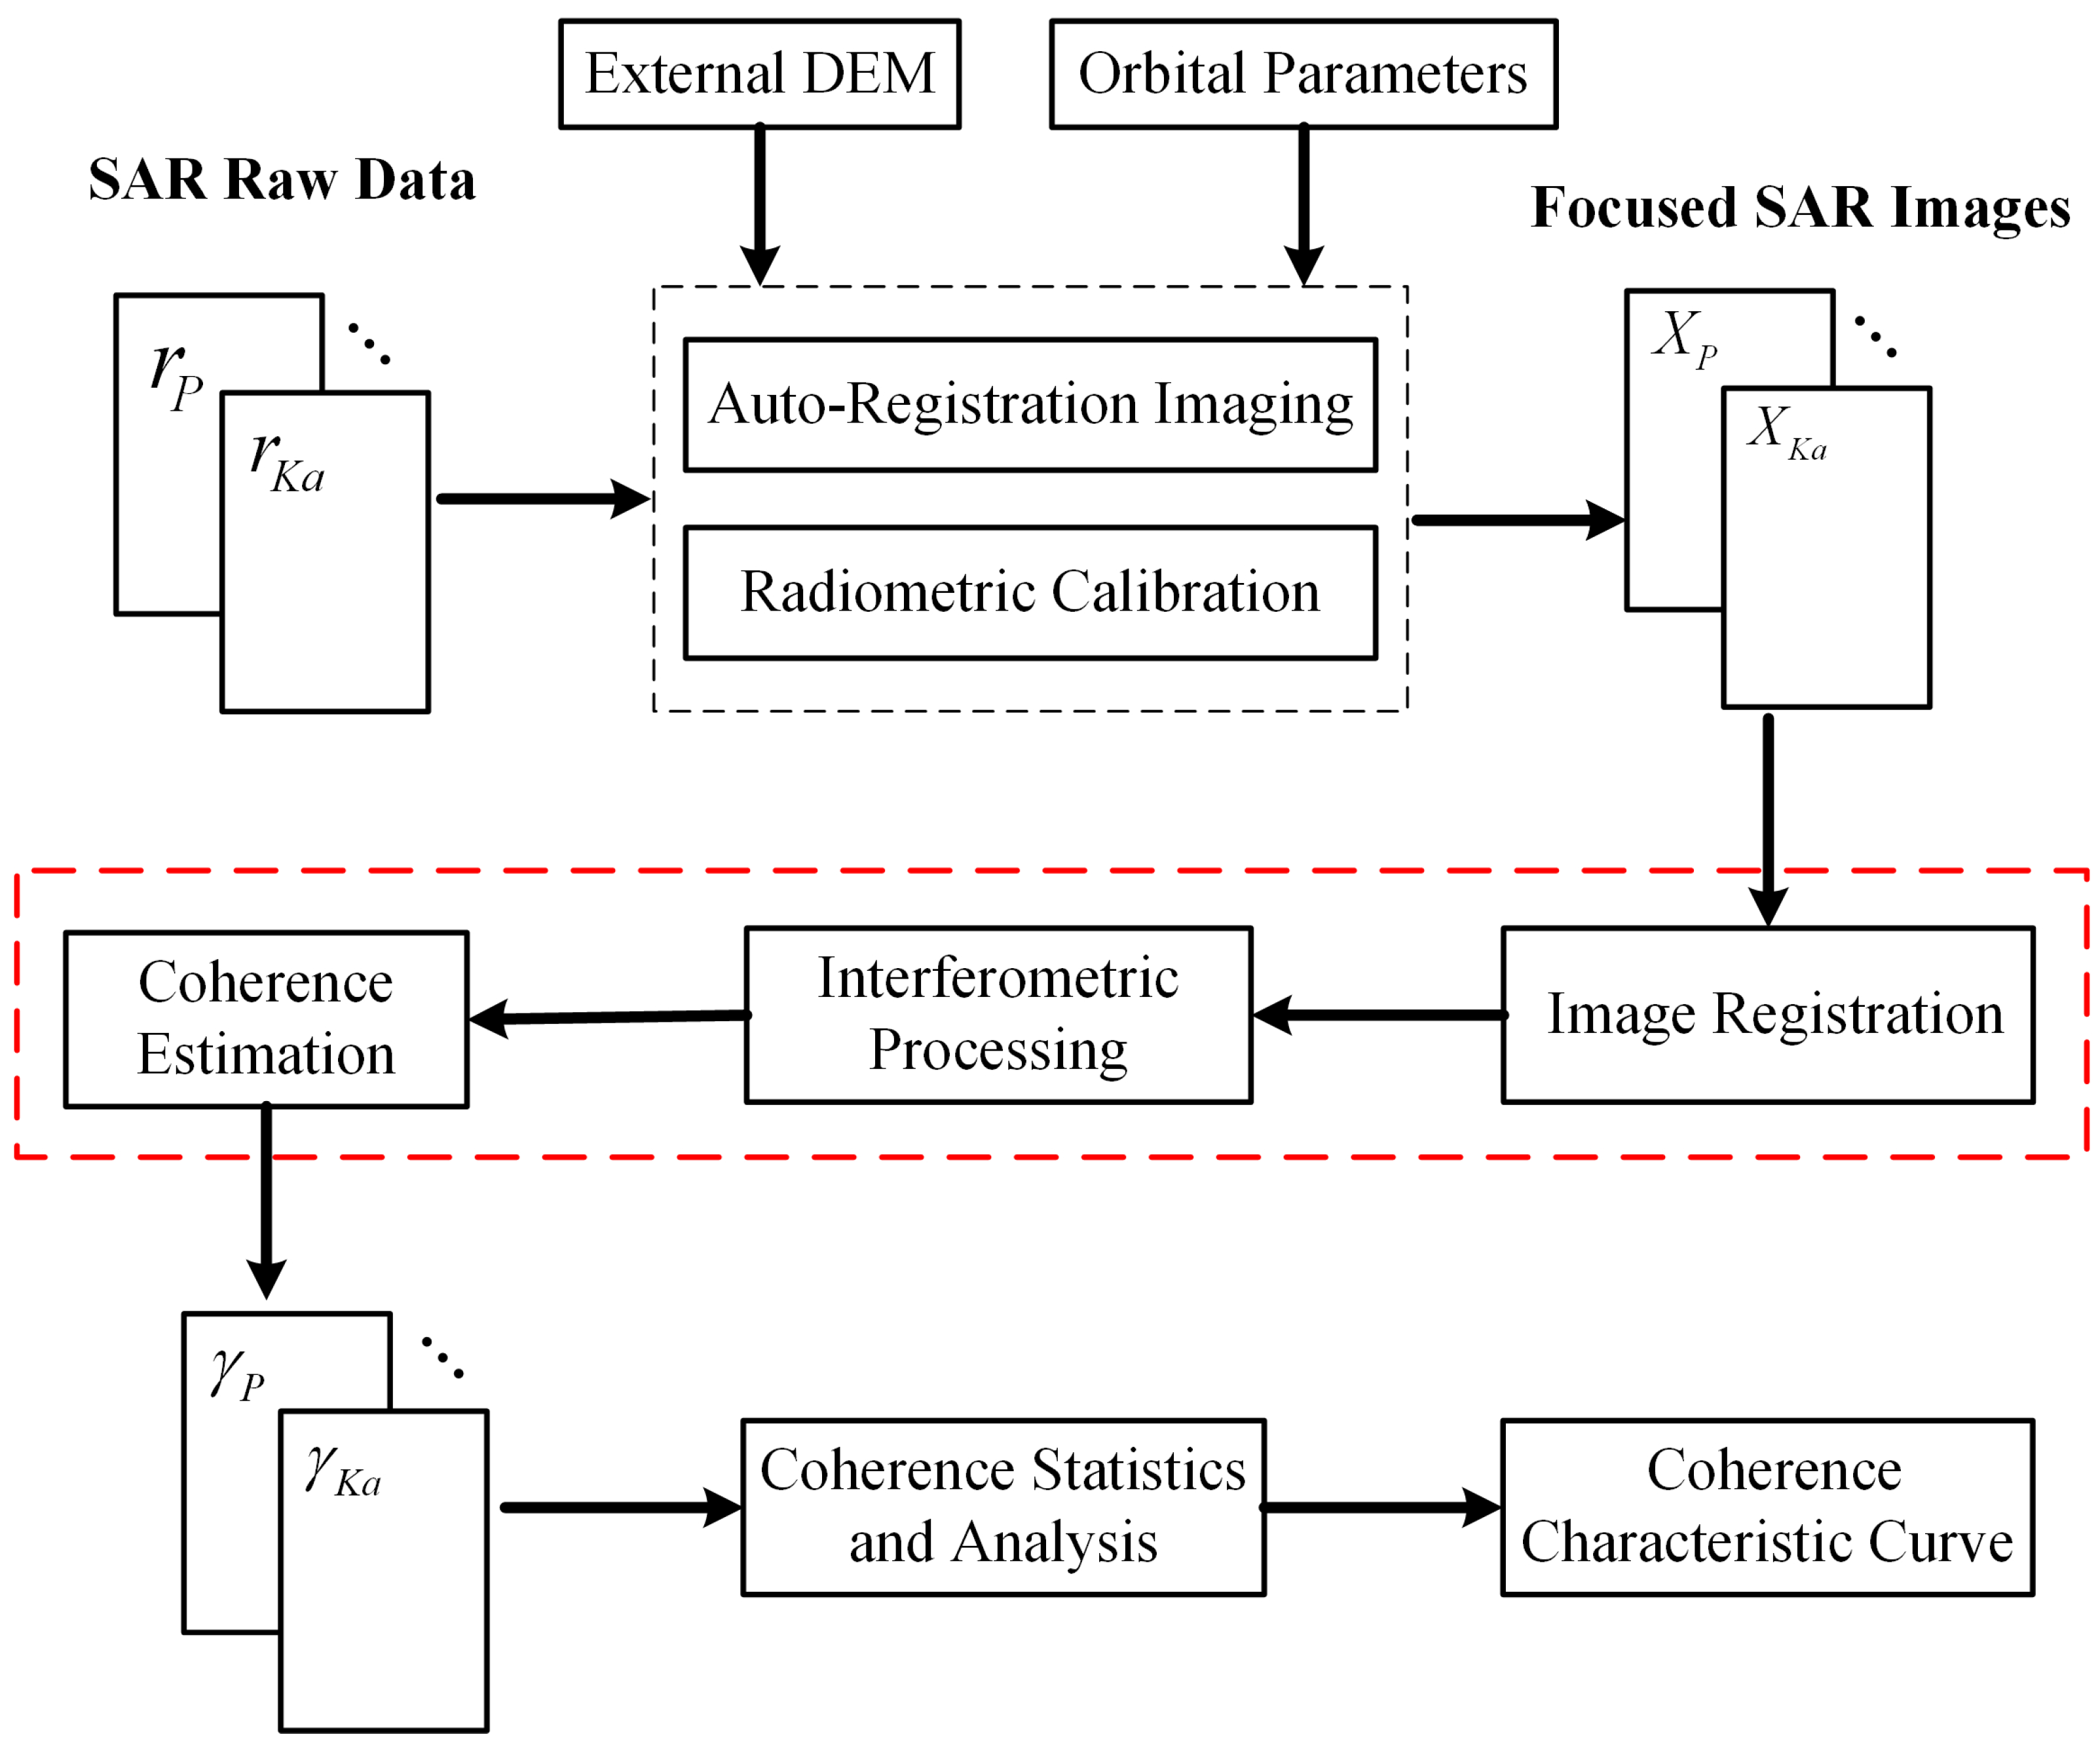
2. Methodology
2.1. Auto-Registration Imaging
2.2. Interferometric Processing and Analysis
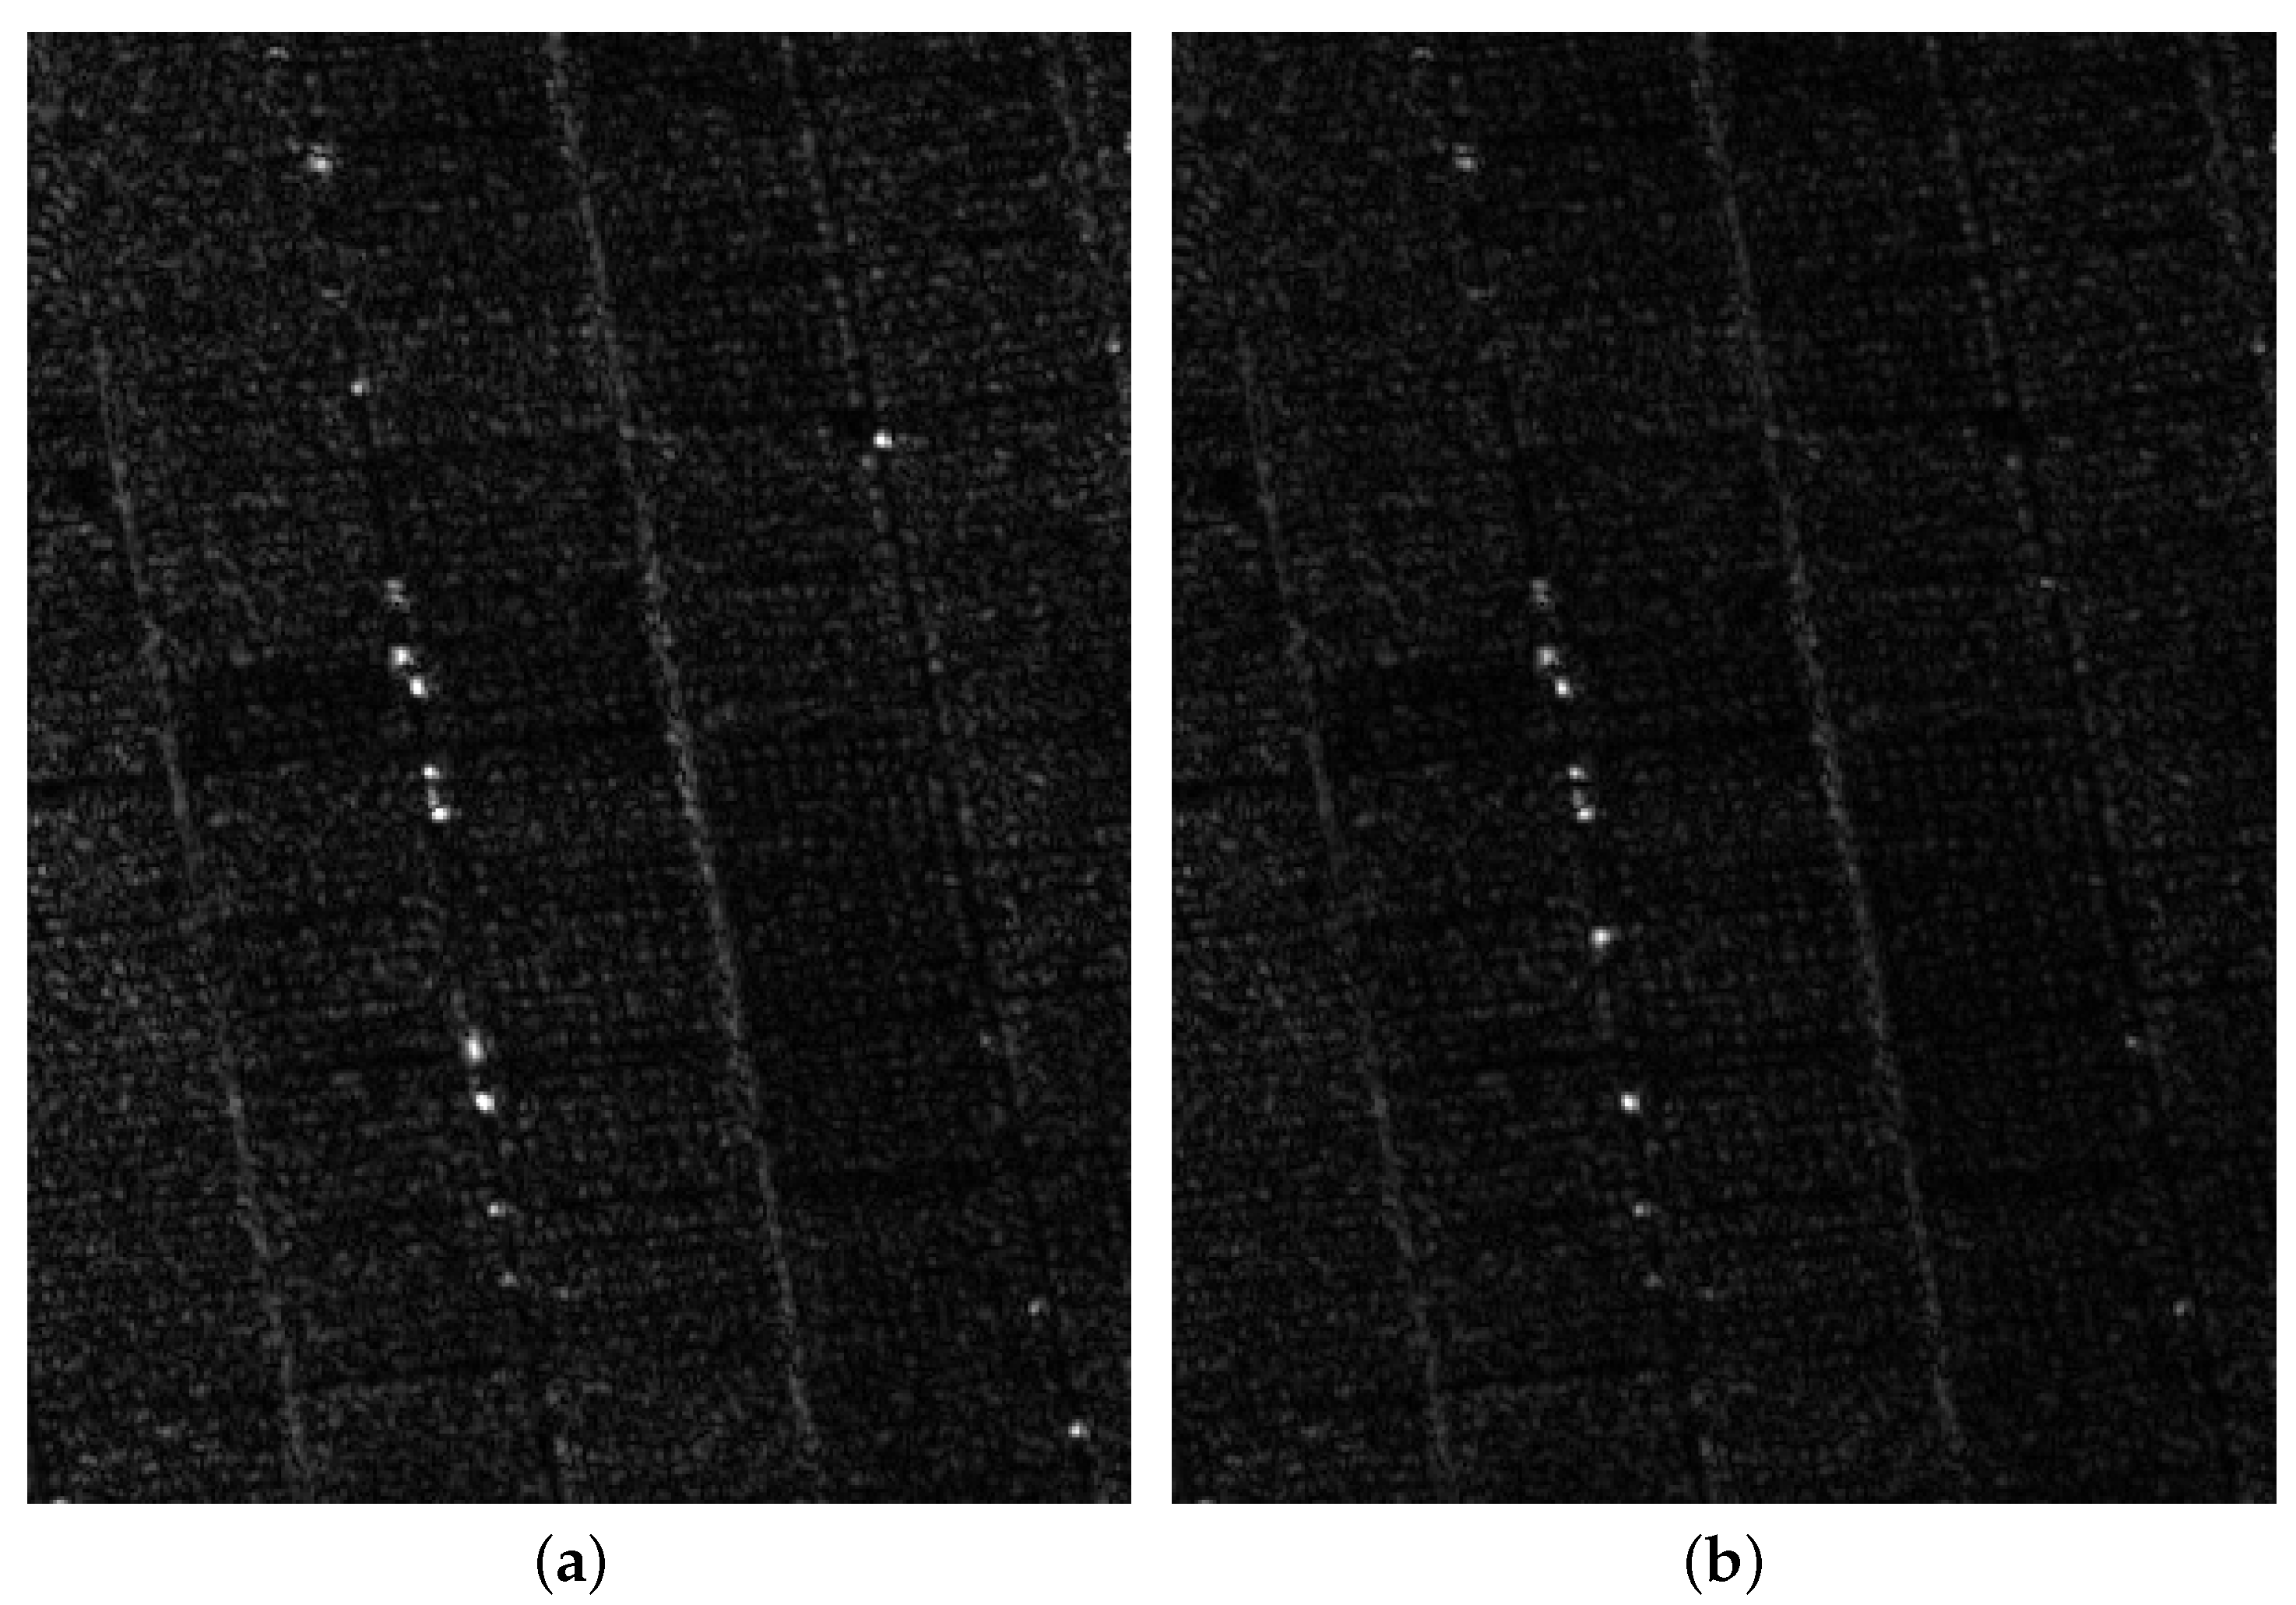
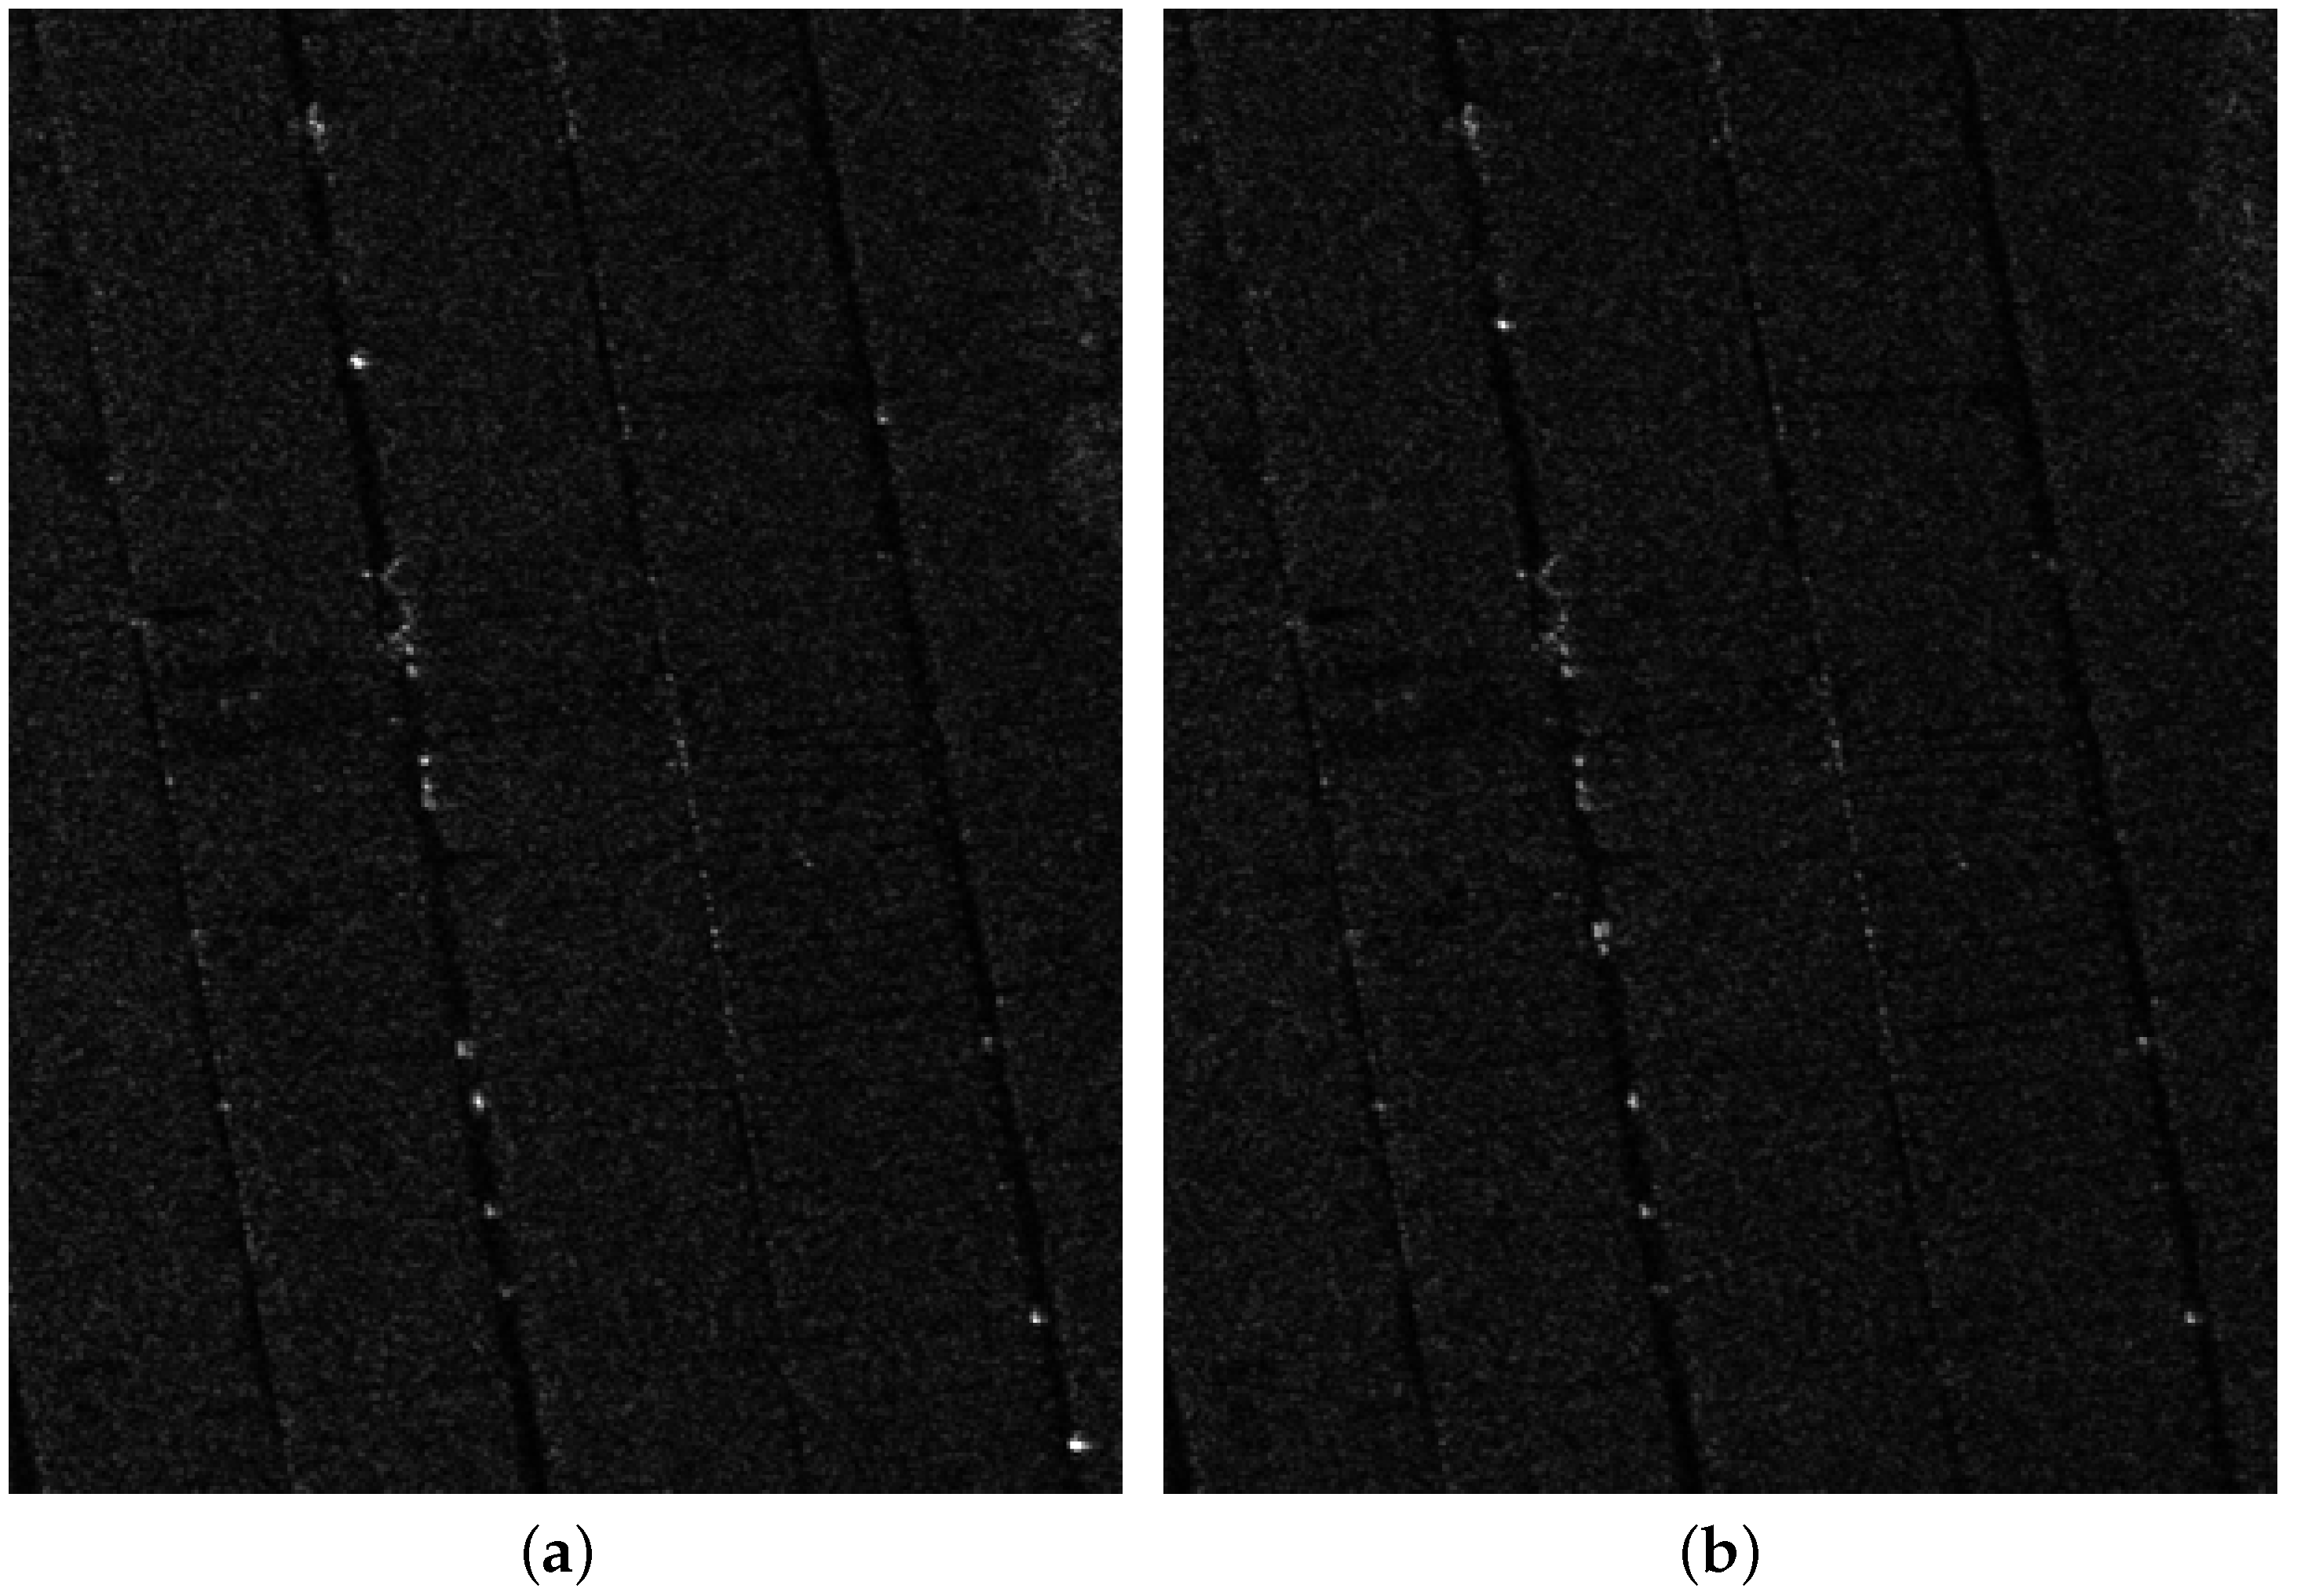
3. Experiments and Results
3.1. Experiments
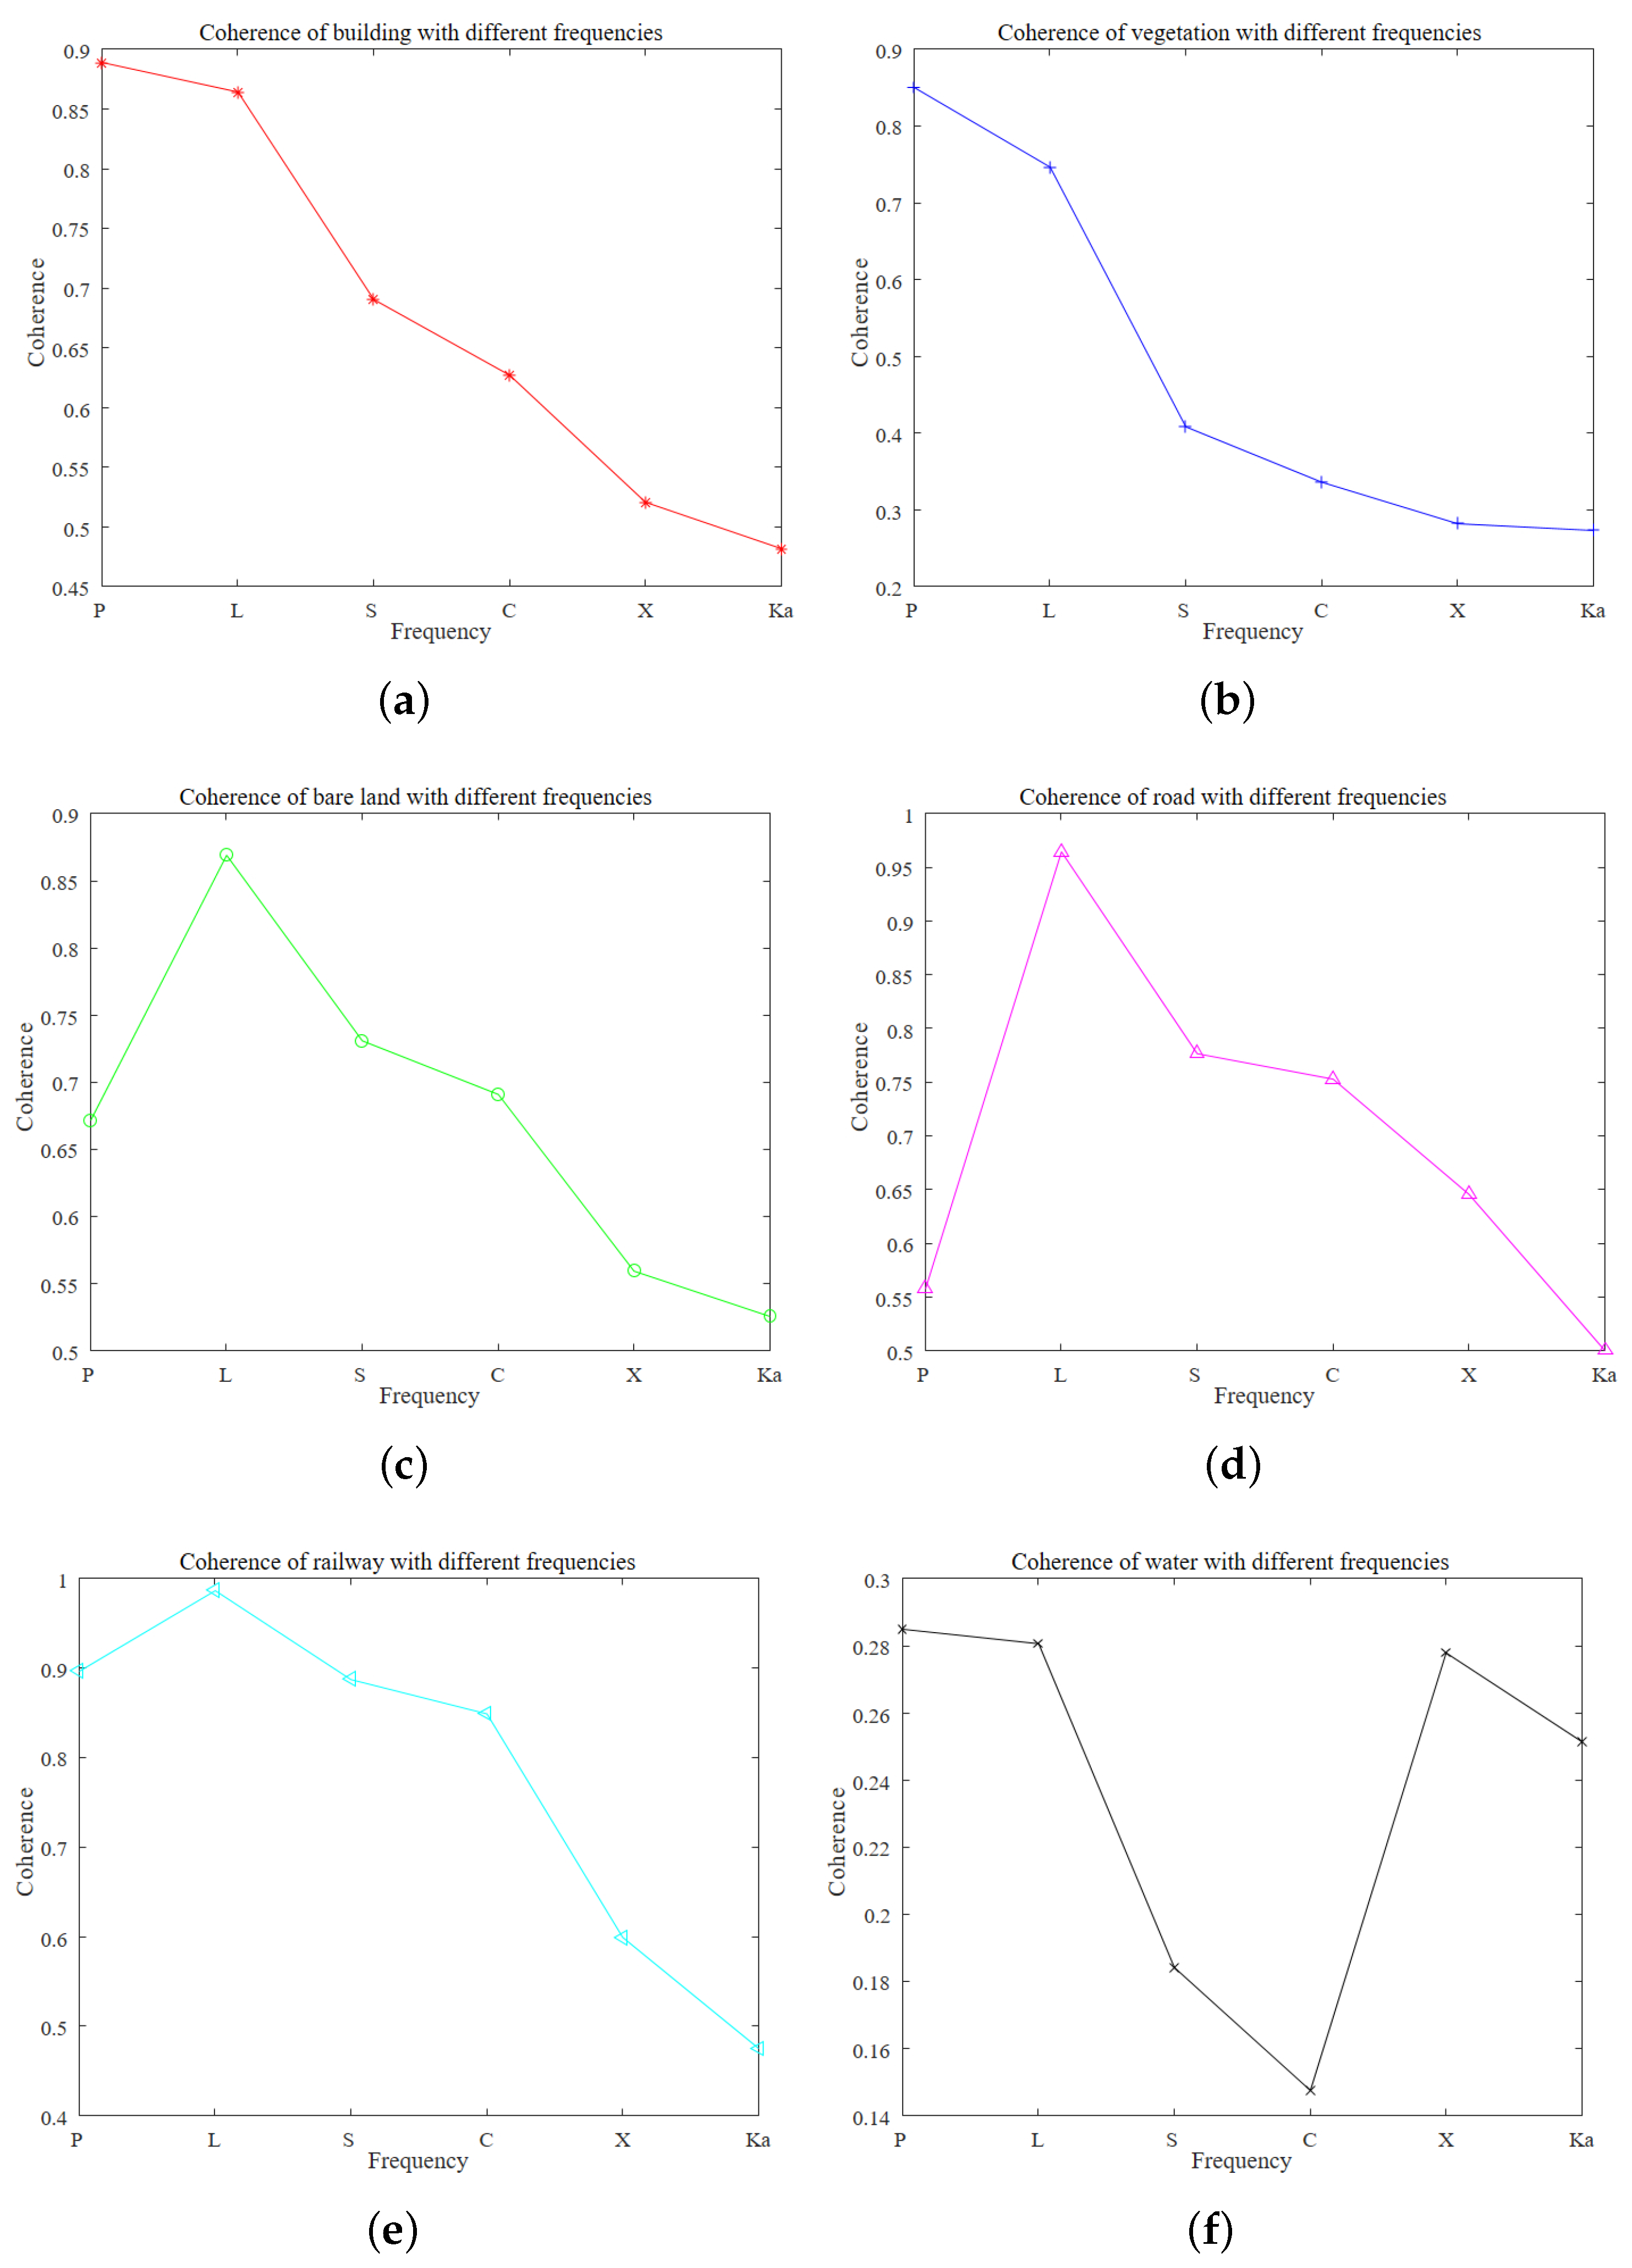
3.2. Experiment Analysis
4. Discussion
Author Contributions
Funding
Institutional Review Board Statement
Informed Consent Statement
Data Availability Statement
Acknowledgments
Conflicts of Interest
References
- Moreira, A.; Prats-Iraola, P.; Younis, M.; Krieger, G.; Hajnsek, I.; Papathanassiou, K.P. A tutorial on synthetic aperture radar. IEEE Geosci. Remote Sens. Mag. 2013, 1, 6–43. [Google Scholar] [CrossRef] [Green Version]
- Hu, Z.; Bryant, M.; Qiu, R.C. Multi-path SAR change detection. In Proceedings of the 2012 IEEE Radar Conference, Atlanta, GA, USA, 7–11 May 2012; pp. 859–863. [Google Scholar] [CrossRef]
- Dong, G.; Kuang, G.; Wang, N.; Zhao, L.; Lu, J. SAR Target Recognition via Joint Sparse Representation of Monogenic Signal. IEEE J. Sel. Top. Appl. Earth Obs. Remote Sens. 2015, 8, 3316–3328. [Google Scholar] [CrossRef]
- Yu, M.; Dong, G.; Fan, H.; Kuang, G. SAR Target Recognition via Local Sparse Representation of Multi-Manifold Regularized Low-Rank Approximation. Remote Sens. 2018, 10, 211. [Google Scholar] [CrossRef] [Green Version]
- Yang, J.; Liu, C.; Wang, Y. Detection and Imaging of Ground Moving Targets With Real SAR Data. IEEE Trans. Geosci. Remote Sens. 2015, 53, 920–932. [Google Scholar] [CrossRef]
- Li, Z.; Wu, J.; Liu, Z.; Huang, Y.; Yang, H.; Yang, J. An Optimal 2-D Spectrum Matching Method for SAR Ground Moving Target Imaging. IEEE Trans. Geosci. Remote Sens. 2018, 56, 5961–5974. [Google Scholar] [CrossRef]
- Wahl, D.E.; Yocky, D.A.; Jakowatz, C.V.; Simonson, K.M. A New Maximum-Likelihood Change Estimator for Two-Pass SAR Coherent Change Detection. IEEE Trans. Geosci. Remote Sens. 2016, 54, 2460–2469. [Google Scholar] [CrossRef]
- Tzouvaras, M.; Danezis, C.; Hadjimitsis, D.G. Small Scale Landslide Detection Using Sentinel-1 Interferometric SAR Coherence. Remote Sens. 2020, 12, 1560. [Google Scholar] [CrossRef]
- Mian, A.; Collas, A.; Breloy, A.; Ginolhac, G.; Ovarlez, J.P. Robust Low-Rank Change Detection for Multivariate SAR Image Time Series. IEEE J. Sel. Top. Appl. Earth Obs. Remote Sens. 2020, 13, 3545–3556. [Google Scholar] [CrossRef]
- Yu, B.; Phillips, R.D. Using contextual information to improve SAR CCD: Bayesian contextual coherent change detection (BC CCD). In Proceedings of the 2014 IEEE Geoscience and Remote Sensing Symposium, Quebec City, QC, Canada, 13–18 July 2014; pp. 1277–1280. [Google Scholar] [CrossRef]
- Newey, M.; Barber, J.; Benitz, G.; Kogon, S. False alarm mitigation techniques for SAR CCD. In Proceedings of the 2013 IEEE Radar Conference, Ottawa, ON, Canada, 29 April–3 May 2013; pp. 1–6. [Google Scholar] [CrossRef]
- Horst, H.; Lorenz, F.; Cadario, E.; Kuny, S.; Thiele, A. Enhancement of Coherence Images for Coherent Change Detection. In Proceedings of the EUSAR 2021, 13th European Conference on Synthetic Aperture Radar, Leipzig, Germany, 29 March–1 April 2021; pp. 1–6. [Google Scholar]
- Biondi, F. (L + S)-RT-CCD for Terrain Paths Monitoring. IEEE Geosci. Remote Sens. Lett. 2018, 15, 1209–1213. [Google Scholar] [CrossRef]
- Carotenuto, V.; Clemente, C.; De Maio, A.; Soraghan, J.; Iommelli, S. Multi-polarization SAR change detection: Unstructured versus structured GLRT. In Proceedings of the 2014 Sensor Signal Processing for Defence, Edinburgh, UK, 8–9 September 2014; pp. 1–5. [Google Scholar] [CrossRef]
- Biondi, F. A new maximum likelihood polarimetric interferometric synthetic aperture radar coherence change detection (ML-PolInSAR-CCD). Int. J. Remote Sens. 2019, 40, 5158–5178. [Google Scholar] [CrossRef]
- Cha, M.; Phillips, R.; Wolfe, P.J. Test statistics for synthetic aperture radar coherent change detection. In Proceedings of the 2012 IEEE Statistical Signal Processing Workshop, Ann Arbor, MI, USA, 5–8 August 2012; pp. 856–859. [Google Scholar] [CrossRef]
- Monti-Guarnieri, A.V.; Brovelli, M.A.; Manzoni, M.; d’Alessandro, M.M.; Molinari, M.E.; Oxoli, D. Coherent Change Detection for Multipass SAR. IEEE Trans. Geosci. Remote Sens. 2018, 56, 6811–6822. [Google Scholar] [CrossRef]
- Manzoni, M.; Monti-Guarnieri, A.; Molinari, M.E. Joint exploitation of spaceborne SAR images and GIS techniques for urban coherent change detection. Remote Sens. Environ. 2021, 253, 112152. [Google Scholar] [CrossRef]
- Pincus, P.B.; Preiss, M. Coherent change detection under a forest canopy. In Proceedings of the 2018 International Conference on Radar, Brisbane, QLD, Australia, 27–31 August 2018; pp. 1–6. [Google Scholar] [CrossRef] [Green Version]
- Wang, Z.; Wang, Y.; Wang, B.; Hu, X.; Song, C.; Xiang, M. Human Activity Detection Based on Multipass Airborne InSAR Coherence Matrix. IEEE Geosci. Remote Sens. Lett. 2022, 19, 1–5. [Google Scholar] [CrossRef]
- Hammer, H.; Kuny, S.; Thiele, A. Enhancing Coherence Images for Coherent Change Detection: An Example on Vehicle Tracks in Airborne SAR Images. Remote Sens. 2021, 13, 5010. [Google Scholar] [CrossRef]
- Zhang, J.; Xing, M.; Sun, G.C.; Wang, Z. Multiple Statistics Contributing to Few-Sample Deep Learning for Subtle Trace Detection in High-Resolution SAR Images. IEEE Trans. Geosci. Remote Sens. 2022, 60, 1–14. [Google Scholar] [CrossRef]
- Zhang, K.; Fu, X.; Lv, X.; Yuan, J. Unsupervised Multitemporal Building Change Detection Framework Based on Cosegmentation Using Time-Series SAR. Remote Sens. 2021, 13, 471. [Google Scholar] [CrossRef]
- Oxoli, D.; Boccardo, P.; Brovelli, M.A.; Molinari, M.E.; Monti Guarnieri, A. Coherent change detection for repeated-pass interferometric SAR images: An application to earthquake damage assessment on buildings. Int. Arch. Photogramm. Remote Sens. Spat. Inf. Sci. 2018, 502, 383–388. [Google Scholar] [CrossRef] [Green Version]
- Washaya, P.; Balz, T.; Mohamadi, B. Coherence Change-Detection with Sentinel-1 for Natural and Anthropogenic Disaster Monitoring in Urban Areas. Remote Sens. 2018, 10, 1026. [Google Scholar] [CrossRef] [Green Version]
- Liu, C.; Yin, J.; Yang, J.; Gao, W. Classification of multi-frequency polarimetric SAR images based on multi-linear subspace learning of tensor objects. Remote Sens. 2015, 7, 9253–9268. [Google Scholar] [CrossRef] [Green Version]
- Wu, Y. Concept on Multidimensional Space Joint-observation SAR. J. Radars 2013, 2, 135–142. [Google Scholar] [CrossRef]
- Ding, C.; Qiu, X.; Wu, Y. Concept, system, and method of holographic synthetic aperture radar. J. Radars 2020, 3, 399–408. [Google Scholar] [CrossRef]
- Rosen, P.A.; Hensley, S.; Zebker, H.A.; Webb, F.H.; Fielding, E.J. Surface deformation and coherence measurements of Kilauea Volcano, Hawaii, from SIR-C radar interferometry. J. Geophys. Res. Planets 1996, 101, 23109–23125. [Google Scholar] [CrossRef]
- Lanari, R.; Fornaro, G.; Riccio, D.; Migliaccio, M.; Papathanassiou, K.; Moreira, J.; Schwabisch, M.; Dutra, L.; Puglisi, G.; Franceschetti, G.; et al. Generation of digital elevation models by using SIR-C/X-SAR multifrequency two-pass interferometry: The Etna case study. IEEE Trans. Geosci. Remote Sens. 1996, 34, 1097–1114. [Google Scholar] [CrossRef]
- Reigber, A.; Jäger, M.; Krogager, E. Polarimetric SAR change detection in multiple frequency bands for environmental monitoring in Arctic regions. In Proceedings of the 2016 IEEE International Geoscience and Remote Sensing Symposium (IGARSS), Beijing, China, 10–15 July 2016; pp. 5702–5705. [Google Scholar] [CrossRef]
- Horn, R.; Jaeger, M.; Keller, M.; Limbach, M.; Nottensteiner, A.; Pardini, M.; Reigber, A.; Scheiber, R. F-SAR—Recent upgrades and campaign activities. In Proceedings of the 2017 18th International Radar Symposium (IRS), Prague, Czech Republic, 28–30 June 2017; pp. 1–10. [Google Scholar] [CrossRef] [Green Version]
- Henke, D.; Dominguez, E.M.; Fagir, J.; Fritsche, L.; Horn, R.; Scheiber, R.; Reigber, A.; Sieger, S.; Janssen, D.; Klöppel, F.; et al. Multi-Platform, Multi-Frequency SAR Campaign with the F-SAR and Miranda35 Sensors. In Proceedings of the IGARSS 2020 IEEE International Geoscience and Remote Sensing Symposium, Waikoloa, HI, USA, 26 September–2 October 2020; pp. 6166–6169. [Google Scholar] [CrossRef]
- Martinis, S.; Fissmer, B.; Rieke, C. Time series analysis of multi-frequency SAR backscatter and bistatic coherence in the context of flood mapping. In Proceedings of the 2015 8th International Workshop on the Analysis of Multitemporal Remote Sensing Images (Multi-Temp), Annecy, France, 22–24 July 2015; pp. 1–4. [Google Scholar] [CrossRef] [Green Version]
- Maleki, S.; Baghdadi, N.; Soffianian, A.; El Hajj, M.; Rahdari, V. Analysis of multi-frequency and multi-polarization SAR data for wetland mapping in Hamoun-e-Hirmand wetland. Int. J. Remote Sens. 2020, 41, 2277–2302. [Google Scholar] [CrossRef]
- Hagensieker, R.; Waske, B. Evaluation of Multi-Frequency SAR Images for Tropical Land Cover Mapping. Remote Sens. 2018, 10, 257. [Google Scholar] [CrossRef] [Green Version]
- Freeman, A.; Zink, M.; Caro, E.; Moreira, A.; Veilleux, L.; Werner, M. The legacy of the SIR-C/X-SAR radar system: 25 years on. Remote Sens. Environ. 2019, 231, 111255. [Google Scholar] [CrossRef]
- Fang, D.; Lv, X.; Yun, Y.; Li, F. An InSAR Fine Registration Algorithm Using Uniform Tie Points Based on Voronoi Diagram. IEEE Geosci. Remote Sens. Lett. 2017, 14, 1403–1407. [Google Scholar] [CrossRef]
- Wei, M.; Sandwell, D.T. Decorrelation of L-Band and C-Band Interferometry Over Vegetated Areas in California. IEEE Trans. Geosci. Remote Sens. 2010, 48, 2942–2952. [Google Scholar] [CrossRef]
- Sabry, R. Improving SAR-Based Coherent Change Detection Products by Using an Alternate Coherency Formalism. IEEE Geosci. Remote Sens. Lett. 2021, 18, 1054–1058. [Google Scholar] [CrossRef]
- Touzi, R.; Lopes, A.; Bruniquel, J.; Vachon, P.W. Coherence estimation for SAR imagery. Geosci. Remote Sens. IEEE Trans. 1999, 37, 135–149. [Google Scholar] [CrossRef] [Green Version]
- Lê, T.T.; Froger, J.; Hrysiewicz, A.; Paris, R. Coherence Change Analysis for Multipass Insar Images Based on the Change Detection Matrix. In Proceedings of the IGARSS 2019 IEEE International Geoscience and Remote Sensing Symposium, Yokohama, Japan, 28 July–2 August 2019; pp. 1518–1521. [Google Scholar] [CrossRef]
- Ramsey, E.W., III; Lu, Z.; Rangoonwala, A.; Rykhus, R.P. Multiple Baseline Radar Interferometry Applied to Coastal Land Cover Classification and Change Analyses. GISci. Remote Sens. 2006, 43, 283–309. [Google Scholar] [CrossRef] [Green Version]
- Kim, S.W.; Wdowinski, S.; Amelung, F.; Dixon, T.H.; Won, J.S. Interferometric Coherence Analysis of the Everglades Wetlands, South Florida. IEEE Trans. Geosci. Remote Sens. 2013, 51, 5210–5224. [Google Scholar] [CrossRef]


| Parameter | Value |
|---|---|
| SAR band | P ∖ L ∖ S ∖ C ∖ X ∖ Ka |
| Carrier frequency | 0.39∖0.96∖3.2∖5.4∖9.6∖35 GHz |
| Bandwidth | 200∖200∖300∖300∖500∖600 MHz |
| Pulse repetition frequency | 500∖2000∖1000∖500∖1000∖2000 Hz |
| Resolution | 1∖1∖1∖0.5∖0.5∖0.3 m |
| Look angle | 45 |
| Platform velocity | 98.15 m/s |
| Azimuth pixel spacing | 0.393 m |
| Range pixel spacing | 0.468 m |
| Building | Vegetation | Bare Land | Road | Railway | Water | |
|---|---|---|---|---|---|---|
| Pixels | 4360 | 399,500 | 29,850 | 11,480 | 1370 | 1300 |
Publisher’s Note: MDPI stays neutral with regard to jurisdictional claims in published maps and institutional affiliations. |
© 2022 by the authors. Licensee MDPI, Basel, Switzerland. This article is an open access article distributed under the terms and conditions of the Creative Commons Attribution (CC BY) license (https://creativecommons.org/licenses/by/4.0/).
Share and Cite
Wang, Z.; Wang, Y.; Wang, B.; Xiang, M.; Wang, R.; Xu, W.; Song, C. Multi-Frequency Interferometric Coherence Characteristics Analysis of Typical Objects for Coherent Change Detection. Remote Sens. 2022, 14, 1689. https://doi.org/10.3390/rs14071689
Wang Z, Wang Y, Wang B, Xiang M, Wang R, Xu W, Song C. Multi-Frequency Interferometric Coherence Characteristics Analysis of Typical Objects for Coherent Change Detection. Remote Sensing. 2022; 14(7):1689. https://doi.org/10.3390/rs14071689
Chicago/Turabian StyleWang, Zhongbin, Yachao Wang, Bingnan Wang, Maosheng Xiang, Rongrong Wang, Weidi Xu, and Chong Song. 2022. "Multi-Frequency Interferometric Coherence Characteristics Analysis of Typical Objects for Coherent Change Detection" Remote Sensing 14, no. 7: 1689. https://doi.org/10.3390/rs14071689