1. Introduction
Archaeological structures and sites are valuable due to their representation of past human civilization and legacy [
1]. They hold rich information on the ancient human heritage that is of paramount importance to archaeologists, historians, researchers, and tourists [
2]. Unfortunately, archaeological structures are vulnerable and highly susceptible to destruction due to events such as urbanization, large-scale agriculture, mining activities, wars, vandalism, natural processes such as erosion, and natural disasters [
3]. Therefore, worldwide efforts have been made to conserve, reconstruct, record, and document archaeological structures and sites. Traditionally, documentation has been conducted through excavations and on-site surveying to take measurements of ancient structures and assess their geometric extension [
4]. However, traditional methods may damage the physical integrity of ancient structures. Additionally, they are expensive, time-consuming, and require specific expertise and skills. As a result, several non-destructive and non-invasive alternative techniques have been developed that have relatively lower cost and require less time and effort than the traditional methods [
1].
GPR is a non-invasive geophysical tool that is utilized to identify and image subsurface soil and structures by using high-frequency electromagnetic (EM) waves (10–1000 MHz) [
5]. EM waves with short wavelengths are capable of detecting small objects buried at shallow depths. Many antiquities in urban and arid areas were discovered by implementing GPR technology [
6,
7,
8,
9,
10]. Other emerging technologies for recording and documenting the remains of archaeological sites include photogrammetry, global positioning systems (GPS), and geographic information systems (GIS). Photogrammetry is used to derive information about an object’s physical measurements, position, and features and construct accurate three-dimensional (3D) models of the object by overlapping multiple two-dimensional images of the object. Depending on the data collection procedure, photogrammetry techniques can be categorized as aerial or close-range photogrammetry. The former uses a camera mounted on an aircraft to take images vertically, whereas the latter collects images from a close distance and different positions within this distance. GPS are satellite-based systems that determine the precise location of objects and their position on Earth and GIS are computer-based tools utilized to store, analyze, and visualize geospatial data to interpret spatial relationships [
3].
One of the most notable archaeological structures recognized as a UNESCO World Heritage site with an Outstanding Universal Value is Qaser Amra in Jordan [
11]. Previous literature has made attempts to document and preserve the site by applying integer methodology. For instance, Al-Kheder et al. combined photogrammetry and laser scanning to produce a 3D textured model of the castle [
12]. Alawneh et al. aimed to analyze the painted plaster of Qaser Amra and identify the paintings, material structure, composition and additives, and pigments used in the plaster [
10]. The study proposed a holistic method integrating various techniques, including electron microprobe analysis, optical microscopy analysis, micro-chemical analysis, and X-ray diffraction. Alshawabkeh & El-Khalili used photogrammetric techniques and computational methods to detect, measure, and analyze cracks and structural damage in Qaser Amra [
13]. Despite previous attempts to document and preserve Qaser Amra, the literature lacks sufficient research examining the feasibility of applying an integrated approach combining geomatics techniques and GPR to the castle.
Integrating geomatics techniques with GPR has been applied to many archaeological sites and used to document various sites in Italy [
14,
15,
16,
17,
18], Germany [
19,
20], Jordan [
2,
21], and Spain [
22,
23]. In addition, the integrated approach was used in studies conducted in Egypt [
24], Portugal [
25], Serbia [
26], Slovakia [
27], South Africa [
28], and Sweden [
29]. However, no study utilized GPR techniques to discover the archaeological features of Qaser Amra in the shallow subsurface and to image the extension of these features. GPR is a proven technique that is efficient at identifying potential areas for excavation [
9]. Additionally, the visual representation of subsurface anomalies produced by GPR data plays an important role in archaeological inspections [
30]. It has become a conventional method used in a wide variety of fields, such as engineering and construction, archaeology, geology, environmental areas, and forensic science [
5]. Therefore, the objective of this study is to perform a GPR survey of Qaser Amra, in integration with aerial and close-range photogrammetry, GIS, and satellite imagery, to build a 3D geospatial archaeological database of the castle.
The remainder of this paper is structured as follows. The following subsection outlines the details and historical significance of Qaser Amra.
Section 2 presents the materials and methods adopted in this study.
Section 3.1. describes the photogrammetry processing implemented to produce a digital elevation model (DEM) and orthophotos.
Section 3.2. explains the steps involved in GIS modeling.
Section 3.3. presents the process and outputs of close-range photogrammetry.
Section 3.4. illustrates the GPR techniques used to locate archaeological features at shallow depths.
Section 3.5. discusses the integrated 3D archaeological model. Finally,
Section 4 concludes the study’s findings and highlights potential future research.
Historical Significance of the Study Area
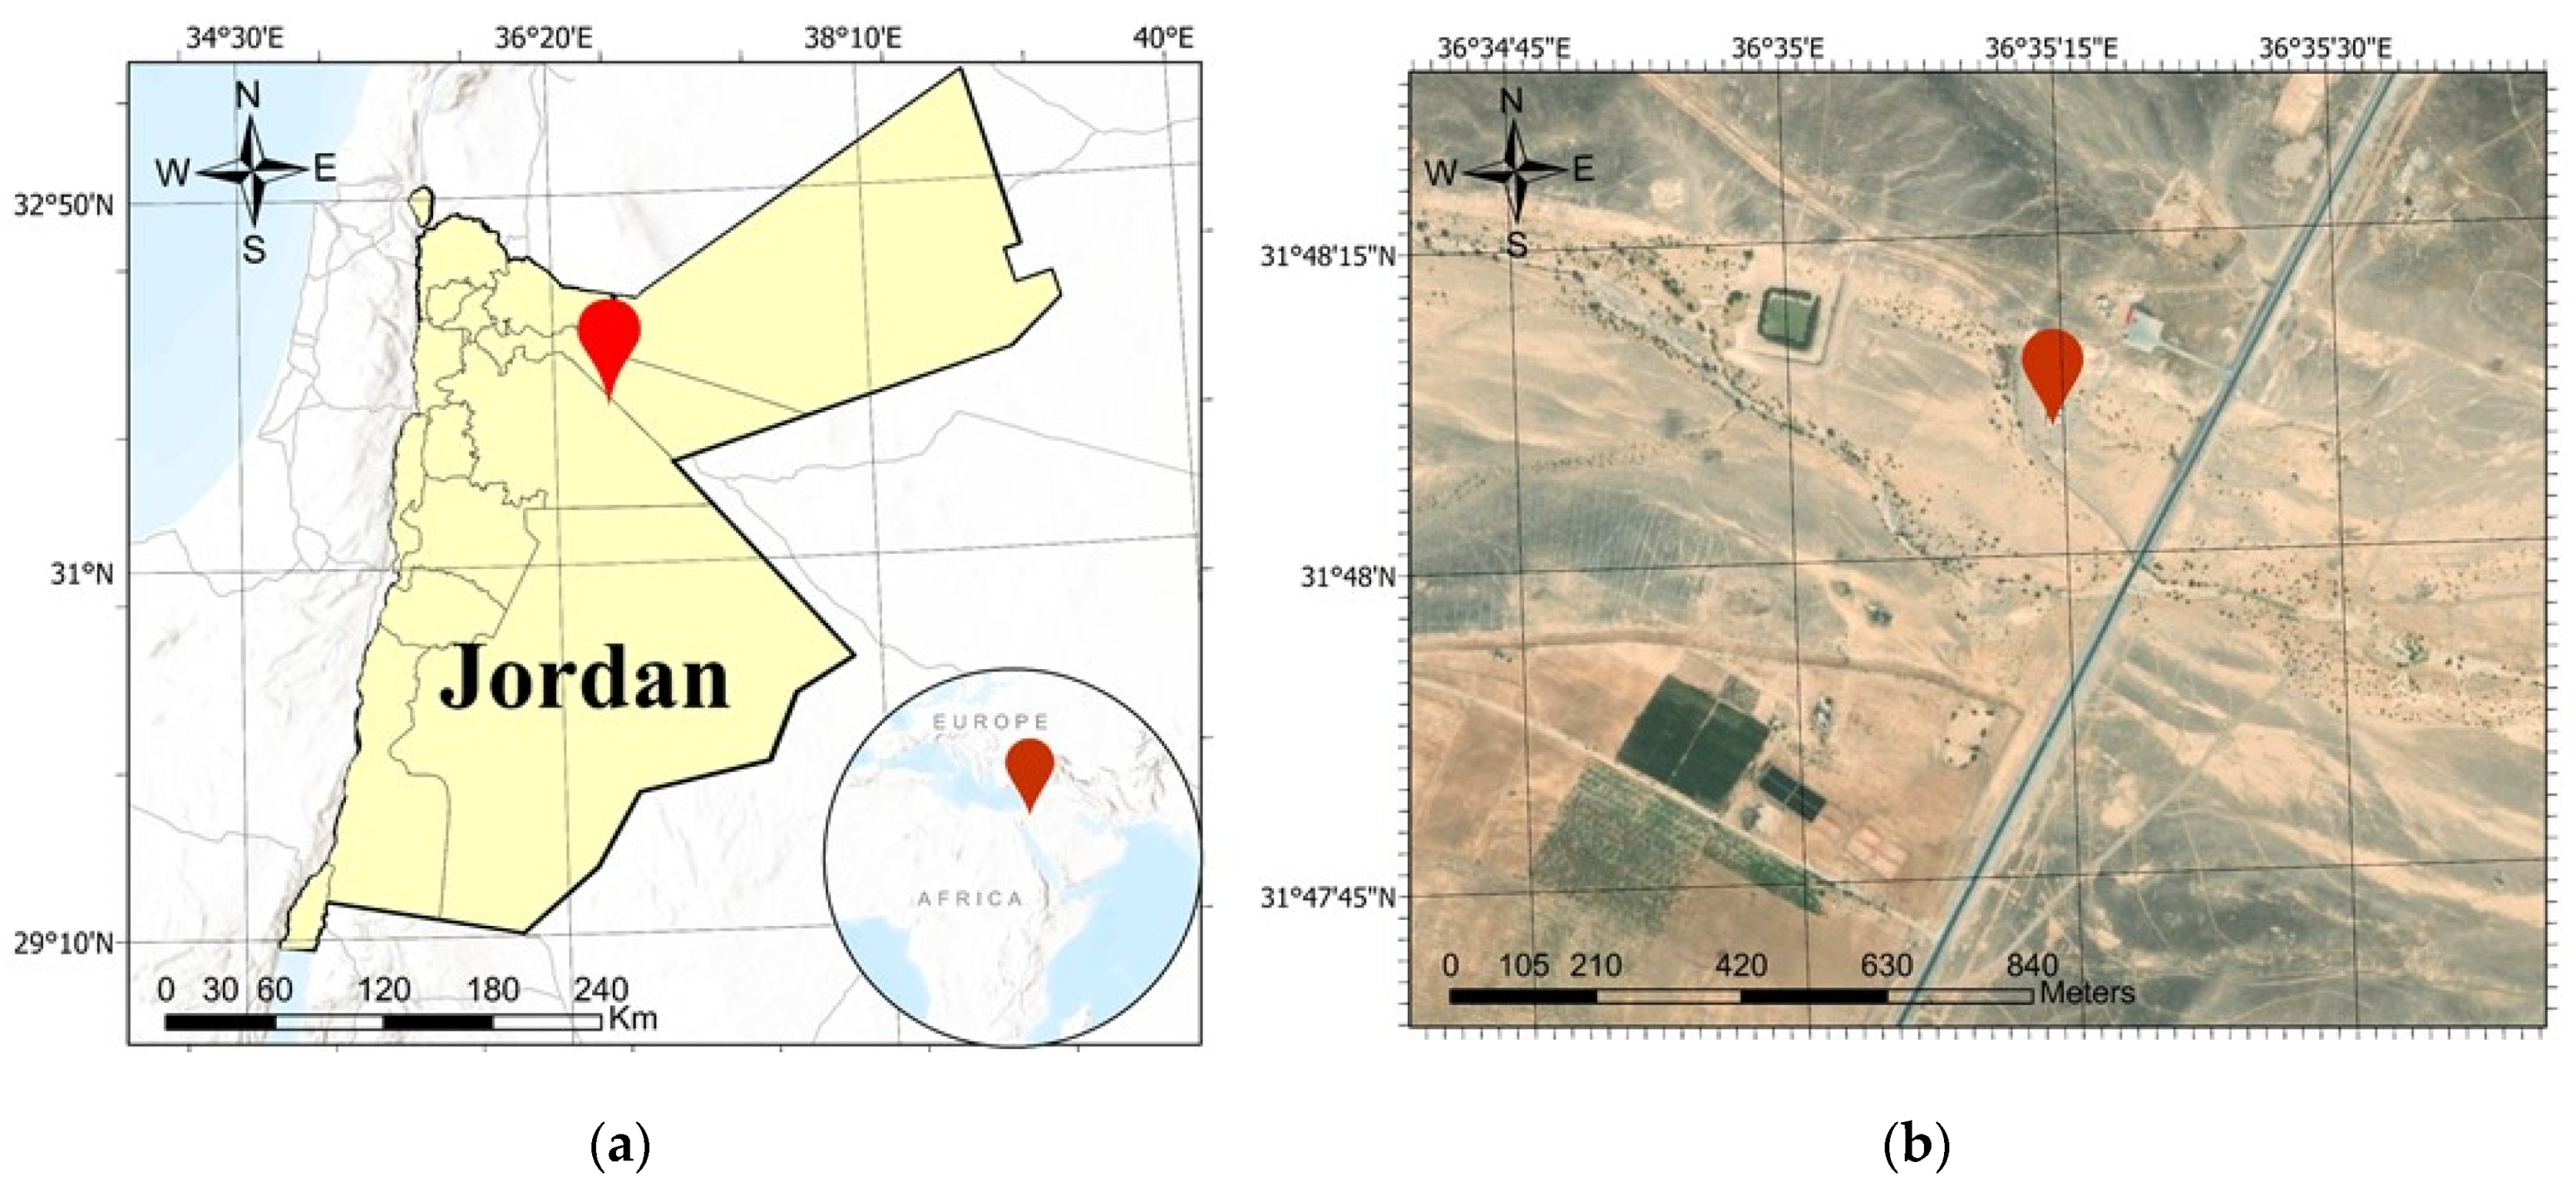
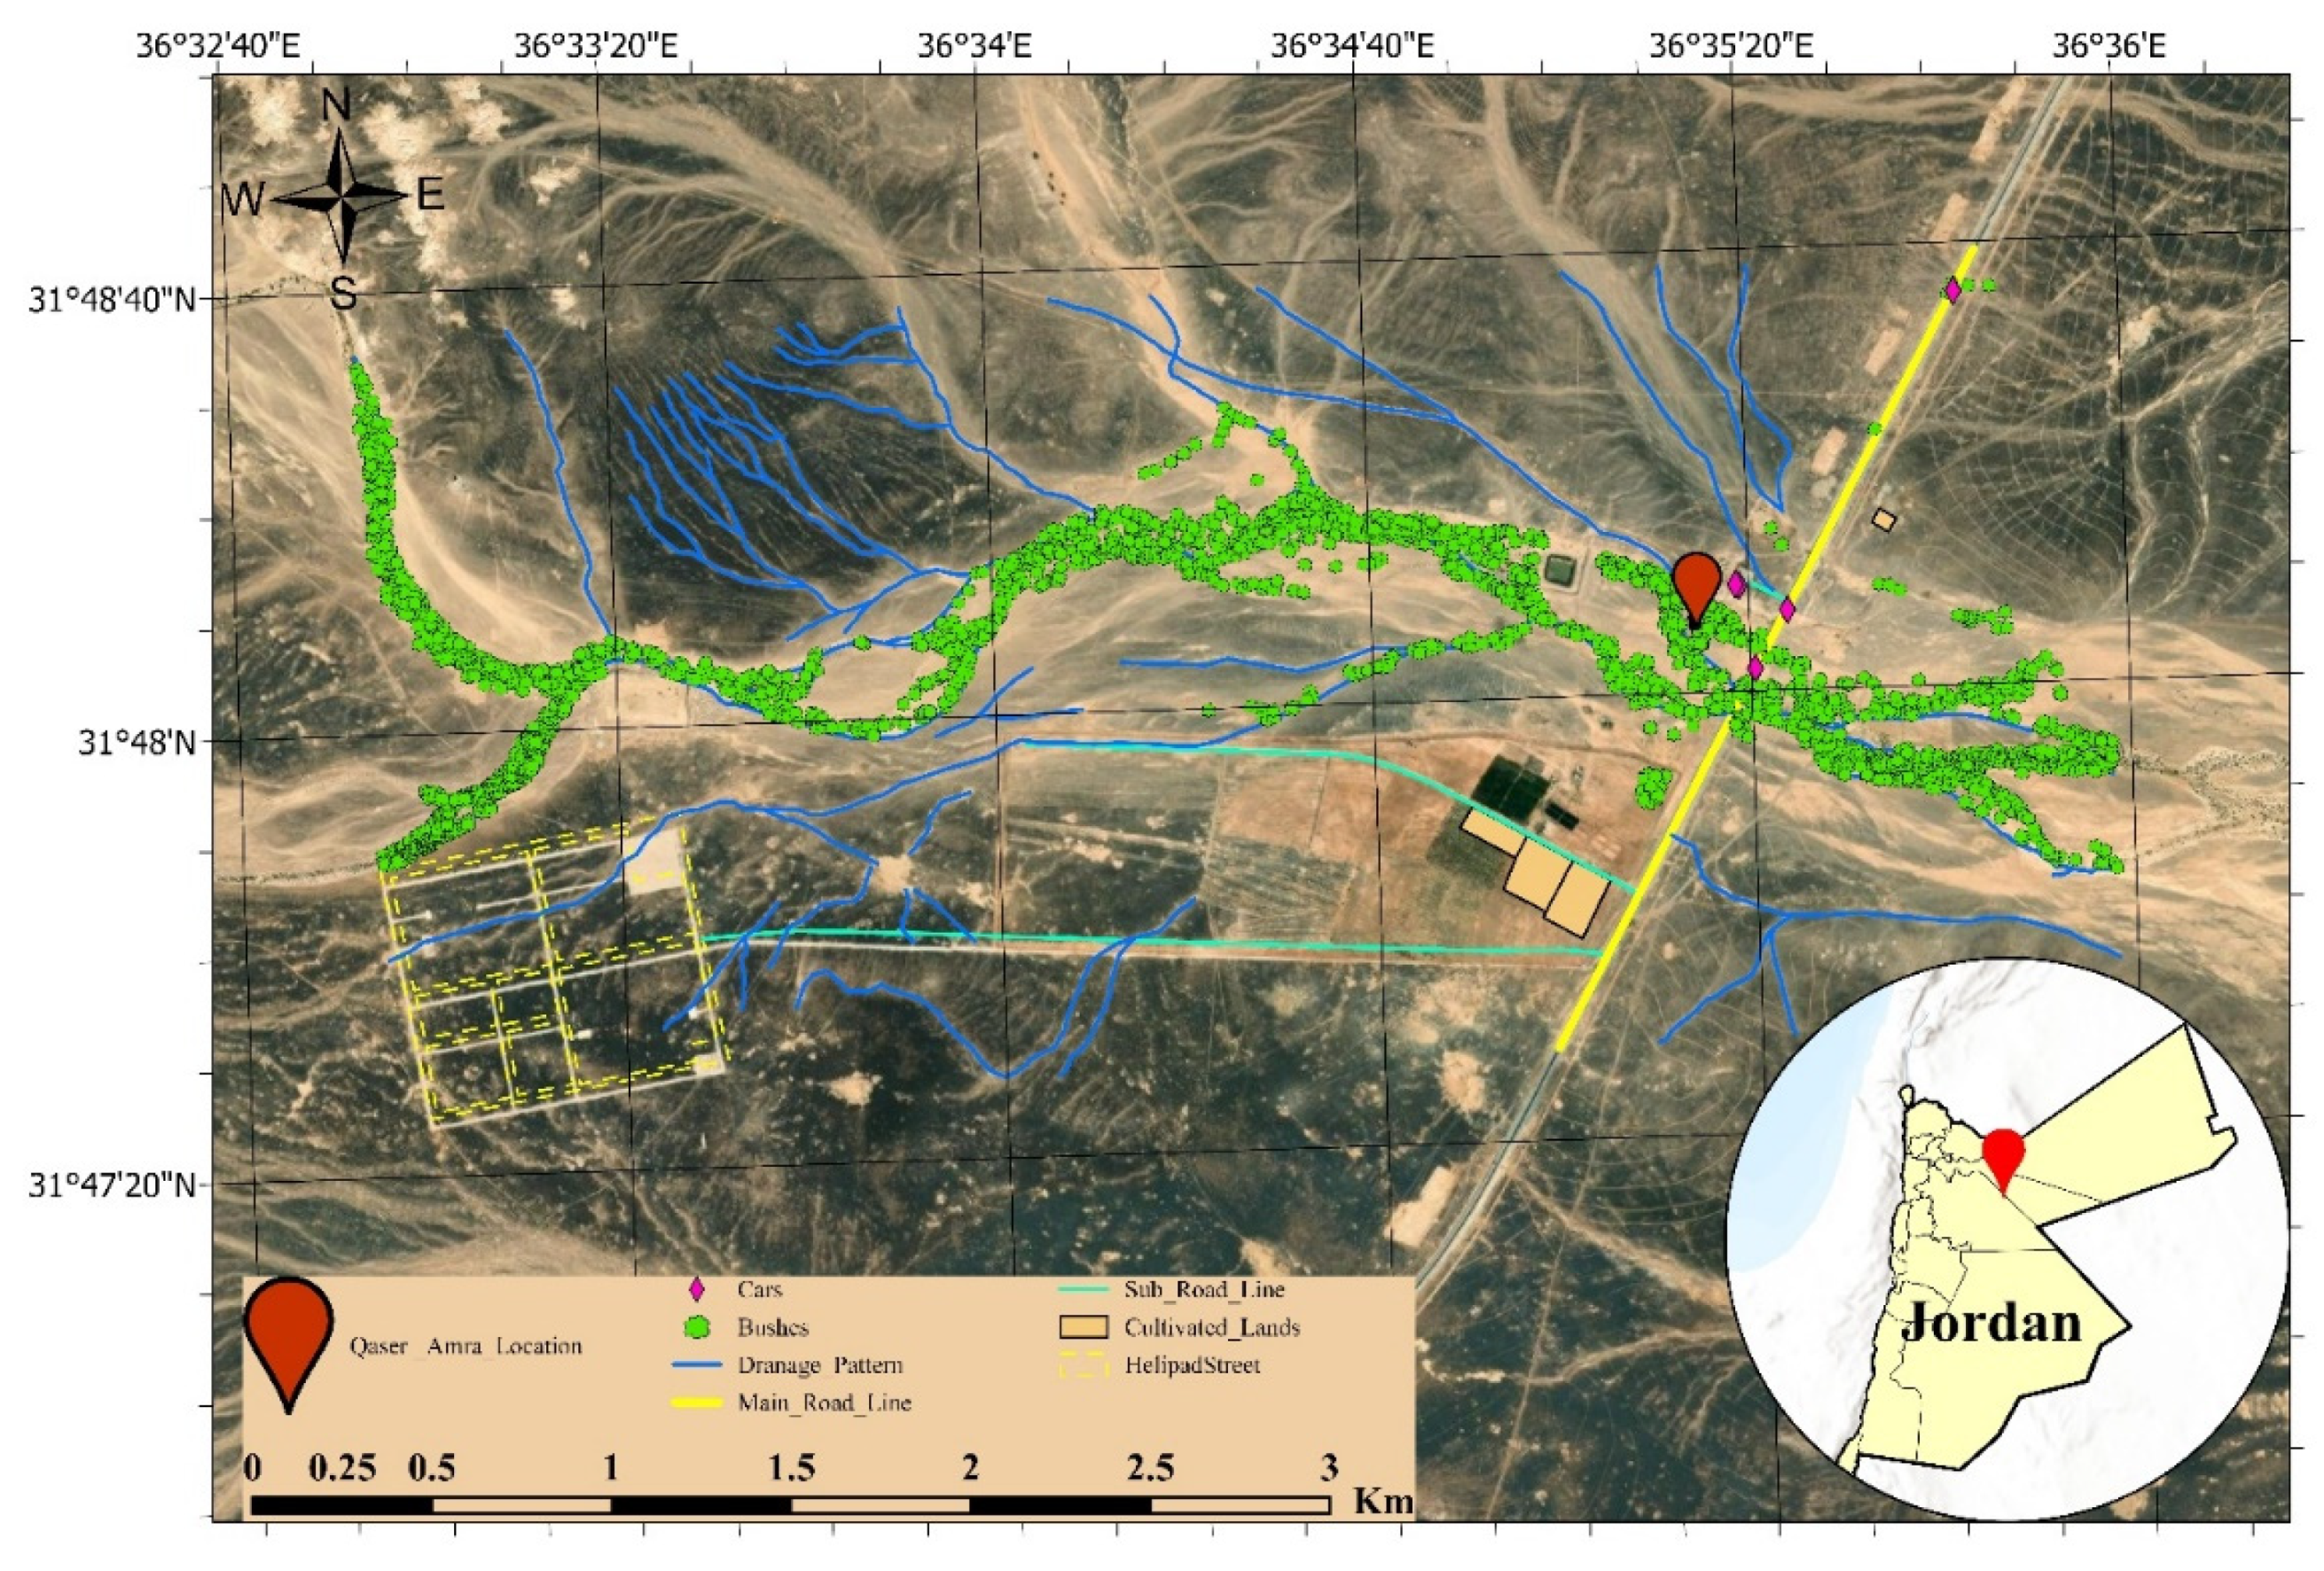
Qaser Amra is a desert castle located in Zarqa Governorate in Jordan built in the early 8th century by the Umayyad caliph Walid Ibn Yazid [
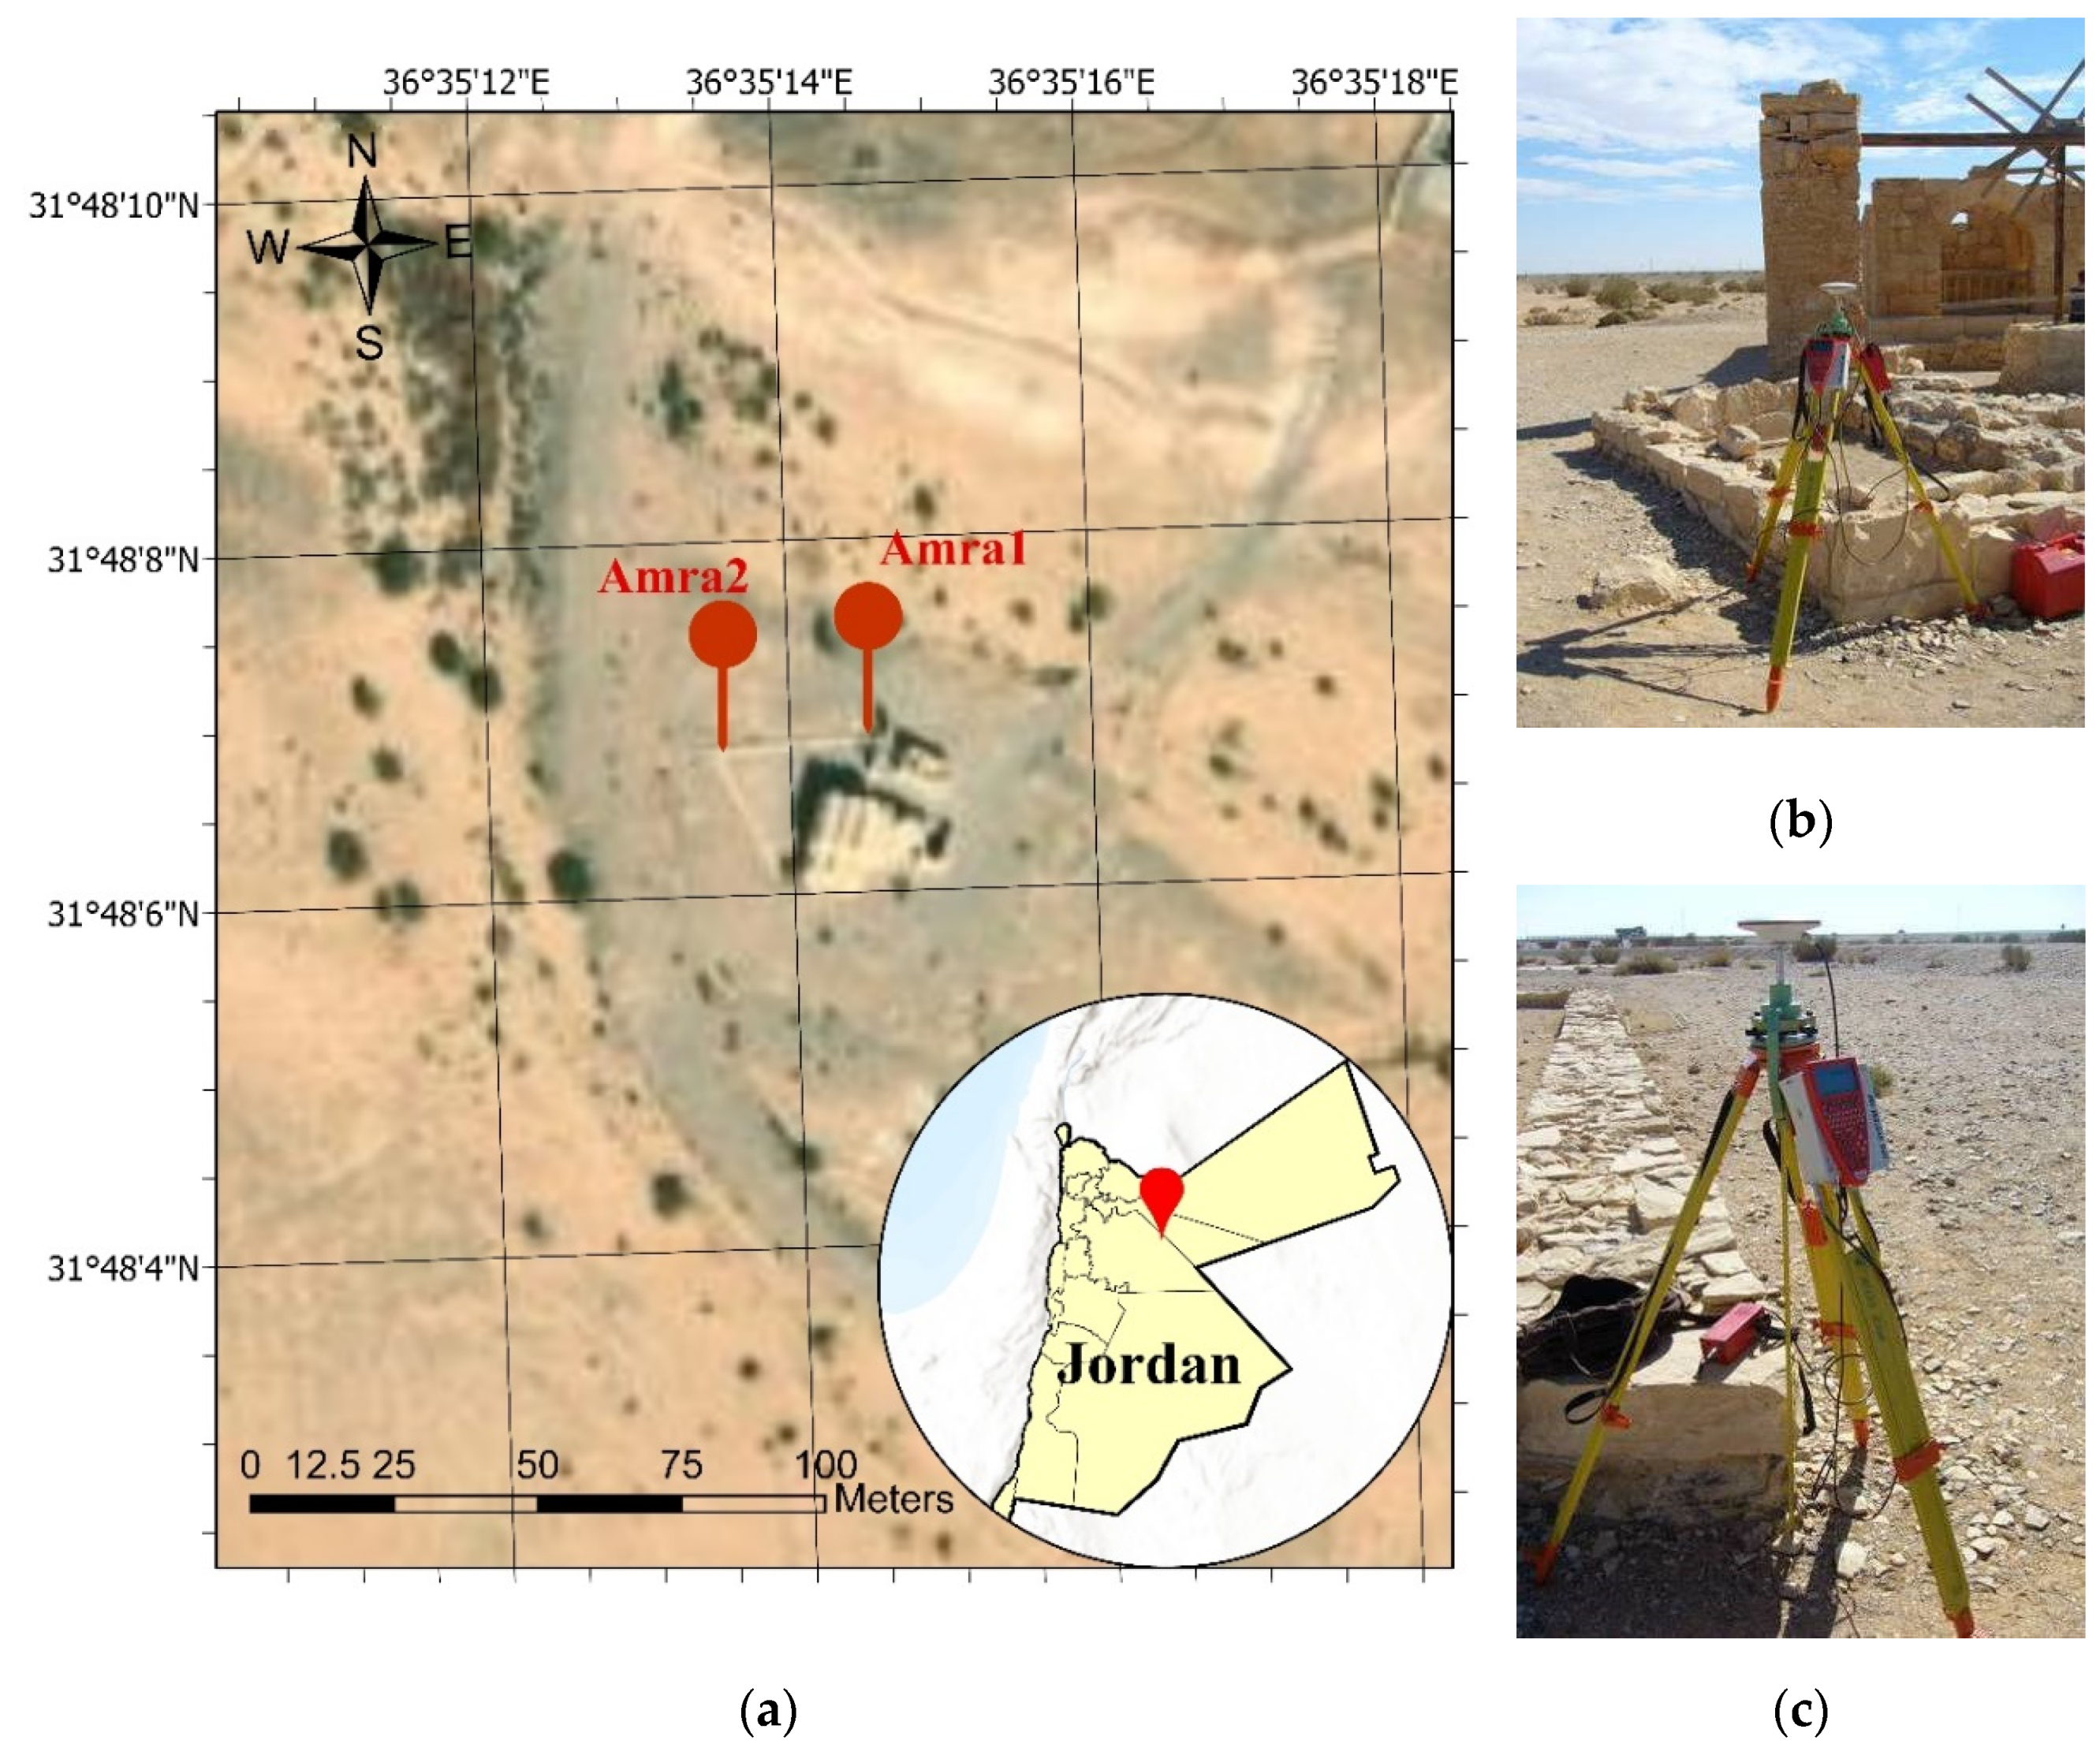
11]. It is located about 85 km east of Amman, at coordinates 31°48’48”N 36°36’08”E and 31.81333°N 36.60222°E, with a height of 520 m, as shown in
Figure 1. Recognized as an important example of early Islamic art and architecture, Qaser Amra is the most well-preserved desert castle from the Umayyad dynasty. Its function during the Umayyad dynasty is unclear. However, some scholars assume that it may have served as a retreat for the Umayyad caliphs, in addition to other functions, such as diplomatic, defensive, recreational, agricultural, and commercial purposes [
11,
12].
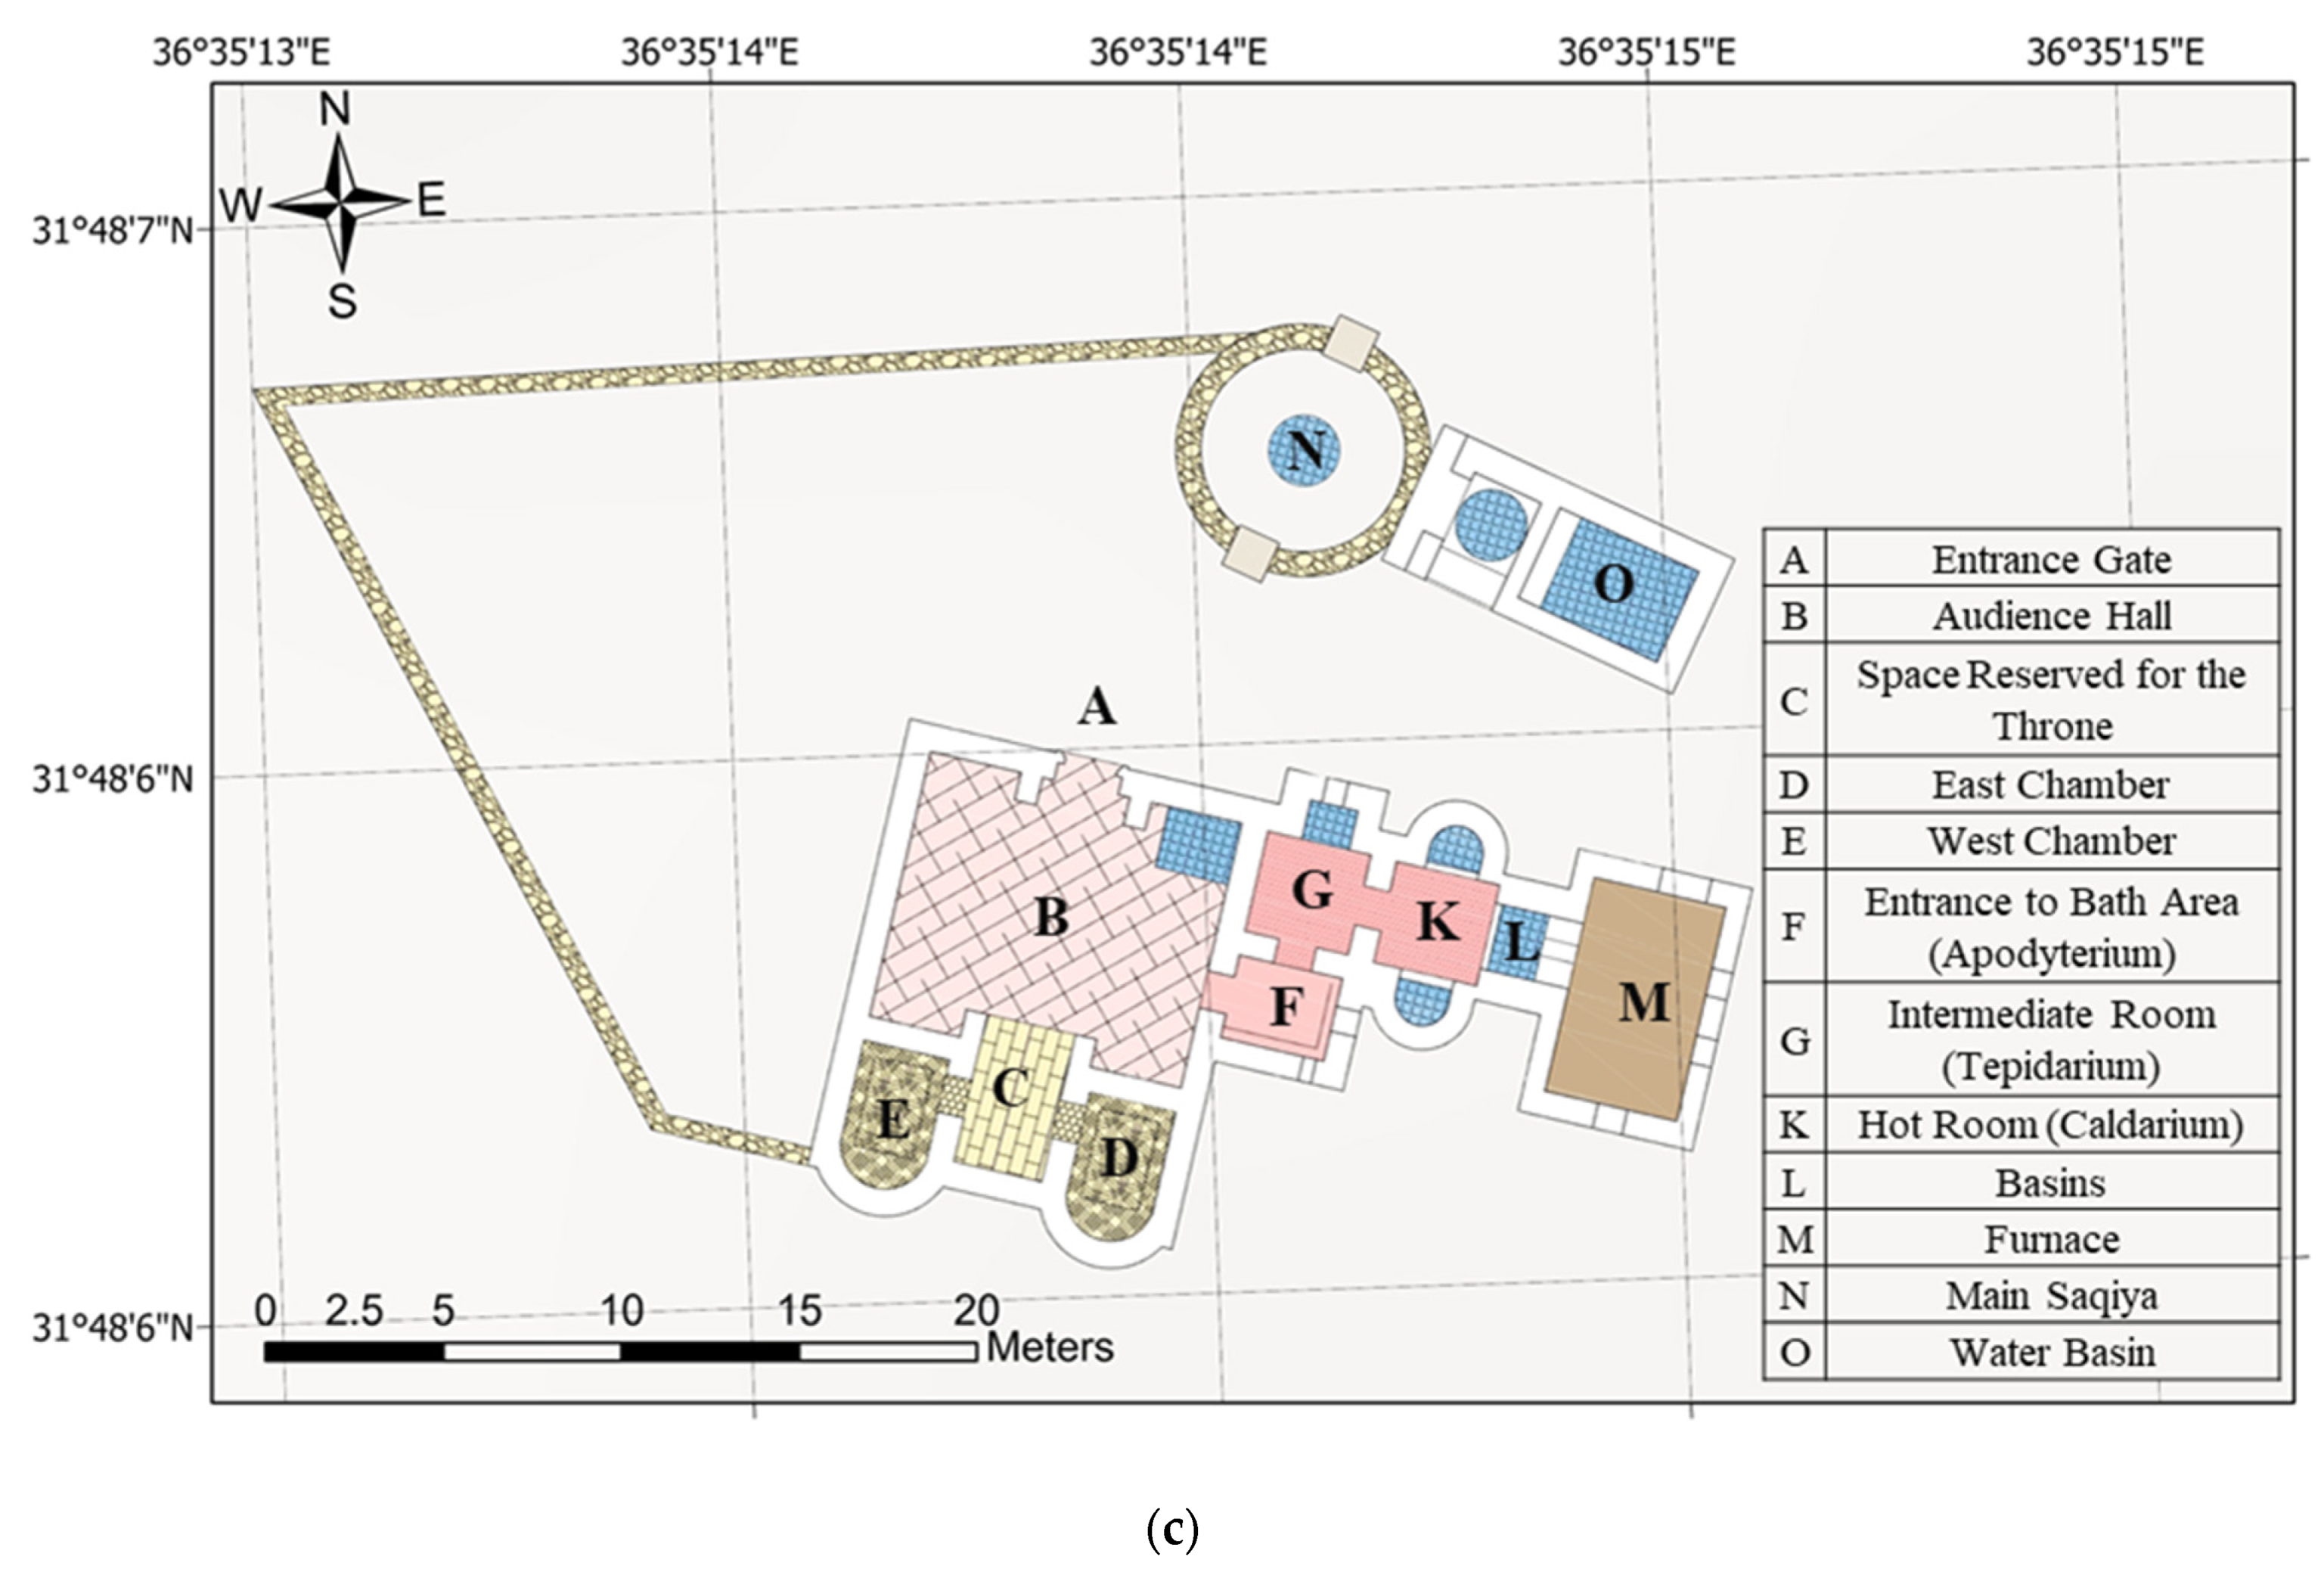
Qaser Amra is a low-rise building that was formerly part of a larger complex consisting of buildings, a mosque, a watchtower, and an actual castle. The only archaeological remains of the other buildings are the foundations [
10,
11]. The complex was once surrounded by a small square fortress that protected the castle. The castle comprises an audience hall, a bath complex, and two hydraulic systems, each roofed by vaulted ceilings resting on transverse arches [
12].
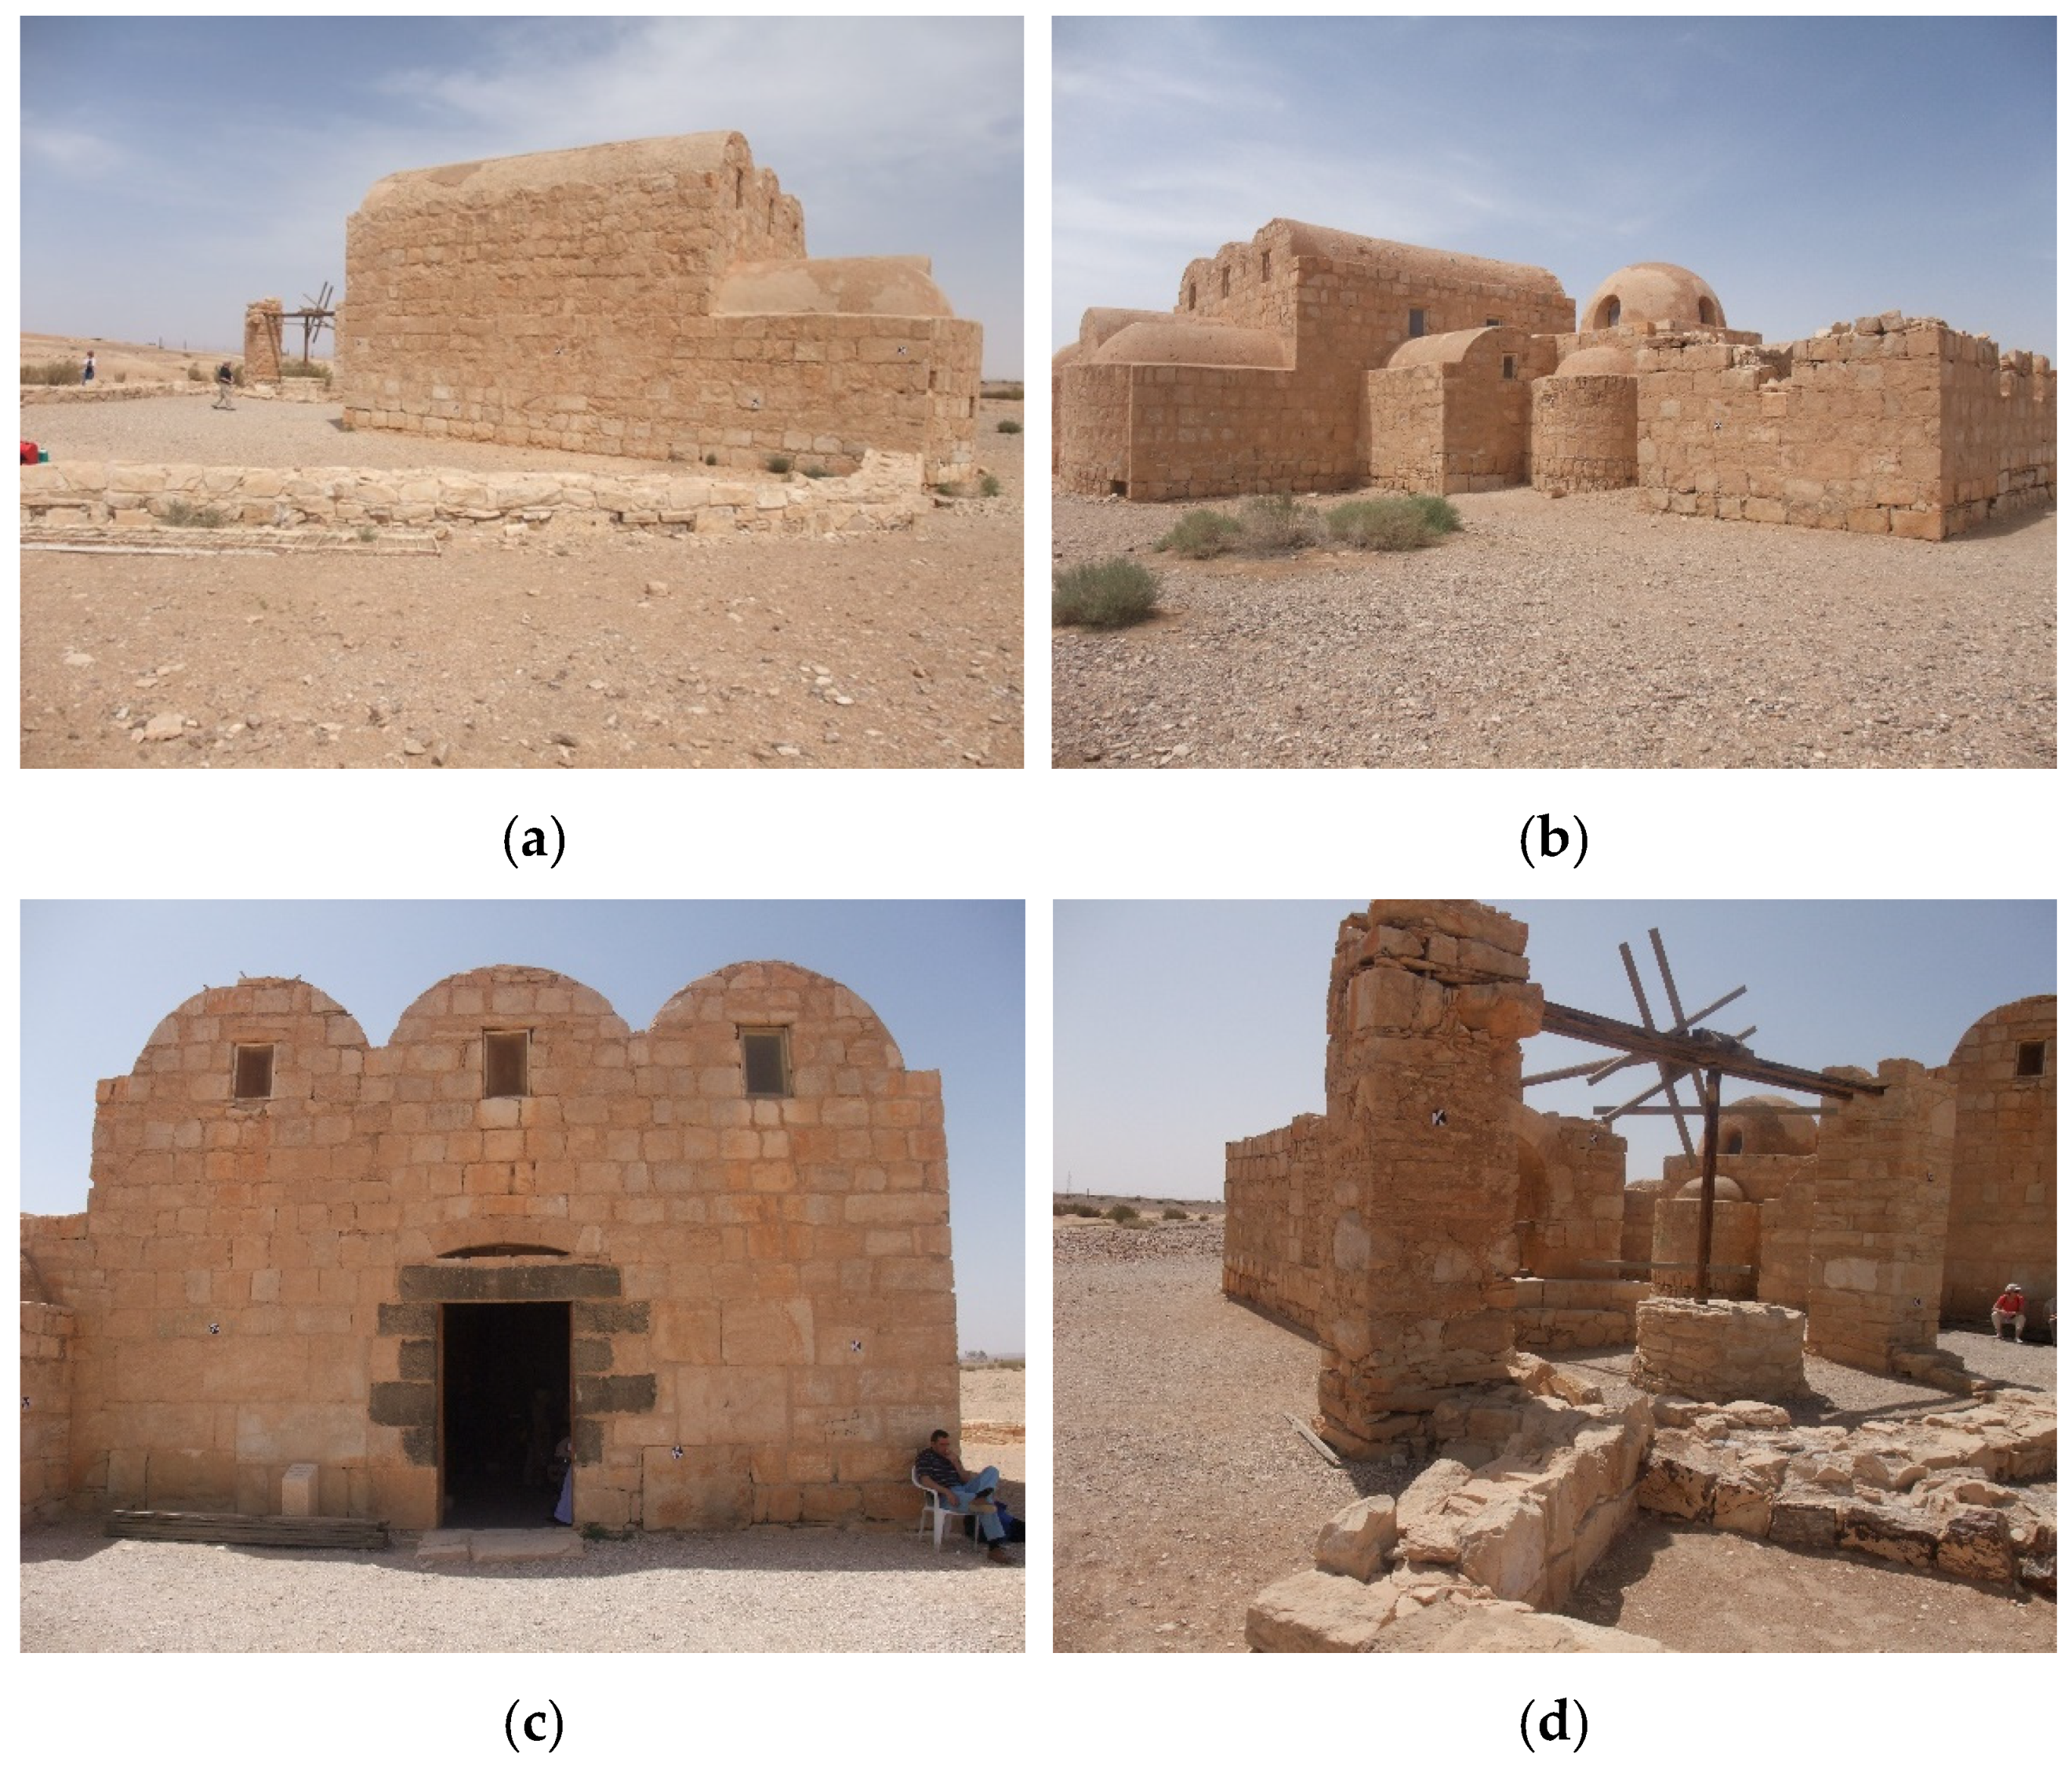
Figure 2 shows the exterior of Qaser Amra from different sides, showing its main elements. The main entrance is located on the northern side and leads to the triple-aisled audience hall, covered by three-barrel vaults, as shown in
Figure 2c. The audience hall leads to the throne room on the southern side, which is connected to two alcoves on the east and west, each roofed by a barrel vault. To the east of the audience hall is the bath complex, which is divided into three rooms. These rooms correspond to the changing room (apodyterium), the warm room (tepidarium), and the hot room (caldarium). The apodyterium is covered by a barrel vault, whereas the tepidarium and caldarium are covered by a cross-vaulted ceiling and a dome, respectively [
11].
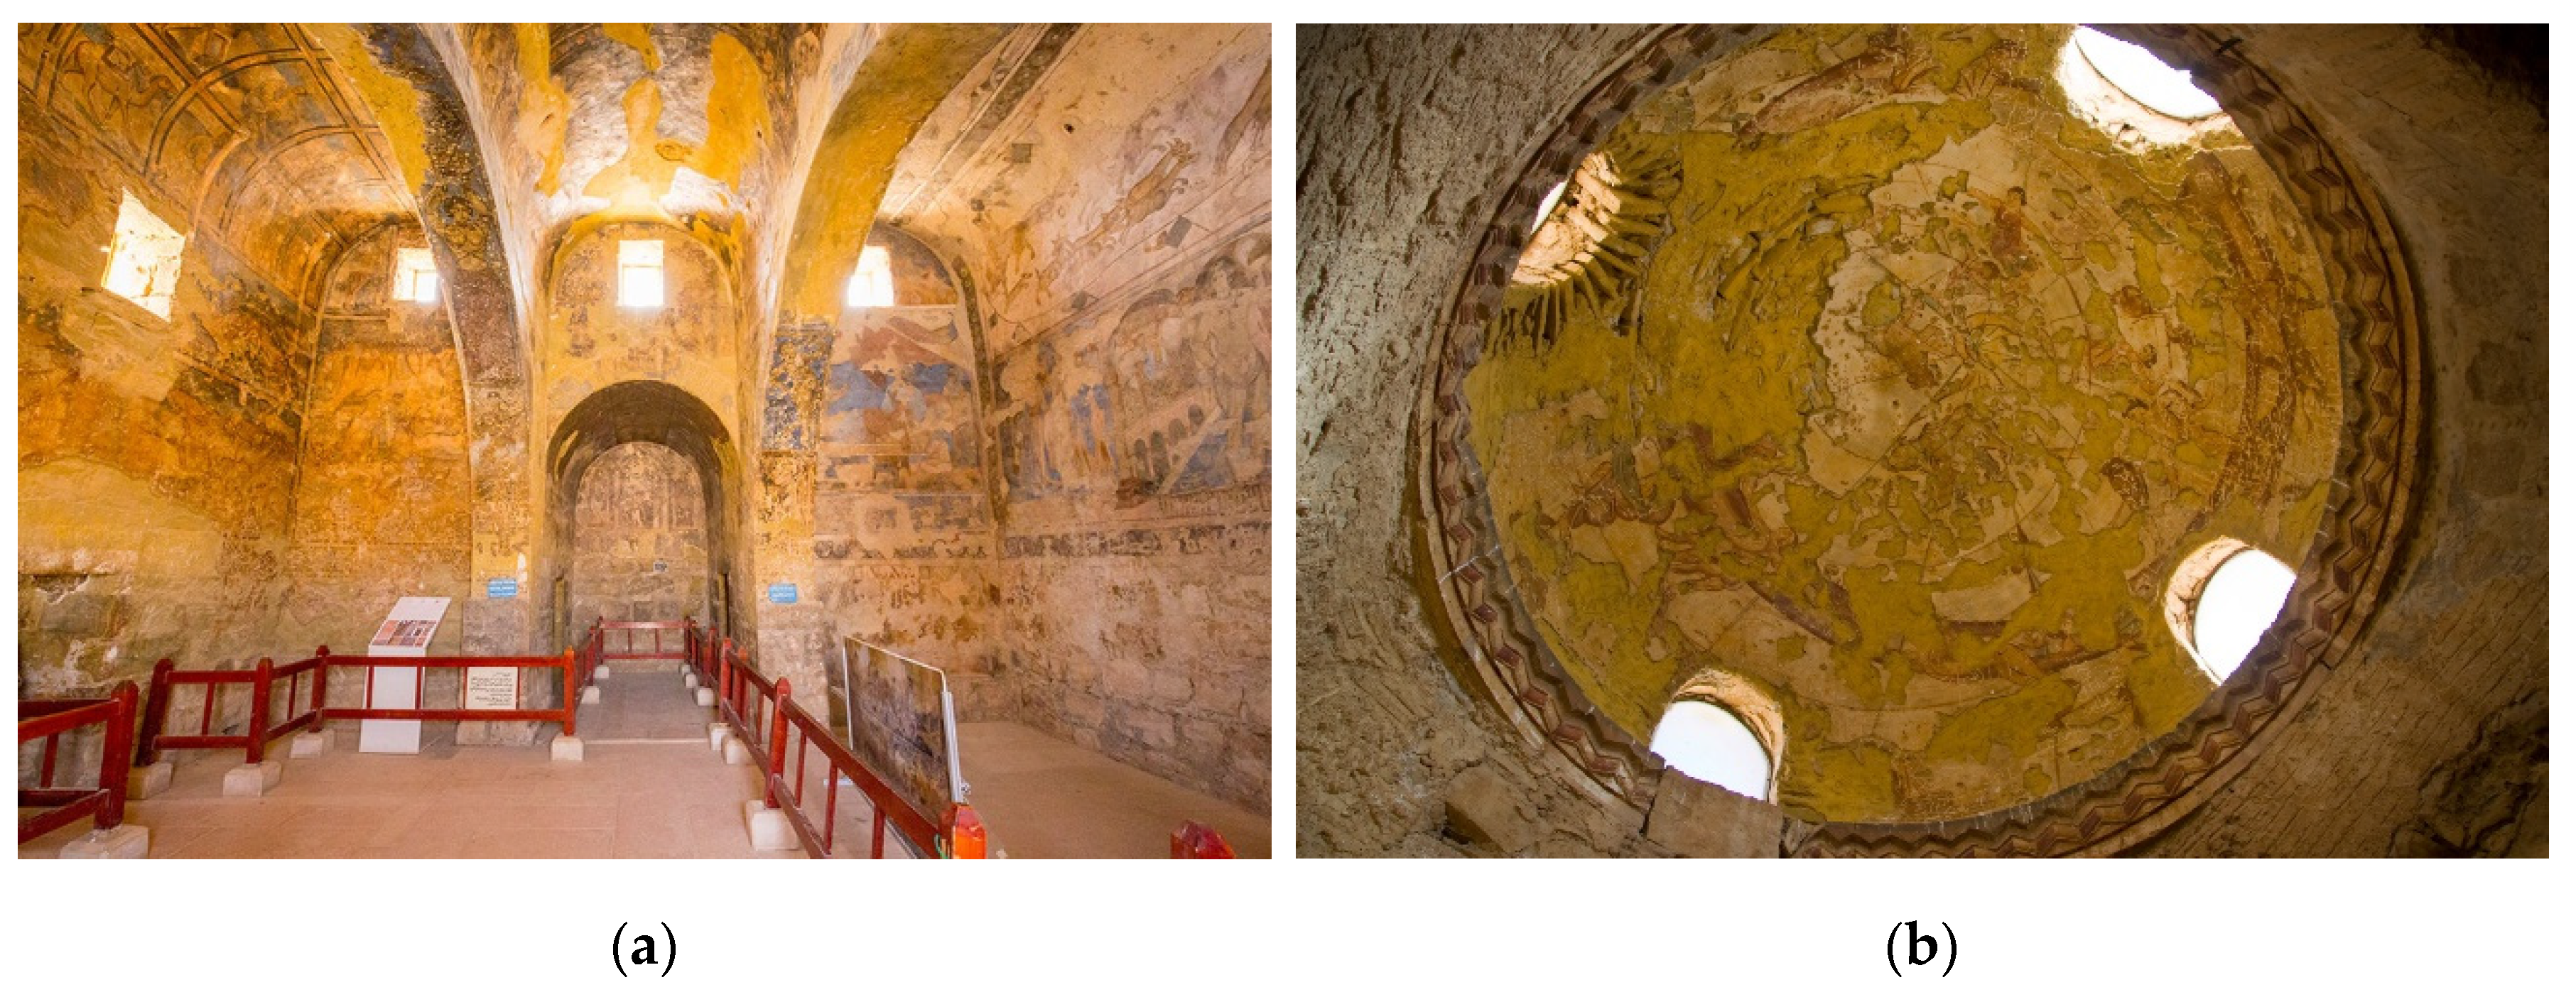
The interior walls and ceilings of Qaser Amra are covered in well-preserved frescoes, as shown in
Figure 3a. The frescoes depict a diverse blend of images and texts, including royal portraits, Byzantine-style hunting scenes, animals, athletic activities, mythological images, pagan figures, and other figures inspired by Greek mythology and Sasanian traditions.
Figure 3b shows the dome of the caldarium painted with zodiac signs and constellations in the northern sky. Qaser Amra is most notable for its exquisite frescoes, particularly those decorating the bath complex, attracting many tourists and scholars. Due to the uniqueness of these paintings and their exceptional testimony to the Umayyad civilization, Qaser Amra was inscribed as a World Heritage Site in 1985 [
10,
11,
31].
Since the 1950s, Qaser Amra has undergone a few conservation works conducted by different organizations. In the 1950s and 1960s, the Department of Antiquities (DoA) in Jordan worked on patching the gaps in the outer walls. The National Archaeological Museum of Spain (MAN) carried out a major, comprehensive conservation project in the early 1970s. The project focused on protecting the paintings, redrawing the figures’ outlines, consolidating the western wall, and surveying the site. The MAN and the University of Granada undertook additional interventions on the paintings in 1979 and 1996 to counteract the deterioration process. Between 1989 and 1996, the DoA and the French Institute of Archaeology for the Near East (IFAPO) collaborated to document and reproduce all of the paintings in Qaser Amra, consolidate the spur wall, and pave the main building. During the same period until 1999, the DOA, the IFAPO, the French Embassy, and UNESCO enhanced accessibility and site presentation. Additionally, they designed and constructed a new visitor center in 1999. Recently, a collaboration between the World Monuments Fund (WMF), the Italian Institute for Conservation and Restoration (ISCR), and the DoA was formed to restore the main building, its decorative features, and the western aisle. The joint project was initiated in 2010 to ensure the long-term conservation of Qaser Amra and develop a sustainable site management plan for the site [
11,
32].
2. Materials and Methods
This section describes the main phases of the proposed methodology for archaeological site information modeling. The developed method was designed according to the 3D GIS modeling approach to generate and visualize 3D site information and terrain details, including maps, satellite images, orthophotos, DEMs, and 3D landscapes.
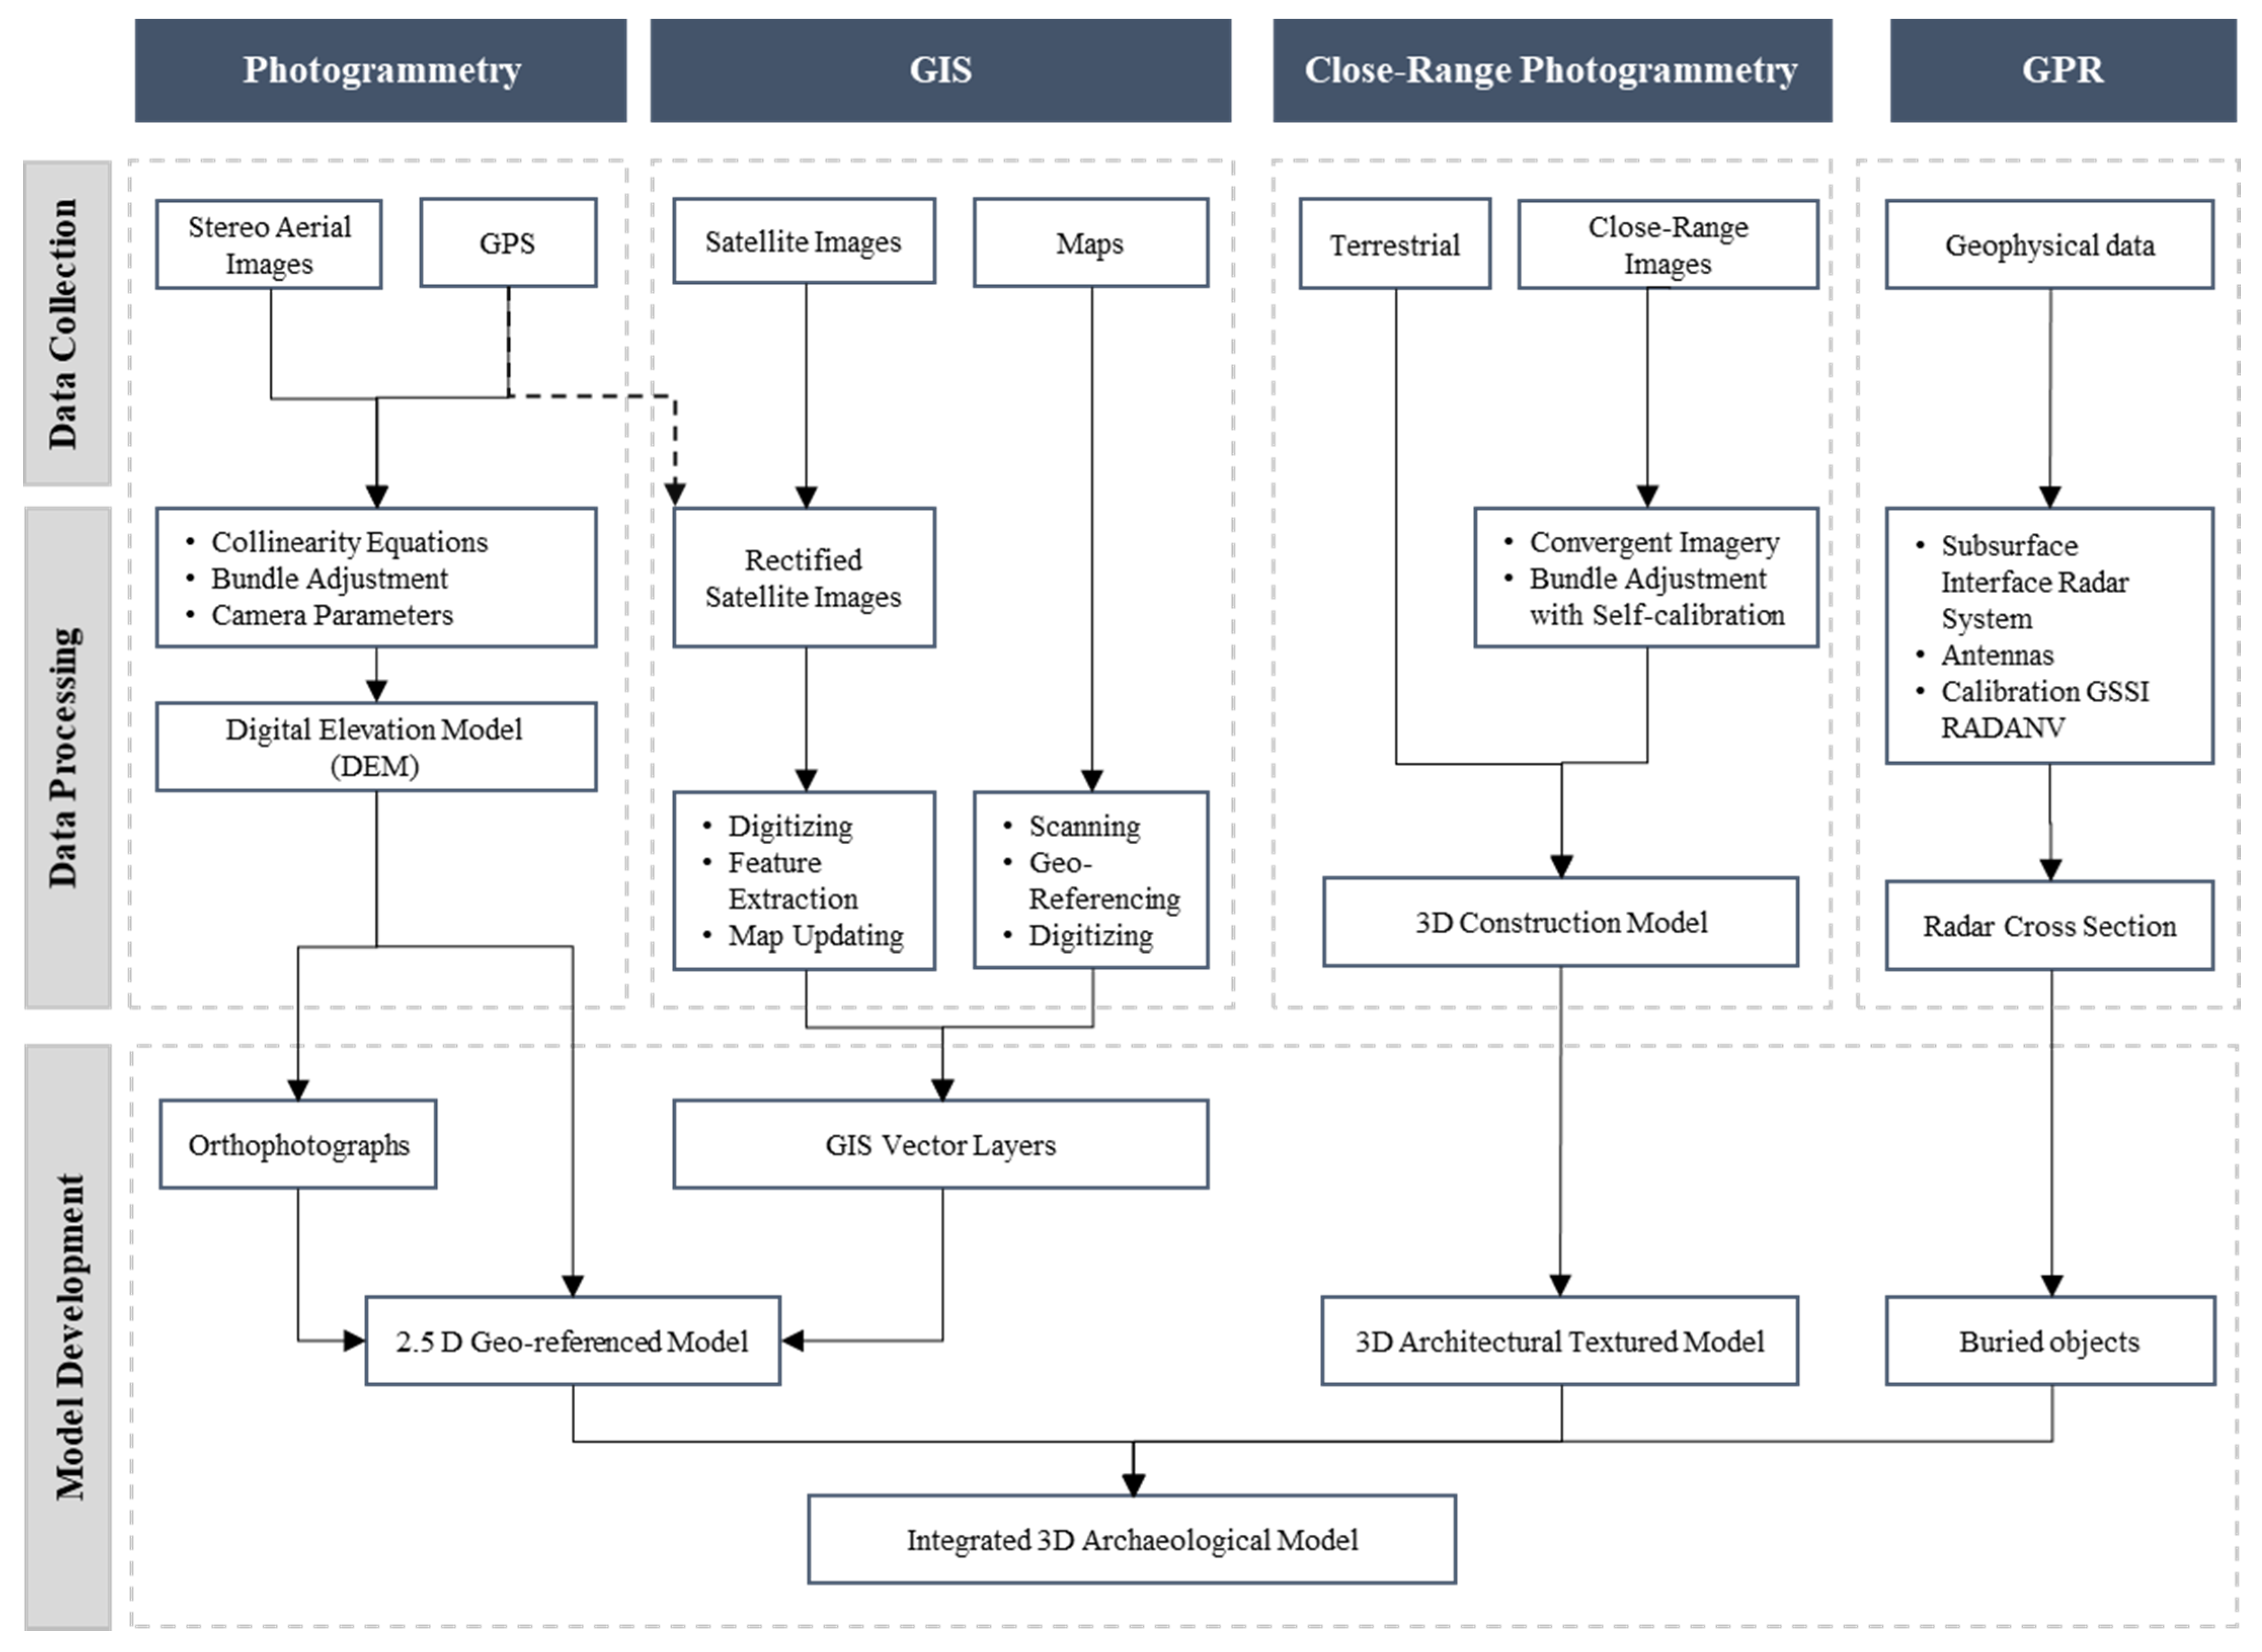
Figure 4 illustrates the four main phases of the proposed methodology: (1) Photogrammetric analysis to generate a DEM and orthophoto of Qaser Amra using aerial photos and GPS. The analysis also includes overlaying GIS layers consisting of roads, buildings, trees, and other archaeological layers to form a base map that provides necessary spatial and non-spatial information for documenting the site. (2) GIS mapping using satellite images, maps, and GPS data. The processing entails scanning, geo-referencing, designing layers, digitizing, and developing site maps and 3D models. The result of the integration between the first two phases is a 2.5D geo-referenced map. (3) Close-range photogrammetry processing to produce a 3D model of the study area with the actual representation of feature shapes, texture, and geometry. (4) GPR profiling using geospatial databases that include photogrammetric information and geospatial layers (exact site location, transportation layer, DEM, orthophotos, boundary maps, and geological information) to capture buried objects. Finally, the produced models from each phase are integrated to generate a comprehensive 3D archaeological model. The following section discusses each process individually in detail.
3. Results and Discussion
The following section includes a detailed discussion of the proposed methodology used to generate and visualize the 3D site information and terrain details, including maps, satellite images, orthophotos, DEMs, and 3D landscapes. The proposed methodology consists of four main phases, which are: (1) photogrammetry, (2) geographic information systems, (3) close-range photogrammetry, and (4) ground-penetrating radar.
3.1. Photogrammetry
The emergence of digital photogrammetry techniques and image processing has rapidly increased the utilization of photogrammetry on world archaeological sites [
33]. Moreover, digital photogrammetry has significantly improved the identification of building materials, form, and spatial distribution and reduced the amount of time to complete a task often considered challenging [
34]. This research used photogrammetry analysis to generate a 3D geospatial archaeological database (DEM map and orthophoto) of Qaser Amra.
3.1.1. Stereo Aerial Images
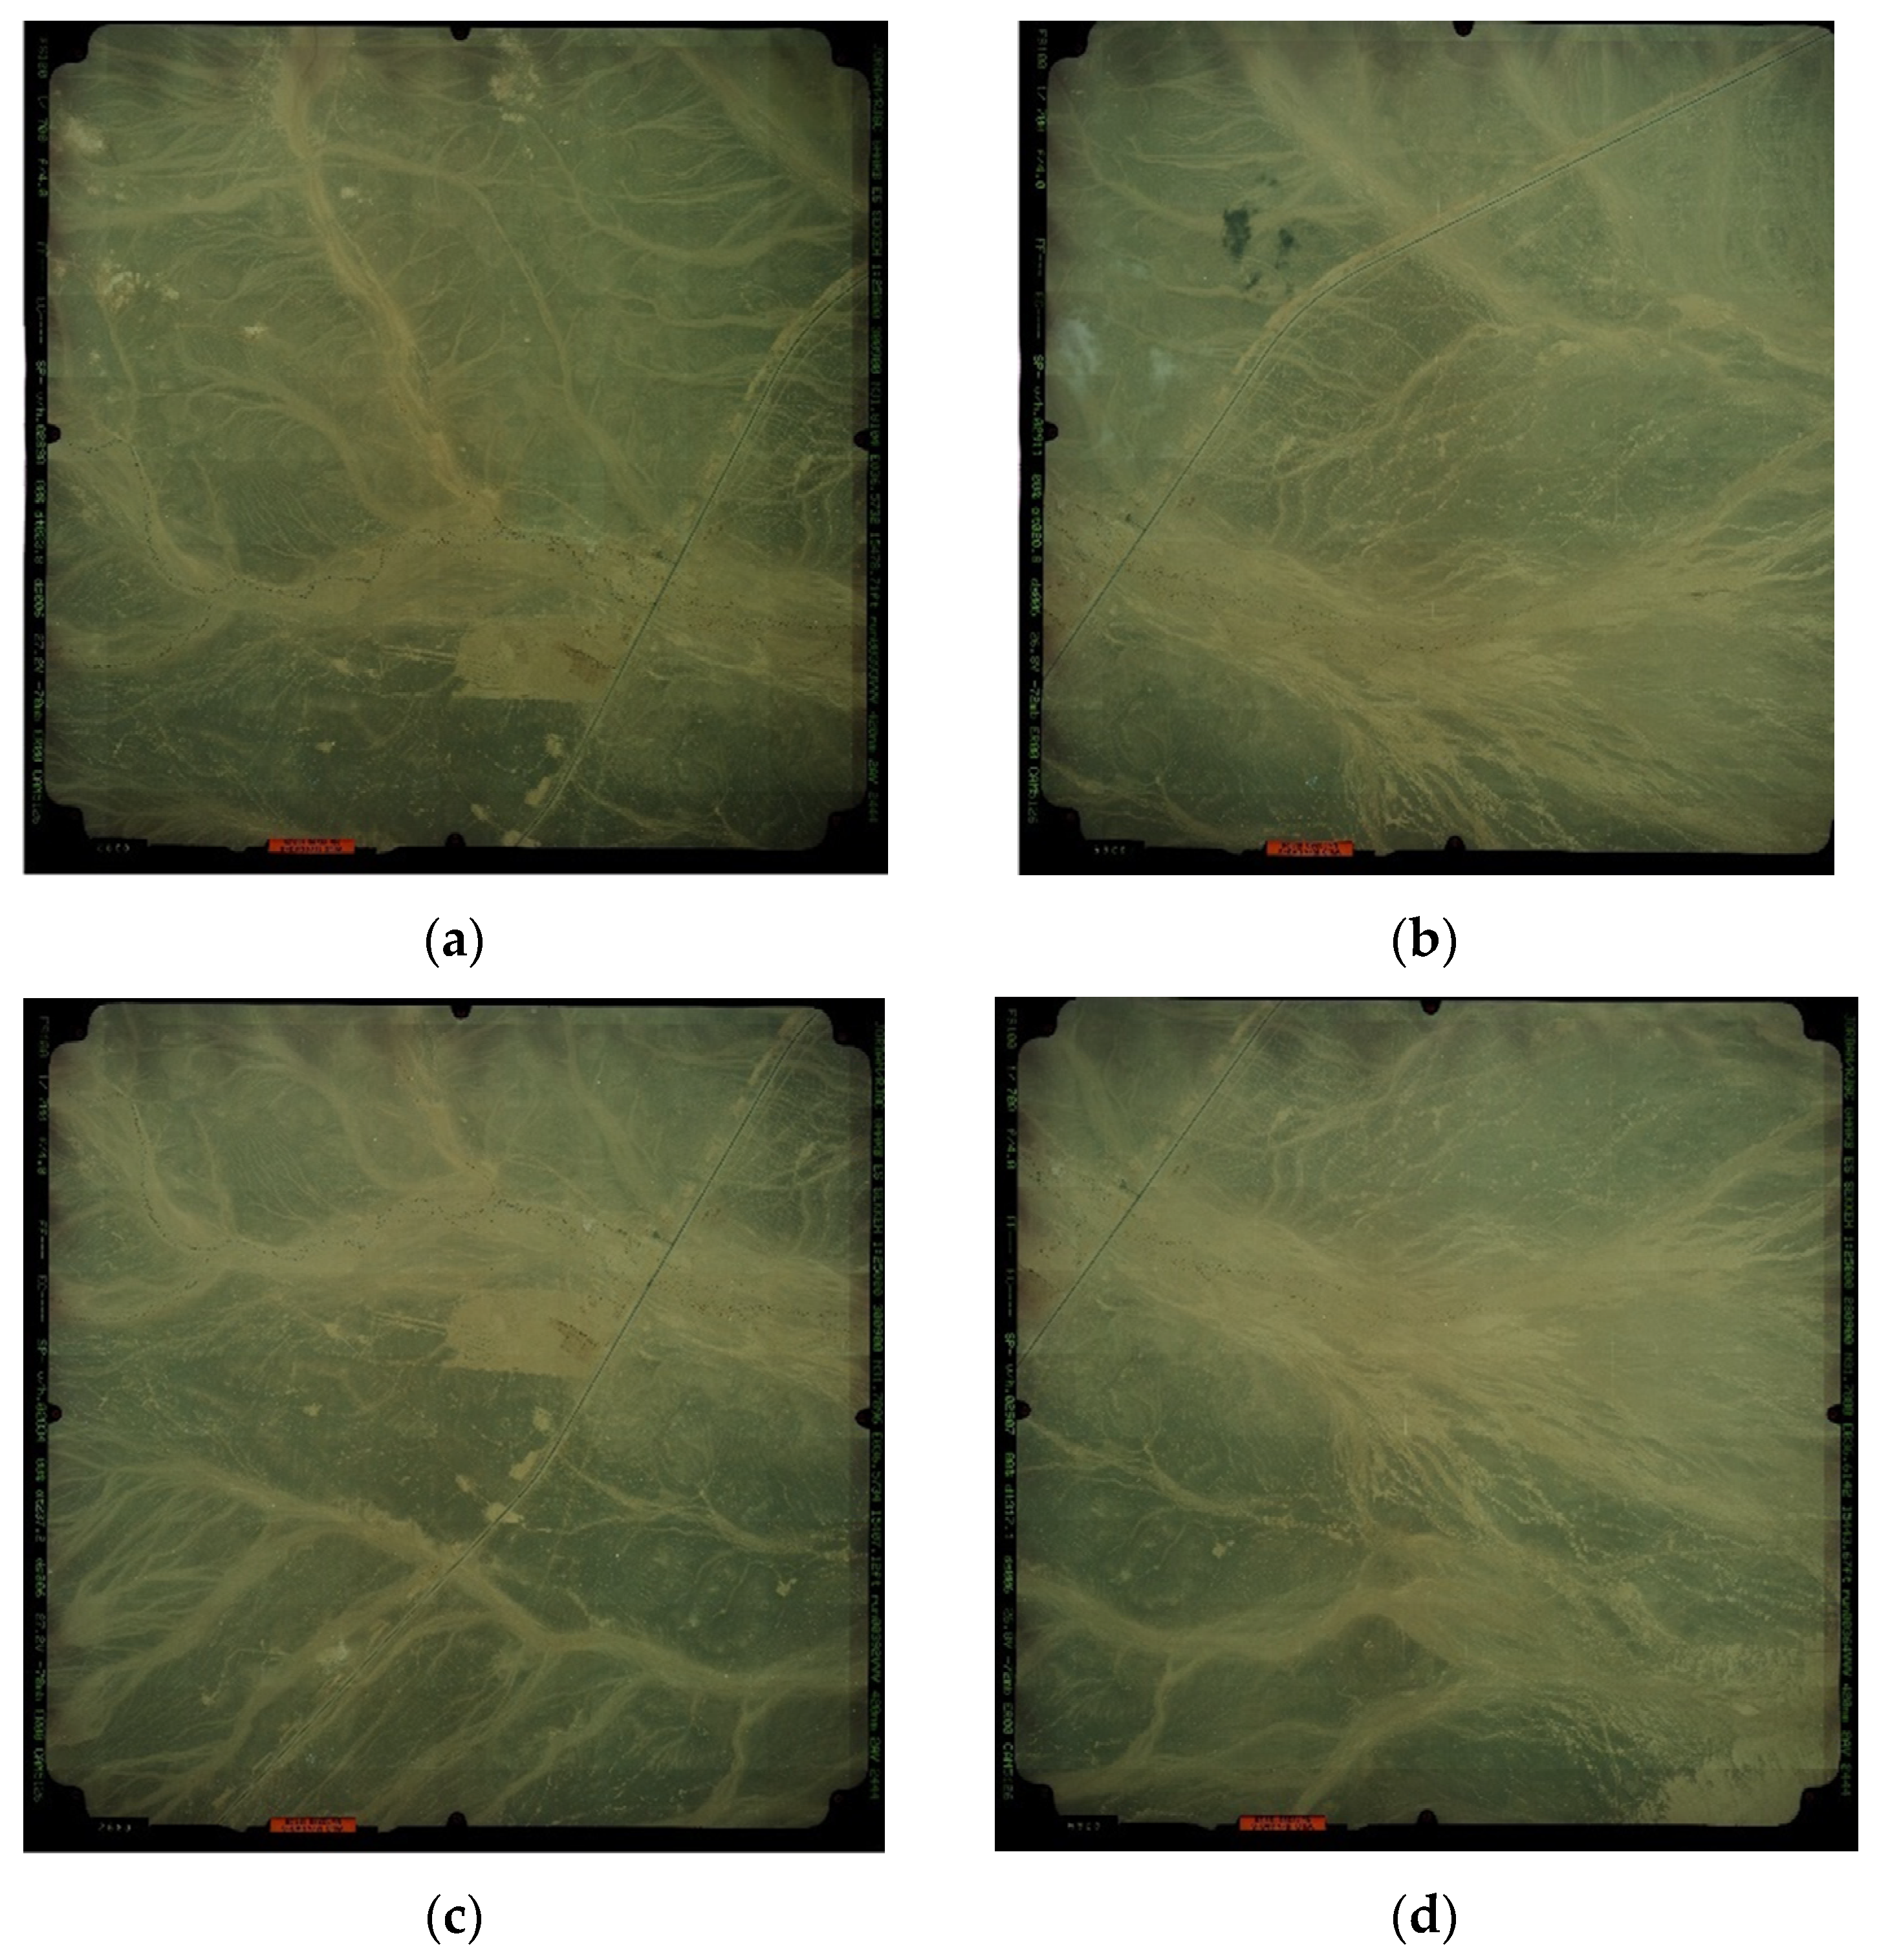
A sample of the aerial images of Qaser Amra with a scale of 1:25,000 is presented in
Figure 5. The images were captured using the RC8 aerial camera with a 228.60 mm format and 152.98 mm focal length, resulting in overlap and a side lap of 60% and 30%, respectively. Four main high-resolution satellite images were used to extract the ground coordinates of tie points and generate the orthophotos and DEMs. Lastly, samples of terrestrial or close-range images of Qaser Amra were taken from various angles. Moreover, Spot Images were provided by Google Earth with a 2.5 m resolution taken from the SPOT 5 satellite. In addition, several high-resolution satellite images were taken from Landsat-8. Due to the very low quality of the aerial images, more information was extracted from the satellite images, such as drainage and helipad.
3.1.2. Global Positioning Systems
Due to its location in a desert area, the survey works for Qaser Amra faced great difficulties. Another challenge was the poor quality of the aerial images, making it difficult to find and identify visible points in the field and on the images. The instruments used in this survey were Leica GPS530 dual-frequency receivers operating in static, rapid static, and stop–and–go GPS modes with two simultaneous observation reference stations. Another survey session was performed with a total electronic station, during which a large number of points located on the site and the castle’s façade was observed. The main aims of terrestrial GPS surveys of the archaeological site were: (1) To establish reference station points to monitor the quality of the generated orthophotos and DEM; (2) To provide the ground control points (GCPs) required to process the aerial images and rectified satellite images; (3) To produce control and validation points used to process close-range photogrammetry. All the GPS surveys of the GCPs were performed in the static mode with sessions lasting between 10 min and half an hour. Checkpoints collected with GPS were observed in the stop–and–go mode usually with two static reference receivers. The precision of the stop–and–go GPS survey was about 10 mm+1 ppm for post-processed carrier-phase observations.
Two reference stations, named Amra1 and Amra2 stations, were located on the corners of the castle’s low stone wall in front of its entrance, as shown in
Figure 6. Amra1 is located on the east side (
Figure 6a), whereas Amra2 is located on the west side (
Figure 6b). The coordinates of Amra2 were obtained using the Online Positioning User Service (OPUS) of the National Geodetic Survey (US). Point Amra1 was computed as a rover from Amra2 using approximately 2.5 h of observations. This solution was used as a reference for all of the other photo control points.
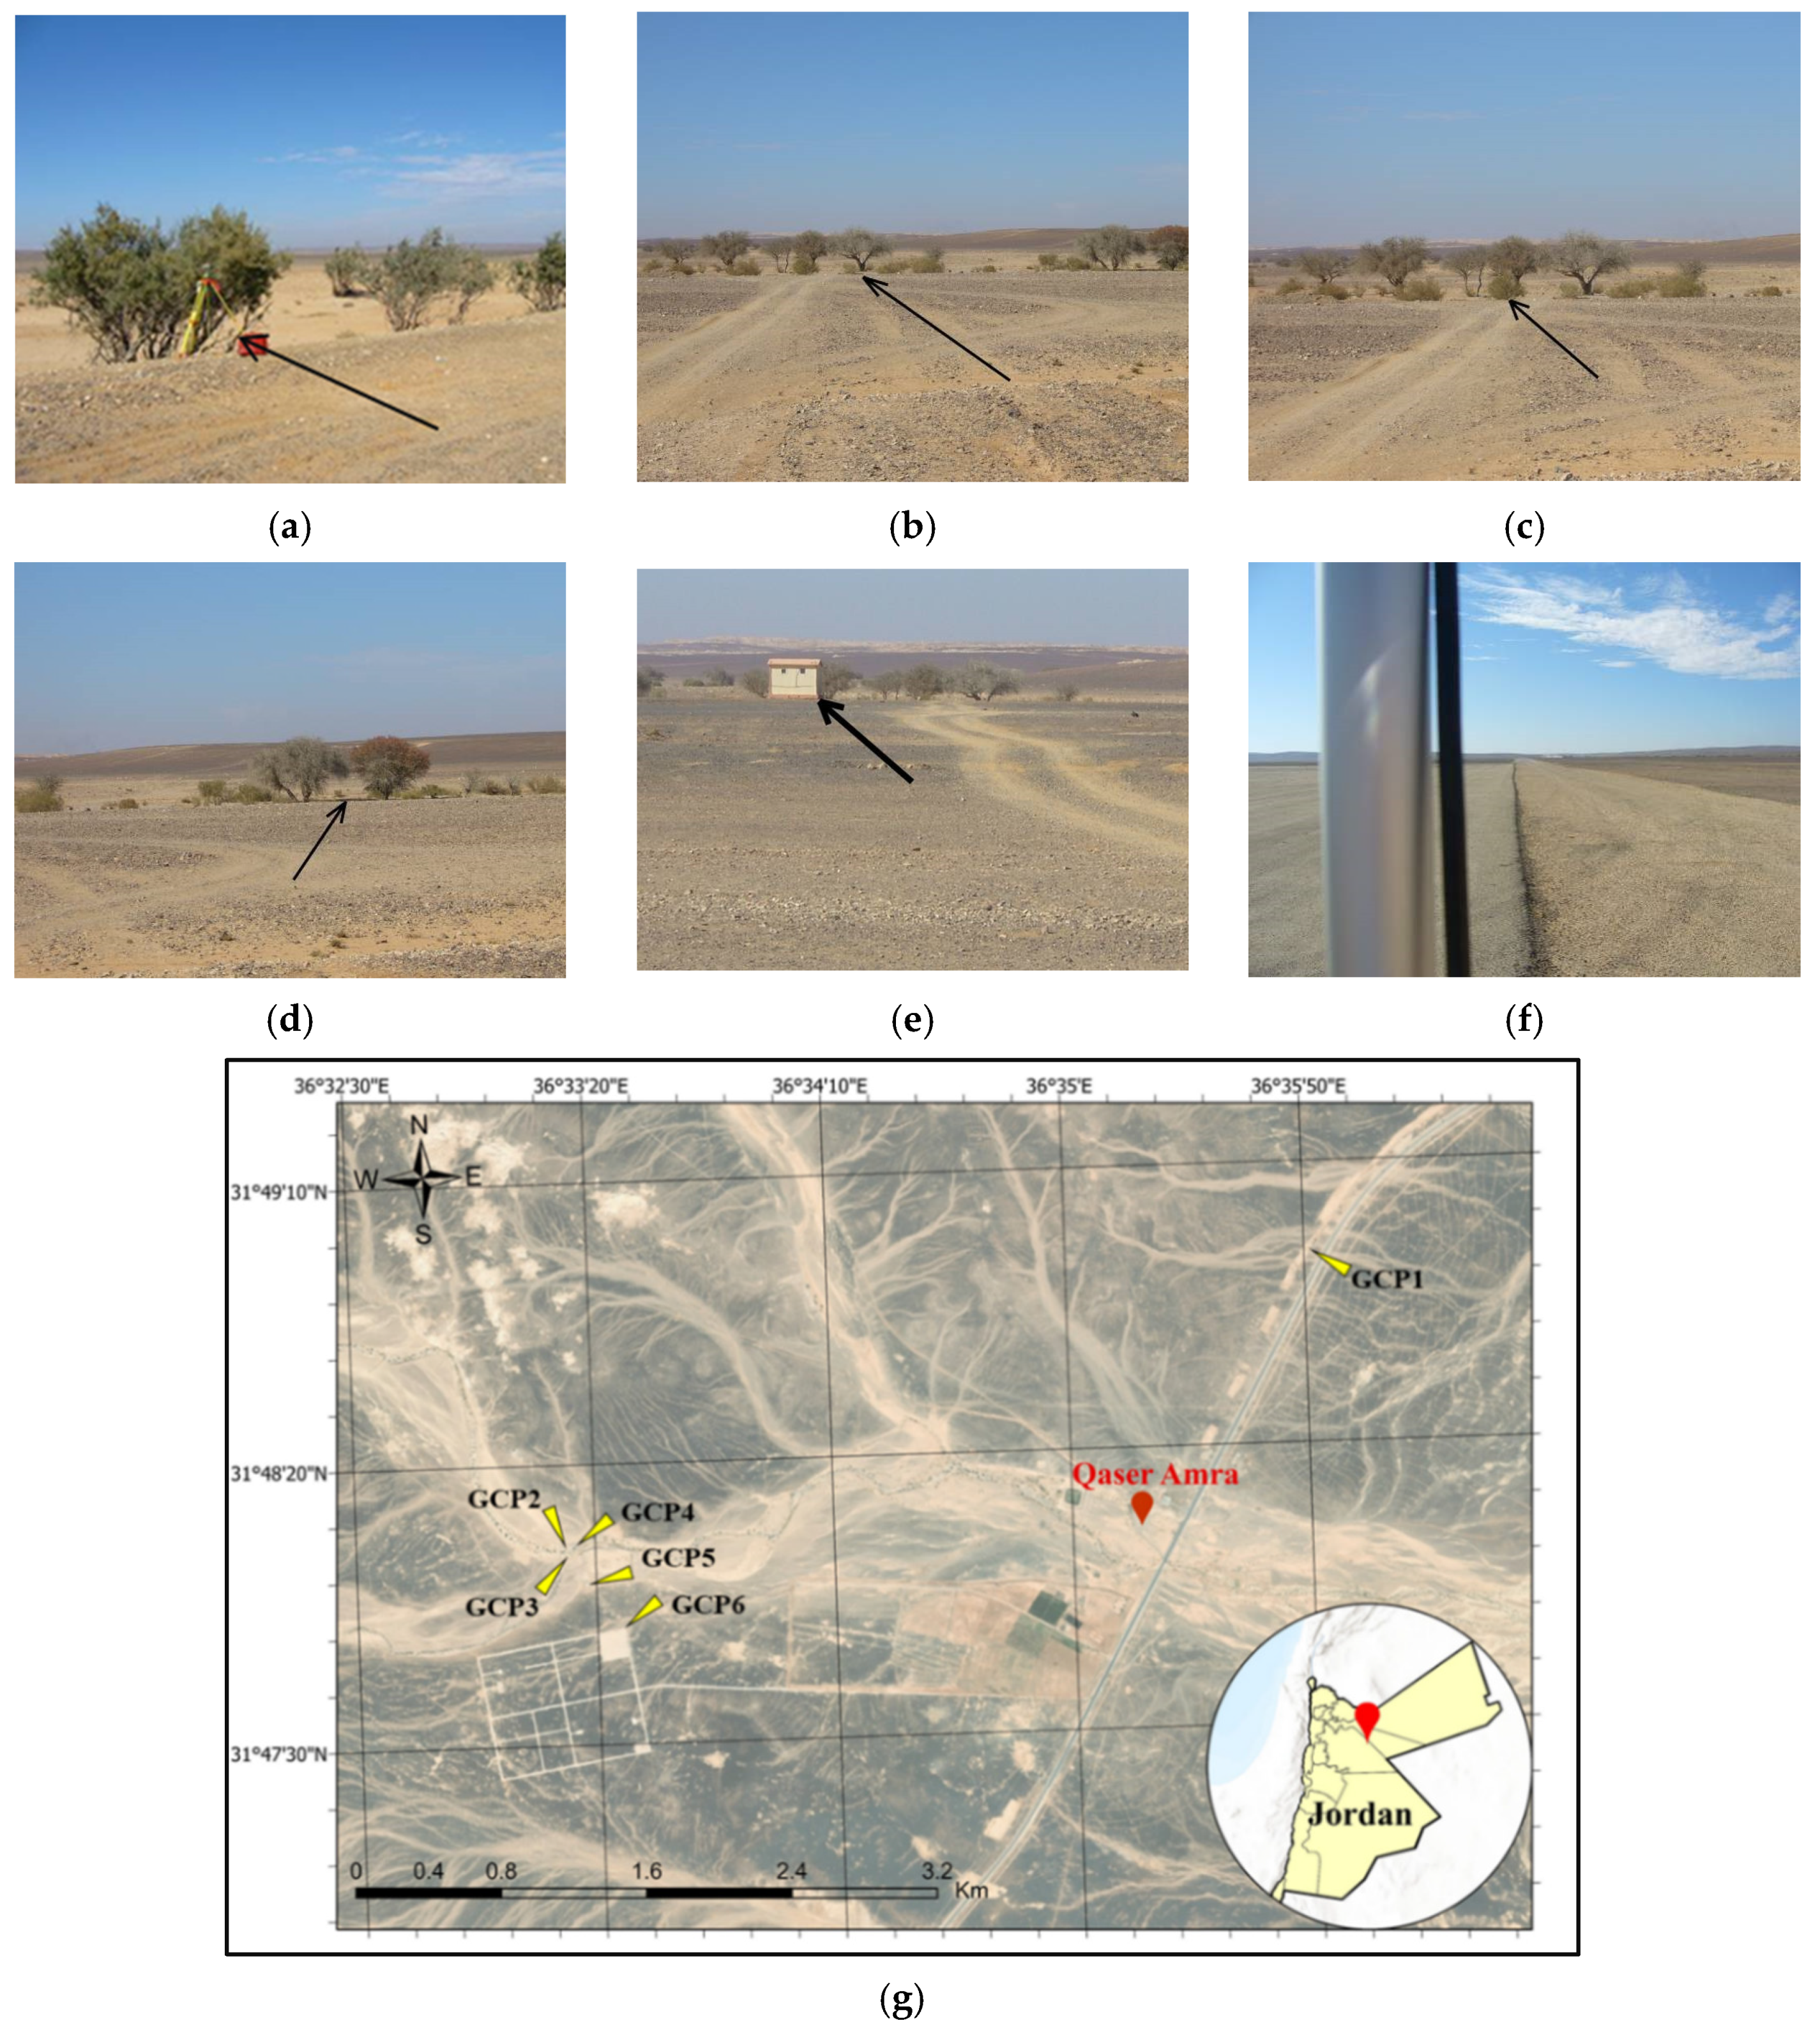
Several GCPs were located in the surrounding area of the study area.
Figure 7 shows an aerial view of the six GCPs at Qaser Amra and the location. GCP1 was located at the southernmost of the three trees in the row and the north side of the overlap (
Figure 7a). The exact location was on the east side of the tree, toward the road. The antenna attached to a tripod was 1.19 m above the ground. GCP2 was located on the eastern edge of the crown of the first tree at the north fork and had a height reading of 2.00 m from the ground (
Figure 7b). GCP3 was located at the first bush nearest to the road coming from the south (
Figure 7c). The antenna, mounted on a pole, was at a height of 2.00 m from the ground. GCP4 was located between the two big trees at the fork, in the middle of the line connecting the southeast edges of the tree crowns (
Figure 7d). The antenna was mounted on a pole at a height of 2.00 m above ground level. GCP5 was located at the southeast corner of the small house near the middle of the road between the rectangular landing and the fork (
Figure 7e). The antenna on the pole had a height reading of 2.00 m above ground level. Finally, GCP6 was located at the northeast corner of the rectangular asphalt landing, not on the dirt road corner (
Figure 7f). The antenna on the pole was positioned 2.00 m above the ground.
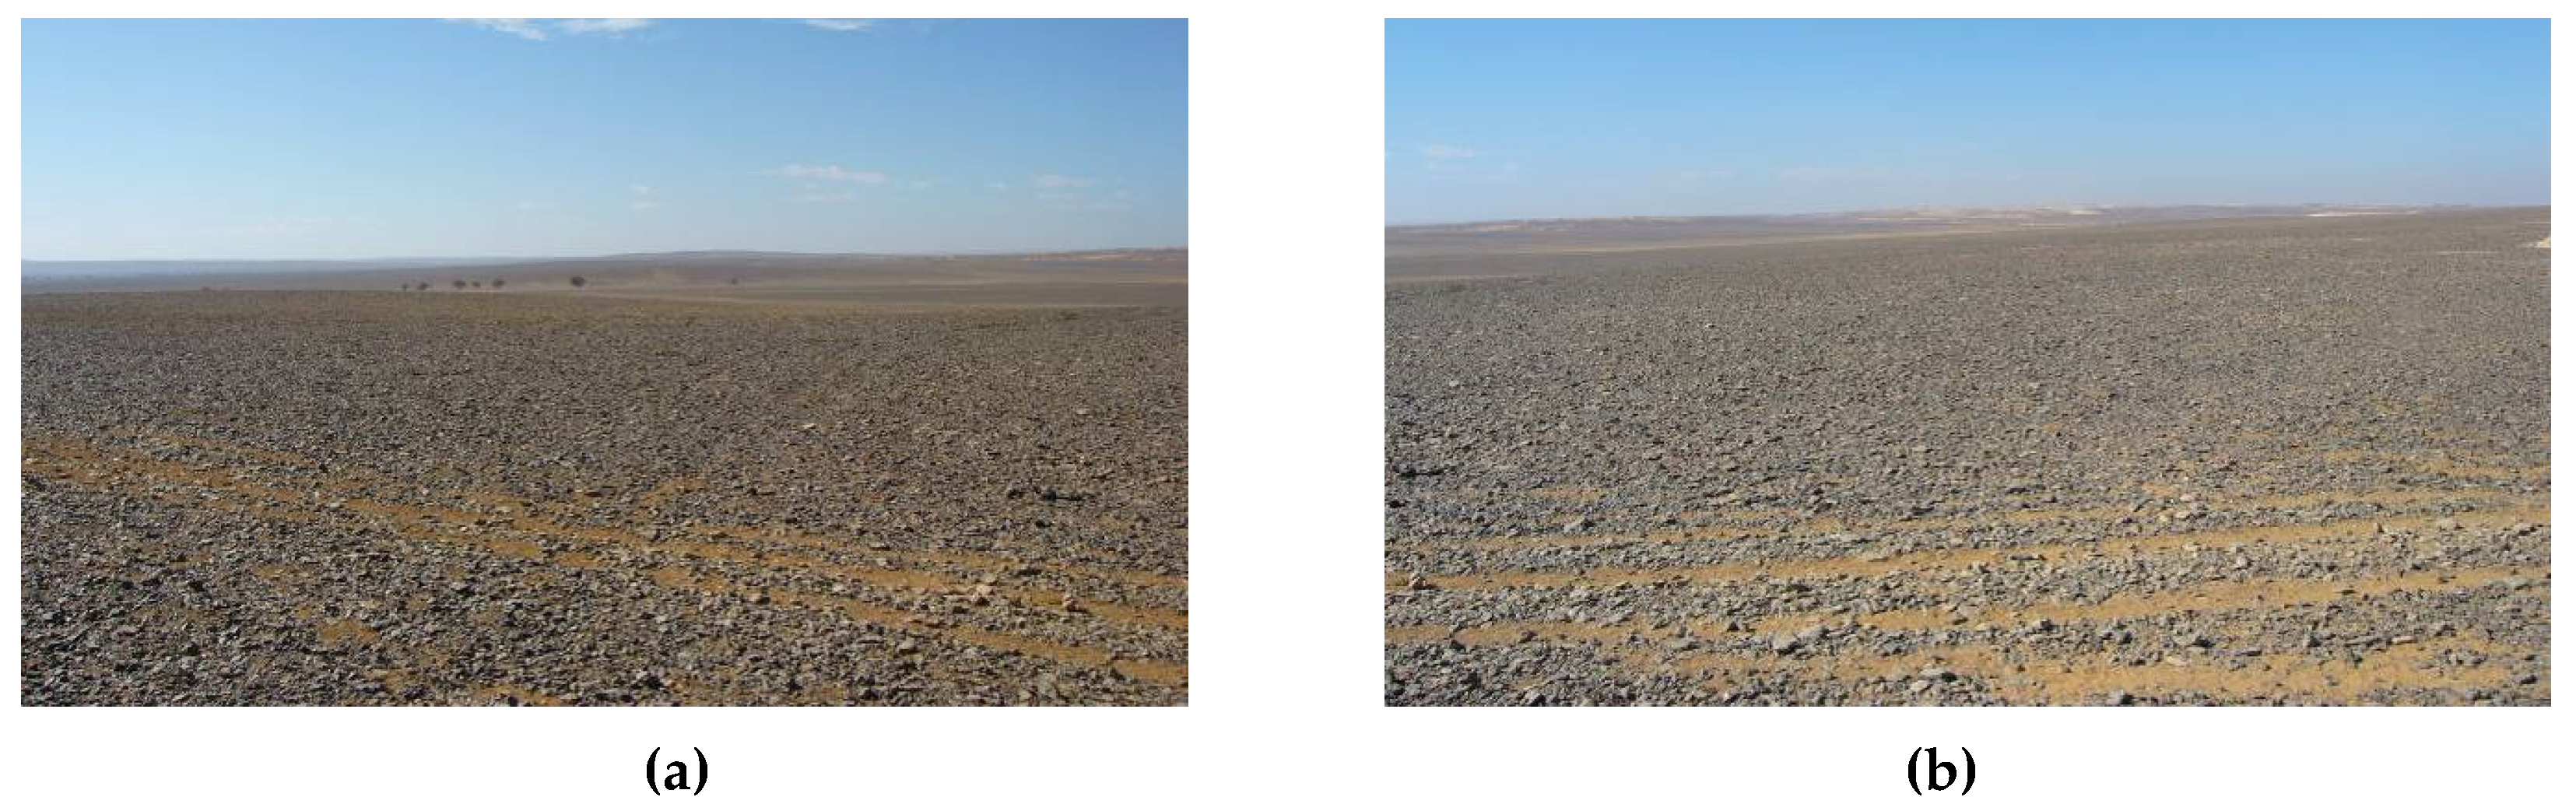
The last five points were in the same area due to the poor quality of the aerial images. The quality of the photos did not allow the details in the field to be easily recognized. Some of the points could not be identified in the images. Instead of the six required control points, only three areas points were taken due to the lack of roads on the east of the main road and in the northwest region of the overlap. It was also impossible to find clearly identifiable objects on both the photos and the ground due to the area’s nature, as shown in
Figure 8.
3.1.3. Data Processing and Modeling
The archaeological site of Qaser Amra was surveyed using the total electronic station Leica TCRA1110 Plus. The field works included a closed-loop traverse, linked to points Amra1 and Amra2, which was adjusted using the least-squares method and Lis CAD Plus software. Side-shots observed all the elements in the area (buildings, fences, etc.), and their coordinates were computed from the reference points. Close-range photogrammetry control and checkpoints were taken on all vertical surfaces using reflector-less measurements of the face-scanning program of the instrument. Point coordinates were computed by Universal Transverse Mercator (UTM) projection—zone 37. The coordinates are not listed in this report due to the large number of points.
The main challenge of photogrammetry techniques is the capability to analytically correlate scanned objects to the coordinates of their image points and vice versa [
35]. A common geometric technique used as a solution to this problem is the collinearity condition in which the camera station, the image point, and the imaged object are aligned in a straight line. The collinearity condition solves seven parameters, including scale, shift, and rotation in the x, y, and z axes. Collinearity equations are used to model the relationship between the image and the ground coordinates by transiting image coordinates as functions of the interior orientation parameters (IOPs), the exterior orientation parameters (EOPs), and the object coordinates. The two collinearity equations were formulated as follows:
where
and
represent the image coordinates of image point
a;
XA,
YA, and
ZA are the ground coordinates of point
A on the object;
and
refer to the coordinates of the principal point
p;
c is the camera constant that represents the principle distance;
,
, and
are the ground coordinates of the projection center; and
, …,
are the rotation matrix elements that are a function of the rotation angles (ω, ϕ, and κ). Compensations for deviating from the collinearity are denoted by
and
[
36]. The adjusted coordinates of the GPS control points in the World Geodetic System 1984 (WGS84 system ITRF2000) with absolute error ellipses and the coordinates in UTM zone 37, reference ellipsoid WGS 84, and ellipsoidal height are provided in
Table 1. The accuracy (root-mean-square error (RMSE)) of the control points obtained after processing is illustrated in
Table 2. The data were extracted from the RINEX (Receiver Independent Exchange) report that allowed adding corrections in post-processing and improving the overall accuracy.
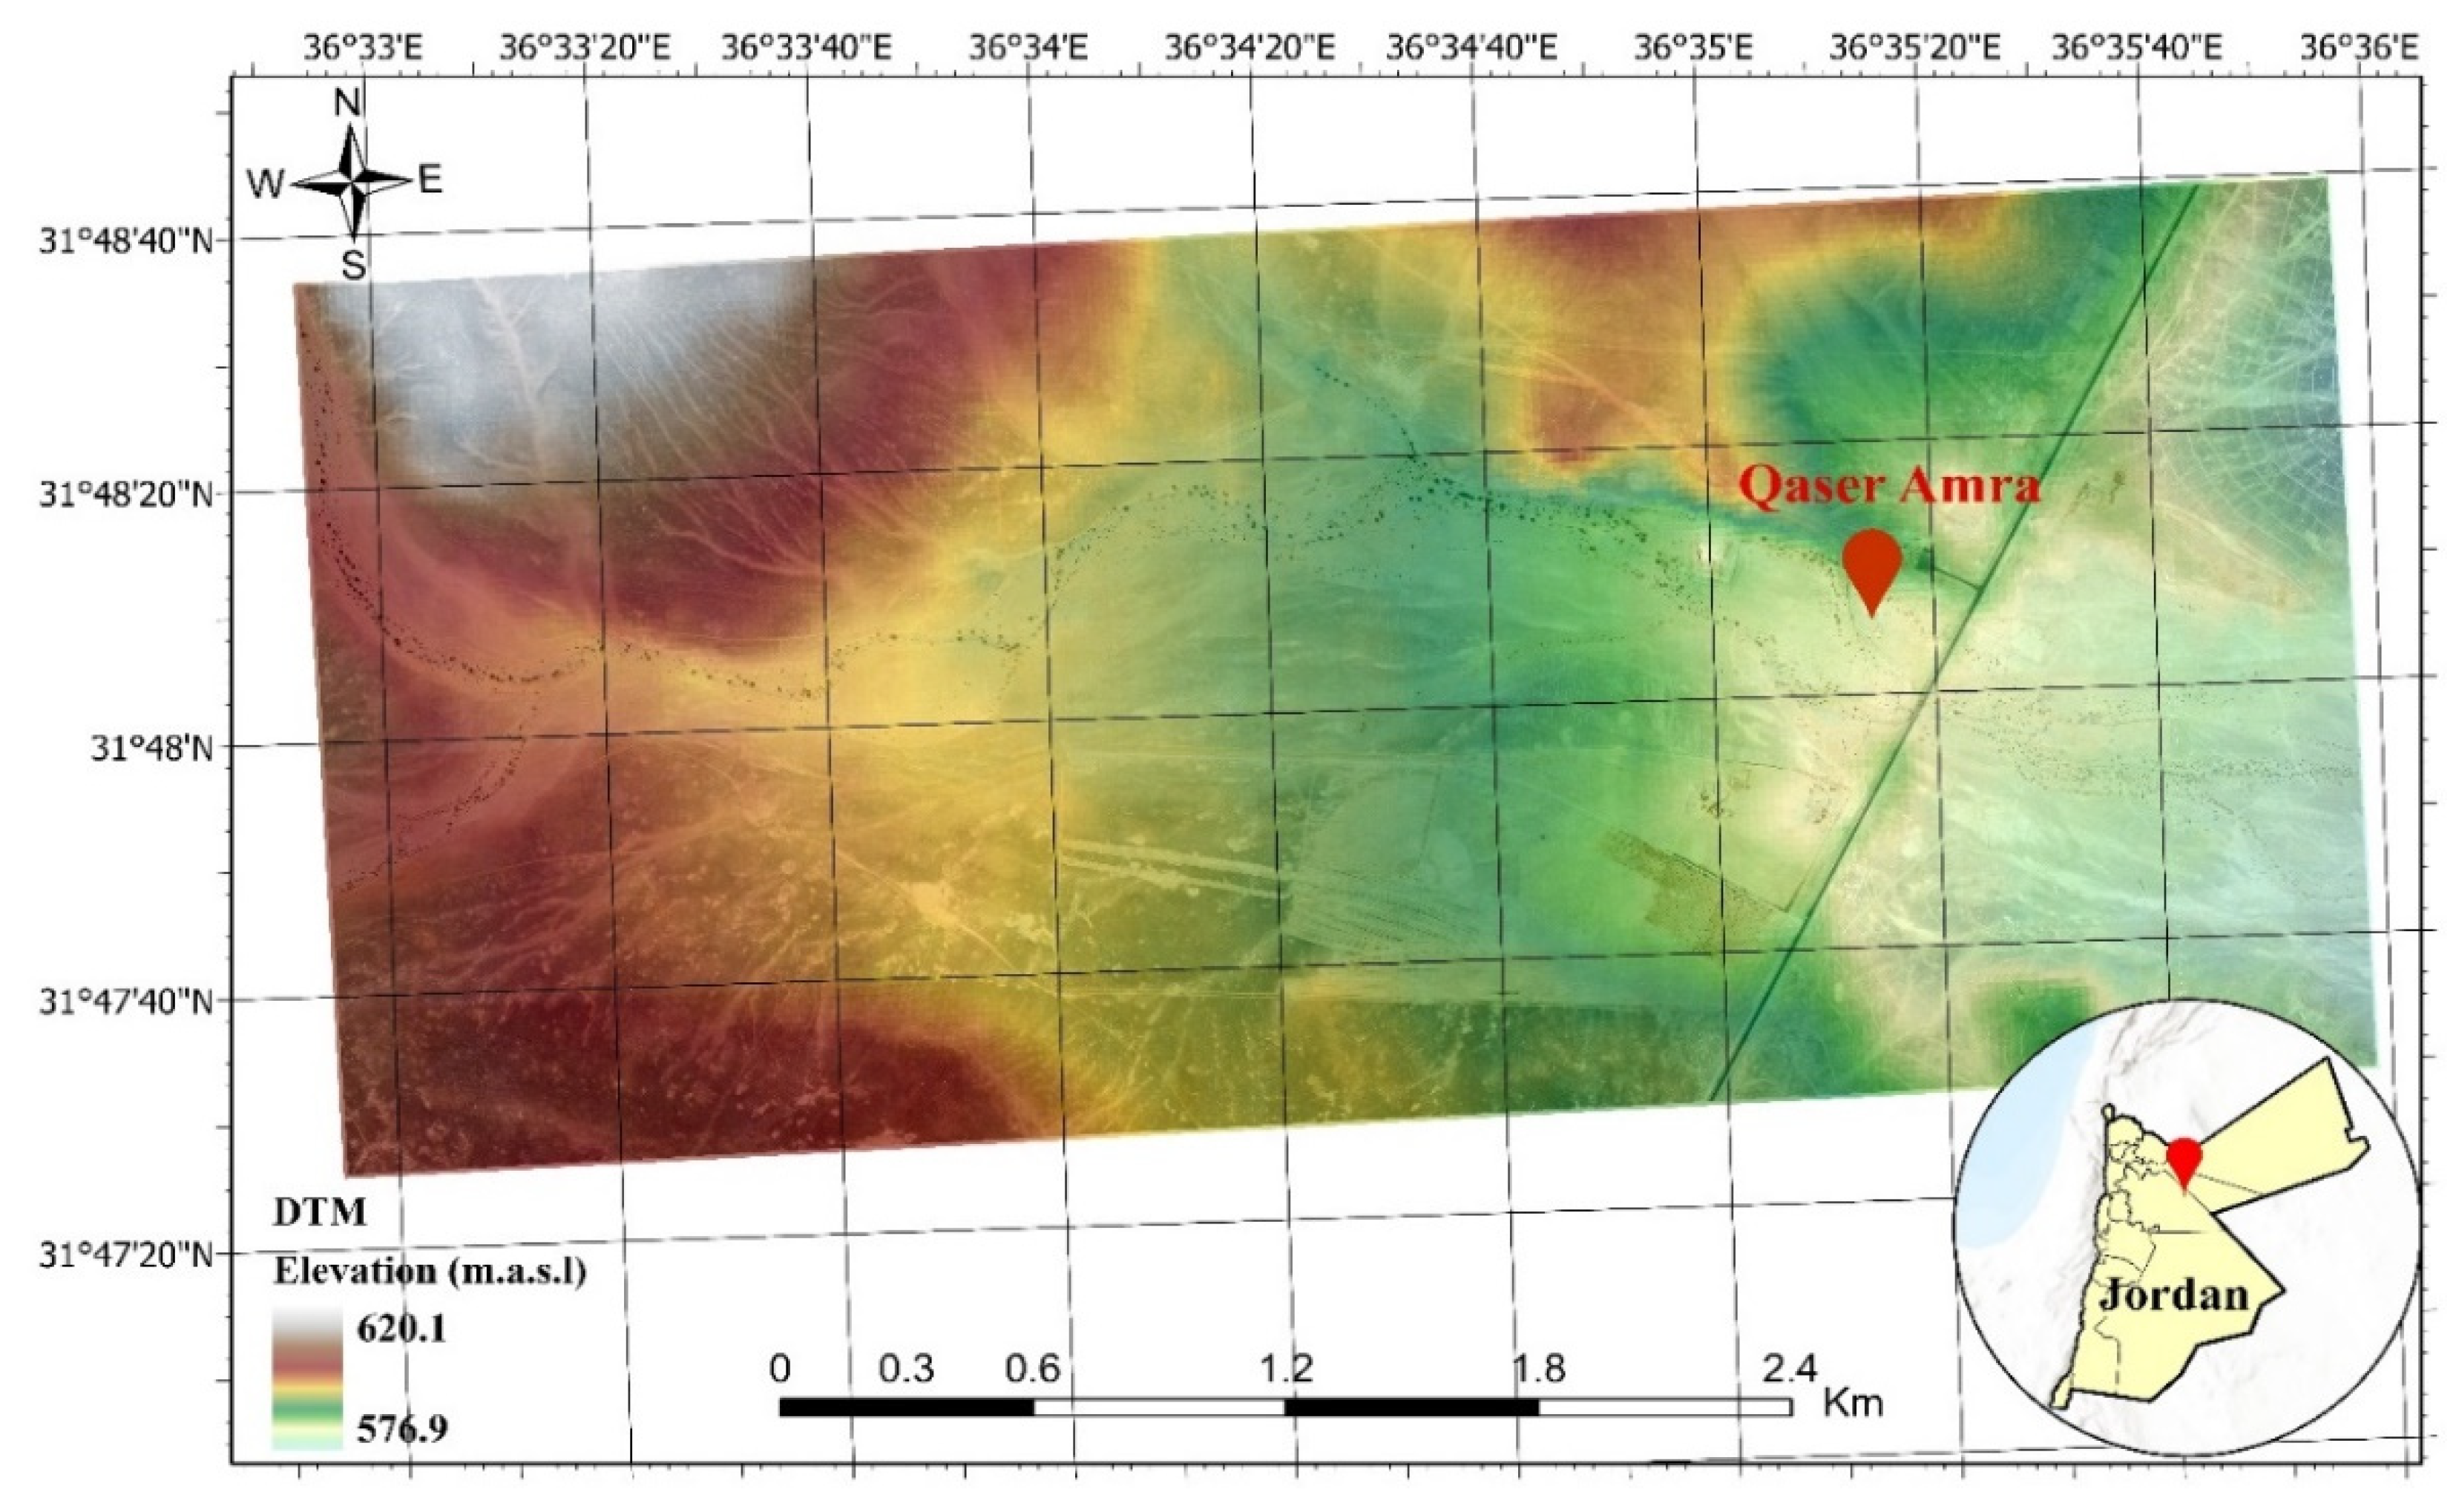
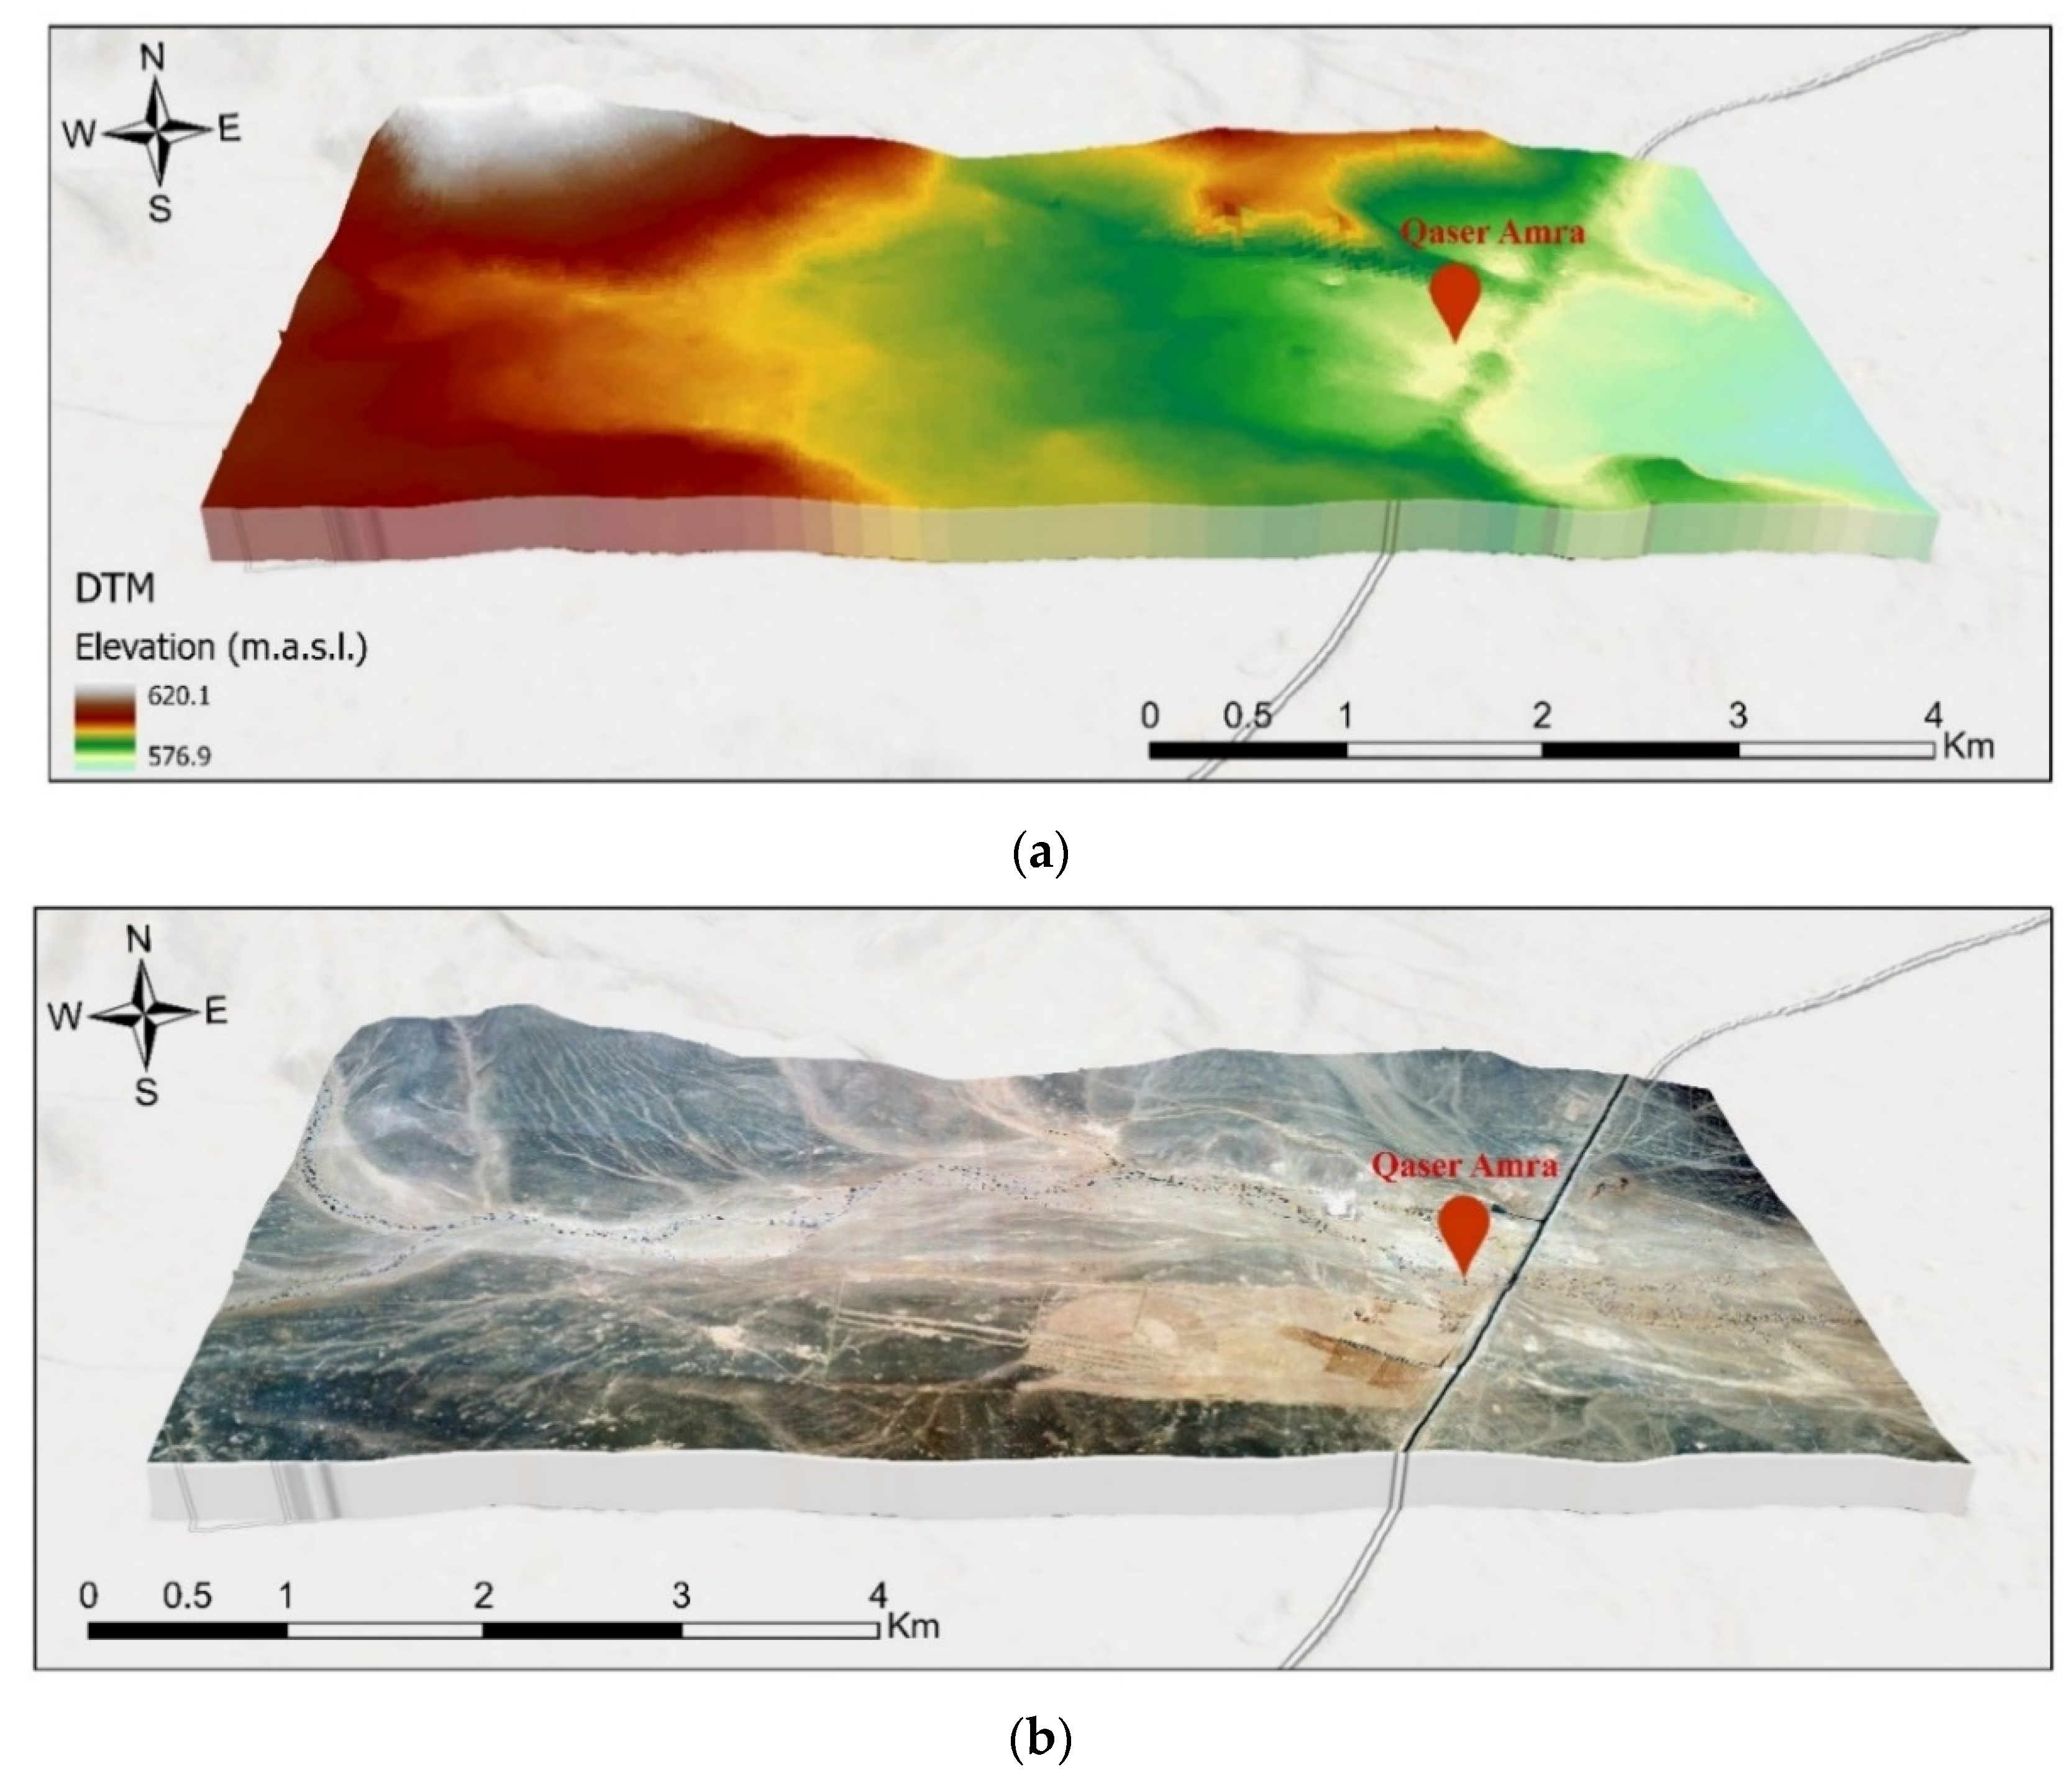
The digital terrain model (DTM) was generated using an image correlation approach that automates the extraction of the required tie points. The analysis was performed using ArcGIS Pro software to produce high-quality maps. Additionally, an adaptive strategy was employed to develop a DTM in a grid format with the characteristics of topography.
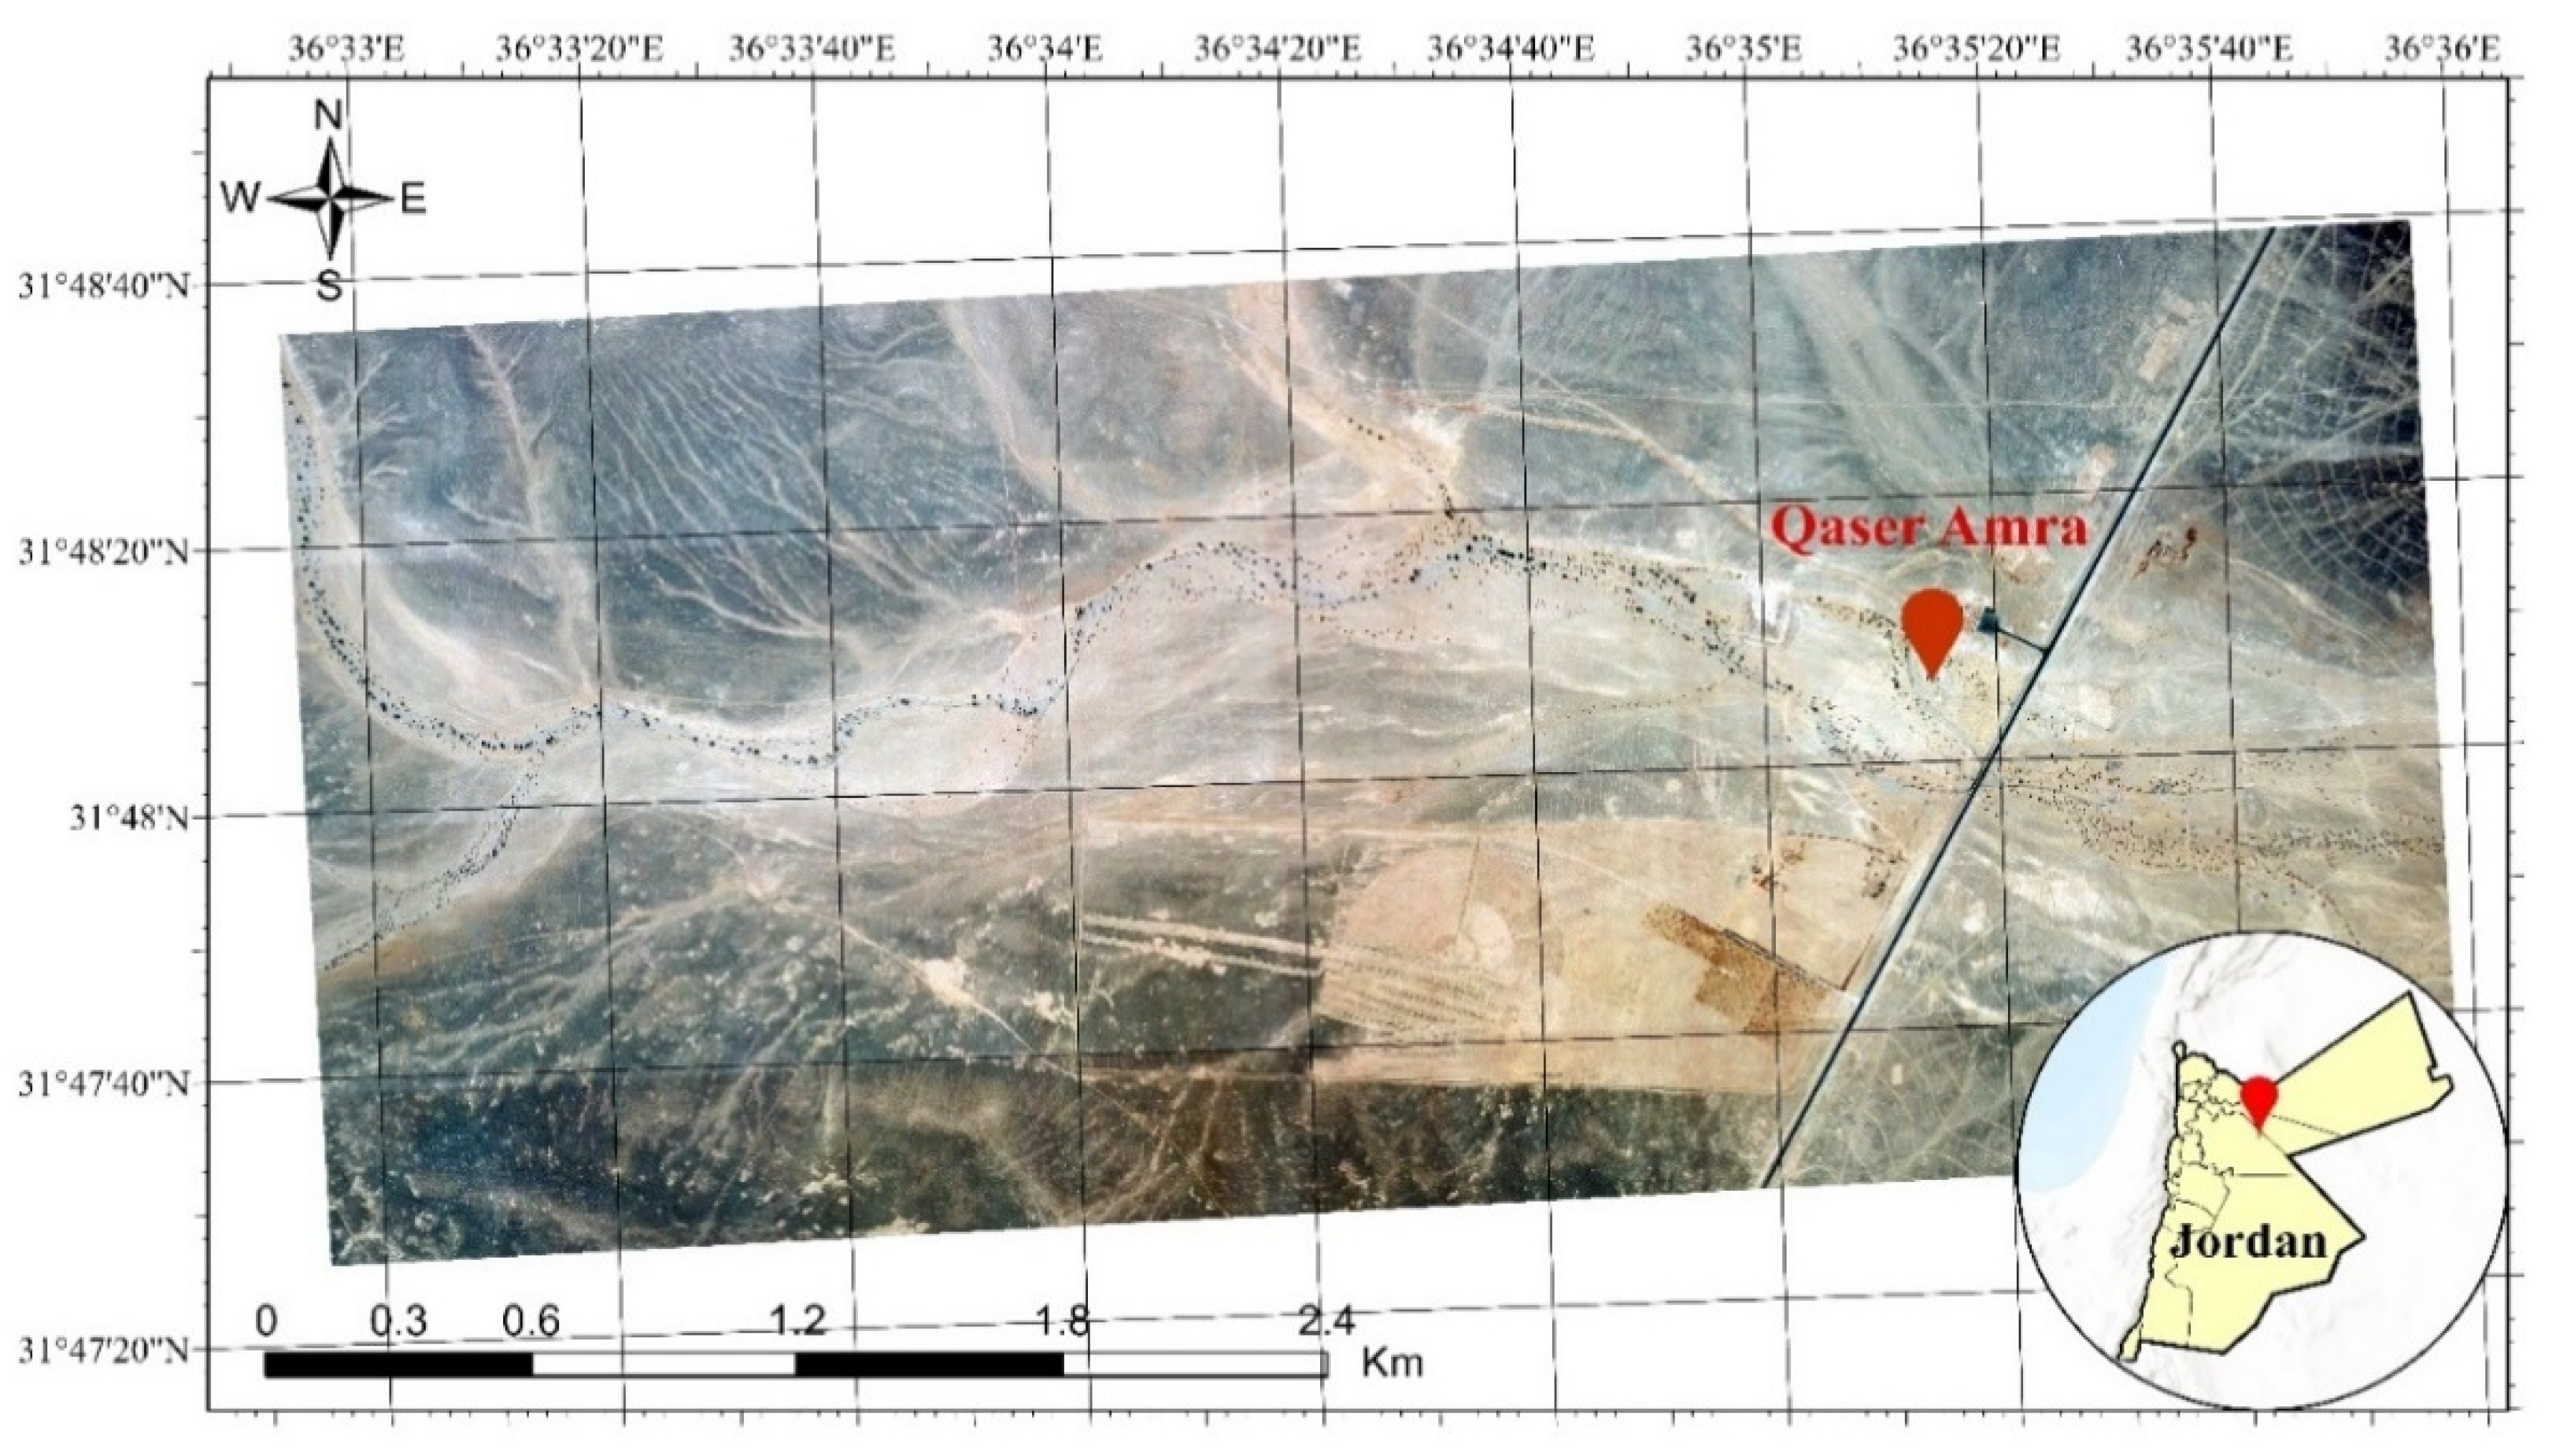
Figure 9 shows the DEM produced during the investigation of the study area with heights ranging from 576.9 to 620.1 m above the mean sea level. Moreover, the RMSE approach was used to assess the accuracy of the generated DEM and GPS points. The RMSE was computed using six checkpoints and was determined to be 0.187 m. Moreover, the produced DEM was used to generate the orthophoto shown in
Figure 10. Typically, an orthophoto is an image that has been transformed from perspective to orthogonal projection, where both tilts and relief displacements have been corrected.
3.2. Geographic Information Systems
GIS can capture and analyze the irregular complex geometry of cultural heritage objects to conclude their spatial relationship. To develop a 3D GIS model, the main requirement is the ability to handle a substantial amount of complex and non-planar 3D geometry and visualize complex objects with a significant number of geometric elements. Most of the layers used for Qaser Amra were digitized from the orthophotos, such as building roads, trees, and the castle.
GIS data processing comprised scanning, geo-referencing, designing layers, and digitizing. After geo-referencing the maps and defining the projection and parameters of the maps to enhance their compatibility with all of the photogrammetry and GIS layers, digitizing was performed to extract the GIS layers.
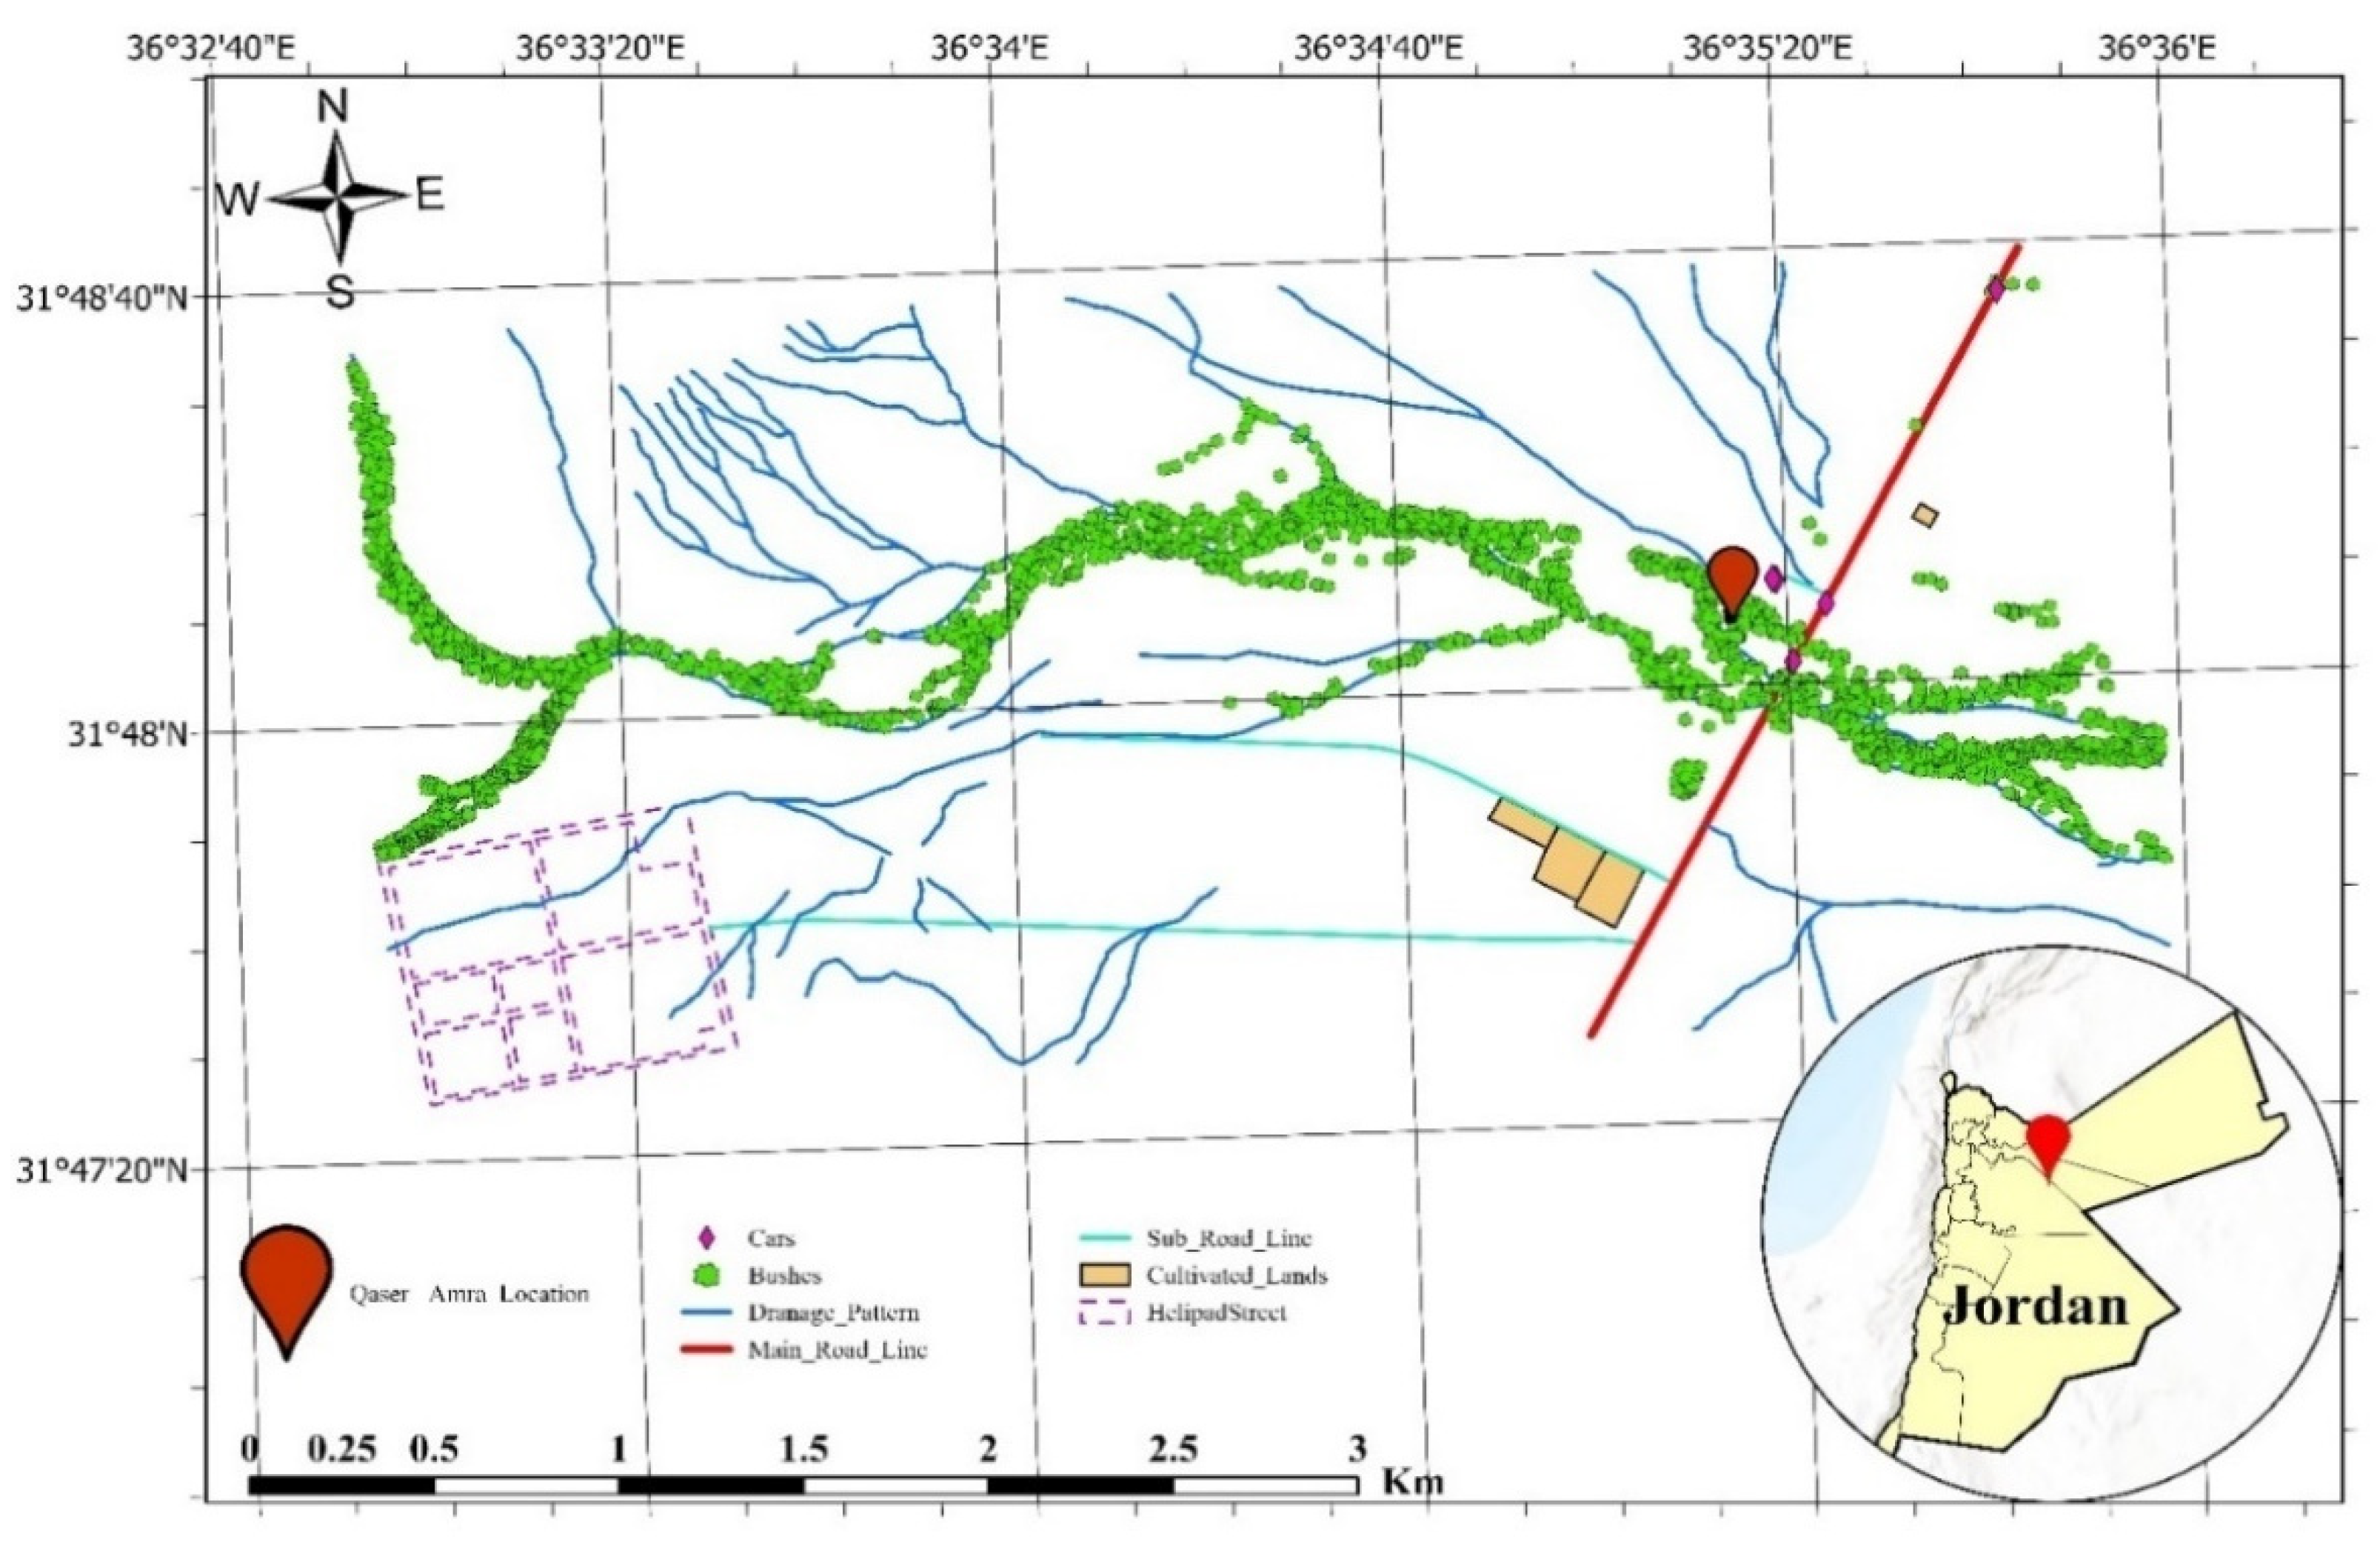
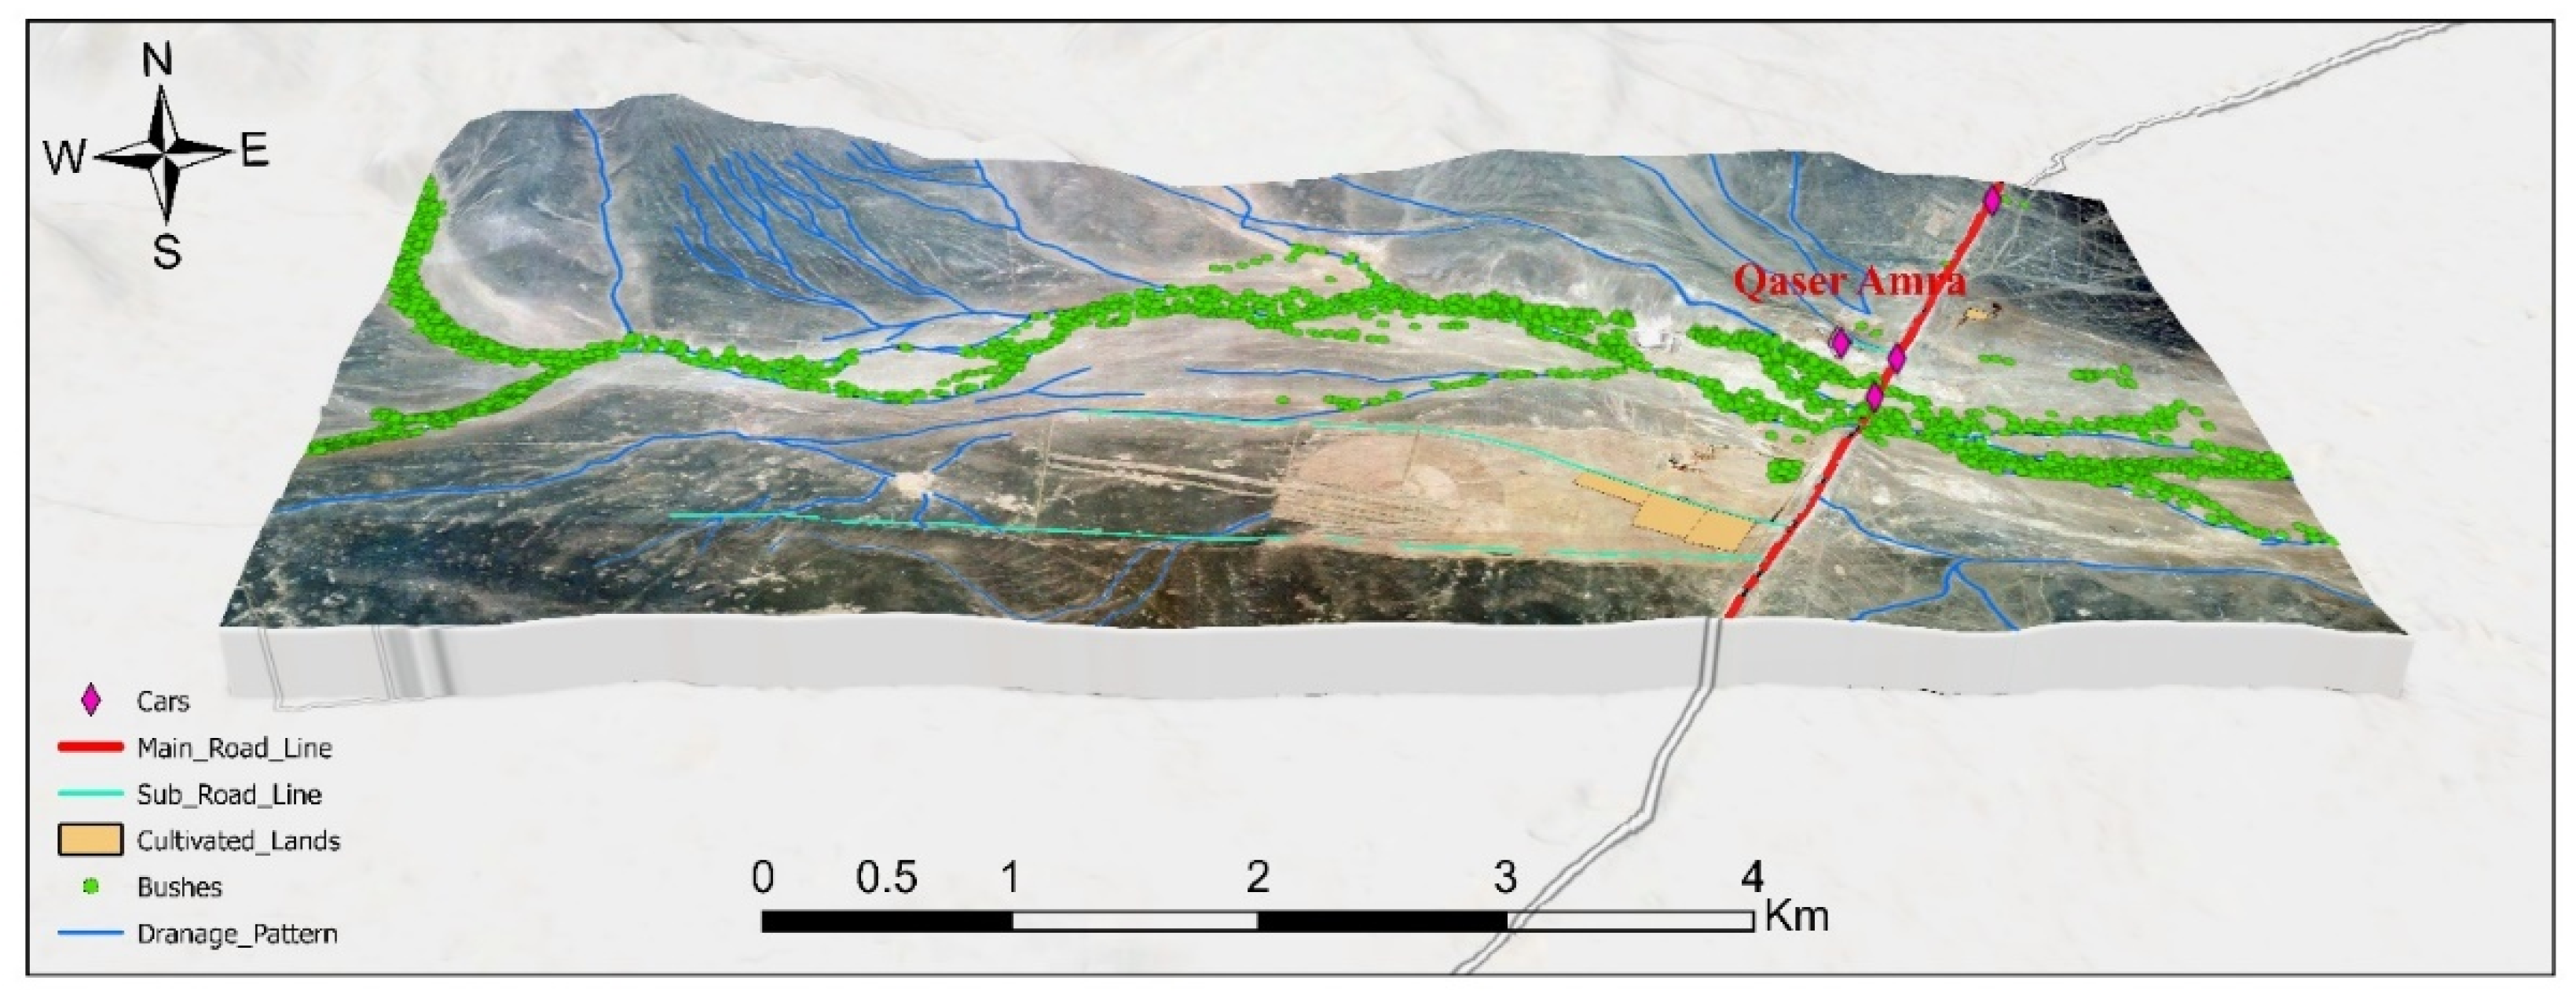
Figure 11 shows the general site map of digitizing features. Different layers can be digitized and overlayed as a new layer to the GIS system.
Subsequently, maps that included digitized layers overlayed with the photogrammetric data obtained in
Section 3.1 were generated.
Figure 12 illustrates the overlay of vector layers over Qaser Amra’s orthophoto that included the different GIS attributes of the roads, buildings, trees, and other archaeological layers. Moreover, these attributes were effective in identifying various data layers. This preparatory step facilitated the 3D modeling in the following step.
2.5D Geo-Referenced Model
Archaeology is a destructive practice that requires documenting a site with high accuracy and comprehensive details. Documentation is needed to re-establish and understand an archaeological site that has been exposed. Using 2.5D geo-referenced modeling can support archaeologists in documentation by creating detailed and geometrically and photometrically reliable 3D models of a study area. The 2.5D geo-referenced model is an upgrade of the 2D DEM and orthophoto maps, adding some information from the photogrammetric processing and GIS vector layers to create a 3D layer. The GIS data and extruded GIS features were utilized from the topographic surface of the study area.
Figure 13 shows the 2.5D geo-referenced model generated for Qaser Amra for both the DEM and the orthophoto.
3.3. Close-Range Photogrammetry
Close-range photogrammetry processing is a procedure for producing a 3D model that captures the actual features, shapes, and texture. The main objective of close-range photogrammetry is to generate models that have the same texture and size as reality. When applying photogrammetric techniques to capture and document archeological sites, the parameters affecting the accuracy and efficiency of the process must be taken into consideration [
3]. These parameters include camera configuration, geometric parameters, resolution, and the bundle adjustment procedure. The conjugated points were selected from a random datum used as a reference for the object space, taking into account their distribution and visibility. The surveyed points were evenly spaced and completely covered the objects under evaluation.
3.3.1. Image Acquisition and Calibration
Image acquisition includes two main steps: (1) capturing images of the castle using triangulation stipulates technique, and (2) capturing calibration images. The principle of triangulation stipulates that each target must be present in a minimum of two images to extract its spatial information in photogrammetric platforms. The digital camera used in the project to collect close-range images is shown in
Table 3. More than sixty high-resolution images (4000 × 3000 pixels) were captured from twenty-five different camera positions. Moreover, the camera stations surrounded the workspace to obtain the convergent image ray geometry at all points. Multiple exposures with varying orientations were taken at each camera station to strengthen the solution for the detection and removal of systematic errors. The overlapping between images at the same section was approximately 100%, confirming full coverage of the modeled area. During data collection, the distance between the camera stations and the castle’s surface was maintained as much as possible. However, the camera was repositioned in some locations due to the size of the castle (base distance ratio of 1:5).
3.3.2. Data Processing
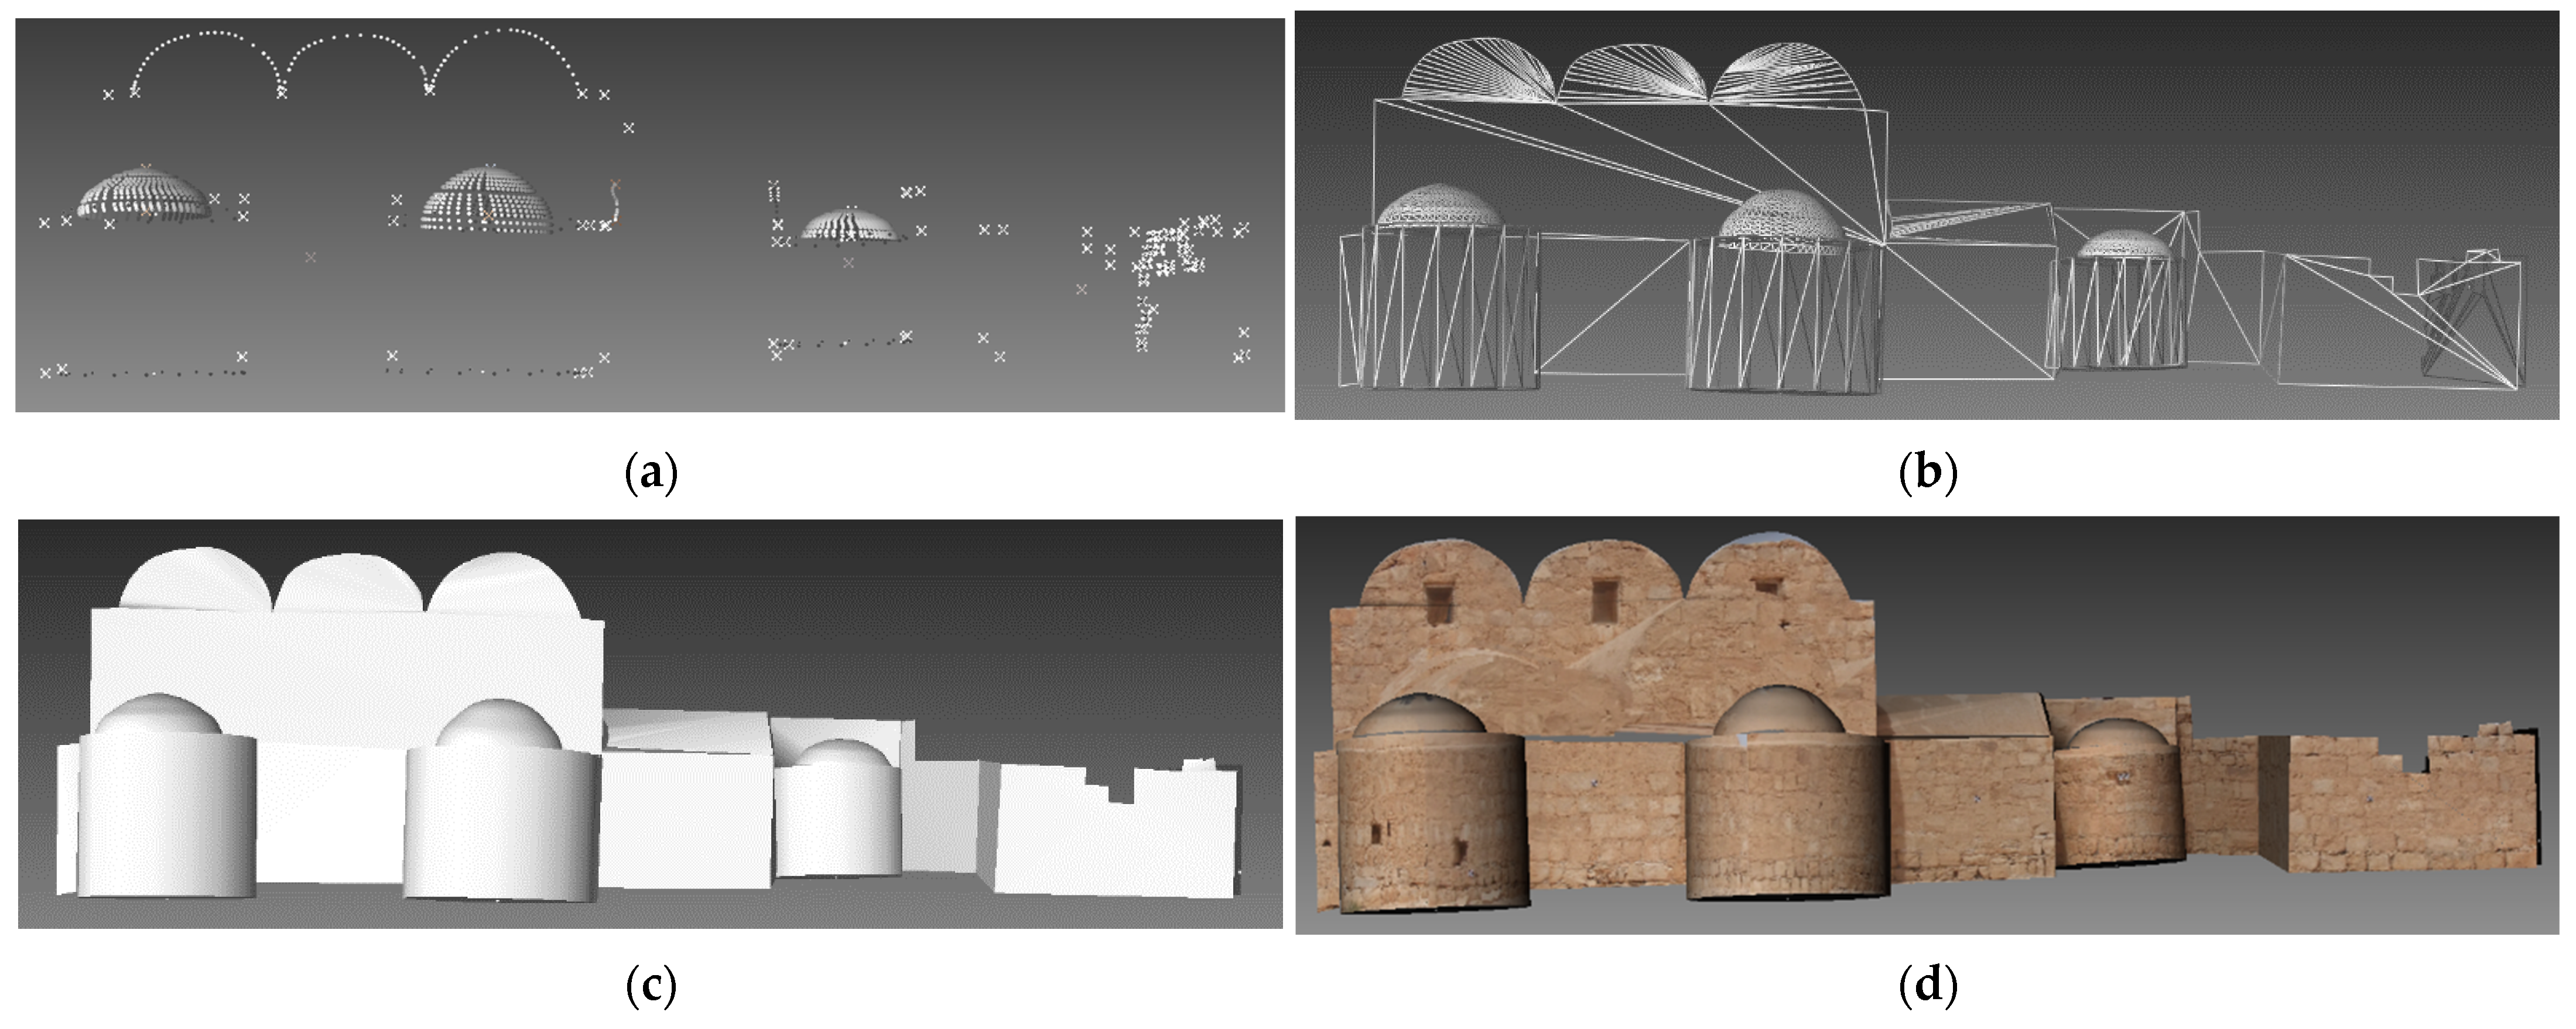
Following the image acquisition and camera calibration, close-range photogrammetry processing was performed using PhotoModeler software. The process started with modeling the perspective ray geometry from the image points. The imported images were used to calculate 2D projections of the castle’s location, as well as the reference coordinate system. The subsequent step involved bundle adjustment, which aided in defining the image location and orientation within the reference system. The bundle adjustment used these measurements to evaluate the ground’s synchronization requirements. Furthermore, at least two images of each point were captured. The geometrical quality and accuracy of the 3D information of a point improved as additional images were taken of that point. The completed castle model comprised of 424 points; 103 images and 47 well-distributed and defined common control points were used during the modeling process. Finally, the architectural adequacy of the selected points for the construction of various forms was assessed.
Figure 14 shows the 3D coordinates obtained for the south side after applying the adjustment procedure to reconstruct the 3D model. During the adjustment process, surface rendering was performed to incorporate surface textures into the 3D model, giving it a real-world appearance, as shown in
Figure 14d. The 3D surface model is essential for presenting destroyed heritage sites to provide architects and renovation experts a realistic view of the ruins for further inspiration.
The dimensional measurement of the castle’s various elements can be extracted from PhotoModeler. In this study, three main dimensions were calculated: the length, width, and height of the south side of the castle. These were compared with the measurements obtained from the total station approach, as shown in
Table 4.
The results indicate that, when compared with the total electronic station measurements, the accuracy achieved by the 3D model generated by PhotoModeler ranged between 0.000403 and 0.003970 m. The generated texture model was very suitable for obtaining important details about the archaeological structure where architects and experts will need to obtain a realistic perspective of the ruin for further inspiration. In addition, it will assist in the management of the archaeological structure through feasibility analysis, rehabilitation decision, monitoring system, and safety planning. Finally, 3D digital documentation is useful for conservation, education, and virtual visits.
3.4. Ground-Penetrating Radar
GPR is a geophysical scanning technique that utilizes radar pulses for high-resolution continuous imaging of subsurface structures. The technique transmits EM waves with a frequency band ranging between 10 MHz and 1000 MHz and detects the position of the reflected energy [
37]. Furthermore, the advantage of adopting EM waves with short-wavelength signals is their capability to generate and focus on the subsurface to map several anomalies that vary in terms of their electrical characteristics.
The ability to determine the reflector’s position in space or time is represented as a function of the horizontal resolution and the pulse width. The vertical resolution, modeled as a function of the frequency, is influenced by the wavelength (λ), which is a function of velocity (
v) and frequency (
f) [
38]:
One-quarter of the dominant wavelength could be used [
39].
3.4.1. GPR Survey
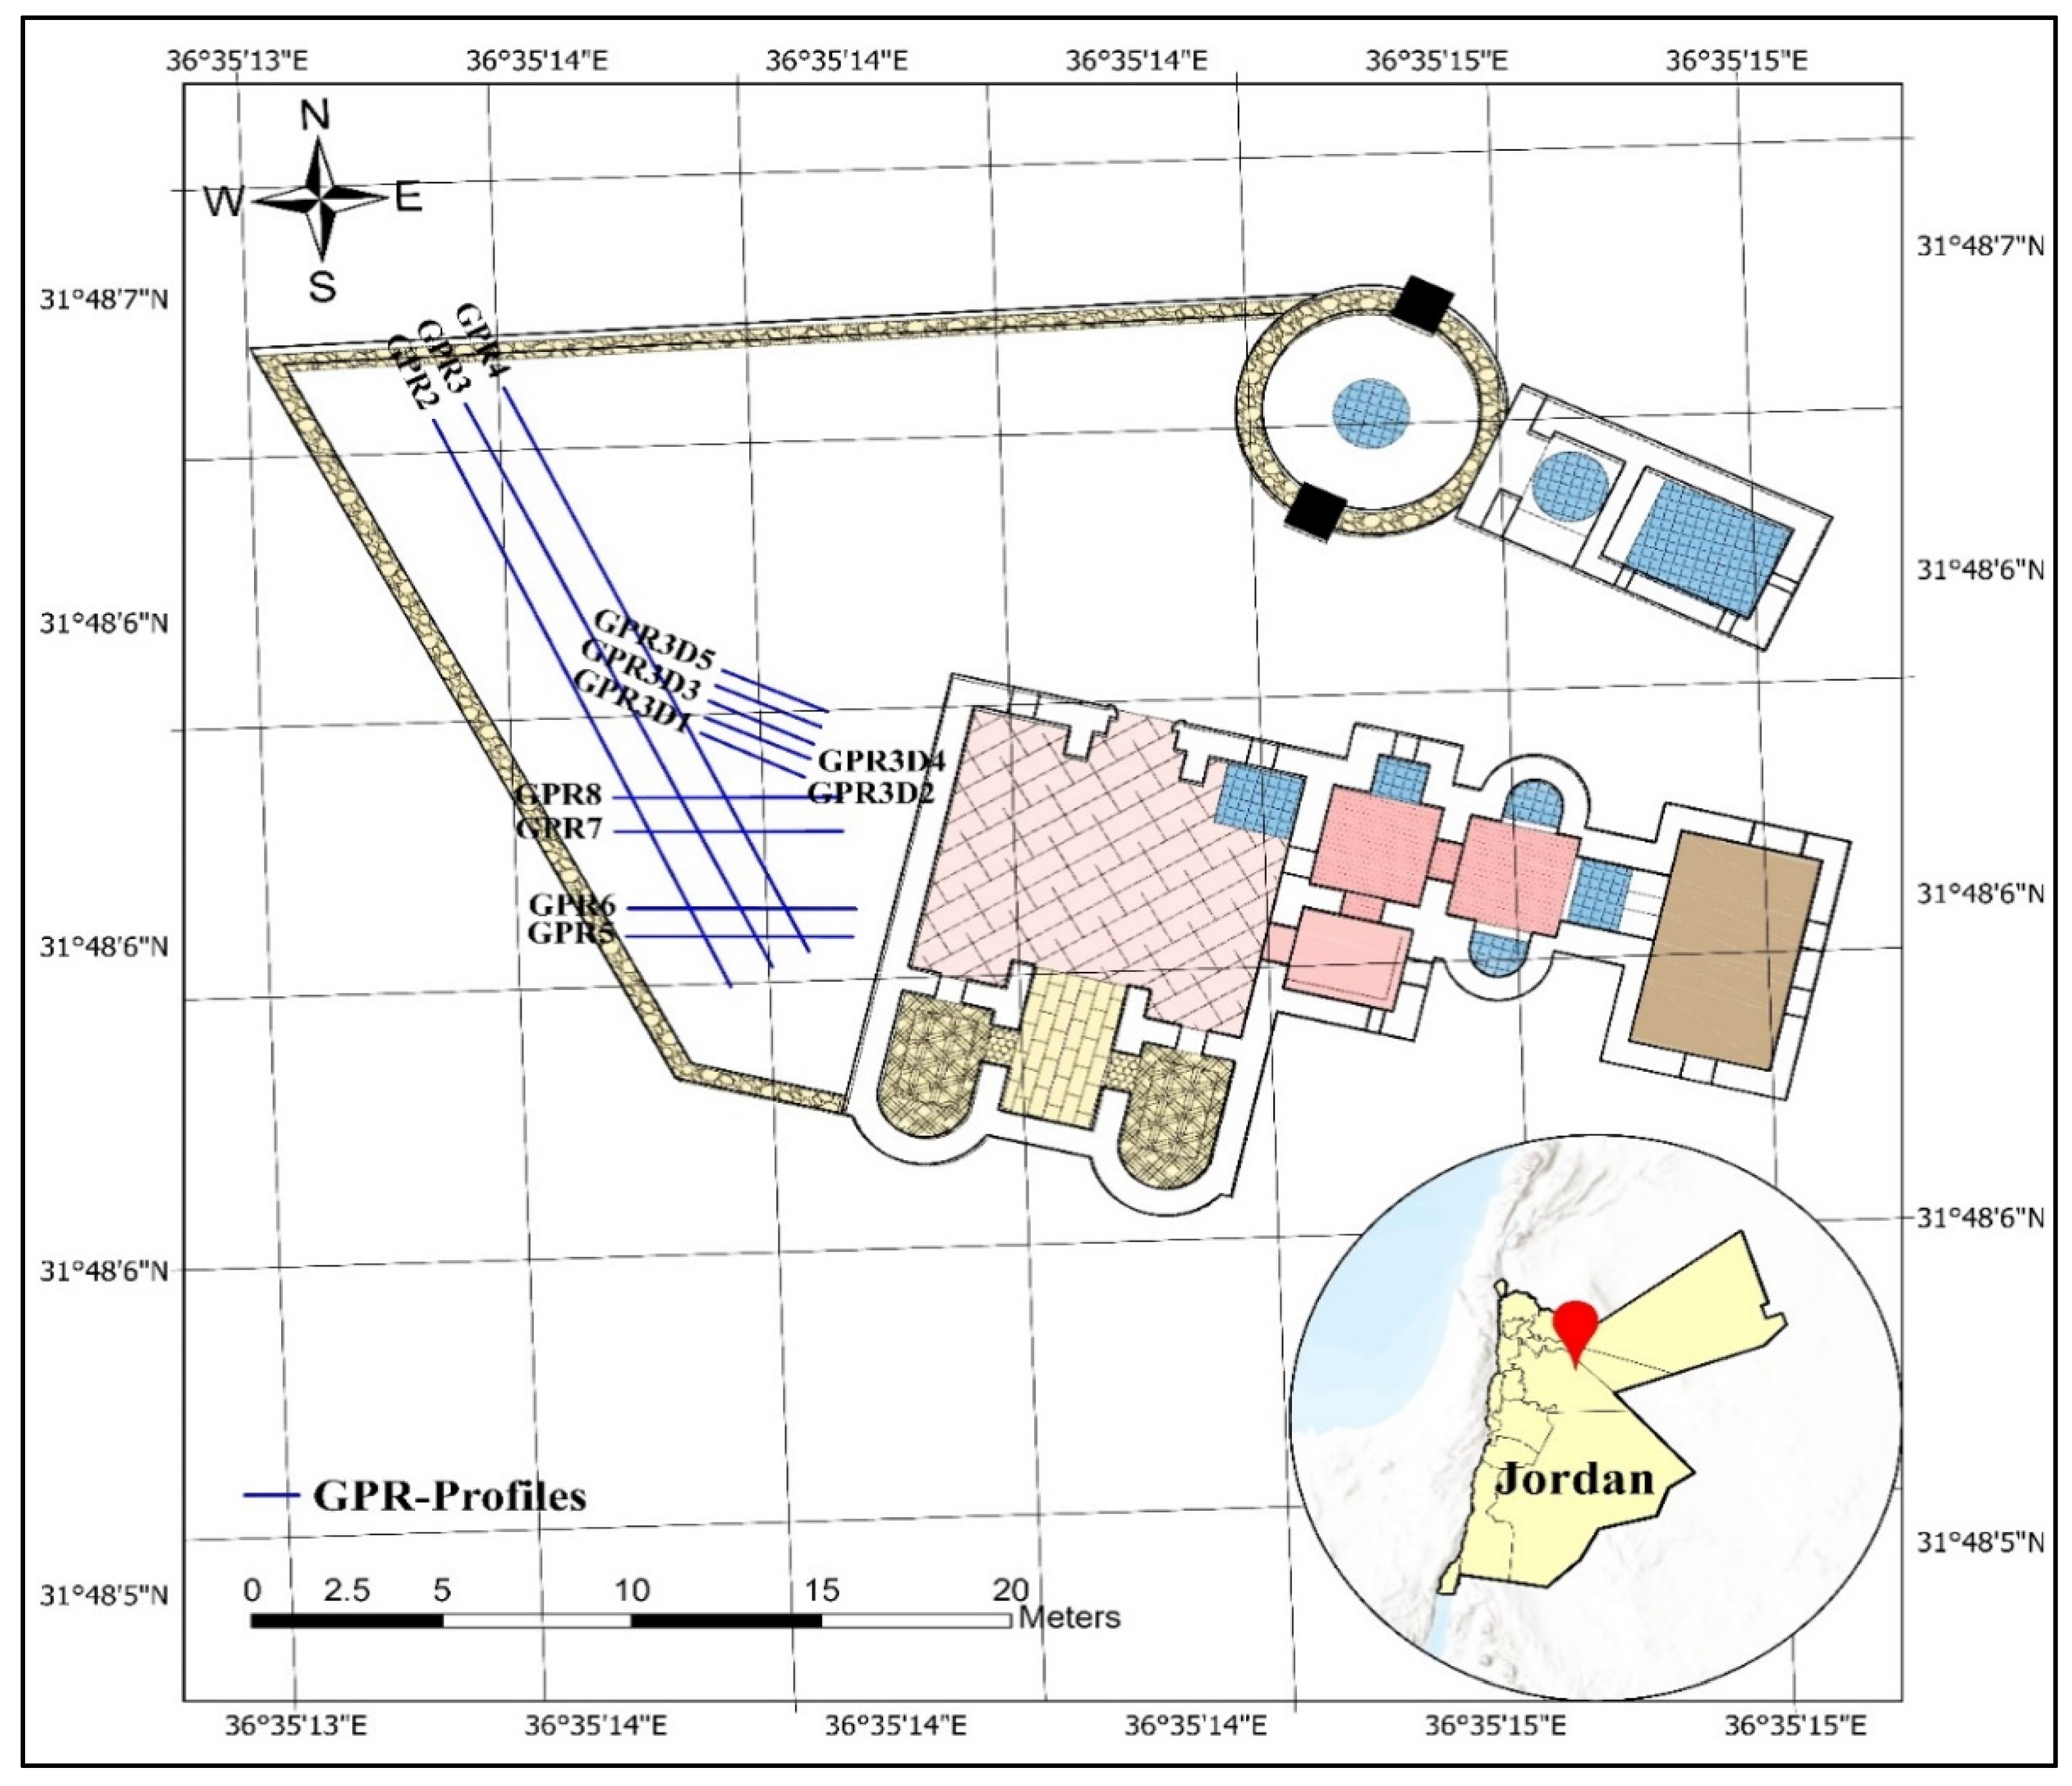
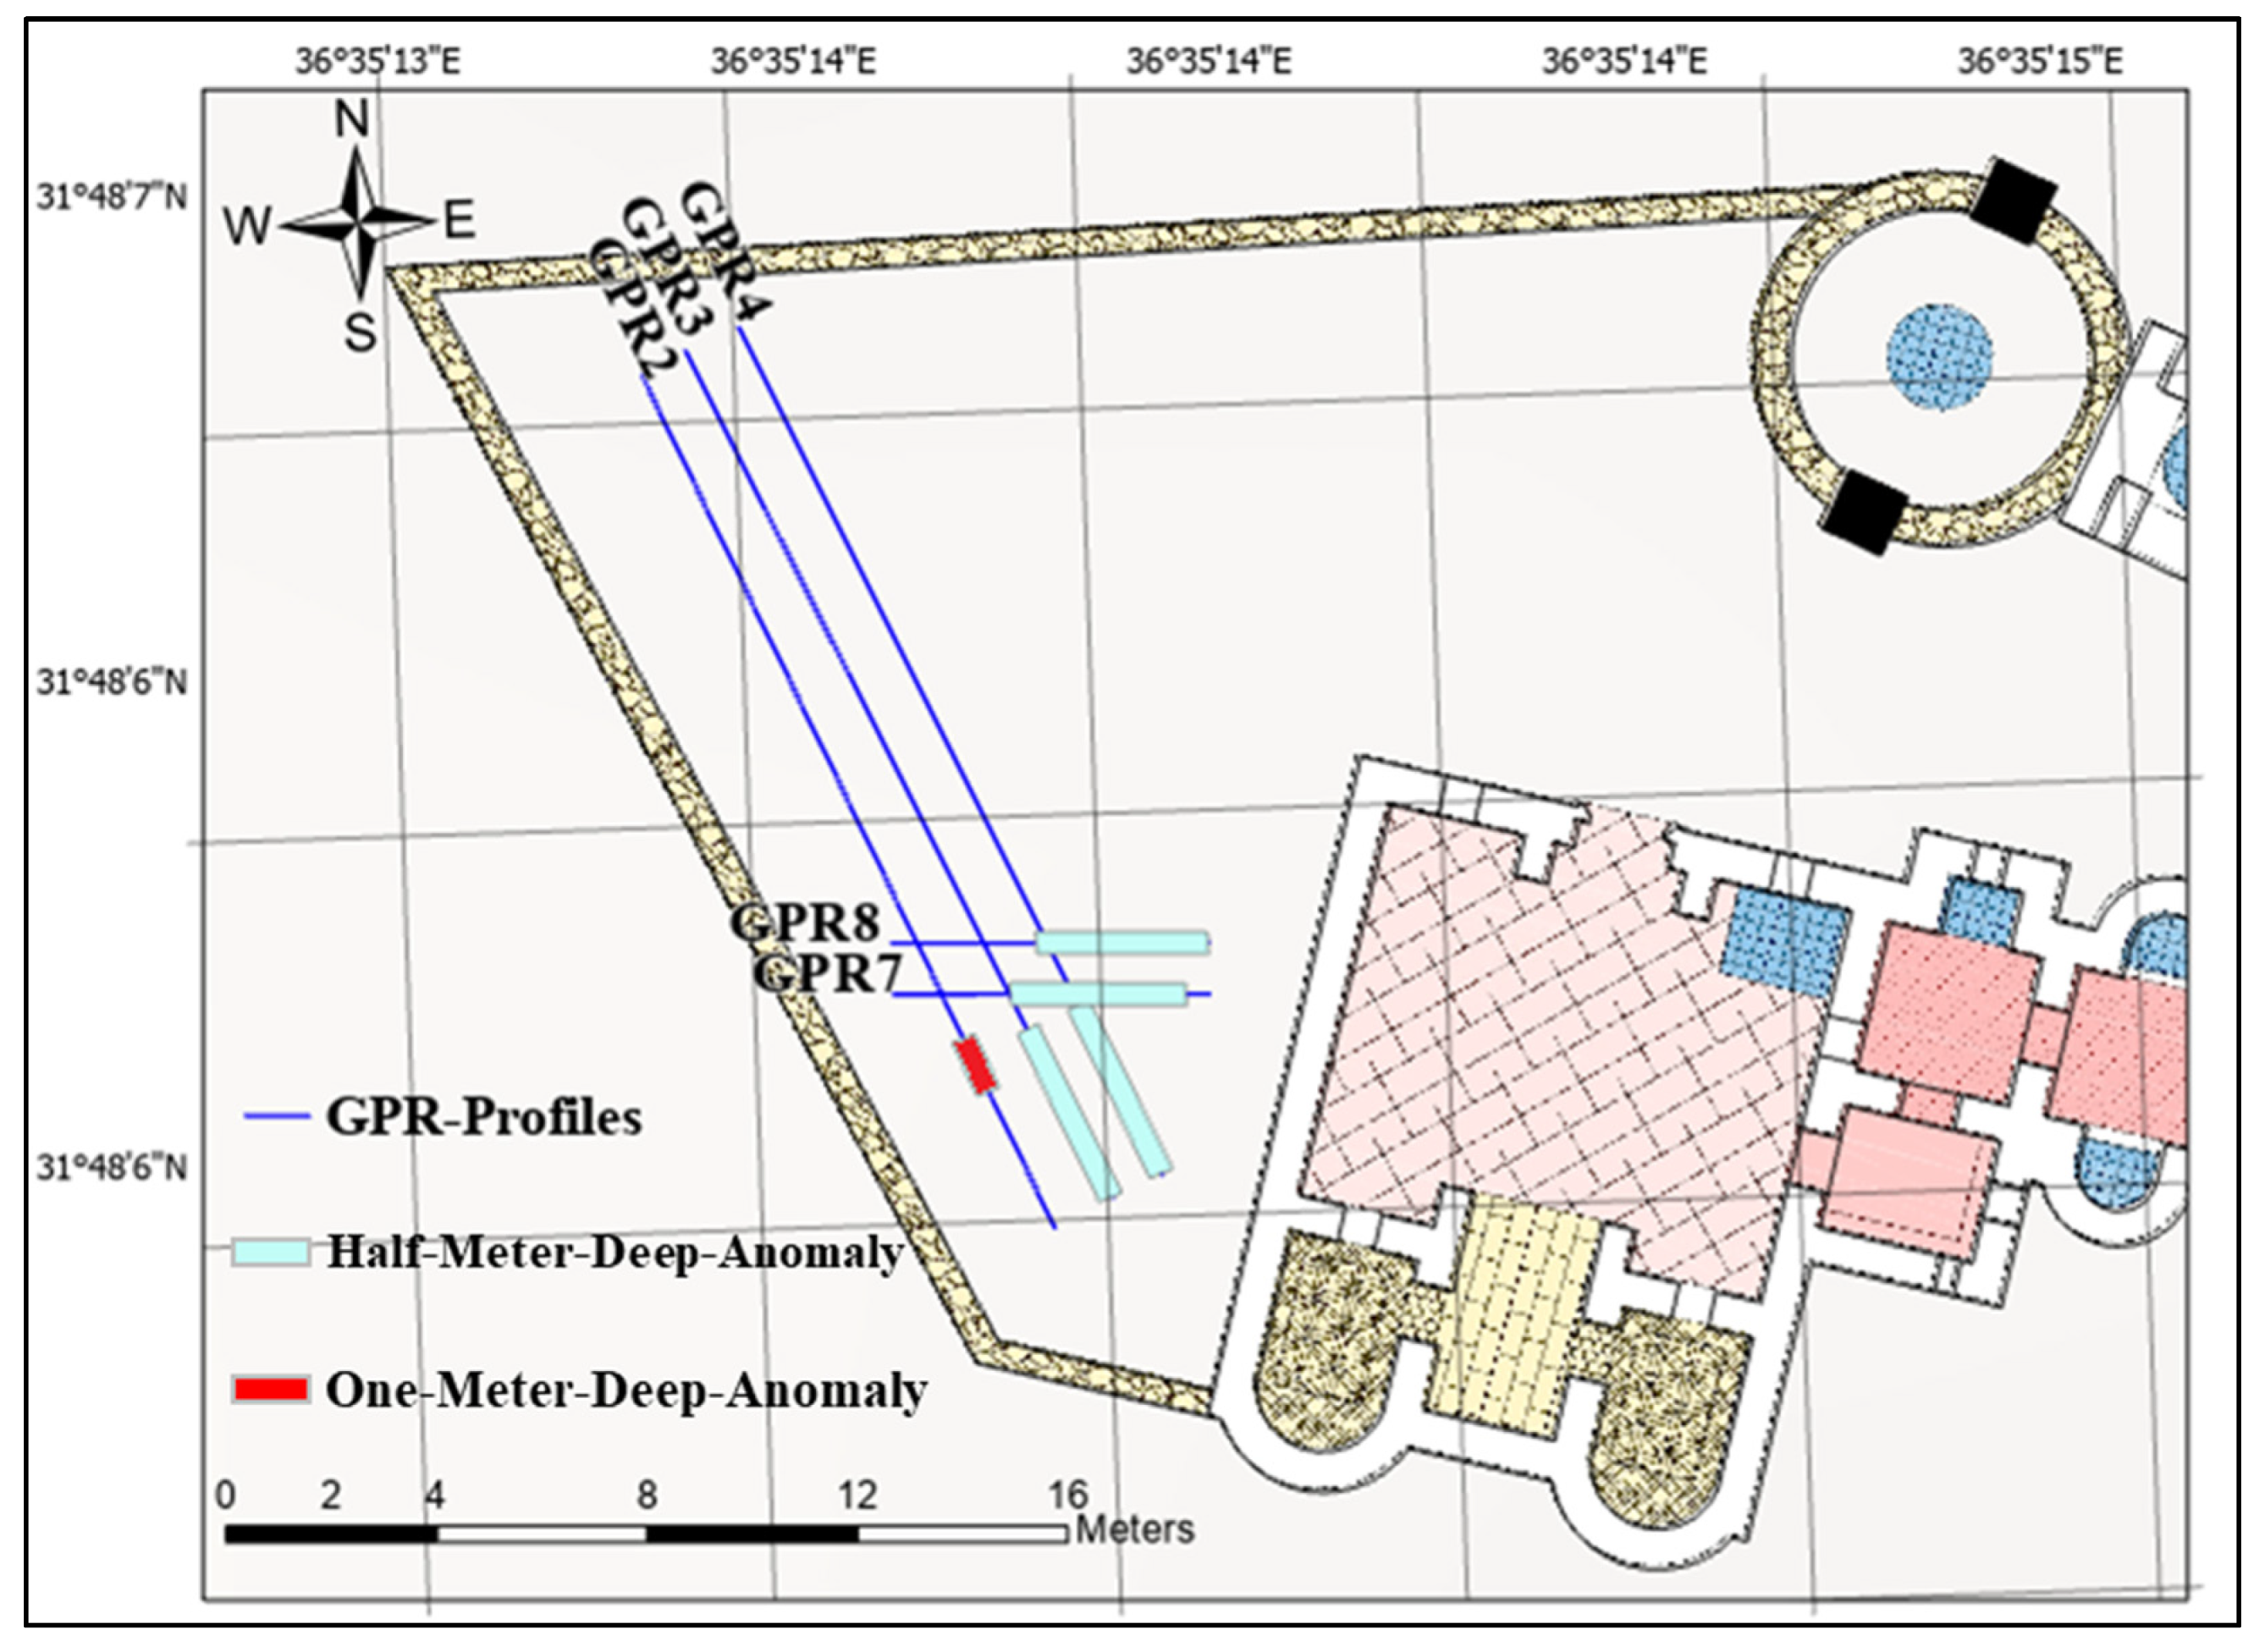
For this research, continuous GPR profiles were surveyed using the Subsurface Interface Radar System (SIRvoyer-20) developed by the Geophysical Survey System (GSSI), USA. The distance-measuring wheel attached to a 400 MHz antenna was used to measure the distance and all profiles accurately. A total of 93 m of GPR surveys were performed along 12 GPR profiles at three different positions on the western side of Qaser Amra, as presented in
Figure 15. At the first position, three 18 m-long northwest–-southeast-direction reconnaissance profiles were conducted with one-meter spacing (GPR2, GPR3, and GPR4). At the second position, four 6 m-long west–east direction profiles were conducted (GPR5, GPR6, GPR7, and GPR8). At the third position, five 3 m-long northwest–southeast direction profiles were conducted with half-meter spacing (GPR3D1, GPR3D2, GPR3D3, GPR3D4, and GPR3D5).
The collected GPR data were processed using the RADAN V software package from the GSSI. To improve the radar cross-section and reduce unwanted noise for the GPR signals, both horizontal and vertical high and low-pass filters were used. The horizontal scale represents the units of distance traveled along the transect line. The vertical scale is a time scale representing the amount of time it took for the radar pulse to travel through the medium and return to the antenna. Further processing using average radar wave velocity was applied to adjust the two-way travel times along the section to depth in meters. The data were then modified, and the horizontal and vertical scales were adjusted. Time-zero correction was then applied to the raw GPR data before processing them with range and display gain, filtering, color shifting, and migration techniques [
40].
3.4.2. GPR Profiles
The obtained GPR data were analyzed and displayed as 2D and 3D depth cross-sections providing vertical and horizontal logical resolutions for the top 2 m of the site [
41]. The vertical and horizontal axes of the GPR cross-section represent the two-way travel time in nanoseconds (ns) and the number of scans and travel distance profile in meters, respectively. The estimation of subsurface radar wave velocity is critical for converting the reflected signal’s two-way travel time to the reflector’s real depth. The calculated near-surface average velocity was 0.11 m ns
−1. Based on the analysis of the GPR cross-section, several targets were revealed, along with their shapes and extension, indicating that they were shallowly buried walls.
Initially, both the survey and GPR equipment were adjusted at established depths in the test site’s buried walls to enable the data to be utilized in computing the electrical permeability of the sediments. Moreover, the GPR anomalies were difficult to understand in some areas due to the lack of archeological and geophysical data for the studied area.
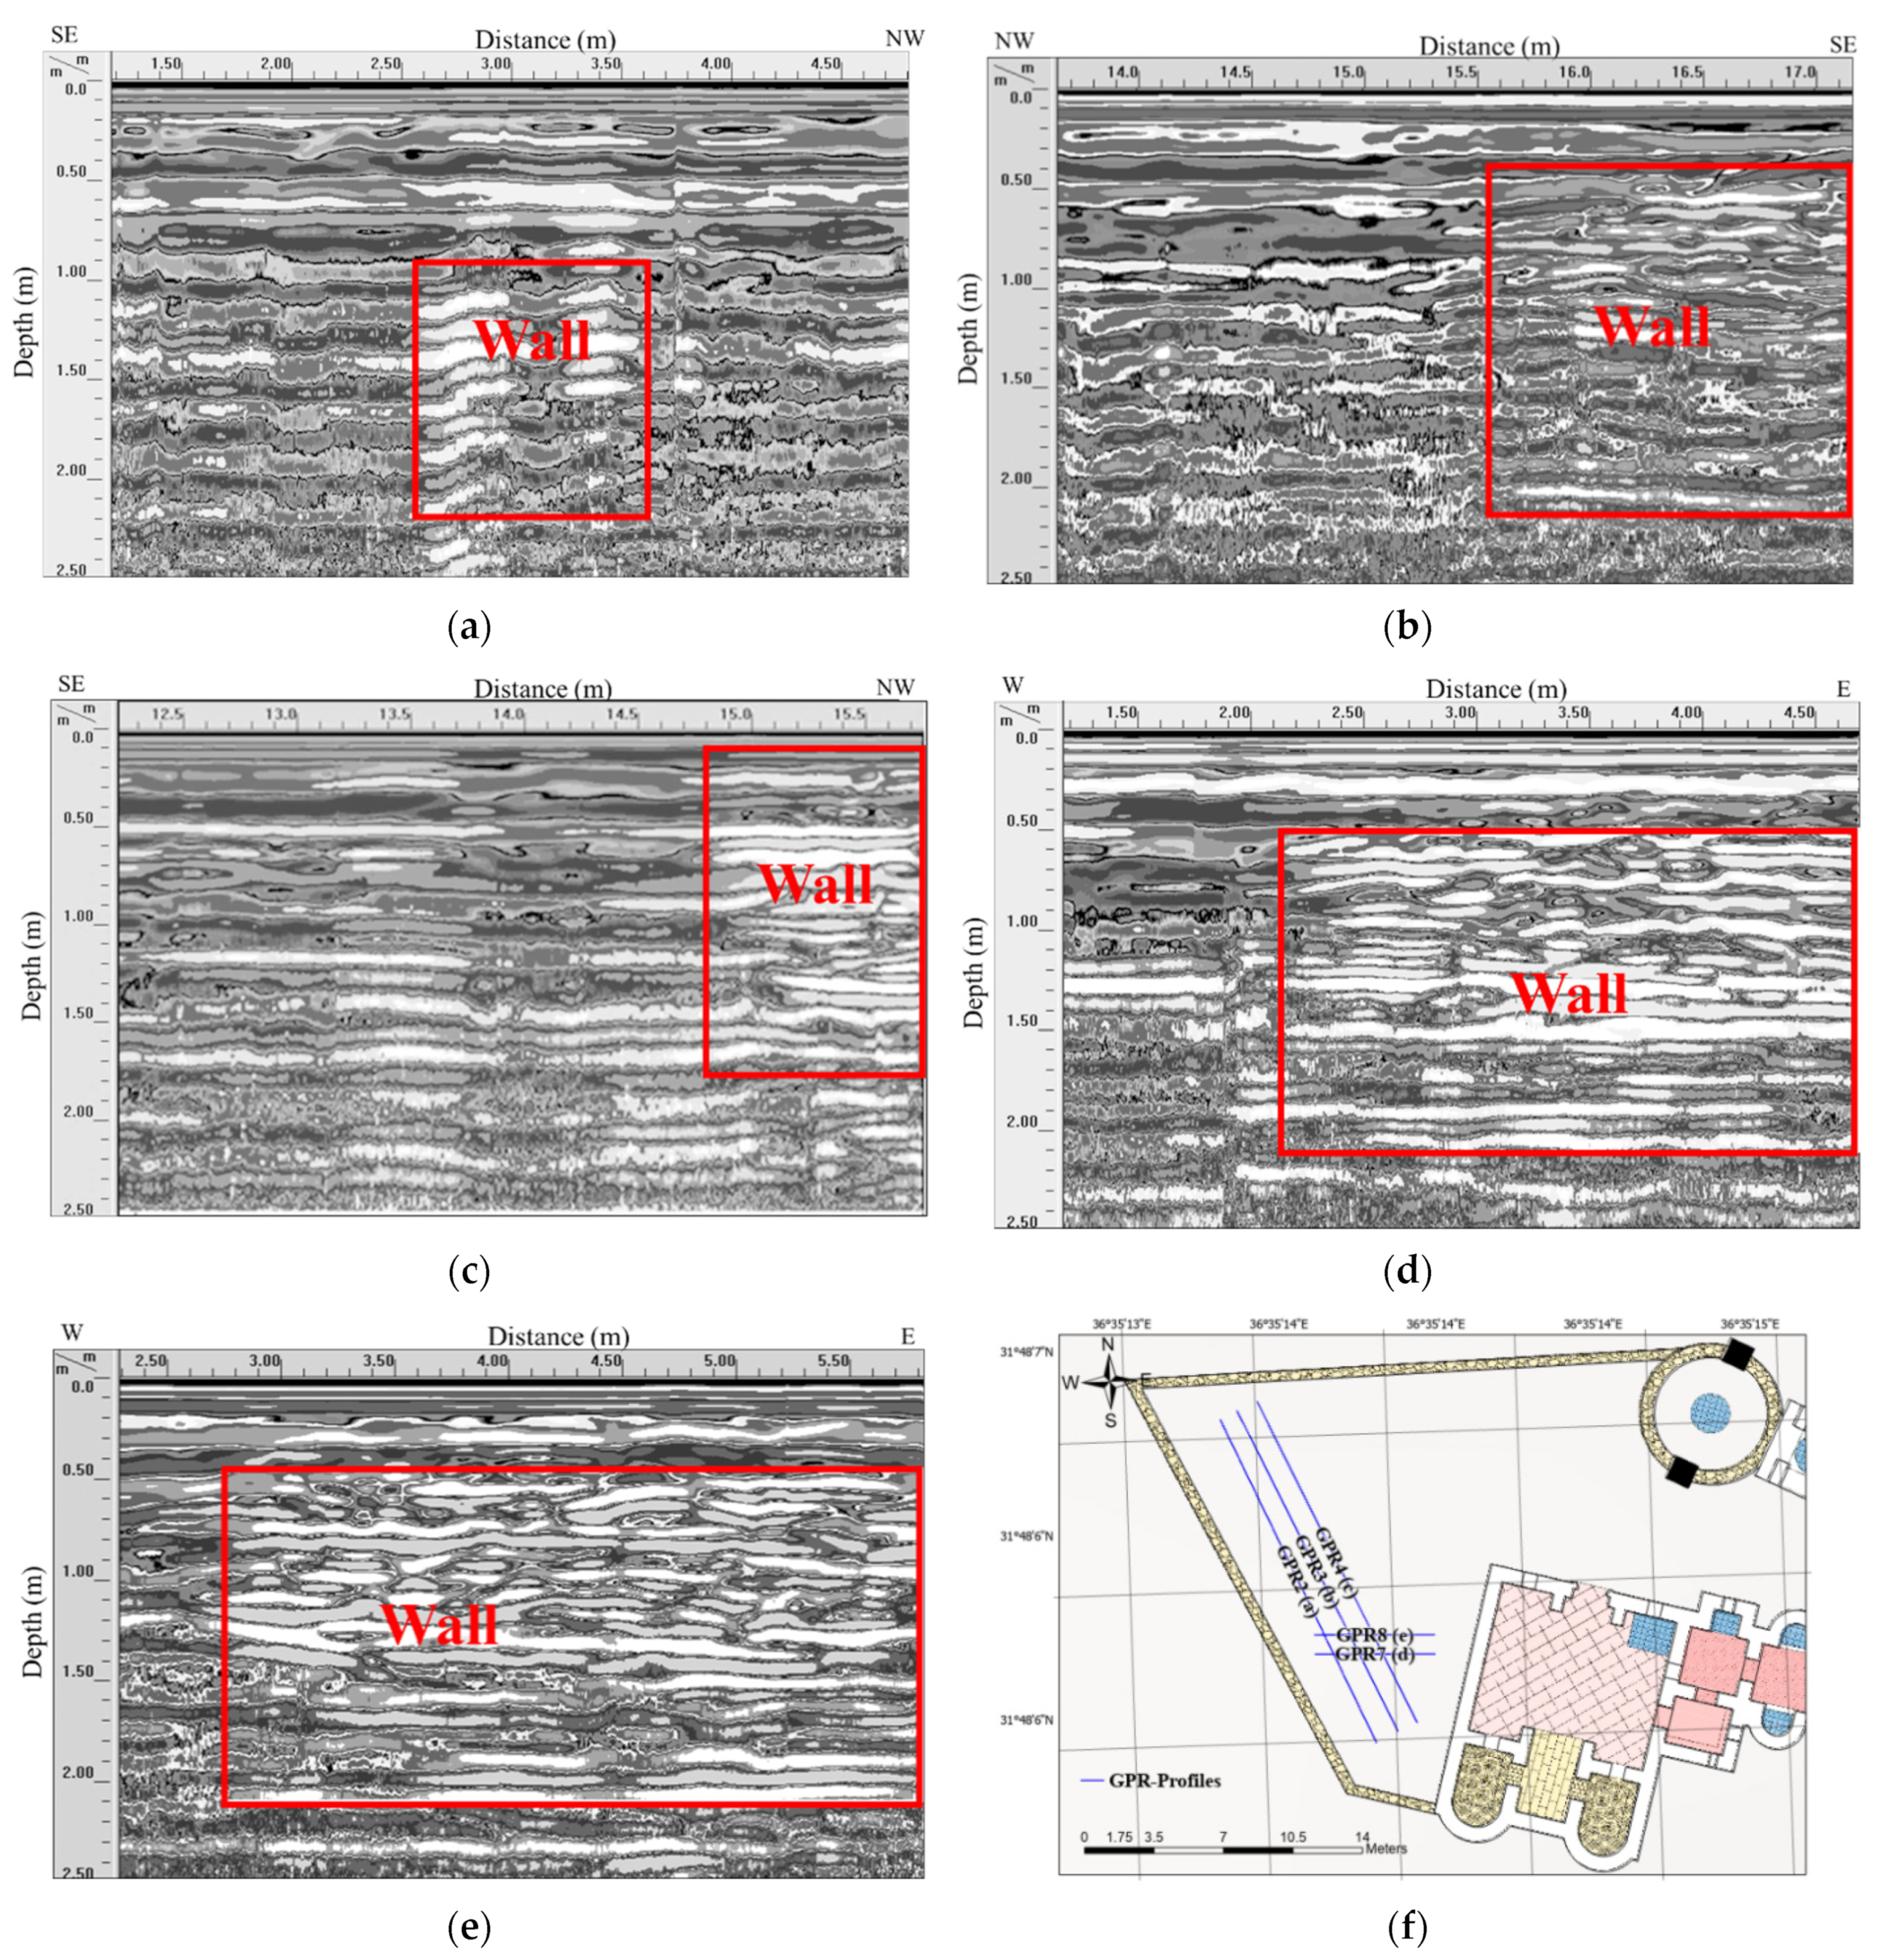
Figure 16 shows the radar cross-section generated by the GPR survey along the studied area (grayscale). The grayscale denotes the amplitude of the returning signal at each time and location. Profile GPR2 ran from northwest to southeast with about an 18 m distance. The radar cross-section along this profile showed the primary anomaly that extended approximately 1 m and was located at the beginning of the profile at about a 1 m depth, representing a buried wall, as shown in
Figure 16a. A similar anomaly could be observed at the end of profiles GPR3 and GPR4, but at a shallower depth of almost 0.5 m below the ground’s surface (
Figure 16b,c). Moreover, profiles GPR7 and GPR8 were 6 m long and located to the south of the study area, close to Qaser Amra, and ran perpendicular to profile GPR4. The radar cross-section along this profile showed a large anomaly that extended along the profile at an approximately 0.5 m depth, which may represent a buried wall, as shown in
Figure 16d,e. The anomaly observed in radar profile GPR8 in
Figure 16e, located between the 2.5 and 6 m markers at around a 0.5 m depth, was interpreted as a buried wall. There were no anomalies found along profiles GPR6 and GPR5. Finally, a unidirectional survey was performed along five profiles aligned about northwest–southeast and spaced 0.5 m apart to the north of profile GPR5.
The analysis of the GPR profiles detected anomalies that are interpreted as buried walls.
Figure 17 illustrates the location of the detected buried walls along GPR profiles and indicates the depth of these buried walls.
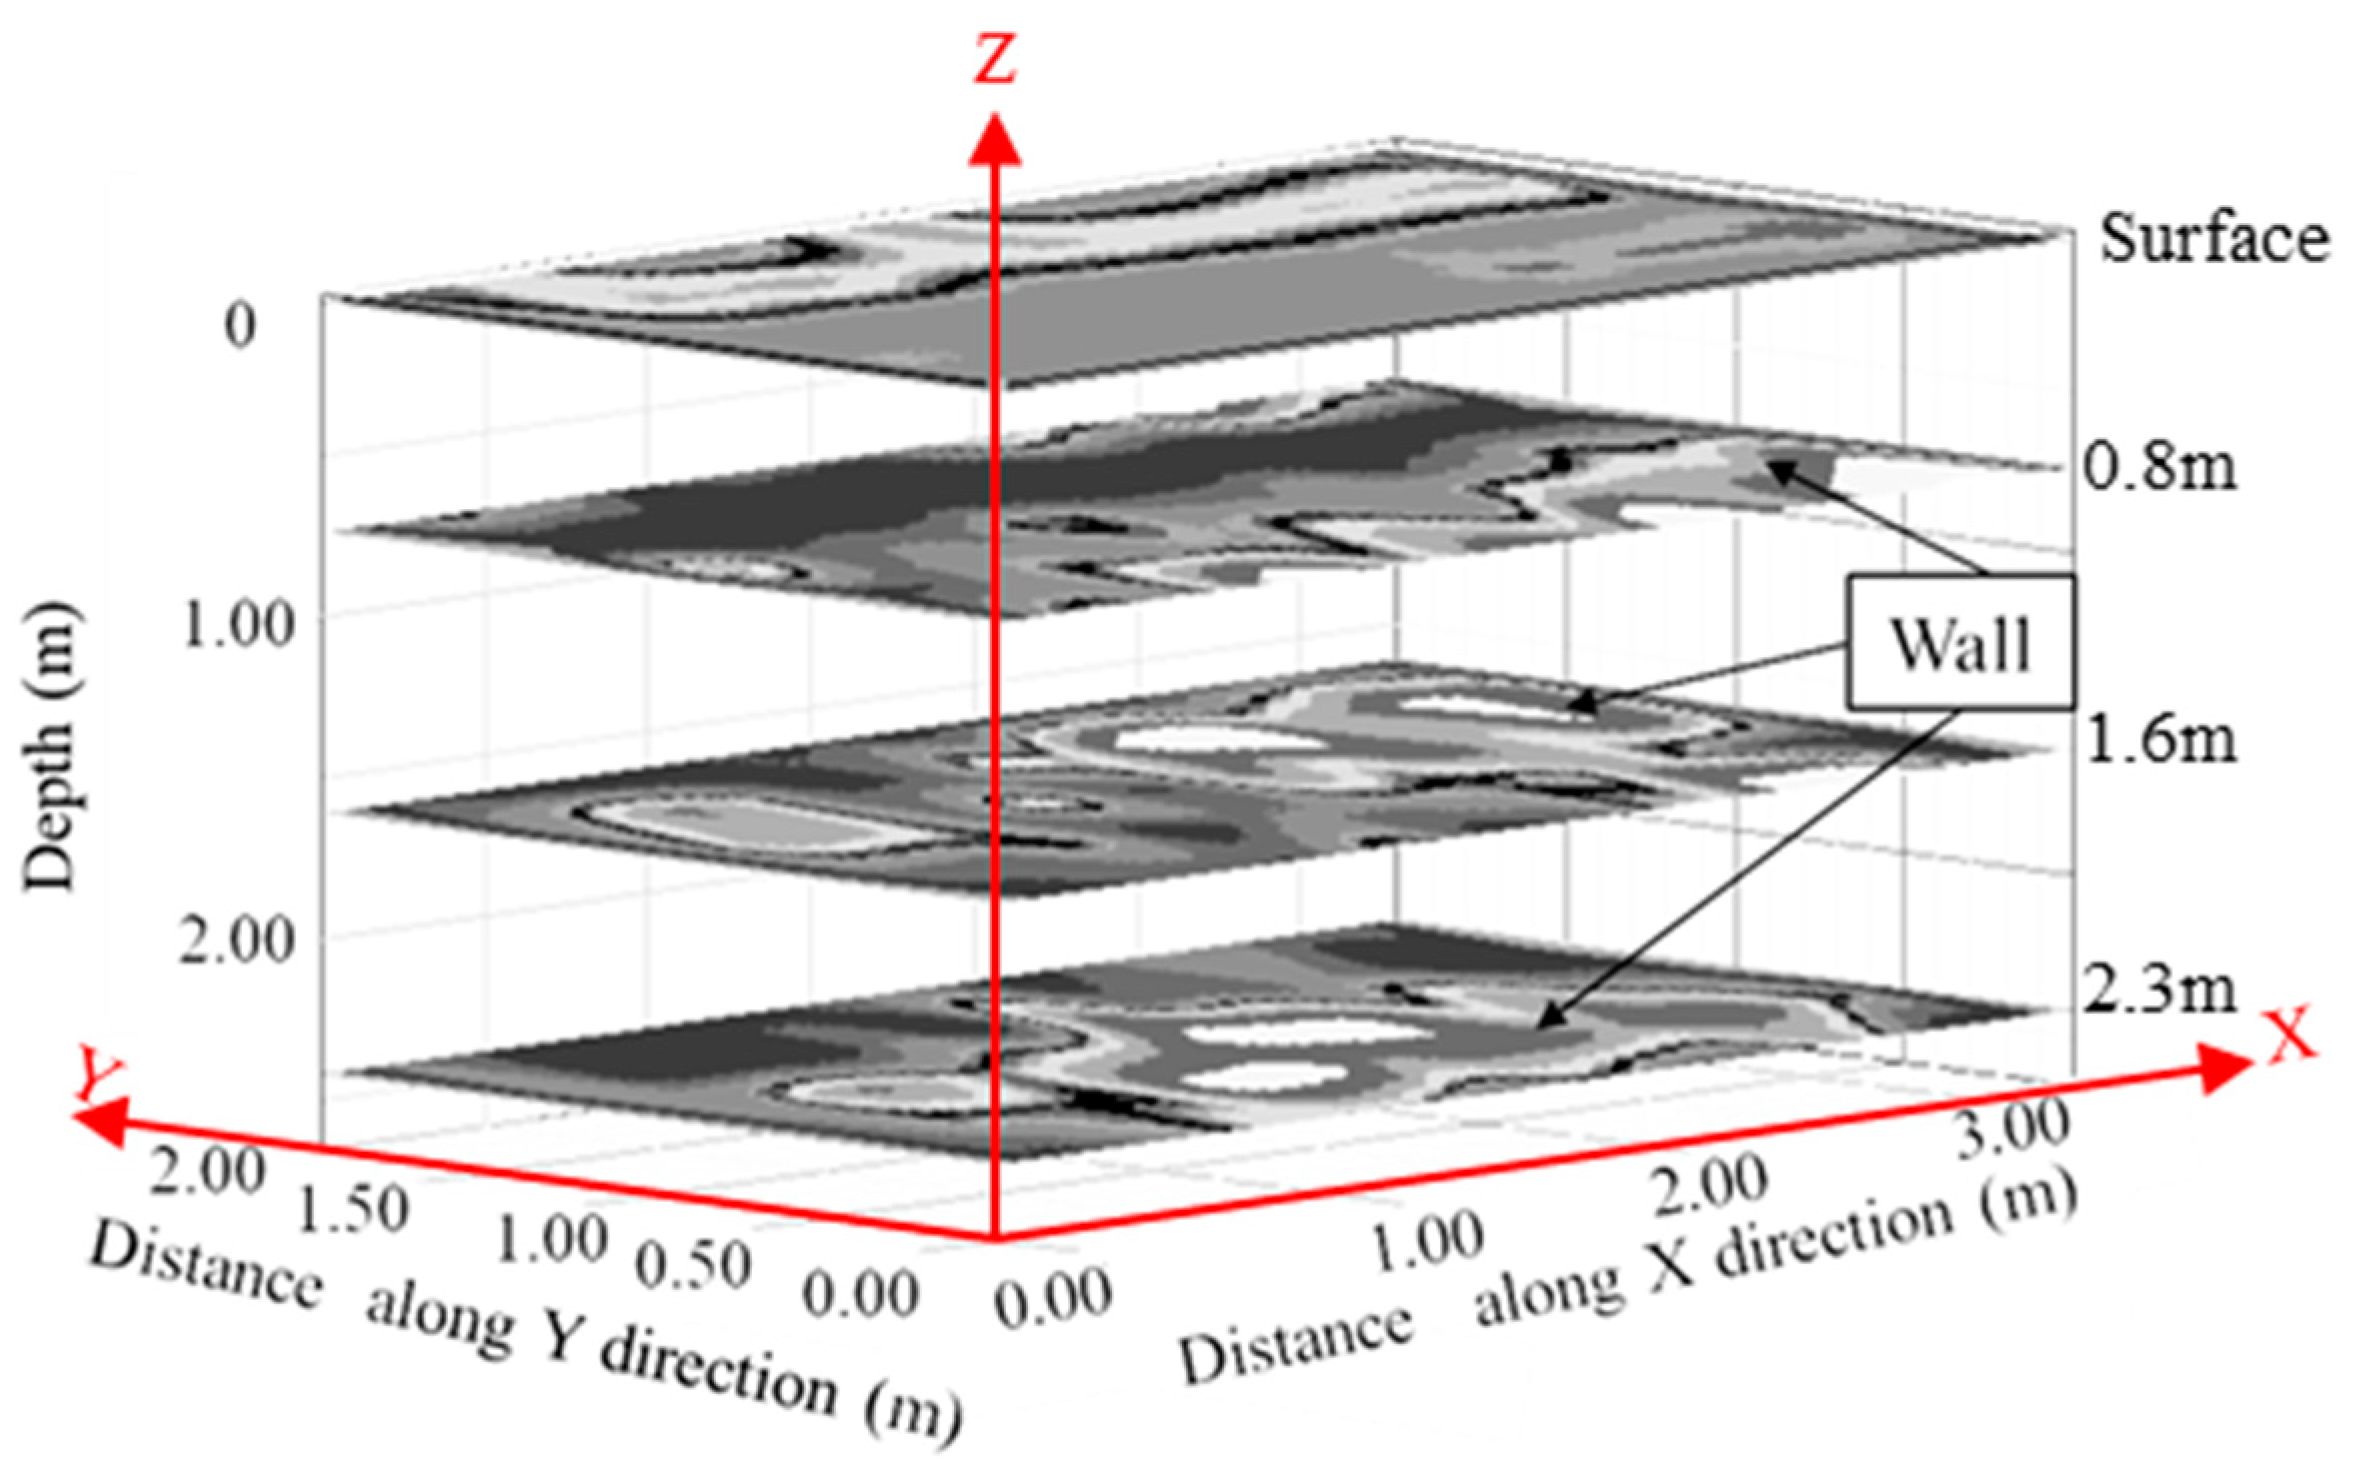
The 3D GPR data were generated from the 2D survey at the western part of Qaser Amra. The data were recorded along with the parallel profiles (unidirectional survey) with 0.5 m spacing. The horizontal depth slices at different depths (0, 0.8, 1.6, and 2.3 m) generated from the 3D plot are shown in
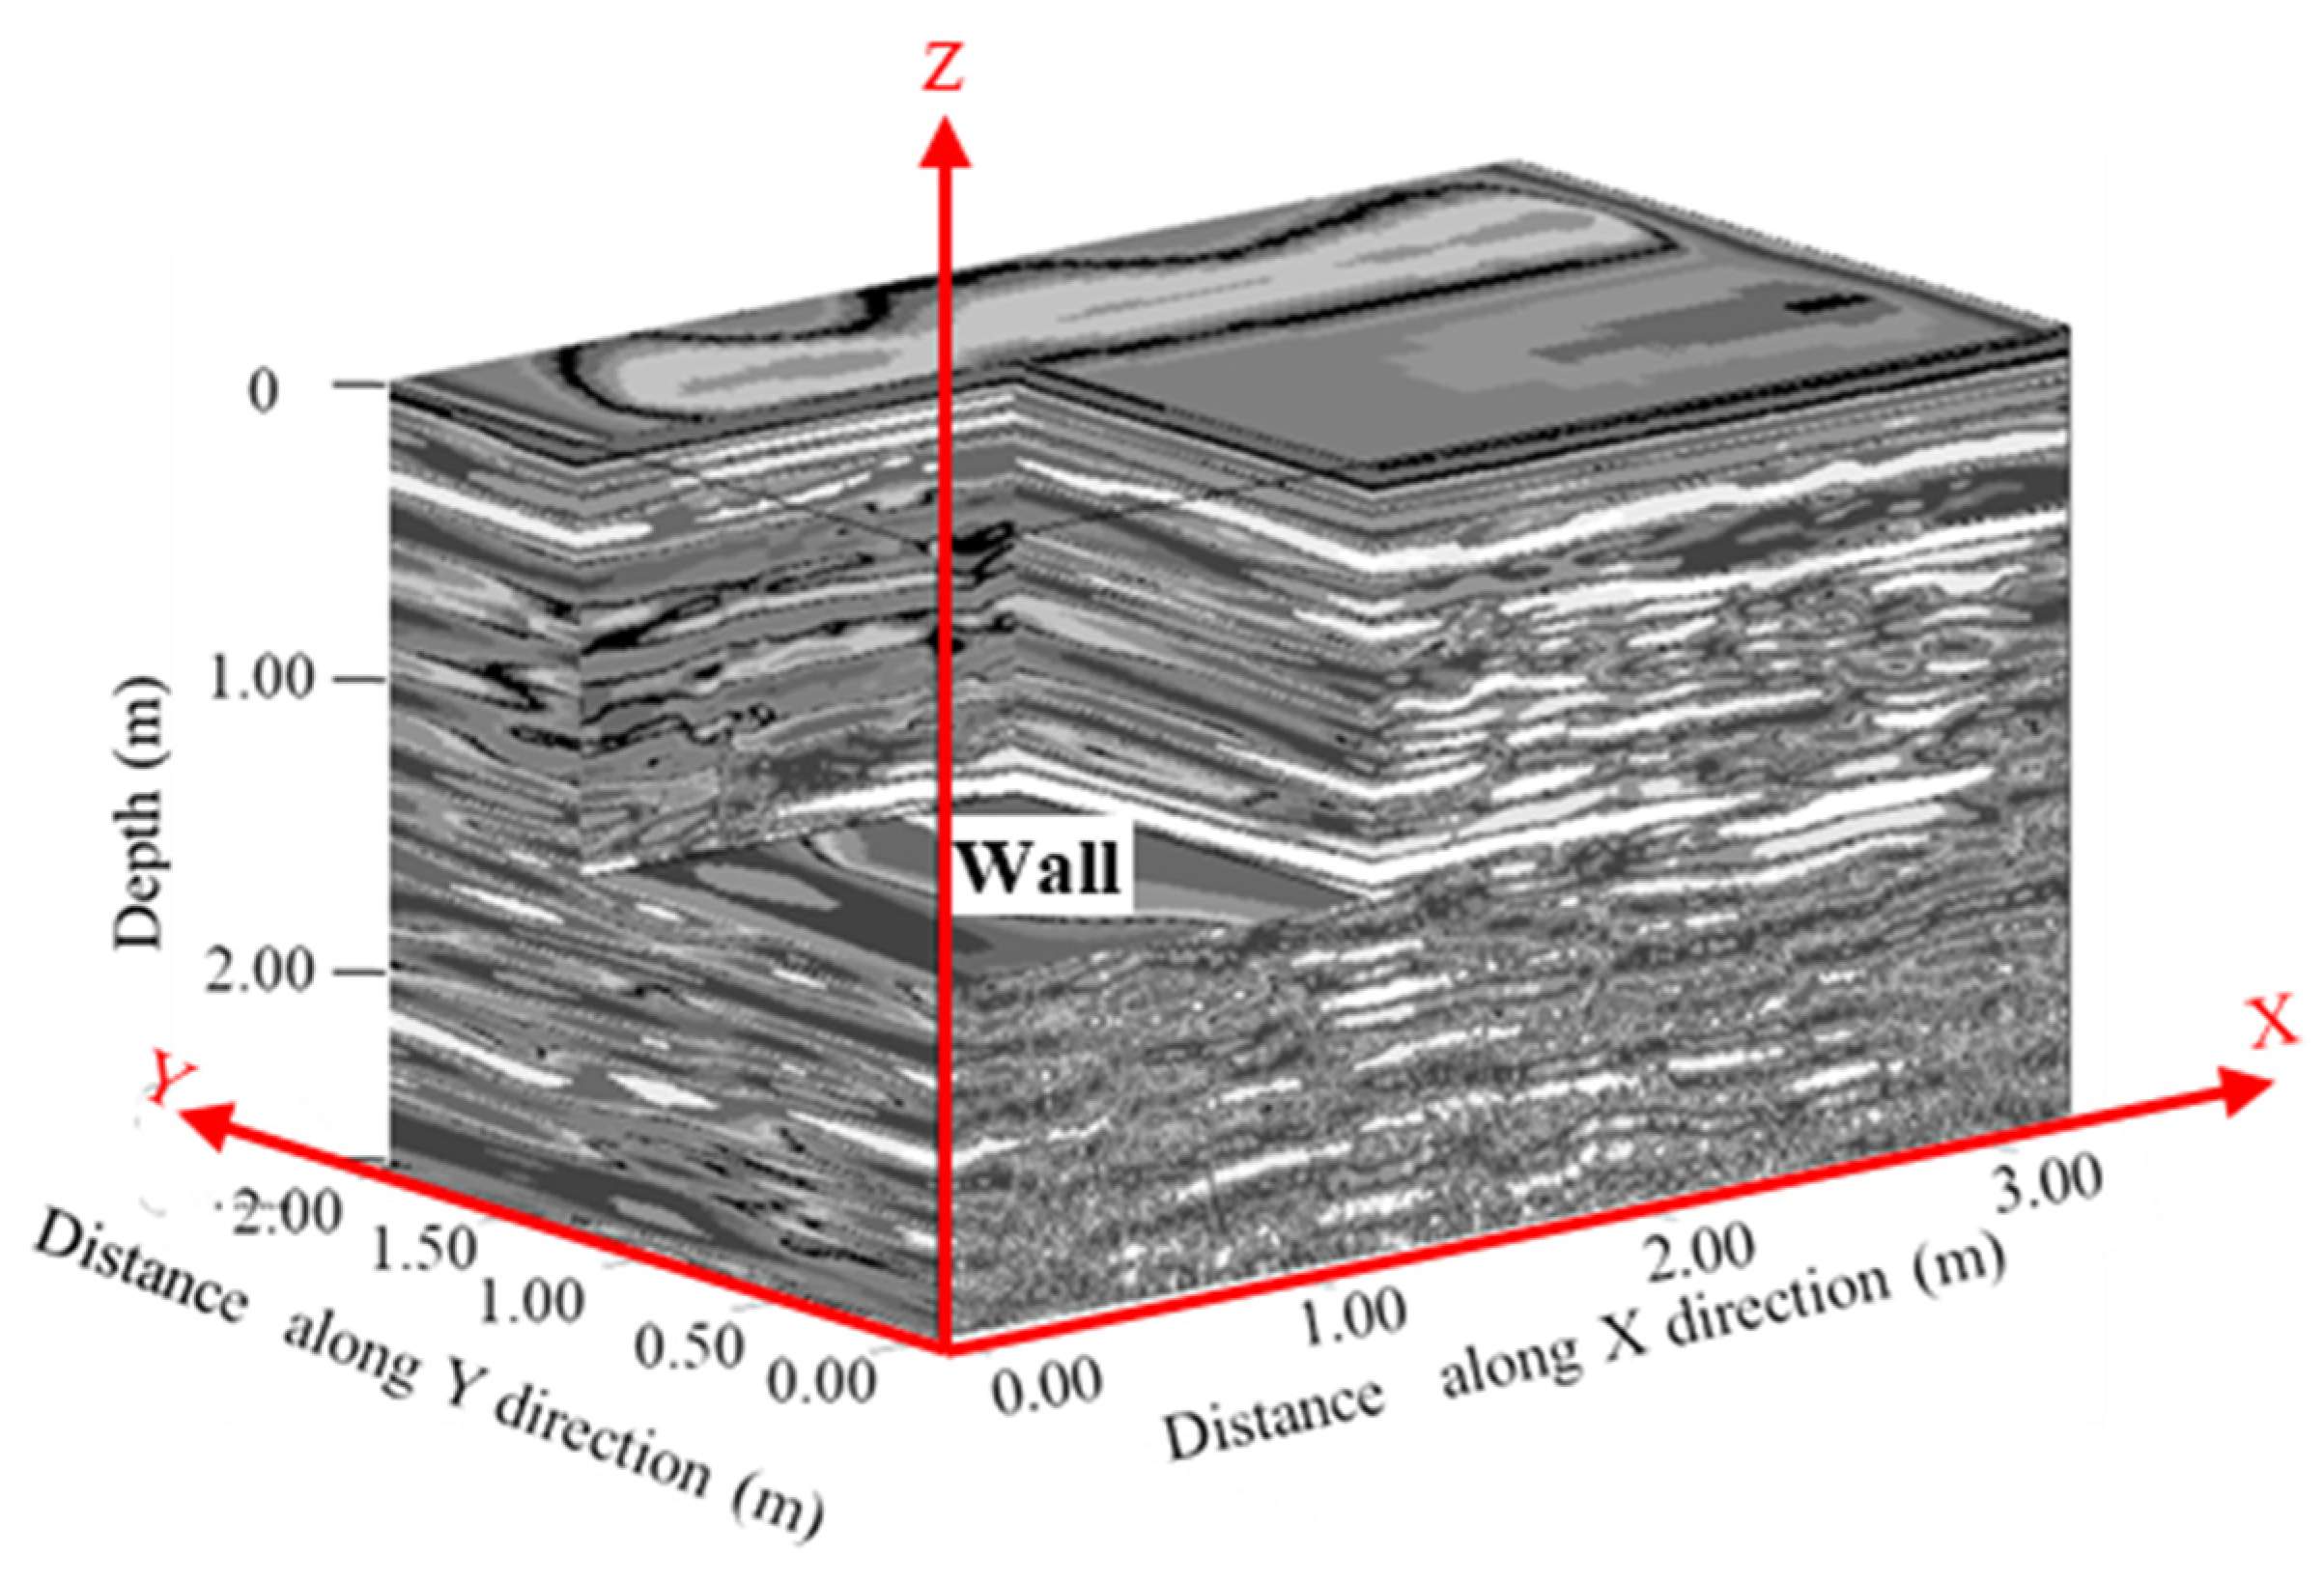
Figure 18. The location of the walls could be determined easily at different depths. The 3D section (cut-out cube) was applied at X = 1.3 m, Y = 1.5 m, and Z = 1.5 m, which clearly showed the depth and the extension of a wall, as illustrated in
Figure 19. Advanced filtering was applied to the GPR data to remove all surrounding materials and detect the anomalies’ actual location and the true location of the buried walls.
The fundamental advantage of this GPR technology is that it provides a non-invasive and non-destructive method to investigate a site or structure that does not require drilling, excavating, or modifying its original composition or shape, which is essential in historical areas such as Qaser Amra. The anomalies along the majority of the GPR profiles can be interpreted as walls in most cases. Some of the detected anomalies could indicate wall sections that were damaged or missing due to natural disasters, such as earthquakes or human intervention, including wall destruction, removal, or rehabilitation. The GPR outcomes could be used to guide future excavations.
3.5. Integrated 3D Archaeological Model
The key concept behind 3D modeling is to create a model of a structure that accurately captures the actual dimensions and shape of its features. The 3D modeling of Qaser Amra was developed from the 3D creation based on GIS, known as 2.5D. Additionally, the model was further enhanced using the data obtained from the close-range photogrammetry to add the actual texture and colors of Qaser Amra to the model. Moreover, the data collected from the techniques discussed in the previous sections were integrated with the GIS as layers to generate various details, such as boundary maps, point locations, transportation layers, hydrological maps, DEM, aerial images (ortho-rectified), satellite images, and land classification images. An integrated database was created to store these layers of information, along with the descriptive attributes necessary for updating and retrieving information, which could be used for managing the site.
Figure 20 presents digitized GIS features, including buildings, streets, parcels, and other features.
4. Conclusions and Future Recommendations
This study presents an integrated methodology combining various geomatics and geophysical processing techniques to develop a 3D archaeological database. The methodology was applied to the important archaeological site of Qaser Amra in Jordan. Aerial and close-range photogrammetry, GIS, and GPR techniques were integrated to capture essential data and build multi-layered data and information models of the site. Photogrammetric processing was conducted to obtain topography data and generate high-resolution orthophotos and DEMs from aerial stereo images. The GIS vector layers and the control points used in photogrammetric processing were generated through GIS processing using GPS and map data. A 3D textured model was developed using close-range photogrammetry. Upon applying the geomatics techniques, GPR was utilized to reveal subsurface anomalies at the Qaser Amra archaeological site. The lack of archaeological information around the subsurface condition of Qaser Amra was complemented through applying the GPR technology. The flat topography of the archaeological site enabled obtaining high-quality GPR data. As observed from the results of this study, the 3D images produced outputs with higher resolution compared to the 2D profiles. The GPR survey in this study was conducted to identify and map the depth and extension of the covered walls. Anomalies were accurately detected and located using a spatial-extent 3D survey based on vertical sections, depth slices, and 3D images. The anomalies were detected at shallow depths from approximately 0.5 m to 1 m below the ground’s surface and extending to a depth of 2.5 m.
The proposed methodology provides necessary data that could be of added value to ministries and government agencies for archaeological documentation, conservation, and management. It can be further evaluated in terms of its potential in modeling other sites. Further research can be conducted to examine the potential of applying the proposed methodology to other applications, such as determining utility locations while undergoing maintenance and selecting construction areas.


 ,
, 


