Communication

Anthropogenic Illumination as Guiding Light for Nocturnal Bird Migrants Identified by Remote Sensing

1
Nowcasting and Intelligent Traffic Weather Research Group, Finnish Meteorological Institute, 00560 Helsinki, Finland
2
Institute for Atmospheric and Earth System Research, University of Helsinki, 00560 Helsinki, Finland
*
Author to whom correspondence should be addressed.
Remote Sens. 2022, 14(7), 1616; https://doi.org/10.3390/rs14071616
Submission received: 7 March 2022 / Revised: 24 March 2022 / Accepted: 25 March 2022 / Published: 28 March 2022
(This article belongs to the Special Issue Monitoring Bird Movements by Remote Sensing)

Abstract

:
Migrant birds rely on environmental and celestial cues for navigation and orientation during their journeys. Adverse weather, such as heavy rain or fog, but also thick layers of low-level clouds, affect visibility and can challenge birds’ ability to orientate. Therefore, birds typically favour certain meteorological conditions for migration. Photopollution from artificial lights outdoors and radiated from buildings is known to negatively affect nocturnal migrants’ flight behaviour and trajectories, which may lead to collisions with human infrastructure. Positive effects of artificial light have been identified in some stationary birds, e.g., for extended foraging hours, though not during migration. In the present study, we show the effect of artificial light on the concentration and flight directions of migrating birds during overcast conditions in the peri-urban woodland in Southern Finland. Overcast conditions, by low-level clouds, prompted birds to migrate at low altitudes. Instead of spatially homogenous large-scale migration patterns, birds were observed to adapt their flight directions, in accordance with the artificial lights of the urbanized area. By using dual- and single-polarisation weather radar data we were able to study small-scale patterns of bird movements under the influence of low-level cloud layers. These cases show the remarkable capability of the existing weather radar networks to study bird migration.

Graphical Abstract

1. Introduction

During migration, birds rely on a variety of environmental cues for orientation, using landmarks as leading lines, the magnetic field, the sun, and stars [1]. Orientation ability is aggravated by adverse meteorological conditions, such as heavy rain or fog, but also low cloud cover [2,3,4]. In response to unfavourable weather, birds typically modulate their migration behaviour by either adapting flight directions, flight altitudes (e.g., to lower levels), or landing [1,5,6]. At night, when birds use celestial cues and the magnetic field, there is evidence that overcast or foggy conditions, blocking the access to skylight, disable the light-dependent magnetic compass used by birds. Simultaneous impairment of visual and magnetic cues may lead to disorientation [7]. Poor visibility and disorientation then force birds to adjust their flight paths, land in large numbers, or resort to seeming alternatives, such as anthropogenic light, for orientation [8]. However, artificial light at night (ALAN) of specific wavelengths negatively interferes with the magnetic compass [9,10]. Birds’ natural attraction to light, especially to continuous sources [11], and the detrimental impact of ALAN on nocturnal migrants’ behaviour has been highlighted by many studies, especially in the context of collision risks with a variety of human infrastructures (e.g., reviewed in [12,13]). A global evaluation of threats imposed by light pollution was given by [14]. Studies investigating birds’ response to artificial light have employed a variety of tools, amongst others, weather radars (e.g., [15,16,17,18]). By using weather radars, [19] revealed the greatest density of birds being around brightly lit cities in the US. The impact of ALAN in and around European urban areas is poorly understood, but recent findings indicate changes in call activity in migratory birds [20]. Besides, many studies indicate a complex of light-related hazards, with respect to offshore windfarms and oil platforms, during bird migration periods (e.g., [10,21]). Positive effects of ALAN on birds have only been reported in combination with some resident bird species, which, e.g., extend foraging hours or explore new food resources at night (e.g., [22,23,24]). However, to the best of our knowledge, there are no similar accounts of cases of bird migration where ALAN would have, in some way, favoured birds’ journeys.
Here, we discuss two coincidental findings of bird migration in meteorological conditions adverse to nocturnal migrants’ orientation in a rural area with scattered settlements in Southern Finland, in which ALAN may have served as orientation aid at night. We contrast these cases with migration in clear sky conditions by combining dual- and single-polarisation weather radar data with satellite imagery of ALAN and ceilometer measurements.

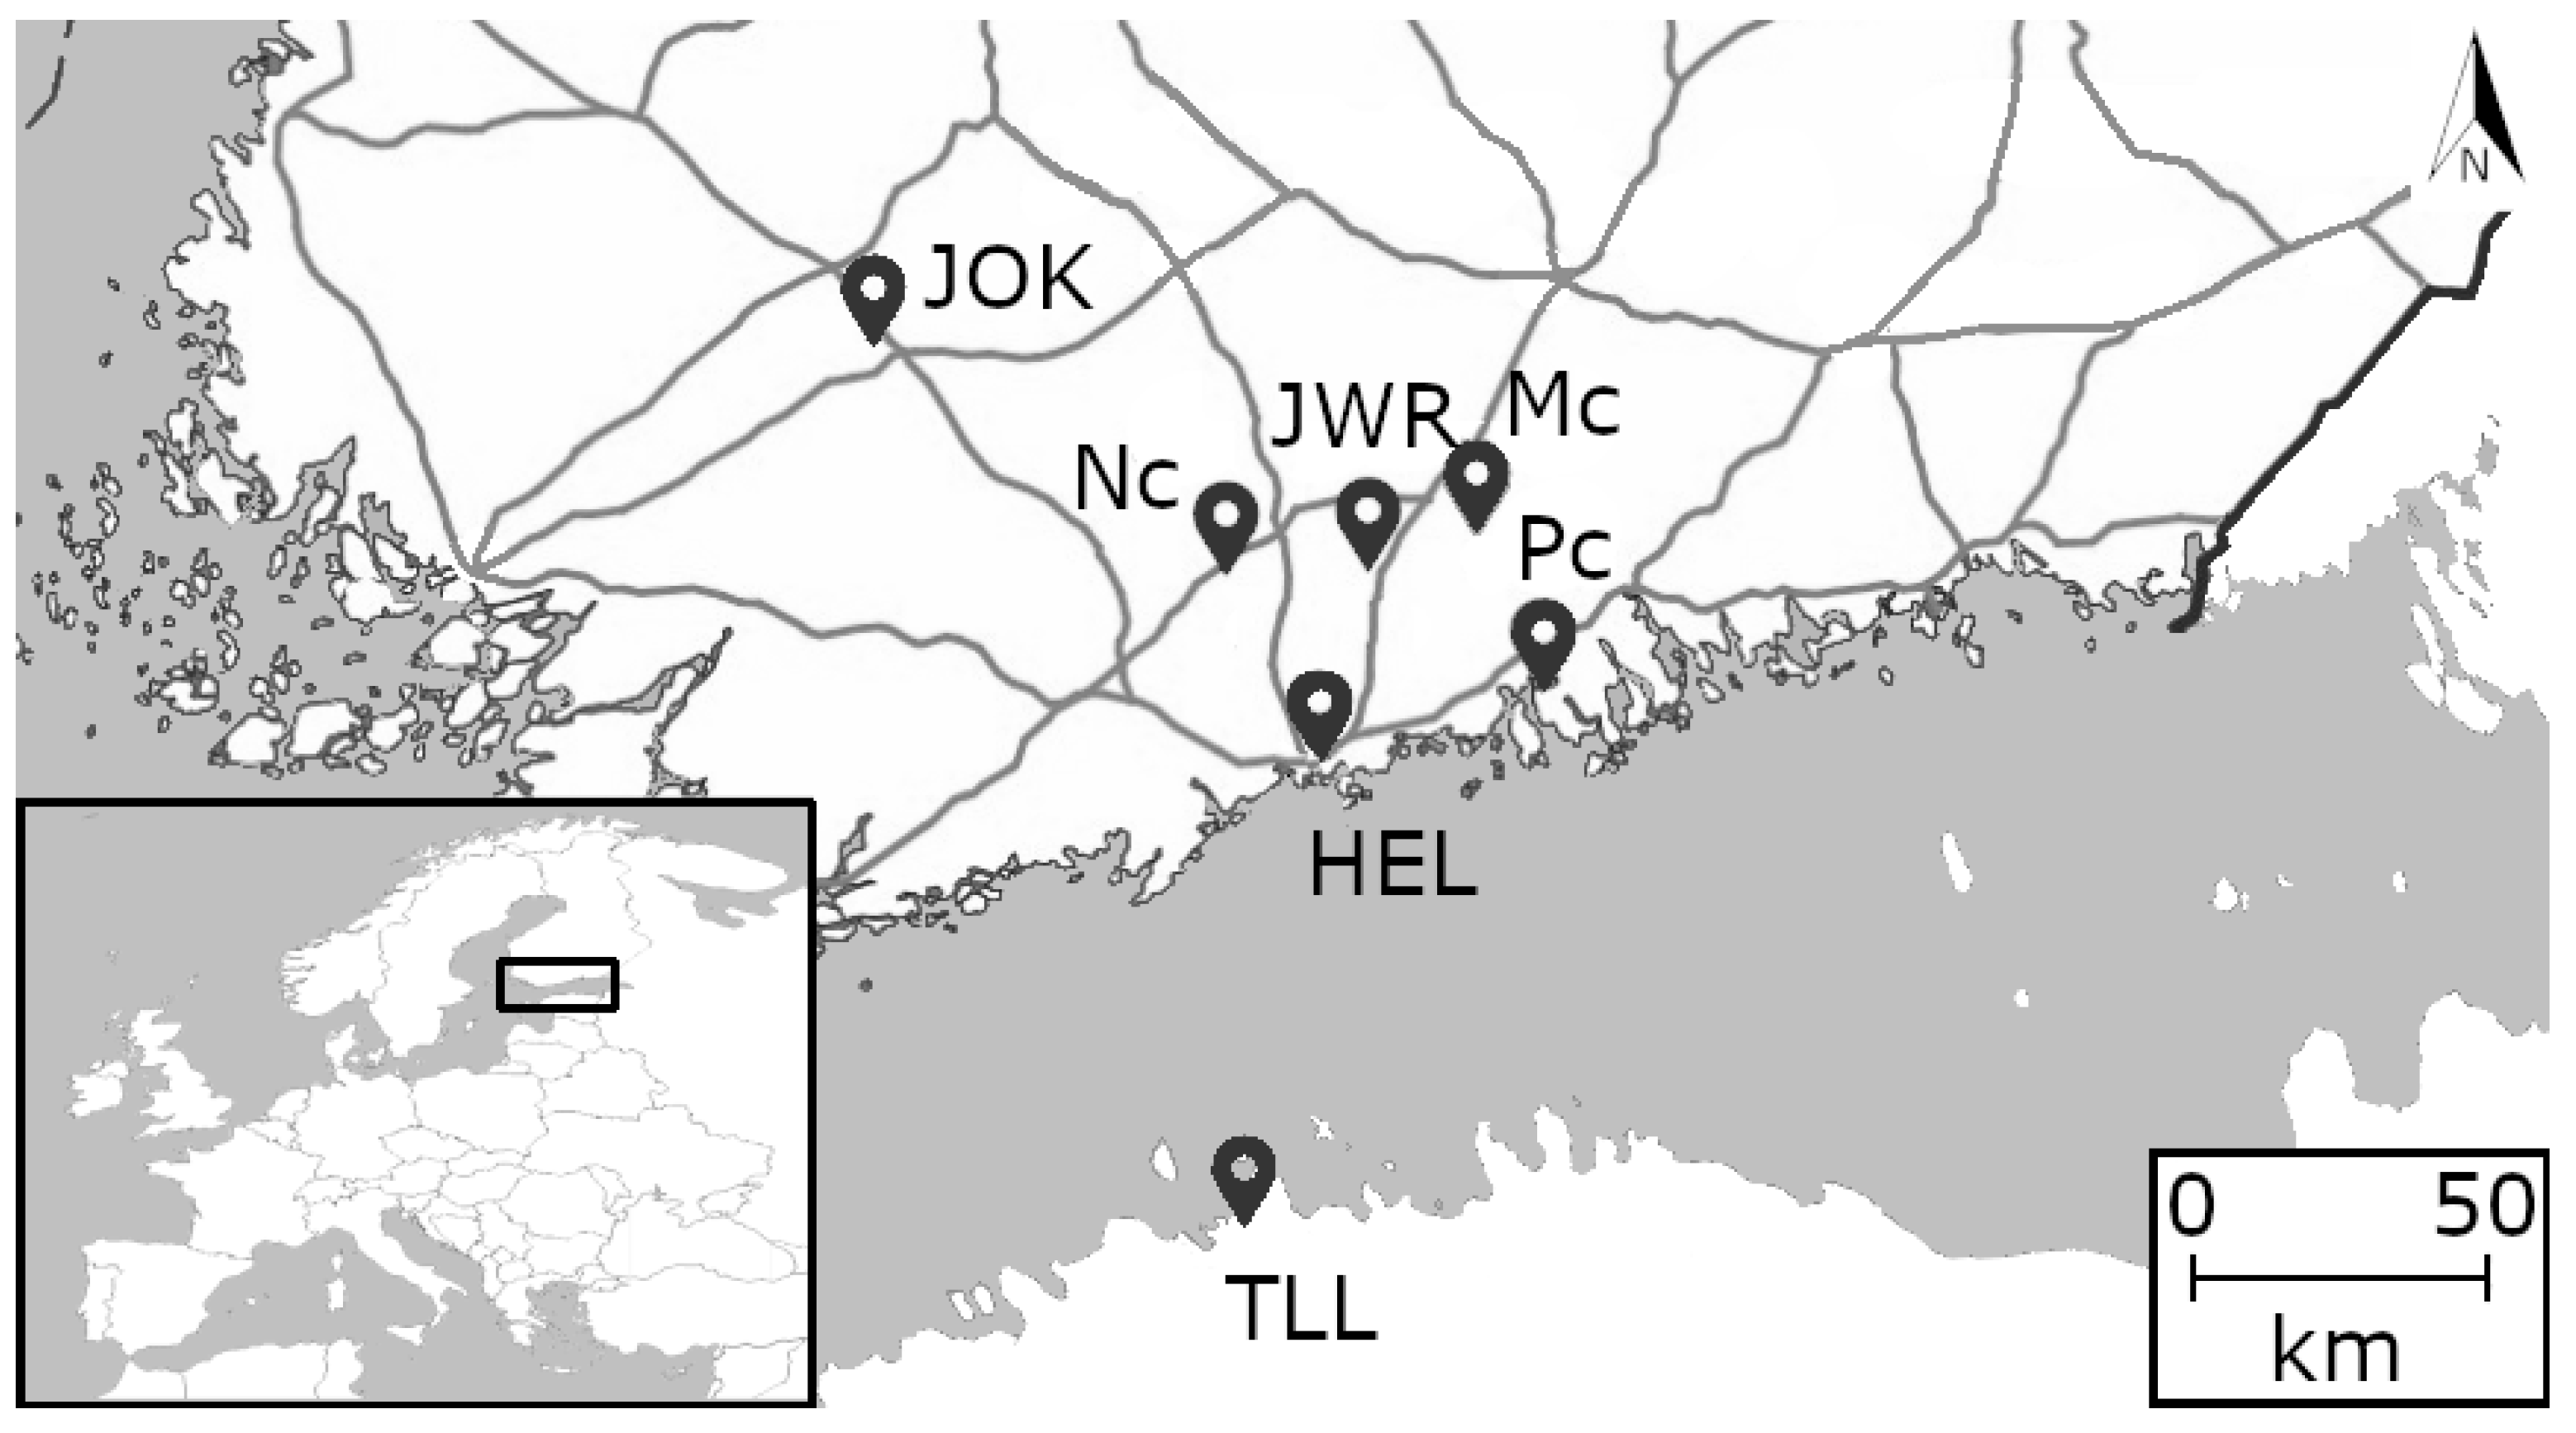
2. Materials and Methods

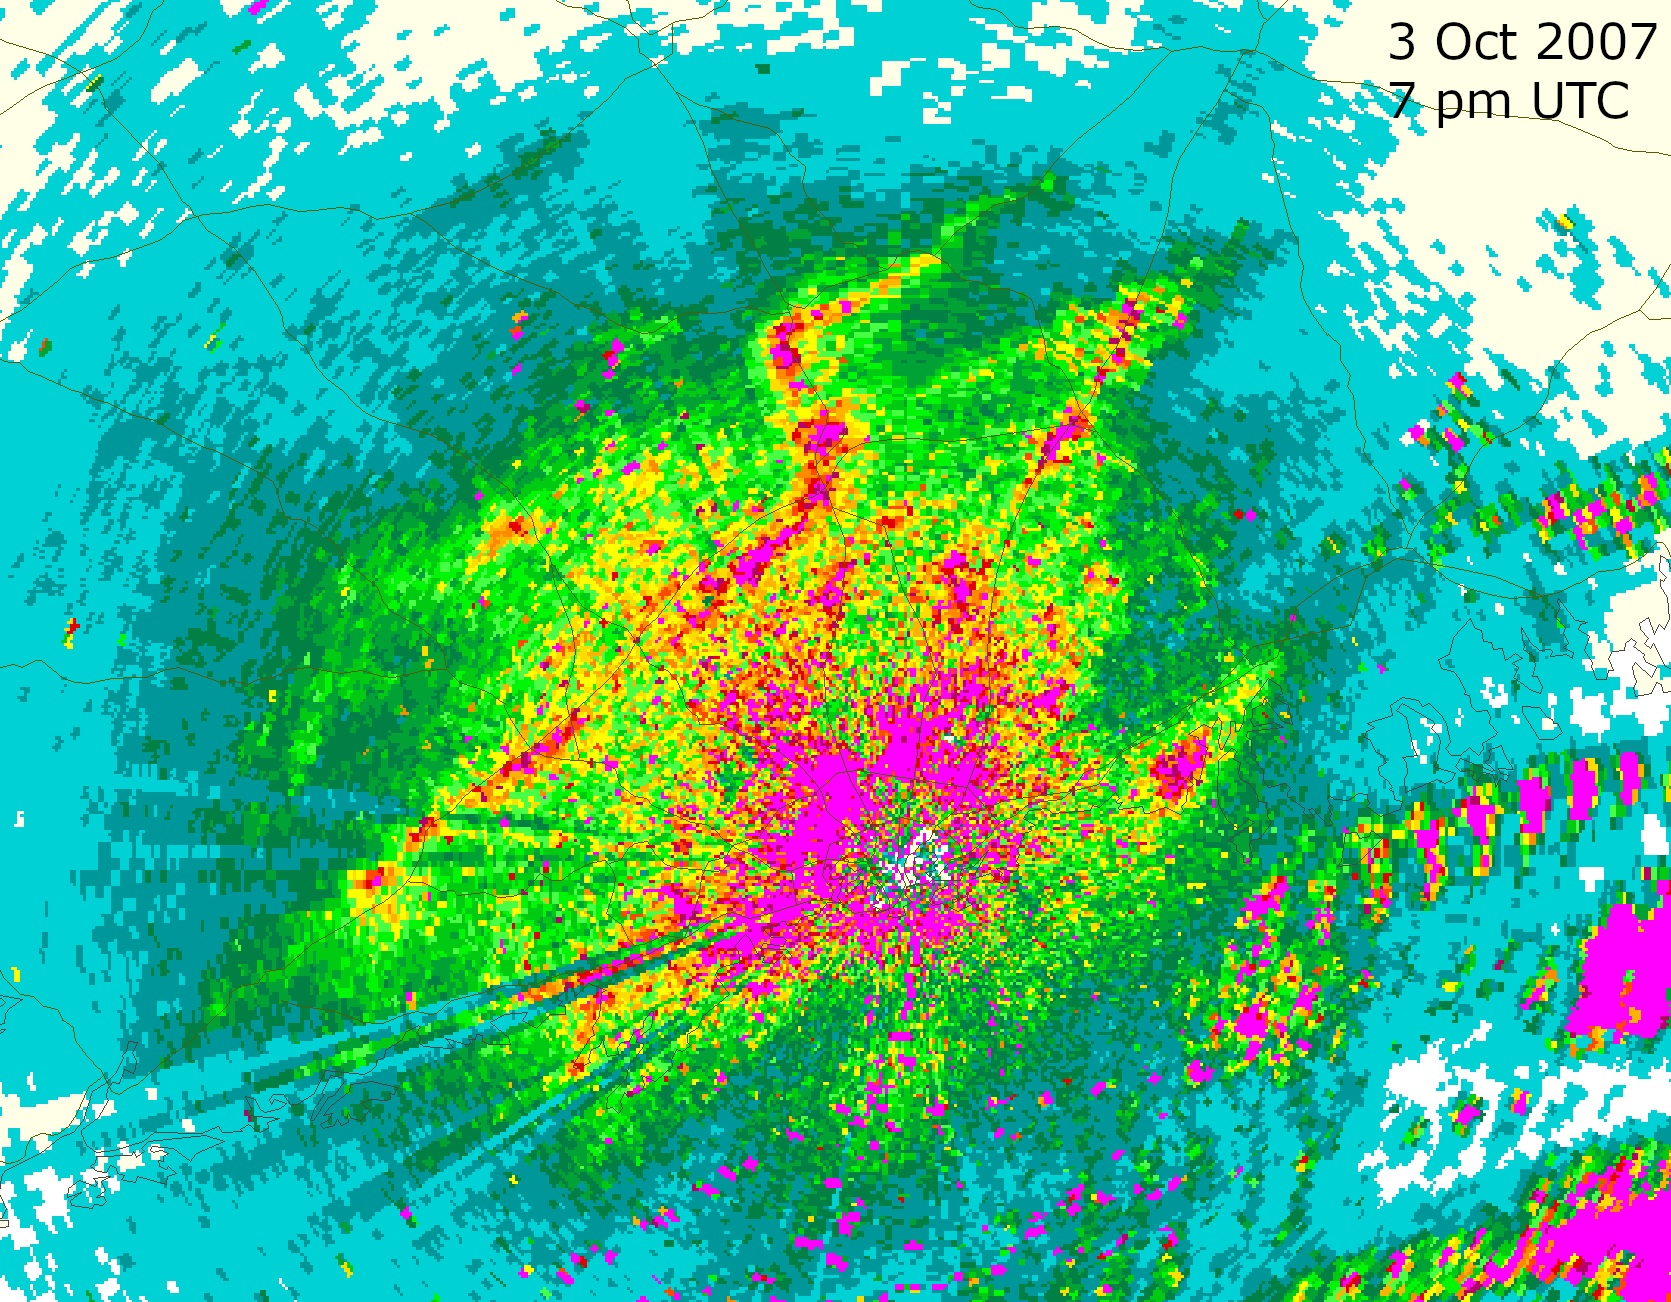
2.1. Weather Radar Measurements

Radar data were collected as plan position indicator sweeps (PPI) in October 2007 by two systems, a dual-polarisation C-band Doppler weather radar at the Kumpula Campus of the University of Helsinki, Finland, and a single-polarisation C-band Doppler weather radar in the city of Järvenpää, 32 km NNE of the Kumpula radar (Figure 1). In a PPI sweep, the antenna maintains its elevation angle constant, while rotating the azimuth angle through 360 degrees. The returns can then be mapped on a horizontal plane with the radar in the centre. The Kumpula radar is described as an aeroecological tool in [25], and the radar setup for hydrometeorological purposes has been discussed in [26].
The Järvenpää radar was operated mainly in vertical-looking mode but also performed PPI scans from an elevation angle of 30 degrees upwards. It recorded short periods with high-pulse repetition frequency (PRF, 1100 Hz) and small sample sizes of eight pulses, yielding measurements every 8/1100 s. This enabled high-resolution recordings of wing beat patterns of birds flying across the radar beam used for target identification.
The local stationary features of the bird migration in the Kumpula radar data were enhanced by summing radar reflectivity of consecutive scans in the converted form of rainfall intensity, which is a standard method in radar software to produce accumulated rainfall estimates for desired observation periods. The radar scans at 15-min intervals, provided a rather homogeneous accumulation structure in continuous precipitation areas. However, small or intense rain cells and strong, but sparse targets, such as ships, form dotted series of maxima along their trajectories (Figure 2A). In contrast, if the densities of flying birds are locally concentrated, the accumulation estimates form conspicuous continuous patterns during the period of one or more hours.
The lowest elevation angle of the Kumpula radar scans used in this study was 0.5 degrees, for which the radar beam was 300 to 500 m above ground at the decisive ranges of about 40 km. The azimuth resolution of the radar scans was 1.0 degrees. To identify the spatial distribution of bins pertaining to birds, the PPI area was divided into quasi-horizontal sections, extending over 14 range bins (corresponding to a range interval of 3 km) and 5 azimuth angles, containing 70 bins of the radar volume. The maximum number of bins may slightly vary, though, given the differences of the antenna scans in the azimuth limits. Of these bins, bird bins were separated from precipitation by visual inspection, based on the characteristics of the polarimetric moments [27] and spatial variance in the measured radial Doppler velocity (VRAD, [28]). VRAD data were de-aliased by the dual-PRF method during signal processing prior to inspection [29].
To study the local variations in flight direction and speed, mean VRAD, obtained from each of the sections, was subtracted from bin-specific VRAD measurements. In the following, the differences are referred to as residual radial velocity ΔVRAD. Outliers of ΔVRAD, mostly caused by unsuccessful dual-PRF processing, were removed by additionally filtering velocities, allowing the absolute ΔVRAD to be less or equal to the birds’ air speed. For that purpose, VRAD measurements from near-by precipitation were used to estimate wind in the respective bird layer on 3 and 5 October. On 9 October, wind estimates were obtained from the nearby atmospheric sounding stations in Tallinn and Jokioinen (Figure 1). The wind drift was subsequently subtracted from the observed VRAD to obtain birds’ air speed and direction.

2.2. Meteorological Data

Cloud base measurements were obtained from four ceilometers in the area where the Kumpula weather radar registered bird migration. The ceilometer systems at the sites of Nurmijärvi, Porvoo, Mäntsälä, and Helsinki (Figure 1) were specified in [30]. In addition to cloud base height, the ceilometers enabled the assessment of the visibility in conditions of low-level clouds with small droplet size, which, similar to fog, would attenuate the ceilometer signals.
Measurements of temperature, humidity, and wind profiles (wind speed and direction) were obtained from the closest atmospheric sounding stations in Jokioinen, Finland, and Tallinn, Estonia, situated 109 km NNW and 80 km S, respectively, from the Kumpula radar (Figure 1). In case of precipitation, wind could be also determined by Doppler weather radar. Insects were not available as passive wind tracers.

2.3. Nocturnal Light Pollution

For comparison of the spatial bird echo distribution and the anthropogenic illumination, a light pollution map was obtained from www.lightpollutionmap.info (accessed on 13 December 2021; Figure 2C).

3. Results

On 3 and 5 October 2007, the Kumpula weather radar registered congregations of migrant birds roughly along the main roads, mainly in forested areas with scattered illuminated urban settlements in the N–W sector from Helsinki (Figure 2A–C). For comparison, we also refer to a typical nocturnal bird migration event under clear sky on 9 October (Figure 3). In the following, we detail the prevailing meteorological conditions and related bird migration phenomena for each day, based on weather radar, ceilometer, and sounding data.

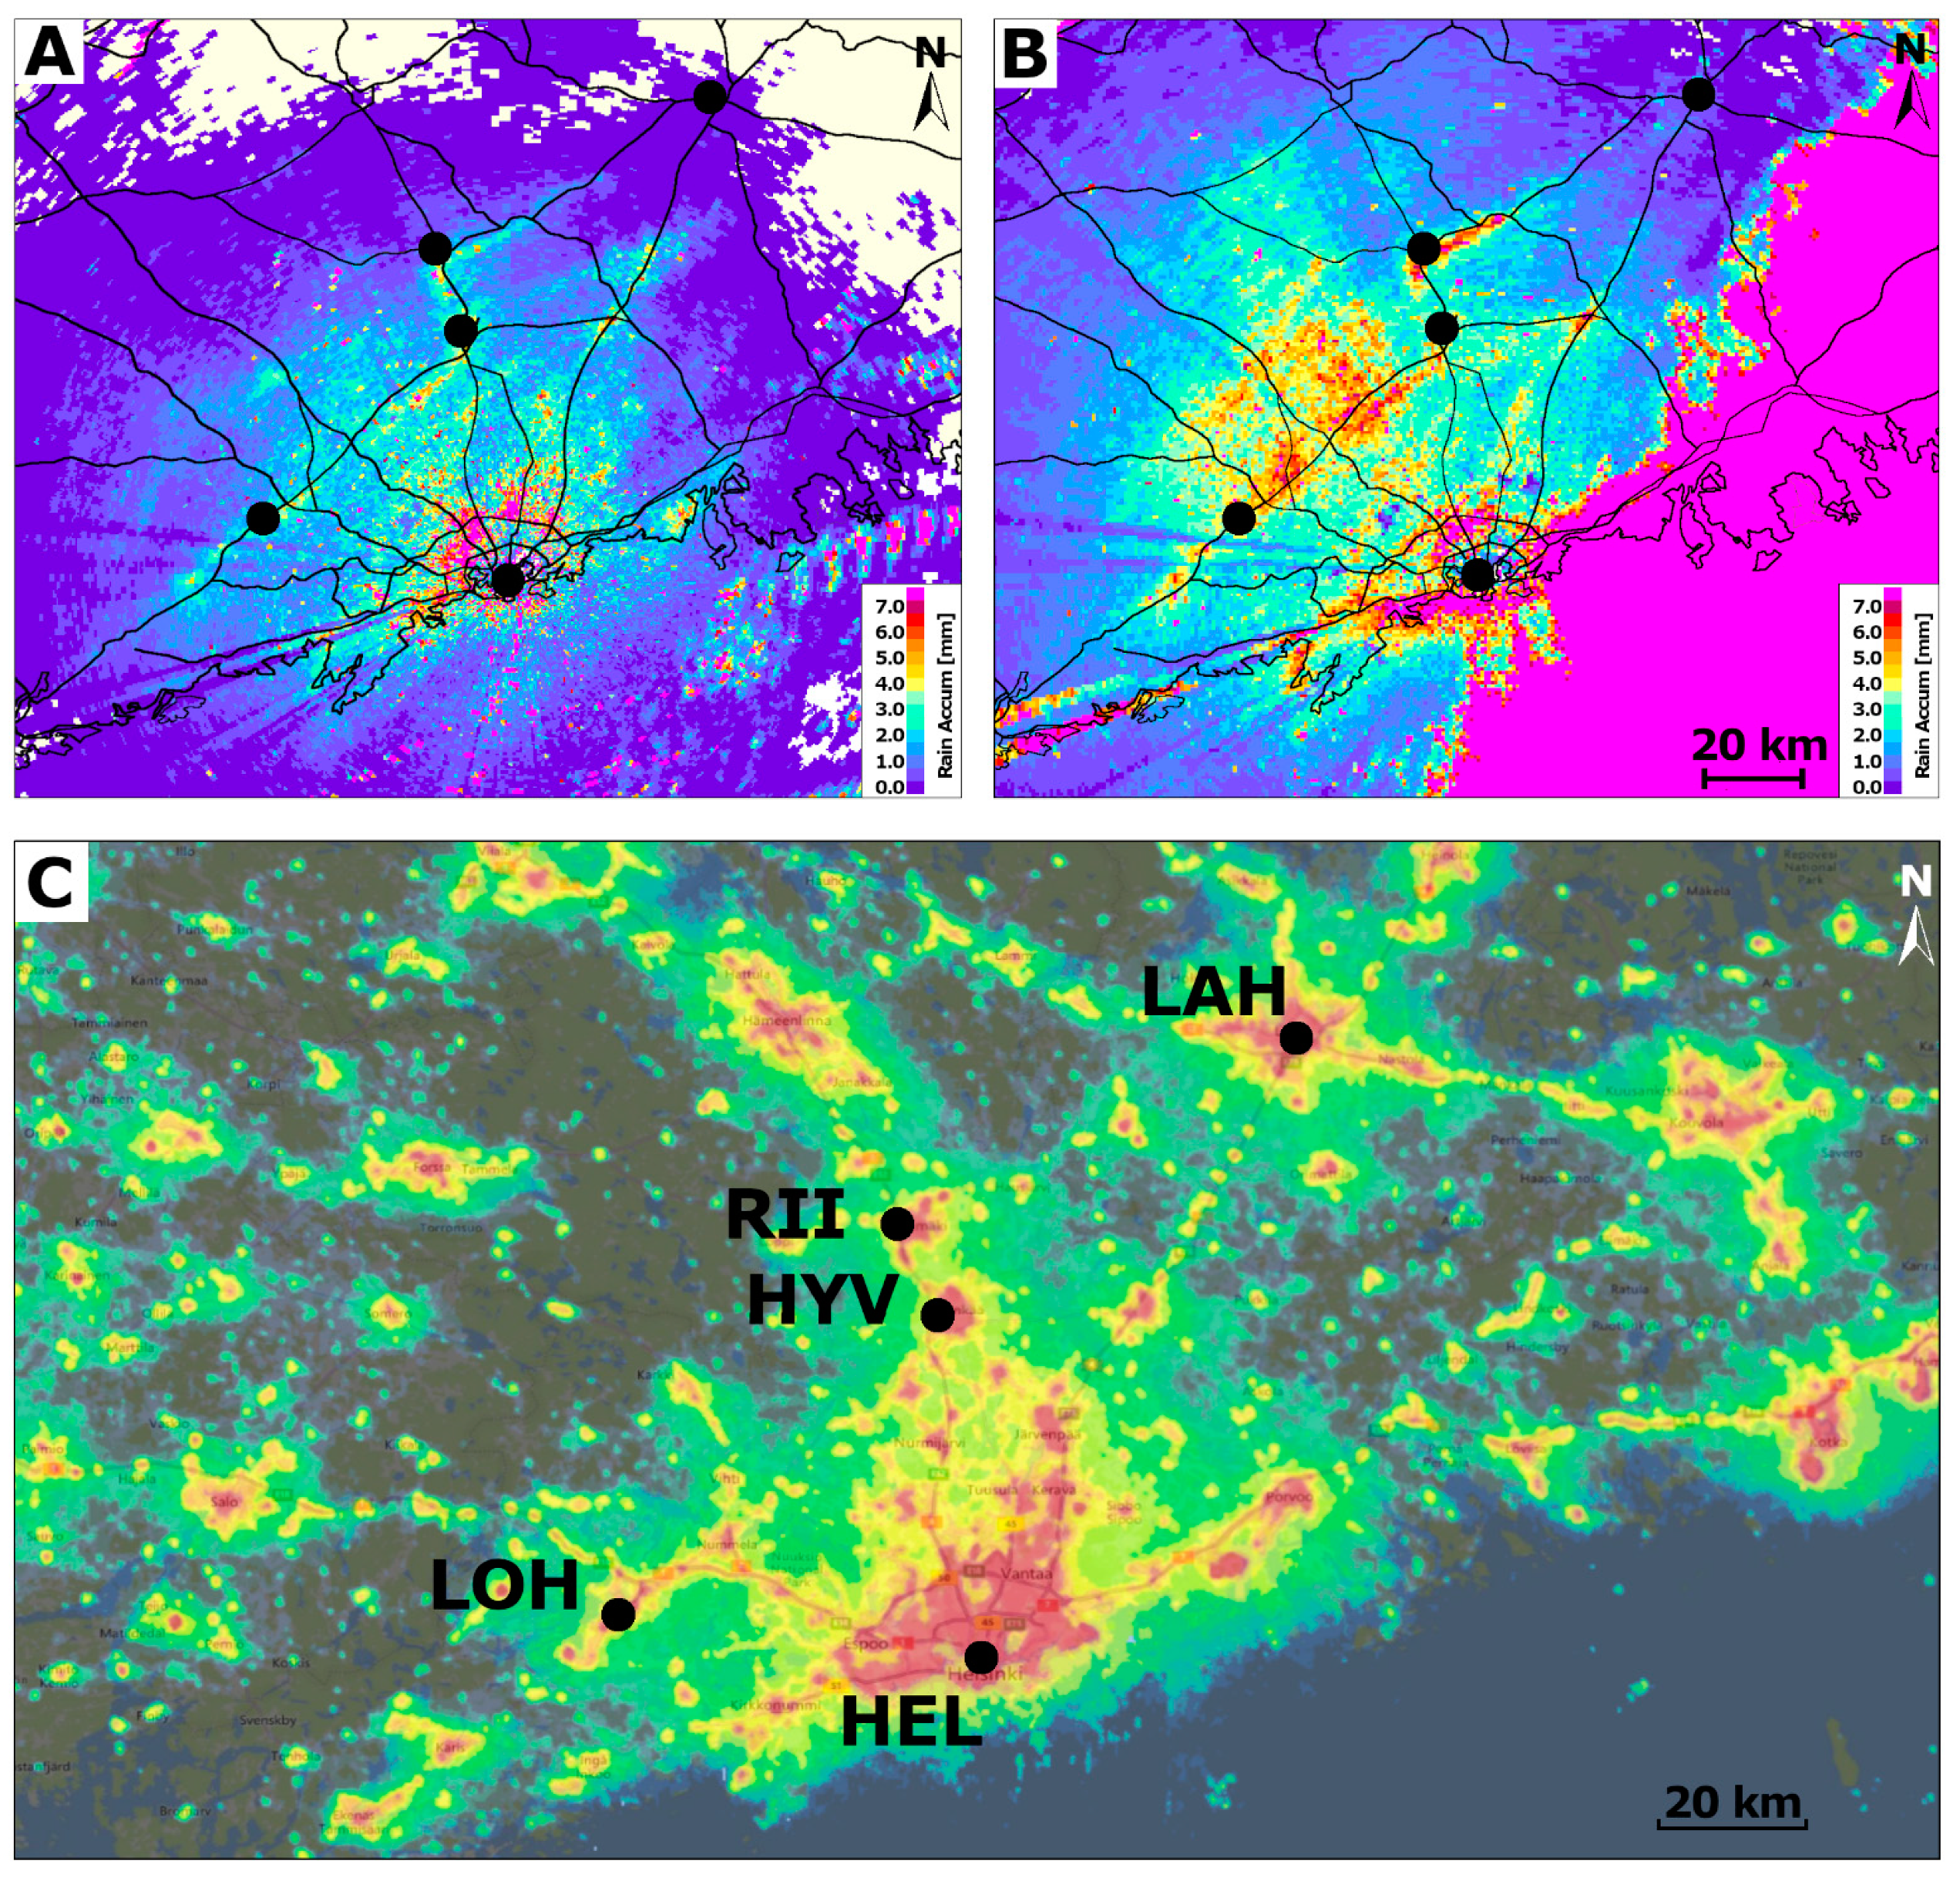
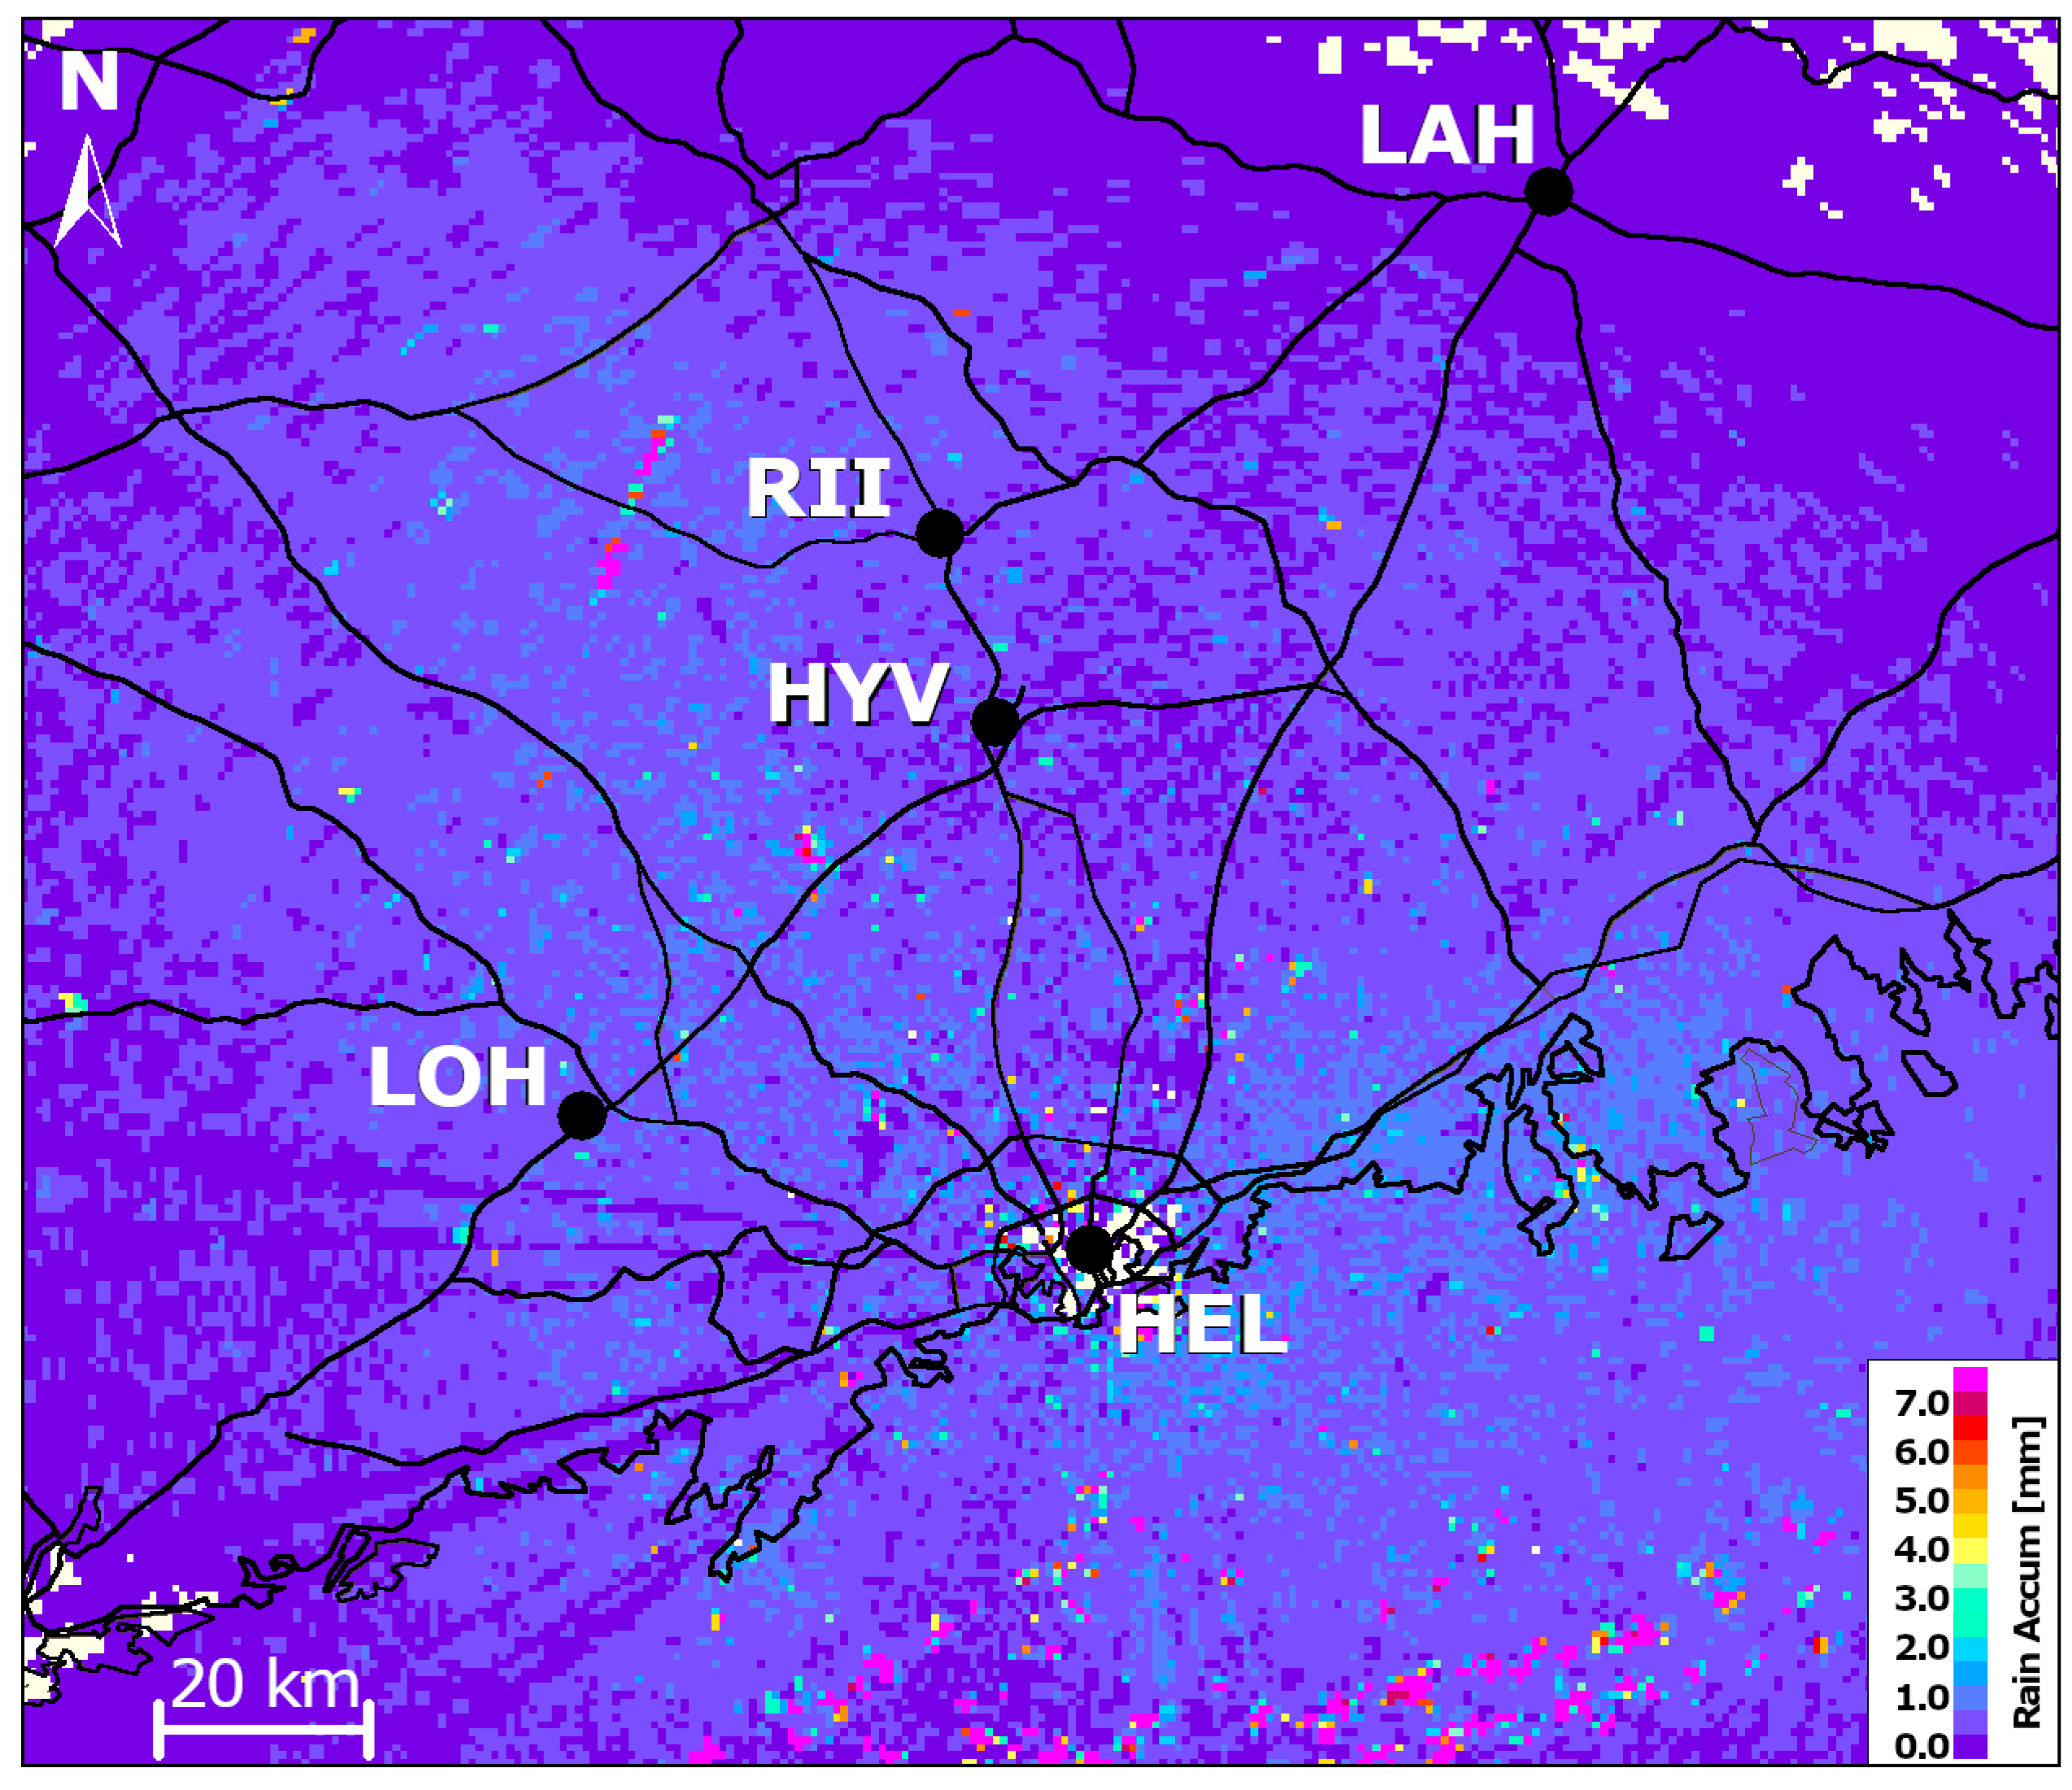
3.1. Spatial Patterns

October 3. According to ceilometer measurements at Nurmijärvi, Mäntsälä, and Porvoo, the sky was uniformly overcast with a cloud base at 700–1200 m above ground level, with a more scattered low cloud at an altitude of only 150–300 m (Figure 4).
Small rain showers were moving with the wind towards SW only a few tens of kilometres from the radar in the E–SE sector (Figure 2A). A more uniform rain area was situated south of these lines of showers (not shown). A linear depolarisation ratio (LDR) approximately 15–20 dB larger than LDR of precipitation indicated the presence of bird migration, as a yellow-green area (Figure 5A).
Close-range vertical radar cross-sections showed faint echoes, related to the low-level cloud layer between 100–1000 m, caused most likely by drizzle or refractive index turbulence [31], rather than by small cloud droplets (blue patterns in Figure 6A). Most of the birds were confined to the layer between 100–500 m, i.e., below or in the scattered lowest cloud layer and drizzle, but some migrated in a higher layer at 1500–2500 m above the ground (Figure 6A). Ceilometer data (Figure 4A,B) demonstrated that the visibility under the lower cloud layer was rather good for migrants to take off and continue their flight below or in the layer of the scattered lowest clouds.
The accumulated reflectivity of birds can be seen as an enhancement in Figure 2A and Figure 5A, following local maxima of ALAN along the chain of anthropogenic lights between LAH-RII (western part of it), RII-HYV, and, finally, HYV-LOH with an extension towards WSW. The chain of lights is also associated with major highways lit at night. Close-range radar scans, with higher elevation angles, revealed a spatially more extensive accumulation of birds near the city centre of Helsinki, faintly seen in the accumulation in Figure 1A, as well. The bird flow towards Helsinki showed a preferred migration direction from about NE to SW, the main road between Lahti and Helsinki. There was also a local maximum at the coastline, 30 km ENE from Helsinki, where a brightly lit petrochemical industrial park is located. Birds may have been attracted by the lights there; however, radar Doppler velocities verified that the birds were in migratory flight roughly along the coast of the Gulf of Finland towards WSW.
October 5. The same uniformly overcast cloud layer situation prevailed as that on 3 October, though, this time, at altitudes of 400–700 m (Figure 4C,D). Adjacent to the area with migrating birds, there was uniform precipitation in the E–SW sector, approaching the mainland with intense individual cells moving with the wind towards SW. It was causing steady backscattering from mid- to high-level cloud layers (Altostratus/Cirrostratus), in addition to the same kind of weak scattering related to the lowest cloud layer at altitudes of 200–1200 m as on 3 October (low-level blue regions in Figure 6B). In contrast to 3 October, the mid-level cloud already caused overcast conditions at all altitudinal levels of bird migration. Lines of intense bird migration, approximately matching the road network at Riihimäki and between Hyvinkää and Lohja, were even stronger than on 3 October (Figure 2B). LDR showed a similar migration pattern as on 3 October, clearly separating bird migration from precipitation (Figure 5B). Likewise, most of the birds were flying at altitudes of 200–700 m, i.e., concentrating below the lowest cloud layer, with some birds in a higher layer at 1500–2500 m above ground level (Figure 6B). The vertical-looking radar at Järvenpää captured echo signatures of passerines in flapping flight in both layers (Figure 7). The frequencies shown are of about 20–25 Hz and correspond to very small passerines, such as Regulus regulus or Phylloscopus collybita, in accordance with Finnish migration schedules [32].
October 9. This third case is a common example of nocturnal broad-front migration of passerines (purple area in Figure 3), without any significant patterns related to terrestrial features, including ALAN. The sky was clear and intense nocturnal bird migration extended quite uniformly up to an altitude of 2 km (Figure 6C). The blue weak echo in Figure 6C most likely originates from close-range, ground-based targets in the antenna side lobes, which bypassed the ground clutter filter, i.e., Doppler filtering, and were affected, especially, by higher winds, widening the Doppler spectra of forested ground. The accumulated reflectivity enhancement in the SE and NW was caused by the birds’ body orientation. Birds in head- or tail-on position, in relation to the C-band radar, exhibit lower reflectivity in the linear horizontal polarisation used by the radar than birds in lateral view. The azimuthal pattern in reflectivity indicated birds were heading towards the SW (Figure 3), while the Doppler velocity field showed a displacement towards SSW–S. Atmospheric sounding showed wind coming from NW in Tallinn and from WNW in Jokioinen, confirming the birds’ heading towards SW for displacement to SSW.

3.2. Velocity Patterns and Flight Directions

Table 1 highlights the differences in radial velocity patterns of birds, following the urban illumination and, thus, deviating from the expected migration directions on 3 and 5 October, as opposed to uniform migration on 9 October. It shows selected azimuths of the dual-PRF radar scan from Kumpula at the lowest elevation angle of 0.5 degrees. At this elevation, the antenna beam is about 300 m above ground level, at a range of 40 km. In the radar coverage area, the roads are mostly at about the same height as the radar and only sometimes lead over hills of less than 100 m above the radar level. At a range of 40 km, azimuths of 280–290 degrees match the bird echo band aligned towards SSW. Azimuths of 340–350 degrees match the radar echo band between Riihimäki and Hyvinkää, and azimuths of 20–30 degrees are generally on the road from Lahti to Helsinki, with an urban centre 50 km from Helsinki.
Standard deviation (SD) of the measured radial speed in the 5 × 14 bin sections is only about 0.1 m/s in precipitation, while the SDs of bird echoes exhibit much higher values. In the uniform migration on 9 October, SD was 2 to 3 m/s. If we limit the maximum allowed difference, in relation to the expected air speed of birds, based on Doppler signals, then the standard deviation on 3 and 5 October approximates the values observed on the 9 October. Fully random flight directions of birds would rise the standard deviation to about 5 m/s.
On 3 and 5 October, the generally tailwind-assisted migration occurred approximately from the NE to WSW–SW. On 9 October, wind was blowing from NW and WNW, and the birds travelled in crosswinds from an azimuth of 10 degrees, i.e., almost N, towards SSW-S. On 9 October, the standard deviations were smaller in all azimuths, compared to 3 and 5 October (Table 1), which exhibited great variation. In the W–NW sector, the positive ΔVRAD may indicate birds heading more westwards and, in the N–NE sector, positive values would also indicate a more westward movement than expected from the radar scan at 20 km range. Values in the centre of the N–NW sector pointed slightly more towards the radar than at the edges of the main N–NW sector, and that also gives the visual impression that the birds at the band from Riihimäki to Hyvinkää had clearly changed their direction of movement, compared to the nearby azimuths. The radial velocity structure showed that birds at this “great bend” were flying quite straight towards the radar, as the road between Riihimäki and Hyvinkää is almost parallel to the radar beam. Maximum radial speed was a few meters per second higher in the NNE, at about 20 degrees azimuth. In this azimuth, birds followed the urban lighting along the road from Lahti towards Helsinki, and radial speed increased. The zero radial speed was observed in azimuths of 300–305 degrees, and this would then mean a maximum radial velocity towards the radar in azimuths of 30–35 degrees.

4. Discussion

Our study shows two events of active bird migration, where birds follow illuminated human infrastructure in low-level overcast conditions. The applied set of remote sensing data enabled a detailed reconstruction and analysis of bird behaviour, as well as the prevailing meteorological conditions in three dimensions. The small-scale patterns of 3 and 5 October clearly differed from extensive and uniform passerine migration under clear sky on 9 October. The first impression looking at the reflectivity images was that the birds were tracking the main roads. However, a closer look at the data revealed that, in some areas, the birds constituting the intensified echo bands were not actually following the main roads, but roughly the imaginary line between densely populated areas close to the road network.
The enhancement of radar reflectivity, observed in these bird migration bands, can emerge from two types of bird behaviour. A first possible reason for the strong reflectivities is an increase in bird densities, i.e., that birds gather in the artificially lit areas. The second possible cause could be an increase in birds’ flight altitude, which then lifts the birds better into the radar beam height and, thus, into the sight of the radar. The latter option would become increasingly evident the shallower the migration outside the migration band would be, as it would prompt more birds beyond the radar horizon to ascend. In these events, the cloud base varied between 200–1200 m, and vertical cross-sections at close ranges did not show any meaningful changes in birds’ flight altitudes, but rather a uniform mixed height pattern below the capping cloud layer. In fact, the radar beam height in the near-horizontal PPI scans was even below the main layer of birds verified by the vertical cross-sections, and ascending flights of the birds would not strengthen their echoes. Furthermore, there is no explicit topographical reason for birds to climb at just these inland sites, with rather uniform woodland, as opposed to the shoreline, where such an ascent phenomenon is regularly observed in Finland, but also described elsewhere in literature (e.g., [33]). We, therefore, believe that the first scenario applies, and birds aggregated in the illuminated areas. This would be also in line with previous observations that birds are attracted to brightly lit areas and unwilling to leave them, the so-called capture phenomenon (e.g., [12]). Because of the low and continuous cloud layer, birds could only perceive the anthropogenic light sources of the road network and adjacent settlements.
Many published accounts have reported an increase in circling behaviour or directional shifts around light sources, as well as a decrease in flight speed (e.g., [12,18,34,35]. In the present study, though, we could not find any signs of circling behaviour in the areas of bird aggregations. The velocity data indicated directional advancement, so it might be that the birds’ magnetic sense still pointed to some migration direction and let the birds move on, instead of lingering in the same area. Alternatively, we reckon that the continuous light of the roads and houses prevented such a circling effect, because the transition between dark and lit areas was probably smoother than around single lit sources (such as light houses) in otherwise dark environments. The effect of such a glowing dome of light over cities below clouds was also described by [36], in the example of a tracked wader.
The situation for the birds forming the accumulation near the coastline could have been more confusing, given the unlit surface of the seaside contrasting the bright lights of the urban areas on the land side, though, without any access to celestial cues. Possibly, these birds also used the Finnish shoreline for orientation, which runs approximately in an ENE–WSW direction. Lights from the Estonian shore may not be accessible as a visual navigational aid for nocturnal migrants in the prevailing overcast conditions, especially in the precipitation of 5 October. Finally, we cannot completely exclude the possibility that light sources in some isolated areas, such as the industrial site 30 km ENE from the Kumpula radar and urban centres, attracted and captured some low-flying birds. However, migration continued, according to Doppler velocities that were similar to surrounding areas, and were as anticipated for autumn migration, i.e., roughly SW to WSW.
Finally, the frequency of occurrence of such events, as described in the present study, is unknown, as there are only anecdotal reports in literature. We cannot make any inferences on the generality of the birds’ reaction to similar challenging weather conditions. To gain more insights into migrant birds’ potential use of ALAN in urbanized areas, it would be necessary to thoroughly search radar data in resembling circumstances. One major challenge is that weather radars are typically in run in operational mode and unavailable for customized measurements, unlike the radars used in this study.
Future research should leverage the broad range of remote sensing tools available, in order to address the questions related to meteorological impact on bird migrants and human-wildlife conflicts at different spatiotemporal scales. For instance, radar wind profilers can be especially promising for studies in precipitative conditions, which reliably depict birds, even in different types of hydrometeors. For this purpose, interdisciplinary collaborations between meteorologists and biologists should be encouraged, in order to diversify the set of research tools deployed and benefit from mutual knowledge exchange.

Author Contributions

Conceptualization, N.W. and M.L.; methodology, N.W and M.L.; validation, N.W., M.L. and J.K.; formal analysis, M.L.; data curation, M.L.; writing—original draft preparation, N.W. and M.L.; writing—review and editing, M.L., J.K. and D.N.M.; visualization, N.W. and M.L.; supervision, J.K. and D.N.M. All authors have read and agreed to the published version of the manuscript.

Funding

This research was partly funded through the 2017–2018 Belmont Forum and BiodivERsA joint call for research proposals, under the BiodivScen ERA-Net COFUND programme, as well as with the funding organisations Academy of Finland (aka 326315), Swiss National Science Foundation (SNF 31BD30_184120), Belgian Federal Science Policy Office (BelSPO BR/185/A1/GloBAM-BE), Netherlands Organisation for Scientific Research (NWO E10008), and National Science Foundation (NSF 1927743).

Institutional Review Board Statement

Not applicable.

Informed Consent Statement

Not applicable.

Data Availability Statement

Data are contained within the article.

Acknowledgments

We thank Jurij Stare for permission to use the light pollution map. We are further grateful for the valuable comments by the anonymous reviewers, which further improved the quality of the manuscript.

Conflicts of Interest

The authors declare no conflict of interest.

References

  1. Alerstam, T. Bird Migration; Cambridge University Press: Cambridge, UK, 1990. [Google Scholar]
  2. Richardson, W.J. Timing of bird migration in relation to weather: Updated review. In Bird Migration: Physiology and Ecophysiology; Gwinner, E., Ed.; Springer: Berlin/Heidelberg, Germany, 1990; pp. 78–101. [Google Scholar]
  3. Panuccio, M.; Dell’Omo, G.; Bogliani, G.; Catoni, C.; Sapir, N. Migrating birds avoid flying through fog and low clouds. Int. J. Biometeorol. 2019, 63, 231–239. [Google Scholar] [CrossRef] [PubMed]
  4. Becciu, P.; Panuccio, M.; Dell’Omo, G.; Sapir, N. Groping in the Fog: Soaring Migrants Exhibit Wider Scatter in Flight Directions and Respond Differently to Wind Under Low Visibility Conditions. Front. Ecol. Evol. 2021, 9, 745002. [Google Scholar] [CrossRef]
  5. Shamoun-Baranes, J.; Liechti, F.; Vansteelant, W.M.G. Atmospheric conditions create freeways, detours and tailbacks for migrating birds. J. Comp. Physiol. A 2017, 203, 509–529. [Google Scholar] [CrossRef] [PubMed]
  6. Becciu, P.; Menz, M.H.M.; Aurbach, A.; Cabrera-Cruz, S.A.; Wainwright, C.E.; Scacco, M.; Ciach, M.; Pettersson, L.B.; Maggini, I.; Arroyo, G.M.; et al. Environmental effects on flying migrants revealed by radar. Ecography 2019, 42, 942–955. [Google Scholar] [CrossRef] [Green Version]
  7. Muheim, R.; Sjöberg, S.; Pinzon-Rodriguez, A. Polarized light modulates light-dependent magnetic compass orientation in birds. Proc. Natl. Acad. Sci USA 2016, 113, 1654–1659. [Google Scholar] [CrossRef] [Green Version]
  8. Newton, I. Weather-related mass-mortality events in migrants. IBIS 2007, 149, 453–467. [Google Scholar] [CrossRef]
  9. Poot, H.; Ens, B.J.; de Vries, H.; Donners, M.A.H.; Wernand, M.R.; Marquenie, J.M. Green light for nocturnally migrating birds. Ecol. Soc. 2008, 13, 47. Available online: https://www.ecologyandsociety.org/vol13/iss2/art47/ (accessed on 7 March 2022). [CrossRef] [Green Version]
  10. Marquenie, J.; Donners, M.; Poot, H.; Steckel, W.; de Wit, B. Bird-Friendly Light Sources: Adapting the Spectral Composition of Artificial Lighting. IEEE Ind. Appl. Mag. 2013, 19, 56–62. [Google Scholar] [CrossRef]
  11. Rebkea, M.; Dierschkeb, V.; Weinera, C.N.; Aumüllera, R.; Hilla, K.; Hilla, R. Attraction of nocturnally migrating birds to artificial light: The influence of colour, intensity and blinking mode under different cloud cover conditions. Biol. Conserv. 2019, 233, 220–227. [Google Scholar] [CrossRef]
  12. Gauthreaux, S.A.; Belser, C.G. Effects of artificial night lighting on migrating birds. In Ecological Consequences of Artificial Night Lighting; Rich, C., Longcore, T., Eds.; Island Press: London, UK, 2006; pp. 67–93. [Google Scholar]
  13. Adams, C.A.; Fernández-Juricic, E.; Bayne, E.M.; Cassady, S.; Clair, C. Effects of artificial light on bird movement and distribution: A systematic map. Environ. Evid. 2021, 10, 37. [Google Scholar] [CrossRef]
  14. Cabrera-Cruz, S.A.; Smolinsky, J.A.; Buler, J.J. Light pollution is greatest within migration passage areas for nocturnally-migrating birds around the world. Sci. Rep. 2018, 8, 3261. [Google Scholar] [CrossRef] [PubMed]
  15. Cabrera-Cruz, S.A.; Cohen, E.B.; Smolinsky, J.A.; Buler, J.J. Artificial light at night is related to broad-Scale stopover distributions of nocturnally migrating landbirds along the Yucatan Peninsula, Mexico. Remote Sens. 2020, 12, 395. [Google Scholar] [CrossRef] [Green Version]
  16. Cabrera-Cruz, S.A.; Smolinsky, J.A.; McCarthy, K.P.; Buler, J.J. Urban areas affect flight altitudes of nocturnally migrating birds. J. Anim. Ecol. 2019, 88, 1873–1887. [Google Scholar] [CrossRef] [PubMed]
  17. La Sorte, F.; Fink, D.; Buler, J.; Farnsworth, A.; Cabrera-Cruz, S.A. Seasonal associations with urban light pollution for nocturnally migrating bird populations. Glob. Change Biol. 2017, 23, 11. [Google Scholar] [CrossRef] [PubMed]
  18. Van Doren, B.M.; Horton, K.G.; Dokter, A.M.; Klinck, H.; Elbin, S.B.; Farnsworth, A. High-intensity urban light installation dramatically alters nocturnal bird migration. Proc. Natl. Acad. Sci. USA 2017, 114, 11175–11180. [Google Scholar] [CrossRef] [PubMed] [Green Version]
  19. McLaren, J.D.; Buler, J.J.; Schreckengost, T.; Smolinsky, J.A.; Boone, M.; Emiel van Loon, E.; Dawson, D.K.; Walters, E.L. Artificial light at night confounds broad-scale habitat use by migrating birds. Ecol. Lett. 2018, 21, 356–364. [Google Scholar] [CrossRef] [PubMed]
  20. Gillings, S.; Scott, C. Nocturnal flight calling behaviour of thrushes in relation to artificial light at night. IBIS 2021, 163, 1379–1393. [Google Scholar] [CrossRef]
  21. Hüppop, O.; Hüppop, K.; Dierschke, J.; Hill, R. Bird collisions at an offshore platform in the North Sea. Bird Study 2016, 63, 73–82. [Google Scholar] [CrossRef]
  22. Lebbin, D.J.; Harvey, M.G.; Lenz, T.C.; Andersen, M.J.; Ellis, J.M. Nocturnal Migrants Foraging at Night by Artificial Light. Wilson J. Ornithol. 2007, 119, 506–508. [Google Scholar] [CrossRef]
  23. Leopold, M.F.; Philippart, C.J.M.; Yorio, P. Nocturnal feeding under artificial light conditions by Brown-hooded Gull (Larus maculipennis) in Puerto Madryn harbour (Chubut Province, Argentina). Hornero 2010, 25, 55–60. [Google Scholar]
  24. Byrkjedal, I.; Lislevand, T.; Vogler, S. Do passerine birds utilise artificial light to prolong their diurnal activity during winter at northern latitudes? Ornis Norvegica 2012, 35, 37–42. [Google Scholar] [CrossRef]
  25. Leskinen, M.; Markkula, I.; Koistinen, J.; Pylkkö, P.; Ooperi, S.; Siljamo, P.; Ojanen, H.; Raiskio, S.; Tiilikkala, K. Pest insect immigration warning system by an atmospheric dispersion model, weather radars and traps. Appl. Entomol. 2011, 135, 55–67. [Google Scholar] [CrossRef] [Green Version]
  26. Moisseev, D.; Saltikoff, E.; Leskinen, M. Using dual-polarisation weather radar observations to improve quantitative precipitation estimation in snowfall. In Proceedings of the 8th International Symposium on Troposheric Profiling, Delft, The Netherlands, 19–23 October 2009. [Google Scholar]
  27. Stepanian, P.M.; Horton, K.G.; Melnikov, V.M.; Zrnić, D.S.; Gauthreaux, S.A., Jr. Dual-polarization radar products for biological applications. Ecosphere 2016, 7, e01539. [Google Scholar] [CrossRef]
  28. Dokter, A.M.; Holleman, I.; Liechti, F. Bird Detection by Operational Weather Radar; Scientific Report WR 2009-06; KNMI: De Bilt, The Netherlands, 2009; pp. 1–208.
  29. Doviak, R.J.; Zrnic, D.S. Doppler Radar & Weather Observations; Academic Press Limited: London, UK, 1993. [Google Scholar]
  30. Koskinen, J.T.; Poutiainen, J.; Schultz, D.M.; Joffre, S.; Koistinen, J.; Saltikoff, E.; Gregow, E.; Turtiainen, H.; Dabberdt, W.F.; Damski, J.; et al. The Helsinki Testbed: A Mesoscale Measurement, Research, and Service Platform. Bull. Am. Meteorol. Soc. 2011, 93, 325–342. [Google Scholar] [CrossRef] [Green Version]
  31. Franck, A.; Moisseev, D.; Vakkari, V.; Leskinen, M.; Lampilahti, J.; Kerminen, V.-M.; O’Connor, E. Evaluation of convective boundary layer height estimates using radars operating at different frequency bands. Atmos. Meas. Technol. 2021, 14, 7341–7353. [Google Scholar] [CrossRef]
  32. Weisshaupt, N.; Lehikoinen, A.; Mäkinen, T.; Koistinen, J. Challenges and benefits of using unstructured citizen science data to estimate seasonal timing of bird migration across large scales. PLoS ONE 2021, 16, e0246572. [Google Scholar] [CrossRef] [PubMed]
  33. Bruderer, B.; Liechti, F. Flight behaviour of nocturnally migrating birds in coastal areas: Crossing or coasting. J. Av. Biol. 1998, 29, 499–507. [Google Scholar] [CrossRef]
  34. Cochran, W.W.; Graber, R.R. Attraction of nocturnal migrants by lights on a television tower. Wilson Bull. 1958, 70, 378–380. [Google Scholar]
  35. Bruderer, B.; Peter, D.; Steuri, T. Behaviour of migrating birds exposed to X-band radar and a bright light beam. J. Exp. Biol. 1999, 202, 1015–1022. [Google Scholar] [CrossRef]
  36. Bruderer, B. Vogelzug: Eine schweizerische Perspektive; Der Ornithologische Beobachter. Beiheft 12; Ala, Schweizerische Gesellschaft für Vogelkunde und Vogelschutz: Rüschlikon, Switzerland, 2017. [Google Scholar]
Figure 1. The map shows the main roads and observation systems used in the present study: Kumpula weather radar (HEL) in Helsinki; Järvenpää weather radar (JWR); ceilometers at Nurmijärvi (Nc), Porvoo (Pc), Mäntsälä (Mc), and Helsinki (HEL); and the atmospheric sounding stations at Jokioinen (JOK) and Tallinn, Estonia (TLL).
Remotesensing 14 01616 g001
Figure 2. Accumulated reflectivity patterns, as observed by the Kumpula weather radar (A) on 3 October 2007, 19:00 UTC, and (B) 5 October 2007, 19:00 UTC, as well as the (C) corresponding night light map (source: www.lightpollutionmap.info, accessed on 13 December 2021) of the same area, with the relevant urban reference points (LOH: Lohja; HEL: Helsinki; HYV: Hyvinkää; RII: Riihimäki; LAH: Lahti). In A, birds extend over major parts of the map (purple to red) with some ships (dotted pink lines in S) and showers on the sea (larger pink dots in E). In (B), the bird pattern is similar to (A), though confined by rain (pink band).
Remotesensing 14 01616 g002
Figure 3. Accumulated reflectivity patterns of bird migration (purple), as observed by the Kumpula weather radar on 9 October 2007, 19:00 UTC and the relevant urban reference points (LOH: Lohja; HEL: Helsinki; HYV: Hyvinkää; RII: Riihimäki; LAH: Lahti).
Remotesensing 14 01616 g003
Figure 4. A selection of backscattering amplitudes from ceilometer measurements on 3 October 2007 ((A): Porvoo, 3 October 2007 18:13 UTC; and (B): Helsinki, 3 October 2007 19:21 UTC) and 5 October 2007 ((C): Nurmijärvi, 5 October 2007 18:26 UTC; and (D): Nurmijärvi, 5 October 2007 19:22 UTC), showing heights of cloud layers. For ceilometer locations, see map of Figure 1.
Remotesensing 14 01616 g004
Figure 5. Linear depolarisation ratio (LDR) on 3 Oct 2007 18:34 UTC (A) and 5 Oct 2007 19:34 UTC (B), showing bird migration as yellow-green area and precipitation in blue.
Remotesensing 14 01616 g005
Figure 6. Vertical cross sections of Ze (in units of dBZ) at short ranges of 2–20 km by the Kumpula radar with altitudinal reflectivity distributions of migrating birds (vertically elongated yellow-green spots) at 18:49 UTC on 3 (A), 5 (B), and 9 (C) October 2007, as well as with scattering from drizzle and low clouds up to about 1 km (blue in (A,B)) and a cloud layer above 2 km (B).
Remotesensing 14 01616 g006
Figure 7. High temporal resolution recordings of migrating birds, as observed by the vertical-looking Doppler weather radar at Järvenpää, 32 km NNE from Kumpula radar, on 5 October 2007, 17:35:29.6–17:35:30.4 UTC. The figure covers a one-second period. The birds were observed simultaneously at 500 and 1950 m traversing the vertical-looking radar beam.
Remotesensing 14 01616 g007
Table 1. Residual radial velocity ΔVRAD in bird migration cases 3, 5, and 9 October 2007. ΔVRAD, its standard deviation, and the number of bird bins in 5 degrees azimuth sections, at a range of 40 to 43 km. Number of bird bins denotes the number of bird bins in an area of approximately 10 km2, in an altitude range of 100–700 m. The column direction and speed shows wind and bird migration directions (as directions from which they originate). Radial velocity is negative for movements towards the radar. The minus signs denote the measured radial velocity being more negative than the expected value, and plus signs denote the radial velocity being more positive.
Date [UTC]VariableWNW SectorNNW Sector-WNNW Sector-ENNE SectorDirection (Degrees) and (Air) Speed [m/s]
280–285°285–290°330–340°340–345°345–350°350–360°20–25°25–30°Wind
Birds
3 October 2007, 19:28ΔVRAD+3.5+2.2+0.1−3.6−1.5−0.0−1.0+0.2
S.D. of ΔVRAD3.13.43.40.03.62.42.93.560°; 7 m/s
number of bird bins1939813739261530°; 7 m/s
5 October 2007, 18:58ΔVRAD+4.0+3.1−1.8−3.6−2.3−1.3+1.6+5.0
S.D. of ΔVRAD3.73.64.02.93.62.52.52.150°; 10 m/s
number of bird bins19374429493132740°; 7 m/s
9 October 2007, 19:28ΔVRAD−1.7+0.6−0.4−0.6+0.5+2.3+2.2+1.4
S.D. of ΔVRAD3.24.42.41.82.22.22.12.8340°; 13 m/s
number of bird bins72357667173242750°; 10 m/s
Publisher’s Note: MDPI stays neutral with regard to jurisdictional claims in published maps and institutional affiliations.

