Article

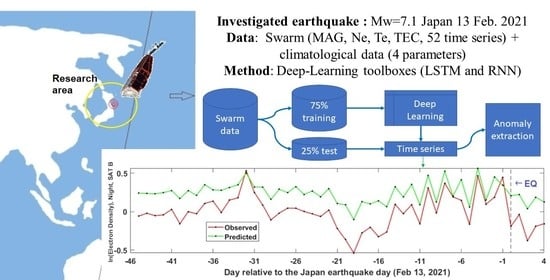
Developing a Deep Learning-Based Detector of Magnetic, Ne, Te and TEC Anomalies from Swarm Satellites: The Case of Mw 7.1 2021 Japan Earthquake

1
Photogrammetry and Remote Sensing Department, School of Surveying and Geospatial Engineering, College of Engineering, University of Tehran, North Amirabad Ave., Tehran 1417614411, Iran
2
Istituto Nazionale di Geofisica e Vulcanologia, Via di Vigna Murata 605, 00143 Roma, Italy
3
College of Instrumentation and Electrical Engineering, Jilin University, Changchun 130061, China
*
Author to whom correspondence should be addressed.
Remote Sens. 2022, 14(7), 1582; https://doi.org/10.3390/rs14071582
Submission received: 31 January 2022 / Revised: 22 March 2022 / Accepted: 23 March 2022 / Published: 25 March 2022
(This article belongs to the Special Issue Remote Sensing for Seismology)

Abstract

:
Since the appearance and evolution of earthquake ionospheric precursors are expected to show a nonlinear and complex behaviour, the use of nonlinear predictor models seems more appropriate. This paper proposes a new approach based on deep learning as a powerful tool for extracting the nonlinear patterns from a time series of ionospheric precursors. A Long Short-Term Memory (LSTM) network as a type of Recurrent Neural Network (RNN) was used to investigate 52 six-month time series, deduced from the three Swarm satellite (Alpha (A), Bravo (B) and Charlie (C)) measurements, including electron density (Ne), electron temperature (Te), magnetic scalar and vector (X, Y, Z) components, Slant and Vertical Total Electron Content (STEC and VTEC), for day and night periods around the time and location of a seismic event. This new approach was tested on a strong Mw = 7.1 earthquake in Japan on 13 February 2021, at 14:07:50 UTC by comparing the results with two implemented methods, i.e., Median and LSTM methods. Furthermore, clear anomalies are seen by a voting classification method 1, 6, 8, 13, 31 and 32 days before the earthquake. A comparison with atmospheric data investigation is further provided, supporting the lithosphere–atmosphere–ionosphere coupling (LAIC) mechanism as a suitable theory to explain the alteration of upper geolayers in the earthquake preparation phase. In other words, using multi-method and multi-precursor analysis applied to 52 time series and also to the orbit-by-orbit investigation, the observed anomalies on the previous day and up to 32 days before the event in normal solar and quiet geomagnetic conditions could be considered as a striking hint of the forthcoming Japan earthquake.

Graphical Abstract

1. Introduction

In this paper, we investigate the preparatory phase of a significant magnitude (M7.1) earthquake in Japan that occurred on 13 February 2021. The problem of earthquake precursors and the possibility to make a prediction have a long history with some examples of success (for example, M7.3 Haicheng, China, 1975 earthquake), unfortunately, followed by failures in the same country (for example, in China the highly deadly M7.5 Tangshan, China, 1976, earthquake) [1]. To date, many papers and scientific reports indicate the occurrence of unusual changes in different layers of the earth system (lithosphere, atmosphere and ionosphere) around the location and time of major earthquakes [2,3,4,5,6,7,8,9,10]. Furthermore, several theories have been proposed to explain such “changes”; for example, Pulinets and Ouzounov [6] proposed a chain of processes induced by the possible release of radon in the atmosphere as found by several authors (e.g., Deb et al., [11] detected increase in radon counting before two Nepal 2015 strong earthquakes; see also Kojima et al., [12]). The decay of the radon in the atmosphere can ionise the air that, in turn, can cause a drop in air humidity and an increase in surface temperature and overall perturbations of the atmospheric and ionospheric electric circuit [6]. Another source mechanism is based on the production of positive-holes (or simply p-holes) in the rocks by the increase in stress on the crustal volume, including the fault before the earthquake [5,13]. These p-holes could then propagate straight in the ionosphere as an ultra-low-frequency electromagnetic wave disturbance [3] or by plasma bubbles [14], or even by the previously described chain [6] after the radon release. However, the existence of complex and completely nonlinear behaviour in the time series of precursors has caused high uncertainty in earthquake prediction. Therefore, the use of machine learning methods that are able to model these nonlinear variations seems particularly meaningful in studies of earthquake precursors. Artificial Neural Network (ANN), Support Vector Regression (SVR), ensembles methods (Decision Tree, Bagging, Boosting, Random Forest) and Optimisation algorithms are examples of efforts that have been performed for this type of time series modelling of precursors [15]. In addition, the importance of considering low Earth orbiting satellites in earthquake studies is undeniable, for their global coverage and sensitive payload measurement of some ionospheric parameters. The use of powerful deep learning tools along with up-to-date satellite data can hopefully provide the basis for the development of seismic warning systems with a low uncertainty.

1.1. Case Study

A strong earthquake of Mw = 7.1 occurred at 14:07:50 UTC (LT = UTC + 09:00 = 23:07:50) on 13 February 2021, near the east coast of Honshu, Japan, (37.727°N, 141.775°E, 44 km depth) as the result of thrust faulting near the subduction zone interface plate boundary between the Pacific and North America Plates (Figure 1a). This seismic event happened in the vicinity of the rupture area of the 11 March 2011 M9.1 Tohoku earthquake; in fact, the 2021 earthquake epicentre is just 82 km farther and the fault rupture segment is inside the one of the M9.1 event [16,17,18].
We also report in Figure 1 the seismicity in the investigated area for the analysed time period, i.e., from 1 September 2020 until 18 February 2021, checking for M5+ events recorded in the USGS catalogue. As well known, the area is characterised by frequent seismicity, mainly produced by the subduction of the Pacific Plate under the Japanese Plate with some deep events. This is confirmed by the high a-value of Gutenberg–Richter’s earthquake magnitude distribution [19] that corresponds to 6.93 annual a-value (see Figure 1b). The b-value obtained is very close to one, as globally expected for seismic events. In Figure 1c, we placed a dashed black line to focus attention on M5.5+ earthquakes, because previous studies [20] found a statistical relationship that such events can show a pre-earthquake ionosphere disturbance; therefore, we give attention to the time of occurrence of such events. In particular, we have four events with M > 5.5 in the analysed period before the M7.1 Japan earthquake that occurred on 12 September 2020 (−153.9 days) with M = 6.1, on 3 October 2020 (−132.6 days) with M = 5.8, on 20 December 2020 (−54.3 days) with M = 6.3 and on 12 January 2021 (−31.9 days) with M = 5.9 but at a depth of about 214 km. It is interesting to note that in the days around the mainshock there are no M5.5+ earthquakes, but several M5+ events are observed in particular after the main event.

1.2. Data

Swarm mission (launched on 22 September 2013) is a constellation of three identical satellites, Alpha (A), Bravo (B) and Charlie (C), placed in quasi-polar orbits at an altitude between 440 km (Alpha and Charlie) and 510 km (Bravo) [21]. These satellites include magnetic and plasma sensors: (1) an Absolute Scalar Magnetometer (ASM), which measures the strength of the magnetic field and provides scalar measurements of the magnetic field to calibrate the vector field magnetometer (VFM) [22]; (2) a VFM, which makes high-precision measurements of the intensity and direction of the magnetic field [23]; (3) the Electric Field Instrument (EFI), which is composed of Langmuir probes and thermal ion imager [24]. Langmuir probes provide plasma data such as electron density Ne, electron temperature Te and spacecraft electric potential V [25]; (4) a GPS (Global Position System) receiver that helps together with laser retroreflectors to provide a Precise Orbit Determination (POD) [26]. From the two receiving frequencies of the GPS receiver, it is possible to estimate the Total Electron Content (TEC) in the topside ionosphere above the Swarm satellites, and a recent work has shown that this parameter from Swarm can in addition be used to search for ionospheric pre-earthquake disturbances [27].
To date, several papers have investigated plasma and magnetic field parameters around the time and location of some strong earthquakes using Swarm satellite data, providing several pieces of evidence regarding the relationship between ionospheric disturbances recorded by Swarm satellites and earthquake occurrence. De Santis et al. [28] found a common pattern in the cumulate of night-time Swarm alpha magnetic anomalies and seismicity before and during the M7.8 Nepal 2015 earthquake. Akhoondzadeh et al. [29,30] and Marchetti and Akhoondzadeh [31] provided examples of several Swarm Ne and magnetic anomalies and their temporal patterns possibly related to the M7.8 Ecuador 2016, M7.3 Iraq–Iran border 2017 and M8.2 Mexico 2017 earthquakes, respectively. Marchetti et al. [32,33] and De Santis et al. [34] identified a chain of processes in lithosphere atmosphere and ionosphere before the M6.5 Italian seismic sequences 2016–2017, before the M7.5 Indonesia 2018 earthquake and before the M7.1 Ridgecrest (USA) 2019 earthquake. Finally, De Santis et al. [20] provided a statistical demonstration of significant correlation of Swarm electron density and magnetic anomalies with M5.5+ earthquakes that occurred during a period of about five years.

2. Methodology

The Long Short-Term Memory (LSTM) technique was proposed by Hochreiter and Schmidhuber (1997), to overcome the lack of vanishing gradient in the Recurrent Neural Network (RNN) [35]. This model can deduce dynamic temporal behaviour in time series data by the use of shared parameters while running through time. The LSTM includes some units called memory blocks in the recurrent hidden layers that preserve the values of short- and long-term, which use memory cells to store information with self-connections and the temporal state of the network. The LSTM consists of three layers as RNN, but a hidden layer of LSTM has three units (input, forget and output) to control the flow of information to the memory cells. Based on the activation of units, the information residing in memory is stored in the memory cell (if the input unit has high activation), will pass to the next neuron (if the output unit has high activation) and will be cleared (if the forget unit has high activation). The functions of the three units are mathematically formulated as follows:
f u = s i g m o i d ( W f x t + W H f H t 1 + b f )
i u = s i g m o i d ( W i x t + W H i H t 1 + b i )
o u = s i g m o i d ( W o x t + W H o H t 1 + b o )
c t = c t 1 ( f u ) t + ( i u ) t ( t a n h ( W c x t + W H c H t 1 + b c )
H t = o t t a n h ( c t 1 )
Equations (1)–(5) illustrate forget unit, input unit, output unit, current memory cell and the hidden unit, respectively, at time step t. The kernel functions are represented by tanh and sigmoid.
Here, W and b indicate weight matrices and bias variables of three units and memory cell units. H t 1 shows the previously hidden unit, which is an element-wise addition to weights of three units; c t denotes the current cell unit after processing. The element-wise multiplication between the input unit, cell unit and output unit of hidden layers is indicated by ⊗.
y n = f   ( y n 1 , y n 2 , y n 3 , )
y n + 1 = f   ( y n , y n 1 , y n 2 , )
In the next step, LSTM learns on the base of the state matrix pattern and their parameters are tuned. Processing is stopped until the Root Mean Square Error (RMSE) reaches the set value after the defined iteration. In particular, the RMSE at the first run is high and then rapidly decreases as the number of iterations increase; when the RMSE variations become negligible, we consider that the algorithm has been well tuned, i.e., the convergence has been reached.
Now, LSTM predicts the values during the testing data and the differences between observed and predicted values are calculated. If these differences are outside the pre-defined bounds   M ± 1.25 × I q r (M and Iqr are the Median and the Interquartile range, respectively), an anomalous day is detected. This threshold corresponds to two standard deviations for a Gaussian distribution of data and it has already been used successfully in previous works on pre-earthquake satellite data investigations [9,15].
In this study, in order to implement the LSTM method, each time series is divided into seventy percent (120 days) for training and thirty percent (51 days) for the purpose of testing and anomaly detection of the proposed LSTM methodology. The method is trained and applied to each time series separately. Such percentages have been selected as a compromise to improve the predicted trend performances and obtain a sufficiently long time to search for anomalies (one month or more); in fact, for example, fifty percent for training and testing periods does not provide reasonable trends. The parameters used in LSTM were selected as given in Table 1.

3. Observations

The potential seismo-ionospheric anomalies are detected in quiet solar geomagnetic conditions as defined by two geomagnetic indexes: ap that represents the global geomagnetic activity of the planet [36], and Dst that is calculated around the geomagnetic equator and very sensible to detect geomagnetic storms [37]. We also included the evaluation of the level of solar activity, monitoring the solar radio flux at a wavelength of 10.7 cm, simply denoted as F10.7. For our study, quiet conditions are defined as ap < 25 nT, |Dst|≤ 20 nT and F10.7 < 120 SFU (Solar Flux Unit).
Figure 2 shows the variations of ap, Dst and F10.7 indices during the period from 1 September 2020 to 18 February 2021. An asterisk shows the earthquake occurrence time. The x-axis illustrates the day relative to the earthquake day. The y-axis represents the universal time in (a) and (b), the F10.7 (SFU) value in (c).
Figure 3 shows the variations of magnetic field vector measured by the magnetometer of the Kakioka (KAK) Observatory during the same period of time. The geographic location of the observatory is 36.232°N, 140.186°E, being the closest working geomagnetic observatory of the INTERMAGNET network to the earthquake epicentre. Figure 3c shows striking anomalies 11 days before the earthquake. The perturbed geomagnetic days were indicated by “P” in the graph.
To detect the potential seismo-ionospheric anomalies, first during the period of study, only the tracks inside the Dobrovolsky area ( R = 10 0.43 M , where R is the radius in kilometres of the earthquake preparation zone and M is the earthquake magnitude [38]) at every day are selected. For this earthquake, the Dobrovolsky area radius is equal to about 1130 km. All tracks are then divided in two groups, i.e., day and night. In the next step, the median of each parameter, including the electron density and the electron temperature, is calculated and finally, the time series of the median values are constructed. Since the variations of the plasma parameters are affected by seasonal and nonlinear variations, a polynomial of degree 3 is fitted to the time series and the differences between the two curves as a new time series are considered.
Figure 4 shows the Swarm B satellite electron density residual variations during the period of study. The natural logarithm was computed to better investigate this quantity, and a 7-degree polynomial detrend has been applied to remove most seasonal variations. The x-axis represents the days relative to the earthquake day. The dashed vertical line indicates the earthquake date. Median and bounds are drawn as blue and green horizontal lines, respectively. The pre-defined allowed ranges are defined as ± 1.25 × I q r , which m and Iqr are the median and the inter-quartile range parameters, respectively. In this figure, the days accompanied with high geomagnetic activities are depicted with the ”P” symbol (that stands for “Perturbed”). It should be noted that the values of the median and the limits were calculated only by using the quiet geomagnetic days.
In Figure 5a the red curve denotes the observed natural logarithm of night-time electron density values measured by Swarm B, and the green curve shows the predicted values using the LSTM method during the testing days. Figure 5b represents the differences between the observed and predicted parameter values within the testing data. This figure clearly shows striking anomalies at 1, 3 and 4, 16, 20, 31 and 32 days prior to the earthquake. The deviation of the parameter from the allowed bounds on 1, 3 and 32 days before the event is noticeable.
Since the two satellites A and C operate in close orbits of the same altitude, their observed unusual variations in differences between their measurements could be considered as potential pre-earthquake rapid ionospheric anomalies during the quiet solar geomagnetic days.
Figure 6 shows the differences between the electron density values measured by satellites A and C in day-time. Clear anomalies are detected 6, 8, 9, 13 and 15 days before the earthquake. In Figure 7, using the LSTM method, striking anomalies are observed 6, 8, 12, 13 and 15 days before the event.
The other main anomalies detected in all measured plasma parameters using Swarm A, B, and C satellites and deduced from the Median and LSTM methods are listed in Table 2 and Table 3. Column 4 in these tables shows the day of anomaly occurrence with respect to the earthquake. All the anomalies are identified only during quiet geomagnetic times.
In order to detect potential seismo-magnetic anomalies, four magnetic field parameters measured by satellites A, B, and C, i.e., total intensity and vector (X, Y, Z) magnetic field components were analysed in the same conditions of electron density, i.e., during the same period from 1 September 2020 to 18 February 2021, inside the Dobrovolsky area.
In order to achieve this aim, first the difference between the measured magnetic parameter in nominal satellite conditions and the predicted value using the IGRF-12 (International Geomagnetic Reference Field, [39]) model is computed. These two mathematical operations permit removal of the main field, i.e., the core that is the main contribution to Earth’s magnetic field; in fact, we expect that the possible seismo-induced ionospheric disturbances could be very much smaller with respect to the core field, and so impossible to detect without pre-processing the data. Afterward, the median of the residuals of magnetic values of each track inside the Dobrovolsky area, separately for day and night, is calculated and the time series of the magnetic field median values during the period of study, i.e., from 1 September 2020 to 18 February 2021, is finally created. Additionally, to remove the seasonal and other long-term variations not predicted by the IGRF, a polynomial of degree 3 is fitted to the time series and the residual values are finally calculated. Additionally, a threshold value is defined here as m ± 1.25 × I q r . Therefore, we select those residual values of each observed magnetic field parameter if they exceed the pre-defined threshold in geomagnetically quiet conditions (|Dst| ≤ 20 nT, ap < 25 nT and F10.7 < 120).
Figure 8 illustrates the night-time Y magnetic field values measured by satellite B during the night-time of the period of study. Striking anomalies are seen 1, 8, 22, 23, and 35 days before the earthquake. The magnetic Y (east) component is usually less affected by external magnetic field variations.
Figure 9a shows the observed night-time magnetic field Y component value measured by Swarm B as a red curve and also denotes as a green curve the values predicted by using the LSTM method for the testing days. Inspecting Figure 9b, clear anomalies are shown 1, 8, 21, 22, 23 and 35 days prior to the earthquake.
Figure 10 and Figure 11 are similar to Figure 8 and Figure 9, respectively, but show the variations of magnetic field Y component data analysis from Swarm C at night-time. The striking anomaly observed on 1 day before the earthquake acknowledges the results obtained from the Swarm B data analysis.
The other main ionospheric anomalies detected in all measured magnetic and plasma parameters using Swarms A, B and C satellites deduced from the Median and LSTM methods are listed in Table 2 and Table 3.
A final investigation of atmospheric conditions in the same period previously explored with machine learning technique (i.e., the 45 days before the earthquake) has been applied to climatological datasets, in order to test and constrain better the lithosphere–atmosphere–ionosphere coupling (LAIC) theories before the Mw = 7.1 Japan 2021 earthquake. In fact, even if in this paper we test and propose a new method to search for ionospheric anomalies, we know that to have a complete frame of the phenomena we need to analyse also the atmosphere through which the possible disturbances propagates from lithosphere to ionosphere. The ECMWF ERA-5 climatological dataset of Skin Temperature (SKT), NOAA MERRA2 climatological dataset [40] data of sulphur dioxide (SO2), carbon monoxide (CO) and dimethyl sulphide and AQUA-AIRS methane data [41] were analysed. The results of the investigated parameters are shown in Figure 12, Figure 13, Figure 14, Figure 15 and Figure 16 with a red dashed curve for the value in the year of the earthquake, i.e., 2021, and a blue line is the mean of the same parameter calculated on the previous years for the same day and month, as described for the MEANS algorithm in Piscini et al. [42] and De Santis et al. [34]. The cyan, green and yellow bands are 1.0, 1.5 and 2.0 standard deviations, respectively, from the mean of the historical values for the specific day. In addition, due to the global warming phenomenon, the multi-year linear trend of skin temperature and methane was removed in the pre-processing of the historical time series. These atmospheric investigations have always been conducted in a smaller area than the Dobrovolsky area to avoid that the possible pre-earthquake anomalies could vanish in an area that is too large (for the spatial mean). The selection was based on the previous optimisation made for other earthquakes (e.g., Italian seismic sequence [32]) and on the parameter investigated, and is reported in the caption of each figure. We highlight the anomalies with red circles, where a bold red circle means a significant and more robust anomaly, to distinguish it with respect to weakly significant anomalies, at the threshold limit of two standard deviations, which was chosen for atmospheric data analyses.
The skin temperature presents two anomalous values overcoming the threshold of two standard deviations, with one more significant than the other. We also noted that the long term trend for the 2021 (red dashed curve) from −33 days until the earthquake is higher (almost flat) than the historical mean that decreases during these weeks. We see that only one day (−24) is under the mean, while the others are always above, although inside the range between 1.0 and 1.5 standard deviations (that in standard conditions is expected to contain only about 9.2% of the values, while they are instead 35%). Even if this effect is small as the absolute value, we can hypothesise that it is due to the rapid increase in stress (and consequently the number and the velocity of formation of microfractures) on the fault of the incoming earthquake as proposed and verified by several seismological analyses [43].
The other atmospheric parameters investigated show some single anomalous days: SO2 on days −26, −7, −3 and on the day of the earthquake; CO on days −23, −12 and a strong anomaly on the day of the earthquake; DMS on days −37 and −12; CH4 on days −43, −42, −41, −35, −34, −33, −25, −24, −18, −14 and −8 with respect to the earthquake day. The methane in the year of the earthquake (red dashed line) was also found to be constantly above its historical mean for the region (blue curve) in a similar way to the skin temperature. Some days are not visualised due to a lack of satellite coverage of the area. Moreover, we noted that the two anomalies detected in CO and SO2 on the day of the earthquake are probably a co-seismic effect as the time of the atmospheric data (local midnight) follows the earthquake occurrence by about 52 min.

4. Discussion and Conclusions

Table 2 and Table 3 illustrate the detected anomalies using the Median and LSTM methods. In the fifth column, all anomalous days detected are sorted according to their number of occurrences in the 52 time series that were analysed. In this study, the anomalous days detected were also checked by orbital analysis. It is shown that 1, 6, 8, 13, 31 and 32 days before the event are the main candidates that could be potentially seismo-ionospheric anomalies by running the two detectors of the Median and LSTM methods. In other words, they are obtained via a simple fusion technique, namely a voting technique. Among them, however, one day before the earthquake has an unusual deviation from the normal state in the main time series. Another interesting point is that satellite B for magnetic field Y component, Ne and Te at night-time show high sensitivity to seismic activity.
We noticed that the most anomalous values appeared 31 and 32 days before the earthquake. We need to note that around this time (exactly 31.89 days before the mainshock) an M5.9 was localised in the Dobrovolsky area (Figure 1), but its depth of more than 200 km and its not-so-high magnitude makes us confident to exclude a co-seismic ionospheric disturbance induced by this event and consider instead the recorded anomalies in this time more likely to be a precursor of M7.1 of February 13, 2021. Furthermore, this anticipation time is very close to the ones found for an increase in electron density before the M7.5 Indonesia 2018 (40 days) and M7.1 California Ridgecrest 2019 (33 days) earthquakes [33,34]. It is interesting to note that these events have a comparable earthquake magnitude with the Japan earthquake, although the Ridgecrest earthquake occurred in a different region and tectonic setting. Therefore, it would be compelling in future studies to verify further whether the ionosphere could respond 30–40 days before earthquakes with this range of magnitude. This fact would confirm the validity of Rikitake law [44], also recently established for satellites by De Santis et al. [20].
To be certain that the anomalies detected in the ionosphere are not due to orbital parameter changes of the Swarm satellites, we plotted the mean local time inside the investigated area as a function of the time (Figure 17). In fact, the Swarm satellite has a precession of the orbit which means that the tracks crossed every day at different longitude, without an exact revisiting time, and with a gradual shift of the local time as well visible in Figure 16. We note that there is a “jump” in local time from 18 LT to 6 LT for daytime about 20 days before the earthquake for Swarm Bravo satellite and 10 days before the earthquake for Swarm Alpha and Charlie satellites. Therefore, the anomalies extracted at those times are suspicious and might be due to the apparent effect of orbital configuration or result from sunlight irradiation change during the same orbit (light/shadow crossing along the orbit).
Detected ionospheric and atmospheric anomalies could be linked by a “diffusion” mechanism from the atmosphere to the ionosphere, with a time of about three days, as found by Piscini et al. [45] for the transmission of anomalies from the bottom atmosphere to the upper atmosphere before the 2016–2017 Italian seismic sequence. Despite some anomalies also occurring during the same day in the atmosphere and ionosphere, we consider less probable a fast coupling that would imply a pure electromagnetic phenomenon or pre-earthquake acoustic gravity wave, even if we cannot exclude at the present any other possible mechanisms. Future studies and investigations will be necessary to understand better this phenomenon and will provide, if possible, a physical/chemical interpretation of the coupling; in fact, with the present theories we can suggest that if the atmospheric and ionospheric anomalies one month and about 25 days before the event could be explained by a diffusion model such as the one proposed by Pulinets and Ouzounov [6,46], without excluding that some anomalies could occur at the same day, thus requiring a faster coupling model such as the one proposed by Kuo et al. (2014) [14]. If this phenomenon is found also in other case studies, we could even hypothesise that it evolves as a chain of chemical/physical processes induced by air ionisation and after a certain time some very low-frequency electromagnetic waves and/or direct electrical coupling between lithosphere, atmosphere and ionosphere circuits are nested. Additionally, in the case of the Indonesia 2018 earthquake [33], there appears to be a pre-earthquake coupling with a certain delay between the atmosphere and ionosphere anomalies (but of 1 month of delay and 3.7 months before the seismic event) and more than two months before a direct coupling on the same day for atmosphere and ionosphere (2 August 2018). The anticipation and delay times of these two case studies are very different, but the longer anticipation time is found for the event with a higher magnitude (Mw = 7.5 Indonesia) than the one described in this paper (Mw = 7.1, Japan), thus in accordance with the Rikitake law [44] mentioned above.
Given the low orbital separation between the Alpha and Charlie Swarm satellites, if an anomaly was detected at the same time by both satellites, it was counted only once. Finally, the results of this multi-method and multi-precursor analysis on 104 time series, during the day and night, acknowledge the papers and reports already published, which used Swarm data to detect potential seismo-ionospheric anomalies.

Author Contributions

Conceptualization, methodology and software, M.A., A.D.S., D.M. and T.W.; data curation, writing—original draft preparation, writing—reviewing and editing, M.A., A.D.S. and D.M. All authors have read and agreed to the published version of the manuscript.

Funding

This research was funded by INGV project FURTHER, MiUR grant number D53J19000170001, Italian Space Agency, grant number 2020-32-HH.0, National Natural Science Foundation of China, grant number 41974084.

Data Availability Statement

Swarm satellite data are freely available by ESA https/ftp server at https://swarm-diss.eo.esa.int/ (accessed on 21 March 2022).

Acknowledgments

The authors would like to acknowledge the European Space Agency (ESA) for the Swarm data, and the NASA Jet Propulsion Laboratory for the solar and geomagnetic indices. One of the results presented in this paper relies on the data collected at “Kakioka”, so we thank the Japan Meteorological Agency (JMA) for supporting its operation and INTERMAGNET for promoting high standards of magnetic observatory practice (www.intermagnet.org, accessed on 15 January 2022). Part of this work has been performed in the frame of some projects: INGV FURTHER, MiUR “Pianeta dinamico—Working Earth” and Limadou Science+, the latter funded by the Italian Space Agency. The research conducted in China is supported by National Natural Science Foundation of China through the “Research on anomaly extraction technology of seismic electromagnetic satellite data based on blind source separation” project (grant number 41974084).

Conflicts of Interest

The authors declare no conflict of interest. The funders had no role in the design of the study; in the collection, analyses, or interpretation of data; in the writing of the manuscript, or in the decision to publish the results.

References

  1. Geller, R.J. Earthquake prediction: A critical review. Geophys. J. Int. 1997, 131, 425–450. [Google Scholar] [CrossRef] [Green Version]
  2. Parrot, M. Use of satellites to detect seismo-electromagnetic effects, Main phenomenological features of ionospheric precursors of strong earthquakes. Adv. Space Res. 1995, 15, 1337–1347. [Google Scholar] [CrossRef]
  3. Hayakawa, M.; Molchanov, O.A. Seismo- Electromagnetics: Lithosphere-Atmosphere-Ionosphere Coupling. In Seismo Electromagnetics: Lithosphere-Atmosphere-Ionosphere Coupling; Terra Scientific Publishing Co.: Tokyo, Japan, 2002; p. 477. [Google Scholar]
  4. Pulinets, S.; Boyarchuk, K.A. Ionospheric Precursors of Earthquakes; Springer: Berlin/Heidelberg, Germany, 2004. [Google Scholar]
  5. Freund, F. Stress-activated positive hole charge carriers in rocks and the generation of pre-earthquake signals. In Electromagnetic Phenomena Associated with Earthquakes; Hayakawa, M., Ed.; Transworld Research Network: Trivandrum, India, 2009; pp. 41–96. [Google Scholar]
  6. Pulinets, S.; Ouzounov, D. Lithosphere-Atmosphere-Ionosphere Coupling (LAIC) model—An unified concept for earthquake precursors validation. J. Asian Earth Sci. 2011, 41, 371–382. [Google Scholar] [CrossRef]
  7. Sorokin, V.M.; Pokhotelov, O.A. Model for the VLF/LF radio signal anomalies formation associated with earthquakes. Adv. Space Res. 2014, 54, 2532–2539. [Google Scholar] [CrossRef]
  8. Liu, J.Y. Seismo-ionospheric precursors of the 2017 M7.3 Iran-Iraq Border Earthquake and the 2018 M5.9 Osaka Earthquake observed by FORMOSAT-5/AIP. In Proceedings of the EMSEV 2018, International Workshop Integrating Geophysical Observations from Ground to Space for Earthquake and Volcano Investigations Potenza, Basilicata, Italy, 17–21 September 2018. [Google Scholar]
  9. Akhoondzadeh, M.; Parrot, M.; Saradjian, M.R. Electron and ion density variations before strong earthquakes (M > 6.0) using DEMETER and GPS data. Nat. Hazards Earth Syst. Sci. 2010, 10, 7–18. [Google Scholar] [CrossRef] [Green Version]
  10. De Santis, A.; De Franceschi, G.; Spogli, L.; Perrone, L.; Alfonsi, L.; Qamili, E.; Cianchini, G.; Di Giovambattista, R.; Salvi, S.; Filippi, E.; et al. Geospace perturbations induced by the Earth: The state of the art and future trends. Phys. Chem. Earth 2015, 85-86, 17–33. [Google Scholar] [CrossRef] [Green Version]
  11. Deb, A.; Gazi, M.; Barman, C. Anomalous soil radon fluctuations—signal of earthquakes in Nepal and eastern India regions. J. Earth Syst. Sci. 2016, 125, 1657–1665. [Google Scholar] [CrossRef]
  12. Kojima, H.; Yoshino, C.; Nemoto, K.; Hattori, K.; Konishi, T.; Furuya, R. Multi-channel singular spectrum analysis of underground Rn concentration at Asahi station, Boso Peninsula, Japan: Preliminary report on relation between the variation of underground Rn flux and the local seismic activity. JAE Lett. 2020, 39, 46–51. [Google Scholar] [CrossRef]
  13. Freund, F.; Ouillon, G.; Scoville, J.; Sornette, D. Earthquake precursors in the light of peroxy defects theory: Critical review of systematic observations. Eur. Phys. J. Spec. Top. 2021, 230, 7–46. [Google Scholar] [CrossRef]
  14. Kuo, C.L.; Lee, L.C.; Huba, J.D. An improved coupling model for the lithosphere-atmosphere-ionosphere system. J. Geophys. Res. Space Phys. 2014, 119, 3189–3205. [Google Scholar] [CrossRef]
  15. Akhoondzadeh, M. A MLP neural network as an investigator of TEC time series to detect seismo-ionospheric anomalies. Adv. Space Res. 2013, 51, 2048–2057. [Google Scholar] [CrossRef]
  16. Akhoondzadeh, M. Anomalous TEC variations associated with the powerful Tohoku earthquake of 11 March 2011. Nat. Hazards Earth Syst. Sci. 2012, 12, 1453–1462. [Google Scholar] [CrossRef] [Green Version]
  17. Liu, X.; Zhao, D. Upper and lower plate controls on the great 2011 Tohoku-oki earthquake. Sci. Adv. 2018, 4, eaat4396. [Google Scholar] [CrossRef] [PubMed] [Green Version]
  18. Bagiya, M.S.; Thomas, D.; Astafyeva, E.; Bletery, Q.; Lognonné, P.; Ramesh, D.S. The Ionospheric view of the 2011 Tohoku-Oki earthquake seismic source: The first 60 seconds of the rupture. Sci. Rep. 2020, 10, 5232. [Google Scholar] [CrossRef]
  19. Gutenberg, B.; Richter, C.F. Seismicity of the Earth and Associated Phenomena, 2nd ed.; Princeton, N.J., Ed.; Princeton University Press: Princeton, NJ, USA, 1954. [Google Scholar]
  20. De Santis, A.; Marchetti, D.; Pavón-Carrasco, F.J.; Cianchini, G.; Perrone, L.; Abbattista, C.; Alfonsi, L.; Amoruso, L.; Campuzano, S.A.; Carbone, M.; et al. Precursory worldwide signatures of earthquake occurrences on Swarm satellite data. Sci. Rep. 2019, 9, 20287. [Google Scholar] [CrossRef] [Green Version]
  21. Friis-Christensen, E.; Lühr, H.; Hulot, G. Swarm: A constellation to study the Earth’s magnetic field, Earth. Planets Space 2006, 58, 351–358. [Google Scholar] [CrossRef] [Green Version]
  22. Léger, J.M.; Jager, T.; Bertrand, F.; Hulot, G.; Brocco, L.; Vigneron, P.; Lalanne, X.; Chulliat, A.; Fratter, I. In-flight performance of the Absolute Scalar Magnetometer vector mode on board the Swarm satellites. Earth Planets Space 2015, 67, 57. [Google Scholar] [CrossRef] [Green Version]
  23. Merayo, J.M.; Jørgensen, J.L.; Friis-Christensen, E.; Brauer, P.; Primdahl, F.; Jørgensen, P.S.; Allin, T.H.; Denver, T. The Swarm Magnetometry Package. In Small Satellites for Earth Observation; Sandau, R., Röser, H.P., Valenzuela, A., Eds.; Springer: Dordrecht, The Netherlands, 2008. [Google Scholar] [CrossRef]
  24. Knudsen, D.J.; Burchill, J.K.; Buchert, S.C.; Eriksson, A.I.; Gill, R.; Wahlund, J.-E.; Åhlen, L.; Smith, M.; Moffat, B. Thermal ion imagers and Langmuir probes in the Swarm electric field instruments. J. Geophys Res. Space Phys. 2017, 122, 2655–2673. [Google Scholar] [CrossRef]
  25. Haagmans, R.; Bock, R.; Rider, H. Swarm; ESA’s Magnetic Field Mission. 2013. Available online: https://earth.esa.int/documents/700255/1805948/ESA+magnetic+field+mission/36942f02-b2d4-4787-af81-eb19efb74265 (accessed on 15 January 2022).
  26. van den IJssel, J.; Forte, B.; Montenbruck, O. Impact of Swarm GPS receiver updates on POD performance. Earth Planets Space 2016, 68, 85. [Google Scholar] [CrossRef] [Green Version]
  27. Akhoondzadeh, M.; De Santis, A.; Marchetti, D.; Shen, X. Swarm-TEC Satellite Measurements as a Potential Earthquake Precursor Together with Other Swarm and CSES Data: The Case of Mw7.6 2019 Papua New Guinea Seismic Event. Front. Earth Sci. 2022, 10, 820189. Available online: https://www.frontiersin.org/articles/10.3389/feart.2022.820189 (accessed on 15 January 2022). [CrossRef]
  28. De Santis, A.; Balasis, G.; Pavón-Carrasco, F.J.; Cianchini, G.; Mandea, M. Potential earthquake precursory pattern from space: The 2015 Nepal event as seen by magnetic Swarm satellites. Earth Planet Sci. Lett. 2017, 461, 119–126. [Google Scholar] [CrossRef] [Green Version]
  29. Akhoondzadeh, M.; De Santis, A.; Marchetti, D.; Piscini, A.; Cianchini, G. Multi precursors analysis associated with the powerful Ecuador (Mw = 7.8) earthquake of 16 April 2016 using Swarm satellites data in conjunction with other multi-platform satellite and ground data. Adv. Space Res. 2018, 61, 248–263. [Google Scholar] [CrossRef] [Green Version]
  30. Akhoondzadeh, M.; De Santis, A.; Marchetti, D.; Piscini, A.; Jin, S. Anomalous seismo-LAI variations potentially associated with the 2017 Mw = 7.3 Sarpol-e Zahab (Iran) earthquake from Swarm satellites, GPS-TEC and climatological data. Adv. Space Res. 2019, 64, 143–158. [Google Scholar] [CrossRef]
  31. Marchetti, D.; Akhoondzadeh, M. Analysis of Swarm satellites data showing seismo-ionospheric anomalies around the time of the strong Mexico (Mw=8.2) earthquake of 08 September 2017. Adv. Space Res. 2018, 62, 614–623. [Google Scholar] [CrossRef]
  32. Marchetti, D.; De Santis, A.; D’Arcangelo, S.; Poggio, F.; Piscini, A.; Campuzano, S.; De Carvalho, W.V.J.O. Pre-earthquake chain processes detected from ground to satellite altitude in preparation of the 2016–2017 seismic sequence in Central Italy. Remote Sens. Environ. 2019, 229, 93–99. [Google Scholar] [CrossRef]
  33. Marchetti, D.; De Santis, A.; Shen, X.; Campuzano, S.A.; Perrone, L.; Piscini, A.; Giovambattista, R.D.; Jin, S.; Ippolito, A.; Cianchini, G.; et al. Possible Lithosphere-Atmosphere-Ionosphere Coupling effects prior to the 2018 Mw = 7.5 Indonesia earthquake from seismic, atmospheric and ionospheric data. J. Asian Earth Sci. 2020, 188, 104097. [Google Scholar] [CrossRef]
  34. De Santis, A.; Cianchini, G.; Marchetti, D.; Piscini, A.; Sabbagh, D.; Perrone, L.; Campuzano, S.A.; Inan, S. A multiparametric approach to study the preparation phase of the 2019 M7.1 Ridgecrest (California, USA) Earthquake. Front. Earth Sci. 2020, 8, 540398. [Google Scholar] [CrossRef]
  35. Hochreiter, S.; Schmidhuber, J. Long short-term memory. Neural Comput. 1997, 9, 1735–1780. [Google Scholar] [CrossRef]
  36. Matzka, J.; Bronkalla, O.; Tornow, K.; Elger, K.; Stolle, C. Geomagnetic Kp index. V. 1.0. GFZ Data Serv. 2021. [Google Scholar] [CrossRef]
  37. Nose, M.; Iyemori, T.; Sugiura, M.; Kamei, T. World Data Center for Geomagnetism. Geomagn. Dst Index 2015. [Google Scholar] [CrossRef]
  38. Dobrovolsky, I.R.; Zubkov, S.I.; Myachkin, V.I. Estimation of the size of earthquake preparation zones. Pure Appl. Geophys. 1979, 117, 1025–1044. [Google Scholar] [CrossRef]
  39. Thébault, E.; Finlay, C.C.; Beggan, C.D.; Alken, P.; Aubert, J.; Barrois, O.; Bertrand, F.; Bondar, T.; Boness, A.; Brocco, L.; et al. International Geomagnetic Reference Field: The 12th generation. Earth Planets Space 2015, 67, 79. [Google Scholar] [CrossRef]
  40. Gelaro, R.; McCarty, W.; Suárez, M.J.; Todling, R.; Molod, A.; Takacs, L.; Randles, C.A.; Darmenov, A.; Bosilovich, M.G.; Reichle, R.; et al. The Modern-Era Retrospective Analysis for Research and Applications, Version 2 (MERRA-2), American Meteorological Society—Modern-Era Retrospective analysis for Research and Applications version 2 (MERRA-2) special collection. J. Clim. 2017, 30, 5419–5454. [Google Scholar] [CrossRef] [PubMed]
  41. Parkinson, C.L. Aqua: An Earth-Observing Satellite mission to examine water and other climate variables. IEEE Trans. Geosci. Remote Sens. 2003, 41, 173–183. [Google Scholar] [CrossRef]
  42. Piscini, A.; Marchetti, D.; De Santis, A. Multi-parametric climatological analysis associated with global significant volcanic eruptions during 2002–2017. Pure Appl. Geophys. 2019, 176, 3629–3647. [Google Scholar] [CrossRef]
  43. Scholz, C. The Mechanics of Earthquakes and Faulting, 3rd ed.; Cambridge University Press: Cambridge, UK, 2019. [Google Scholar] [CrossRef] [Green Version]
  44. Rikitake, T. Earthquake precursors in Japan: Precursor time and detectability. Tectonophysics 1987, 136, 265–282. [Google Scholar] [CrossRef]
  45. Piscini, A.; De Santis, A.; Marchetti, D.; Cianchini, G. A Multiparametric Climatological Approach to Study the 2016 Amatrice–Norcia (Central Italy) Earthquake Preparatory Phase. Pure Appl. Geophys. 2017, 174, 3673–3688. [Google Scholar] [CrossRef]
  46. Pulinets, S.; Ouzounov, D. The Possibility of Earthquake Forecasting; Learning from Nature; IOP Publ.: Bristol, UK, 2018. [Google Scholar]
Figure 1. M5+ earthquakes localised by the USGS (https://earthquake.usgs.gov/earthquakes accessed on 21 March 2022) in the Dobrovolsky area for the M7.1 13 February 2021 Japan event. (a) Map of the events. (b) Gutenberg–Richter distribution of the earthquakes (their number is represented by “#”). (c) Magnitude as a function of the time with an indication of the depth by the colour bar. The events with M > 5.5 are highlighted by labels with indications of days with respect to the Japan earthquake (negative days if occurring before the mainshock and positive if occurring after) and their magnitude.
Remotesensing 14 01582 g001
Figure 2. The variations of ap, Dst and solar radio flux (F10.7) indices are shown in ac, respectively, during the period from 1 September 2020 to 18 February 2021. An asterisk indicates the earthquake occurrence time in (a,b) ((a) vertical dashed line in (c)). The x-axis represents the day relative to the earthquake day. In (a,b), the shaded scale is chosen such that white indicates calm magnetic periods, while black stands for perturbed magnetic periods; the plot in (c) shows that F10.7 is always under the threshold of 120 SFU.
Remotesensing 14 01582 g002
Figure 3. KAK magnetometer (36.232°N, 140.186°E) measurements (a) x, (b) y and (c) z during the period from 1 September 2020 to 18 February 2021. The dashed black vertical line indicates the earthquake day. The symbol “P” indicates a perturbed value by a geomagnetic storm.
Remotesensing 14 01582 g003
Figure 4. Results of Swarm B electron density data analysis for the Japan earthquake (13 February 2021) from 1 September 2020 to 18 February 2021 at night-time. The natural logarithm and 7-degree polynomial detrend have been applied to the time series. Blue and green lines represent the median value and the selected thresholds to detect the anomalies. If a day experiences some geomagnetic perturbation, it is depicted with the letter “P” on the graph.
Remotesensing 14 01582 g004
Figure 5. (a) Variations of the observed (red curve) and the predicted (green curve) night-time natural logarithm of the electron density measured by Swarm B and obtained by the LSTM method during testing days. (b) Variations of the differences between the observed and the predicted values of electron density obtained by the LSTM method during testing days. The green horizontal lines indicate the upper and lower bounds as m ± 1.25 × I q r . The blue horizontal line indicates the median value (M). In both figures, the x-axis represents the day relative to the earthquake day. The geomagnetically “perturbed” days are highlighted by a “P”.
Remotesensing 14 01582 g005
Figure 6. Results of Swarm A and C electron density differences for the Japan earthquake (13 February 2021) from 1 September 2020 to 18 February 2021 during the day-time. The geomagnetically “perturbed” days are highlighted by a “P”.
Remotesensing 14 01582 g006
Figure 7. (a) Variations of the observed (red curve) and the predicted (green curve) values of the differences between the electron density (ED) values measured by satellites A and C obtained by the LSTM method during testing days at day-time. (b) Variations of the differences between the observed values of the electron density (ED) values measured by satellites A and C and predicted values obtained by the LSTM method during testing days at day-time. The geomagnetically “perturbed” days are highlighted by a “P”. Please note that here the values are not given as their natural logarithm.
Remotesensing 14 01582 g007
Figure 8. Results of magnetic field Y component data analysis from Swarm B for the Japan earthquake (13 February 2021) from 1 September 2020 to 18 February 2021 at night-time. The geomagnetically “perturbed” days are highlighted by a “P”.
Remotesensing 14 01582 g008
Figure 9. (a) Variations of the observed (red curve) and the predicted (green curve) night-time Y magnetic field measured by Swarm B and obtained by the LSTM method during testing days. (b) Variations of the differences between the observed and the predicted values of the Y magnetic field obtained by the LSTM method during testing days. The geomagnetically “perturbed” days are highlighted by a “P”.
Remotesensing 14 01582 g009
Figure 10. Results of Y magnetic field data analysis from Swarm C for the Japan earthquake (13 February 2021) from 1 September 2020 to 18 February 2021 at night-time. The geomagnetically “perturbed” days are highlighted by a “P”.
Remotesensing 14 01582 g010
Figure 11. (a) Variations of the observed (red curve) and the predicted (green curve) night-time Y magnetic field measured by Swarm C and obtained by the LSTM method during testing day. (b) Variations of the differences between the observed and the predicted values of Y magnetic field obtained by the LSTM method during testing days. The geomagnetically “perturbed” days are highlighted by a “P”.
Remotesensing 14 01582 g011
Figure 12. Atmospheric analysis of Skin Temperature (SKT) concentration in the 45 days before the Mw = 7.1 Japan 13 February 2021 earthquake in a square area of 6° size centred on the epicentre. We highlight the anomalies with red circles, where a bold red circle means a significant and more robust anomaly, to distinguish it with respect to weakly significant anomalies, at the threshold limit of two standard deviations, which was chosen for atmospheric data analyses.
Remotesensing 14 01582 g012
Figure 13. Atmospheric analysis of sulphur dioxide (SO2) concentration in the 45 days before the Mw = 7.1 Japan 13 February 2021 earthquake in a square area of 3° size centred on the epicentre. For the estimation of the background values, the year 2001 was excluded due to its abnormal values. We highlight the anomalies with red circles, where a bold red circle means a significant and more robust anomaly.
Remotesensing 14 01582 g013
Figure 14. Atmospheric analysis of surface carbon monoxide (CO) concentration in the 45 days before the Mw = 7.1 Japan 13 February 2021 earthquake in a square area of 3° size centred on the epicentre. We highlight the anomalies with red circles, where a bold red circle means a significant and more robust anomaly.
Remotesensing 14 01582 g014
Figure 15. Atmospheric analysis of dimethyl sulphide (DMS) concentration in the 45 days before the Mw = 7.1 Japan 13 February 2021 earthquake in a square area of 3° size centred on the epicentre. We highlight the anomalies with bold red circles, as significant and more robust anomalies.
Remotesensing 14 01582 g015
Figure 16. Atmospheric analysis of methane (CH4) concentration in the 45 days before the Mw = 7.1 Japan 13 February 2021, earthquake in a round area of 4° radius centred on the epicentre. Gaps in the 2021 time series (red dashed line) are due to unavailable values for some poor (or even absent) satellite coverage in the area. We highlight the anomalies with red circles, where a bold red circle means a significant and more robust anomaly.
Remotesensing 14 01582 g016
Figure 17. Swarm local time as a function of time during the period investigated in this study. The two “borders” (i.e., the terminators) between night and day at 6 LT and 18 LT are underlined by black dashed lines. Swarm Alpha and Charlie are represented by red dots (their local time is very close to each other) while the local time of Swarm Bravo is shown by blue dots.
Remotesensing 14 01582 g017
Table 1. Parameter setting of the LSTM method.
ParameterValue
Layers3
No. of features in sequence input layer1
No. of hidden units in LSTM layer200
No. of responses in fully connected layer1
Max epochs300
Initial learning rate0.005
SolverAdam
Gradient threshold1
Table 2. The observed anomalies from 45 days before the earthquake using the Median/Interquartile method.
Detected Anomalies Using Median/Interquartile Method
SatelliteMeasured Parameter (D: Day, N: Night)Anomalous DaySorted by Voting
DayRank
Swarm
Alpha
Electron DensityD−13−32
−31
−6
−8
−1
−13
−18
−9
−15
−5
−20
−21
−23
−27
−30
−4
−11
−16
−24
−2
−12
−25
−26
−28
−33
−36
−3
−10
−14
−22
−29
−17
−34
−35
(13)
(12)
(11)
(9)
(8)
(8)
(7)
(6)
(6)
(5)
(5)
(5)
(5)
(5)
(5)
(4)
(4)
(4)
(4)
(3)
(3)
(3)
(3)
(3)
(3)
(3)
(2)
(2)
(2)
(2)
(2)
(1)
(1)
(1)
N−31, −32
Electron TemperatureD−12 to −16
N−−−
Magnetic ScalarD−2, −4, −5, −6, −8, −9, −18
N−11, −22, −31 to −33
Magnetic Vector xD−4, −5, −6, −8, −9, −18
N−11, −22, −31 to −33
Magnetic Vector yD−6, −8, −9, −20, −27
N−1, −8, −13, −32
Magnetic Vector zD−1, −34
N−3, −21, −31
Slant TECD−11, −13, −21
N−12, −16, −20, −31
Vertical TECD−21, −36
N−5, −20
Swarm
Bravo
Electron DensityD−24, −32
N−1, −4, −32
Electron TemperatureD−6, −18, −23, −27
N−15, −23
Magnetic ScalarD−6, −18
N−1, −10, −31, −32
Magnetic Vector xD−6, −18
N−10, −23, −31 to −33
Magnetic Vector yD−−−−−
N−1, −8, −22, −23, −35
Magnetic Vector zD−−−−−
N−−−−−
Slant TECD−30, −32
N−−−−−
Vertical TECD−20, −24, −30, −32
N−5, −8
Swarm
Charlie
Electron DensityD−6, −13
N−31, −32, −36
Electron TemperatureD−1, −3, −8, −9, −13 to −18, −27 to −30
N−16, −23 to −30
Magnetic ScalarD−2, −4, −5, −6, −8, −9, −18, −26
N−11, −24, −31, −32
Magnetic Vector xD−5, −6, −8, −9, −18
N−31, −32
Magnetic Vector yD−6, −20, −27
N−1, −10, −32
Magnetic Vector zD−1, −6, −25, −31
N−21, −31
Slant TECD−33
N−15
Vertical TECD−21, −36
N−11
Swarm
Alpha-Charlie
Electron DensityD−6, −8, −9, −13, −15
N−2, −4, −31
Electron TemperatureD−12, −13, −15, −26, −30
N−25, −28
Table 3. The observed anomalies using LSTM method.
Detected Anomalies Using LSTM Method
SatelliteMeasured Parameter (D: Day, N: Night)Anomalous DaySorted by Voting
DayRank
Swarm
Alpha
Electron DensityD−6, −13−31
−32
−8
−5
−13
−1
−23
−6
−21
−9
−22
−3
−12
−15
−18
−4
−24
−2
−14
−16
−17
−25
−20
−26
−30
−35
−10
−28
−29
−33
(18)
(14)
(13)
(12)
(11)
(10)
(10)
(9)
(8)
(7)
(7)
(6)
(5)
(5)
(5)
(4)
(4)
(4)
(4)
(3)
(3)
(3)
(3)
(2)
(2)
(2)
(1)
(1)
(1)
(1)
N−1, −4, −31, −32
Electron TemperatureD−12, −13, −15
N−1, −8, −24
Magnetic ScalarD−2, 4, −5, −6, −8, −9, −26
N−11, −22, −31, −32
Magnetic Vector xD−1, −3, −6
N−11, −18, −22, −31, −32
Magnetic Vector yD−6, −8
N−1, −18, −32
Magnetic Vector zD−5, −11, −35
N−3, −6, −18, −21, −29, −31
Slant TECD−3, −5, −11, −13, −21
N−5, −16, −20, −31
Vertical TECD−11, −21, −26
N−5, −13,
Swarm
Bravo
Electron DensityD−6, −11, −21, −22, −24, −32
N−1, −3, −4, −16,−20, −31, −32
Electron TemperatureD−6, −18, −23,−31, −32, −35
N −15, −16, −23
Magnetic ScalarD−6, −17
N−1, −31, −32
Magnetic Vector xD−6
N−1, −22, −23, −31, −32
Magnetic Vector yD−12, −13, −25
N−1, −15, −20, −22, −23, −30, −31, −42
Magnetic Vector zD−8, −13, −18
N−23
Slant TECD−21, −31, −32
N−5, −8, −11, −31
Vertical TECD−30, −32
N−5, −32
Swarm
Charlie
Electron DensityD−8, −9,−13, −14, −22, −23
N−5, −8, −9, −31, −32
Electron TemperatureD−1, −3
N−16
Magnetic ScalarD−4, −6, −8, −9
N−11, −24, −31, −32
Magnetic Vector xD−1, −3, −22, −23, −24, −25
N−11, −22, −31, −32
Magnetic Vector yD −8, −9
N−1, −10, −32
Magnetic Vector zD−5, −8, −9, −13, −14
N−18, −31
Slant TECD−3, −5, −14, −21
N−15, −33
Vertical TECD−21, −31
N−2, −5, −8
Swarm
Alpha-Charlie
Electron DensityD5, −9, −13, −15
N−23, −31
Electron TemperatureD−6, −8, −12, −13, −15, −34
N−25, −28
Publisher’s Note: MDPI stays neutral with regard to jurisdictional claims in published maps and institutional affiliations.

