Review

Plant Viral Disease Detection: From Molecular Diagnosis to Optical Sensing Technology—A Multidisciplinary Review

1
School of Agriculture, Food & Wine, Waite Research Institute, University of Adelaide, PMB 1, Glen Osmond, Adelaide, SA 5064, Australia
2
School of Biological Sciences, The University of Adelaide, Molecular Life Sciences Building, North Terrace Campus, Adelaide, SA 5005, Australia
3
Research Institute for the Environment and Livelihoods, Charles Darwin University, Casuarina, NT 0810, Australia
4
The Australian Wine Research Institute, Glen Osmond, Adelaide, SA 5064, Australia
*
Author to whom correspondence should be addressed.
Remote Sens. 2022, 14(7), 1542; https://doi.org/10.3390/rs14071542
Submission received: 18 February 2022 / Revised: 17 March 2022 / Accepted: 19 March 2022 / Published: 23 March 2022
(This article belongs to the Special Issue Precision Agriculture Using Hyperspectral Images)

Abstract

:
Plant viral diseases result in productivity and economic losses to agriculture, necessitating accurate detection for effective control. Lab-based molecular testing is the gold standard for providing reliable and accurate diagnostics; however, these tests are expensive, time-consuming, and labour-intensive, especially at the field-scale with a large number of samples. Recent advances in optical remote sensing offer tremendous potential for non-destructive diagnostics of plant viral diseases at large spatial scales. This review provides an overview of traditional diagnostic methods followed by a comprehensive description of optical sensing technology, including camera systems, platforms, and spectral data analysis to detect plant viral diseases. The paper is organized along six multidisciplinary sections: (1) Impact of plant viral disease on plant physiology and consequent phenotypic changes, (2) direct diagnostic methods, (3) traditional indirect detection methods, (4) optical sensing technologies, (5) data processing techniques and modelling for disease detection, and (6) comparison of the costs. Finally, the current challenges and novel ideas of optical sensing for detecting plant viruses are discussed.

Graphical Abstract

1. Introduction

Plant diseases have plagued agricultural production since antiquity. It is estimated that 20–40% of crop yield losses worldwide are caused by plant diseases, of which plant viruses are the second most significant contributor [1,2]. Viral diseases affect crop growth, reduce yield, influence the survival of scions, and impact fruit quality, consequently causing significant economic losses [3].
Major crop viral disease incidents and economic consequences have been reported worldwide [4,5,6]. In 1993–1994, tomato yellow leaf curl virus decreased tomato production by 75% and cost more than USD 10 million in the Dominican Republic [7]. Cotton leaf curl virus caused nearly 30% cotton yield loss worth USD 5 billion in Pakistan between 1992 and 1997 [8]. Rice tungro disease is a devastating viral disease that affects rice production in many countries in southeast Asia; a USD 1.5 billion annually economic loss was estimated due to this disease [5]. For woody perennial crops like fruit trees and grapevines, yield losses are not confined to one season, but multiple seasons. A 14-year field study in New Zealand found that apple tree yield and fruit size decreased gradually over this period due to apple mosaic virus infection, and up to two-thirds of yield loss was observed in the severely infected trees [9]. Atallah et al. [10] reported that Grapevine leafroll disease (GLD) could have a negative long term economic impact if the viral infection is not managed. The same study estimated that losses of between USD 25,000 and USD 40,000 ha−1 could be incurred over 25 years in a vineyard in New York State (USA). In addition, indirect damages contributing to the economic loss include the cost of roguing vines, leaving the vineyard fallow for 3–5 years to remove vectors harbouring in the rhizosphere (e.g., nematodes), and the time between replanting to the recovery to full productivity also needs to be considered [11]. Plant viruses affect not only crop yield but also the quality of downstream products. A study showed that red wine colour intensity is reduced by GLD, which may lower the wine’s price and the financial return to the winery [12]. In addition, numerous unreported and undiscovered plant viral infections make the true extent of yield loss difficult to ascertain. Viruses may cause far more significant economic losses than what is usually recognised.
Managing viral disease in the field can be challenging due to its insidious and persistent nature. Unlike other pathogens, plant viruses are incorporated in the plant genome and therefore cannot be eliminated using chemicals [13]. Infected plants are unlikely to be cured; hence they must be removed and destroyed to minimise further spreading. Viruses can be rapidly transmitted between plants in the field by vectors like insects and nematodes or spread through human activities. Insecticides have some degree of control for vectors to limit the spread of viruses; however, it is not a preferred solution due to the cost associated with ecosystem damage and concerns regarding human health risks and the possibility of vectors developing resistance [14,15]. Thus, most viral disease management strategies are preventative, including using certified virus-free planting materials, breaking down the disease cycle by removing infected plants, vector control, and breeding virus-resistant plants [14].
As part of an effective disease control strategy, detection and diagnosis perform vital roles. Traditionally, direct and indirect plant viral disease detection methods have been distinguished. Direct methods are lab-based testing methods that are either based on detecting DNA, RNA, or virus proteins. While these methods are reliable and accurate, they are expensive, time-consuming, and destructive, mandating alternative options [16,17,18]. Indirect methods, including visual assessment and biological indexing methods, have been used to overcome cost and logistic limitations. However, visual assessment by human eyes is unreliable due to the different levels of experience of the surveyors, whereas biological indexing using indicator plants for viral disease diagnosis is excessively time-consuming [19].
Recent advances in imaging and data processing technologies have accelerated the development of rapid virus detection methods based on remote and proximal optical sensors. It is thus timely and opportune to review recent developments. This paper reviews optical sensing methodologies, data processing, and disease classification modelling methods from a multidisciplinary perspective. A multidisciplinary approach has the advantage that it utilises a diverse array of tools ranging from traditional molecular biology approaches to state-of-the-art sensing and detection methods, providing analysis and insight that would not be possible with any of these tools individually. We believe that this approach has not been thoroughly reviewed in the literature on plant viruses.
We begin by giving a brief overview of how viruses affect plants and then discuss current direct diagnostic techniques and traditional indirect methods. We then describe optical sensing technology and disease prediction modelling methods for virus detection, followed by a comparison of the economics associated with using different sensing methods. We conclude with a discussion of the current challenges and outstanding opportunities for enhancing methods for plant viral disease detection.

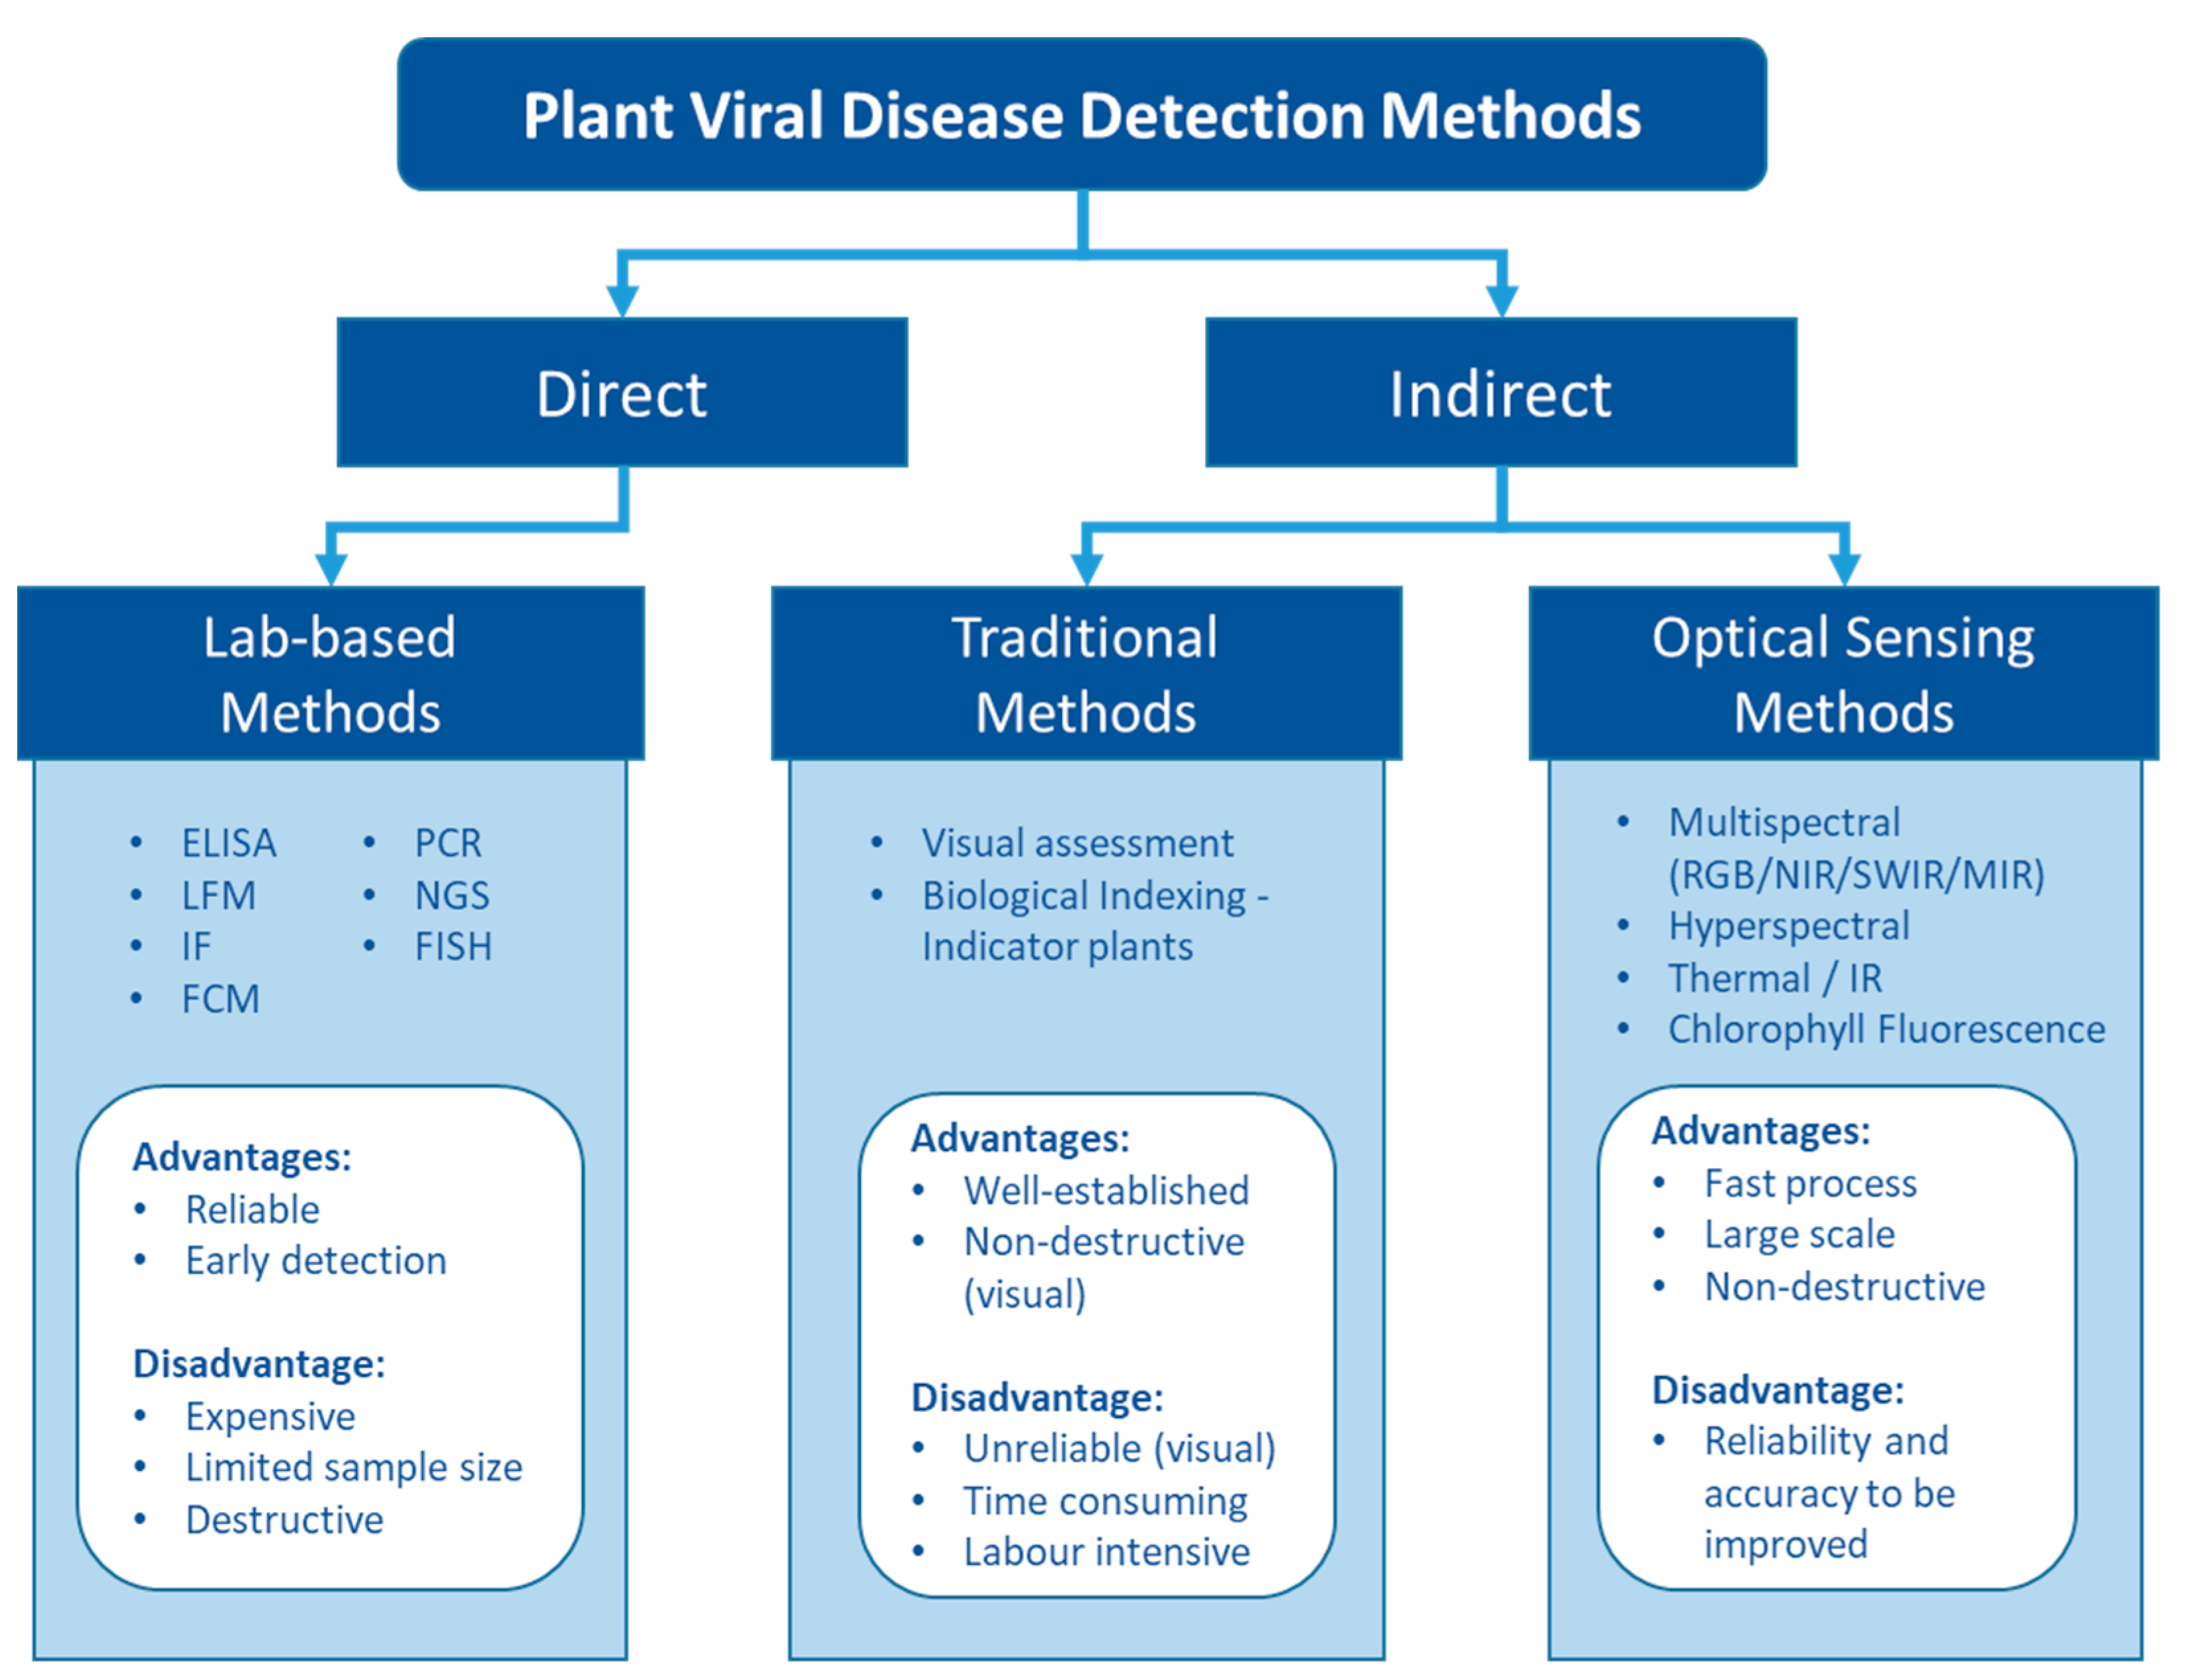
2. Detection of Viruses

2.1. Background-Physiological and Phenotypic Changes of Plants Affected by Viruses

Unlike living organisms that possess a cellular structure, viruses only consist of a set of one or more nucleic acid template molecules (DNA or RNA) which are covered by a coat protein [20]. They lack the protein-coding capacity of living cells and thus need to parasitise a host to utilise the host cells’ transcription machinery to replicate [13]. Replication can occur in most cells—mesophyll, epidermis, parenchyma, phloem companion, and bundle sheath [21]. Infections result in various physiological and biochemical changes that can lead to disease. Viral disease has been observed to alter amino acids and phytohormone levels, cause cell structure distortion, degrade chloroplasts to lower leaf photosynthetic capacity, and decrease nutrient uptake to retard plant growth and development [22,23]. These physiological changes can be visualised and detected as disease symptoms. For example, Gutha et al. [24] showed that a typical symptom-reddish-purple colour in red grape cultivars was caused by grapevine leafroll associated virus 3 (GLRaV-3) mainly due to the accumulation of anthocyanin in grape leaves. They also found that chlorophyll and carotenoid content were 20% less in the infected leaves than in the healthy plants, which may enhance the symptoms. Other studies suggested that insect-borne plant viruses could modify the plant pigments level to attract the vectors to spread the viruses [25,26]. Moreover, other phytochemicals that can be influenced by plant viruses include carbohydrates, polyphenols, and oxidative enzymes such as peroxidase, catalase, ascorbate peroxidase, and superoxide dismutase [27]. These chemicals can be indirectly and non-destructively estimated by eyes or optical sensors as an indication of virus infection (Figure 1).
Fundamentally, plant viruses can be either directly detected by finding their genomic sequence and viral protein or indirectly assessed via the plant phenotypic response to the virus (Figure 1). Numerous plant virus detection methods have been developed to date. The rapid development of molecular and biochemical technologies has ushered in a new era of virus detection over the last few decades. Today, various lab-based diagnosis methods are available for plant virus detection [16,18,28,29]. These methods are generally sensitive and reliable and have been widely used for plant virus diagnostics.
Indirect methods that assess the plant response include traditional methods to detect virus symptoms visually in the field and novel approaches to assess the altered phenotype using optical sensors. The key advantages of these three major detection methods are related to reliability and the ability to provide efficient sampling (Figure 1).

2.2. Direct Methods

There are two major direct diagnostic methods: serological and nucleic acid. Serological methods developed in the mid-1960s use antibodies produced from an animal’s immune system to detect plant viruses [30,31]. The enzyme-labelled antibodies that bind to specific viral proteins (antigens) are readily observable and measurable through spectrophotometry [30,32]. In 1977, using the ‘double-antibody sandwich’ (DAS) form of enzyme-linked immunosorbent assay (ELISA), Clark and Adams [33] demonstrated the efficiency of the DAS-ELISA method to quantify virus concentration in plants. This method is economical and suitable for a quantity of testing compared to many other lab-based methods and continues to be widely used for plant viral disease detection. Another convenient serological diagnostic tool is the lateral flow device (LFD). It uses the virus antibodies attached to nitrocellulose membrane strip with coloured nanoparticles to produce results [34,35,36]; it has been used as a rapid, in-field detection method for plant viruses. Immunofluorescence (IF) is a technique commonly used in microbiology. Using fluorescent dye-labelled antibodies to bind the antigens, IF allows for the visualisation of plant viruses via microscopy that provides valuable information on the intracellular distribution of viruses [37,38].
Nucleic acid-based methods have been used for plant virus detection since 1979 and directly target viral DNA or RNA fragments [39]. In 1985, the revolutionary nucleic acid-based polymerase chain reaction (PCR) method was developed by Saiki et al. [40], which significantly improved plant virus diagnosis. After multiple amplification cycles in two hours, PCR can duplicate a single DNA strand up to 109-fold, which dramatically increases the sensitivity and effectiveness of the virus detection [41]. Based on PCR, many modifications and improvements were subsequently developed and extensively used in plant virus detection, including reverse transcription PCR (RT-PCR), quantitative PCR (qPCR), and loop-mediated isothermal amplification (LAMP). As most plant viruses are RNA viruses, and RNA degrades rapidly under ambient conditions, it is common to reverse-transcribe unstable RNA to more stable complementary DNA (cDNA), which are then amplified using PCR [42]. Today, RT-PCR is the most used method for plant virus diagnosis due to its capability to detect viruses at low concentrations or titer levels [43,44]. Several studies have shown that RT-PCR is more sensitive than ELISA for plant virus detection, with fewer false-negative results [44,45,46,47,48,49,50]. The qPCR, also referred to as real-time PCR, can quantify the virus titre level in the samples by measuring the DNA concentration after each amplification step during the PCR process [51,52]. The loop-mediated isothermal amplification (LAMP) technique is a promising method developed in 2000 by Notomi et al. [53]. Comparing conventional PCR, LAMP does not require a high precision thermocycler to amplify DNA. It is simpler, faster, lower-cost, and has increased popularity in plant virus detection.
Other nucleic acid-based methods have recently been developed to study and detect plant viruses. Next-generation sequencing (NGS), also known as high-throughput sequencing, is a powerful technology that can rapidly sequence the entire viral genome [28,54,55]. NGS provides a comprehensive methodology for detecting and studying plant viruses and has been instrumental in discovering previously unknown viruses and hosts for known viruses [56,57,58]. Fluorescence in situ hybridisation (FISH) uses fluorescent-labelled probes to detect the target virus nucleic acid [59]. FISH can detect and localise the viruses in plants and vectors tissues, which provides a better understanding of virus epidemiology within plant tissues, therefore potentially implicated for disease management [60,61]. Flow cytometry (FCM) can detect multiple plant viruses simultaneous in a sample [62]. It uses a laser beam to excite the fluorescence-labelled antibodies or nucleic acid probes in a fluid stream. By analysing the pass through fluorescence and scattered laser light, FCM can detect specific viruses and measure genome size and gene expression [63].
Lab-based methods remain the gold standard for the detection of plant viruses. They are highly sensitive, accurate, and reliable. They directly target the virus and do not require a plant response, and thus, they can be used for early warning of the disease. However, these methods require special attention to plant tissue sampling and sample processing to avoid cross-contamination, which is labour intensive and time-consuming. Several detection methods also require sophisticated equipment and expensive materials [64]. In light of these costs, it is economically unviable for large numbers of plants, and hence, it cannot be used to obtain representative samples of viruses at the scale of large industrial production farms. Instead, a small proportion of plants are sampled randomly, standard field patterns like X or W patterns, or strategically according to visual assessment to represent the overall disease status in a field [65,66]. However, an insufficient test rate could cause hit-and-miss situations; this is especially unacceptable for critical industries such as nurseries.

2.3. Traditional Indirect Methods

Identifying disease symptoms by eye is the simplest indirect method to detect viruses. Due to physiological changes, viruses-infected plants can show typical symptoms such as mosaic patterns on the leaf, yellowing, leaf rolling, ring spots, necrotic tissues, wilting, and nodulating [13]. Accordingly, most names of plant viruses are related to the typical symptom(s) caused to their major host. Visually identifying these typical symptoms is a quick and simple disease detection method. However, the ease of utilising this approach comes with the drawback of low accuracy for reasons that include individual variability of the surveyors, different infection rates, the developmental stage of disease, and complexity of symptoms [67]. Similar symptoms can manifest from various biotic and abiotic stresses such as nutrient deficiency, fungal or bacterial diseases, environmental factors, or mechanical damage to the plants, further reducing the accuracy.
Virus infections do not always produce apparent visual symptoms in the host plants, making accurate disease detection challenging. Biological indexing was a method developed to address this challenge; it relies on specific indicator plants that have been selected to help identify the disease symptoms. The indicator plants are susceptible species or varieties that usually develop typical symptoms once inoculated with the pathogenic viruses [68]. Biological indexing is able to confirm the potential virus that does not produce symptoms in certain plants, discover an unusual host plant for the virus, and quantify the virus [68]. Biological indexing continues to be used as a complementary method to lab-based testing methods [69]. However, the major disadvantage of using indicator plants is the long duration from inoculation to the development of disease symptoms; this process could take several weeks to months [19]. In addition, symptoms of indicator plants may also vary based on environmental conditions. Constable et al. [70] found that rugose wood symptoms on Rupestris St George indicator plants could not be observed in a cold climate, but could be detected in a hot climate. In contrast, the GLD symptoms appeared in Cabernet Franc in a cool climate, but no symptom was found in the hot climate site for the same treatments, limiting the suitability of this variety as an indicator.
Nowadays, various studies use optical sensors instead of traditional detection methods. Such sensing technology has the advantage of detecting a broader range of spectrums than the human eye, and recently, it was mimicked using computer vision to detect disease in the human brain.

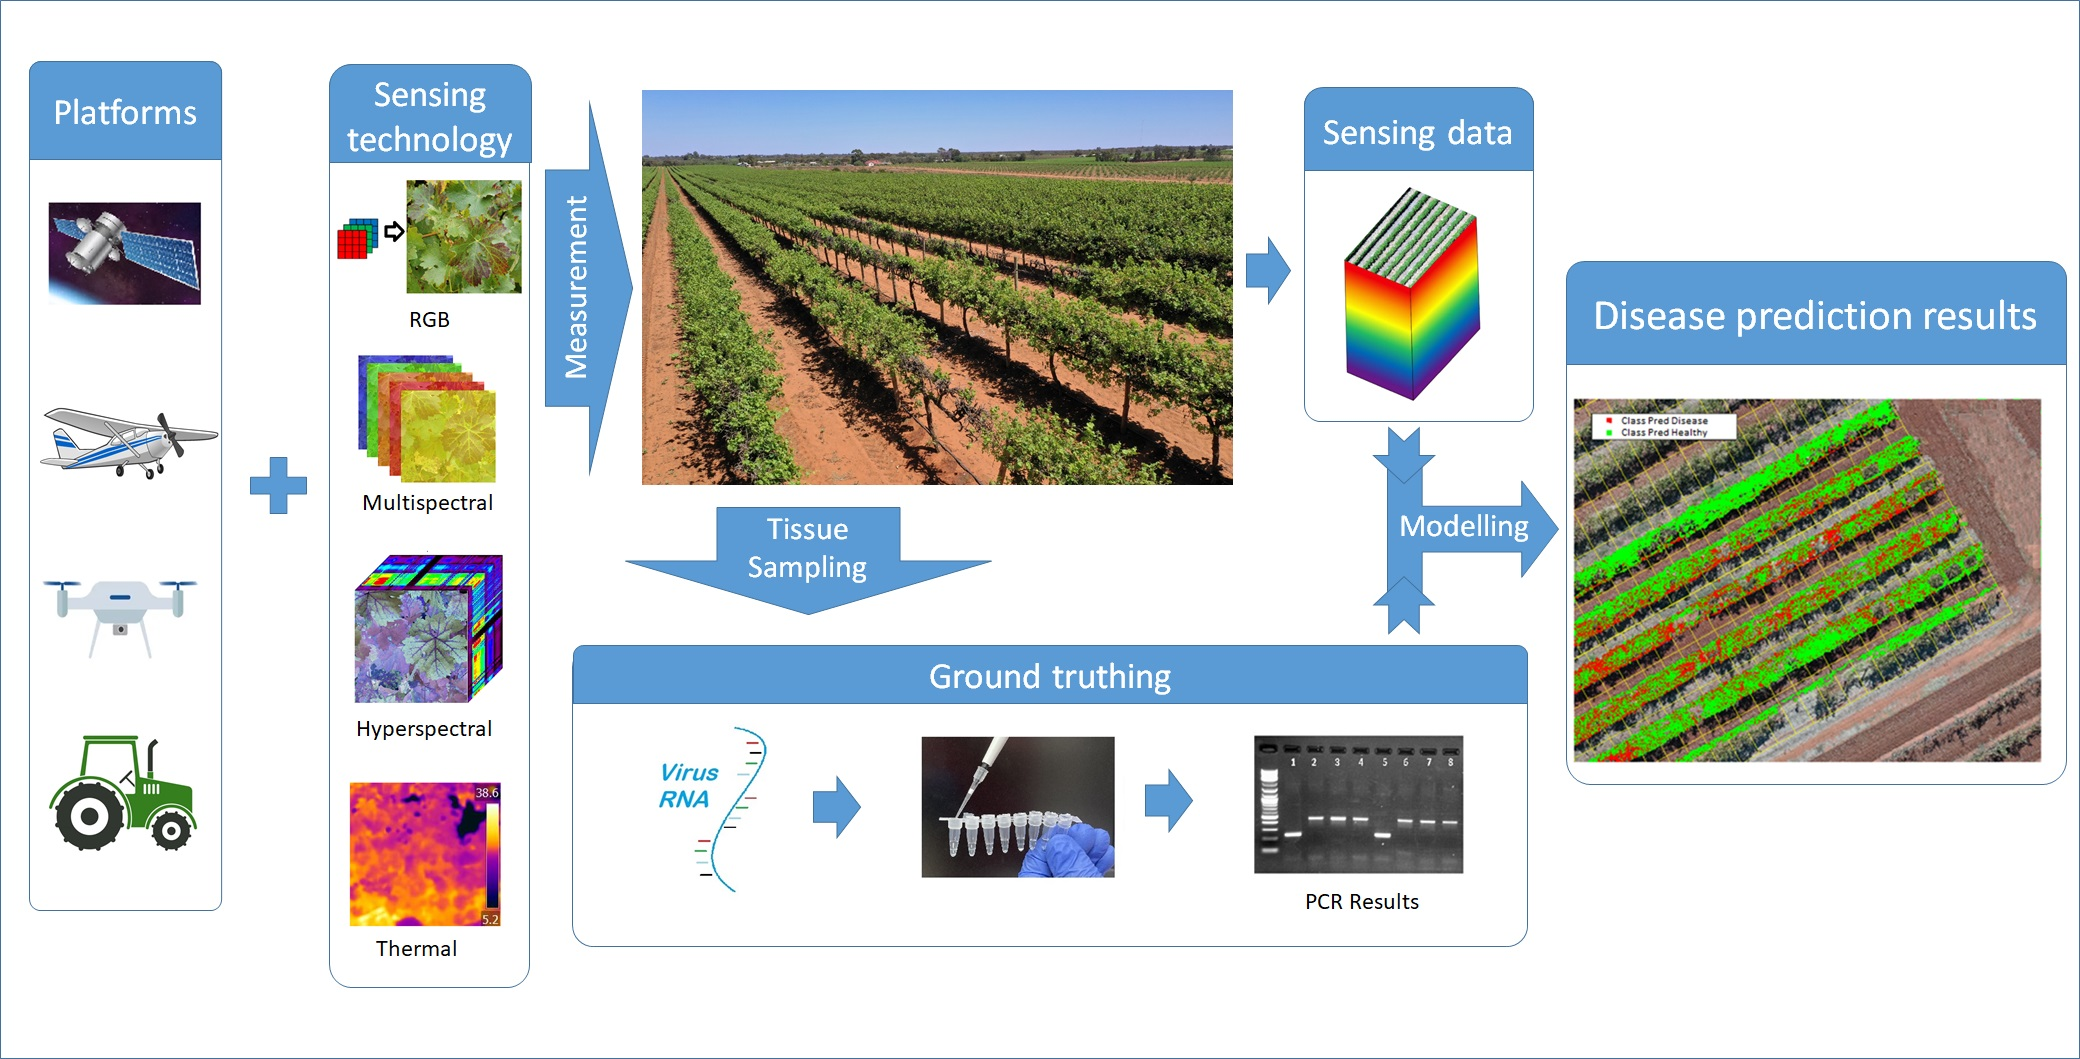
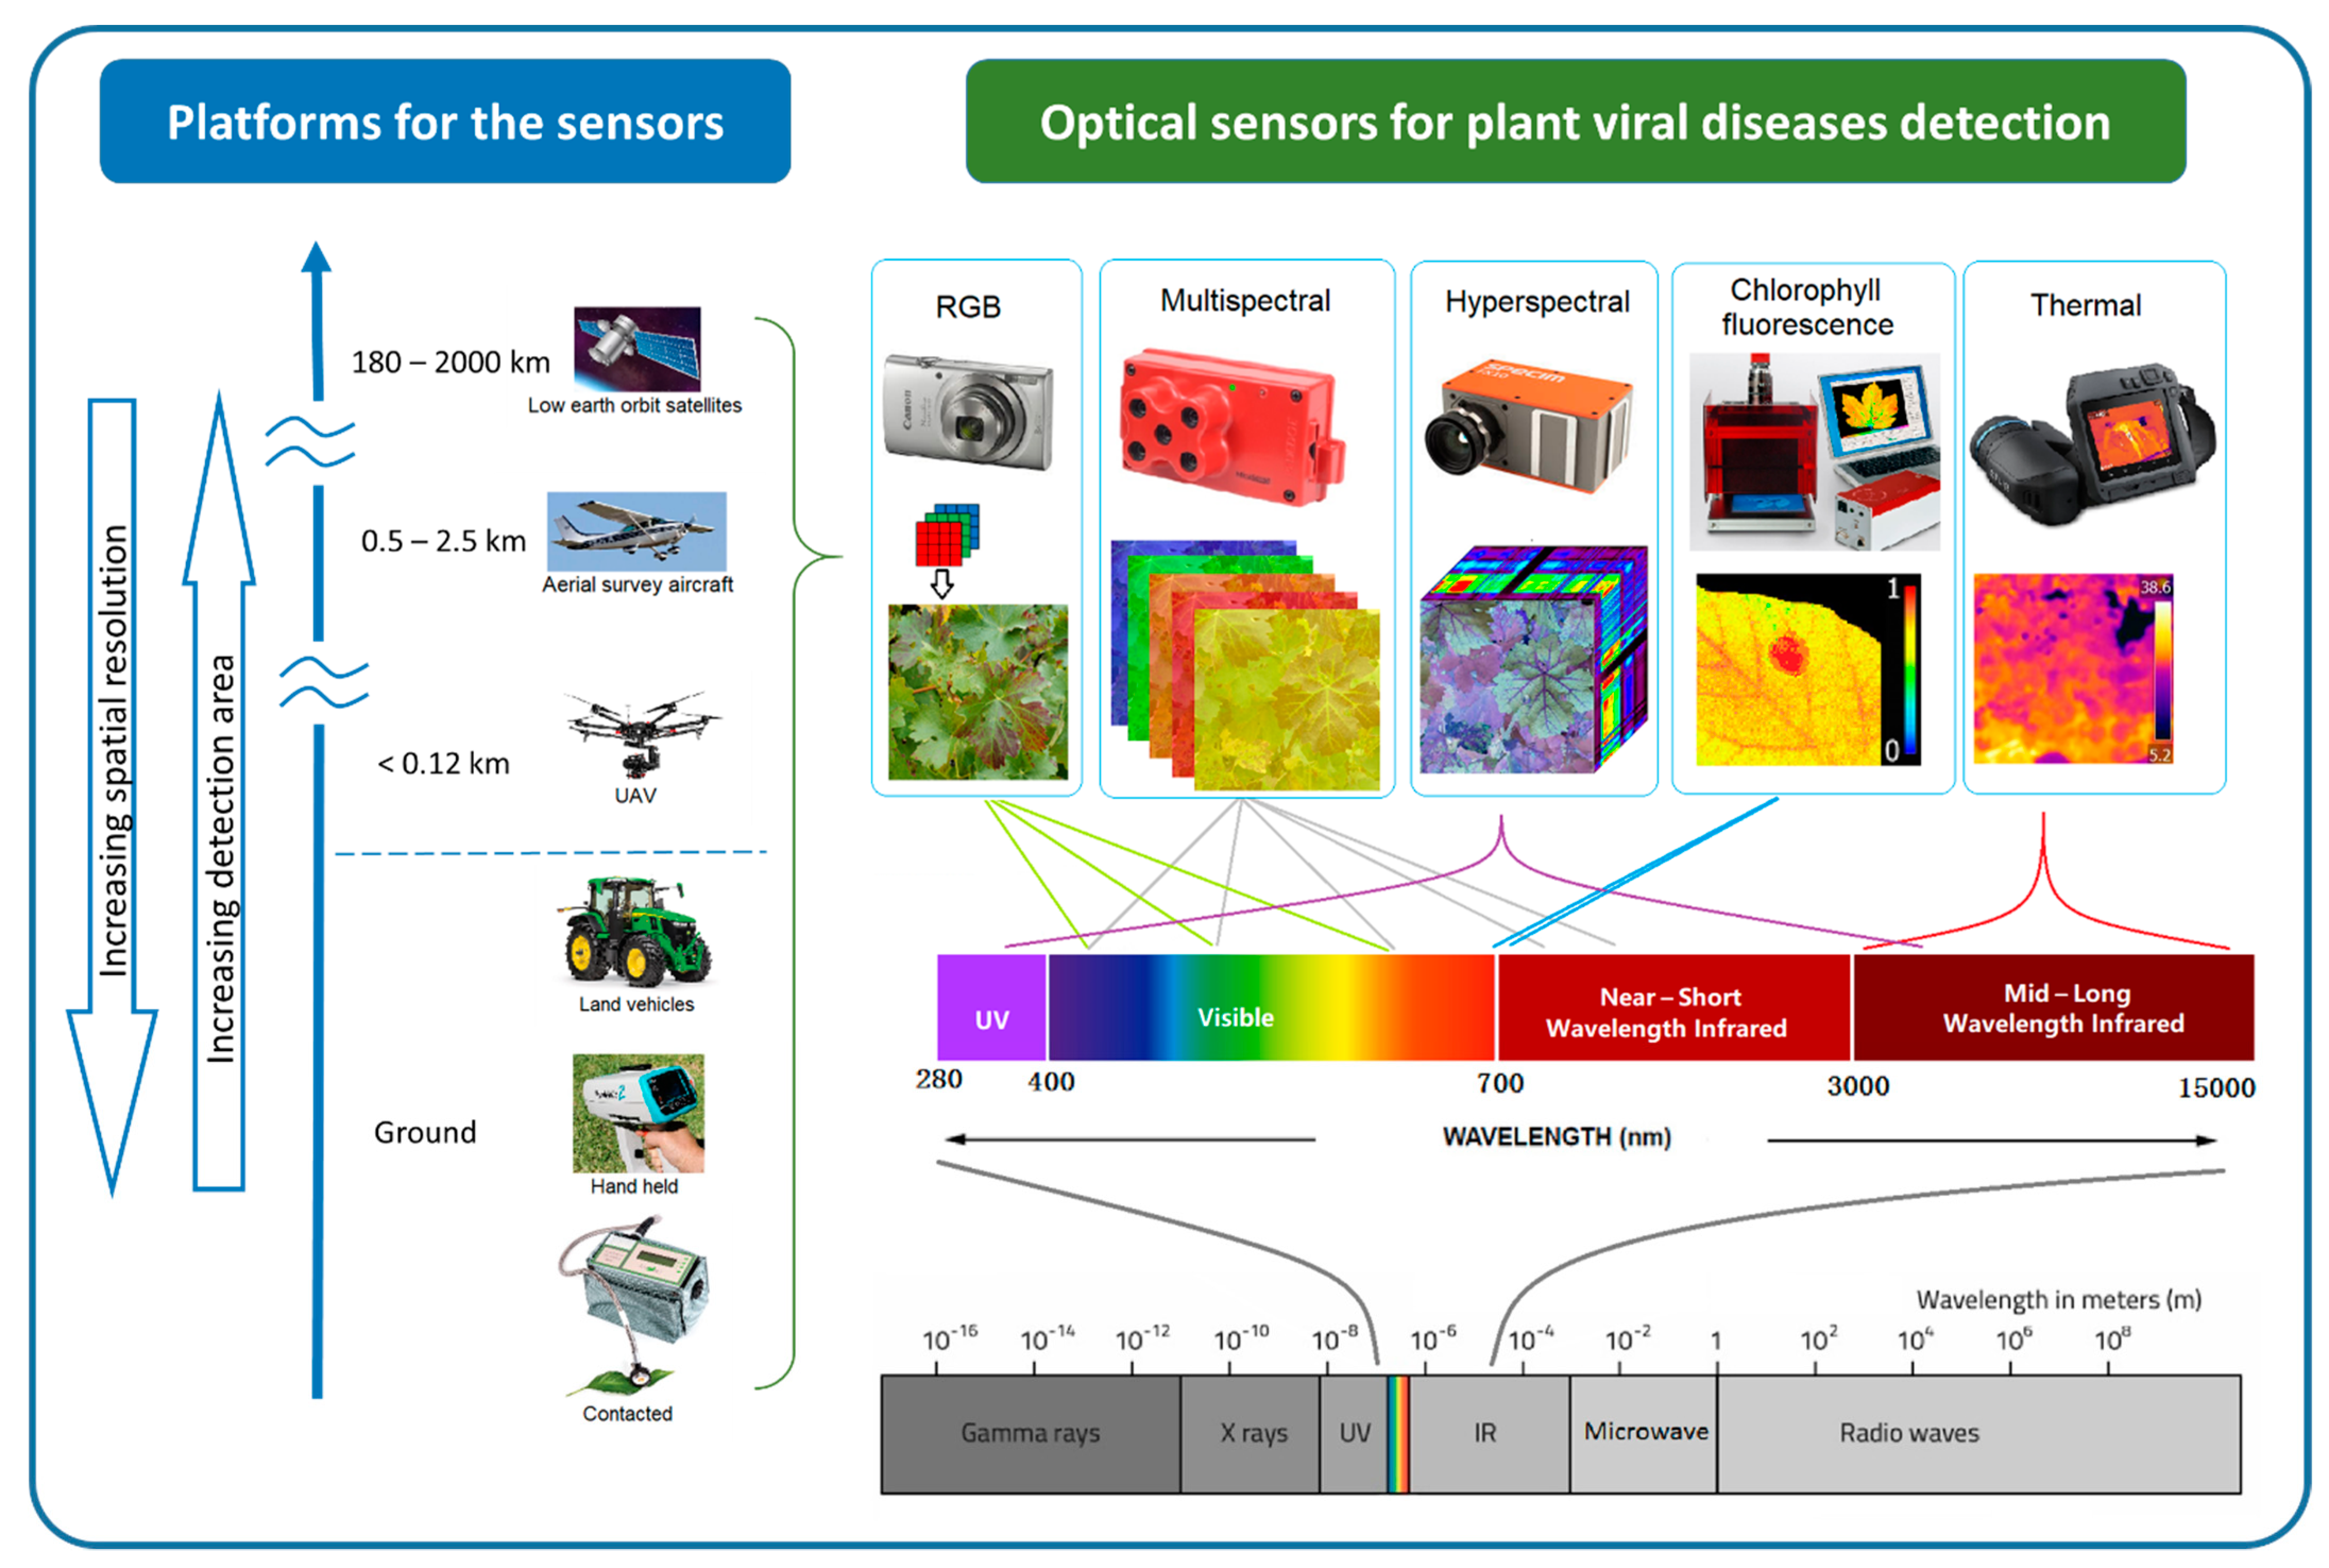
2.4. Optical Sensing Technologies in Plant Viral Disease Detection

Optical sensors measure the frequency and intensity of light, both of which can be interpreted as meaningful information using multivariate statistical techniques. The sensing process is similar to that of human vision, but it has the ability to detect wavelengths of light beyond the visible spectrum detectable by the human eye [71]. The different sensors can measure specific regions of the electromagnetic spectrum, from ultraviolet (UV) to long-wave infrared (LWI). Using optical sensing technologies, subtle phenotype changes caused by the disease are detectable. The sensing technology presents rapid and non-destructive alternatives to the molecular techniques of plant disease detection [17,18] and increases the objectivity of field-based visual assessment. There is a wide variety of optical sensing methods that can be classified by their platforms and associated scale of imagery, as well as by their spectral characteristics [72,73,74,75,76]. Figure 2 illustrates various sensing technologies, their spectral ranges, and platforms that can be used for plant viral disease detection.
At the finest scale, optical sensors can be used directly on contact on leaves, proximally on ground vehicles and hand-held. Some non-imaging sensors like chlorophyll fluorimeter, GreenSeeker, laser thermometer, and spectroradiometer are usually used proximally or directly in contract with the leaf [77]. By increasing the sensing distance, imaging sensors can be used proximally (e.g., mounted on tractors) or remotely (e.g., airborne platforms such as unmanned aerial vehicles (UAV), airplanes, and satellites) to support regional disease management [78]. Generally, increasing sensing distance results in decreasing spatial resolution. Satellite images provide the broadest land coverage but have the lowest spatial resolution. Manned airplanes can capture higher spatial resolution in a moderate area compared to satellite images. UAVs or drones can carry light-weight optical sensors flying as low as a few meters above ground [79,80,81], potentially providing millimetre spatial resolution images for plant viral disease detection.
In the order of increasing spectral detail, we find the RGB (red, green, and blue), multispectral, and hyperspectral systems. RGB systems have similar sensitivity as the human eye and thus produce images that can be readily interpreted [82]. Modern RGB cameras are user-friendly and readily available to the public, which means they can bring a large number of datasets available for plant disease identification. Community shared databases of plant disease infected images have been used for plant disease identification in recent studies using computer vision techniques [83,84]. In addition, low altitude, high-resolution aerial photos from UAV have produced a high-popularity in-field plant disease detection [18,85,86].
Multispectral sensors measure specific spectral wavelength regions across the electromagnetic spectrum; different regions or bands can be selected depending on the purpose of usage [87]. Multispectral cameras have been commonly used in remote sensing to explore land use, characterise vegetation, and monitor the environment and urban structures [88]. For agricultural purposes, the spectral bands in multispectral cameras are selected based on the vegetation characteristics of light absorption and reflection at different wavelengths. Typically, RGB, combined with the unique vegetative reflectance regions, red edge (690–740 nm) and near-infrared (NIR) (700–1300 nm) bands, are used in multispectral sensors [89,90]. This information enables the computation of specific vegetation indices (VIs) that can be used to evaluate different characteristics of the vegetation. For example, by contrasting the absorption and reflectance in red and NIR spectral regions, the well-known normalized difference vegetation index (NDVI) can be calculated [91,92].
Hyperspectral sensors capture hundreds of contiguous narrow bands (2–20 nm) across a range of spectra (UV, visible, near-infrared (VNIR) to short-wave infrared (SWIR)) instead of few discrete broad bands as do multispectral sensors [93]. The highest spectral detail is obtained by sensing single point spectroradiometers rather than imaging, for example, ASD FieldSpec 4 and Ocean Optics USB4000. These sensors are mostly used proximally or directly in contract with the plants. Various studies have shown that spectral reflection signals change with plant viral infections and have demonstrated the method’s potential for early or asymptomatic stage detection [94,95,96,97,98]. A hyperspectral imaging system provides both spatial and spectral information to produce a 3-dimensional (3D) data cube [99]. Hyperspectral imaging data present a potentially significant advantage in plant disease studies at broader scales. MacDonald et al. [100] were able to detect GLD in vineyards using an aircraft-mounted hyperspectral system. They achieved a prediction accuracy of 94.1% on average compared to visual survey results using specific leaf reflectance spectra using a spectroradiometer reported by Naidu et al. [95]. Wang et al. [101] used proximal sensing hyperspectral images to predict tomato spotted wilt virus infected region on the bell pepper plant. This study achieved 96.2% accuracy on plant level detection by evaluating the healthy and diseased pixel ratio, which demonstrated the potential of the hyperspectral image to predict viral infections on asymptomatic leaves.
Chlorophyll fluorescence (Chl-Fl) and infrared (IR) thermal sensors have also been used for plant virus detection. Chl-Fl is an important parameter for plant health and stress expression [102,103]. Many studies have used Chl-Fl as the laboratory’s analysis tool for plant virus infection and demonstrated the likelihood of using Chl-Fl to detect plant virus infection at an early disease stage [104,105,106,107,108,109]. The passive method that uses solar radiation to measure fluorescence rate (known as solar-induced chlorophyll fluorescence) remotely for vegetation stress has also been attempted for plant stress detection [110,111,112,113,114,115,116]. The thermal sensor is predominantly used in precision agriculture to detect and monitor crop biotic and abiotic stress [80,117]. Spatial and temporal thermography patterns have shown potential for the early detection of viral disease. For example, Chaerle et al. [118] demonstrated that a resistant response (cell death) to tobacco mosaic virus (TMV) infection on the tobacco leaves could be detected by thermography rapidly after inoculation, eight hours before visible symptoms were apparent. Similarly, Zhu et al. [119] successfully distinguished the tomato mosaic disease plants five days before the visual symptom appeared using thermal imaging.
Besides those field applicable sensors, other technologies like Raman spectroscopy, Nuclear Magnetic Resonance (NMR) spectroscopy, and optical coherence tomography (OCT) have been used in the lab to detect plant virus diseases. Raman spectroscopy has been used for chemical analysis for decades. Various studies have demonstrated that Raman spectroscopy has the capability to detect plant virus infection at an early stage [120,121,122]. Some portable Raman spectroscopy is also available for in-field use [123]. NMR spectroscopy is used to determine the chemical and physical properties of matter. Some studies used NMR spectroscopy to detect plant metabolic changes caused by virus infection [124,125]. An OCT system can see through the material and detect the morphological structure of cells. Various studies have used OCT to detect plant virus infection in leaves and seeds [126,127,128].

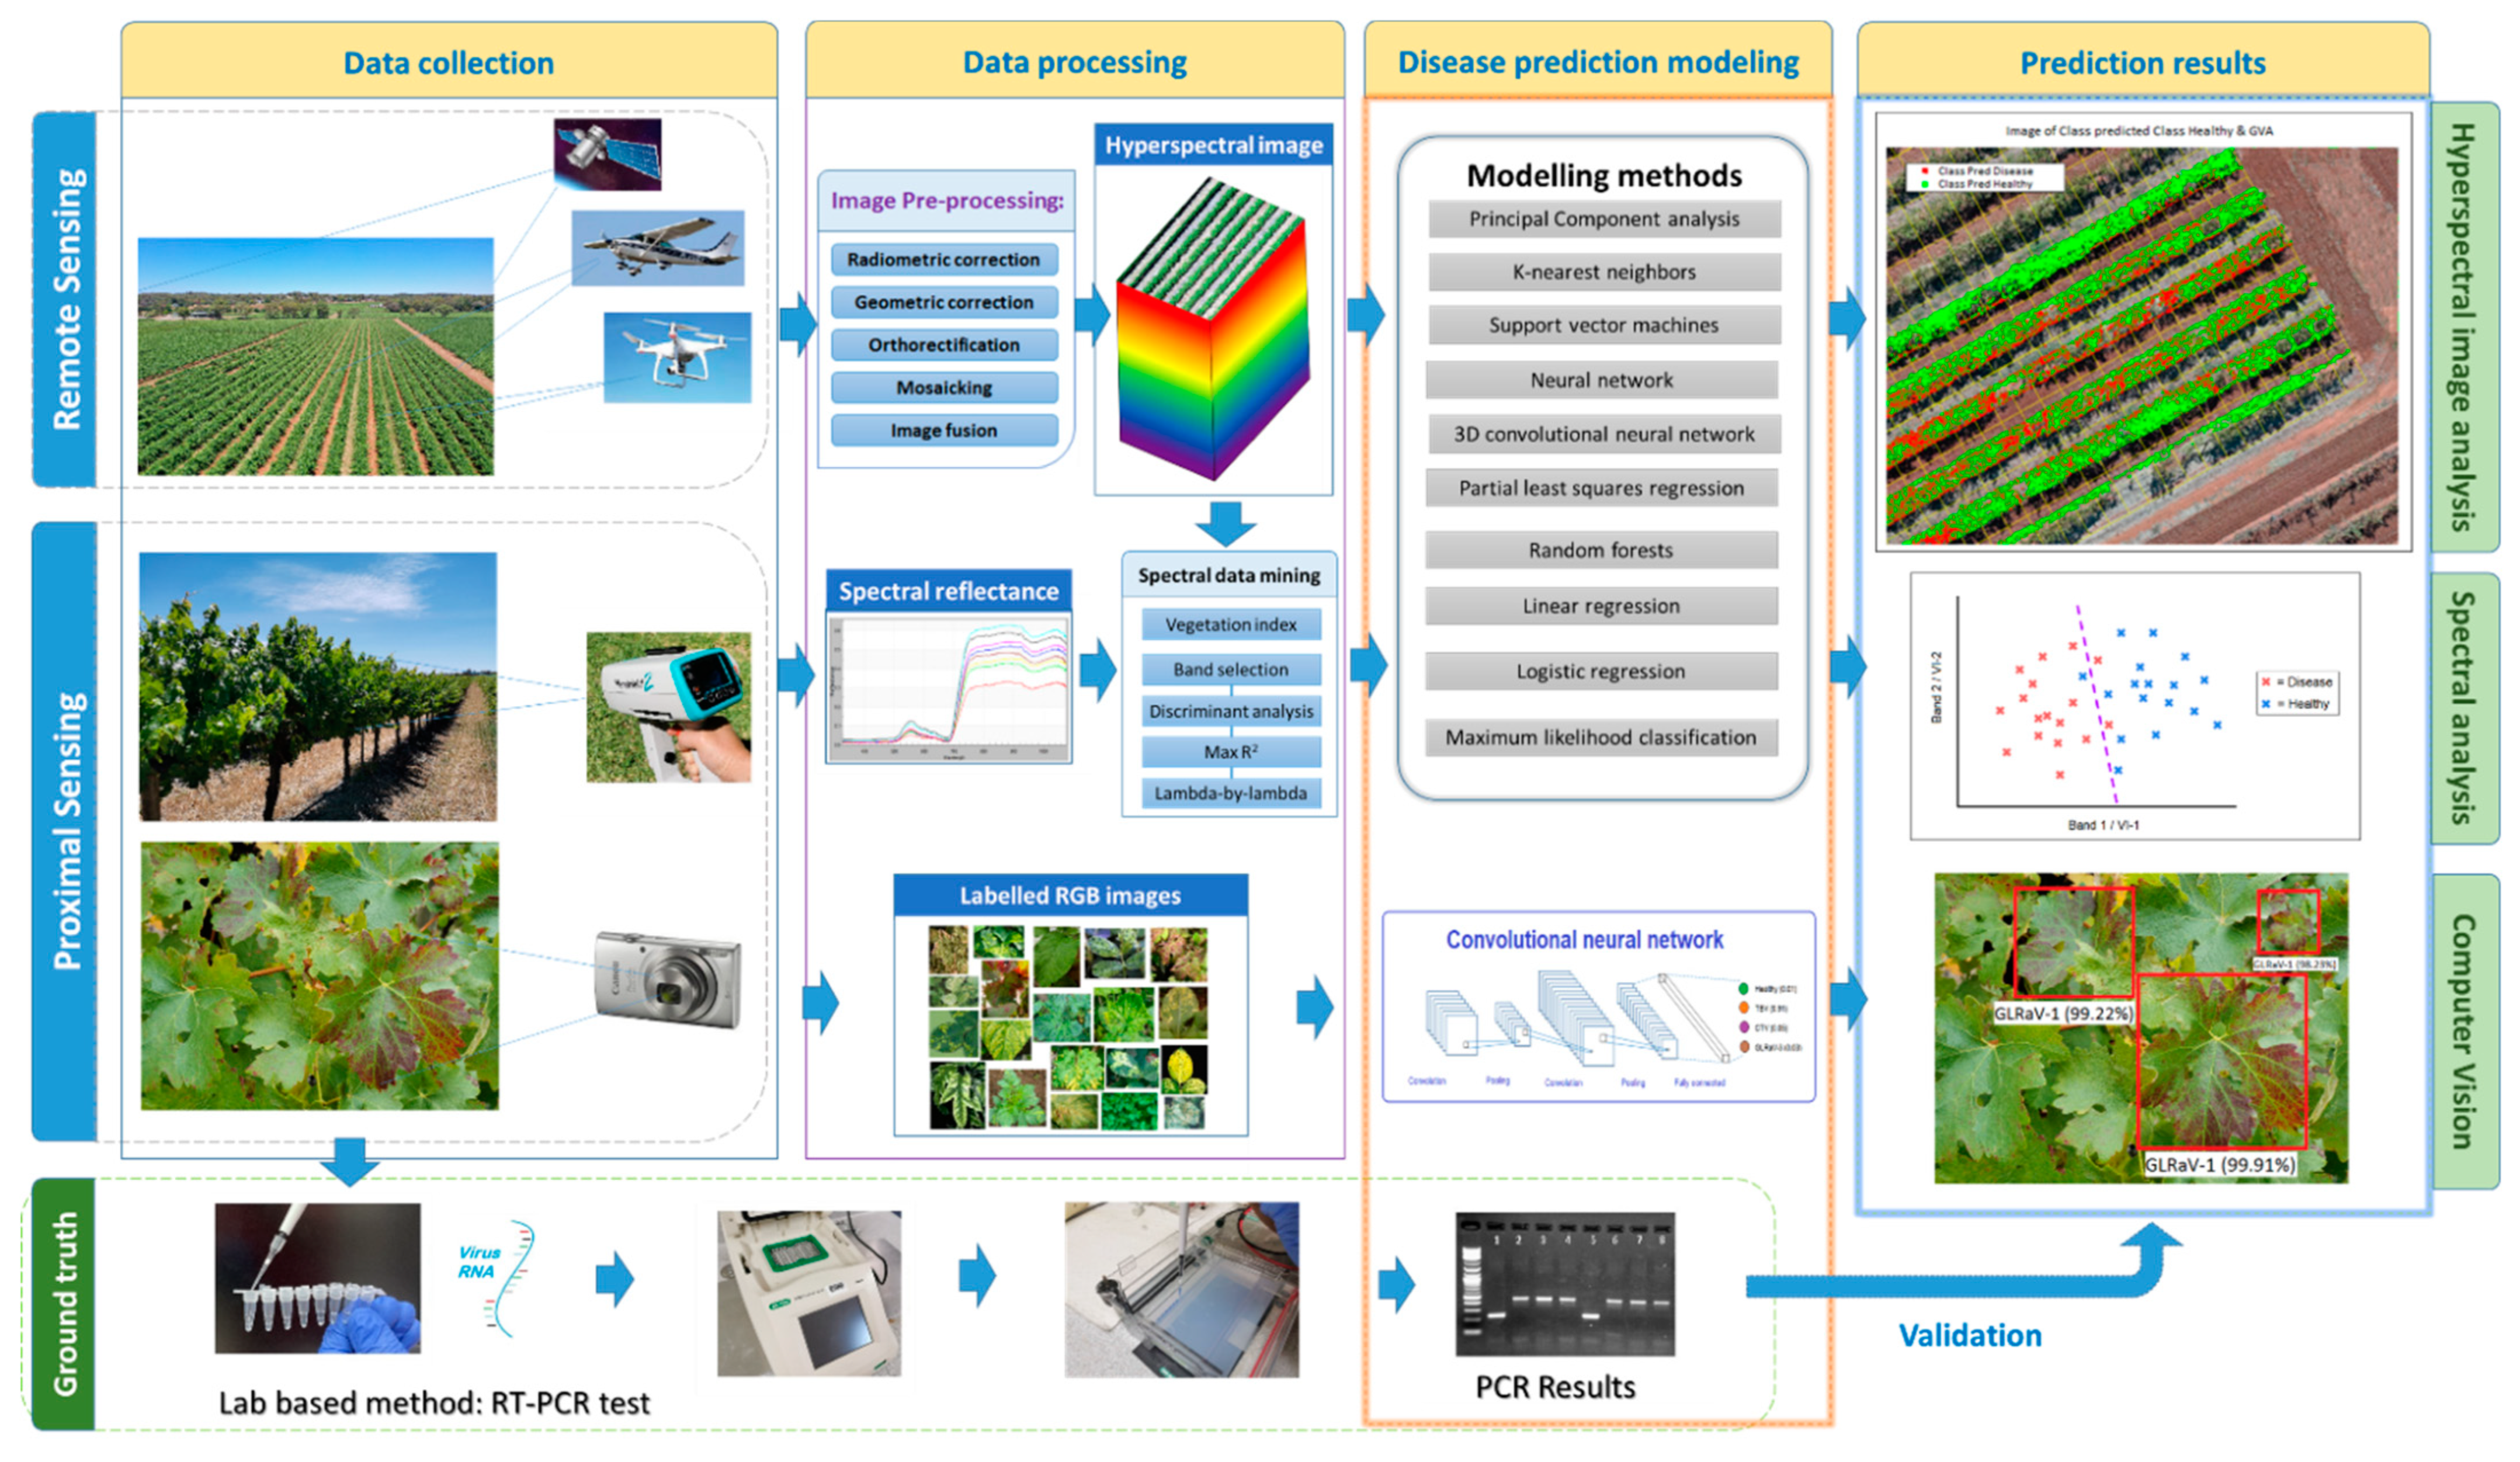
3. Analysis and Modelling Techniques for Optical Sensing Data

The indirect nature of optical sensing technologies in plant viral disease detection implies the need to develop mathematical relationships between sensing information and ground-truthed information (e.g., lab test results or visual assessment). Such disease classification models allow the prediction of diseases from optical sensing data from proximally and remotely sensed spectral data. Model quality is typically validated against reliable ground truth data.
The pipeline for optical disease detection includes data collection, data processing, modelling, and ground-truthing (Figure 3). Different data imply different processing and modelling needs ranging from statistics to machine learning [129,130]. Below, we describe some commonly used methods in plant viral disease modelling.

3.1. Using Computer Vision for Leaf-Based Viral Disease Detection

As described in Section 2.1, viruses alter leaf phenotype. This principle has traditionally been used in field-based reconnaissance of viruses. It has also been adopted in computer vision, which has become popular in recent years due to its excellent performance, such as object detection, facial recognition, and medical diagnosis [131,132,133]. With a large set of training data (annotated images), computer vision systems can rapidly learn and recognise an object in a new, previously unseen image. This technology has the potential to increase the efficiency of traditional field-based virus detection by examining leaves. Mohanty et al. [83] correctly identified 26 plant diseases across 14 crops by using images from the PlantVillage project dataset [134] of 54,306 leaf images and obtained a prediction accuracy of over 99%. Ferentinos [84] tested five different convolutional neural networks (CNN) architectures (AlexNet, AlexNetOWTBn, GoogLeNet, Overfeat, and VGG). Using 87,848 open database images containing 25 different plants and 58 diseases, the authors reported a prediction accuracy of >99%. Ramcharan et al. [135] used GoogLeNet to detect five major pests and diseases in cassava plants, including cassava mosaic virus and cassava brown streak virus. This study used 13,500 images to train the model and achieved 93% accuracy in 1500 test images. Polder et al. [136] used a pre-trained region-based CNN (R-CNN) model to detect tulip breaking virus from multispectral images. They reported that the deep-learning model could identify 82% of the diseased plants, which favourably compared to the judgement of experienced crop inspectors.
UAV based RGB imaging at high spatial resolution has been the basis for successful virus detection of plants. Gomez Selvaraj et al. [137] used UAV-RGB images to detect Banana bunchy top disease (BBTD) and Xanthomonas wilt of banana disease (BXW). This study collected images at 50–100 m above ground, providing 1–3 cm spatial resolution. By training 2477 annotated images in a CNN architecture RetinaNet, the authors achieved 98% precision. Using a similar method but lower altitude, Sugiura et al. [138] captured imagery at the height of 5–10 m above ground, with 2–4 mm spatial resolution to study potato virus Y infection. Using 1800 training images, the model achieved 96% accuracy for the training and 84% for the test dataset, respectively.
The above examples demonstrate the feasibility of using leaf-level RGB images in the CV framework for plant disease detection. However, training image recognition models requires a large number of annotated images at different times, environments, and locations for reliable prediction. Image annotation requires labour, time, and experience; a paucity of annotated images is one of the limitations of the technique [139,140]. Additional challenges arise from the quality of images used for training the model; poor resolution or inadequate annotation can negatively affect accuracy.

3.2. Use of Multispectral Imagery for Plant Viral Disease Detection

Multispectral imagery is a simple, cheap, readily available method for plant surveillance. It has established methodologies focused on spectral analysis of individual pixels, which is different from object-based detection like CV using entire images or subsets of images. The relationship between spectral reflectance and vegetation properties is well established and is to a large degree based on chlorophyll a and b spectral properties. Absorption bands are around 440 nm and 650 nm for chlorophyll a and b, respectively, with high reflectance in green and near-infrared spectral ranges [141,142]. There are more than 150 published vegetation indices (VI), and different relationships with plant cell structure, biochemistry, physiology, and stress have been established [143,144]. Commonly used VIs for plant stress studies include NDVI, Chlorophyll Index, Water Index, and Red-edge Vegetation Stress Index [145]. Multispectral sensors can focus on these important spectral bands and produce a variety of indices that have been examined for disease detection.
The potential physiological effects of viruses on the photosynthetic apparatus in leaves imply that multispectral images contain information on virus detection. For example, Mirik et al. [146] used Landsat 5 TM satellite multispectral images for wheat streak mosaic virus detection on a broad scale. Six bands were used in the maximum likelihood classifier (MLC) to classify the disease pixels in the study, and they achieved overall accuracies of 96% and 99% and were obtained on two different dates compared to ELISA test results. Another study by Hou et al. [147] generated seven VIs using four bands (R, G, B, and NIR) in a satellite image for GLD detection. All 11 feature vectors (seven VIs and four bands) were fed in a clustering analysis model Ant colony clustering algorithm (ACCA) [148] for disease detection. They achieved 75% accuracy for plants with mild symptoms and 84% for plants with severe symptoms. A nine-band multispectral field radiometer was used by Steddom et al. [149] to detect beet necrotic yellow vein virus at canopy level (0.75 m diameter field of view). Using a logistic regression algorithm with Vis, the authors obtained an accuracy of 88% for symptomatic plants; however, they could not separate the asymptomatic plants from healthy plants using their model.

3.3. Use of Hyperspectral Sensing

The success of multispectral approaches has encouraged using more spectral detail through hyperspectral imaging. However, the complexity and volume of hyperspectral imagery imply the need for data reduction as part of the workflow [150]. Different approaches either select spectral bands known to change with physiological plant changes or empirically detect spectral ranges that are affected by the disease using data mining [93,151,152]. Band selection is often used as an initial step. It chooses only those that contribute to the accurate prediction of the disease and remove the redundant bands without losing the key information [93]. In most plant diseases detection studies, the optimum bands in hyperspectral data need to be evaluated and determined for each disease case or development stage. Many methods have been suggested to determine the unique bands for the dataset, such as lambda-by-lambda R-squared to assess pairwise band correlations [93], partial least squares (PLS) [153], successive projections algorithm (SPA) [154], and stepwise discriminant analysis (SDA) [155]. Naidu et al. [95] used SDA to separate infected and healthy GLRaV-3 infected grape leaves. They achieved an overall 81% accuracy and 75% for asymptomatic leaves based on a combination of selected bands and VIs. Zhu et al. [156] used successive projections algorithm (SPA) to determine eight effective wavelengths from 434 variables in hyperspectral imaging for TMV detection. Unsupervised machine learning methods like principal component analysis (PCA) also be used for clustering [97] and reducing dimensions for spectral data [157]. A comprehensive review of the various hyperspectral band selection algorithms has been provided by Sun and Du [158].
For viral disease classification modelling, various statistical and machine learning algorithms can be used. Commonly used methods include linear discriminant analysis (LDA), naive Bayes (NB), random forest (RF), support vector machines (SVM), k-nearest neighbours (KNN), partial least square (PLS) and spectral angle mapper (SAM). Grisham et al. [98] used an SD-2000 Ocean Optics spectrometer to measure the change in chlorophylls and carotenoids in asymptomatic sugarcane leaves infected with sugarcane yellow leaf virus. The authors used the LDA model to predict the infected and non-infected plants at 64% and 72% accuracy, respectively. Sinha et al. [96] used a hand-held spectroradiometer to identify GLD. Two statistical algorithms quadratic discriminant analysis (Q-DA) and NB were used for the spectral data analysis. They obtained the results with 93–99% accuracy using Q-DA and 71–99% using NB. Using PLS discriminant analysis, Pagay et al. [159] detected virus infection in three grape varieties (Pinot noir with GLRaV-3, Shiraz with grapevine virus A (GVA) + GLRaV-3, and Riesling with GVA) with 96%, 91%, and 88% accuracy using an ASD FieldSpec-3 spectroradiometer. Polder et al. [160] compared four types of sensors (RGB, spectrophotometer, hyperspectral imaging, and Ch-Fl imaging) versus visual assessment to classify tulip breaking virus infection. Using an LDA classifier, they found the best performance was from the hyperspectral image data, with 73%, 77%, and 87% accuracy in three tulip varieties. Griffel et al. [94] differentiated spectral reflectance curves of Potato Virus Y infected plants. This study used NIR and SWIR bands to achieve an accuracy of approx. 90% taking the visual assessment as a reference. Al-Saddik et al. [161] used two methods discriminant analysis (DA) and SVM to classify grapevine yellows phytoplasma disease with different combinations of VIs. The result showed that SVM had an accuracy of approx. 97%, and this model performed better than DA, which had an accuracy of 95%. Afonso et al. [97] studied asymptomatic citrus tristeza virus infected plants using time series leaf hyperspectral data. They obtained prediction accuracies ranging from 60–90% across four treatments using the KNN algorithm. A study by Bendel et al. [162] evaluated a hyperspectral camera system in both glasshouse and field situations to detect GLD from symptomatic and asymptomatic plants. In this study, four methods were used for spectral data analysis: LDA, PLS, multi-layer perceptron (MLP), and radial basis function network with relevance (rRBF). Comparison of results showed that MLP had better classification accuracy in the VNIR range (400–1000 nm), and rRBF had better performance in the SWIR range (1000–2500 nm). This study achieved accuracies up to 100% for the symptomatic plants; it also achieved 100% classification accuracy on asymptomatic Aligote variety and 85% on Pinot Noir variety, which demonstrated the potential of using the hyperspectral camera to detect asymptomatic diseases.
Some recent studies in plant viral disease detection used neural networks for hyperspectral image analysis. Zhu et al. [156] compared six different algorithms PLS, SVM, RF, least squares SVM (LS-SVM), extreme learning machine (ELM), and backpropagation neural network (BPNN) for TMV detection. The overall prediction accuracy ranged from 75% to 97%, with the best performance by two machine learning methods, ELM and BPNN, respectively. Another study by Wang et al. [101] aimed to detect tomato spotted wilt virus infection at an early stage with hyperspectral imaging. In this study, a new deep learning algorithm, Outlier removal auxiliary classifier generative adversarial nets (OR-AC-GAN), modified from the GAN network, was used to classify the hyperspectral data. This network was trained to classify three groups healthy, diseased, and background at the pixel level from the hyperspectral image. OR-AC-GAN performed better than 1D-CNN and normal AC-GAN methods with an accuracy of 98%. Moreover, the study showed that this new model was an improvement over classical band selection methods such as maximum variance principal component analysis (MVPCA), fast density-peak-based clustering, and similarity-based unsupervised band selection. The 3D convolutional neural networks (3D CNN) use 3D kernels to produce feature maps that can perform better than traditional classification methods in hyperspectral images [163]. Recently, several studies used 3D CNN algorithms to classify land types based on public satellite hyperspectral data to improve accuracy compared to traditional machine learning methods [164,165,166,167]. However, very few studies have been conducted in plant viral disease detection. Nguyen et al. [168] demonstrated that the early detection of grapevine vein-clearing virus could be achieved using a proximal sensing hyperspectral camera, Specim IQ. They compared the conventional 2D CNN to 3D CNN, which utilises the spatial and spectral information simultaneously from the hyperspectral image for modelling and showed that the accuracy of the 3D CNN is higher than the 2D CNN.
Table 1 provides a summary of the studies using optical sensing technologies and the modelling methods for plant viral disease detection.

4. Comparison of the Cost for Virus Detection Methods

Costs associated with plant virus testing is a major consideration for growers when selecting detection options for viral disease management. In Table 2, we used a typical Australian vineyard as an example to compare the cost-effectiveness of different existing methods for grapevine virus detection. Detection methods include traditional methods visual and indicator plant assessment; commonly used lab-based methods ELISA and RT-PCR; proximal sensing methods RGB image, Chl-Fl sensor, Thermal image, and spectroradiometer; remote sensing with multispectral satellite images, manned aircraft that can capture RGB, multispectral and thermal images simultaneously; and, finally, UAV platform RGB, multispectral, hyperspectral, and thermal images.
The assumption is based on single virus detection in a vineyard with 3 m row spacing and 2 m vine spacing, resulting in approx. 1700 vines ha−1. Assuming the block size is 10 ha, there are approx. 17,000 vines in total. The currency is Australian dollars. Due to the extremely high lab costs (a commercial lab charges around AUD 100 per RT-PCR test and AUD 50 per ELISA test) and indicator plant test methods (an estimated cost for one indicator plant is AUD 20 per test, that includes grafting, growing, and biological index assessment), only 1% of vines are randomly sampled for testing. In contrast, the visual assessment and optical sensing technologies measure all vines in the block. The total cost consists of labour for samples or data collection and testing or data processing costs for the 10 ha block. Only operational costs are compared in this scenario; the costs of capital assets, skill training, travelling, disease model development, and other sunk costs are not included. Labour costs are between AUD 40 and AUD 80/hour, depending on skill. The total cost is based on 10 ha (~17,000 vines).
Cost estimates of various virus monitoring techniques shown in Table 2 indicate that lab-based methods are the most expensive, even at the low testing rate of 1%. However, the methods have the highest accuracy and are generally considered “gold standards” of plant disease detection. Satellite images provide the lowest cost option; however, due to the low resolution of the images, their accuracy is also the lowest of the methods considered here. In general, there is a negative correlation between the sensing distance and the accuracy of sensing technology. In terms of the simplicity of the methods, visual assessment is the simplest and least expensive, but the reliability varies between the inspectors and is only feasible on symptomatic plants. Indicator plants provide relatively high accuracy but require a long time from grafting to the development of symptoms. Hyperspectral methods are the most complex, requiring trained operators for both data acquisition and processing. The technique also requires longer data processing times, but it provides more spectral information for disease modelling. In comparing remote and proximal sensing techniques, the major difference is that, although operationally simpler, data collection time and costs are much higher for proximal sensing per hectare for large blocks, which increases the total cost. In terms of data type, RGB (or visible imagery) is the simplest and least expensive, but as in the case of visual assessment, it is unable of detecting asymptomatic diseases directly; indirect assessments through changes in phenotype may be detected, however. It is noteworthy that the reliability of visual assessments can be improved by confirmation of lab tests, and the robustness of the disease models can be enhanced with larger ground truth datasets; however, lab tests cost extra.

5. Current Challenges and Future Perspectives

5.1. Current Challenges of Plant Viral Disease Detection

Despite significant advances in the detection of plant viral disease, there remain numerous challenges that can be addressed with emerging technologies. Current understanding of plant viruses has increased due to advances in molecular diagnostic methods; however, ascertaining the plant phenotypes resulting from virus infections remains challenging due to the complex interactions between viruses, host genomes, and environmental factors, and symptoms are often not distributed evenly throughout the plant [13]. The viral disease produces variable impacts; some do not produce any symptoms, while others lead to rapid plant decline [56]. Viruses may not necessarily cause disease in the infected plant. Some infected plants have been shown to recover even though the virus remains in the host, suggesting a level of virus tolerance, which has not received much attention to date. All these complexities associated with viruses in plants make disease detection a challenging task.
Viral disease symptoms can be highly variable due to multiple host–pathogen–environment interactions. Multiple pathogens can cause co-infection in plants and make the detection of viruses more difficult. Viral disease symptoms can also be mistaken for other pathogens like fungi, bacteria, nematodes, and viroids; or mislead by abiotic stresses from nutrient deficiencies (e.g., phosphorous or potassium) or water stress. Environmental impacts such as air temperature, soil type, and edge effects also need to be considered. Mechanical and chemical damage such as herbicide injury could cause similar stress responses on plants as the viral disease. These complex combinations of factors could confound the accurate detection of viruses. Thus, a complete understanding of the condition of the plants and continuous monitoring over time is needed to improve the accuracy of viral disease detection.
Building a robust viral disease prediction model with optical sensing technology relies largely on the availability of accurate ground truth data from different times, disease severities, and regions. Acquiring large amounts of data remains a challenge, requiring time, labour, and resources. A simple method like visual assessment can gather sufficient ground truth data for model training. However, its reliability is unsatisfactory as some infected plants do not display visual symptoms and may lead to false negatives. Lab-based testing methods are accurate and essential for ground-truthing; yet, the high cost limits the size of ground truth data, which may reduce the robustness of the model. Nevertheless, none of the diagnostic methods can guarantee 100% accuracy. For example, Pietersen and Harris [173] discovered that even RT-PCR failed to detect GLRaV-3 in the grapevine rootstock-Richter 99 (V. berlandieri × V. rupestris). In this study, the authors found asymptomatic basal shoots (sucker) grown from the GLRaV-3 symptomatic grapevines from an abandoned vineyard in South Africa. They tested the scion and rootstock materials from the same vines. All scion materials with obvious disease symptoms tested positive, but RT-PCR results of the rootstock tissue tested negative. Therefore, understanding limitations and potential sources of error are critical for any detection method.

5.2. Future Prospects for Optical Sensing Technology in Plant Viral Disease Detection

Speed, coverage, accuracy, and cost determine the choice of viral disease detection methods. The complexity of the host–virus–environment interactions makes optical detection extremely challenging and requires robust models developed using reliable ground truth data. Novel approaches provide improved ground-truthing, sensing data collection, and data processing.
For ground-truthing, various technologies have been developed for virus diagnosis in recent years. The COVID-19 global pandemic (since 2019) has seen an emergence of rapid and novel testing methods, for example, the integration of plasmonic thermocycling and fluorescence detection in a portable device by Cheong et al. [174], a field-effect transistor (FET)-based biosensing devices developed by Seo et al. [175], and a microwave immunosensor cavity resonator developed by Elsheakh et al. [176]. Some of the novel devices may be applicable to plant virus diagnosis for rapid detection. The improved genomic sequencing and innovative bioinformatics technologies could help rapid identification of previously unknown plant viruses and strains, which can help us better understand the causes of symptomology, as well to build a global database of virus genomes that can better prepare us for future outbreaks of these viruses. Field deployable testing devices are useful for quickly determining viruses on suspected symptoms, which will aid in sample collection efficiency and increase the confidence of visual assessment for adequate and reliable ground-truthing. For example, a portable gene sequencing device developed by Oxford Nanopore Technologies MinION can be used for fast plant virus detection in the field. Various newly developed portable diagnostic tools using LAMP and LFD technology are promising for rapid field testing [177,178,179].
For optical sensing data collection, understanding the symptomology of viral disease is critical. Establishing optimal crop developmental stages and time of day to capture the optical data, e.g., at a specific incident angle of the sun, are simple approaches to increase detection accuracy. Consistent sensing distance and stabilised sensor movement during the data collection are important for obtaining consistent data. Sensing platforms like autonomous UAVs, ground-based vehicles, and robots are rapidly advancing, offering heavier payload capacities, higher endurance (longer operation duration and range), and high positional accuracy, all of which would help collect quality sensing data while maintaining high consistency. Optical sensors have also steadily improved in resolution, form factor, and weight. Due to the increased demand for low altitude and proximal sensing technology, global manufacturers compete to make higher spatial and spectral resolution optical sensors that are lighter weight and user-friendly. Currently, due to the complexity of the hyperspectral camera system, most high spectral resolution sensors are push-broom type, which requires a very stable condition to operate and needs high positional accuracies, requiring extra processing steps to produce image data. A simple and user-friendly hyperspectral sensor is desirable for disease detection.
In addition to the sensors introduced in Section 2, other types of sensors can be used simultaneously to provide more information to aid in accurate disease detection. For example, a light detection and ranging (LIDAR) sensor has been used with hyperspectral or multispectral systems to reconstruct the image data to aid the accuracy of the positioning. The combination of the sensors can produce a hyperspectral 3D point cloud for plant disease classification [180,181,182]. A stereoscopic camera uses two or more lenses to capture images from multiple angles in a short distance, which produces the high-resolution 3D structure of the leaf shape and size [183]. Microwave sensors are active sensors that can detect the object at any time of day [184]. Non-optical sensors such as chemical sensors can also be used. For example, volatile organic compounds (VOCs) emitted by plants can be used to indicate a diseased state. The emission of VOCs can be altered due to virus infection. Mauck et al. [185] showed that cucumber mosaic virus infected plants produce about 50% more total volatiles than healthy plants to attract the vectors helping the virus invading other healthy plants. Methyl salicylate volatile emissions were increased in TMV infected tobacco plants to warn neighbouring plants, thereby inducing their defence mechanisms [186]. Although disease detection using VOCs is mainly undertaken on a small scale, such as in growth chambers or small glasshouses, novel technologies can provide early warning in large glasshouses or the field [187,188].
For data processing, novel ML algorithms for band selection and new Vis from hyperspectral data can improve the accuracy of disease detection. Considering that spectral signals change over time at different disease development stages, the disease model should contain large datasets over different periods and be updated regularly to improve the robustness of the models. Optimising the 3D CNN algorithm for hyperspectral image data could improve the model accuracy for hyperspectral data. As computational power increases, onboard mobile devices could speed up data processing, so the analysis occurs on-the-go. The disease information can be provided to growers in near real-time using a combination of miniature sensors and onboard computers on land vehicles or wearable smart devices with augmented reality (AR) technology such as Microsoft Hololens.
Overall, further development of technology in molecular diagnosis, sensors, platforms, and data processing methods will improve plant virus detection, ultimately aiding in the efficient management of plant viral disease.

6. Conclusions

Plant viral diseases have been shown to negatively impact crop health and, consequently, decrease crop yields and global food production. The dearth of control options makes it ever more imperative to utilise a diverse array of tools ranging from molecular detection to optical, non-destructive approaches that provide rapid, spatial scale detection. This combines the scientific rigour of laboratory methods with the spatial representation and detectability of pattern of infections using spatial methods. An ongoing challenge with the use of optical sensing technology is the increased complexity of data; this issue can be addressed by using high-performance computers in conjunction with novel algorithms in data processing to improve disease prediction accuracy. Additional challenges will present themselves including the threat of emerging viruses and their variants, which will require ongoing development of detection methodologies that vary in both cost and accuracy. Our detailed economic analysis suggests that aerial visible imaging is the most cost-effective approach for detection provided that symptoms are manifested on the plant. This information gives a dollar value reference to practitioners to manage viral diseases in their crops.

Author Contributions

Y.M.W. performed the article review and prepared the original draft; N.H., D.G., B.O. and V.P. contributed to reviewing and editing the manuscript. All authors have read and agreed to the published version of the manuscript.

Funding

This research was funded by South Australia Australian Grapevine Foundation Planting Service Inc. (Grant number: DVCR711278), Riverland Wine Industry Development Council (Grant number 194388), and Wine Australia (Grant number: PPA002864). Y.M.W.’s study is supported by the Research Training Program, The University of Adelaide.

Acknowledgments

The authors would like to acknowledge the funding body: South Australian Vine Improvement Association, Riverland Wine, and The University of Adelaide.

Conflicts of Interest

The authors declare no conflict of interest.

References

  1. Savary, S.; Willocquet, L.; Pethybridge, S.J.; Esker, P.; McRoberts, N.; Nelson, A. The global burden of pathogens and pests on major food crops. Nat. Ecol. Evol. 2019, 3, 430–439. [Google Scholar] [CrossRef] [PubMed]
  2. Reddy, D.V.R.; Sudarshana, M.R.; Fuchs, M.; Rao, N.C.; Thottappilly, G. Genetically engineered virus-resistant plants in developing countries: Current status and future prospects. In Advances in Virus Research; Loebenstein, G., Carr, J.P., Eds.; Academic Press: Burlington, USA, 2009; Volume 75, pp. 185–220. [Google Scholar] [CrossRef]
  3. Savary, S.; Ficke, A.; Aubertot, J.-N.; Hollier, C. Crop losses due to diseases and their implications for global food production losses and food security. Food Secur. 2012, 4, 519–537. [Google Scholar] [CrossRef]
  4. Jones, R.A.C. Disease Pandemics and Major Epidemics Arising from New Encounters between Indigenous Viruses and Introduced Crops. Viruses 2020, 12, 1388. [Google Scholar] [CrossRef]
  5. Jones, R.A.C. Global Plant Virus Disease Pandemics and Epidemics. Plants 2021, 10, 233. [Google Scholar] [CrossRef] [PubMed]
  6. Sastry, K.S. Impact of virus and viroid diseases on crop yields. In Plant Virus and Viroid Diseases in the Tropics; Volume 1: Introduction of Plant Viruses and Sub-Viral Agents, Classification, Assessment of Loss, Transmission and Diagnosis; Springer: Dordrecht, The Netherlands, 2013; pp. 99–159. [Google Scholar] [CrossRef]
  7. Gilbertson, R.L.; Rojas, M.R.; Kon, T.; Jaquez, J. Introduction of Tomato Yellow Leaf Curl Virus into the Dominican Republic: The Development of a Successful Integrated Pest Management Strategy. Tomato Yellow Leaf Curl Virus Dis. 2007, 92, 487–496. [Google Scholar] [CrossRef]
  8. Briddon, R.W.; Markham, P.G. Cotton leaf curl virus disease. Virus Res. 2000, 71, 151–159. [Google Scholar] [CrossRef]
  9. Wood, G.A.; Chamberlain, E.E.; Atkinson, J.D.; Hunter, J.A. Field studies with apple mosaic virus. N. Z. J. Agric. Res. 1975, 18, 399–404. [Google Scholar] [CrossRef]
  10. Atallah, S.S.; Gomez, M.I.; Fuchs, M.F.; Martinson, T.E. Economic Impact of Grapevine Leafroll Disease on Vitis vinifera cv. Cabernet franc in Finger Lakes Vineyards of New York. Am. J. Enol. Vitic. 2011, 63, 73–79. [Google Scholar] [CrossRef] [Green Version]
  11. Maree, H.J.; Almeida, R.P.P.; Bester, R.; Chooi, K.M.; Cohen, D.; Dolja, V.V.; Fuchs, M.F.; Golino, D.A.; Jooste, A.E.C.; Martelli, G.P.; et al. Grapevine leafroll-associated virus 3. Front. Microbiol. 2013, 4, 82. [Google Scholar] [CrossRef] [Green Version]
  12. Mannini, F.; Digiaro, M. The effects of viruses and viral diseases on grapes and wine. In Grapevine Viruses: Molecular Biology, Diagnostics and Management, 1st ed.; Meng, B., Martelli, G.P., Golino, D.A., Fuchs, M., Eds.; Springer International Publishing: Cham, Switzerland, 2017; pp. 453–482. [Google Scholar] [CrossRef]
  13. Hull, R. Plant Virology, 5th ed.; Elsevier: London, UK; Academic Press: London, UK, 2013. [Google Scholar]
  14. Sastry, K.S.; Zitter, T.A. Management of Virus and Viroid Diseases of Crops in the Tropics. In Plant Virus and Viroid Diseases in the Tropics: Volume 2: Epidemiology and Management; Springer: Dordrecht, The Netherlands, 2014; pp. 149–480. [Google Scholar] [CrossRef]
  15. Awasthi, L.P. Recent Advances in the Diagnosis and Management of Plant Diseases, 1st ed.; Springer: New Delhi, India, 2015; pp. 35–44. [Google Scholar] [CrossRef]
  16. Fang, Y.; Ramasamy, R.P. Current and Prospective Methods for Plant Disease Detection. Biosensors 2015, 5, 537–561. [Google Scholar] [CrossRef] [Green Version]
  17. Sankaran, S.; Mishra, A.; Ehsani, R.; Davis, C. A review of advanced techniques for detecting plant diseases. Comput. Electron. Agric. 2010, 72, 1–13. [Google Scholar] [CrossRef]
  18. Martinelli, F.; Scalenghe, R.; Davino, S.; Panno, S.; Scuderi, G.; Ruisi, P.; Villa, P.; Stroppiana, D.; Boschetti, M.; Goulart, R.L.; et al. Advanced methods of plant disease detection: A review. Agron. Sustain. Dev. 2015, 35, 1–25. [Google Scholar] [CrossRef] [Green Version]
  19. Legrand, P. Biological assays for plant viruses and other graft-transmissible pathogens diagnoses: A review. EPPO Bull. 2015, 45, 240–251. [Google Scholar] [CrossRef]
  20. Smith, K.M. Introduction. In Plant Viruses; Smith, K.M., Ed.; Springer: Dordrecht, The Netherlands, 1977; pp. 1–5. [Google Scholar] [CrossRef]
  21. Hipper, C.; Brault, V.; Ziegler-Graff, V.; Revers, F. Viral and Cellular Factors Involved in Phloem Transport of Plant Viruses. Front. Plant Sci. 2013, 4, 154. [Google Scholar] [CrossRef] [Green Version]
  22. Mauck, K.E.; De Moraes, C.M.; Mescher, M.C. Biochemical and physiological mechanisms underlying effects ofCucumber mosaic viruson host-plant traits that mediate transmission by aphid vectors. Plant Cell Environ. 2014, 37, 1427–1439. [Google Scholar] [CrossRef]
  23. Jaime, C.; Muchut, S.E.; Reutemann, A.G.; Gieco, J.O.; Dunger, G. Morphological changes, alteration of photosynthetic parameters and chlorophyll production induced by infection with alfalfa dwarf virus in Medicago sativa plants. Plant Pathol. 2019, 69, 393–402. [Google Scholar] [CrossRef]
  24. Gutha, L.R.; Casassa, L.F.; Harbertson, J.F.; Naidu, R.A. Modulation of flavonoid biosynthetic pathway genes and anthocyanins due to virus infection in grapevine (Vitis vinifera L.) leaves. BMC Plant Biol. 2010, 10, 187. [Google Scholar] [CrossRef] [Green Version]
  25. Maxwell, D.J.; Partridge, J.C.; Roberts, N.W.; Boonham, N.; Foster, G.D. The Effects of Plant Virus Infection on Polarization Reflection from Leaves. PLoS ONE 2016, 11, e0152836. [Google Scholar] [CrossRef] [Green Version]
  26. Moeini, P.; Afsharifar, A.; Homayoonzadeh, M.; Hopkins, R.J. Plant virus infection modifies plant pigment and manipulates the host preference behavior of an insect vector. Èntomol. Exp. Appl. 2020, 168, 599–609. [Google Scholar] [CrossRef]
  27. Bahar, T.; Qureshi, A.M.; Qurashi, F.; Abid, M.; Zahra, M.B.; Haider, M.S. Changes in Phyto-Chemical Status upon Viral Infections in Plant: A Critical Review. Phyton 2021, 90, 75–86. [Google Scholar] [CrossRef]
  28. Boonham, N.; Kreuze, J.; Winter, S.; van der Vlugt, R.; Bergervoet, J.; Tomlinson, J.; Mumford, R. Methods in virus diagnostics: From ELISA to next generation sequencing. Virus Res. 2014, 186, 20–31. [Google Scholar] [CrossRef]
  29. Naidu, R.A.; Hughes, J.D.A. Methods for the detection of plant virus diseases. In Plant Virology in Sub-Saharan Africa: Proceedings of a Conference Organized by IITA: 4–8 June 2001; International Institute of Tropical Agriculture: Ibadan, Nigeria, 2003; p. 233. [Google Scholar]
  30. Torrance, L.; Jones, R.A.C. Recent developments in serological methods suited for use in routine testing for plant viruses. Plant Pathol. 1981, 30, 1–24. [Google Scholar] [CrossRef]
  31. Matthews, R.E.F. Serological techniques for plant viruses. In Methods in Virology; Maramorosch, K., Koprowski, H., Eds.; Elsevier Science: New York, NY, USA, 1967; Volume 3, pp. 199–241. [Google Scholar] [CrossRef]
  32. Nakane, P.K.; Pierce, G.B. Enzyme-Labeled Antibodies: Preparation and Application for the Localization of Antigens. J. Histochem. Cytochem. 1966, 14, 929–931. [Google Scholar] [CrossRef] [PubMed] [Green Version]
  33. Clark, M.F.; Adams, A.N.; Graham, F.L.; Smiley, J.; Russell, W.C.; Nairn, R. Characteristics of the Microplate Method of Enzyme-Linked Immunosorbent Assay for the Detection of Plant Viruses. J. Gen. Virol. 1977, 34, 475–483. [Google Scholar] [CrossRef]
  34. Danks, C.; Barker, I. On-site detection of plant pathogens using lateral-flow devices. EPPO Bull. 2000, 30, 421–426. [Google Scholar] [CrossRef]
  35. Maheshwari, Y.; Vijayanandraj, S.; Jain, R.K.; Mandal, B. Field-usable lateral flow immunoassay for the rapid detection of a macluravirus, large cardamom chirke virus. J. Virol. Methods 2018, 253, 43–48. [Google Scholar] [CrossRef]
  36. Selvarajan, R.; Kanichelvam, P.S.; Balasubramanian, V.; Subramanian, S.S. A rapid and sensitive lateral flow immunoassay (LFIA) test for the on-site detection of banana bract mosaic virus in banana plants. J. Virol. Methods 2020, 284, 113929. [Google Scholar] [CrossRef]
  37. Boine, B.; Kingston, R.L.; Pearson, M.N. Recombinant expression of the coat protein of Botrytis virus X and development of an immunofluorescence detection method to study its intracellular distribution in Botrytis cinerea. J. Gen. Virol. 2012, 93, 2502–2511. [Google Scholar] [CrossRef] [Green Version]
  38. Kuo, S.-Y.; Lin, Y.-C.; Lai, Y.-C.; Liao, J.-T.; Hsu, Y.-H.; Huang, H.-C.; Hu, C.-C. Production of fluorescent antibody-labeling proteins in plants using a viral vector and the application in the detection of Acidovorax citrulli and Bamboo mosaic virus. PLoS ONE 2018, 13, e0192455. [Google Scholar] [CrossRef] [Green Version]
  39. Morris, T.J.; Dodds, J. Isolation and analysis of double-stranded RNA from virus-infected plant and fungal tissue. Phytopathology 1979, 69, 854–858. [Google Scholar] [CrossRef] [Green Version]
  40. Saiki, R.K.; Scharf, S.; Faloona, F.; Mullis, K.B.; Horn, G.T.; Erlich, H.A.; Arnheim, N. Enzymatic amplification of beta-globin genomic sequences and restriction site analysis for diagnosis of sickle cell anemia. Science 1985, 230, 1350–1354. [Google Scholar] [CrossRef] [PubMed]
  41. Olmos, A.; Capote, N.; Bertolini, E.; Cambra, M. Molecular diagnostic methods for plant viruses. In Biotechnology and Plant Disease Management; Punja, Z.K., de Boer, S.H., Sanfaçon, H., Eds.; CAB International: Wallingford, UK, 2007; pp. 227–249. [Google Scholar] [CrossRef]
  42. Farkas, D.H.; Holland, C.A. Overview of molecular diagnostic techniques and instrumentation. In Cell and Tissue Based Molecular Pathology; Tubbs, R.R., Stoler, M.H., Eds.; Churchill Livingstone: Philadelphia, CA, USA, 2009; pp. 19–32. [Google Scholar] [CrossRef]
  43. Scagliusi, S.M.; Basu, S.; Gouvêa, J.A.D.; Vega, J. Comparison of two diagnostic methods for evaluation of Sugarcane yellow leaf virus concentration in Brazilian sugarcane cultivars. Funct. Plant Sci. Biotechnol. 2009, 3, 26–30. [Google Scholar]
  44. Mekuria, G.; Ramesh, S.; Alberts, E.; Bertozzi, T.; Wirthensohn, M.; Collins, G.; Sedgley, M. Comparison of ELISA and RT-PCR for the detection of Prunus necrotic ring spot virus and prune dwarf virus in almond (Prunus dulcis). J. Virol. Methods 2003, 114, 65–69. [Google Scholar] [CrossRef] [PubMed]
  45. Vigne, E.; Garcia, S.; Komar, V.; Lemaire, O.; Hily, J.-M. Comparison of Serological and Molecular Methods With High-Throughput Sequencing for the Detection and Quantification of Grapevine Fanleaf Virus in Vineyard Samples. Front. Microbiol. 2018, 9, 2726. [Google Scholar] [CrossRef] [Green Version]
  46. McGavin, W.J.; Cock, P.J.A.; Macfarlane, S.A. Partial sequence and RT-PCR diagnostic test for the plant rhabdovirus Raspberry vein chlorosis virus. Plant Pathol. 2010, 60, 462–467. [Google Scholar] [CrossRef]
  47. Lima, J.A.A.; Nascimento, A.K.Q.; Radaelli, P.; Silva, A.K.F.; Silva, F.R. A Technique Combining Immunoprecipitation and RT-PCR for RNA Plant Virus Detection. J. Phytopathol. 2013, 162, 426–433. [Google Scholar] [CrossRef]
  48. Rojas, M.R.; Gilbertson, R.J.; Russell, D.R.; Maxwell, D.P. Use of Degenerate Primers in the Polymerase Chain Reaction to Detect Whitefly-Transmitted Geminiviruses. Plant Dis. 1993, 77, 340–347. [Google Scholar] [CrossRef]
  49. Nakaune, R.; Nakano, M. Efficient methods for sample processing and cDNA synthesis by RT-PCR for the detection of grapevine viruses and viroids. J. Virol. Methods 2006, 134, 244–249. [Google Scholar] [CrossRef]
  50. Kokkinos, C.D.; Clark, C.A. Real-Time PCR Assays for Detection and Quantification of Sweetpotato Viruses. Plant Dis. 2006, 90, 783–788. [Google Scholar] [CrossRef] [Green Version]
  51. Taylor, S.; Wakem, M.; Dijkman, G.; Alsarraj, M.; Nguyen, M. A practical approach to RT-qPCR—Publishing data that conform to the MIQE guidelines. Methods 2010, 50, S1–S5. [Google Scholar] [CrossRef]
  52. Deepak, S.; Kottapalli, K.; Rakwal, R.; Oros, G.; Rangappa, K.; Iwahashi, H.; Masuo, Y.; Agrawal, G. Real-Time PCR: Revolutionizing Detection and Expression Analysis of Genes. Curr. Genom. 2007, 8, 234–251. [Google Scholar] [CrossRef] [PubMed]
  53. Notomi, T.; Okayama, H.; Masubuchi, H.; Yonekawa, T.; Watanabe, K.; Amino, N.; Hase, T. Loop-mediated isothermal amplification of DNA. Nucleic Acids Res. 2000, 28, E63. [Google Scholar] [CrossRef] [PubMed] [Green Version]
  54. Adams, I.P.; Glover, R.H.; Monger, W.A.; Mumford, R.; Jackeviciene, E.; Navalinskiene, M.; Samuitiene, M.; Boonham, N. Next-generation sequencing and metagenomic analysis: A universal diagnostic tool in plant virology. Mol. Plant Pathol. 2009, 10, 537–545. [Google Scholar] [CrossRef] [PubMed]
  55. Barba, M.; Czosnek, H.; Hadidi, A. Historical Perspective, Development and Applications of Next-Generation Sequencing in Plant Virology. Viruses 2014, 6, 106–136. [Google Scholar] [CrossRef] [PubMed]
  56. Wu, Q.; Habili, N.; Constable, F.; Al Rwahnih, M.A.; Goszczynski, D.E.; Wang, Y.; Pagay, V. Virus Pathogens in Australian Vineyards with an Emphasis on Shiraz Disease. Viruses 2020, 12, 818. [Google Scholar] [CrossRef]
  57. Pecman, A.; Kutnjak, D.; Gutiérrez-Aguirre, I.; Adams, I.; Fox, A.; Boonham, N.; Ravnikar, M. Next Generation Sequencing for Detection and Discovery of Plant Viruses and Viroids: Comparison of Two Approaches. Front. Microbiol. 2017, 8, 1998. [Google Scholar] [CrossRef] [Green Version]
  58. Blawid, R.; Silva, J.M.F.; Nagata, T. Discovering and sequencing new plant viral genomes by next-generation sequencing: Description of a practical pipeline. Ann. Appl. Biol. 2017, 170, 301–314. [Google Scholar] [CrossRef]
  59. Rudkin, G.T.; Stollar, B.D. High resolution detection of DNA–RNA hybrids in situ by indirect immunofluorescence. Nature 1977, 265, 472–473. [Google Scholar] [CrossRef]
  60. Kliot, A.; Kontsedalov, S.; Lebedev, G.; Brumin, M.; Cathrin, P.B.; Marubayashi, J.M.; Škaljac, M.; Belausov, E.; Czosnek, H.; Ghanim, M. Fluorescence in situ Hybridizations (FISH) for the Localization of Viruses and Endosymbiotic Bacteria in Plant and Insect Tissues. J. Vis. Exp. 2014, 84, e51030. [Google Scholar] [CrossRef] [Green Version]
  61. Shargil, D.; Zemach, H.; Belausov, E.; Lachman, O.; Kamenetsky, R.; Dombrovsky, A. Development of a fluorescent in situ hybridization (FISH) technique for visualizing CGMMV in plant tissues. J. Virol. Methods 2015, 223, 55–60. [Google Scholar] [CrossRef]
  62. Iannelli, D.; D’Apice, L.; Cottone, C.; Viscardi, M.; Scala, F.; Zoina, A.; Del Sorbo, G.; Spigno, P.; Capparelli, R. Simultaneous detection of cucumber mosaic virus, tomato mosaic virus and potato virus Y by flow cytometry. J. Virol. Methods 1997, 69, 137–145. [Google Scholar] [CrossRef]
  63. D’Hondt, L.; Höfte, M.; VAN Bockstaele, E.; Leus, L. Applications of flow cytometry in plant pathology for genome size determination, detection and physiological status. Mol. Plant Pathol. 2011, 12, 815–828. [Google Scholar] [CrossRef] [PubMed]
  64. Constable, F.E. A review of Diagnostic Technologies to Benefit the Australian Nursery Industry; Hort Innovation: North Sydney, Australia, 2019. [Google Scholar]
  65. Luo, W.; Pietravalle, S.; Parnell, S.; van den Bosch, F.; Gottwald, T.R.; Irey, M.S.; Parker, S.R. An improved regulatory sampling method for mapping and representing plant disease from a limited number of samples. Epidemics 2012, 4, 68–77. [Google Scholar] [CrossRef] [PubMed]
  66. Jones, R.A.C. Control of plant virus diseases. Adv. Virus Res. 2006, 67, 205–244. [Google Scholar] [CrossRef]
  67. Bock, C.H.; Poole, G.H.; Parker, P.E.; Gottwald, T.R. Plant Disease Severity Estimated Visually, by Digital Photography and Image Analysis, and by Hyperspectral Imaging. Crit. Rev. Plant Sci. 2010, 29, 59–107. [Google Scholar] [CrossRef]
  68. Smith, K.M. Testing for viruses: Indicator plants. In Plant Viruses; Smith, K.M., Ed.; Springer: Dordrecht, The Netherlands, 1977; pp. 175–180. [Google Scholar] [CrossRef]
  69. Wolfenden, R.; Henderson, C.; Dennien, S. Innovating New Virus Diagnostics and Planting Bed Management in the Australian Sweetpotato Industry; Hort Innovation: North Sydney, Australia, 2018. [Google Scholar]
  70. Constable, F.E.; Connellan, J.; Nicholas, P.; Rodoni, B.C. The reliability of woody indexing for detection of grapevine virus-associated diseases in three different climatic conditions in Australia. Aust. J. Grape Wine Res. 2012, 19, 74–80. [Google Scholar] [CrossRef]
  71. Santos, J.L.; Farahi, F. Handbook of Optical Sensors; Taylor & Francis: London, UK, 2014; pp. 3–11. [Google Scholar]
  72. Lee, W.S.; Alchanatis, V.; Yang, C.; Hirafuji, M.; Moshou, D.; Li, C. Sensing technologies for precision specialty crop production. Comput. Electron. Agric. 2010, 74, 2–33. [Google Scholar] [CrossRef]
  73. Mahlein, A.-K.; Oerke, E.-C.; Steiner, U.; Dehne, H.-W. Recent advances in sensing plant diseases for precision crop protection. Eur. J. Plant Pathol. 2012, 133, 197–209. [Google Scholar] [CrossRef]
  74. Heim, R.H.J.; Carnegie, A.J.; Zarco-Tejada, P.J. Breaking down barriers between remote sensing and plant pathology. Trop. Plant Pathol. 2019, 44, 398–400. [Google Scholar] [CrossRef]
  75. Thomas, S.; Kuska, M.T.; Bohnenkamp, D.; Brugger, A.; Alisaac, E.; Wahabzada, M.; Behmann, J.; Mahlein, A.-K. Benefits of hyperspectral imaging for plant disease detection and plant protection: A technical perspective. J. Plant Dis. Prot. 2017, 125, 5–20. [Google Scholar] [CrossRef]
  76. Mahlein, A.-K. Plant Disease Detection by Imaging Sensors—Parallels and Specific Demands for Precision Agriculture and Plant Phenotyping. Plant Dis. 2016, 100, 241–251. [Google Scholar] [CrossRef] [PubMed] [Green Version]
  77. Oerke, E.-C.; Mahlein, A.-K.; Steiner, U. Proximal Sensing of Plant Diseases. In Detection and Diagnostics of Plant Pathogens; Gullino, M.L., Bonants, P.J.M., Eds.; Springer: Dordrecht, The Netherlands, 2014; Volume 5, pp. 55–70. [Google Scholar] [CrossRef]
  78. Jones, R. Trends in plant virus epidemiology: Opportunities from new or improved technologies. Virus Res. 2014, 186, 3–19. [Google Scholar] [CrossRef] [PubMed]
  79. Adão, T.; Hruška, J.; Pádua, L.; Bessa, J.; Peres, E.; Morais, R.; Sousa, J.J. Hyperspectral imaging: A review on UAV-based sensors, data processing and applications for agriculture and forestry. Remote Sens. 2017, 9, 1110. [Google Scholar] [CrossRef] [Green Version]
  80. Gautam, D.; Pagay, V. A Review of Current and Potential Applications of Remote Sensing to Study the Water Status of Horticultural Crops. Agronomy 2020, 10, 140. [Google Scholar] [CrossRef] [Green Version]
  81. Aasen, H.; Honkavaara, E.; Lucieer, A.; Zarco-Tejada, P.J. Quantitative Remote Sensing at Ultra-High Resolution with UAV Spectroscopy: A Review of Sensor Technology, Measurement Procedures, and Data Correction Workflows. Remote Sens. 2018, 10, 1091. [Google Scholar] [CrossRef] [Green Version]
  82. Hirsch, R. Exploring Colour Photography: A Complete Guide; Laurence King: London, UK, 2004. [Google Scholar]
  83. Mohanty, S.P.; Hughes, D.P.; Salathé, M. Using Deep Learning for Image-Based Plant Disease Detection. Front. Plant Sci. 2016, 7, 1419. [Google Scholar] [CrossRef] [Green Version]
  84. Ferentinos, K.P. Deep learning models for plant disease detection and diagnosis. Comput. Electron. Agric. 2018, 145, 311–318. [Google Scholar] [CrossRef]
  85. Wiesner-Hanks, T.; Wu, H.; Stewart, E.; DeChant, C.; Kaczmar, N.; Lipson, H.; Gore, M.A.; Nelson, R.J. Millimeter-Level Plant Disease Detection From Aerial Photographs via Deep Learning and Crowdsourced Data. Front. Plant Sci. 2019, 10, 1550. [Google Scholar] [CrossRef] [Green Version]
  86. Zhou, X.-G.; Zhang, D.; Lin, F. UAV Remote Sensing: An Innovative Tool for Detection and Management of Rice Diseases; IntechOpen: London, UK, 2021. [Google Scholar] [CrossRef]
  87. Kang, H.R. Multispectral imaging. In Computational Color Technology; Kang, H.R., Ed.; SPIE Press: Bellingham, WC, USA, 2006; pp. 301–324. [Google Scholar] [CrossRef]
  88. Ünsalan, C.; Boyer, K.L. Multispectral Satellite Image Understanding: From Land Classification to Building and Road Detection; Springer: London, UK, 2011; pp. 49–119. [Google Scholar]
  89. Curran, P.J.; Windham, W.R.; Gholz, H.L. Exploring the relationship between reflectance red edge and chlorophyll concentration in slash pine leaves. Tree Physiol. 1995, 15, 203–206. [Google Scholar] [CrossRef]
  90. Mulla, D.J. Twenty five years of remote sensing in precision agriculture: Key advances and remaining knowledge gaps. Biosyst. Eng. 2013, 114, 358–371. [Google Scholar] [CrossRef]
  91. Rouse, J.W., Jr.; Harlan, J.C.; Haas, R.H.; Schell, J.A.; Deering, D.W. Monitoring the Vernal Advancement and Retrogradation (Green Wave Effect) of Natural Vegetation. NASA/GSFCT Type III Final Report 1974, NASA-CR-144661. Available online: https://ntrs.nasa.gov/citations/19740022555 (accessed on 12 May 2021).
  92. Davy, S.H. NDVI from A to Z. In The Normalized Difference Vegetation Index; Pettorelli, N., Ed.; OUP Oxford: Oxford, UK, 2013; pp. 30–43. [Google Scholar]
  93. Thenkabail, P.S.; Lyon, J.G.; Huete, A. Advances in hyperspectral remote sensing of vegetation and agricultural croplands. In Hyperspectral Remote Sensing of Vegetation; Thenkabail, P.S., Lyon, J.G., Huete, A., Eds.; CRC Press: Boca Raton, FL, USA, 2011; pp. 3–35. [Google Scholar] [CrossRef]
  94. Griffel, L.; Delparte, D.; Edwards, J. Using Support Vector Machines classification to differentiate spectral signatures of potato plants infected with Potato Virus Y. Comput. Electron. Agric. 2018, 153, 318–324. [Google Scholar] [CrossRef]
  95. Naidu, R.A.; Perry, E.M.; Pierce, F.J.; Mekuria, T. The potential of spectral reflectance technique for the detection of Grapevine leafroll-associated virus-3 in two red-berried wine grape cultivars. Comput. Electron. Agric. 2009, 66, 38–45. [Google Scholar] [CrossRef]
  96. Sinha, R.; Khot, L.R.; Rathnayake, A.P.; Gao, Z.; Naidu, R.A. Visible-near infrared spectroradiometry-based detection of grapevine leafroll-associated virus 3 in a red-fruited wine grape cultivar. Comput. Electron. Agric. 2019, 162, 165–173. [Google Scholar] [CrossRef]
  97. Afonso, A.M.; Guerra, R.; Cavaco, A.M.; Pinto, P.; Andrade, A.; Duarte, A.; Power, D.M.; Marques, N.T. Identification of asymptomatic plants infected with Citrus tristeza virus from a time series of leaf spectral characteristics. Comput. Electron. Agric. 2017, 141, 340–350. [Google Scholar] [CrossRef]
  98. Grisham, M.P.; Johnson, R.M.; Zimba, P.V. Detecting Sugarcane yellow leaf virus infection in asymptomatic leaves with hyperspectral remote sensing and associated leaf pigment changes. J. Virol. Methods 2010, 167, 140–145. [Google Scholar] [CrossRef]
  99. Qin, J. Hyperspectral imaging instruments. In Hyperspectral Imaging for Food Quality Analysis and Control; Sun, D.-W., Ed.; Academic Press: San Diego, CA, USA, 2010; pp. 129–172. [Google Scholar] [CrossRef]
  100. MacDonald, S.L.; Staid, M.; Staid, M.; Cooper, M.L. Remote hyperspectral imaging of grapevine leafroll-associated virus 3 in cabernet sauvignon vineyards. Comput. Electron. Agric. 2016, 130, 109–117. [Google Scholar] [CrossRef] [Green Version]
  101. Wang, D.; Vinson, R.; Holmes, M.; Seibel, G.; Bechar, A.; Nof, S.; Tao, Y. Early Detection of Tomato Spotted Wilt Virus by Hyperspectral Imaging and Outlier Removal Auxiliary Classifier Generative Adversarial Nets (OR-AC-GAN). Sci. Rep. 2019, 9, 4377. [Google Scholar] [CrossRef]
  102. Gorbe, E.; Calatayud, A. Applications of chlorophyll fluorescence imaging technique in horticultural research: A review. Sci. Hortic. 2012, 138, 24–35. [Google Scholar] [CrossRef]
  103. Daley, P.F. Chlorophyll fluorescence analysis and imaging in plant stress and disease. Can. J. Plant Pathol. 1995, 17, 167–173. [Google Scholar] [CrossRef]
  104. Osmond, C.B.; Daley, P.F.; Badger, M.R.; Lüttge, U. Chlorophyll Fluorescence Quenching During Photosynthetic Induction in Leaves of Abutilon striatum Dicks. Infected with Abutilon Mosaic Virus, Observed with a Field-Portable Imaging System. Bot. Acta 1998, 111, 390–397. [Google Scholar] [CrossRef]
  105. Pineda, M.; Soukupová, J.; Matouš, K.; Nedbal, L.; Barón, M. Conventional and combinatorial chlorophyll fluorescence imaging of tobamovirus-infected plants. Photosynthetica 2008, 46, 441–451. [Google Scholar] [CrossRef]
  106. Spoustová, P.; Synková, H.; Valcke, R.; Čeřovská, N. Chlorophyll a fluorescence as a tool for a study of the Potato virus Y effects on photosynthesis of nontransgenic and transgenic Pssu-ipt tobacco. Photosynthetica 2013, 51, 191–201. [Google Scholar] [CrossRef]
  107. Lei, R.; Jiang, H.; Hu, F.; Yan, J.; Zhu, S. Chlorophyll fluorescence lifetime imaging provides new insight into the chlorosis induced by plant virus infection. Plant Cell Rep. 2016, 36, 327–341. [Google Scholar] [CrossRef] [PubMed]
  108. Chaerle, L.; Lenk, S.; Hagenbeek, D.; Buschmann, C.; Van Der Straeten, D. Multicolor fluorescence imaging for early detection of the hypersensitive reaction to tobacco mosaic virus. J. Plant Physiol. 2007, 164, 253–262. [Google Scholar] [CrossRef]
  109. Pérez-Bueno, M.L.; Pineda, M.; Barón, M. Phenotyping Plant Responses to Biotic Stress by Chlorophyll Fluorescence Imaging. Front. Plant Sci. 2019, 10, 1135. [Google Scholar] [CrossRef]
  110. Fernandez-Jaramillo, A.A.; Duarte-Galvan, C.; Contreras-Medina, L.M.; Torres-Pacheco, I.; Romero-Troncoso, R.D.J.; Guevara-Gonzalez, R.G.; Millan-Almaraz, J.R. Instrumentation in Developing Chlorophyll Fluorescence Biosensing: A Review. Sensors 2012, 12, 11853–11869. [Google Scholar] [CrossRef] [PubMed]
  111. Ni, Z.; Lu, Q.; Huo, H.; Zhang, H. Estimation of Chlorophyll Fluorescence at Different Scales: A Review. Sensors 2019, 19, 3000. [Google Scholar] [CrossRef] [PubMed] [Green Version]
  112. Grace, J.; Nichol, C.; Disney, M.; Lewis, P.; Quaife, T.; Bowyer, P. Can we measure terrestrial photosynthesis from space directly, using spectral reflectance and fluorescence? Glob. Chang. Biol. 2007, 13, 1484–1497. [Google Scholar] [CrossRef]
  113. Zarco-Tejada, P.J.; Jimenez-Berni, J.A.; Suárez, L.; Sepulcre-Cantó, G.; Morales, F.; Miller, J.R. Imaging chlorophyll fluorescence with an airborne narrow-band multispectral camera for vegetation stress detection. Remote Sens. Environ. 2009, 113, 1262–1275. [Google Scholar] [CrossRef]
  114. MacArthur, A.; Robinson, I.C.; Rossini, M.; Davis, N.; Macdonald, K. A dual-field-of-view spectrometer system for reflectance and fluorescence measurements (Piccolo Doppio) and correction of etaloning. In Proceedings of the Fifth International Workshop on Remote Sensing of Vegetation Fluorescence, Paris, France, 22–24 April 2014. [Google Scholar]
  115. Chang, C.Y.; Zhou, R.; Kira, O.; Marri, S.; Skovira, J.; Gu, L.; Sun, Y. An Unmanned Aerial System (UAS) for concurrent measurements of solar-induced chlorophyll fluorescence and hyperspectral reflectance toward improving crop monitoring. Agric. For. Meteorol. 2020, 294, 108145. [Google Scholar] [CrossRef]
  116. Vargas, J.Q.; Bendig, J.; Mac Arthur, A.; Burkart, A.; Julitta, T.; Maseyk, K.; Thomas, R.; Siegmann, B.; Rossini, M.; Celesti, M.; et al. Unmanned Aerial Systems (UAS)-Based Methods for Solar Induced Chlorophyll Fluorescence (SIF) Retrieval with Non-Imaging Spectrometers: State of the Art. Remote Sens. 2020, 12, 1624. [Google Scholar] [CrossRef]
  117. Khanal, S.; Fulton, J.; Shearer, S. An overview of current and potential applications of thermal remote sensing in precision agriculture. Comput. Electron. Agric. 2017, 139, 22–32. [Google Scholar] [CrossRef]
  118. Chaerle, L.; Van Caeneghem, W.; Messens, E.; Lambers, H.; Van Montagu, M.; Van Der Straeten, D. Presymptomatic visualization of plant–virus interactions by thermography. Nat. Biotechnol. 1999, 17, 813–816. [Google Scholar] [CrossRef] [PubMed]
  119. Zhu, W.; Chen, H.; Ciechanowska, I.; Spaner, D. Application of infrared thermal imaging for the rapid diagnosis of crop disease. IFAC-PapersOnLine 2018, 51, 424–430. [Google Scholar] [CrossRef]
  120. Mandrile, L.; Rotunno, S.; Miozzi, L.; Vaira, A.M.; Giovannozzi, A.M.; Rossi, A.M.; Noris, E. Nondestructive Raman Spectroscopy as a Tool for Early Detection and Discrimination of the Infection of Tomato Plants by Two Economically Important Viruses. Anal. Chem. 2019, 91, 9025–9031. [Google Scholar] [CrossRef]
  121. Farber, C.; Shires, M.; Ong, K.; Byrne, D.; Kurouski, D. Raman spectroscopy as an early detection tool for rose rosette infection. Planta 2019, 250, 1247–1254. [Google Scholar] [CrossRef]
  122. Rys, M.; Juhász, C.; Surówka, E.; Janeczko, A.; Saja, D.; Tóbiás, I.; Skoczowski, A.; Barna, B.; Gullner, G. Comparison of a compatible and an incompatible pepper-tobamovirus interaction by biochemical and non-invasive techniques: Chlorophyll a fluorescence, isothermal calorimetry and FT-Raman spectroscopy. Plant Physiol. Biochem. 2014, 83, 267–278. [Google Scholar] [CrossRef] [Green Version]
  123. Yeturu, S.; Jentzsch, P.V.; Ciobotă, V.; Guerrero, R.; Garrido, P.; Ramos, L.A. Handheld Raman spectroscopy for the early detection of plant diseases: Abutilon mosaic virus infecting Abutilon sp. Anal. Methods 2016, 8, 3450–3457. [Google Scholar] [CrossRef]
  124. Choi, Y.H.; Kim, H.K.; Linthorst, H.J.M.; Hollander, J.G.; Lefeber, A.W.M.; Erkelens, C.; Nuzillard, A.J.-M.; Verpoorte, R. NMR Metabolomics to Revisit the Tobacco Mosaic Virus Infection in Nicotiana tabacum Leaves. J. Nat. Prod. 2006, 69, 742–748. [Google Scholar] [CrossRef]
  125. López-Gresa, M.P.; Lisón, P.; Kim, H.K.; Choi, Y.H.; Verpoorte, R.; Rodrigo, I.; Conejero, V.; Bellés, J.M. Metabolic fingerprinting of Tomato Mosaic Virus infected Solanum lycopersicum. J. Plant Physiol. 2012, 169, 1586–1596. [Google Scholar] [CrossRef] [Green Version]
  126. Lee, C.; Lee, S.-Y.; Kim, J.-Y.; Jung, H.-Y.; Kim, J. Optical Sensing Method for Screening Disease in Melon Seeds by Using Optical Coherence Tomography. Sensors 2011, 11, 9467–9477. [Google Scholar] [CrossRef] [PubMed] [Green Version]
  127. Hao, C.T.; Eddie, T.K.-M.; Beng-Koon, N.; Sirajudeen, G.R.; Meng, T.C.; Fatt, C.T.; Tang, P.W. Diagnosis of virus infection in orchid plants with high-resolution optical coherence tomography. J. Biomed. Opt. 2009, 14, 014006. [Google Scholar] [CrossRef]
  128. Lee, S.-Y.; Lee, C.; Kim, J.; Jung, H.-Y. Application of optical coherence tomography to detect Cucumber green mottle mosaic virus (CGMMV) infected cucumber seed. Hortic. Environ. Biotechnol. 2012, 53, 428–433. [Google Scholar] [CrossRef]
  129. Ose, K.; Corpetti, T.; Demagistri, L. Multispectral satellite image processing. In Optical Remote Sensing of Land Surface; Elsevier: Oxford, UK, 2016; pp. 57–124. [Google Scholar] [CrossRef]
  130. Hastie, T.; Tibshirani, R.; Friedman, J.H. The Elements of Statistical Learning: Data Mining, Inference, and Prediction, 2nd ed.; Springer: New York, NY, USA, 2009; pp. 9–42. [Google Scholar]
  131. Sinha, P.; Balas, B.; Ostrovsky, Y.; Russell, R. Face Recognition by Humans: Nineteen Results All Computer Vision Researchers Should Know About. Proc. IEEE 2006, 94, 1948–1962. [Google Scholar] [CrossRef]
  132. Pathak, A.R.; Pandey, M.; Rautaray, S. Application of deep learning for object detection. Procedia Comput. Sci. 2018, 132, 1706–1717. [Google Scholar] [CrossRef]
  133. Esteva, A.; Chou, K.; Yeung, S.; Naik, N.; Madani, A.; Mottaghi, A.; Liu, Y.; Topol, E.; Dean, J.; Socher, R. Deep learning-enabled medical computer vision. npj Digit. Med. 2021, 4, 5. [Google Scholar] [CrossRef]
  134. Hughes, D.P.; Salathe, M. An open access repository of images on plant health to enable the development of mobile disease diagnostics. arXiv 2016, arXiv:1511.08060. [Google Scholar]
  135. Ramcharan, A.; Baranowski, K.; McCloskey, P.; Ahmed, B.; Legg, J.; Hughes, D.P. Deep Learning for Image-Based Cassava Disease Detection. Front. Plant Sci. 2017, 8, 1852. [Google Scholar] [CrossRef] [Green Version]
  136. Polder, G.; van de Westeringh, N.; Kool, J.; Khan, H.A.; Kootstra, G.; Nieuwenhuizen, A. Automatic Detection of Tulip Breaking Virus (TBV) Using a Deep Convolutional Neural Network. IFAC-PapersOnLine 2019, 52, 12–17. [Google Scholar] [CrossRef]
  137. Selvaraj, M.G.; Vergara, A.; Montenegro, F.; Ruiz, H.A.; Safari, N.; Raymaekers, D.; Ocimati, W.; Ntamwira, J.; Tits, L.; Omondi, A.B.; et al. Detection of banana plants and their major diseases through aerial images and machine learning methods: A case study in DR Congo and Republic of Benin. ISPRS J. Photogramm. Remote Sens. 2020, 169, 110–124. [Google Scholar] [CrossRef]
  138. Sugiura, R.; Tsuda, S.; Tsuji, H.; Murakami, N. Virus-infected plant detection in potato seed production field by uav imagery. In Proceedings of the 2018 ASABE Annual International Meeting, Detroit, MI, USA, 29 July–1 August 2018. [Google Scholar] [CrossRef]
  139. Barbedo, J.G.A. Plant disease identification from individual lesions and spots using deep learning. Biosyst. Eng. 2019, 180, 96–107. [Google Scholar] [CrossRef]
  140. Barbedo, J.G.A. Impact of dataset size and variety on the effectiveness of deep learning and transfer learning for plant disease classification. Comput. Electron. Agric. 2018, 153, 46–53. [Google Scholar] [CrossRef]
  141. Thenkabail, P.S.; Smith, R.B.; De-Pauw, E. Evaluation of narrowband and broadband vegetation indices for determining optimal hyperspectral wavebands for agricultural crop characterization. Photogramm. Eng. Remote Sens. 2002, 68, 607–622. [Google Scholar]
  142. Yao, X.; Zhu, Y.; Tian, Y.; Feng, W.; Cao, W. Exploring hyperspectral bands and estimation indices for leaf nitrogen accumulation in wheat. Int. J. Appl. Earth Obs. Geoinf. 2010, 12, 89–100. [Google Scholar] [CrossRef]
  143. Roberts, D.A.; Roth, K.L.; Perroy, R.L. Hyperspectral vegetation indices. In Hyperspectral Remote Sensing of Vegetation; Thenkabail, P.S., Lyon, J.G., Huete, A., Eds.; CRC Press: Boca Raton, FL, USA, 2011. [Google Scholar] [CrossRef]
  144. Tocqueville, A.D. Vegetation indices. In The Normalized Difference Vegetation Index; Pettorelli, N., Ed.; OUP Oxford: Oxford, UK, 2013; pp. 18–29. [Google Scholar]
  145. Prabhakar, M.; Prasad, Y.G.; Rao, M.N. Remote sensing of biotic stress in crop plants and its applications for pest management. In Crop Stress and its Management: Perspectives and Strategies; Venkateswarlu, B., Shanker, A., Shanker, C., Maheswari, M., Eds.; Springer: Dordrecht, The Netherlands, 2012; pp. 517–545. [Google Scholar] [CrossRef]
  146. Mirik, M.; Jones, D.C.; Price, J.A.; Workneh, F.; Ansley, R.J.; Rush, C.M. Satellite Remote Sensing of Wheat Infected by Wheat streak mosaic virus. Plant Dis. 2011, 95, 4–12. [Google Scholar] [CrossRef] [Green Version]
  147. Hou, J.; Li, L.; He, J. Detection of grapevine leafroll disease based on 11-index imagery and ant colony clustering algorithm. Precis. Agric. 2016, 17, 488–505. [Google Scholar] [CrossRef]
  148. Gao, W. Improved Ant Colony Clustering Algorithm and Its Performance Study. Comput. Intell. Neurosci. 2015, 2016, 1–14. [Google Scholar] [CrossRef] [Green Version]
  149. Steddom, K.; Heidel, G.; Jones, D.; Rush, C.M. Remote Detection of Rhizomania in Sugar Beets. Phytopathology 2003, 93, 720–726. [Google Scholar] [CrossRef] [Green Version]
  150. Bajwa, S.; Kulkarni, S. Hyperspectral Data Mining. In Hyperspectral Remote Sensing of Vegetation; Thenkabail, P.S., Lyon, J.G., Huete, A., Eds.; CRC Press: Boca Raton, FL, USA, 2011; pp. 93–120. [Google Scholar] [CrossRef]
  151. Qi, J.; Inoue, Y.; Wiangwang, N. Hyperspectral remote sensing in global change studies. In Hyperspectral Remote Sensing of Vegetation; Thenkabail, P.S., Lyon, J.G., Huete, A., Eds.; CRC Press: Boca Raton, FL, USA, 2011; pp. 69–91. [Google Scholar] [CrossRef]
  152. Cogato, A.; Wu, L.; Jewan, S.Y.Y.; Meggio, F.; Marinello, F.; Sozzi, M.; Pagay, V. Evaluating the Spectral and Physiological Responses of Grapevines (Vitis vinifera L.) to Heat and Water Stresses under Different Vineyard Cooling and Irrigation Strategies. Agronomy 2021, 11, 1940. [Google Scholar] [CrossRef]
  153. Stocchero, M.; De Nardi, M.; Scarpa, B. PLS for classification. Chemom. Intell. Lab. Syst. 2021, 216, 104374. [Google Scholar] [CrossRef]
  154. Soares, S.F.C.; Gomes, A.D.A.; Araujo, M.C.U.; Filho, A.R.G.; Galvão, A. The successive projections algorithm. TrAC Trends Anal. Chem. 2012, 42, 84–98. [Google Scholar] [CrossRef]
  155. Yeh, Y.-H.F.; Chung, W.-C.; Liao, J.-Y.; Chung, C.-L.; Kuo, Y.-F.; Lin, T.-T. A Comparison of Machine Learning Methods on Hyperspectral Plant Disease Assessments. IFAC Proc. Vol. 2013, 46, 361–365. [Google Scholar] [CrossRef] [Green Version]
  156. Zhu, H.; Chu, B.; Zhang, C.; Liu, F.; Jiang, L.; He, Y. Hyperspectral Imaging for Presymptomatic Detection of Tobacco Disease with Successive Projections Algorithm and Machine-learning Classifiers. Sci. Rep. 2017, 7, 4125. [Google Scholar] [CrossRef] [Green Version]
  157. Bagheri, N.; Mohamadi-Monavar, H.; Azizi, A.; Ghasemi, A. Detection of Fire Blight disease in pear trees by hyperspectral data. Eur. J. Remote Sens. 2017, 51, 1–10. [Google Scholar] [CrossRef] [Green Version]
  158. Sun, W.; Du, Q. Hyperspectral Band Selection: A Review. IEEE Geosci. Remote Sens. Mag. 2019, 7, 118–139. [Google Scholar] [CrossRef]
  159. Pagay, V.; Habili, N.; Wu, Q.; Coleman, D. Rapid and non-destructive detection of Shiraz disease and grapevine leafroll disease on asymptomatic grapevines in Australian vineyards. In Proceedings of the 19th Congress of the International Council for the study of Virus and Virus-like Diseases of Grapevine, Santiago, Chile, 9–12 April 2018. [Google Scholar]
  160. Polder, G.; van der Heijden, G.W.A.M.; van Doorn, J.; Clevers, J.G.P.W.; van der Schoor, R.; Baltissen, A.H.M.C. Detection of the tulip breaking virus (TBV) in tulips using optical sensors. Precis. Agric. 2010, 11, 397–412. [Google Scholar] [CrossRef] [Green Version]
  161. Al-Saddik, H.; Simon, J.C.; Cointault, F. Assessment of the optimal spectral bands for designing a sensor for vineyard disease detection: The case of ‘Flavescence dorée’. Precis. Agric. 2018, 20, 398–422. [Google Scholar] [CrossRef]
  162. Bendel, N.; Kicherer, A.; Backhaus, A.; Köckerling, J.; Maixner, M.; Bleser, E.; Klück, H.-C.; Seiffert, U.; Voegele, R.T.; Töpfer, R.J.R.S. Detection of grapevine leafroll-associated virus 1 and 3 in white and red grapevine cultivars using hyperspectral imaging. Remote Sens. 2020, 12, 1693. [Google Scholar] [CrossRef]
  163. Audebert, N.; Le Saux, B.; Lefèvre, S. Deep Learning for Classification of Hyperspectral Data: A Comparative Review. IEEE Geosci. Remote Sens. Mag. 2019, 7, 159–173. [Google Scholar] [CrossRef] [Green Version]
  164. Li, Y.; Zhang, H.; Shen, Q. Spectral–Spatial Classification of Hyperspectral Imagery with 3D Convolutional Neural Network. Remote Sens. 2017, 9, 67. [Google Scholar] [CrossRef] [Green Version]
  165. Wang, C.; Ma, N.; Ming, Y.; Wang, Q.; Xia, J. Classification of hyperspectral imagery with a 3D convolutional neural network and J-M distance. Adv. Space Res. 2019, 64, 886–899. [Google Scholar] [CrossRef]
  166. Yang, J.; Zhao, Y.-Q.; Chan, J.C.-W.; Xiao, L. A Multi-Scale Wavelet 3D-CNN for Hyperspectral Image Super-Resolution. Remote Sens. 2019, 11, 1557. [Google Scholar] [CrossRef] [Green Version]
  167. Yang, X.; Zhang, X.; Ye, Y.; Lau, R.; Lu, S.; Li, X.; Huang, X. Synergistic 2D/3D Convolutional Neural Network for Hyperspectral Image Classification. Remote Sens. 2020, 12, 2033. [Google Scholar] [CrossRef]
  168. Nguyen, C.; Sagan, V.; Maimaitiyiming, M.; Maimaitijiang, M.; Bhadra, S.; Kwasniewski, M.T. Early Detection of Plant Viral Disease Using Hyperspectral Imaging and Deep Learning. Sensors 2021, 21, 742. [Google Scholar] [CrossRef]
  169. Rangarajan, A.K.; Purushothaman, R.; Ramesh, A. Tomato crop disease classification using pre-trained deep learning algorithm. Procedia Comput. Sci. 2018, 133, 1040–1047. [Google Scholar] [CrossRef]
  170. Oh, S.; Ashapure, A.; Marconi, T.G.; Jung, J.; Landivar, J.; Thomasson, J.A.; McKee, M.; Moorhead, R.J. UAS based Tomato yellow leaf curl virus (TYLCV) disease detection system. In Proceedings of the SPIE Defense + Commercial Sensing, Baltimore, MA, USA, 14 May 2019. [Google Scholar] [CrossRef]
  171. Junges, A.H.; Almança, M.A.K.; Fajardo, T.V.M.; Ducati, J.R. Leaf hyperspectral reflectance as a potential tool to detect diseases associated with vineyard decline. Trop. Plant Pathol. 2020, 45, 522–533. [Google Scholar] [CrossRef]
  172. Berdugo, C.A.; Zito, R.; Paulus, S.; Mahlein, A.-K. Fusion of sensor data for the detection and differentiation of plant diseases in cucumber. Plant Pathol. 2014, 63, 1344–1356. [Google Scholar] [CrossRef]
  173. Pietersen, G.; Harris, M. Poor detection of grapevine leafroll disease in the rootstock Richter 99 (Vitis berlandieri X Vitis rupestris). In Proceedings of the 19th Congress of the International Council for the Study of Virus and Virus-Like Diseases of the Grapevine (ICVG), Santiago, Chile, 28–29 April 2018. [Google Scholar]
  174. Cheong, J.; Yu, H.; Lee, C.Y.; Lee, J.-U.; Choi, H.-J.; Lee, J.-H.; Lee, H.; Cheon, J. Fast detection of SARS-CoV-2 RNA via the integration of plasmonic thermocycling and fluorescence detection in a portable device. Nat. Biomed. Eng. 2020, 4, 1159–1167. [Google Scholar] [CrossRef]
  175. Seo, G.; Lee, G.; Kim, M.J.; Baek, S.-H.; Choi, M.; Ku, K.B.; Lee, C.-S.; Jun, S.; Park, D.; Kim, H.G.; et al. Rapid Detection of COVID-19 Causative Virus (SARS-CoV-2) in Human Nasopharyngeal Swab Specimens Using Field-Effect Transistor-Based Biosensor. ACS Nano 2020, 14, 5135–5142, Erratum in ACS Nano 2020, 14, 12257–12258. [Google Scholar] [CrossRef] [Green Version]
  176. Elsheakh, D.M.; Ahmed, M.I.; Elashry, G.M.; Moghannem, S.M.; Elsadek, H.A.; Elmazny, W.N.; Alieldin, N.H.; Abdallah, E.A. Rapid Detection of Coronavirus (COVID-19) Using Microwave Immunosensor Cavity Resonator. Sensors 2021, 21, 7021. [Google Scholar] [CrossRef]
  177. Papadakis, G.; Pantazis, A.K.; Fikas, N.; Chatziioannidou, S.; Tsiakalou, V.; Michaelidou, K.; Pogka, V.; Megariti, M.; Vardaki, M.; Giarentis, K.; et al. Portable real-time colorimetric LAMP-device for rapid quantitative detection of nucleic acids in crude samples. Sci. Rep. 2022, 12, 3775. [Google Scholar] [CrossRef] [PubMed]
  178. Liu, X.; Zhang, J.; Cai, Y.; Zhang, S.; Ma, K.; Hua, K.; Cui, Y. A novel DNA methylation biosensor by combination of isothermal amplification and lateral flow device. Sens. Actuators B Chem. 2021, 333, 129624. [Google Scholar] [CrossRef]
  179. Xun, G.; Lane, S.T.; Petrov, V.A.; Pepa, B.E.; Zhao, H. A rapid, accurate, scalable, and portable testing system for COVID-19 diagnosis. Nat. Commun. 2021, 12, 2905. [Google Scholar] [CrossRef] [PubMed]
  180. Li, N.; Ho, C.P.; Wang, I.-T.; Pitchappa, P.; Fu, Y.H.; Zhu, Y.; Lee, L.Y.T. Spectral imaging and spectral LIDAR systems: Moving toward compact nanophotonics-based sensing. Nanophotonics 2021, 10, 1437–1467. [Google Scholar] [CrossRef]
  181. Iseli, C.; Lucieer, A. Tree species classification based on 3D spectral point clouds and orthomosaics acquired by snapshot hyperspectral UAS sensor. In Proceedings of the ISPRS Geospatial Week 2019, Enschede, The Netherlands, 10–14 June 2019; pp. 379–384. [Google Scholar] [CrossRef] [Green Version]
  182. Ounis, A.; Bach, J.; Mahjoub, A.; Daumard, F.; Moya, I.; Goulas, Y. Combined use of LIDAR and hyperspectral measurements for remote sensing of fluorescence and vertical profile of canopies. Span. Assoc. Remote Sens. 2016, 45, 87–94. [Google Scholar] [CrossRef] [Green Version]
  183. Jin, X.; Zarco-Tejada, P.J.; Schmidhalter, U.; Reynolds, M.P.; Hawkesford, M.J.; Varshney, R.K.; Yang, T.; Nie, C.; Li, Z.; Ming, B.; et al. High-Throughput Estimation of Crop Traits: A Review of Ground and Aerial Phenotyping Platforms. IEEE Geosci. Remote Sens. Mag. 2020, 9, 200–231. [Google Scholar] [CrossRef]
  184. Singh, D.; Sao, R.; Singh, K. A remote sensing assessment of pest infestation on sorghum. Adv. Space Res. 2006, 39, 155–163. [Google Scholar] [CrossRef]
  185. Mauck, K.E.; De Moraes, C.M.; Mescher, M.C. Deceptive chemical signals induced by a plant virus attract insect vectors to inferior hosts. Proc. Natl. Acad. Sci. USA 2010, 107, 3600–3605. [Google Scholar] [CrossRef] [Green Version]
  186. Shulaev, V.; Silverman, P.; Raskin, I. Airborne signalling by methyl salicylate in plant pathogen resistance. Nature 1997, 385, 718–721. [Google Scholar] [CrossRef]
  187. Brilli, F.; Loreto, F.; Baccelli, I. Exploiting Plant Volatile Organic Compounds (VOCs) in Agriculture to Improve Sustainable Defense Strategies and Productivity of Crops. Front. Plant Sci. 2019, 10, 624. [Google Scholar] [CrossRef]
  188. Jansen, R.M.; Wildt, J.; Kappers, I.F.; Bouwmeester, H.J.; Hofstee, J.W.; van Henten, E.J. Detection of Diseased Plants by Analysis of Volatile Organic Compound Emission. Annu. Rev. Phytopathol. 2011, 49, 157–174. [Google Scholar] [CrossRef] [PubMed] [Green Version]
Figure 1. The pros and cons of different types of detection methods for plant viruses.
Remotesensing 14 01542 g001
Figure 2. Optical sensing technologies for plant viral disease detection can be classified by their platform and associated spatial resolution and extent. Sensors also vary by band position, the spectral range within the whole electromagnetic spectrum.
Remotesensing 14 01542 g002
Figure 3. Workflow chart for plant viral disease prediction at different scales. Proximal sensing can obtain detailed spectral information at a point scale or leaf phenotypes at the leaf scale. Airborne remote sensing can be conducted at different spatial and spectral detail to be used for spatial mapping. Different data types involve various classification methods, including object-based methods like computer vision, spectral signal analysis, and pixel-based for multi and hyperspectral images. Indirect methods rely on ground-based information for model development and predictions.
Remotesensing 14 01542 g003
Table 1. Examples of studies on detecting plant viral disease using different optical sensing technologies and modelling methods.
Sensing SystemPlatforms/DeviceDisease Modelling MethodsPlant VirusGround Truthing MethodsReference
RGB imagingHandheld/Digital camerasCNN, SVM, KNN, GoogLeNetMultiple diseasesLabelled in dataset[135]
RGB imagingHandheld/Digital camerasAlexNet, VGG16netMultiple diseasesLabelled in dataset[169]
RGB imagingA rail system/Digital camerasR-CNNTulip breaking virusELISA[136]
RGB; Multispectral imagingUAV/DJI P4, SlantRange 3PANNTomato yellow leaf curl virusPCR[170]
RGB; multispectral imagingUAV and Satellite/DJI P4, Sony QX1,
MicaSense RedEdge, WorldView2,
PlanetScope, Sentinel 2
RetinaNet, SVM, Random forestBanana bunchy top virusVisual assessment[137]
Multispectral imagingSatellite/Landsat 5 TMMLCWheat streak mosaic virusVisual assessment and ELISA[146]
Multispectral imagingSatellite/(N/A)ACCAGrapevine leafroll-associated virus 3Visual assessment[147]
Multispectral; hyperspectralHandheld/ASD FieldSpec FRLogistic regressionBeet necrotic yellow vein virusELISA[149]
HyperspectralHandheld/ASD Field Spec 3SDAGrapevine leafroll-associated virus 3RT-PCR[95]
HyperspectralIndoor proximal setting/SD-2000 fiber opticLDASugarcane yellow leaf virusRT-PCR[98]
Hyperspectral imagingAircraft/Headwall Photonics VNIR E SeriesClassification and regression tree (CART)Grapevine leafroll-associated virus 3Visual assessment and ELISA and RT-PCR[100]
HyperspectralHandheld/Ocean USB4000PCA, KNNCitrus tristeza virusRT-PCR and qPCR[97]
HyperspectralHandheld/ASD FieldSpec 3PLS-DAGrapevine leafroll-associated virus 3, and Grape virus ART-PCR[159]
HyperspectralHandheld/ASD FieldSpec 4SVMPotato virus YVisual assessment and RT-PCR[94]
HyperspectralHandheld/SVC HR–1024i, SVC Spectra VistaPLSR, SMLRGrapevine leafroll-associated virus 3RT-PCR[96]
Hyperspectral imagingIndoor proximal setting/V10E Specim ImSpectorOR-AC-GAN, MVPCA, FDPCTomato Spotted Wilt VirusInoculated virus[101]
Hyperspectral imagingHarvest machine mounted/HySpex VNIR & SWIRLDA, PLS, MLP, rRBFGrapevine leafroll-associated virus 1, 3Visual assessment and ELISA and RT-PCR[162]
HyperspectralHandheld/ASD FieldSpec 3PLSGrapevine leafroll-associated virus 3qPCR[171]
Hyperspectral imagingHandheld/SPECIM IQSVM, RF, 2D CNN, and 3D CNNGrapevine vein clearing virusTested in the previous study[168]
RGB, Chl-Fl, hyperspectralHandheld/Nikon D70, ASD FieldSpec Pro FRLDATulip breaking virusVisual assessment and ELISA[160]
Chl-Fl imagingIndoor proximal setting/Chl-Fl image systemVI: Fm/Fm’-1Abutilon mosaic virusVisual assessment[104]
Chl-Fl imagingIndoor proximal setting/Customized Chl-Fl imagingLDAPepper mild mottle virusInoculated virus[105]
Chl-Fl, hyperspectral, thermal imagingIndoor proximal setting and handheld/ ImSpector V10E
SPAD-meter
VARIOSCAN 3201
LDA, SDACucumber green mottle mosaic virusInoculated virus and Visual assessment[172]
Table 2. Cost comparison between detection methods based on a typical Australian vineyard.
Method TypeReliabilityCapability for Asymptomatic DetectionSensing ResolutionTesting RateSample/Data Collection CostSample/Data Collection Time (Man Hours)Sample/Data Processing CostSample/Data Processing TimeTotal Cost
TraditionalVisual assessmentLow-MediumNoN/A100%AUD 16004000AUD 1600
Indicator PlantsMediumYesN/A1%AUD 3208AUD 3400MonthsAUD 3720
Lab-based testingELISAHighYesN/A1%AUD 3208AUD 85002–3 daysAUD 8820
RT-PCRVery HighYesN/A1%AUD 3208AUD 17,0002–3 daysAUD 17,320
Proximal sensingRGBLow-MediumNo<Single leaf100%AUD 64016AUD 12802 daysAUD 1920
Chl-FlLowYesSingle leaf100%AUD 480080AUD 12802 daysAUD 6080
ThermalLowYesSingle leaf100%AUD 240040AUD 12802 daysAUD 3680
HyperspectralMediumYesSingle leaf100%AUD 480080AUD 25604 daysAUD 7360
Remote sensing (Satellite)MultispectralVery LowYes>Single plant100%AUD 10/image AUD 12802 daysAUD 1290
Remote sensing (Manned Airplane)RGB + Multispectral + ThermalLowYesSingle plant100%AUD 100<0.5 hAUD 12802 daysAUD 1380
Remote sensing (UAV)RGBLowNo<Single leaf100%AUD 2002AUD 12802 daysAUD 1480
MultispectralLowYesSingle leaf100%AUD 3003AUD 19203 daysAUD 2220
HyperspectralMediumYesSingle leaf100%AUD 4006AUD 32005 daysAUD 3600
ThermalLowYesSingle leaf100%AUD 3003AUD 12802 daysAUD 1580
Publisher’s Note: MDPI stays neutral with regard to jurisdictional claims in published maps and institutional affiliations.

