Article

Permafrost Ground Ice Melting and Deformation Time Series Revealed by Sentinel-1 InSAR in the Tanggula Mountain Region on the Tibetan Plateau

1
School of Geographical Sciences, Nanjing University of Information Science & Technology (NUIST), Nanjing 210044, China
2
Cryosphere Research Station on Qinghai-Xizang Plateau, State Key Laboratory of Cryosphere Science, Northwest Institute of Eco-Environment and Resources, Chinese Academy of Sciences (CAS), Lanzhou 730000, China
3
University of Chinese Academy of Sciences, Beijing 100864, China
*
Author to whom correspondence should be addressed.
Remote Sens. 2022, 14(4), 811; https://doi.org/10.3390/rs14040811
Submission received: 4 January 2022 / Revised: 27 January 2022 / Accepted: 4 February 2022 / Published: 9 February 2022

Abstract

:
In this study, we applied small baseline subset-interferometric synthetic aperture radar (SBAS-InSAR) to monitor the ground surface deformation from 2017 to 2020 in the permafrost region within an ~400 km × 230 km area covering the northern and southern slopes of Mt. Geladandong, Tanggula Mountains on the Tibetan Plateau. During SBAS-InSAR processing, we inverted the network of interferograms into a deformation time series using a weighted least square estimator without a preset deformation model. The deformation curves of various permafrost states in the Tanggula Mountain region were revealed in detail for the first time. The study region undergoes significant subsidence. Over the subsiding terrain, the average subsidence rate was 9.1 mm/a; 68.1% of its area had a subsidence rate between 5 and 20 mm/a, while just 0.7% of its area had a subsidence rate larger than 30 mm/a. The average peak-to-peak seasonal deformation was 19.7 mm. There is a weak positive relationship (~0.3) between seasonal amplitude (water storage in the active layer) and long-term deformation velocity (ground ice melting). By examining the deformation time series of subsiding terrain with different subsidence levels, we also found that thaw subsidence was not restricted to the summer and autumn thawing times but could last until the following winter, and in this circumstance, the winter uplift was greatly weakened. Two import indices for indicating permafrost deformation properties, i.e., long-term deformation trend and seasonal deformation magnitude, were extracted by direct calculation and model approximations of deformation time series and compared with each other. The comparisons showed that the long-term velocity by different calculations was highly consistent, but the intra-annual deformation magnitudes by the model approximations were larger than those of the intra-annual highest-lowest elevation difference. The findings improve the understanding of deformation properties in the degrading permafrost environment.

Graphical Abstract

1. Introduction

Frozen sediment in nature usually contains ice, especially within the surface layer of soils. The soil just below the permafrost table is commonly ice-rich [1,2,3,4,5]. The volumetric ice content in this layer of soils is always greater than 50%. It is common to meet the pure ice layer, which was formed by ice segregation, from several centimeters up to several meters. As the thawing front penetrates the ice-rich soil layers, ground surface settlement on a gentle and flat plain [6,7] and slumping or collapse on slopes [8,9,10] occur, accompanied by ground ice melting and soil consolidation. Shore retreat around the Arctic Ocean [11] and construction damage [12] caused by ground ice melting have been widely reported.
The Qinghai-Tibet Plateau (QTP) has approximately 1.06 × 10⁶ km2 of permafrost coverage and stores approximately 1.27 × 10⁴ km3 of water-equivalent ground ice [13,14,15]. It has the largest high-altitude permafrost of the middle and low latitudes, and the ground ice stored in this region is twice the glacial ice reserve and 10 times the total amount of groundwater resources [16]. In recent decades, the climate on the plateau has become warmer and wetter, with an increase of 0.3–0.4 °C every 10 years, and the warming rate in the past 40 years is almost twice the global average. Based on the distribution of ground ice and the current thickening rate of the active layer, approximately 80 km3 of ground ice in the permafrost region of the QTP is expected to melt each decade in the near future [14]. The melting of ground ice may release a certain amount of water that subsequently participates in the regional water cycle and influences the regional water balance. Some studies have revealed that melting water from permafrost ground ice may contribute 12% to the lake volume increase in the Tibetan Plateau’s endorheic basin [17]. The permafrost region on the Tibetan Plateau is the source area of the Yangtze River, Yellow River, Mekong River, and Salween River. The melting water from permafrost ground ice will have a hydrologic and ecological effect on these river basins and downstream. Measuring the amount of ground ice melting water could provide a basis for current hydrological process assessments and future predictions. Terrain surface deformation/settlement provides a “window” to detect the subsurface ground ice melting, and thus summarizing the deformation characteristics related to ground ice loss is especially important.
Interferometric synthetic aperture radar (InSAR) time series analysis uses the phase change in the SAR signals to determine the relative terrain displacement on the order of millimeters to centimeters. InSAR has been applied to detect small surface terrain movement due to permafrost activities caused by seasonal freeze-thaw and multiannual thawing degradation [18,19,20,21,22,23,24,25,26,27,28]. When icy permafrost thaws, thermokarst activity, such as terrain downward displacement, can be captured by applying InSAR monitoring. In the Tibetan Plateau permafrost environment, the long-term surface subsidence rate is less than 5 mm/a on the northwestern Tibetan Plateau in a cold and dry environment [18], ranging from 3 to 30 mm/a on Eboling Mountain in the northeastern region of the Tibetan Plateau in an ice-rich environment [28] and ranging from 2 to 30 mm/a on the HohXil region from Wudaoliang to Tuotuohe [29]. In the Arctic, it was recently found that large late-season subsidence could indicate top-of-permafrost ground ice melting [19,30]. Late-season subsidence could reach 4–8 cm in ice-rich areas during warm seasons in the northwestern Alaskan Arctic, while the subsidence value was low in ice-poor areas [19].
The ground deformation process is complex over permafrost terrain, and the deformation signal includes both a long-term deformation trend and a periodic seasonal elevation change during the year. Two types of models are commonly used to describe the seasonal variation in ground surface up-down deformation cycles: (1) a sinusoidal model that uses a sinusoidal function to approximate the seasonal oscillation in a one-year cycle [21,24,27]; and (2) a degree-day model that describes seasonal deformation proportional to the square root of the cumulative degree day of thawing or freezing [28,29,31]. It remains controversial about which type of model is better at describing seasonal deformation. When SAR acquisitions are not adequate, a deformation model is usually preset in SBAS-InSAR processing to reduce the number of solutions in the deformation time series inversion [32]. With the launch of new SAR satellites, such as Sentinel-1A/B, adequate SAR images with short repeat cycles can be obtained; thus, in this study, we inverted the network of interferograms into deformation time series in a direct way without a preset deformation model. The raw deformation time series was derived first, and then the long-term deformation velocity and seasonal deformation amplitude were extracted. Based on the raw deformation time series, we could evaluate whether during the inversion process the preset model affected the derived deformation properties, such as the results of long-term velocity and seasonal amplitude.
By exploring the deformation properties in degrading permafrost, we aim to reveal the terrain deformation characteristics concerning ground ice melting. Three main questions to be answered by this study are as follows: (1) What are the characteristics of ground ice melting in the Tanggula Mountain region, the central part of the Tibetan Plateau? (2) What other deformation signals are related to ground ice melting? (3) Are there differences in the deformation properties derived by different calculations?

2. Study Area and Datasets

2.1. Study Area

The study area is a 400 km × 230 km domain with elevations from 4080 to 6569 m a.s.l. from Fenghuoshan in the north to Amdo in the south, covering the northern and southern slopes of the Tanggula Mountains, shown in Figure 1. The study area includes the north continuous permafrost and the south island permafrost environments. Approximately 68% of its terrain is covered by permafrost, mainly in the north of the study area [13]. Mt. Geladandong of the Tanggula Mountains is in the center of this study region, where the Zhajiazangbu River, the main inland river in the Tibetan Plateau, and the Tuotuohe River, the source of the Yangtze River, have their sources.
The region is characterized by cold and semiarid climate conditions. There are three meteorological stations located inside the study area: Amdo station in the south (4800 m a.s.l.), Tanggula station in the middle (5033 m a.s.l.), and Tuotuohe station in the north (4533 m a.s.l.). Their locations are marked in Figure 1. The mean annual air temperature (MAAT) is −2.2 °C and −3.51 °C at Amdo and Tuotuohe, respectively, with a warming rate larger than 0.54 °C/10a. Figure 2a illustrates the monthly mean ground temperature at a depth of 10 cm recorded at Tanggula station. The annual precipitation was 459.1 mm 301.6 mm at Amdo and Tuotuohe from 1981 to 2017, respectively [14], and 353.5 mm at Tanggula between 2005 and 2015. Precipitation normally comes during May and September. Figure 2b illustrates the monthly precipitation amount recorded at Tanggula station during 2005 and 2015. During the winter months (November–February), precipitation is less than 10 mm.
Alpine desert, steppe, meadow, and swamp meadow cover the land surface. The vegetation is sparse in the area above 4900 m a.s.l., presenting an alpine desert landscape. In river valleys, piedmont alluvial fans, and gentle hillsides are present above 4500 m a.s.l., with low precipitation and strong evaporation. The ground is mainly covered by gravels with thin soil, characterized by patchy sparse vegetation cover. In well-drained basins and lakeside areas with sufficient moisture, grass mounds make the ground undulating. In areas with poor drainage conditions, swamp meadow is formed. The erosion is strong in the bare and sparsely vegetated land. Land desertification on the Tibetan Plateau continues to expand and spread in permafrost regions and has been receiving increasing attention in recent years [33,34,35].
We conducted field investigations in the autumn of 2019 and 2020. Thirty-nine boreholes were drilled during the fieldwork, and ice-rich soil layers near the permafrost table were found in a quarter of all the borehole cores. Eighty-one ground penetrating radar (GPR) profiles longer than 50 m were carried out, and their locations are marked in Figure 1. The field drillings indicated that the active layer thickness (ALT) was generally in the range of 2–4 m. The ALT was 1.8–2.3 m of the swamp meadow, 2.1–3.6 m of the alpine meadow, 2.3–6.0 m of the alpine steppe and desert, and up to 5–6 m in the riverbed or floodplain [36]. GPR interpretations also indicated that the maximum ALT was 5.6 m, and the minimum was 1.2 m with an average of 2.9 m; the volumetric soil water content in the active layer was 0.475 m3/m3 at maximum, 0.032 m3/m3 at minimum, and 0.204 m3/m3 at average.

2.2. Datasets

The C-band Sentinel-1A (S1A) SAR images (https://scihub.copernicus.eu/, accessed on 3 January 2022) were processed to retrieve surface deformation. Sentinal-1A and Sentinal-1B were launched in April 2014 and April 2016, respectively. We used Level 1 single look complex (SLC) images acquired in the descending orbit in interferometric wide-swath (IW) mode with VV polarization in the study. The orbit number was 150, and the frame numbers included 490, 485, and 480. The incidence angle was from 31.57°–46.27°. In total, 100 acquisition dates of orbit 150 from September 2017 to December 2020 were processed, and 196 interferometric pairs were generated.
The 1-arcsecond grid (~30 m) Shuttle Radar Topographic Mission (SRTM) DEM was used to geocode and remove the topographic phase.
For indicating temperature information in the study area, a daily 1-km all-weather land surface temperature dataset [37], which integrated Aqua MODIS LST products and GLDAS reanalysis data, was adopted in this study. The dataset is seamless in space and highly consistent with the amplitude and spatial distribution of the 1 km daily Aqua MODIS LST product [38]. We averaged daytime and nighttime data to generate the daily land surface temperature.

3. Methods

3.1. SBAS-InSAR Processing

SBAS-InSAR deploys multiple master datasets to minimize the effects of spatial-temporal decorrelation [32,39,40]. It selects interferograms with small spatial and temporal baselines, thus is suitable for permafrost environments that face strong spatial-temporal decorrelation. We performed SBAS-InSAR processing in three steps as follows:
  • InSAR Processing
To minimize the decorrelation caused by permafrost landscapes and terrain elevation changes, we only generated interferograms with short time intervals. Every SAR image was coregistered with the following two sequential acquisitions. The temporal baselines of individual interferograms were 12 to 24 days, and the perpendicular baseline of all the interferometric pairs was <100 m. The precision state vectors obtained from the ESA were applied to reduce the effects of inaccurate baselines. Then, multilooking with 13 pixels in range and 3 pixels in azimuth was performed to form a square pixel (~40 m) and reduce the speckle noise. The topographic phase was simulated using the SRTM DEM and then subtracted from the interferogram. Subsequently, we applied an adaptive spectral filter to the generated differential interferograms. To unwrap the differential phase, a minimum cost flow (MCF) phase unwrap method was applied in this study. These processings were implemented using ISCE software (https://github.com/isce-framework/isce2, accessed on 3 January 2022). Coregistration and conversion between radar coordinates and geometric coordinate systems were accelerated by the aid of a graphic processing unit (GPU) under the CUDA framework during the processing of such a large area.
  • Deformation Time Series Estimation
In this step, the network of unwrapped interferograms was inverted to construct a timeline of line-of-sight (LOS) displacement maps. We applied a weighted least square (WLS) estimator to invert the network of interferograms into time series, in which the interferograms were weighted by the inverse of the phase variance [41,42]. Unlike some studies that presuppose a deformation model to facilitate solving the phase time series in permafrost environments, we did not preset any deformation in this study. The raw phase time series were solved by minimizing the phase residual in the WLS estimator. The first scene of the datasets was taken as the benchmark for the time series of LOS displacements. The pixels with extremely high temporal coherence greater than 0.99 were taken as reference points to compare the spatial differences of ground surface deformation. Then, tropospheric delay correction, phase deramping, and topographic residual correction were applied to reduce the residual errors in the deformation phases. The tropospheric delay in the satellite LOS direction was estimated using ERA-5 reanalysis data. The processing was developed in PyAPS software from [43]. Linear phase ramps, which might be caused by residual tropospheric and ionospheric delays, were estimated and removed from the displacement time series at each acquisition using reliable pixels. The systematic topographic phase residual caused by a DEM error was estimated based on the proportionality with the perpendicular baseline time series [44]. The processing described above was implemented by MintPy [45] (https://github.com/insarlab/MintPy, accessed on 3 January 2022).
  • Reference Point Refinement and Geocoding
The exposed bedrock in the natural environment in flat terrain was the ideal reference point due to its minimal surface deformation compared with sediments with higher water content. If it was not available in our study region, we set the reference point in the area located in the seasonally frozen ground with very dry surface soil that was homogeneous and had coherence close to one. Finally, we geocoded the deformation time series to the WGS84 coordinate system with 0.0005 × 0.0005 degree spacing and then reprojected it to the Albers Equal Area Conic system with a 100 × 100 m grid size. To minimize the disturbance of extreme values (e.g., ionospheric distortion) in the following calculation of intra-annual deformation magnitude, we also applied a 3-size moving window filter to the deformation time series.

3.2. Long-Term Deformation Velocity and Seasonal Deformation Calculation

After the deformation time series were derived, two import indices, i.e., long-term deformation trend and seasonal deformation magnitude, were extracted to describe permafrost deformation characteristics. These two indices were obtained by direct calculation and the model approximations of deformation time series. In describing the long-term deformation trend, a linear trend is normally adopted to derive the long-term trend rate. The intra-annual seasonal deformation can be calculated as the highest-lowest terrain elevation difference in each year. Then the multiyear values are averaged to represent the averaged state during the investigation period. In addition to the direct calculation of highest-lowest terrain seasonal deformation, two types of model approximations are widely used. In the sinusoidal model [18,21], seasonal deformations are modeled with a sinusoidal function, like the oscillation with temperature. In the degree-day model [29,46], seasonal deformations modeled with the Stefan equations, where the deformation is proportional to the square root of the cumulative degree day of thawing or freezing. Some studies refine and extend the models based on the abovementioned models. Table 1 lists the three calculations used in this study for later comparison. Although all the calculations can give seasonal deformation magnitudes, the calculated seasonal deformation values have different meanings and applicabilities. In the sinusoidal model, the computed seasonal deformation emphasizes a periodic deformation signal over permafrost terrain. In the degree-day model, the computed seasonal deformation emphasizes the largest deformation magnitude in relation to thawing depth.

4. Results

4.1. SBAS-InSAR Derived Deformation Time Series

The SBAS-InSAR derived deformation time series were examined in three sectors marked in Figure 1. In our study area, exposed bedrock in flat terrain is rare, thus we took great care in selecting reference points of InSAR application. The point outside the permafrost region in arid and flat terrain in the south of the study area, also having the highest interferometric coherence close to 1, was finally set as the reference point. We first examined the SBAS-InSAR deformation time series in the south seasonally frozen ground zone (sector 1, Figure 3) to check whether they performed high stability. In this region, the permafrost only sporadically occurs in certain areas where the environment is favorable for its existence, and the large area should be stable. Site TS1 is in arid and flat terrain, and its displacement curve is highly stable, with fluctuations smaller than 1 mm. Site TS3 is situated on the top of a low hill, and its terrain is also stable. Site TS2 is in flat terrain, but next to a stream, thus having soil moisture variations. Consequently, in contrast to TS1, its displacement curve manifests a visible fluctuation. Some uplift signals occurring in the sensor-facing slopes and subsidence signals occurring in the sensor-away slopes are actually downslope movements driven by gravity reflected by the relative position of the sensor and the local topography [23,47,48].
The area of sector 2 shown in Figure 4 is near the Tuotuohe River, with both permafrost and taliks developed. The deformation time series of six points in this sector are illustrated. The field drilling at site TS9 indicates no permafrost existence at this point; it has the smallest seasonal deformation (Figure 4i) among the six sites. Sites TS4, TS5, and TS6 all manifest different levels of permafrost terrain subsidence. Site TS6 is in low-lying wet areas and thus has the most significant seasonal deformation (Figure 4f). The terrain subsidence trend indicates ground ice loss. If the sediment does not contain excess ice or there is little ground ice change, the ALT variation alone will only amplify or shrink the intra-annual seasonal oscillation amplitude and keep the maximum uplift level constant during the winter season, other than lateral variations in the long-term ground displacement [18]. The uplift deformation signal of site TS8 (Figure 4h) might be related to permafrost aggradation. This site is very close to the river, and the sufficient water supply might facilitate the upward freezing of previously unfrozen (or seasonally frozen) sediment. At site TS7, the freeze-thaw seasonal oscillation is distinct (Figure 4g), but the permafrost thermal state is stable. The displacement curves shown in Figure 4d–i demonstrate that the SBAS-InSAR derived displacement curves can reflect different states of permafrost and seasonally frozen ground.
The area of sector 3 shown in Figure 5 is located west of the study area. Two alluvial fans are clearly visible in Figure 5a. Sites TS11 and TS12 are on the alluvial fan, thus exhibiting a clear uplift trend up to 6.8 mm/a (Figure 5e–f) due to sand deposition. Site TS10 is where photo P1 was taken, in which wind-blown dust is visible (Figure 1P1). This site manifests a small uplift value of 1.8 mm/a (Figure 5d), which might also be attributed to sand deposition. Field drilling at site TS11 indicated no permafrost exitance at this point. Sites TS10–TS12 have similar deformation curves; these tree sites probably have no permafrost existence as inferred by their locations and deformation curves. Sites TS13 and TS 14 exhibit periodic and intense freeze-thaw deformation along with an evident subsidence trend (Figure 5d–e), clearly indicating ground ice melting.
The deformation time series shown in Figure 3, Figure 4 and Figure 5 illustrate varied terrain deformation patterns, even within a small area. The coherence maps in subfigures (b) reveal that the permafrost-affected areas have lower coherence than non-permafrost areas. This is especially clear in Figure 4b. The seasonal oscillation is controlled mainly by the water storage in the active layer [49]; low-lying wet areas have larger seasonal oscillations than the dry areas. In some places, terrain uplift signal caused by sand deposition on alluvial fans or riverbanks is visible. In recent years, land desertification on the Tibetan Plateau has been receiving increasing attention [33,34,35]. The rivers in their source area are wide, and the riverbanks are low and flat. During summer, water carries debris from rock weathering, sandy meadows, and steppes and deposits it in the riverbed and floodplain. In winter, when river flow decreases, the riverbanks covered with sediments are exposed, and strong winds blow loose sediments onto the gently sloped riverbanks. InSAR measures relative deformation relative to the reference point. The Tibetan Plateau itself has tectonic movements, and the study area covers 400 km long, which means such large-scale InSAR measurements are also affected by tectonic movements. In addition, the ionospheric distortion on the phases could also be significant on a large scale. However, in most cases, the uplift signal caused by other factors can be easily distinguished from the permafrost aggradation-induced uplift signal because the latter also has a periodic and large seasonal deformation, as shown in Figure 4h.

4.2. Characteristics of Ground Surface Deformation in the Tanggula Mountain Region

After the deformation time series were derived, two import indices, i.e., long-term deformation trend and seasonal deformation magnitude, were derived using a direct calculation method as described in Table 1. The spatial distributions of long-term deformation velocity and seasonal deformation magnitude are shown in Figure 6.

4.2.1. Spatial Distribution of Long-Term Deformation Velocity and Seasonal Deformation Magnitude

The spatial distribution pattern of the long-term deformation velocity (Figure 6a) follows the permafrost distribution map (Figure 1b) very well. Widespread and large subsidence is found in the northern continuous permafrost zone, whereas subsidence is sporadic in the southern island permafrost and seasonally frozen ground terrain. Based on the analysis of deformation time series in Section 4.1 and the previous research [18,48], areas displaying LOS velocities of less than 2.5 mm/a are likely unmoving on a multiannual scale (the threshold of 2.5 mm is set in displaying deformation characteristics in Figure 6). On steep slopes, the deformation occurs mainly as a downslope movement driven by gravity [23,48]; thus, statistical analysis was only performed on pixels with slope angles below 10°. Among the subsiding terrain with distinct subsidence greater than 2.5 mm/a, the coverage area with different subsidence levels from −2.5~5 mm/a to greater than 30 mm/a was calculated, and the statistics are summarized in Table 2. The average subsidence rate over the subsiding terrain is 9.1 mm/a, most terrain in the northern and southern slopes of Mt. Geladandong (68.1%) has a subsidence rate between 5–20 mm/a, and a very limited region (0.7%) has a subsidence rate even larger than 30 mm/a.
The spatial distribution pattern of seasonal deformation (Figure 6b) also follows the distribution of permafrost existence (Figure 1b). In the south of the study area, where island permafrost and seasonally frozen ground terrain are present, the seasonal deformation location is sporadic, and the value is much smaller. The spatial pattern also agrees with that of the long-term deformation velocity (Figure 6a). The places subject to subsidence also have higher seasonal deformation values than other places. The seasonal deformation is mainly affected by the water content in the active layer due to the ice-water phase change in the active layer during the freeze-thaw cycle [49,51], thus a large water storage capacity results in a large seasonal ground deformation during the freeze-thaw cycle. Among the terrain with subsidence larger than 2.5 mm/a, 44.3% has seasonal deformation of 10–20 mm, 30.7% of the terrain has seasonal deformation of 20–30 mm, 13.1% has seasonal deformation of 30–50 mm, 11.7% has seasonal deformation of less than 10 mm and 0.2% has seasonal deformation larger than 50 mm. The averaged seasonal deformation magnitude is 19.7 mm.

4.2.2. Relationship between Seasonal Amplitude and Deformation Velocity

As seen in Figure 6, terrain with large seasonal deformation tends to undergo strong subsidence. The distributions of intra-annual seasonal deformation with different subsidence levels are illustrated in Figure 7. The average intra-annual seasonal deformation increases from 16.7 mm to 28.6 mm from the lowest to the highest subsidence level. Although there is a positive relationship between the seasonal deformation magnitude and long-term deformation velocity, the correlation coefficient between them is only 0.3. The correlation relationship between seasonal amplitude and deformation velocity could be explained as follows. On the one hand, the formation of ground ice requires water. The segregated ice is developed when soil moisture migrates through the frozen fringe in response to the temperature gradient to form discrete layers or lenses [2,52,53]. Segregated ice formation is favored in areas with sufficient soil water content. On the other hand, the melting of ground ice near the permafrost table releases a large amount of free liquid water, which increases the water content in the active layer, especially at the bottom of the active layer. The interaction between water storage in the active layer and ground ice loss is complicated, which explains why the correlation coefficient is low, although we noticed a synergy between them.

4.2.3. Deformation Curves of Degrading Permafrost with Different Subsidence Levels

The deformation curves of different subsidence levels during 2017–2020 are shown in Figure 8. We did not observe extremely large late-season subsidence during the three-year monitoring period, likely the 4–8 cm in one month recorded in the northwestern Alaskan Arctic [19]. The very large late-season subsidence in the Alaskan Artic occurred under the circumstances of massive excess ground ice, an exceptionally warm summer, and the fast drainage speed of meltwater. The circumstances mentioned above may not be satisfied in the Tanggula Mountain region. Whether such large late-season subsidence can occur on the Tibetan Plateau remains to be investigated.
The differences between the deformation curves with varied subsidence levels are distinct in Figure 8, which highlights the differences in deformation characteristics of ice-poor and ice-rich permafrost terrain. To better interpret the deformation characteristics, we calculated the deformation velocity in the thawing season (1 May–30 September) and in the freezing season (1 October–31 December), shown in Figure 9c. To facilitate the interpretation of Figure 9c, the daily air temperature, ADDT and ADDF are also presented in Figure 9a,b.
As seen in Figure 9c, heavily settled terrain has a much faster thawing settlement speed during May–September than the terrain with a lower subsidence rate; however, it does not have a much faster freezing heave speed during October and December. The freezing heave speed does not further increase when the long-term subsidence velocity is >10 mm/a. The freezing season in 2018 (blue triangle in Figure 9c), followed by a very warm summer confirmed by its ADDT (Figure 9b), is worth attention. The terrain freezing heave speed is weakened when its long-term subsiding rate is > 10 mm/a, and even the subsidence signal is continuously detected when its long-term subsiding rate is > 20 mm/a. Apparently, over this terrain, the active layer uplift in winter was obscured by ground ice melting, and the winter frost heave was greatly weakened.

4.3. Differences in the Deformation Properties Derived by Different Calculation Methods

In addition to the deformation properties derived by direct calculation of deformation time series, in this section we also displayed the deformation properties derived by model approximations of deformation time series and compared their agreement and disagreement. The comparison extent is shown with red dashes in Figure 6.

4.3.1. Differences between Long-Term Deformation Calculations

Figure 10 presents the long-term deformation trend velocities calculated using a linear trend plus a sinusoidal function and a piecewise linear trend plus a degree-day model (Table 1). They are nearly the same as in Figure 6a. The scatterplot between the three results and the relational expression (Figure 11) also confirmed the sameness between the three results. They also indicate that different intra-annual seasonal model descriptions do not affect the calculation of long-term velocities.

4.3.2. Differences between Seasonal Deformation Calculations

Figure 12 shows the spatial distribution of seasonal deformation approximated by the sinusoidal function and degree-day model. The spatial distribution patterns of the seasonal deformation by three calculations (Figure 6b and Figure 12) were almost identical, and the correlation coefficient between the different results is all above 0.91 (Figure 13). However, the values from the model approximations and the direct calculation of the intra-annual highest-lowest terrain elevation differed.
The sinusoidal result slightly overestimates the seasonal deformation in large values. The sinusoidal function emphasizes the periodic sinusoidal signal, and some nonperiodic sinusoidal signals cannot be captured. For example, Figure 6b manifests that the riverbanks undergo small deformation values due to sand deposition, but such deformation signals are not manifested in Figure 12a because these signals are not sinusoidal periodic. This explains why the scatterplot in Figure 13a is dispersive in small values and convergent in large values: the large values are caused by permafrost seasonal freeze-thaw activities, whereas small motions may have other causes.
The degree-day result overestimates the seasonal deformation. The degree-day model is suitable for areas with apparent temperature-induced frost heave and thaw subsidence characteristics. In areas that do not have such deformation characteristics, the model is not suitable and will lead the model-derived seasonal deformation values to be very low. It explains why the white regions, where seasonal deformation is 0–2.5 mm, cover a larger extent in Figure 12b than in Figure 6b and Figure 12a. In calculating the seasonal deformation using the degree-day model, we adopted the largest ADDT during the year, whereas the actual acquisition date at the end of the thawing season does not coincide with the date having the largest ADDT. As a result, the “largest” ADDT should be smaller, leading to a calculated seasonal deformation in this study larger than the intra-annual highest-lowest elevation difference. It is also worth mentioning that the degree-day model needs a precise temperature input (air/ground surface temperature); bias in the temperature inputs would also lead to bias in the resulting seasonal deformation. However, high spatial resolution and accurate temperature is lacking in the large and wild permafrost region.

5. Discussion

5.1. InSAR Application in the Study Area

In a permafrost environment, snowmelt or wet snowfall can be significant sources of decorrelation [54,55]. In this study area, the precipitation during November–February is very small, with the monthly precipitation under 10 mm (Figure 2). Figure 14 shows the averaged interferometric coherence in different months during the year. It is found that the interferometric coherence is high during November–February, which also proves that the snow distortion is limited during this period. However, a lower coherence is noticed during the freeze-thaw transition period, especially during April and June. The lower coherence is most likely caused by the combined effects of snow and ground surface freeze/thaw state changes. Several deformation curves in Figure 4 and Figure 5, e.g., Figure 4d,e,g,i and Figure 5g,h, manifest that the displacement is very small from late January to the end of February (ground is stable) after a fast freeze-heaving speed from late October to the beginning of January. Our field monitoring of terrain deformation on the southern slopes of Mt. Geladandong during the 2021–2022 freezing season also reveals that the freezing heaving ends at the beginning of January. The detected sudden uplift signal during April and May is most likely caused by snowfalls, not the real terrain deformation signal. Thus, to exclude the decorrelation influence during March–May, the highest terrain elevation is sought in the January–February period when calculating the intra-annual highest-lowest elevation difference. It also explains why the model-approximated seasonal deformations are larger than the values calculated by the highest-lowest terrain elevation difference.

5.2. Seasonal Deformation Model Descriptions

There have been several arguments about what time series models are suitable for describing seasonal deformation. During the MT-InSAR or SBAS-InSAR processing, a deformation model is usually predetermined and placed to make the computation easier in a typical computation of a time sequence of deformation. On the one hand, when the acquisitions of SAR data or the qualified interferograms are insufficient, a rank defect problem is faced in directly resolving a time sequence of deformation. By replacing unknowns of a time sequence of deformation (dozens of hundreds) with the parameters in the deformation model (less than 10), the number of unknowns is largely reduced. The parameters in the deformation model are significantly less than the unknowns in the deformation time series. On the other hand, the temporal deformation curve generated through the model is steady and does not have a jump or inconsistency in a deformation time series. However, all the predetermined models simplify and approximate the actual deformation time series. They cannot wholly capture the deformation caused by the complex influences in the permafrost areas. In addition, the models have their deficiencies from the perspective of their physical background. The format of the degree-day model is that of the Stefan model [56], which assumes that the terrain deformation is parallel/proportional to the thawing depth. The sinusoidal model assumes that the deformation is in the sinusoidal curve as the air temperature. The permafrost surface terrain deformation is complicated and subjected to many factors, not only temperature or precipitation, but many other factors, including soil hydrothermal processes, soil moisture, soil porosity, heat conductivity and capacity. In some circumstances, the surface displacements would deviate from the preset model. The recent launch of Sentinel-1 satellites with systematic acquisitions with a shorter revisit time (down to 6 days combining A and B satellites in some regions) allows to form a large number of SAR data acquisitions and increase the temporal sampling rate of the monitorings. When adequate qualified interferograms are available, the preset deformation model is not obligatory in solving deformation time series in the MT-InSAR processing. The predetermined model applied in the MT-InSAR processing will compulsively force the generated deformation curve to fit the preset deformation pattern, which biases the deformation estimations and impedes the correct interpretation of the deformation temporal patterns. The predetermined deformation model is not recommended in the MT-InSAR process when adequate SAR data acquisitions are available.
In this study, we first obtained the raw deformation time series without a preset deformation model, then compared the deformation properties (long-term velocity and seasonal magnitude) generated by a direct calculation and the model approximations. The comparison result could also reflect the differences caused by different deformation time-series inversion schemes during SBAS-InSAR processing. Regarding the long-term deformation velocities or the ground ice melting velocities, the results show that the long-term velocities obtained by the three calculations are almost the same. Regarding the intra-annual seasonal deformation magnitude, the direct calculation and the model approximations show slight differences, and the deviations depend on the model descriptions. In addition, as analyzed in Section 4.2.3, we found that the subsidence is not restricted to the summer thawing season. Rather, the thaw subsidence could last until the following autumn or winter. Based on this finding, the piecewise separation of long-term deformation into the freezing and thawing season based on air or ground surface temperature as in Equation (7) does not help resolve this issue. Beyond that, the model approximations do not consider the snow accumulation induced bias during March and May.

6. Conclusions

In this study, we monitored ground surface deformation on the northern and southern slopes of the Tanggula Mountains during 2017–2020 using SBAS-InSAR analysis, and reached the following conclusions.
(1)
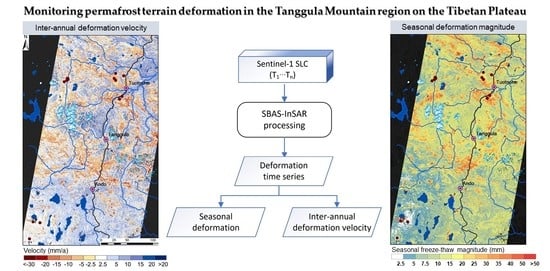
The deformation curves of varied terrain surfaces, e.g., degrading permafrost, aggrading permafrost, stable permafrost, seasonally frozen ground, alluvial fan, in the permafrost environment in the Tanggula Mountain region were first revealed and analyzed in detail. Compared to non-permafrost areas, the permafrost-affected areas have lower coherence and large periodic seasonal deformation. Most permafrost deformation time series reveal that the displacement is very small from late January to the end of February (ground is stable), after a fast freeze-heaving speed from late October to the beginning of January. In the study area, due to low precipitation during November–February, the snowmelt or wet snowfall effect is limited, and interferometric coherence is high during this time. A lower coherence is noticed during April and June, which is most likely caused by the combined effects of snow and ground surface freeze/thaw state changes.
(2)
The average subsidence rate is 9.1 mm/a over subsiding terrain. The majority of the subsiding terrain (68.1%) has a subsidence rate between 5–20 mm/a. A very limited region (0.7%) has a subsidence rate larger than 30 mm/a, and the average seasonal deformation magnitude is 19.7 mm. Both the subsidence rate and the seasonal deformation are higher than those on the northwestern part of the Tibetan Plateau [18]. The subsidence values are similar to those on the ice-rich Eboling Mountain in the northeastern region of the Tibetan Plateau [28], and those in the Hohxil region from Wudaoliang to Tuotuohe [29]. In comparison to other permafrost areas in Arctic and subarctic regions [18,19,20,22,23,24,27,30,46,47,54,55,57,58,59,60,61,62,63,64,65,66,67,68,69], generally, the seasonal deformation value on the Tibetan Plateau is smaller, but the intra-annual subsidence rate is not a small value.
(3)
We compared two important deformation indices over permafrost terrain, i.e., long-term deformation trend and seasonal deformation magnitude, derived by direct calculation of deformation time series and model approximations using the sinusoidal and degree-day models. Regarding the long-term deformation trend rates, different calculations manifested very high agreement. Regarding the seasonal deformation magnitude, there is a deviation between the model-approximated values and the direct calculation of intra-annual highest-lowest elevation difference. We also detected a winter subsidence signal over heavily settled terrain in a warm year by examining the deformation time series. Thus, the piecewise separation of long-term deformation into the freezing and thawing season based on air or ground surface temperature may not describe this phenomenon well. When adequate SAR data acquisitions are available, the preset deformation model in MT-InSAR processing might introduce bias in deriving seasonal deformation properties.

Author Contributions

Conceptualization, L.W.; methodology, L.W.; formal analysis, L.W. and E.D.; investigation, L.W., L.Z., H.Z., S.L., D.Z., G.L., C.W. and Y.L.; resources, L.Z., E.D., D.Z. and G.L.; data curation, H.Z. and S.L.; writing—original draft preparation, L.W.; writing—review and editing, L.W., L.Z., E.D. and Y.L.; project administration, L.Z.; funding acquisition, L.W. and L.Z. All authors have read and agreed to the published version of the manuscript.

Funding

This research was supported by research grants from the National Natural Science Foundation of China (No. 42001054 and 41931180), the Natural Science Foundation of Jiangsu Province (BK20200828), and the Second Tibetan Plateau Scientific Expedition and Research (STEP) program (No. 2019QZKK0201).

Data Availability Statement

The Sentinel-1 SAR data was downloaded from the Alaska Satellite Facility (https://www.asf.alaska.edu/sentinel/, accessed on 3 January 2022). Precise orbit files of Sentinel-1 were obtained from the Payload Data Ground Segment (PDGS) and downloaded from (https://scihub.copernicus.eu/gnss/#/home, accessed on 3 January 2022).

Conflicts of Interest

The authors declare no conflict of interest.

References

  1. French, H.M. The Periglacial Environment; John Wiley & Sons: Hoboken, NJ, USA, 2017. [Google Scholar]
  2. Cheng, G. The mechanism of repeated-segregation for the formation of thick layered ground ice. Cold Reg. Sci. Technol. 1983, 8, 57–66. [Google Scholar]
  3. Shur, Y.; Hinkel, K.M.; Nelson, F.E. The transient layer: Implications for geocryology and climate-change science. Permafr. Periglac. Process. 2005, 16, 5–17. [Google Scholar] [CrossRef]
  4. Mackay, J.R. Some observations on the growth and deformation of epigenetic, syngenetic and anti-syngenetic ice wedges. Permafr. Periglac. Process. 1990, 1, 15–29. [Google Scholar] [CrossRef]
  5. Burn, C.R. The development of near-surface ground ice during the Holocene at sites near Mayo, Yukon Territory, Canada. J. Quat. Sci. 1988, 3, 31–38. [Google Scholar] [CrossRef]
  6. Streletskiy, D.; Shiklomanov, N.I.; Littlet, J.D.; Nelson, F.E.; Brown, J.; Nyland, K.E.; Klene, A.E. Thaw subsidence in undisturbed tundra landscapes, Barrow, Alaska, 1962–2015. Permafr. Periglac. Process. 2016, 28, 566–572. [Google Scholar] [CrossRef]
  7. Shiklomanov, N.I.; Streletskiy, D.A.; Little, J.D.; Nelson, F.E. Isotropic thaw subsidence in undisturbed permafrost landscapes. Geophys. Res. Lett. 2013, 40, 6356–6361. [Google Scholar] [CrossRef]
  8. Günther, F.; Overduin, P.P.; Yakshina, I.A.; Opel, T.; Baranskaya, A.V.; Grigoriev, M.N. Observing Muostakh disappear: Permafrost thaw subsidence and erosion of a ground-ice-rich island in response to arctic summer warming and sea ice reduction. Cryosphere 2015, 9, 151–178. [Google Scholar] [CrossRef] [Green Version]
  9. Lantuit, H.; Pollard, W. Fifty years of coastal erosion and retrogressive thaw slump activity on Herschel Island, southern Beaufort Sea, Yukon Territory, Canada. Geomorphology 2008, 95, 84–102. [Google Scholar] [CrossRef]
  10. Kokelj, S.V.; Jorgenson, M. Advances in thermokarst research. Permafr. Periglac. Process. 2013, 24, 108–119. [Google Scholar] [CrossRef]
  11. Lantuit, H.; Overduin, P.; Wetterich, S. Recent progress regarding permafrost coasts. Permafr. Periglac. Process. 2013, 24, 120–130. [Google Scholar] [CrossRef]
  12. Hjort, J.; Karjalainen, O.; Aalto, J.; Westermann, S.; Romanovsky, V.E.; Nelson, F.E.; Etzelmüller, B.; Luoto, M. Degrading permafrost puts Arctic infrastructure at risk by mid-century. Nat. Commun. 2018, 9, 1–9. [Google Scholar] [CrossRef] [PubMed]
  13. Zou, D.; Zhao, L.; Sheng, Y.; Chen, J.; Hu, G.; Wu, T.; Wu, J.; Xie, C.; Wu, X.; Pang, Q.; et al. A new map of permafrost distribution on the Tibetan Plateau. Cryosphere 2017, 11, 2527. [Google Scholar] [CrossRef] [Green Version]
  14. Zhao, L.; Zou, D.; Hu, G.; Du, E.; Pang, Q.; Xiao, Y.; Li, R.; Sheng, Y.; Wu, X.; Sun, Z.; et al. Changing climate and the permafrost environment on the Qinghai-Tibet (Xizang) Plateau. Permafr. Periglac. Process. 2020, 31, 396–405. [Google Scholar] [CrossRef]
  15. Zhao, L.; Sheng, Y. Permafrost and Environment Changes on the Qinghai-Tibetan Plateau; Science Press: Beijing, China, 2019. (In Chinese) [Google Scholar]
  16. Cheng, G.; Jin, H. Permafrost and groundwater on the Qinghai-Tibet Plateau and in northeast China. Hydrogeol. J. 2013, 21, 5–23. [Google Scholar] [CrossRef]
  17. Zhang, G.; Yao, T.; Shum, C.K.; Yi, S.; Yang, K.; Xie, H.; Feng, W.; Bolch, T.; Wang, L.; Behrangi, A.; et al. Lake volume and groundwater storage variations in Tibetan Plateau’s endorheic basin. Geophys. Res. Lett. 2017, 44, 5550–5560. [Google Scholar] [CrossRef]
  18. Daout, S.; Doin, M.-P.; Peltzer, G.; Socquet, A.; Lasserre, C. Large-scale InSAR monitoring of permafrost freeze-thaw cycles on the Tibetan Plateau. Geophys. Res. Lett. 2017, 44, 901–909. [Google Scholar] [CrossRef]
  19. Zwieback, S.; Meyer, F.J. Top-of-permafrost ground ice indicated by remotely sensed late-season subsidence. Cryosphere 2021, 15, 2041–2055. [Google Scholar] [CrossRef]
  20. Antonova, S.; Sudhaus, H.; Strozzi, T.; Zwieback, S.; Kääb, A.; Heim, B.; Langer, M.; Bornemann, N.; Boike, J. Thaw Subsidence of a Yedoma Landscape in Northern Siberia, Measured In Situ and Estimated from TerraSAR-X Interferometry. Remote Sens. 2018, 10, 494. [Google Scholar] [CrossRef] [Green Version]
  21. Li, Z.-W.; Zhao, R.; Hu, J.; Wetn, L.; Feng, G.; Zhalng, Z.; Wang, Q. InSAR analysis of surface deformation over permafrost to estimate active layer thickness based on one-dimensional heat transfer model of soils. Sci. Rep. 2015, 5, 1–9. [Google Scholar] [CrossRef]
  22. Liu, L.; Zhang, T.; Wahr, J. InSAR measurements of surface deformation over permafrost on the North Slope of Alaska. J. Geophys. Res. Earth Surf. 2010, 115, F3. [Google Scholar] [CrossRef]
  23. Reinosch, E.; Bucketl, J.; Dong, J.; Gerke, M.; Baade, J.; Riedel, B. InSAR time series analysis of seasonal surface displacement dynamics on the Tibetan Plateau. Cryosphere 2020, 14, 1633–1650. [Google Scholar] [CrossRef]
  24. Daout, S.; Dini, B.; Haetberli, W.; Doin, M.-P.; Palrsons, B. Ice loss in the Northeastern Tibetan Plateau permafrost as seen by 16 yr of ESA SAR missions. Earth Planet. Sci. Lett. 2020, 545, 116404. [Google Scholar] [CrossRef]
  25. Lu, P.; Han, J.; Li, Z.; Xu, R.; Li, R.; Hao, T.; Qialo, G. Lake outburst accelerated permafrost degradation on Qinghai-Tibet Plateau. Remote Sens. Environ. 2020, 249, 112011. [Google Scholar] [CrossRef]
  26. Zhang, Z.; Wang, M.; Liu, X.; Wang, C.; Zhang, H.; Tang, Y.; Zhang, B. Deformation feature analysis of Qinghai–Tibet railway using TerraSAR-X and Sentinel-1A time-series interferometry. IEEE J. Sel. Top. Appl. Earth Obs. Remote Sens. 2019, 12, 5199–5212. [Google Scholar] [CrossRef]
  27. Zhang, X.; Zhang, H.; Wang, C.; Tang, Y.; Zhang, B.; Wu, F.; Wang, J.; Zhang, Z. Time-series InSAR monitoring of permafrost freeze-thaw seasonal displacement over Qinghai–Tibetan Plateau using Sentinel-1 data. Remote Sens. 2019, 11, 1000. [Google Scholar] [CrossRef] [Green Version]
  28. Chen, J.; Liu, L.; Zhang, T.; Cao, B.; Lin, H. Using persistent scatterer interferometry to map and quantify permafrost thaw subsidence: A case study of Eboling Mountain on the Qinghai-Tibet Plateau. J. Geophys. Res. Earth Surf. 2018, 123, 2663–2676. [Google Scholar] [CrossRef]
  29. Zhang, X.; Zhang, H.; Wang, C.; Tang, Y.; Zhang, B.; Wu, F.; Wang, J.; Zhang, Z. Active layer thickness retrieval over the Qinghai-Tibet Plateau using Sentinel-1 multitemporal InSAR monitored Permafrost subsidence and temporal-spatial multilayer soil moisture data. IEEE Access 2020, 8, 84336–84351. [Google Scholar] [CrossRef]
  30. Bartsch, A.; Leibman, M.; Strozzi, T.; Khomutov, A.; Widhalm, B.; Babkina, E.; Mullanurov, D.; Ermokhina, K.; Kroisleitner, C.; Bergstedt, H. Seasonal progression of ground displacement identified with satellite radar interferometry and the impact of unusually warm conditions on permafrost at the Yamal Peninsula in 2016. Remote Sens. 2019, 11, 1865. [Google Scholar] [CrossRef] [Green Version]
  31. Liu, L.; Schaefer, K.; Zhang, T.; Walhr, J. Estimating 1992–2000 average active layer thickness on the Alaskan North Slope from remotely sensed surface subsidence. J. Geophys. Res. Earth Surf. 2012, 117. [Google Scholar] [CrossRef]
  32. Berardino, P.; Fornaro, G.; Lanari, R.; Sansosti, E. A new algorithm for surface deformation monitoring based on small baseline differential SAR interferograms. IEEE Trans. Geosci. Remote Sens. 2002, 40, 2375–2383. [Google Scholar] [CrossRef] [Green Version]
  33. Zhang, C.-L.; Li, Q.; Shen, Y.-P.; Zhou, N.; Wang, X.-S.; Li, J.; Jia, W.-R. Monitoring of aeolian desertification on the Qinghai-Tibet Plateau from the 1970s to 2015 using Landsat images. Sci. Total Environ. 2018, 619, 1648–1659. [Google Scholar] [CrossRef] [PubMed]
  34. Li, Q.; Zhang, C.; Shen, Y.; Jia, W.; Li, J. Quantitative assessment of the relative roles of climate change and human activities in desertification processes on the Qinghai-Tibet Plateau based on net primary productivity. Catena 2016, 147, 789–796. [Google Scholar] [CrossRef]
  35. Wu, Q.; Yu, W.; Jin, H. No protection of permafrost due to desertification on the Qinghai–Tibet Plateau. Sci. Rep. 2017, 7, 1–8. [Google Scholar] [CrossRef] [Green Version]
  36. Liu, G. Preliminary results of permafrost investigation on northern and southern slopes of Mt. Geladandong, interior Qinghai-Tibet Plateau. J. Glaciol. Geocryol. 2022, 44, 1–13. (In Chinese) [Google Scholar]
  37. Zhang, X.; Zhang, X.; Zhou, J.; Tang, W.; Ding, L.; Ma, J.; Zhang, X. Daily 1-km All-Weather Land Surface Temperature Dataset for Western China; National Tibetan Plateau Data Center: Beijing, China, 2019. [Google Scholar]
  38. Zhang, X.; Zhou, J.; Liang, S.; Wang, D. A practical reanalysis data and thermal infrared remote sensing data merging (RTM) method for reconstruction of a 1-km all-weather land surface temperature. Remote. Sens. Environ. 2021, 260, 112437. [Google Scholar] [CrossRef]
  39. Lanari, R.; Lundgren, P.; Manzo, M.; Casu, F. Satellite radar interferometry time series analysis of surface deformation for Los Angeles, California. Geophys. Res. Lett. 2004, 31, 23. [Google Scholar] [CrossRef]
  40. Usai, S. A least squares database approach for SAR interferometric data. IEEE Trans. Geosci. Remote Sens. 2003, 41, 753–760. [Google Scholar] [CrossRef] [Green Version]
  41. Guarnieri, A.M.; Tebaldini, S. On the exploitation of target statistics for SAR interferometry applications. IEEE Trans. Geosci. Remote Sens. 2008, 46, 3436–3443. [Google Scholar] [CrossRef]
  42. Tough, J.; Blacknell, D.; Quegan, S. A statistical description of polarimetric and interferometric synthetic aperture radar data. Proc. R. Soc. Lond. Ser. A Math. Phys. Sci. 1995, 449, 567–589. [Google Scholar]
  43. Jolivet, R.; Agram, P.S.; Lin, N.Y.; Simons, M.; Doin, M.; Peltzer, G.; Li, Z. Improving InSAR geodesy using global atmospheric models. J. Geophys. Res. Solid Earth 2014, 119, 2324–2341. [Google Scholar] [CrossRef]
  44. Fattahi, H.; Amelung, F. DEM error correction in InSAR time series. IEEE Trans. Geosci. Remote Sens. 2013, 51, 4249–4259. [Google Scholar] [CrossRef]
  45. Zhang, Y.; Fattahi, H.; Amelung, F. Small baseline InSAR time series analysis: Unwrapping error correction and noise reduction. Comput. Geosci. 2019, 133, 104331. [Google Scholar]
  46. Chen, J.; Wu, T.; Zou, D.; Liu, L.; Wu, X.; Gong, W.; Zhu, X.; Li, R.; Hao, J.; Hu, G.; et al. Magnitudes and patterns of large-scale permafrost ground deformation revealed by Sentinel-1 InSAR on the central Qinghai-Tibet Plateau. Remote Sens. Environ. 2022, 268, 112778. [Google Scholar] [CrossRef]
  47. Chen, F.; Lin, H.; Zhou, W.; Hong, T.; Wang, G. Surface deformation detected by ALOS PALSAR small baseline SAR interferometry over permafrost environment of Beiluhe section, Tibet Plateau, China. Remote Sens. Environ. 2013, 138, 10–18. [Google Scholar] [CrossRef]
  48. Buckel, J.; Reinosch, E.; Hördt, A.; Zhang, F.; Riedel, B.; Gerke, M.; Schwalb, A.; Mäusbacher, R. Insights into a remote cryosphere: A multi-method approach to assess permafrost occurrence at the Qugaqie basin, western Nyainqêntanglha Range, Tibetan Plateau. Cryosphere 2021, 15, 149–168. [Google Scholar] [CrossRef]
  49. Chen, J.; Wu, Y.; O′Connor, M.; Cardenas, M.B.; Schaefer, K.; Michaelides, R.; Kling, G. Active layer freeze-thaw and water storage dynamics in permafrost environments inferred from InSAR. Remote Sens. Environ. 2020, 248, 112007. [Google Scholar] [CrossRef]
  50. Pepe, A.; Lanari, R. On the extension of the minimum cost flow algorithm for phase unwrapping of multitemporal differential SAR interferograms. IEEE Trans. Geosci. Remote. Sens. 2006, 44, 2374–2383. [Google Scholar] [CrossRef]
  51. Mackay, J.R.; Burn, C.R. The first 20 years (1978–1979 to 1998–1999) of active-layer development, Illisarvik experimental drained lake site, western Arctic coast, Canada. Can. J. Earth Sci. 2002, 39, 1657–1674. [Google Scholar] [CrossRef]
  52. Mackay, J.R. Downward water movement into frozen ground, western arctic coast, Canada. Can. J. Earth Sci. 1983, 20, 120–134. [Google Scholar] [CrossRef]
  53. French, H.; Harbor, J. The development and history of glacial and periglacial geomorphology. In Treatise on Geomorphology; Shroder, J.F., Ed.; Academic Press: Cambridge, MA, USA, 2013. [Google Scholar]
  54. Short, N.; LeBlanc, A.-M.; Sladen, W.; Oldenborger, G.; Mathon-Dufour, V.; Brisco, B. RADARSAT-2 D-InSAR for ground displacement in permafrost terrain, validation from Iqaluit Airport, Baffin Island, Canada. Remote Sens. Environ. 2014, 141, 40–51. [Google Scholar] [CrossRef]
  55. Wang, L.; Marzahn, P.; Bernier, M.; Ludwig, R. Sentinel-1 InSAR measurements of deformation over discontinuous permafrost terrain, Northern Quebec, Canada. Remote Sens. Environ. 2020, 248, 111965. [Google Scholar] [CrossRef]
  56. Riseborough, D.; Shiklomanov, N.; Etzelmüller, B.; Gruber, S.; Marchenko, S. Recent advances in permafrost modelling. Permafr. Periglac. Process. 2008, 19, 137–156. [Google Scholar] [CrossRef]
  57. Liu, L.; Jafarov, E.E.; Schaefer, K.M.; Jones, B.M.; Zebker, H.A.; Williams, C.A.; Rogan, J.; Zhang, T. InSAR detects increase in surface subsidence caused by an Arctic tundra fire. Geophys. Res. Lett. 2014, 41, 3906–3913. [Google Scholar] [CrossRef]
  58. Liu, L.; Schaefer, K.; Gusmeroli, A.; Grosse, G.; Jones, B.M.; Zhang, T.; Parsekian, A.D.; Zebker, H.A. Seasonal thaw settlement at drained thermokarst lake basins, Arctic Alaska. Cryosphere 2014, 8, 815–826. [Google Scholar] [CrossRef] [Green Version]
  59. Strozzi, T.; Antonova, S.; Günther, F.; Mätzler, E.; Vieira, G.; Wegmüller, U.; Westermann, S.; Bartsch, A. Sentinel-1 SAR interferometry for surface deformation monitoring in low-land permafrost areas. Remote Sens. 2018, 10, 1360. [Google Scholar] [CrossRef] [Green Version]
  60. Chen, J.; Günther, F.; Grosse, G.; Liu, L.; Lin, H. Sentinel-1 InSAR measurements of elevation changes over Yedoma uplands on Sobo-Sise Island, Lena Delta. Remote Sens. 2018, 10, 1152. [Google Scholar] [CrossRef] [Green Version]
  61. Wu, Z.; Zhao, L.; Liu, L.; Zhu, R.; Gao, Z.; Qiao, Y.; Tian, L.; Zhou, H.; Xie, M. Surface-deformation monitoring in the permafrost regions over the Tibetan Plateau, using Sentinel-1 data. Sci. Cold Arid. Reg. 2018, 10, 114–125. [Google Scholar]
  62. Li, Z.; Tang, P.; Zhou, J.; Tian, B.; Chen, Q.; Fu, S. Permafrost environment monitoring on the Qinghai-Tibet Plateau using time series ASAR images. Int. J. Digit. Earth 2015, 8, 840–860. [Google Scholar] [CrossRef]
  63. Chimitdorzhiev, T.N.; Dagurov, P.N.; Bykov, M.E.; Dmitriev, A.V.; Kirbizhekova, I.I. Comparison of ALOS PALSAR interferometry and field geodetic leveling for marshy soil thaw/freeze monitoring, case study from the Baikal lake region, Russia. J. Appl. Remote Sens. 2016, 10, 016006. [Google Scholar] [CrossRef]
  64. Rouyet, L.; Lauknes, T.R.; Christiansen, H.H.; Strand, S.M.; Larsen, Y. Seasonal dynamics of a permafrost landscape, Adventdalen, Svalbard, investigated by InSAR. Remote Sens. Environ. 2019, 231, 111236. [Google Scholar] [CrossRef]
  65. Rouyet, L.; Liu, L.; Strand, S.; Christiansen, H.; Lauknes, T.; Larsen, Y. Seasonal InSAR displacements documenting the active layer freeze and thaw progression in central-western Spitsbergen, Svalbard. Remote Sens. 2021, 13, 2977. [Google Scholar] [CrossRef]
  66. Rudy, A.C.; Lamoureux, S.F.; Treitz, P.; Short, N.; Brisco, B. Seasonal and multi-year surface displacements measured by DInSAR in a High Arctic permafrost environment. Int. J. Appl. Earth Obs. Geoinf. 2018, 64, 51–61. [Google Scholar] [CrossRef]
  67. Wang, L.; Marzahn, P.; Bernier, M.; Jacome, A.; Poulin, J.; Ludwig, R. Comparison of TerraSAR-X and ALOS PALSAR differential interferometry with multisource DEMs for monitoring ground displacement in a discontinuous permafrost region. IEEE J. Sel. Top. Appl. Earth Obs. Remote. Sens. 2017, 10, 4074–4093. [Google Scholar] [CrossRef]
  68. Zhang, Z.; Wang, M.; Wu, Z.; Liu, X. Permafrost deformation monitoring along the Qinghai-Tibet Plateau engineering corridor using InSAR observations with multi-sensor SAR datasets from 1997–2018. Sensors 2019, 19, 5306. [Google Scholar] [CrossRef] [PubMed] [Green Version]
  69. Zhao, R.; Li, Z.; Feng, G.; Wang, Q.; Hu, J. Monitoring surface deformation over permafrost with an improved SBAS-InSAR algorithm: With emphasis on climatic factors modeling. Remote Sens. Environ. 2016, 184, 276–287. [Google Scholar] [CrossRef]
Figure 1. Study area: The base map in subfigure (a) is the Landsat-8 image acquired in October 2020 (red: SWIR1, green: NIR, blue: red); Subfigure (b) is the permafrost map [13] over the hillshade map, calculated using the 1-arcsec-SRTM DEM with the Sentinel-1 incidence angle and azimuth angle. The locations of the GPR surveys and meteorological stations are marked with dots. The location of the study area on the Tibetan Plateau is marked in the subfigure in the top right corner. The bottom panel (photos P1P3) shows the vegetation cover from alpine desert to alpine meadow. The red dashed rectangles in subfigures (a,b) indicate three exemplary sectors, sector1(s1), sector2(s2), sector3(s3), in which deformation timeseries are shown.
Remotesensing 14 00811 g001
Figure 2. (a) monthly mean ground temperature at a depth of 10 cm at Tanggula station during 2010 and 2015; (b) monthly precipitation at Tanggula station during 2005 and 2015.
Remotesensing 14 00811 g002
Figure 3. Enlarged view of sector 1 and deformation time series of three points within sector 1: (a) Landsat-8 image acquired in October 2020 (red: SWIR1, green: NIR, blue: red); (b) temporal coherence [50] of stacked interferogram pairs (c) deformation trend velocity; (df) LOS deformation curves of three points TS1, TS2 and TS3, respectively. Their locations are marked with red dots in subfigure (a). The positive and negative values of displacement and velocity indicate the uplift and subsidence of surface movement.
Remotesensing 14 00811 g003
Figure 4. Enlarged view of sector 2 and deformation time series of six points within sector 2: (a) Landsat-8 image acquired in October 2020; (b) temporal coherence of stacked interferogram pairs (c) deformation trend velocity; (di) LOS deformation time series of six points TS4–TS9, respectively. Their locations are marked with red dots in subfigure (a).
Remotesensing 14 00811 g004
Figure 5. Enlarged view of sector 3 and deformation time series of five points within sector 3: (a) Landsat-8 image acquired in October 2020; (b) temporal coherence of stacked interferogram pairs (c) deformation trend velocity; (dh) LOS deformation time series of five points TS10–TS14, respectively. Their locations are marked with red dots in subfigure (a).
Remotesensing 14 00811 g005
Figure 6. Maps of the long-term deformation velocity (a) and seasonal deformation magnitude (b). The positive and negative values in subfigure (a) indicate the uplift and subsidence of surface movement. Temporal coherence [50] smaller than 0.7 is shown in dark grey, and deformation could not be retrieved in these areas. The black dashed rectangles in subfigures (a,b) marked three sectors, which are illustrated in Figure 3, Figure 4 and Figure 5.
Remotesensing 14 00811 g006
Figure 7. Probability density of seasonal deformation with different subsidence levels of −2.5~−5 mm/a (subfigure (a)), −5~−10 mm/a (b), −10~−20 mm/a (c), −20~−30 mm/a (d), and <−30 mm/a (e).
Remotesensing 14 00811 g007
Figure 8. Deformation curves with different subsidence levels of −2.5~−5 mm/a (subfigure (a)), −5~−10 mm/a (b), −10~−20 mm/a (c), −20~−30 mm/a (d), and <−30 mm/a (e). The y-axis of subfigure (e) is different from the other subfigures, which is −110~110 mm. The solid lines indicate the average values of all spatial deformation values on a given date, and the light-colored areas show the mean ± one standard deviation.
Remotesensing 14 00811 g008
Figure 9. Subfigure (a) shows the daily averaged 2-m air temperature in the permafrost region of the study area. The dates with Sentinel-1 acquisitions are marked with blue triangles. Subfigure (b) shows the accumulated degree days of thaw (left) and the accumulated degree days of freeze (right). Subfigure (c) illustrates the deformation speeds with different subsidence levels in the thawing season from 1 May to 30 September and in the freezing season from 1 October to 31 December.
Remotesensing 14 00811 g009
Figure 10. Maps of the long-term deformation velocity calculated by using linear trend + sinusoidal model (a); piecewise linear rend + degree-day model (b).
Remotesensing 14 00811 g010
Figure 11. Cross comparison of the long-term deformation velocities calculated in three ways: (a) direct calculation vs. linear trend + sinusoidal model approximation; (b) direct calculation vs. piecewise linear trend + degree-day model approximation.
Remotesensing 14 00811 g011
Figure 12. Maps of the seasonal deformation magnitude approximated by the sinusoidal model (a) and degree-day model (b).
Remotesensing 14 00811 g012
Figure 13. Cross comparison of the seasonal deformation magnitudes calculated in three ways: (a) direct calculation vs. sinusoidal model approximation; (b) direct calculation vs. piecewise degree-day model approximation.
Remotesensing 14 00811 g013
Figure 14. Averaged interferometric coherence in different months.
Remotesensing 14 00811 g014
Table 1. Calculations of long-term deformation velocity and seasonal deformation.
CalculationDescriptionEquation
Direct calculation
  • A linear trend model is used to calculate the long-term deformation velocity.
  • The intra-annual highest-lowest terrain elevation difference represents the intra-annual seasonal deformation after extracting and separating the linear trend from the deformation time series. Based on our knowledge, the terrain with the highest terrain elevation occurred January–February, and the lowest terrain elevation occurred August–October. The averaged value for investigation years is the final intra-annual deformation value.
D t = v t                     (1)
D t = D t v t                 (2)
s 1 = max   ( D Jan ,   Feb ) min   D Aug ,   Sep ,   Oct ¯ (3)
where D t is the deformation time series, t is the temporal span of image acquisition dates away from the first acquisition date, v is the long-term trend velocity, D t is the deformation time series minus the long-term linear trend and max   ( D Jan ,   Feb ) and min   D Aug ,   Sep ,   Oct represent the highest terrain elevation January–February and the lowest terrain elevation that occurred August–October in each year, respectively.
Model approximationSinusoidal model [18,21]
  • A linear trend plus a periodic seasonal oscillation model to approach deformation curves
  • Sinusoidal function is adopted to describe periodic seasonal oscillation, i.e., upheaval in winter and spring and subsidence in summer and autumn
D t = v t + A sin 2 π T t + φ + c   (4)
s 2 = 2 A                (5)
where A is periodic seasonal oscillation amplitude, T is the period of seasonal undulations (assumed to be one year), φ is the initial phase, and c is the residual term. v , A , φ , and c are the coefficients to be determined pixel by pixel in the spatial grid. The periodic peak-to-peak seasonal deformation magnitude s 2 is twice the absolute value of the periodic amplitude of A .
Degree-day model [29,46]
  • The continuous deformation process is divided into freezing and thawing processes with a piecewise function
  • The seasonal freeze uplift and thaw subsidence is described using a Stefan equation, that the deformation is proportional to the square root of the cumulative degree day of thawing or freezing
D t = v L t + S I t            (6)
L t = T 1 + t t t     if   t t t t f T   if   t > t f (7)
I t = ADDT t k ADDF t     (8)
where v L t and S I t in Equation (6) represents the linear and seasonal deformation respectively, S is the seasonal deformation magnitude, v is the long-term displacement rate (mm/yr), the coefficient of linear deformation L t and seasonal deformation I t are expressed in Equations (7) and (8). In Equation (7), T is the number of consecutive permafrost years (in units of years), t t and t f are the onsets of thawing and freezing, respectively. In Equation (8), I t is the composite index to account for the seasonal thaw subsidence and freeze uplift, k is the coefficient for adjusting the soil thermal conductivities in the thaw and freeze seasons, ADDT (°C days) and ADDF (°C days) are the accumulated degree days of thaw and freeze, respectively. The ADDT is calculated as the sum of the daily air temperature above 0 °C, and the ADDF is calculated as the sum of the daily air temperature below 0 °C. The two indices are effective for indicating accumulated energy.
Table 2. Statistics of terrain deformation characteristics with different subsidence levels in the study area.
Long-Term
Velocity Level (mm/Year)
Area (km2)Coverage
Perc. (%)
Deformation Characteristics (mm)
Ave. Velocity (mm/Year)Ave. Intra-Annual Seasonal Deformation Magnitude (mm)
−2.5–−55866.426.6−3.716.7
−5–−108613.739.1−7.319.2
−10–−206381.929.0−13.622.1
−20–−301012.04.6−23.425.7
<−30143.20.7−34.928.6
Overall22,017.3100%−9.119.7
Publisher’s Note: MDPI stays neutral with regard to jurisdictional claims in published maps and institutional affiliations.

