Article

Modification of Temperature Lapse Rates and Cloud Properties during a Spatiotemporally Extended Dust Aerosol Episode (16–18 June 2016) over the Mediterranean Basin Based on Satellite and Reanalysis Data

by
Maria Gavrouzou
1,
Nikolaos Hatzianastassiou
1,*,
Christos J. Lolis
1,
Marios-Bruno Korras-Carraca
1,2 and
Nikolaos Mihalopoulos
3,4
1
Laboratory of Meteorology, Department of Physics, University of Ioannina, 45110 Ioannina, Greece
2
Department of Environment, University of the Aegean, 81100 Mytilene, Greece
3
Institute for Environmental Research and Sustainable Development (IERSD), National Observatory of Athens, 15236 Athens, Greece
4
Environmental Chemical Processes Laboratory, Department of Chemistry, University of Crete, 70013 Heraklion, Greece
*
Author to whom correspondence should be addressed.
Remote Sens. 2022, 14(3), 679; https://doi.org/10.3390/rs14030679
Submission received: 17 December 2021 / Revised: 21 January 2022 / Accepted: 28 January 2022 / Published: 31 January 2022

Abstract

:
A spatiotemporally extended dust aerosol episode that occurred over the Mediterranean Basin (MB) from 16 to 18 June 2016 is investigated using observational satellite and reanalysis data, focusing on the effects of high dust loads on cloud formation and temperature fields, including the creation of temperature inversions. The atmospheric conditions before and during the 3-day dust aerosol episode case (DAEC) are also analyzed. The dust episode, which is identified using a contemporary satellite algorithm, consists of long-range transport of African dust to the western and central MB. The day to day, before and during the DAEC, atmospheric circulation, dust-cloud interactions, and dust effect on temperature are examined using a variety of Moderate Resolution Imaging Spectroradiometer (MODIS) Level-3 Collection 6.1 satellite and Modern-Era Retrospective analysis for Research and Applications, Version 2 (MERRA-2) reanalysis data. According to the obtained results, the dust export from N. Africa, which occurs under the prevalence of a trough over the western MB, and a ridge over the central MB, extends from southwest to northeast along two axes, one in the western and another in the central Mediterranean, covering remote areas up to the coasts of southern Europe, including the Balearic and Tyrrhenian Seas, the Italian peninsula, the Ionian and Adriatic Seas, and the Balkan peninsula. The analysis provides evidence of the formation of mixed-phase clouds, with high cloud-top heights (CTH higher than 10 km) and low cloud-top temperatures (CTT as low as 230 K), which spatiotemporally coincide with the high dust loadings that provide the necessary CCN and IN. Dust aerosols are transported either in the boundary layer (within the first 1–2 km) of areas close to the North African dust source areas or in the free troposphere over the Mediterranean Sea and the Italian and Balkan peninsulas (between 2 and 8 km). Distinct and extended layers of remarkable temperature inversions (up to 20 K/km) are created below the exported dust layers in the boundary layer of Mediterranean Sea areas, while weak/reduced lapse rates are formed over continental areas of MB undergoing the dust transport. Such modifications of temperature fields are important for the dynamics of the atmosphere of MB.

Graphical Abstract

1. Introduction

Aerosols play a key role in the atmosphere, interacting with clouds and radiation. However, these interactions are complex, inducing a significant degree of uncertainty for current and future climate changes [1]. Aerosols participate in chemical reactions, absorbing and scattering the shortwave and terrestrial radiation and acting as cloud condensation nuclei (CCN) and ice nuclei (IC). Through their interaction with radiation, aerosols affect the Earth’s radiation budget, modifying the atmospheric temperature structure and driving to temperature inversions [2]. Aerosols tend to cool the surface and warm the atmosphere, inducing a cooling effect at the top of the atmosphere (TOA) [3,4]. Apart from their direct radiative effect (DRE), aerosols also exert an indirect effect on climate. Hydrophilic aerosols (such as sea salt and sulfate aerosols) act as CCN and/or IN, thereby modifying the cloud physical and optical properties (e.g., cloud droplet number concentration, cloud effective radius, cloud optical thickness, cloud-top height, cloud lifetime, and precipitating efficiency). On the other hand, hydrophobic aerosols (such as mineral dust) can act as CCN or IN as well, through adsorption, especially when they are covered by soluble materials [5,6]. The aerosol cloud interactions (ACI) vary temporally and spatially, strongly depending on cloud types, regional aerosol background, atmospheric circulation, regional geomorphological characteristics, as well as other atmospheric parameters such as relative humidity (RH) and wind vertical velocities [7]. For example, as it concerns warm clouds, additional aerosols increase the number and reduce the size of droplets, resulting in increased cloud reflectivity and a longer lifetime (“Twomey effect” [8]). Aerosols also affect clouds through their semi-direct effect, which accounts for local warming within the troposphere caused by absorbing aerosols, such as black carbon, leading to changes in atmospheric stability and cloud cover [9,10,11].
Dust aerosols (DA) is one of the most significant aerosol types in terms of their loading in the atmosphere 1700 Tg/yr [12]. They also play a significant role in aerosol-radiation and aerosol cloud interactions since they strongly absorb and scatter shortwave and longwave radiation [4] while being effective IN [6] and CCN [13,14,15]. Indeed, on an annual basis, insoluble mineral dust contributes up to 40% to the CCN in cloud-forming areas, and coatings with hygroscopic salts double the dust contribution to CCN [16]. On the other hand, the insoluble surface of mineral dust particles provides the solid-liquid interface needed for stabilizing newly formed ice embryos and thus enhances the heterogeneous freezing process in supercooled water, helping the formation of multiple types of ice phase clouds, e.g., altocumulus, cirrus, deep convective clouds [6]. The greatest part of DA is injected in the atmosphere from the world deserts, especially the biggest ones, namely Sahara Desert in N. Africa, Middle East deserts, and Taklamakan, Gobi, and Thar deserts in Asia [17]. In particular, all of N. Africa’s dust sources contribute almost 59% of total dust emissions (1000 Tg/yr out of 1700 Tg/yr) [18]. However, the desert dust is not only restricted over the global deserts. Except for giant dust particles, which are quickly removed from the atmosphere through dry deposition, DA can remain in the atmosphere from a few hours up to several days and travel far away from their sources, driven by the atmospheric circulation. In particular, Saharan dust transport takes place every year and is characterized by specific seasonal and spatial characteristics. During the winter of the northern hemisphere, the northeastern trade winds transport the greatest part (i.e., 60% [19]) of Saharan DA over the Gulf of Guinea, while in summer, when the trade winds take an eastern direction over Sahara, DA are exported to the Tropical Atlantic Ocean. Saharan dust is also transported over the Mediterranean Sea and southern Europe. Specifically, during spring and early summer, and more scarcely in autumn and winter, when low-pressure systems are formed over the western Sahara and southwesterly flows prevail in the lower troposphere, dust is transported to the central and eastern Mediterranean Basin (MB) [20]. On the other hand, under the co-prevalence of a low-pressure system over the western Sahara and a high-pressure system over the eastern Sahara, DA are transported to the western MB [21].
The frequent occurrence of dust export over the greater MB, especially in spring and summer periods [22,23], combined with the large amounts of solar radiation in those seasons, and the occurrence of a variety of cloud types [24,25], makes MB an area of special interest for studying DA and their interactions with radiation and clouds. Thus, a significant number of studies dealing with the atmospheric conditions favoring dust aerosol episodes (DAEs) in the region [19,20,21,26,27,28] and their seasonal characteristics [23,26,27,29] has been conducted during the last few decades. In addition, a few studies focused on dust-cloud interactions during specific dust episodes over the MB. However, all of them investigated the impact of DA on Mediterranean clouds solely based on model simulations [30,31,32]. Apart from this, no one study so far has focused on the modification of the vertical temperature profile, and the possible formation of temperature inversions, due to the DA episodes over the MB. Nevertheless, similar studies exist for the Tropical Atlantic Ocean, where DA is also exported from N. Africa deserts. Indeed, in such a study, aerosol index (AI) data from the ozone monitoring instrument (OMI), and various kinds of temperature data (satellite and modeled) were used to detect dust events and investigate temperature profiles during them over the Tropical Atlantic Ocean [2]. According to that study, the presence of DA over this region causes an increase in atmospheric temperature, which is maximum at 2 km. This heating stabilizes the air below 2 km and simultaneously decreases the stability above 2 km. Such an investigation deserves to be performed for other world areas undergoing significant dust export, such as the MB.
Here, for the first time, an observational approach is followed to investigate the possible effects of dust episodes on the atmospheric temperature profiles and cloud properties over the climatically sensitive greater MB (our study area, Figure 1). More specifically, satellite and reanalysis data are synergistically used to study the formation of clouds and the creation of temperature inversions during a 3-day (16–18 June 2016) dust aerosol episode case (DAEC), which refers to a dust episode with great geographical and temporal coverage (Section 2.1), identified with a satellite algorithm [29]. The columnar aerosol optical properties, i.e., aerosol optical depth (AOD) and dust optical depth (DOD) are taken from the Moderate Resolution Imaging Spectroradiometer (MODIS) Aqua Collection 6.1 database and the Modern-Era Retrospective analysis for Research and Applications, Version 2 (MERRA-2) database, respectively, enabling to follow in detail the evolution of DAEC, from one day before the DAEC (15 June 2016) through the last day of the DAEC (18 June 2018). Apart from a high spatial (0.500° × 0.625°) and temporal (3-h) resolution, the used MERRA-2 data also have the advantage of providing complete spatial coverage of the study region, thus effectively complementing the used MODIS data. Data for a number of cloud and other atmospheric parameters are also used in this study, namely cloud fraction (CF) and cloud-top properties, i.e., cloud-top height (CTH) and cloud-top temperature (CTT), available at 1° × 1° and daily resolution from MODIS Collection 6.1. The atmospheric circulation during the dust export is also analyzed and discussed using 850 hPa and 700 hPa geopotential heights and sea-level pressure (SLP) data obtained from the MERRA-2 reanalysis. Based on this variety of used data, an innovative detailed analysis of the vertical profiles of DOD and the temperature gradient (γ) during the DAEC is presented. This analysis also includes vertical cross-sections across the dust export pathways, as well as horizontal cross-sections at selected levels of special interest in terms of DA and their thermal effects.

2. Data and Methodology

2.1. DAEC Identification

The studied DAEC occurred from 16 to 18 June 2016 and has been identified with a satellite algorithm fully described in the work of [29]. It uses spectral AOD from MODIS Collection 6.1 and aerosol index (AI) from the OMI Near-UV aerosol product (OMI-OMAERUV) and computes the aerosol Ångström Exponent (α). The algorithm, using daily Level-3 input data at 1° × 1° latitude-longitude spatial resolution, identifies the prevalence of DA in the atmosphere over the specific pixel and day whenever α ≤ 0.4 and AI ≥ 1. Subsequently, the algorithm identifies the occurrence of strong and extreme DA episodes (DAEs) whenever AODmean + 2STDV ≤ AOD ≤ AODmean + 4STDV and AOD ≥ AODmean + 4STDV, respectively. According to the algorithm, a single day is characterized as dust aerosol episode day (DAED) when strong or extreme DAEs occur over at least 30 pixels of the study area. This filter is applied in order to ensure the great spatial extent, which characterizes the dust export over the MB. The algorithm has identified 166 Mediterranean DAEDs (116 strong and 50 extreme) over the period 2005–2019. Finally, the identified DAEDs were grouped into 98 DAECs, consisting of n ≥ 1 sequent DAEDs. A detailed description of the DAEDs and DAECs that occurred over the MB from 2005 to 2019 are presented in the work of [29].
The duration (in days), the intensity (in terms of spatial mean DOD over the episodic dusty pixels), and the percent coverage of the study area of each DAEC are shown in Figure 2. In the present study, a 3-day long (16–18 June 2016, serial number 76) strong DAEC, with a mean DOD equal to 0.79, is selected. This specific DAEC was chosen because: (i) it occurred in summer, when CF over the MB, and especially over its southern parts, is low [33], (ii) its 3-day duration enables the observation of the evolution of dust export, always in relation with the studied temperature and cloud parameters and (iii) it has extended spatial coverage of MB (i.e., 8% of the study area).

2.2. MODIS Data

MODIS spectroradiometer on board the NASA’s Terra (launched on 18 December 1999) and Aqua (launched on 4 May 2002) satellites [34,35] measures the reflected solar and emitted terrestrial radiation in 36 spectral bands, or groups of wavelengths, in the VIS and IR spectra [36] providing information for several cloud and aerosol parameters. MODIS data are available in different temporal and spatial resolutions. Specifically, daily data are available in 3 and 10 km spatial resolution (level 2 data), whereas daily, 8-day, and monthly data are available in 1° × 1° spatial resolution (level 3 data). For the retrieval of aerosol data, three different algorithms, namely dark target (DT) land, ocean, and deep blue (DB), are used. The DB algorithm takes advantage of deep blue channels in order to retrieve aerosol optical properties over highly reflected surfaces (such as deserts). Since the first release of MODIS data, several improvements have been made, and thus, new product collections are available. In the present study, level 3 data from the latest and improved collection of MODIS Aqua (Collection, C6.1) MYD08_D3 products are used [37,38]. The analysis also makes use of MYD08_D3, which is a joint product that contains daily 1° × 1° grid average values of various atmospheric parameters related to atmospheric aerosol properties, total ozone burden, atmospheric water vapor, cloud optical and physical properties, and atmospheric stability indices. This product also provides standard deviations, quality assurance weighted means, and other statistically derived quantities for each parameter. In the present study, data for the following MODIS parameters are used: (i) AOD data at 550 nm from “Deep_Blue_Aerosol_Optical_Depth_550_Land_Mean” and ”Aerosol_Optical_Depth_Ocean_Mean”, (ii) cloud fraction (CF) for liquid, ice, and mixed-phase clouds, from “Cloud_Retrival_Fraction_37_Liquid”, “Cloud_Retrival_Fraction_37_Ice” and “Cloud_Retrieval_Fraction_Combined”, (iii) cloud-top height (CTH) from “Cloud_Top_Height_Day_Mean” and (iv) cloud-top temperature (CTT) from “Cloud_Top_Temperature_Day_Mean”. MODIS Aqua satellite data are used and preferred to Terra ones in order to ensure consistency with the OMI data (retrieved from measurements taken with the OMI instrument onboard the Aura satellite, which flies in formation about 15 min behind Aqua in the “A-Train” satellite constellation) used to identify the studied DAEC with the satellite algorithm [29].

2.3. MERRA-2 Data

MERRA-2 [39,40] is the latest version of global atmospheric reanalysis for the satellite era, produced using the Goddard Earth Observing System (EOS) Model, Version 5 (GEOS-5) with its Atmospheric Data Assimilation System (ADAS), version 5.12.4. The MERRA project focuses on historical climate analyses for a broad range of weather and climate time scales and places the NASA EOS suite of observations in a climate context. Data are produced on a 0.500° × 0.625° latitude-longitude grid resolution, at 72 atmospheric layers between the surface and 0.01 hPa, covering the climatological period from 1980 up to date. MERRA-2 provides several improvements over its predecessor (MERRA-1), including aerosol assimilation for the entire period. Specifically, MERRA-2 assimilates bias-corrected aerosol optical depth (AOD) from the MODIS instruments on Terra (2000-present) and Aqua (2002-present) satellites and the Advanced Very-High-Resolution Radiometer (AVHRR) (1979–2002) instruments. Additionally, it assimilates (non-bias corrected) AOD from MODIS over bright surfaces and AOD from Aerosol Robotic Network sunphotometer stations (1999–2014) [41]. The database, which is available through the NASA’s Goddard Earth Sciences Data and Information Services Center (GES DISC) website (https://disc.gsfc.nasa.gov/ (accessed on 17 December 2021)), includes several products with 2-D or 3-D data available at different time scales (namely 1-h, 3-h, and 6-h) (https://goldsmr5.gesdisc.eosdis.nasa.gov/data/MERRA2/M2I3NVASM.5.12.4/doc/MERRA2.README.pdf (accessed on 17 December 2021)). In the present study, geopotential height (GPH) and wind (direction and speed) data at 700 hPa and 850 hPa, as well as the sea-level pressure (SLP) data, are obtained from the “M2I6NPANA” MERRA-2 product. M2I6NPANA provides 6-h instantaneous data for several meteorological parameters at 42 pressure levels (spanning from 150 to 1000 hPa). Columnar DOD data are taken from the “M2T1NXAER” Aerosol Diagnostics product, which provides hourly averaged single-level data of the total AOD, the DOD, as well as of the optical depths of other aerosols (namely black carbon, organic carbon, and sea salt). Other parameters, such as aerosol mass density and angstrom parameter, are also contained in this product. The 3-D temperature profiles used in the present analysis are obtained from the “M2I3NVASM” 3-h instantaneous product, which is available at the aforementioned 72 model levels. The AOD and DOD vertical profiles used in the present study are calculated using MERRA-2 vertically resolved (in 72 layers), 3-h instantaneous aerosol mixing ratios, and spatiotemporally collocated relative humidity data, both taken from the “M2I3NVAER” product, along with look-up-tables providing the extinction efficiency per aerosol type, size bin and relative humidity [4,42].

3. Results and Discussion

3.1. Atmospheric Circulation and Regional Dust Loading before and during the DAEC

The atmospheric circulation, namely the patterns of 700 hPa and 850 hPa geopotential heights and the SLP before and during the studied DAEC, are shown in Figure 3. In Figure 4, the geographical distribution and transport of dust loading over the MB during the evolution of the DAEC is presented using different kinds of MODIS and MERRA-2 data. Specifically, the geographical distribution of AOD for the period 15–18 June 2016, i.e., one day before the DAEC and the 3 days of the DAEC, is given based on MODIS satellite (first column) and MERRA-2 reanalysis (middle column) data, complemented by the distribution of DOD from MERRA-2 (right column). The comparison between the left and middle columns enables the assessment of the performance of MERRA-2 against MODIS, and the recovery of missing MODIS information, whereas the comparison between the middle and right column quantifies the contribution of dust to the total aerosol loading.
One day before the DAEC (D-0, 15 June 2016), a ridge at 700 and 850 hPa causes a WSW wind flow above the central MB (Figure 3i-a) and off the coasts of Algeria and Tunisia. At the surface, weak cyclonic and anticyclonic circulations are observed over NW Africa and the eastern MB, respectively (Figure 3iii-a). The dust loadings are relatively low (<0.6) and practically confined over N. Africa (negligible amounts are observed over the adjacent sea areas). On the next day, i.e., the first day of DAEC (D-1, 16 June 2016), the ridge strengthens and moves easterly. This ridge, combined with a through formed over northern Spain and southern France, causes a strong southwesterly wind flow (horizontal velocities up to 92.7 and 108 km/h at 850 hPa and 700 hPa, respectively) over the western MB and especially over the areas extending from NE Algeria up to Tunisia and the Tyrrhenian Sea (Figure 3i-b,ii-b). At the surface, the conditions are quite similar to those of the previous day, with low pressures over Algeria, Tunisia, and the entire western Mediterranean Sea (Figure 3iii-b). The low pressures at and near the surface favored the uplift of DA from the N. Africa’s deserts and their injection in the upper layers of the atmosphere [43,44]. Subsequently, the prevailing conditions at 700 hPa and 850 hPa, which are characteristic for dust transport to the MB [20,45,46], induced a northward transport of the injected African DA into the MB across the central Mediterranean Sea. Indeed, the maps of AOD and DOD (Figure 4i-b,ii-b,iii-b) clearly show this dust transport over the Tyrrhenian Sea, the Sea of Sicily, through to Italy and up to the northern Adriatic Sea (significant dust loadings and DOD values up to 1.4 are observed, especially over Tunisia and the Tyrrhenian Sea). On the second day of DAEC (D-2, 17 June 2016), the ridge at 700 hPa is even more strengthened and northeasterly extended, while a high-pressure system is formed at 850 hPa over the central MB (Figure 3i-c,ii-c). At the surface, the low pressures observed during the previous two days over NW Africa almost vanish, and high pressures prevail practically over the entire study area (Figure 3iii-c). Under these conditions, the dust export moves easterly, covering a wide area of the central MB, including the Tyrrhenian and Ionian Seas, the southern half of Italy, and the Balkans (Figure 4i-c,ii-c,iii-c)). During the last day of DAEC (D-3, 18 June 2016), the ridge moves even more eastwards, and combined with a deepened through over the western MB, results in a strong (velocities up to 46.8 and 82.8 km/h at 850 hPa and 700 hPa, respectively) SW wind over Libya and central Mediterranean Sea (Figure 3i-d,ii-d). This airflow causes a dust export, affecting the maritime areas from the Gulf of Gabes through to the Gulf of Sidra, the Ionian and Aegean Seas, Greece, as north as the northern Balkans and the Black Sea (Figure 4i-d,ii-d,iii-d).
The MERRA-2 reanalysis reproduces quite well the day-to-day geographical patterns of AOD, and especially the AOD values up to about 1.5 (Figure 4i-b and Figure S1). However, it significantly underestimates the higher AOD values (up to 4.1) of MODIS, especially those observed on the first day of DAECs close to the Tunisian coasts (Figure 4i-b). Such an underestimation has also been reported in previous studies that compared MERRA-2 and Aerosol Robotic Network (AERONET) AOD. Thus, an underestimation of MERRA-2 AOD was found in different regions of the globe, namely southern Europe, Amazon basin, and Southern and Southeastern Asia [47], while the comparison of MERRA-2 AOD with corresponding data from 400 Aerosol Robotic Network (AERONET) stations over the globe for the period 2002–2015, showed that MERRA-2 is not able to capture the extreme AOD values [48]. This underestimation is attributed to a combination of factors, including inadequate anthropogenic emissions, a lack of nitrate aerosols in GOCART, and a relatively small amount of observed data used for the assimilation [41]. The ability of MERRA-2 to appropriately reproduce the MODIS satellite AOD enhances its usefulness in providing the dust contribution (DC) to the total aerosol loading. This contribution (shown in Figure S2), which is derived from the ratio between the right and middle columns of Figure 4, varies from almost zero values (e.g., Black Sea on the D-0, Figure S2-a) up to 1 (e.g., Algeria, Figure S2). One day before the DAEC (D-0, 15 June 2016), dust is the dominant aerosol only over N. Africa and the Middle East, where DC varies from 0.8 to 1 (or 80% to 100%). In contrast, DC is small (up to 0.3) over the northern parts of the MB (Figure S2-a). On the first day of DAEC (D-1, 16 June 2016), the DC significantly increases across the dust export path (Figure 4b and Figure S2-b), reaching values that range from 0.7 up to 1. During the next two days of the DAEC, the geographical distributions of DC are quite similar to those of DOD (Figure 4i,ii,iii-c) with maximum values over N. Africa and the MB areas undergoing the dust export (Figure S2).

3.2. Cloud Formation and Properties before and during the DAEC

3.2.1. Cloud Fraction

The day-to-day variation of dust aerosols, by means of DOD anomalies, and cloud fraction before and during the examined DAED (16–18 June 2016) is presented in Figure 5, aiming to examine the existence of a possible cross-relationship between them through revealed similar geographical patterns. The anomaly of DOD (first column) is based on MERRA-2 and refers to the corresponding mean DOD for the 2005–2019 period, while the CF data, taken from MODIS Aqua, are given either for mixed-phase clouds (liquid and ice, second column) or separately for each cloud phase (liquid in the third column and ice in the fourth column). The DOD anomaly is given at 12UTC in order to match the MODIS Aqua satellite time. One day before the DAEC (first row), the entire MB is characterized by negative DOD anomalies, except for a great part of Algeria and the Middle East, where positive anomalies up to about 0.5 are noted, indicating elevated dust loadings (Figure 5i-a). Concerning cloudiness, no clouds exist over the greatest part of MB (Figure 5ii-a), especially over its southern part (south of 35°–40°N), including the entire North African continent and the central Mediterranean Sea. Clouds, associated with the prevailing synoptic conditions discussed in the previous section (e.g., the low-pressure system over the NW part of the study region), cover only the northern half of MB, with liquid clouds covering mostly its western part (Iberian peninsula, southern France and northern Italy, Figure 5iii-a) and ice clouds over its eastern half (Figure 5iv-a).
When the African dust export begins (first day of DAEC, D-1, 16 June 2016), remarkable expanded positive DOD anomalies are observed over a great part of the western and the entire central Mediterranean Sea, also covering extended continental areas, including the entire Italian and the eastern Balkan peninsulas (Figure 5i-b). Not only these DOD anomalies are spatially extended, but they are also intense, reaching values up to 0.94 over eastern Algeria, Tunisia, and the Gulf of Gabes. On the same day, mixed-phase clouds are formed over Tunisia, the Gulf of Gabes, the Tyrrhenian Sea, and the Adriatic Sea (Figure 5ii-b), i.e., where the African dust is exported. A significant part of the clouds formed over these areas is of ice phase (Figure 5iv-b). In addition, on day D-1, there is notable (CF = 0.9–1.0) southwest-northeast oriented cloudiness, extending from the boundaries between Morocco and Algeria up to the northernmost part of the western Mediterranean Sea and to the Gulf of Lion and the Ligurian Sea. These cloudy areas are observed above the western boundary of the exported dust, where relatively low DOD anomalies exist (white colors, anomalies up to 0.1–0.2). It should be noted that all the aforementioned areas covered by clouds during the first day of DAEC were characterized by clear-skies in the previous day (negative DOD anomalies; Figure 5i-a,ii-a,iii-a,iv-a). As shown in Figure 5iii-b,iv-b, the clouds formed over the Mediterranean areas that underwent dust export mainly consist of ice. The observed formation of clouds and/or the increase in CF, and especially in ice CF, can be associated with the ability of DA to act as CCN and IN, as it is reported in the literature. For example, the work of [49], based on model simulations, reported that adding IN (namely dust aerosols) to Mediterranean clean clouds increases the ice concentration near the cloud top and that these added ice crystals increase the cloud horizontal extent. Assuming DA as the only IN precursor in model simulations for cirrus clouds, an annual mean cloud ice crystals concentration equal to about 0.05 cm−3 for the globe, 0.1 cm−3 for most of the N. Hemisphere, and up to 0.3 cm−3 for areas near the dust sources was found [50]. In addition, using observational MODIS AOD and CF data, but for the region of China and on a seasonal and annual temporal scale, an increase in CF with increasing AOD was found, and this effect became maximum in summer [51]. Our results corroborate these findings providing, for the first time over the MB and under dust episodes conditions, observationally based evidence of a relationship between dust aerosol particles, and especially DOD, and clouds (CF). Of course, apart from CCN/IN, it is well-known [52] that other meteorological parameters, such as humidity and temperature, play a significant role. In order to explore the role of these parameters for the formation of clouds associated with the Mediterranean dust export, the horizontal cross-sections of T (in K) and RH at specific altitudes below and close to the top of clouds formed over the dust export region (Figure 6, left column and first row), during the first day of DAEC (16 June 2016) are shown in the Supplement (Figure S3). The geographical distribution of T at altitudes below the top (cloud-top height, CTH) of the clouds formed over the dust export areas (Figure 6i-b and Figure S3) is rather homogeneous and does not match with the dusty areas. On the other hand, while the geographical distributions of the RH exhibit considerable similarities with the patterns of CF over regions with high dust loads (Figure 5ii-b and Figure S3), clouds are also formed over areas with lower RH (as low as 45%), for example over the Gulf of Gabes and the Tyrrhenian Sea off the coasts of Tunisia (Figure 6i-b and Figure S3ii-b). These findings highlight the key role of dust aerosols acting as CCN/IN for the formation of liquid and ice clouds over the Mediterranean areas undergoing the African dust export.
During the second day of the DAEC (D-2, 17 June 2016), the DOD anomalies further shift easterly and significantly extend to the northeast, as far as to Ukraine and to the western coast of the Black Sea (Figure 5i-c). In addition, the intense positive DOD anomalies (>0.6, deep reddish colors) cover a more extended than in the previous day area. It is interesting that the spatial coverage of clouds has similar geographical patterns with those of dust (DOD). Thus, the cloudy line over the central MB shifts to the east and extends to the northeast (compare Figure 5ii-c,ii-b). Indeed, in day D-2, new mixed-phase clouds are formed over the areas where the DOD anomalies intensify. For example, note the cloud line that extends from the Libyan coasts across Sicily, the Ionian Sea, Greece, and up to Romania and Ukraine (Figure 5ii-c,iii-c,iv-c). As already explained for the first day of DAEC (D-1, 16 June 2016), discussed in the previous paragraph of the same section, these clouds (especially the lower ones) form under relatively low RH values (right column of Figure S4). On the other hand, it is also interesting to note that over other areas where high DOD persist, especially African continental such as Algeria and Tunisia, clouds either completely (CF = 0) or partly dissipate. This can be attributed to the dust aerosol semi-direct effect [9,10], taking into account the considerable absorptivity of DA [53]. Indeed, DA significantly absorb solar radiation over North Africa, especially during summer (up to 33.9 W/m2 [4]), resulting in local heating, thereby reducing RH, lowering supersaturation, and leading to cloud dissipation. Similar characteristics, in terms of similarity between the spatial patterns of DOD and CF, are also observed in the subsequent and last day (D-3, 18 June 2016) of the DAEC. Thus, there is a remarkable collocation between positive DOD anomalies and cloud cover, which both slightly further, compared to the previous day, extend to the east and the northeast, covering new areas, such as Bulgaria and the western Black Sea, that were not cloudy in the previous day (D-2).

3.2.2. Cloud-Top Height and Pressure

The geographical distribution of cloud-top height and pressure (CTH and CTP, respectively), which provide information about the altitude of the formed clouds before and during the studied DAEC, are given in Figure 6. One might expect that the geographical distribution, specifically the coverage, of these two cloud properties should be identical with those of CF, but as shown by the comparison between Figure 4ii,iii,iv-a and Figure 6, there are more missing data (white pixels) for CF than for CTH and CTP. This is attributed to the selection of the retrieved MODIS satellite CF product. Specifically, in the present study, the “Cloud_Retrieval_Fraction” product, which is the fraction of the daytime-only pixel population within a level 3 (1° × 1°) grid box that has successful MOD06 cloud optical property (COP) retrievals (i.e., both optical thickness and effective particle radius solutions are within the pre-computed look-up table space), is used. This product was preferred to the “Cloud_Fraction” product of MODIS, which is the fraction of pixels for a given population (e.g., daytime, nighttime, etc.) within a level 3 grid box that are determined to be confident or probably cloudy by the MOD35 cloud mask (https://atmosphere-imager.gsfc.nasa.gov/sites/default/files/ModAtmo/MODISCloudOpticalPropertyUserGuideFinal_v1.1_1.pdf (accessed on 17 December 2021)). On the other hand, cloud-top properties (including CTH and CTP used here) are given for confident or probably cloudy pixels, i.e., they are in parallel with the “Cloud_Fraction” product (not used here). Here it should be noted that the selection of using the “Cloud_Retrieval_Fraction” product in the present study was made because its retrievals are provided for each dual spectral channel pairing (e.g., VNSWIR-2.1 μm, 1.6–2.1 μm, etc.), and are further segregated by cloud thermodynamic phase (liquid, ice, undetermined, combined).
Before the beginning of the DAEC (D-0, 15 June 2016), mainly low and middle clouds covered the northern parts of the study region (southern Europe), mostly having CTH lower than 4 km (bluish colors) and CTT higher than about 270 K (Figure 6i-a,i-b). Some middle and high clouds (up to 11.3 km) with CTT as low as 230 K are observed over the western WB, covering the NE Iberian Peninsula, southern France, and the Balearic Sea, as well as over the northern Balkans and the Middle East. On the first day of DAEC (D-1, 16 June 2016), the clouds that form over the areas affected by the dust export are in the general middle to high, with CTH varying from 7 to 11 km, and low CTT (between 230 and 265 K). These clouds are extended along the aforementioned (Section 3.2.1) slant paths, one over the western MB (Balearic Sea), consisting of both liquid and ice clouds, and another over the central MB (Tyrrhenian Sea), consisting of ice clouds (Figure 5ii-b,iii-b,iv-b). Based on this CF, CTH, and CTP information, it is derived that the western MB cloudy line consists either of supercooled liquid or water droplets or ice crystals, whereas the central MB cloudy line consists of ice crystals. Moreover, the fact that the western part of the western MB cloudy line consists of higher ice clouds, opposite to its eastern part, which contains lower liquid clouds (Figure 5iii-b,iv-b). This situation may be attributed to the prevailing lower temperatures associated with the prevailing circulation, which brings colder air masses from northern latitudes (Figure 3i-b,ii-b and Figure S3i). Our results agree with previous studies [54,55] reporting that higher clouds formed under increased AOD. Indeed, a decrease in CTP with increasing AOD was found in most regions (the MB included), based on the use of a previous version, namely Collection 4, of MODIS Aqua and Terra Level-3 AOD and CTP data [56]. This relationship between AOD and cloud height is attributed to the added latent heat from inhomogeneous ice nucleation, which invigorates updrafts [57]. In addition, the CTT values found in the present study over the dusty areas are similar to those found for dusty, polluted clouds by the authors of [6], who used both satellite data and model simulations to investigate the effect of dust IN on the CTT in a well-developed mesoscale convective system in Northeastern Asia on 25 April 2008. During the next day of DAEC (D-2, 17 June 2016), the CTH is decreased (ranging from 0 to 3 km), and the CTT is increased (from 290 to 300 K) over the cloudy regions with strong positive DOD anomalies. This can be associated with the dissipation of ice, but also of liquid clouds due to the heating caused by the absorption of solar radiation by heavy dust amounts, especially at the top of the clouds (see previous section). In contrast, it is interesting to note that over neighboring areas, where dust aerosols are first observed on this day, higher CTHs (from 6 to 8 km) and lower CTT (from 265 to 285 K) are observed. Finally, on the last day of DAEC (D-3, 18 June 2016), the height and temperature of clouds over the dusty areas of the previous day decrease and increase, respectively. On the other hand, high CTHs (from 8 to 10 km) and low CTTs (from 240 to 260 K) are observed over the Balearic Sea, where positive, and higher than in the previous day, DOD anomalies occur, and over Greece, where the DOD anomalies intensified compared to the previous day (Figure 5i-d,i-c).

3.3. The Effect of Dust Transport on Atmospheric Temperature

In this section, the modification of the Mediterranean temperature field induced by the studied DAEC is investigated using 3-D MERRA-2 reanalysis data. This modification arises from the interaction, through scattering and absorption, of dust aerosols with the radiation (both short and longwave). In general, dust is known to induce a SW cooling/warming effect at the top-of-atmosphere (TOA), depending on properties such as the dust loading (DOD) and absorptivity, the underlying surface albedo, and a SW cooling effect at the Earth’s surface [4,58,59,60,61], as well as a LW warming effect either at the TOA and at the Earth’s surface [62,63]. The corresponding dust radiative temperature effects in the atmosphere are more complicated. Indeed, the DA-radiation interaction is not homogeneous within the entire atmospheric column, whereas the DA radiative effect is sensitive to the vertical distribution of aerosols [3,4,61,64]. Specifically, it has been found that the absorption of solar radiation by DA results in a heating effect across the vertically extended dust layer, with the heating rates being stronger in the lower parts of the atmosphere, where the aerosol load is greater, resulting in an increase in the atmospheric stability mainly in the lower troposphere [3]. On the other hand, it has also been found that DA cause a LW cooling effect in the atmosphere and a LW warming effect both at the Earth’s surface and at the TOA [61,63,65]. This inhomogeneous temperature modification due to DA can change the atmospheric lapse rates, γ, and the atmospheric stability [27,66]. Such changes are very important since they can affect the downward mixing of energy, such as momentum provided by winds, whereas they can act horizontally on thermal wind balances, causing horizontally changing pressure gradients, also altering the horizontal wind [66,67,68]. This important effect of DA on atmospheric temperature has been investigated over other regions, such as the Tropical Atlantic Ocean [2], Australia [69], and Asia [70]. Based on satellite data and model simulations, it was found that dust plumes transported from Sahara to the Tropical Atlantic Ocean increased the temperature below 5 km, with a maximum increase at 1–2 km, resulting in an increase in atmospheric stability below 2 km, against a decrease between 2 and 5 km [2]. In addition, using model simulations (WRF-Chem) to investigate the feedback between DA and boundary layer characteristics in Australia, it has been found that DA cause this way temperature inversions and decreased temperature gradients between 2 and 3 km [69]. Temperature inversions just below the dust layer, namely at 1 and 2 km above ground level, were also found, using model simulations to investigate the meteorological feedback of a severe dust storm event over eastern China [70]. Yet, the atmospheric temperature structure modification under dust episodes (DAECs) has not been investigated over the MB. Such an investigation is of special interest, because of the frequent occurrence of episodic dust export, especially from the Sahara [29], and the high amounts of solar radiation, especially in summer [60]. This is attempted in the present section, emphasizing the possible creation of temperature inversions due to the examined DAEC, taking advantage of the 3-D MERRA-2 reanalysis data of DOD and temperature.
In order to study in detail the modification of temperature profiles and static stability, and the possible creation of temperature inversions, by the examined DAEC (16–18 June 2016), specific vertical cross-sections of temperature gradient γ (Figure 7iii-a,iii-b,iii-c) and DOD (Figure 7ii-a,ii-b,ii-c) were produced across the pathway of the exported dust during the DAEC. These cross-sections, given along selected slant paths shown in Figure 7i-a,i-b,i-c, are shown in Figure 7 for each day of the DAEC. The values of DOD and γ are calculated at 72 layers of MERRA-2 and then interpolated to contour height levels above sea-level pressure. In the cross-sections of γ, both negative (bluish colors) and positive (reddish colors) values exist, the positive ones indicating the existence of temperature inversion in the atmosphere. White colors in the γ cross-sections refer to conditions close to inversion. Apart from the vertical cross-sections, horizontal cross-sections of γ for each day of the DAEC (Figures S6–S8) have also been produced at specific selected atmospheric levels, namely 1300, 1700, and 2700 m, to examine the collocation of DA with the areas of temperature inversion. Similar horizontal cross-sections of DOD are also given at 1500, 1900, and 3100 m, selected to be just above the corresponding levels of γ. This selection was made because, as shown in our results (Figure 7), but also in the bibliography [70], the temperature inversions caused by DA occur below the dust layer. It should be noted that the creation of temperature inversions below the dust layers should be, at least partly, attributed to the heating of the overlying dust layer caused by the absorption of solar radiation by the absorbing dust particles [4,53]. Nevertheless, the warm advection associated with the southern transport of African air masses to the Mediterranean should not be ignored since it also plays a less or more significant role in the heating.
On the first day of DAEC (D-1, 16 June 2016, Figure 7i-a), a slant path extending from Morocco up to NE Balkans, crossing MB areas that whether or not undergo the dust export, has been selected in order to make evident the presence and the altitude of the exported dust. Indeed, as shown in Figure 7ii-a, the dust layer (DOD > 0.015) extending from 37°N–5°E to 41°N–20°E, i.e., from the coastline of Algeria to the western coast of Italy (Lazio), is situated at altitudes ranging between 2000 and 6000 m, with maximum DOD values (up to 0.04, yellowish and bluish colors) between 3800 and 4800 m. Between 38°N–7.5°E and 40°N–12.5°E, i.e., over the western Tyrrhenian Sea off the coasts of Sardinia, high DOD values (up to 0.02, yellowish colors) also occur below 3800 m, in the whole boundary layer down to the Earth’s surface. These high DOD values can be attributed to the proximity of this region to the African source region of the dust export and the absence of sedimentation of the heavy DA. A reduction in temperature lapse rates, or even temperature inversions (white and pink to red colors appearing in the right column of Figure 7), are observed just below the elevated dust layer. This can be explained by the fact that during daytime, DA absorb SW radiation, causing a heating effect in the atmosphere, especially at the base and throughout the dust layer. Simultaneously, through absorption and scattering of solar radiation, DA reduce the SW radiation reaching the lowest atmospheric levels and the Earth’s surface, resulting in a cooling effect therein. The combination of reduced temperature at the lower layers and increased temperature above them results in the reduced temperature lapse rates and temperature inversions observed in the right column of Figure 7iii-a. The horizontal cross-sections of γ (Figure S6) reveal positive (up to 10 K/km) or small negative values of γ off the Tunisian coasts, over the Tyrrhenian Sea, and over the western coastal part of northwestern Italy (Lazio and Toscana), where high DOD values occur. However, it is interesting to note that higher up in the free troposphere, at 2700 m, inversions are also observed over NW Africa (along the Atlas Mountains, Morocco, and north Algeria), coinciding with a separate branch of dust transport (Figure S6). Temperature inversions in the free troposphere (2–3 km), caused by DA, were also found in Australia using model simulations [69]. It should be noted that although this branch of free tropospheric dust transport is not evident in the columnar DOD distribution (Figure 5i-b), it is associated with the distinct line of liquid clouds extending along the same path with the transported elevated dust and the inversions (Figure S6).
On the second day of DAEC (D-2, 17 June 2016), an elevated dust layer with significant dust loads (DOD up to 0.11) is observed between 3800 and 6000 m (Figure 7ii-b) across the dust export path, not only over N. Africa (Tunisia) but also over the Mediterranean areas between 26°N and 44°N and between 13°E and 20°E, namely over southern Italy and the Adriatic Sea. High dust amounts (DOD up to 0.07, yellowish colors) are observed within the first 2 km over the Gulf of Gabes, where dust is exported from the low-altitude (less than 500 m ASL) continental areas of Tunisia (Figure 3). Spatially extended and strong temperature inversions (reddish colors, Figure 7iii-b) occurred below 1000 m, under the dust layer, over the Gulf of Gabes, i.e., the maritime areas off the Tunisian and Libyan coasts extending from 32.5°N to 36.5°N and from 11.5°E to 14.5°E. Although such inversions are not observed further to the northeast, over the continental areas of Italy, a drastic decrease in temperature lapse rates is apparent over there, with either small negative (as low as 3.5 K/m) or neutral (zero) lapse rates (white and light cyan colors, respectively) at altitudes up to about 4.5 km. This extended temperature inversion, along with the concurrent anomalous high DOD, is well presented in Figure S7i,ii-a. This is the first time in bibliography that reduced lapse rates and temperature inversions attributed to DA are found at such heights, while in previous studies conducted in other world regions, such inversions were found either between 1 and 2 km [2,70] or between 2 and 3 km [69].
Finally, on the last day of DAEC (D-3, 18 June 2016), when the pathway of transport has slightly moved northeasterly, across the Ionian Sea, a distinct layer with high dust loadings (DOD up to 0.05, yellowish, greenish, and bluish colors, Figure 7ii-c), situated between 2 and 5 km, extends from 29.5°N–11.5°E (northwest Libya) to 40°N-20°E (Ionian Sea, Figure 7i-c). Relatively high dust loadings (DOD up to 0.08, orange colors, Figure 7ii-c) are also observed at similar altitudes over the Balkans’ continental areas of the path, indicating a long-range dust transport. Again, as in the previous two days, an extended layer of temperature inversions extends from the surface up to about 1000 m, below the dust layer, from 33°N–14.5°E to 39.5°N–19.5°E (reddish colors, Figure 7iii-c)., namely over the Mediterranean (Ionian) Sea from the Libyan coasts to west coasts of Greece. A layer of small negative γ (white and light cyan colors) overlies this inversion layer, up to 2–3 km, also extending higher (up to 2–6 km) from 39.5°N–19.5°E to 45.5°N–24.5°E, i.e., from the west coast of Greece to the end of cross-section path in Romania. The geographical distribution of temperature gradients on D-2 day (Figure S8) reveals a coincidence of inversions (pink and red colors) with anomalous high DOD at all the selected levels over the Mediterranean Sea, but also over coastal areas of Tunisia and Libya at 1100 and 1300 m.

4. Conclusions

In the present study, a detailed analysis of an evolving episode of dust transport (DAEC) over the Mediterranean Basin and of the associated atmospheric circulation, cloud formation, and three-dimensional temperature structure is made by using observational MODIS satellite and MERRA-2 reanalysis data. Emphasis is given to the assessment of the effect of DAEC on the formation and the properties of clouds, as well as on the atmospheric stability and the creation of temperature inversions. The DAEC, identified by a satellite algorithm [29], occurred from 16 to 18 June 2016 over the west and central MB. The study relied on the synergetic use of a variety of satellite and reanalysis data (atmospheric geopotential height and sea-level pressure, columnar and vertically resolved AOD and DOD, cloud fraction and phase, temperature profiles, and lapse rates), enabling to shed light on the 3-D structure, and the spatiotemporal variability of the dust episode, and its effects on clouds, temperature, and static atmospheric stability. To our knowledge, this is the first time that the relationship between dust aerosols and cloud formation and properties has been investigated observationally, especially over the MB. It is also the first time that the creation of temperature inversions due to dust has been investigated over the MB. The main findings of the present study are the following:
  • One day before the beginning of the dust export, a weak cyclonic circulation is established over NW Africa, which is intensified on the subsequent (first) day, favoring the uplifting of DA. A trough at 850 and 700 hPa over the western Mediterranean Basin, and a ridge over the central-to-east basin, intensifying and moving easterly during the evolution of dust export, create a SW wind flow, which transports DA from NE Algeria and Tunisia to the central MB and up to southern Europe;
  • There is strong evidence that the evolving Mediterranean dust episode plays a key role in the formation of clouds by providing CCN and IN. Before the DAEC, clear-sky conditions are observed, with few clouds only over the northern parts of the basin, whereas on the first day of the dust episode, mixed-phase clouds are formed over areas with high positive DOD anomalies (values up to 0.9). The formed clouds extend along two northeasterly oriented axes, one over the western MB and a second over the central MB, both being consisted mainly of ice clouds. High CF values (up to 1) are also observed on the second and the third days of DAEC over the areas of MB undergoing dust transport, especially where the dust transport occurs for the first time (given the eastward shift of the African dust transport). However, in these two days (second and third days of DAEC), it is observed that clouds over the areas continuing to undergo dust transport from the first day of DAEC either dissipate or diminish;
  • The clouds formed over the Mediterranean dusty regions are mainly high (CTH larger than 10 km) with low cloud-top temperatures (CTT as low as 230 K). Over the areas that undergo continuous dust transport, i.e., for subsequent days, the decrease in CF is associated with reduced cloud height (CTH as low as 500 m) and increased CTT (up to 295 K);
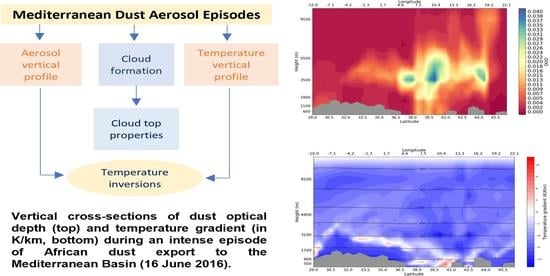
  • The dust transport takes place in two atmospheric layers, one near the surface, mostly occurring near the dust source North African areas, and another higher up, in the free troposphere, between 2 and 8 km. Intense temperature inversions (up to 20 K/km) or reduced negative lapse rates (a few degrees/km) are systematically observed below the dust layer. The inversions are more systematically observed within the maritime boundary layer due to the cooler sea surface underlying the dust layer and, also, sporadically over the North African continental areas undergoing continuous dust transport. On the other hand, small negative (reduced) lapse rates are observed in the free troposphere above continental areas (Italian and Balkan peninsulas) experiencing the transport of African dust.
The results of the present study confirm model computations indicating enhanced cloud formation under high dust load conditions. The literature reported invigoration of updrafts and the formation of ice phase clouds are also confirmed by the obtained results of this study, which reveal the existence of ice phase clouds, especially in the free troposphere, over Mediterranean areas undergoing dust transport. Moreover, this study documents for the first time the creation of temperature inversions within the maritime boundary layer of the MB due to the African dust transport. Such inversions are associated with increased temperatures within the solar absorbing and heated dust layer, which can enhance free tropospheric updrafts that, combined with the available CCN/IN, may favor the formation of middle and high clouds. On the other hand, the stabilization of the lower atmosphere due to dust episodes is relevant to air quality issues. The findings of the present study related to the radiative effect of dust on the Mediterranean temperature fields and vertical profiles are planned to be simulated in future work using a 3-D radiative transfer model (RTM). In such a study, the attribution and partition of the heating of the dust layer to the aerosol radiative heating and the warm advection will be possible. Furthermore, the cloud formation during MB DAECs is planned to be investigated based on cloud-resolving model simulations accounting for dust-cloud interactions. Finally, the conclusions drawn from this study will be consolidated by studying more DAECs, also occurring in other seasons, namely spring, autumn, or winter.

Supplementary Materials

The following supporting information can be downloaded at: https://www.mdpi.com/article/10.3390/rs14030679/s1, Figure S1: Geographical distribution of MODIS AOD during one day before the DAEC (D-0, a), and during the first (D-1, b), second (D-2, c) and the third (D-3, d) day of the DAEC that occurred during 16–18 June 2016 over the Mediterranean Basin. The colorbar is forced to range from zero up to 1.5, with all values greater than 1.4 being indicated with deep red color; Figure S2: Geographical distribution of the MERRA-2 dust contribution (DOD/AOD) during one day before the DAEC (D-0, a), and during the first (D-1, b), second (D-2, c) and the third (D-3, d) day of the DAEC that occurred during 16–18 June 2016 over the Mediterranean Basin; Figure S3: Horizontal cross-sections of temperature (in K, left column) and relative humidity (right column) at specific altitudes (indicated at the top of each map) below and close to the top of clouds formed over the dust export region (see Figure 6 of main paper, left column and first row), on the first day of DAEC (16 June 2016); Figure S4: As in Figure S3, but for the second day of DAEC (17 June 2016); Figure S5: As in Figure S3, but for the third day of DAEC (18 June 2016); Figure S6: Horizontal cross-sections of temperature gradient (in K/Km, left column) and DOD (right column) at specific altitudes (indi-cated at the top of maps) below and close to the dust layer (see Figure 7, left column and first row), on the first day of DAEC (16 June 2016); Figure S7: As in Figure S6, but for the second day of DAEC (17 June 2016); Figure S8: As in Figure S6, but for the third day of DAEC (18 June 2016).

Author Contributions

Conceptualization, N.H., and M.G.; methodology, N.H., and M.G.; software, M.G., and N.H.; formal analysis, M.G.; investigation, N.H., and M.G.; resources, N.H., M.G., and M.-B.K.-C.; data curation, N.H., M.G., and M.-B.K.-C.; writing—original draft preparation, M.G.; writing—review and editing, N.H., N.M., M.-B.K.-C., C.J.L., and M.G.; visualization, M.G.; supervision, N.H.; project administration, N.H.; funding acquisition, N.H. and N.M. All authors have read and agreed to the published version of the manuscript.

Funding

This research was funded by the PANhellenic infrastructure for Atmospheric Composition and climatE change (PANACEA) research project (MIS 5021516), implemented under the Action Reinforcement of the Research and Innovation Infrastructure, and the Operational Program Competitiveness, Entrepreneurship, and Innovation (NSRF 2014–2020), co-financed by Greece and the European Union (European Regional Development Fund).

Data Availability Statement

Publicly available data sets were analyzed in this study. These data can be found here: (https://ladsweb.modaps.eosdis.nasa.gov/search/) (accessed on 17 December 2021).

Acknowledgments

We acknowledge support by the project “PANhellenic infrastructure for Atmospheric Composition and climatE change” (MIS 5021516), which is implemented under the Action “Reinforcement of the Research and Innovation Infrastructure”, funded by the Operational Programme “Competitiveness, Entrepreneurship and Innovation” (NSRF 2014–2020) and co-financed by Greece and the European Union (European Regional Development Fund).

Conflicts of Interest

The authors declare no conflict of interest.

References

  1. Boucher, O.; Randall, D.; Artaxo, P.; Bretherton, C.; Feingold, G.; Forster, P.; Kerminen, V.-M.; Kondo, Y.; Liao, H.; Lohmann, U.; et al. Clouds and Aerosols. In Climate Change 2013: The Physical Science Basis, Contribution of Working Group I to the Fifth Assessment Report of the Intergovernmental Panel on Climate Change; Stocker, T.F., Qin, D., Plattner, G.-K., Tignor, M., Allen, S.K., Boschung, J., Nauels, A., Xia, Y., Bex, V., Midgley, P.M., Eds.; Cambridge University Press: Cambridge, UK; New York, NY, USA, 2013; Available online: http://www.climatechange2013.org/images/uploads/WGIAR5_WGI12Doc2b_FinalDraft_Chapter07.pdf (accessed on 16 December 2021).
  2. Wang, K.Y.; Liu, C.H. Transport of the Saharan dust air plumes over the tropical North Atlantic from FORMOSAT–3/COSMIC observation. Atmos. Pollut. Res. 2014, 5, 539–553. [Google Scholar] [CrossRef] [Green Version]
  3. Korras-Carraca, M.B.; Pappas, V.; Hatzianastassiou, N.; Vardavas, I.; Matsoukas, C. Global vertically resolved aerosol direct radiation effect from three years of CALIOP data using the FORTH radiation transfer model. Atmos. Res. 2019, 224, 138–156. [Google Scholar] [CrossRef]
  4. Korras-Carraca, M.-B.; Gkikas, A.; Matsoukas, C.; Hatzianastassiou, N. Global Clear-Sky Aerosol Speciated Direct Radiative Effects over 40 Years (1980–2019). Atmosphere 2021, 12, 1254. [Google Scholar] [CrossRef]
  5. Karydis, V.A.; Tsimpidi, A.P.; Bacer, S.; Pozzer, A.; Nenes, A.; Lelieveld, J. Global impact of mineral dust on cloud droplet number concentration. Atmos. Chem. Phys. 2017, 17, 5601–5621. [Google Scholar] [CrossRef] [Green Version]
  6. Li, R.; Dong, X.; Guo, J.; Fu, Y.; Zhao, C.; Wang, Y.; Min, Q. The implications of dust ice nuclei effect on cloud top temperature in a complex mesoscale convective system. Sci. Rep. 2017, 7, 13826. [Google Scholar] [CrossRef] [Green Version]
  7. Fan, J.; Yuan, T.; Comstock, J.M.; Ghan, S.; Khain, A.; Leung, L.R.; Li, Z.; Martins, V.J.; Ovchinnikov, M. Dominant role by vertical wind shear in regulating aerosol effects on deep convective clouds. J. Geophys. Res. 2009, 114, D22206. [Google Scholar] [CrossRef]
  8. Twomey, S. Influence of pollution on shortwave albedo of clouds. J. Atmos. Sci. 1977, 34, 1149–1152. [Google Scholar] [CrossRef] [Green Version]
  9. Hansen, J.; Sato, M.; Ruedy, R. Radiative forcing and climate response. J. Geophys. Res. 1997, 102, 6831–6864. [Google Scholar] [CrossRef]
  10. Ackerman, A.S.; Toon, O.B.; Stevens, D.E.; Heymsfield, A.J.; Ramanathan, V.; Welton, E.J. Reduction of tropical cloudiness by soot. Science 2000, 288, 1042–1047. [Google Scholar] [CrossRef] [Green Version]
  11. Koch, D.; Del Genio, A.D. Black carbon absorption effects on cloud cover: Review and synthesis. Atmos. Chem. Phys. 2010, 10, 7685–7696. [Google Scholar] [CrossRef] [Green Version]
  12. Kok, J.F.; Adebiyi, A.A.; Albani, S.; Balkanski, Y.; Checa-Garcia, R.; Chin, M.; Colarco, P.R.; Hamilton, D.S.; Huang, Y.; Ito, A.; et al. Contribution of the world’s main dust source regions to the global cycle of desert dust. Atmos. Chem. Phys. 2021, 21, 8169–8193. [Google Scholar] [CrossRef]
  13. Feingold, G.; Cotton, W.R.; Kreidenweis, S.M.; Davis, J.T. The Impact of Giant Cloud Condensation Nuclei on Drizzle Formation in Stratocumulus: Implications for Cloud Radiative Properties. J. Atmos. Sci. 1999, 56, 4100–4117. [Google Scholar] [CrossRef] [Green Version]
  14. Hoose, C.; Lohmann, U.; Bennartz, R.; Croft, B.; Lesins, G. Global simulations of aerosol processing in clouds. Atmos. Chem. Phys. 2008, 8, 6939–6963. [Google Scholar] [CrossRef] [Green Version]
  15. Levin, Z.; Cotton, W.R. Summary. In Aerosol Pollution Impact on Precipitation; Levin, Z., Cotton, W.R., Eds.; Springer: Dordrecht, The Netherlands, 2009. [Google Scholar] [CrossRef]
  16. Karydis, V.A.; Kumar, P.; Barahona, D.; Sokolik, I.N.; Nenes, A. On the effect of dust particles on global cloud condensation nuclei and cloud droplet number. J. Geophys. Res. 2011, 116, D23204. [Google Scholar] [CrossRef] [Green Version]
  17. Ginoux, P.; Prospero, J.M.; Gill, T.E.; Hsu, N.C.; Zhao, M. Global-scale attribution of anthropogenic and natural dust sources and their emission rates based on MODIS Deep Blue aerosol products. Rev. Geophys. 2012, 50, RG3005. [Google Scholar] [CrossRef]
  18. Bullard, J.E.; Baddock, M.C.; Bradwell, T.; Crusius, J.; Darlington, E.F.; Gaiero, D.; Gassó, S.; Gisladottir, G.; Hodgkins, R.; McCulloch, R.; et al. High-latitude dust in the Earth system. Rev. Geophys. 2016, 54, 447–485. [Google Scholar] [CrossRef] [Green Version]
  19. D’Almeida, G.A. Desert Aerosol: Characteristics and Effects on Climate. In Paleoclimatology and Paleometeorology: Modern and Past Patterns of Global Atmospheric Transport; Springer: Dordrecht, The Netherlands, 1989; pp. 311–338. [Google Scholar] [CrossRef]
  20. Gkikas, A.; Houssos, E.E.; Lolis, C.J.; Bartzokas, A.; Mihalopoulos, N.; Hatzianastassiou, N. Atmospheric circulation evolution related to desert-dust episodes over the Mediterranean. Q. J. R. Meteorol. Soc. 2015, 141, 1634–1645. [Google Scholar] [CrossRef]
  21. Engelstaedter, S.; Tegen, I.; Washington, R. North African dust emissions and transport. Earth Sci. Rev. 2006, 79, 73–100. [Google Scholar] [CrossRef]
  22. Gkikas, A.; Hatzianastassiou, N.; Mihalopoulos, N.; Katsoulis, V.; Kazadzis, S.; Pey, J.; Querol, X.; Torres, O. The regime of intense desert dust episodes in the Mediterranean based on contemporary satellite observations and ground measurements. Atmos. Chem. Phys. 2013, 13, 12135–12154. [Google Scholar] [CrossRef] [Green Version]
  23. Gkikas, A.; Basart, S.; Hatzianastassiou, N.; Marinou, E.; Amiridis, V.; Kazadzis, S.; Pey, J.; Querol, X.; Jorba, O.; Gassó, S.; et al. Mediterranean intense desert dust outbreaks and their vertical structure based on remote sensing data. Atmos. Chem. Phys. 2016, 16, 8609–8642. [Google Scholar] [CrossRef] [Green Version]
  24. Chaboureau, J.-P.; Claud, C. Mediterranean cloud system variability inferred from satellite observations. Adv. Geosci. 2006, 7, 246. [Google Scholar] [CrossRef] [Green Version]
  25. Chéruy, F.; Aires, F. Cluster Analysis of Cloud Properties over the Southern European Mediterranean Area in Observations and a Model. Mon. Weather Rev. 2009, 137, 3161–3176. [Google Scholar] [CrossRef]
  26. Moulin, C.; Lambert, C.E.; Dulac, F.; Dayan, U. Control of atmospheric export of dust from North Africa by the North Atlantic Oscillation. Nat. Cell Biol. 1997, 387, 691–694. [Google Scholar] [CrossRef]
  27. Knippertz, P.; Stuut, J.B.W. Mineral Dust—A Key Player in the Earth System; Springer Science & Business Media: Dordrecht, The Netherlands, 2014; pp. 121–147. [Google Scholar]
  28. Schepanski, K.; Mallet, M.; Heinold, B.; Ulrich, M. North African dust transport toward the western Mediterranean basin: Atmospheric controls on dust source activation and transport pathways during June–July 2013. Atmos. Chem. Phys. 2016, 16, 14147–14168. [Google Scholar] [CrossRef] [Green Version]
  29. Gavrouzou, M.; Hatzianastassiou, N.; Gkikas, A.; Lolis, C.J.; Mihalopoulos, N. A Climatological Assessment of Intense Desert Dust Episodes over the Broader Mediterranean Basin Based on Satellite Data. Remote Sens. 2021, 13, 2895. [Google Scholar] [CrossRef]
  30. Bangert, M.; Nenes, A.; Vogel, B.; Vogel, H.; Barahona, D.; Karydis, V.A.; Kumar, P.; Kottmeier, C.; Blahak, U. Saharan dust event impacts on cloud formation and radiation over Western Europe. Atmos. Chem. Phys. 2012, 12, 4045–4063. [Google Scholar] [CrossRef] [Green Version]
  31. Gong, X.; Wex, H.; Müller, T.; Wiedensohler, A.; Höhler, K.; Kandler, K.; Ma, N.; Dietel, B.; Schiebel, T.; Möhler, O.; et al. Characterization of aerosol properties at Cyprus, focusing on cloud condensation nuclei and ice-nucleating particles. Atmos. Chem. Phys. 2019, 19, 10883–10900. [Google Scholar] [CrossRef] [Green Version]
  32. Tsarpalis, K.; Katsafados, P.; Papadopoulos, A.; Mihalopoulos, N. Assessing Desert Dust Indirect Effects on Cloud Microphysics through a Cloud Nucleation Scheme: A Case Study over the Western Mediterranean. Remote Sens. 2020, 12, 3473. [Google Scholar] [CrossRef]
  33. Ioannidis, E.; Lolis, C.J.; Papadimas, C.D.; Hatzianastassiou, N.; Bartzokas, A. On the intra-annual variation of cloudiness over the Mediterranean region. Atmos. Res. 2018, 208, 246–256. [Google Scholar] [CrossRef]
  34. Barnes, W.L.; Xiong, X.; Guenther, B.W.; Salomonson, V. Development, Characterization, and Performance of the EOS MODIS Sensors. In Earth Observing Systems VIII, Proceedings of the Optical Science and Technology, SPIE’s 48th Annual Meeting, San Diego, CA, USA, 3–8 August 2003; SPIE: Bellingham, WA, USA, 2003; Volume 5151, p. 5151. [Google Scholar] [CrossRef]
  35. Salomonson, V.V.; Barnes, W.; Masuoka, E.J. Introduction to MODIS and an Overview of Associated Activities. In Earth Science Satellite Remote Sensing; Qu, J.J., Gao, W., Kafatos, M., Murphy, R.E., Salomonson, V.V., Eds.; Springer: Berlin/Heidelberg, Germany, 2006. [Google Scholar] [CrossRef]
  36. Levy, R.C.; Remer, L.A.; Mattoo, S.; Vermote, E.F.; Kaufman, Y.J. Second-generation operational algorithm: Retrieval of aerosol properties over land from inversion of Moderate Resolution Imaging Spectroradiometer spectral reflectance. J. Geophys. Res. Atmos. 2007, 112, D13211. [Google Scholar] [CrossRef] [Green Version]
  37. Hsu, N.C. Changes to Modis Deep Blue Aerosol Products between Collection 6 and Collection 6.1. 2017. Available online: https://atmosphere-imager.gsfc.nasa.gov/sites/default/files/ModAtmo/modis_deep_blue_c61_changes2.pdf (accessed on 16 December 2021).
  38. Mattoo, S. Aerosol Dark Target (10 km & 3 km) Collection 6.1 Changes. Available online: https://atmosphere-imager.gsfc.nasa.gov/sites/default/files/ModAtmo/C061_Aerosol_Dark_Target_v2.pdf (accessed on 17 December 2021).
  39. Bosilovich, M.G.; Lucchesi, R.; Suarez, M. MERRA-2: File Specification. 2015. Available online: https://gmao.gsfc.nasa.gov/pubs/docs/Bosilovich785.pdf (accessed on 17 December 2021).
  40. Gelaro, R.; McCarty, W.; Suárez, M.J.; Todling, R.; Molod, A.; Takacs, L.; Randles, C.A.; Darmenov, A.; Bosilovich, M.G.; Reichle, R.; et al. The Modern-Era Retrospective Analysis for Research and Applications, Version 2 (MERRA-2). J. Clim. 2017, 30, 5419–5454. Available online: https://journals.ametsoc.org/view/journals/clim/30/14/jcli-d-16-0758.1.xml (accessed on 16 December 2021). [CrossRef] [PubMed]
  41. Buchard, V.; Randles, C.A.; da Silva, A.M.; Darmenov, A.; Colarco, P.R.; Govindaraju, R.; Ferrare, R.; Hair, J.; Beyersdorf, A.J.; Ziemba, L.D.; et al. The MERRA-2 Aerosol Reanalysis, 1980 Onward. Part II: Evaluation and Case Studies. J. Clim. 2017, 30, 6851–6872. Available online: https://journals.ametsoc.org/view/journals/clim/30/17/jcli-d-16-0613.1.xml (accessed on 16 December 2021). [CrossRef] [PubMed]
  42. Randles, C.A.; da Silva, A.M.; Buchard, V.; Colarco, P.R.; Darmenov, A.; Govindaraju, R.; Smirnov, A.; Holben, B.; Ferrare, R.; Hair, J.; et al. The MERRA-2 Aerosol Reanalysis, 1980 Onward. Part I: System Description and Data Assimilation Evaluation. J. Clim. 2017, 30, 6823–6850. Available online: https://journals.ametsoc.org/view/journals/clim/30/17/jcli-d-16-0609.1.xml (accessed on 16 December 2021). [CrossRef]
  43. Schepanski, K.; Knippertz, P. Soudano-Saharan depressions and their importance for precipitation and dust: A new perspective on a classical synoptic concept. Q. J. R. Meteorol. Soc. 2011, 137, 1431–1445. [Google Scholar] [CrossRef] [Green Version]
  44. Fiedler, S.; Schepanski, K.; Knippertz, P.; Heinold, B.; Tegen, I. How important are atmospheric depressions and mobile cyclones for emitting mineral dust aerosol in North Africa? Atmos. Chem. Phys. 2014, 14, 8983–9000. [Google Scholar] [CrossRef] [Green Version]
  45. Dulac, F.; Tanré, D.; Bergametti, G.; Buat-Ménard, P.; Desbois, M.; Sutton, D. Assessment of the African airborne dust mass over the western Mediterranean Sea using Meteosat data. J. Geophys. Res. Atmos. 1992, 97, 2489–2506. [Google Scholar] [CrossRef]
  46. Varga, G.; Újvári, G.; Kovács, J. Spatiotemporal patterns of Saharan dust outbreaks in the Mediterranean Basin. Aeolian Res. 2014, 15, 151–160. [Google Scholar] [CrossRef] [Green Version]
  47. Che, H.; Gui, K.; Xia, X.; Wang, Y.; Holben, B.N.; Goloub, P.; Cuevas-Agulló, E.; Wang, H.; Zheng, Y.; Zhao, H.; et al. Large contribution of meteorological factors to inter-decadal changes in regional aerosol optical depth. Atmos. Chem. Phys. 2019, 19, 10497–10523. [Google Scholar] [CrossRef] [Green Version]
  48. Shi, Z.; Xie, X.; Xin, R.; Li, X.; Liu, Y.; Jing, L.; Liu, X.; Zhisheng, A. Radiative Effect of Mineral Dust on East Asian Summer Monsoon During the Last Glacial Maximum: Role of Snow-Albedo Feedback. Geophys. Res. Lett. 2019, 46, 10901–10909. [Google Scholar] [CrossRef]
  49. Teller, A.; Levin, Z. The effects of aerosols on precipitation and dimensions of subtropical clouds: A sensitivity study using a numerical cloud model. Atmos. Chem. Phys. 2006, 6, 67–80. [Google Scholar] [CrossRef] [Green Version]
  50. Barahona, D.; West, R.E.L.; Stier, P.; Romakkaniemi, S.; Kokkola, H.; Nenes, A. Comprehensively accounting for the effect of giant CCN in cloud activation parameterizations. Atmos. Chem. Phys. 2010, 10, 2467–2473. [Google Scholar] [CrossRef] [Green Version]
  51. Stathopoulos, S.; Georgoulias, A.K.; Kourtidis, K. Space-borne observations of aerosol-cloud relations for cloud systems of different heights. Atmos. Res. 2017, 183, 191–201. [Google Scholar] [CrossRef]
  52. Pruppacher, H.; Klett, J. Homogeneous Nucleation. In Microphysics of Clouds and Precipitation; Springer: Dordrecht, The Netherlands, 2010; pp. 191–215. [Google Scholar]
  53. Wang, C.; Jeong, G.R.; Mahowald, N. Particulate absorption of solar radiation: Anthropogenic aerosols vs. dust. Atmos. Chem. Phys. 2009, 9, 3935–3945. [Google Scholar] [CrossRef] [Green Version]
  54. Kaufman, Y.J.; Koren, I.; Remer, L.A.; Rosenfeld, D.; Rudich, Y. The effect of smoke, dust, and pollution aerosol on shallow cloud development over the Atlantic Ocean. Proc. Natl. Acad. Sci. USA 2005, 102, 11207–11212. [Google Scholar] [CrossRef] [PubMed] [Green Version]
  55. Koren, I.; Kaufman, Y.J.; Rosenfeld, D.; Remer, L.A.; Rudich, Y. Aerosol invigoration and restructuring of Atlantic convective clouds. Geophys. Res. Lett. 2005, 32, L14828. [Google Scholar] [CrossRef] [Green Version]
  56. Myhre, G.; Stordal, F.; Johnsrud, M.; Kaufman, Y.J.; Rosenfeld, D.; Storelvmo, T.; Kristjansson, J.E.; Berntsen, T.K.; Myhre, A.; Isaksen, I.S.A. Aerosol-cloud interaction inferred from MODIS satellite data and global aerosol models. Atmos. Chem. Phys. 2007, 7, 3081–3101. [Google Scholar] [CrossRef] [Green Version]
  57. Ekman, A.M.L.; Engström, A.; Wang, C. The effect of aerosol composition and concentration on the development and anvil properties of a continental deep convective cloud. Quarterly Journal of the Royal Meteorological Society: A journal of the atmospheric sciences. Appl. Meteorol. Phys. Oceanogr. 2007, 133, 1439–1452. [Google Scholar]
  58. Hatzianastassiou, N.; Katsoulis, B.; Pnevmatikos, J.; Antakis, V. Spatial and Temporal Variation of Precipitation in Greece and Surrounding Regions Based on Global Precipitation Climatology Project Data. J. Clim. 2008, 21, 1349–1370. Available online: https://journals.ametsoc.org/view/journals/clim/21/6/2007jcli1682 (accessed on 16 December 2021). [CrossRef]
  59. Hatzianastassiou, N.; Matsoukas, C.; Drakakis, E.; Stackhouse, P.W., Jr.; Koepke, P.; Fotiadi, A.; Pavlakis, K.G.; Vardavas, I. The direct effect of aerosols on solar radiation based on satellite observations, reanalysis datasets, and spectral aerosol optical properties from Global Aerosol Data Set (GADS). Atmos. Chem. Phys. 2007, 7, 2585–2599. [Google Scholar] [CrossRef] [Green Version]
  60. Papadimas, C.D.; Hatzianastassiou, N.; Matsoukas, C.; Kanakidou, M.; Mihalopoulos, N.; Vardavas, I. The direct effect of aerosols on solar radiation over the broader Mediterranean basin. Atmos. Chem. Phys. 2012, 12, 7165–7185. [Google Scholar] [CrossRef] [Green Version]
  61. Granados-Muñoz, M.J.; Sicard, M.; Papagiannopoulos, N.; Barragán, R.; Bravo-Aranda, J.A.; Nicolae, D. Two-dimensional mineral dust radiative effect calculations from CALIPSO observations over Europe. Atmos. Chem. Phys. 2019, 19, 13157–13173. [Google Scholar] [CrossRef] [Green Version]
  62. Antón, M.; Valenzuela, A.; Mateos, D.; Alados, I.; Foyo-Moreno, I.; Olmo, F.J.; Alados-Arboledas, L. Longwave aerosol radiative effects during an extreme desert dust event in southeastern Spain. Atmos. Res. 2014, 149, 18–23. [Google Scholar] [CrossRef]
  63. Gkikas, A.; Obiso, V.; Pérez García-Pando, C.; Jorba, O.; Hatzianastassiou, N.; Vendrell, L.; Basart, S.; Solomos, S.; Gassó, S.; Baldasano, J.M. Direct radiative effects during intense Mediterranean desert dust outbreaks. Atmos. Chem. Phys. 2018, 18, 8757–8787. [Google Scholar] [CrossRef] [Green Version]
  64. Johnson, B.T.; Heese, B.; McFarlane, S.A.; Chazette, P.; Jones, A.; Bellouin, N. Vertical distribution and radiative effects of mineral dust and biomass burning aerosol over West Africa during DABEX. J. Geophys. Res. 2008, 113, D00C12. [Google Scholar] [CrossRef]
  65. Sicard, M.; Bertolín, S.; Mallet, M.; Dubuisson, P.; Comerón, A. Estimation of mineral dust long-wave radiative forcing: Sensitivity study to particle properties and application to real cases in the region of Barcelona. Atmos. Chem. Phys. 2014, 14, 9213–9231. [Google Scholar] [CrossRef] [Green Version]
  66. Schepanski, K. Transport of Mineral Dust and Its Impact on Climate. Geosciences 2018, 8, 151. [Google Scholar] [CrossRef] [Green Version]
  67. Pérez, C.; Nickovic, S.; Pejanovic, G.; Baldasano, J.M.; Özsoy, E. Interactive dust-radiation modeling: A step to improve weather forecasts. J. Geophys. Res. 2006, 111, D16206. [Google Scholar] [CrossRef] [Green Version]
  68. Heinold, B.; Tegen, I.; Schepanski, K.; Hellmuth, O. Dust radiative feedback on Saharan boundary layer dynamics and dust mobilization. Geophys. Res. Lett. 2008, 35, L20817. [Google Scholar] [CrossRef] [Green Version]
  69. Choobari, O.A.; Zawar-Reza, P.; Sturman, A. Feedback between windblown dust and planetary boundary-layer characteristics: Sensitivity to boundary and surface layer parameterizations. Atmos. Environ. 2012, 61, 294–304. [Google Scholar] [CrossRef]
  70. Yang, S.; Wang, Z.; Huang, X.; Wang, W.; Sheng, L.; Zhou, Y. Meteorological feedback and eco-environmental impact of Asian dust: A simulation study. Atmos. Environ. 2021, 253, 118350. [Google Scholar] [CrossRef]
Figure 1. The study region of the greater Mediterranean Basin.
Remotesensing 14 00679 g001
Figure 2. The duration in days (top panel), the intensity in terms of DOD (middle panel) and the relative percent spatial coverage of MB (bottom panel) of the 98 DAECs that occurred over the broader Mediterranean Basin from 2005 to 2019. The timing (month and year) and the serial number of each DAEC are indicated on the bottom horizontal axis of bottom panel and the top horizontal axis of the top panel, respectively. The studied DAEC (16–18 June 2016, serial number 76) is highlighted in orange color.
Remotesensing 14 00679 g002
Figure 3. The atmospheric circulation, i.e., geopotential height (GPH, in m) at 700 hPa (left column, (i)), GPH at 850 hPa (middle column, (ii)) and sea-level pressure (SLP, in hPa), (right column, (iii)) for one day before the DAEC (D-0, first row, (a)), and the first (D-1, second row, (b)), second (D-2, third row, (c)) and third (D-3, fourth row, (d)) days of the DAEC that occurred during 16–18/06/2016 over the Mediterranean Basin. Data are from MERRA-2 reanalysis and refer to 12UTC.
Remotesensing 14 00679 g003
Figure 4. Geographical distribution of MODIS AOD (left column (i)), MERRA-2 AOD (middle column (ii)), and MERRA-2 DOD (right column (iii)) during one day before the DAEC (D-0, first row, (a)), and during the first (D-1, second row, (b)), the second (D-2, third row, (c)) and the third (D-3, fourth row, (d)) day of the DAEC that occurred during 16–18 June 2016 over the Mediterranean Basin. Free colorbars are used in all graphs.
Remotesensing 14 00679 g004aRemotesensing 14 00679 g004b
Figure 5. Geographical distribution of: MERRA-2 DOD anomalies (first column, (i)), MODIS cloud fraction of mixed-phase (liquid and ice) clouds (second column, (ii)), MODIS liquid cloud fraction (third column, (iii)), and MODIS ice cloud fraction (fourth column, (iv)) during the day before the DAEC (D-0, first row, (a)), and the first (D-1, second row, (b)), second (D-2, third row, (c)) and third (D-3, fourth row, (d)) days of the DAEC that occurred from 16 to 18 June 2016 over the Mediterranean Basin.
Remotesensing 14 00679 g005
Figure 6. Geographical distribution of MODIS cloud-top height (CTH in m, left column (i)) and cloud-top temperature (CTT in K, right column (ii)) during the day before the DAEC (D-0, first row, (a)), and the first (D-1, second row, (b)), second (D-2, third row, (c)) and third (D-3, fourth row, (d)) days of the DAEC that occurred during from 16 to 18 June 2016 over the Mediterranean Basin.
Remotesensing 14 00679 g006aRemotesensing 14 00679 g006b
Figure 7. Vertical cross-sections of MERRA-2 DOD (middle column (ii)) and temperature gradient (in K/km, right column (iii)) along the slant paths across the African dust export into the Mediterranean Basin (shown on the maps of DOD anomalies, (left column (i)), during the first (D-1, first row, (a)), second (D-2, second row, (b)) and third (D-3, third row, (c)) days of the DAEC that occurred from 16 to 18 June 2016 over the Mediterranean Basin. The gray areas of cross-sections denote the orography.
Remotesensing 14 00679 g007
Publisher’s Note: MDPI stays neutral with regard to jurisdictional claims in published maps and institutional affiliations.

