
Spatial Prioritization for Wildfire Mitigation by Integrating Heterogeneous Spatial Data: A New Multi-Dimensional Approach for Tropical Rainforests

 ,
,  ,
,  ,
,  , , , ,
Abstract
:1. Introduction
2. Materials and Methods
2.1. Data
2.1.1. Climate and Atmospheric Data Products
2.1.2. Forestry Data Products
2.1.3. Socio-Economic Data Products
2.2. Methodology
2.2.1. Wildfire Susceptibility Index
2.2.2. Carbon Stock Index
2.2.3. Carbon Emission Index
2.2.4. Wildfire Priority Index (WPI)
2.2.5. Emerging Hostpot
3. Results
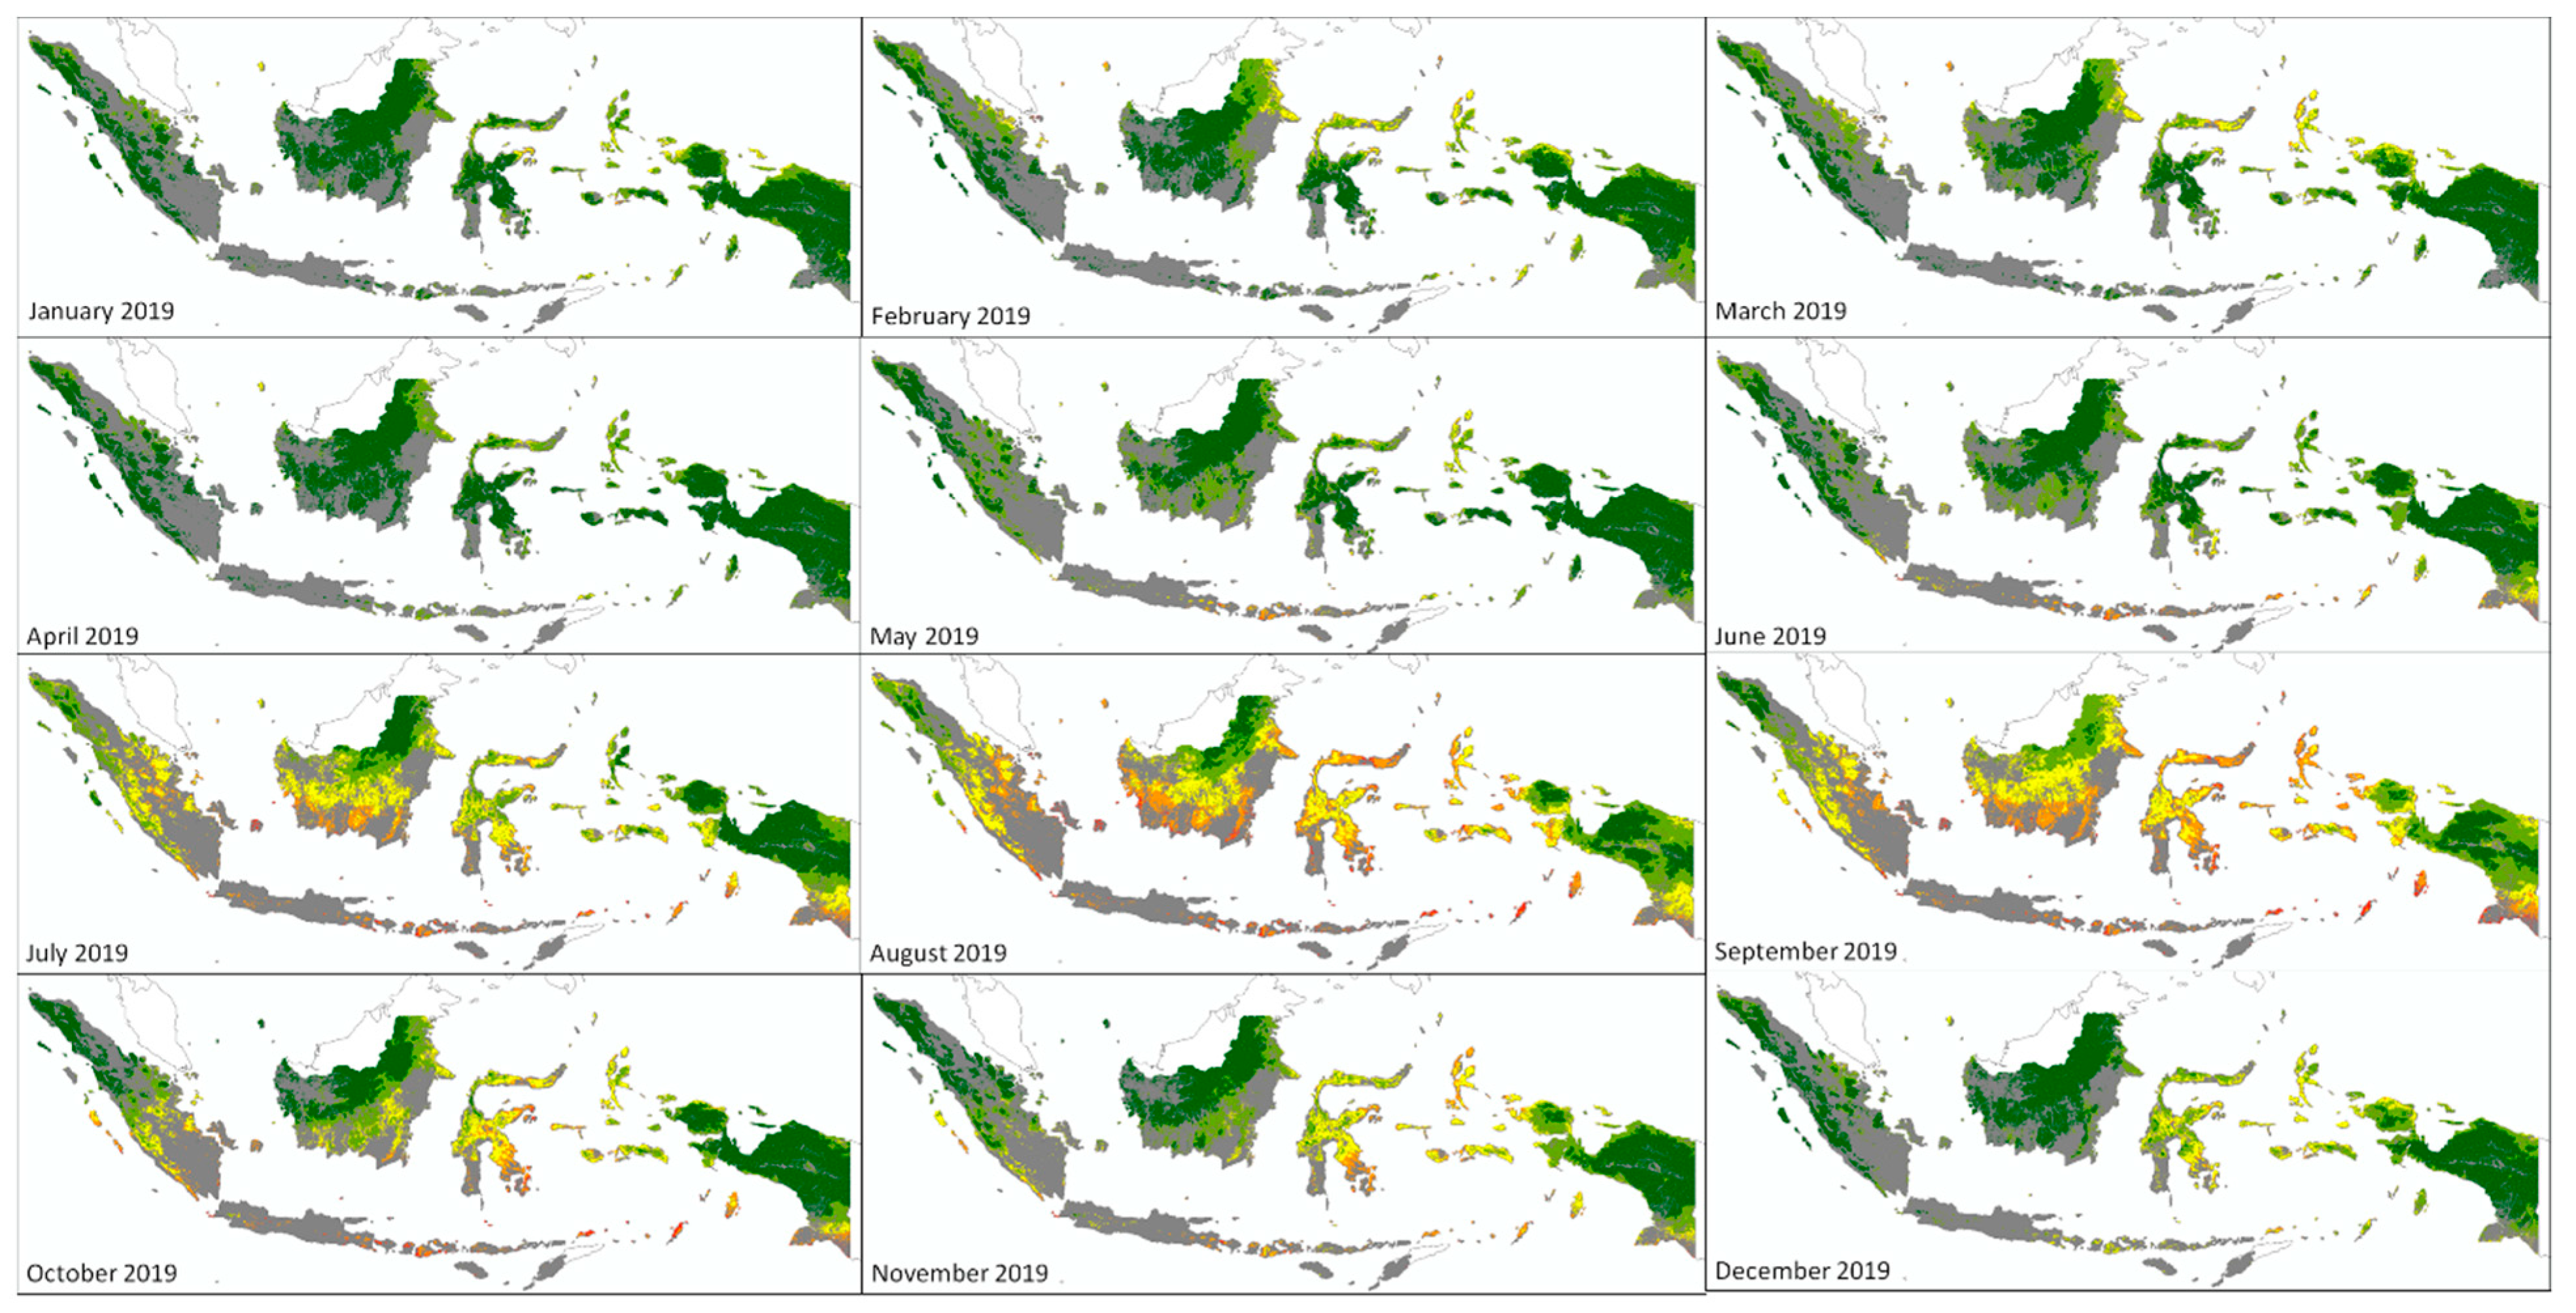
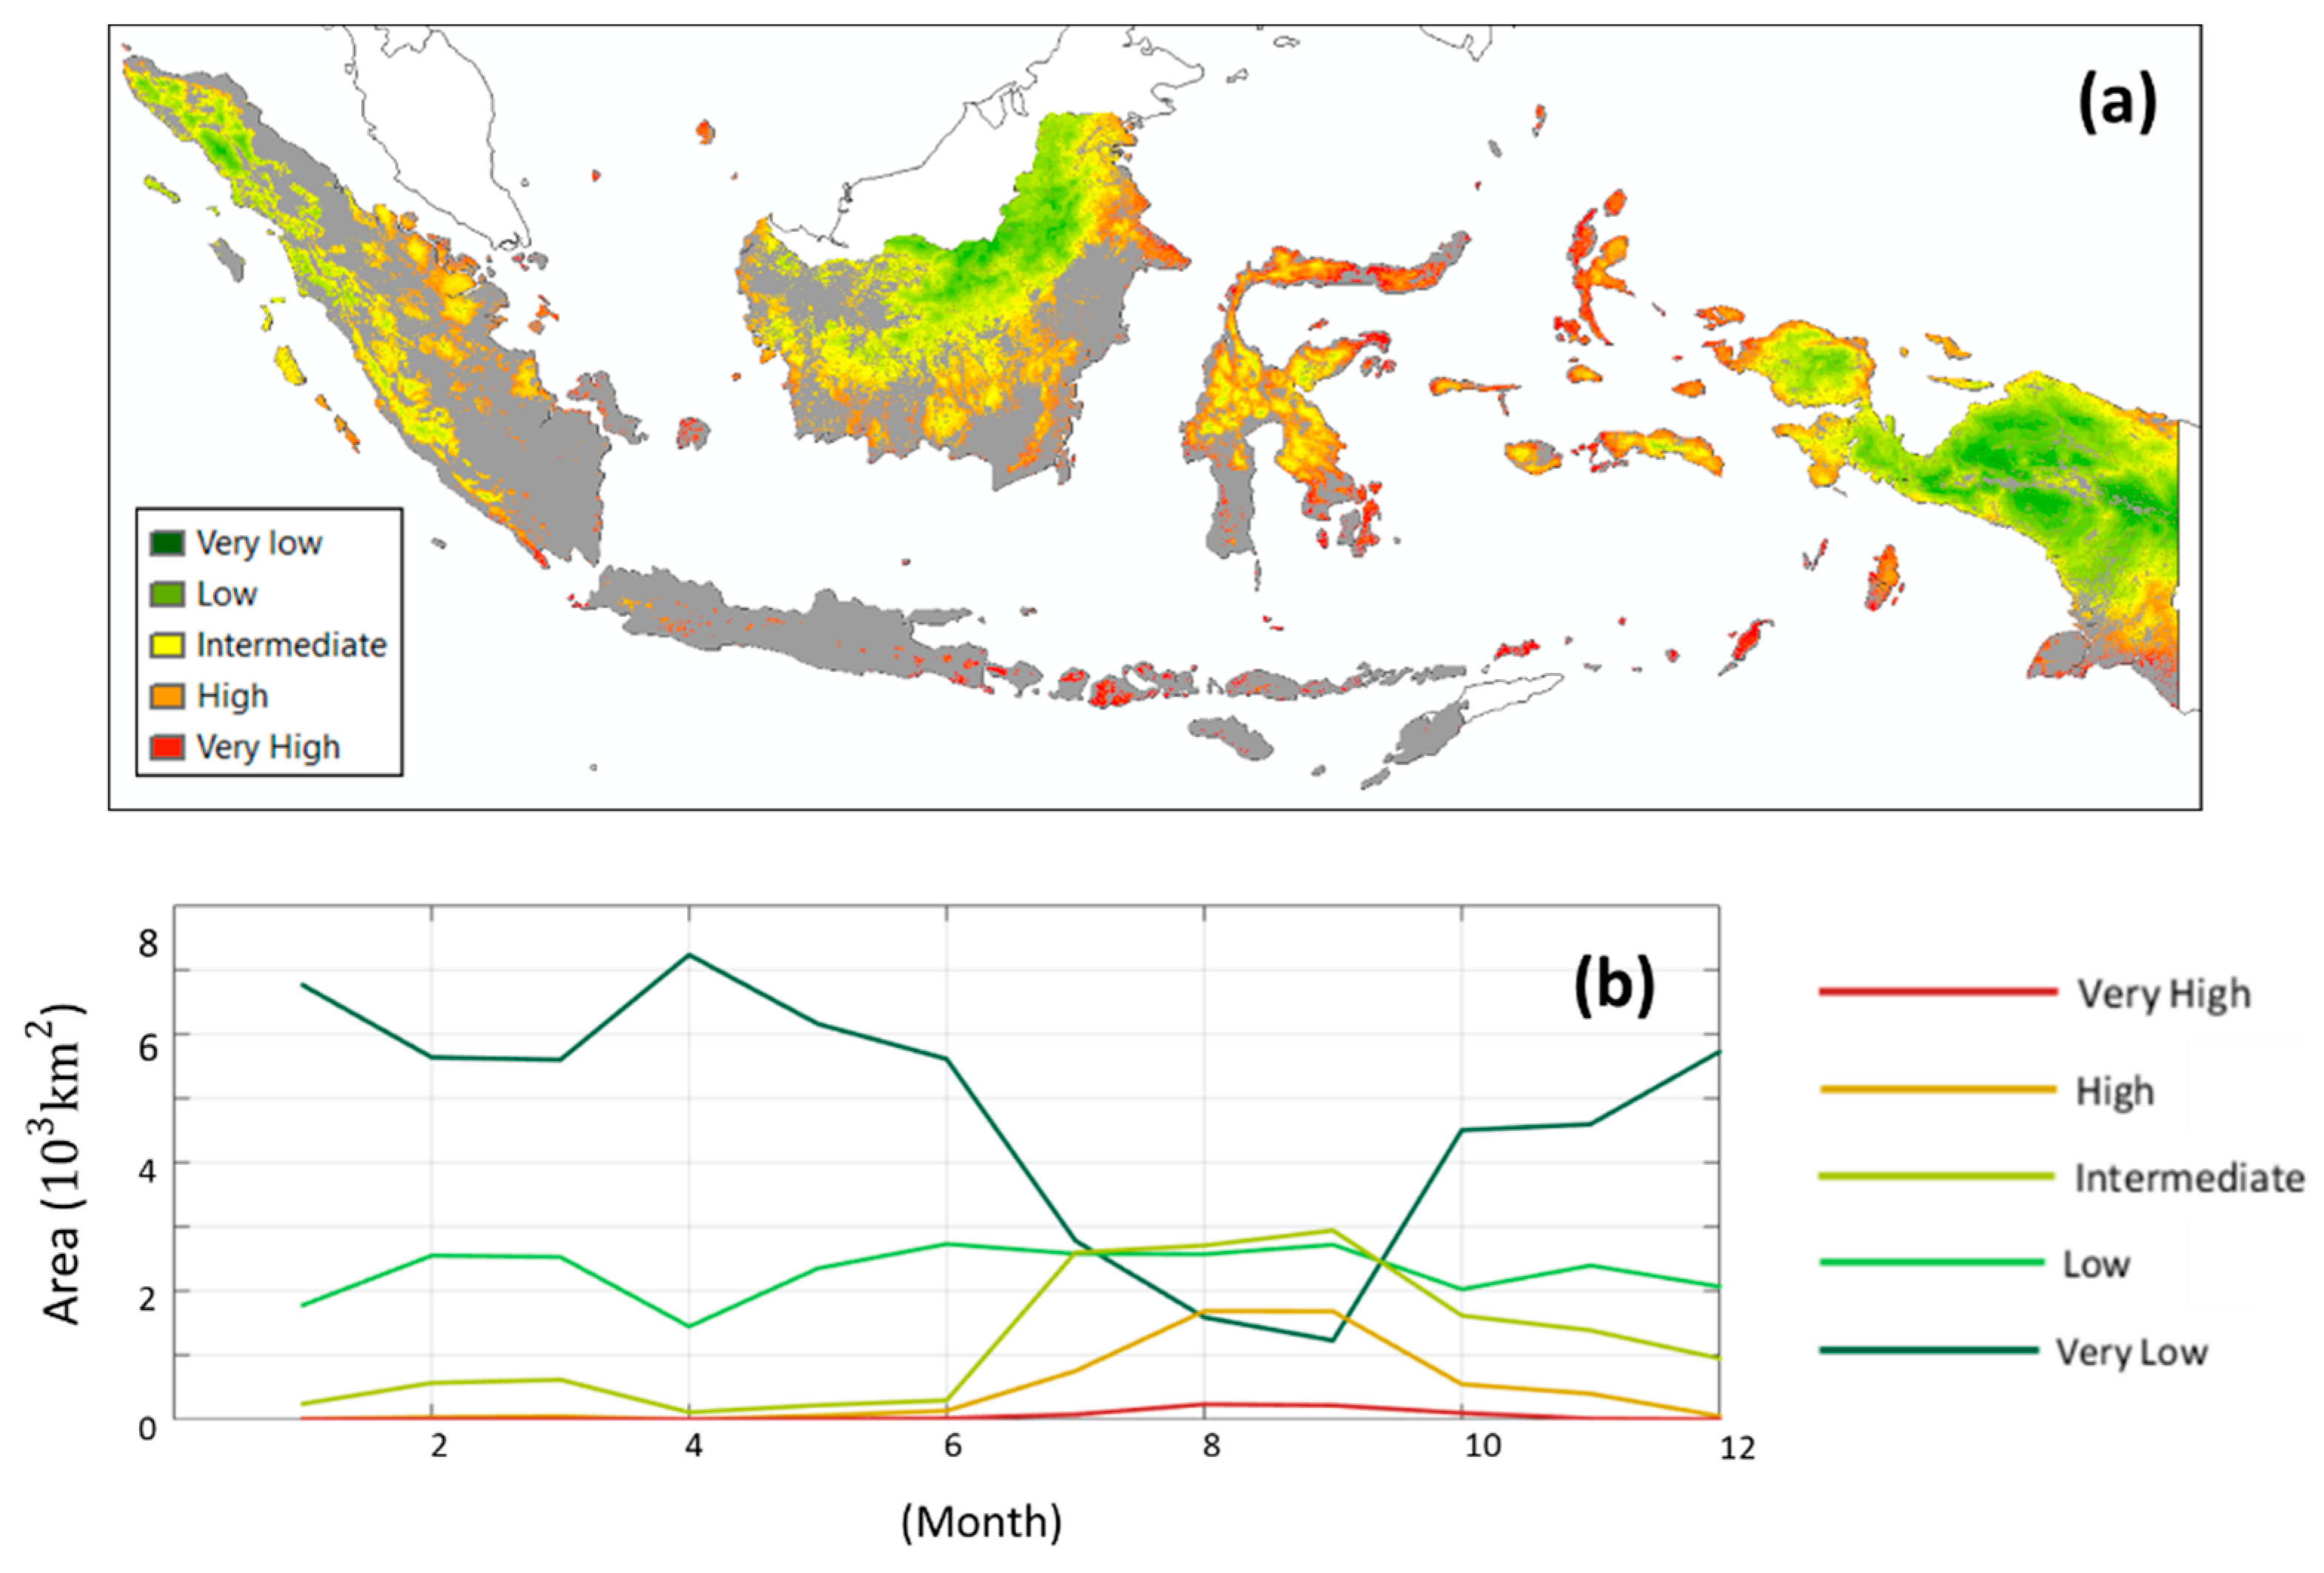
3.1. Wildfire Susceptibility Model
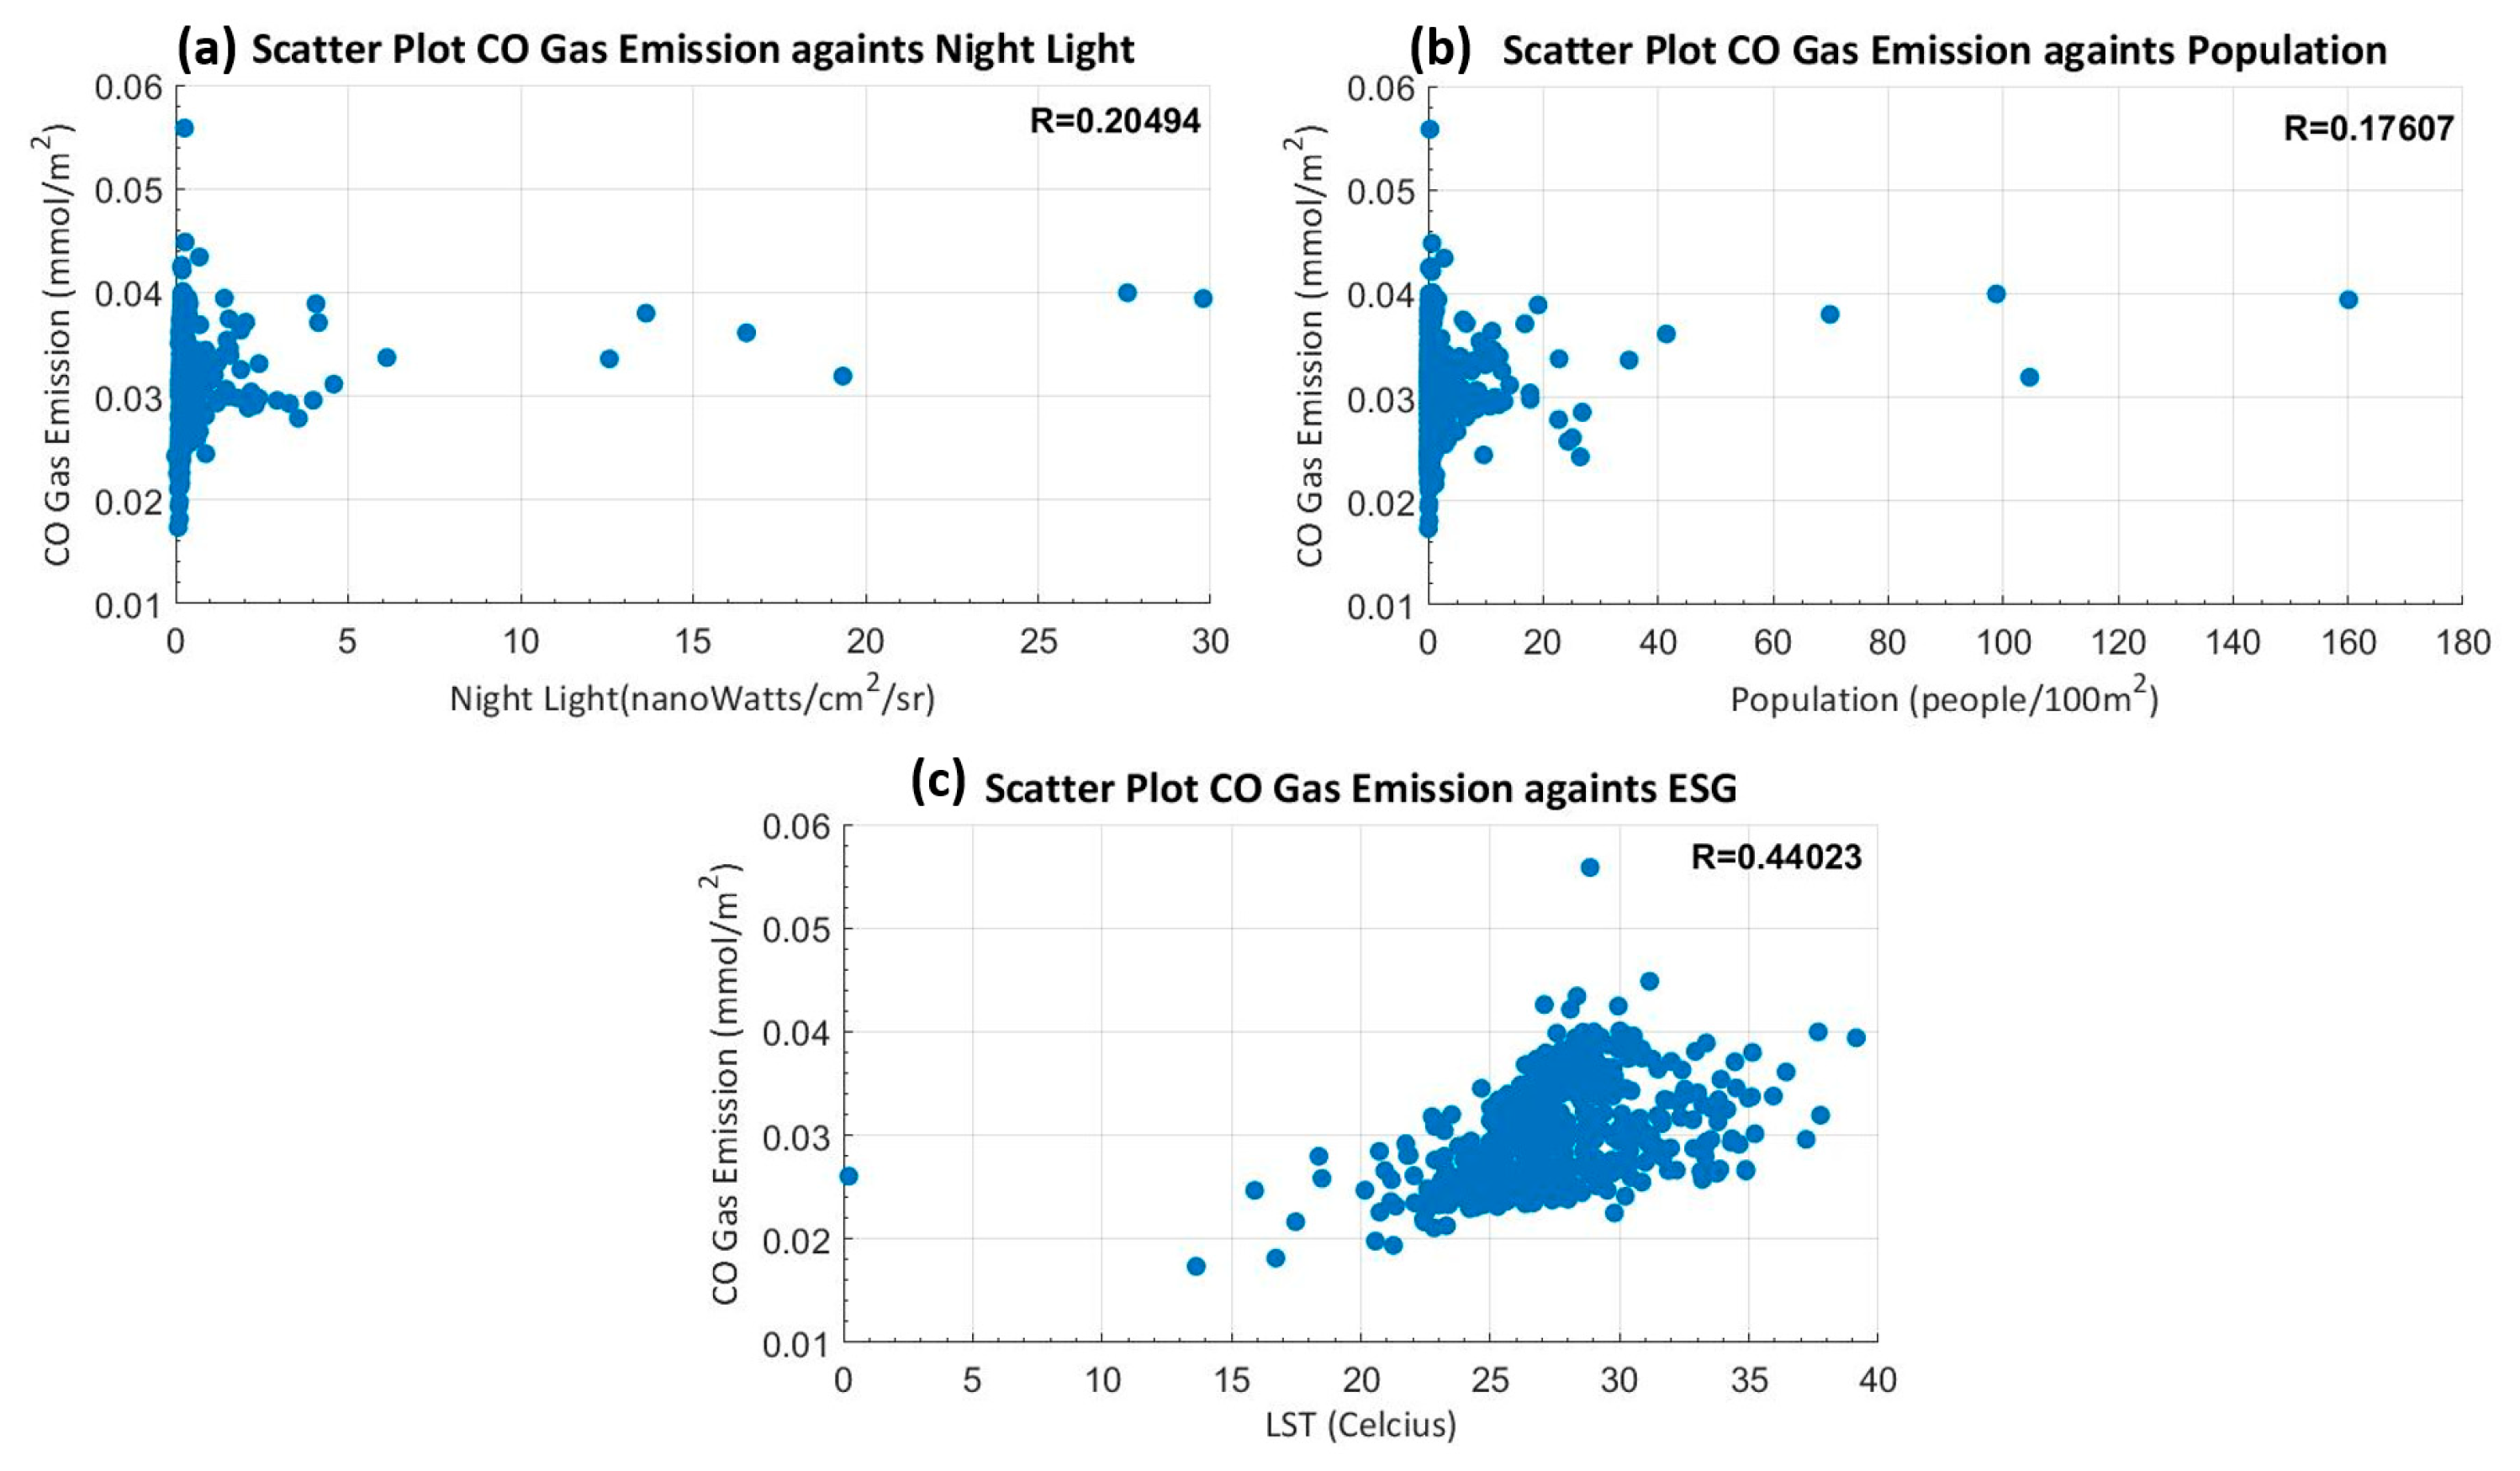
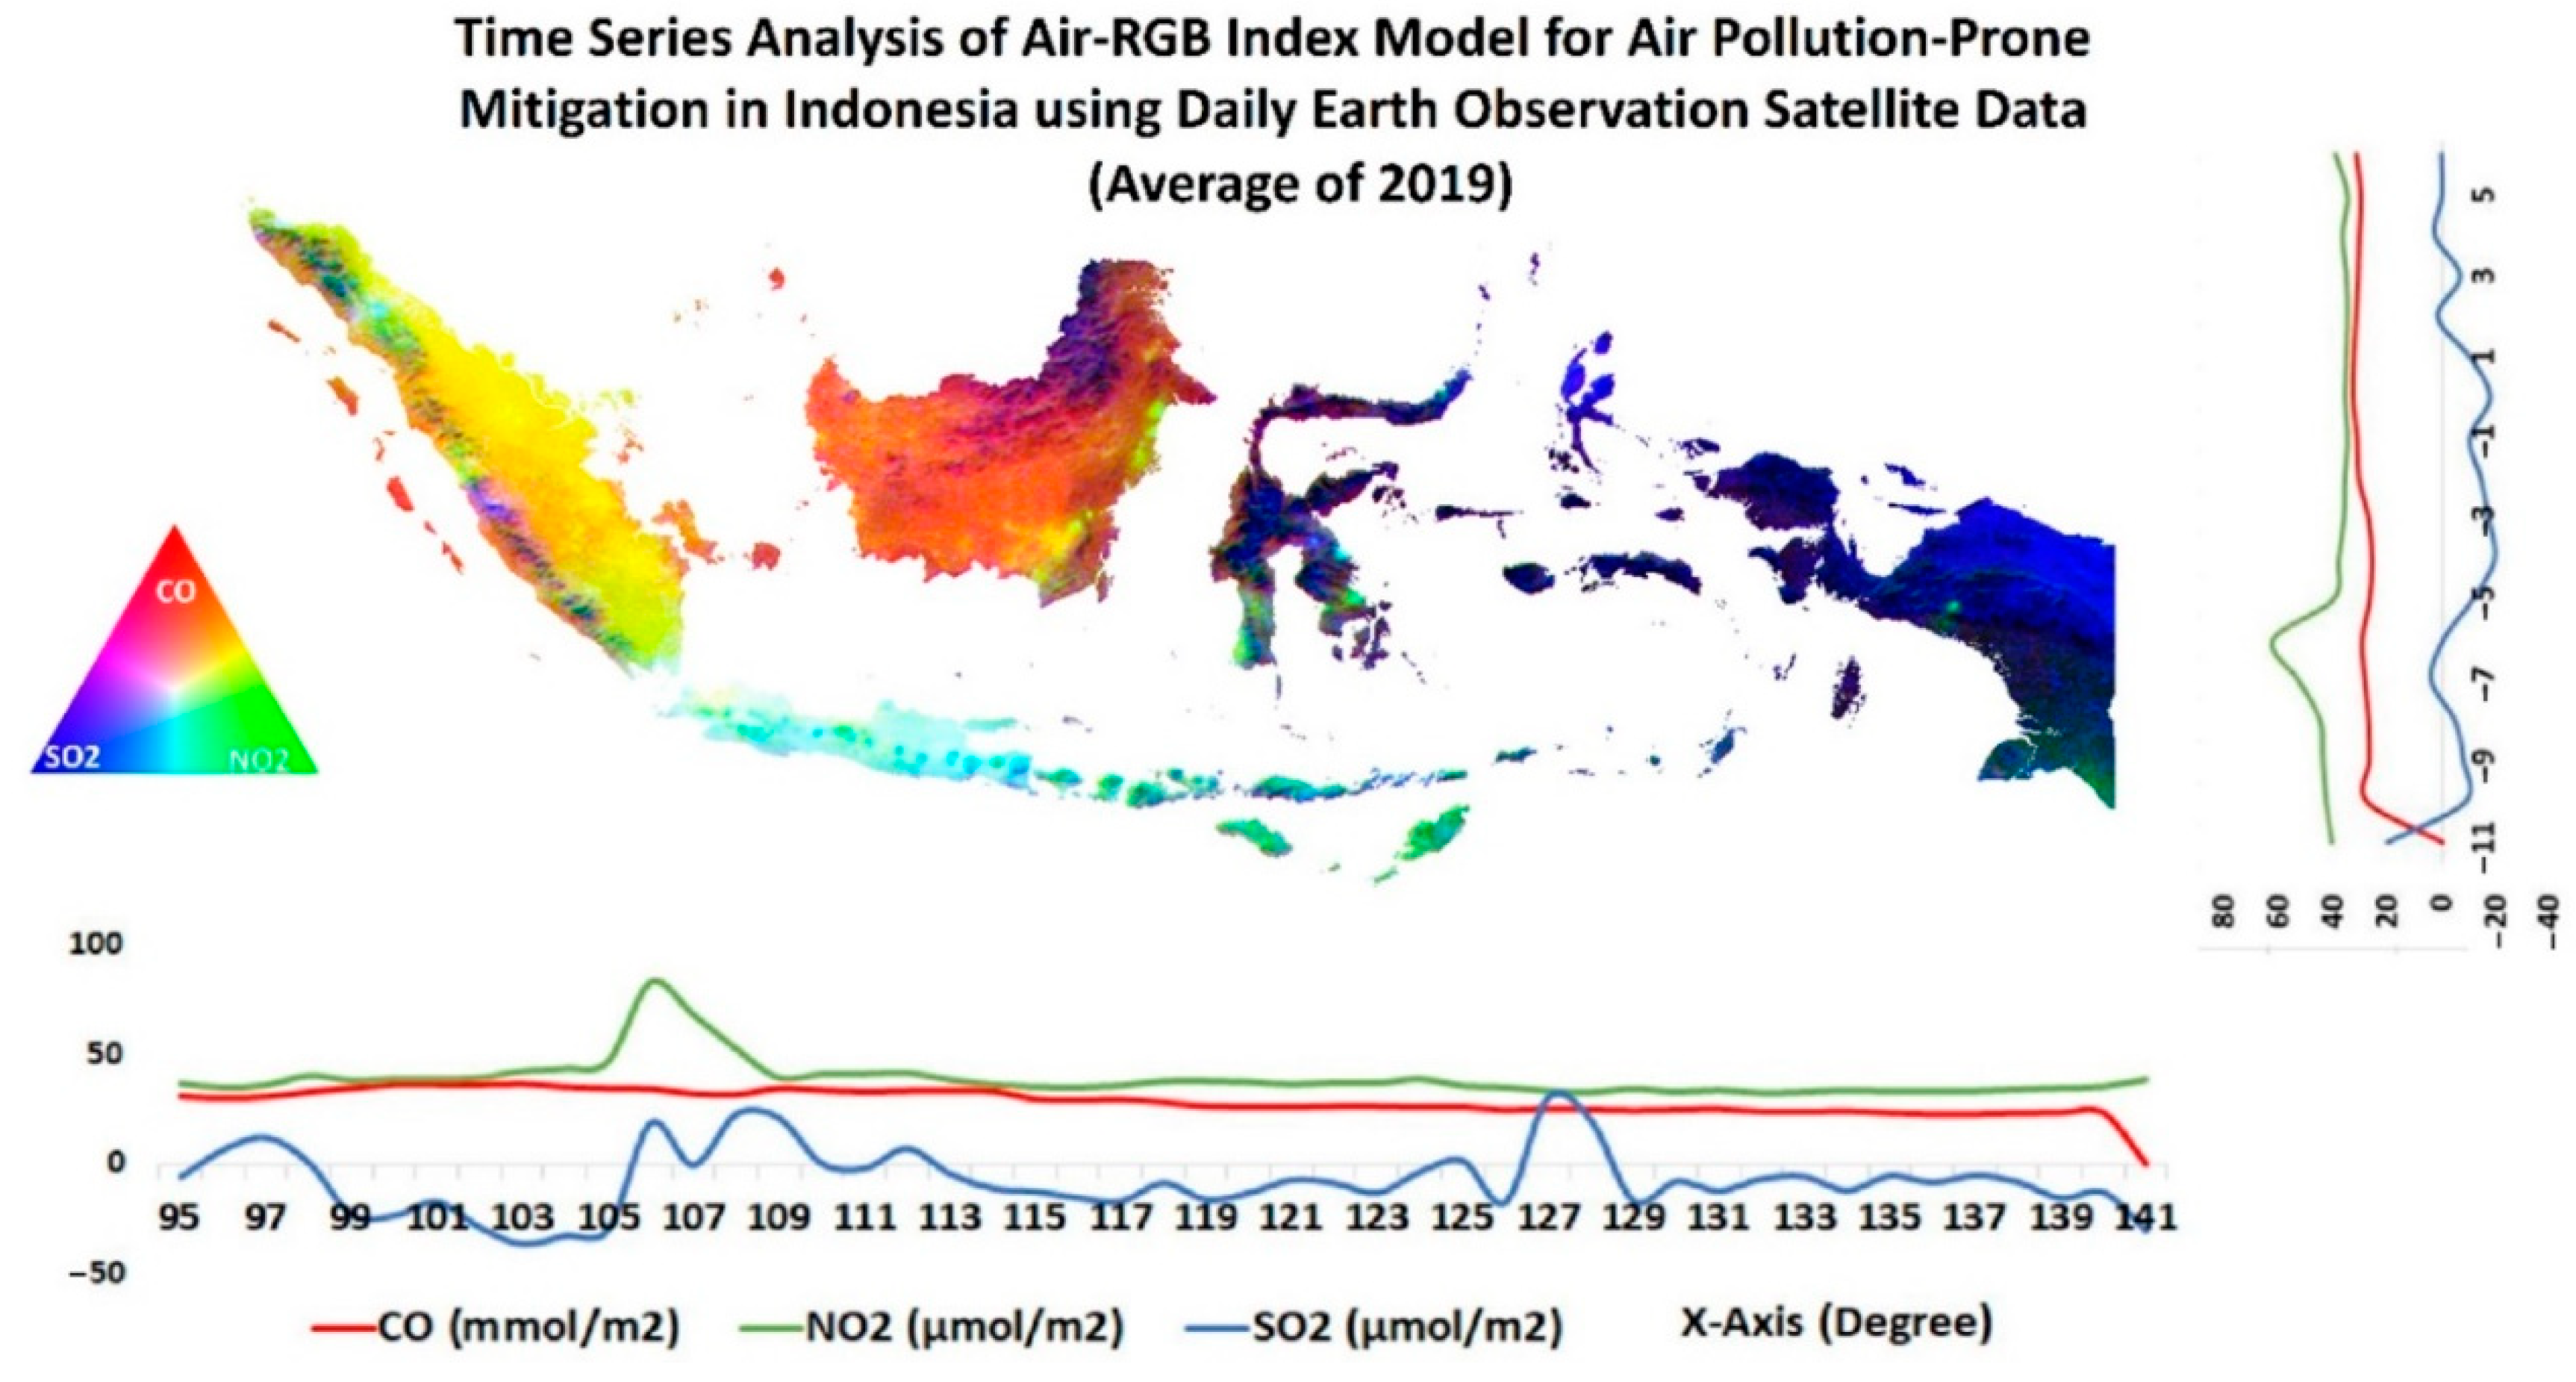
3.2. Carbon Emission Model
3.3. Carbon Stock Model
3.4. Priority Model for Wildfire Mitigation
4. Discussion
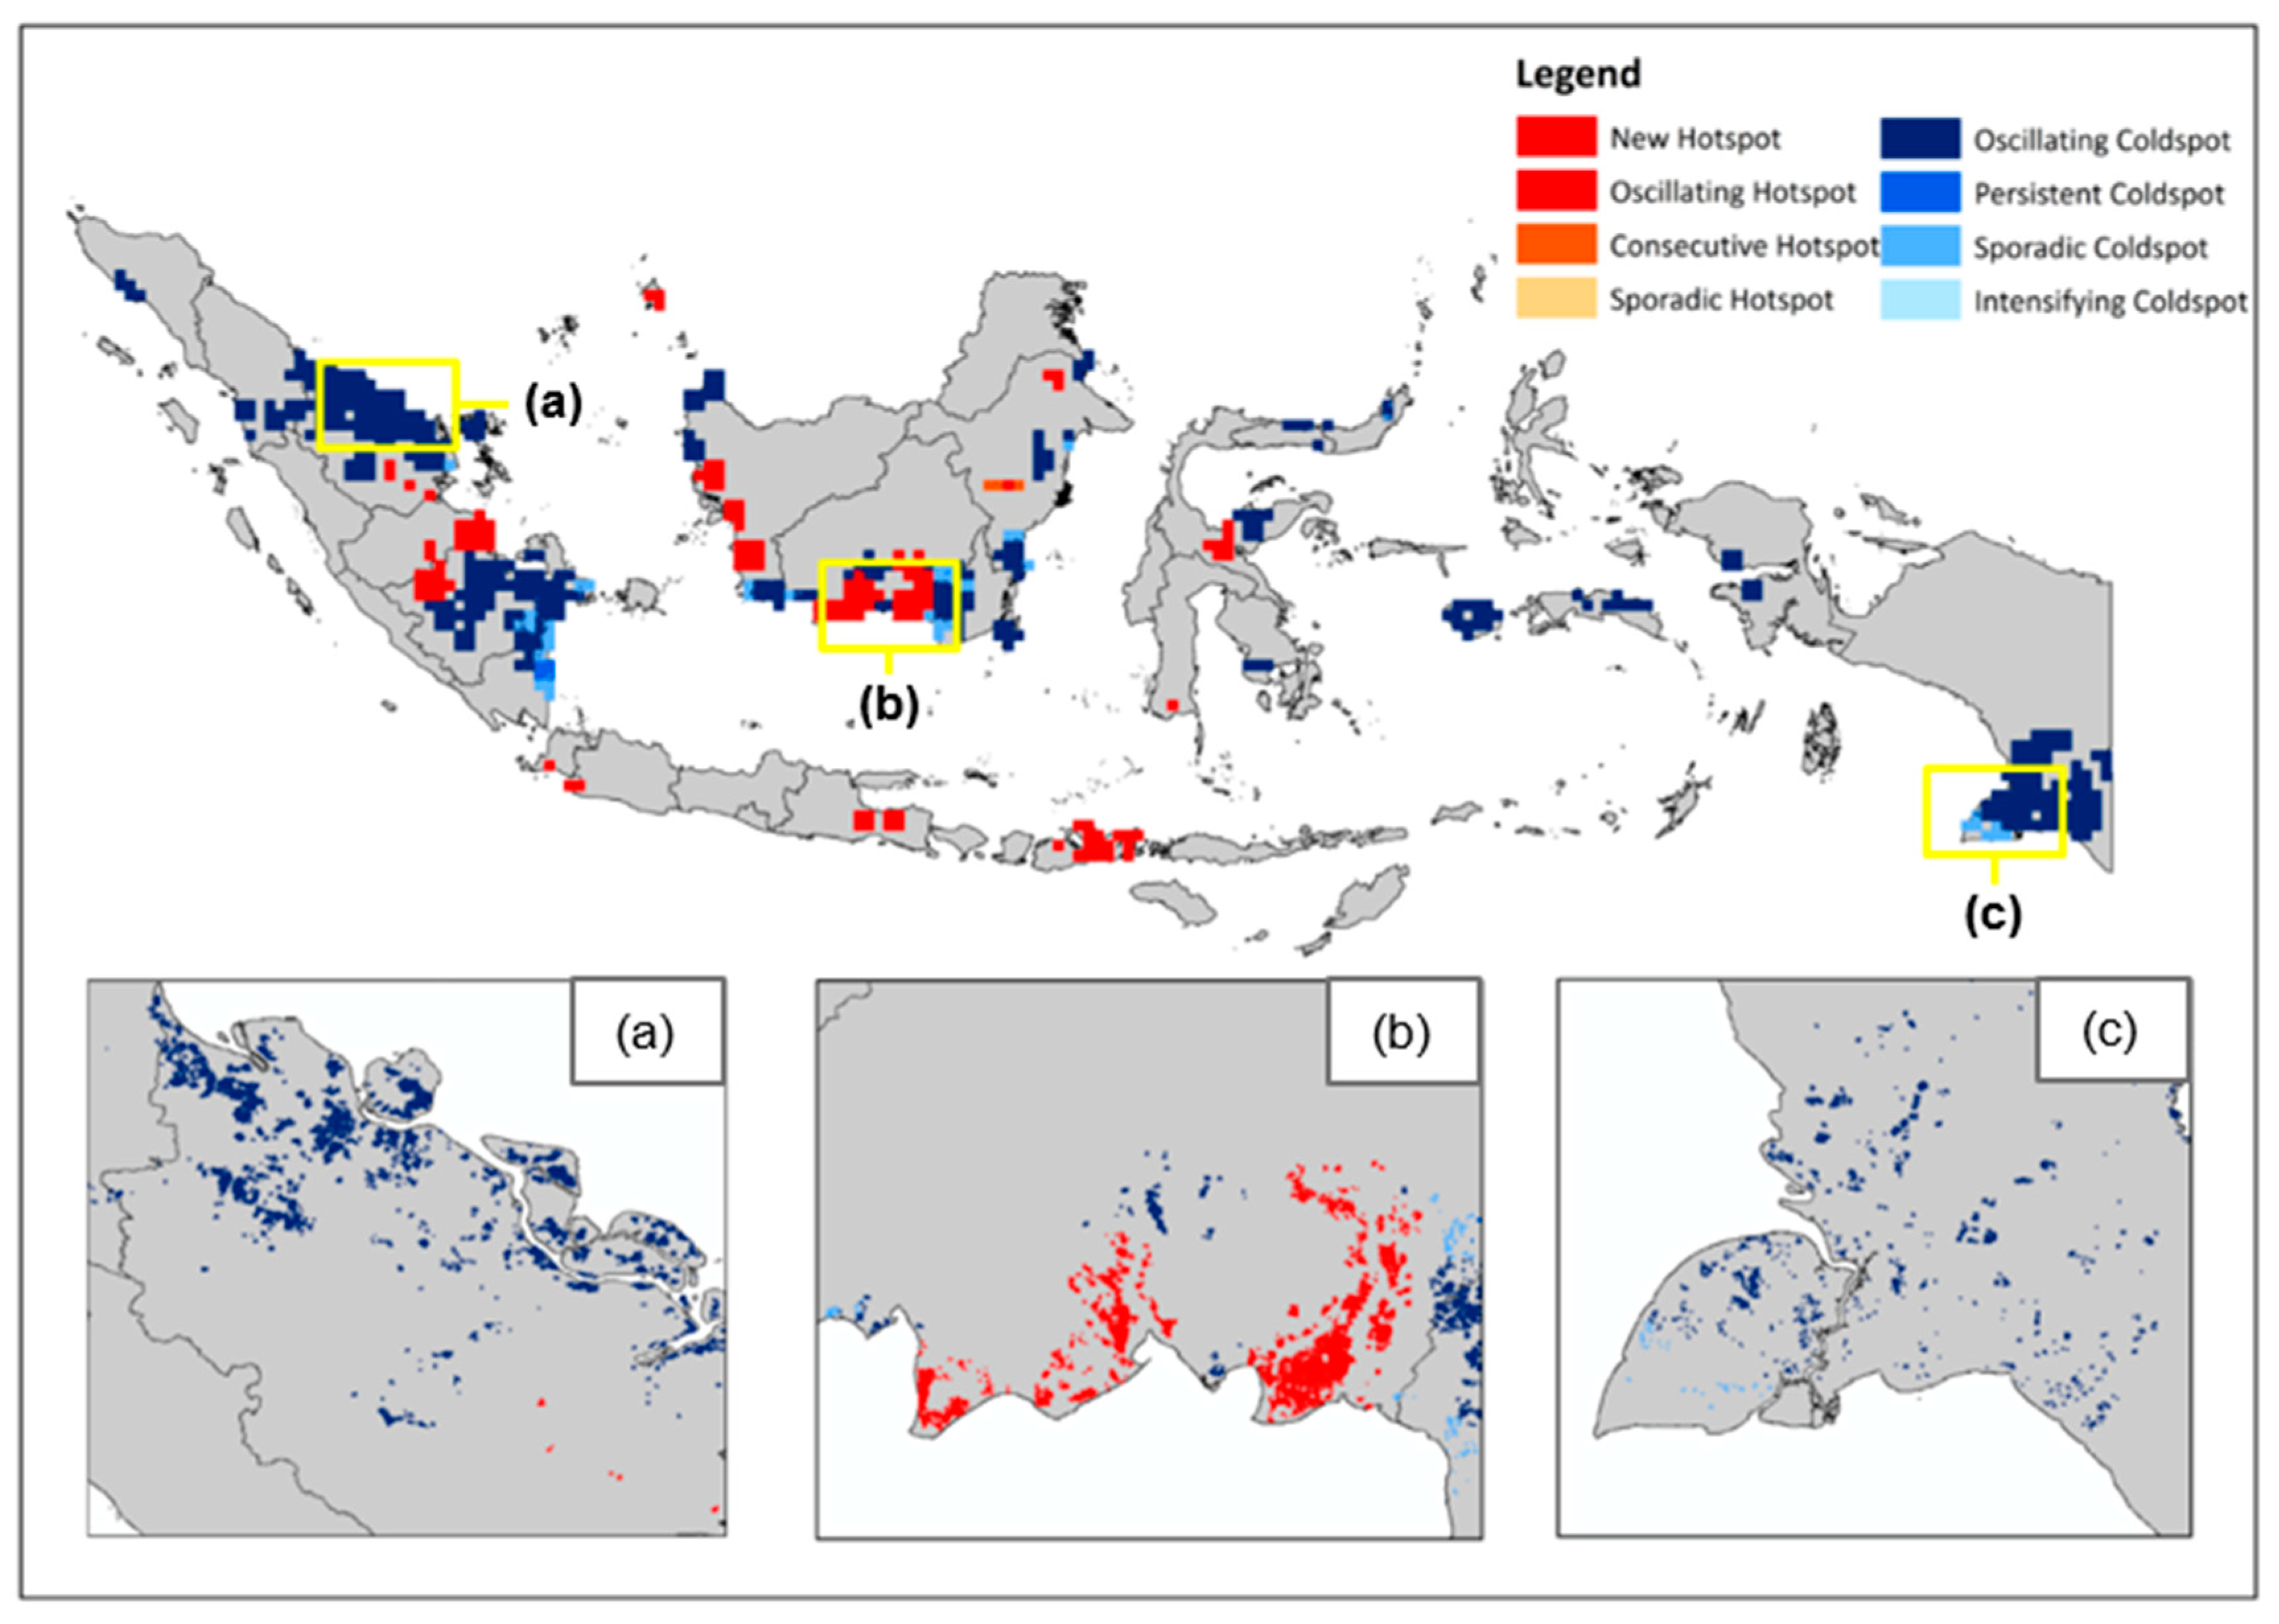
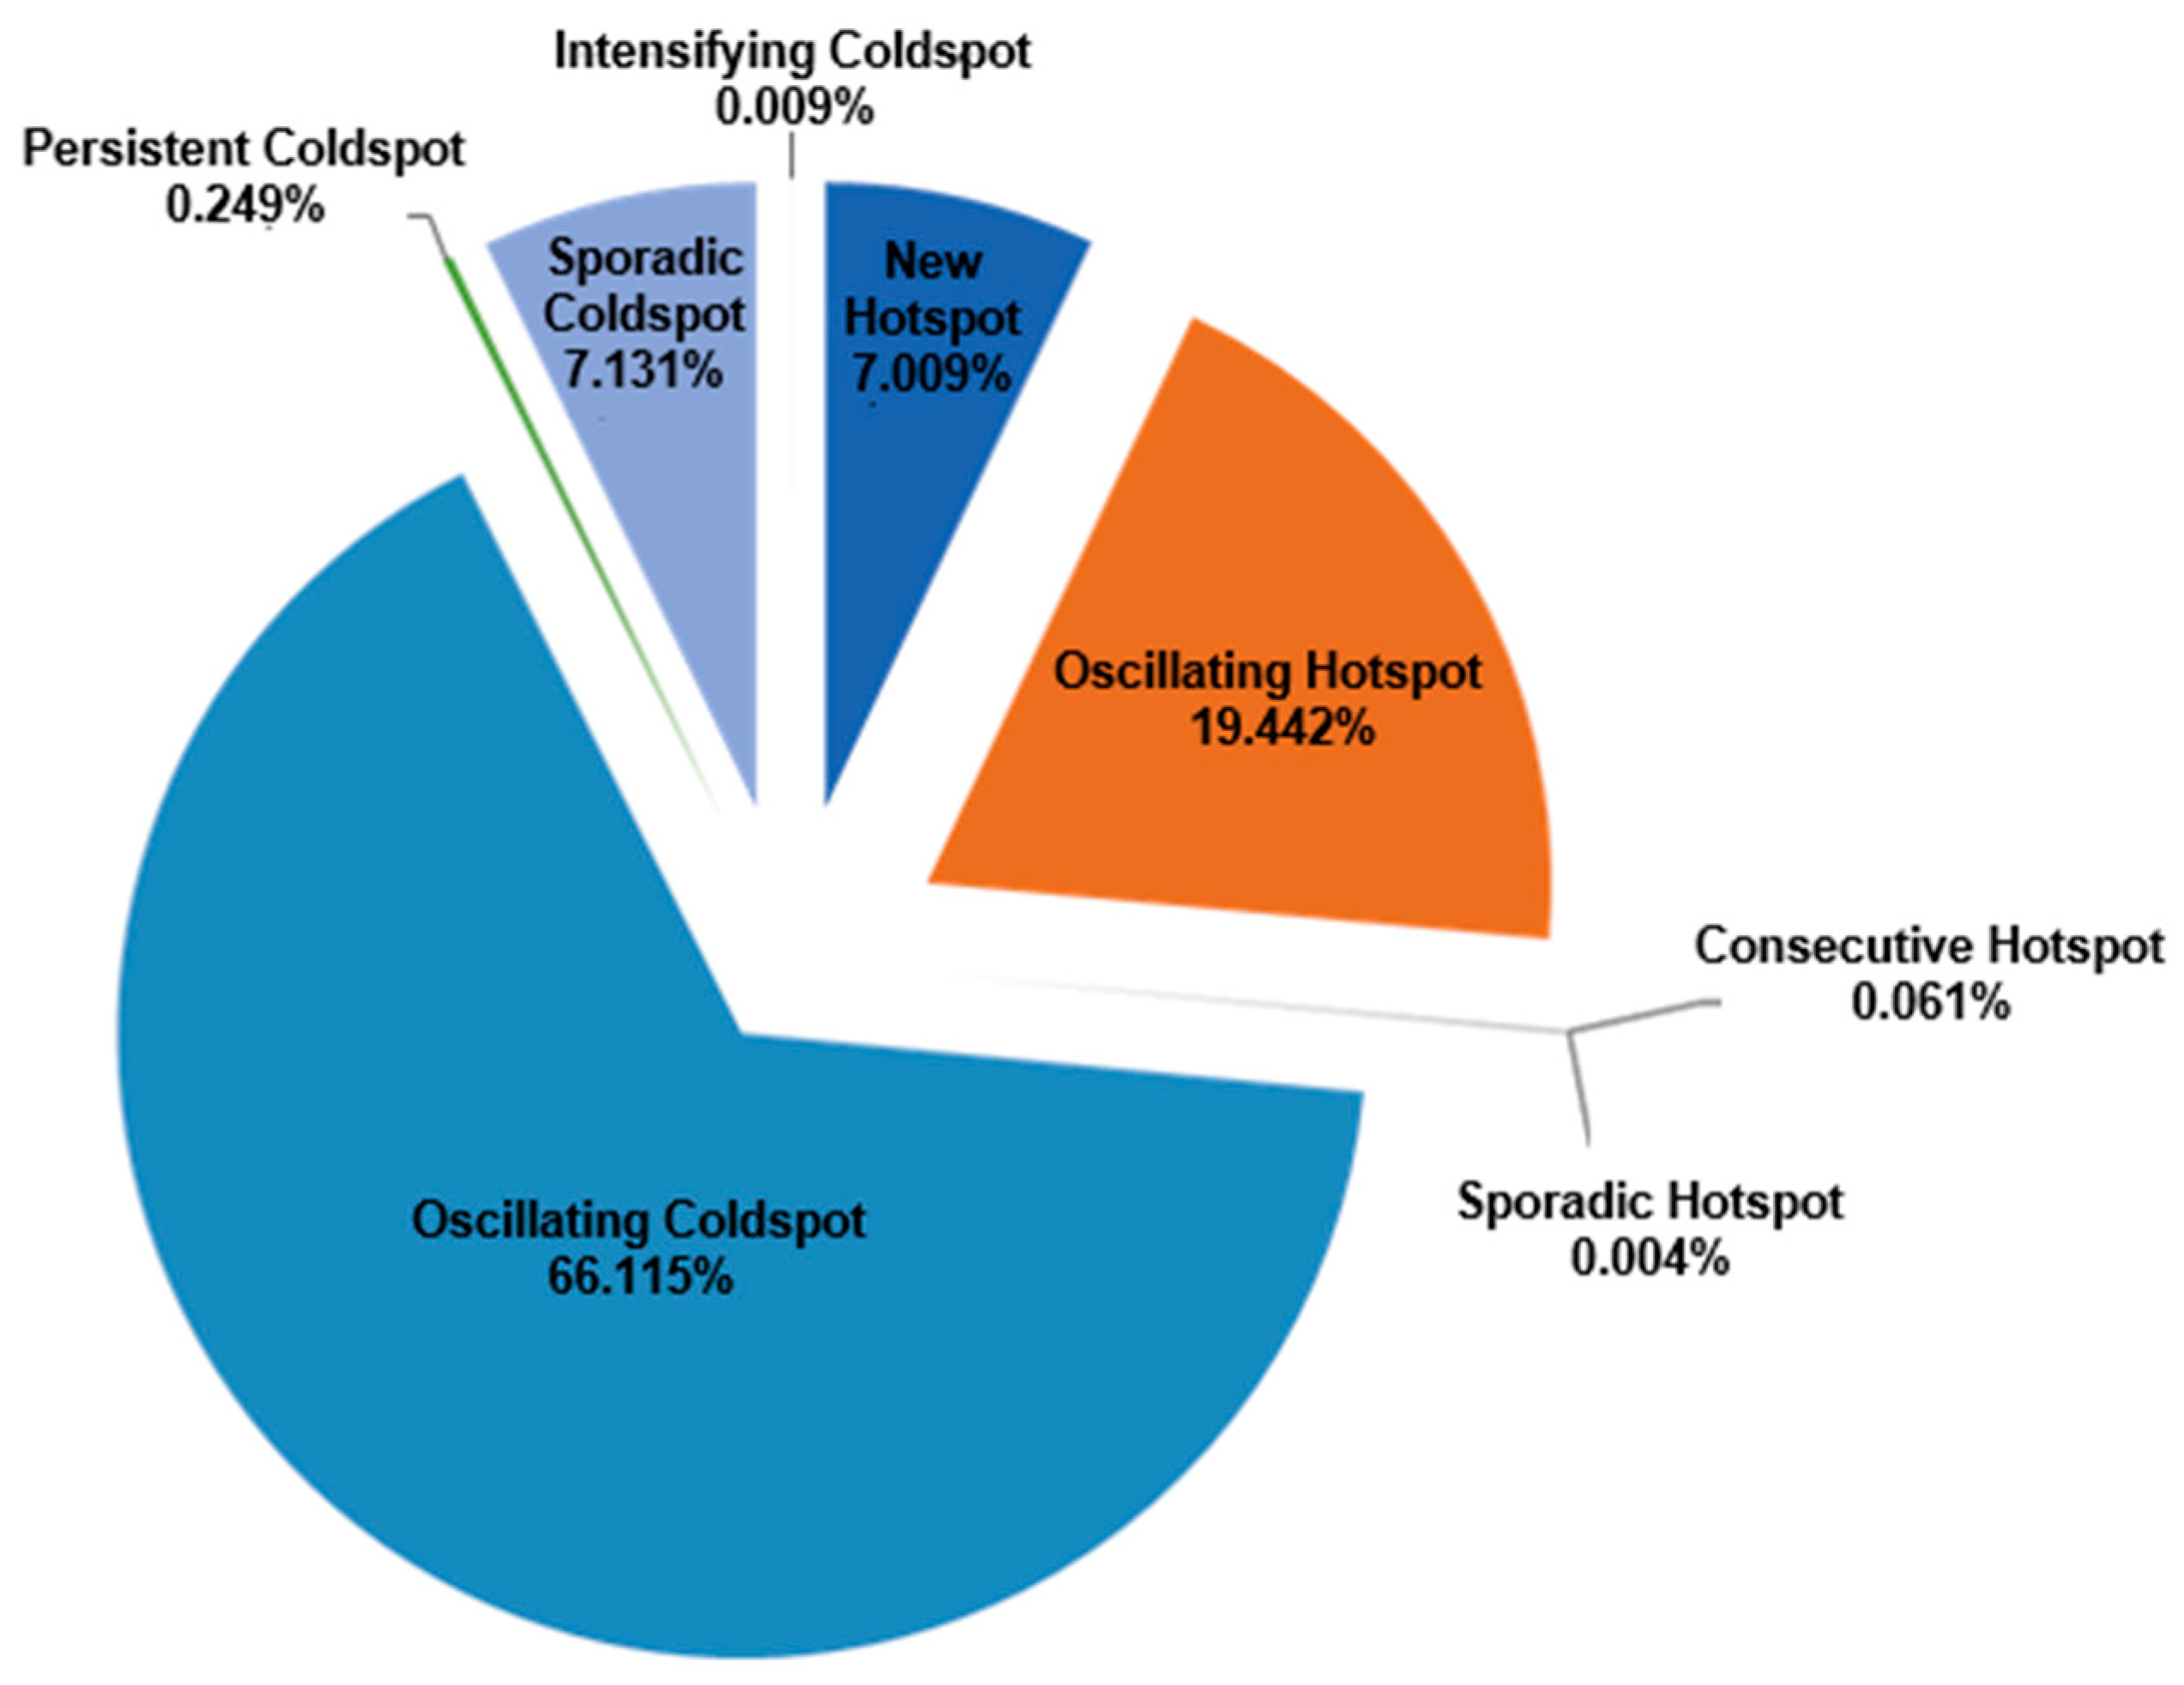
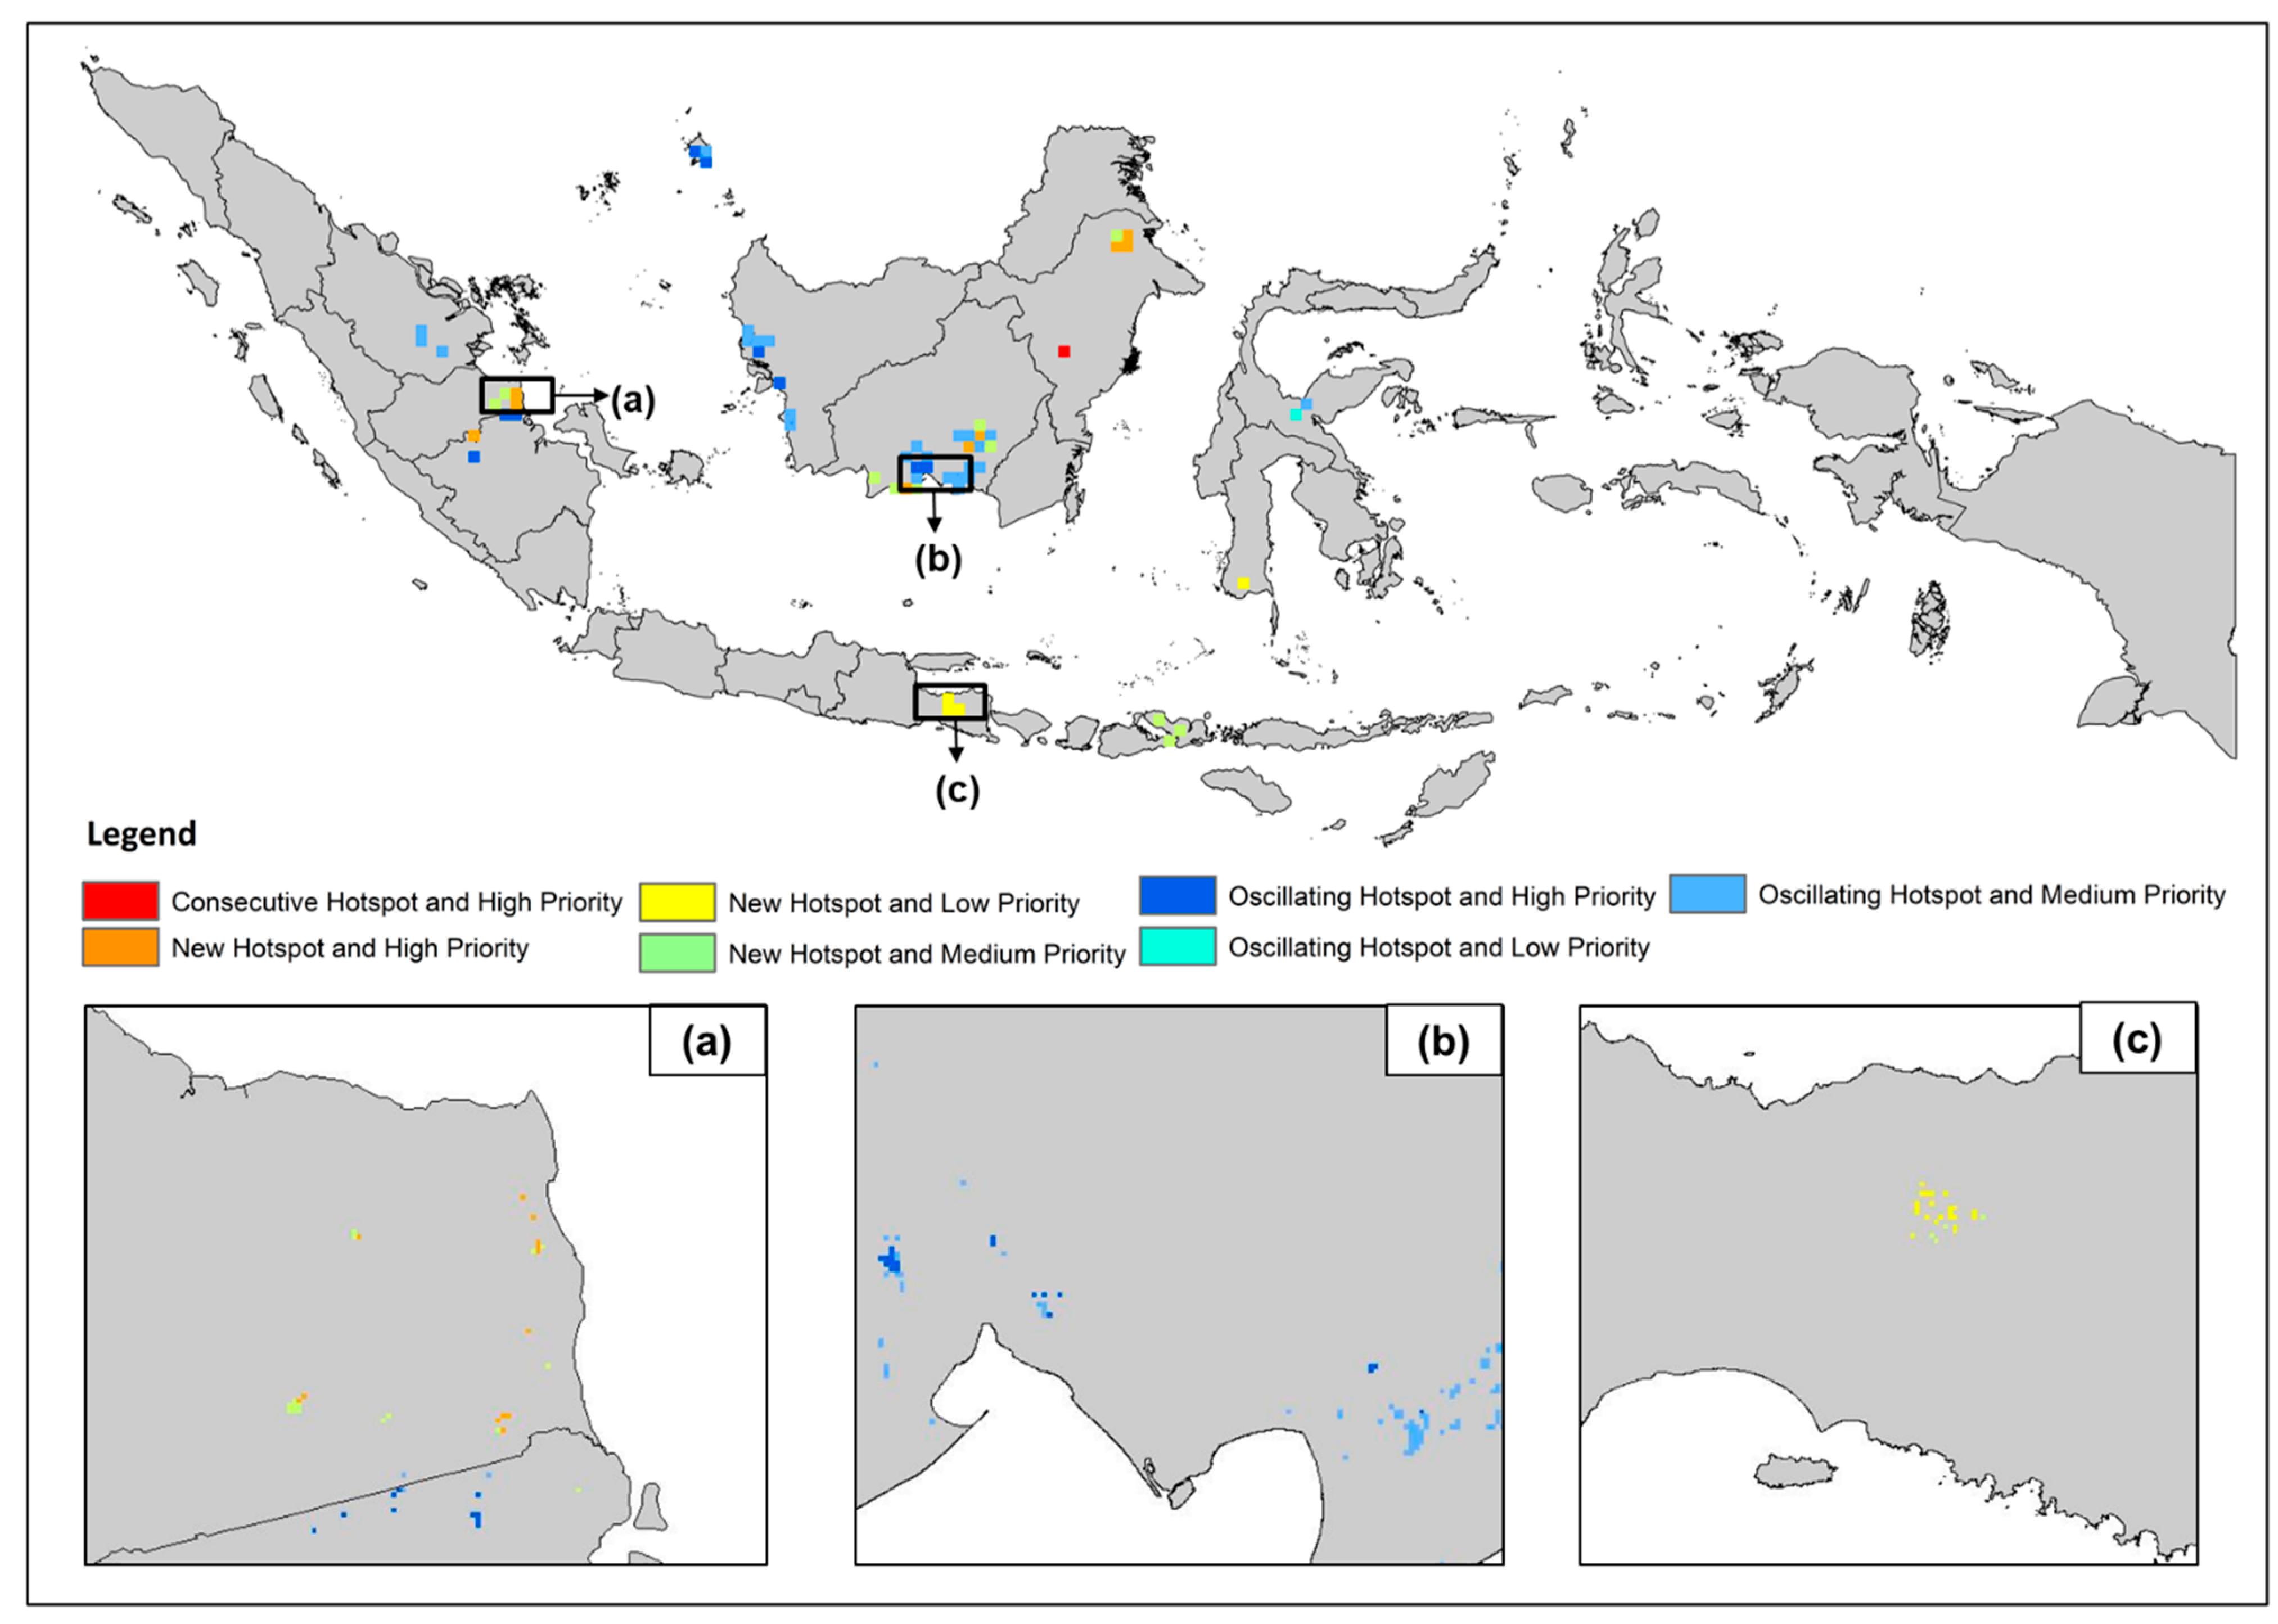
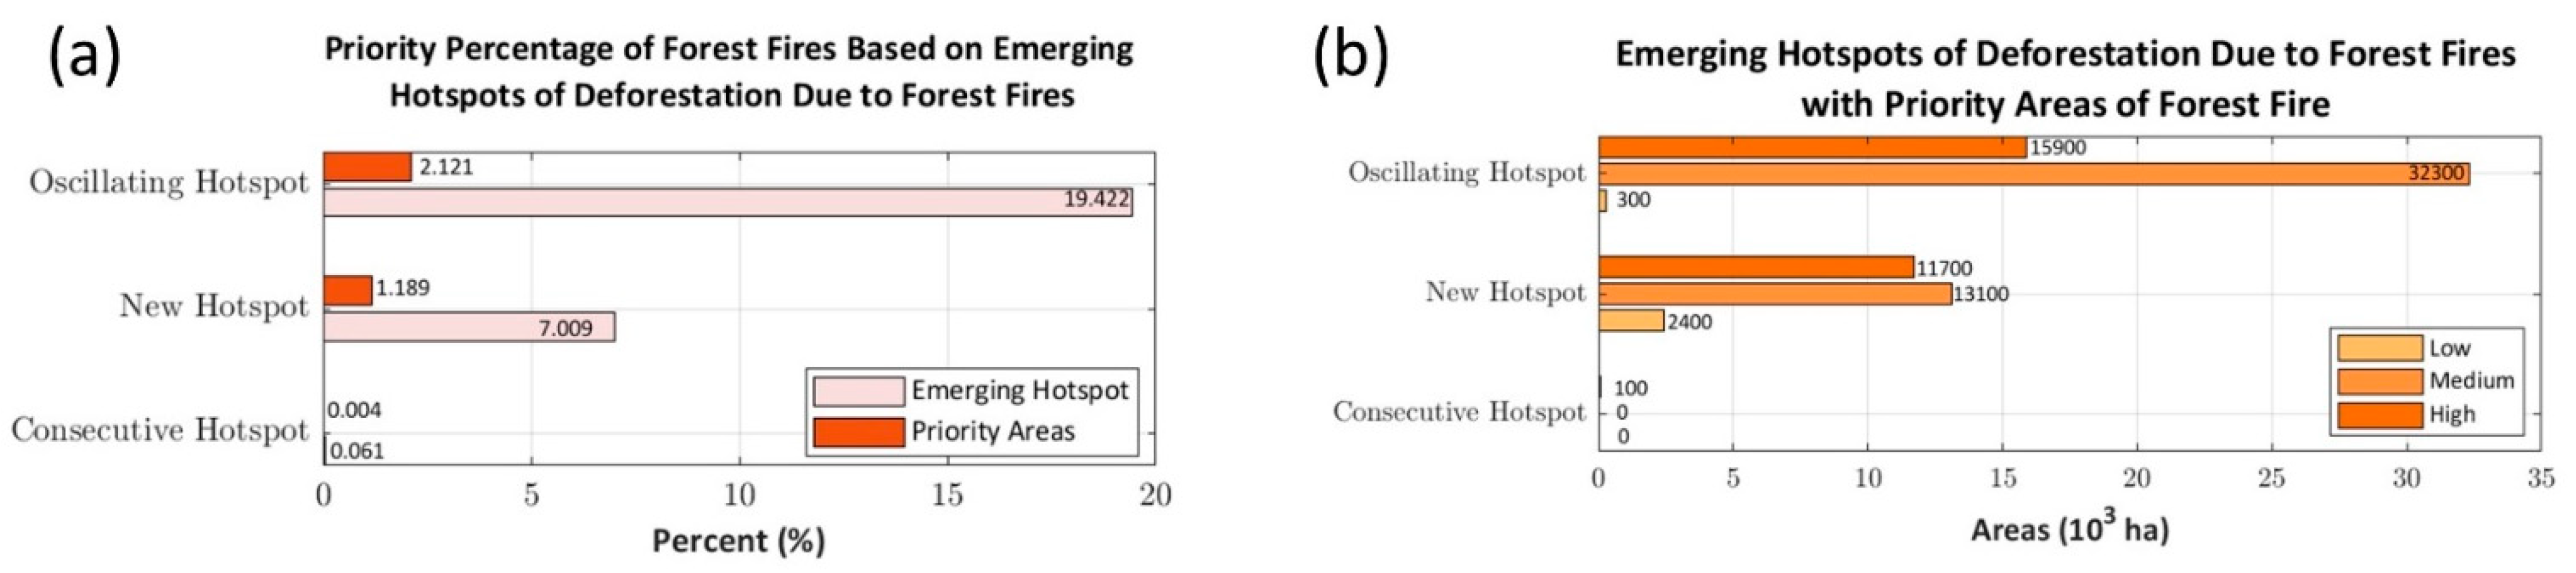
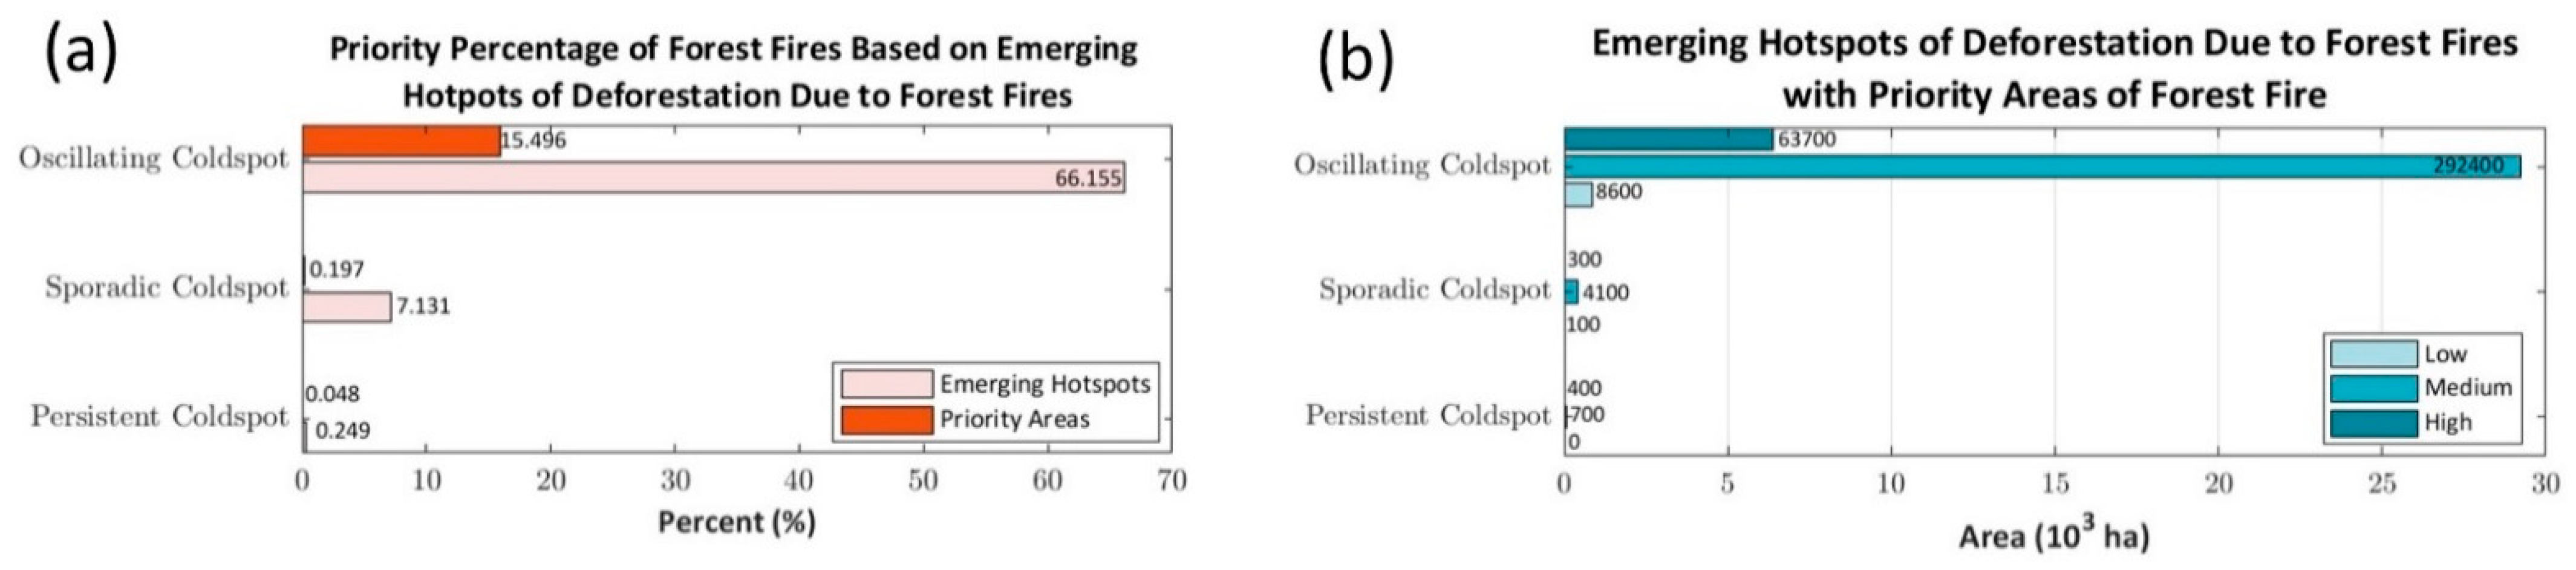
4.1. Emerging Hotspots of Deforestation
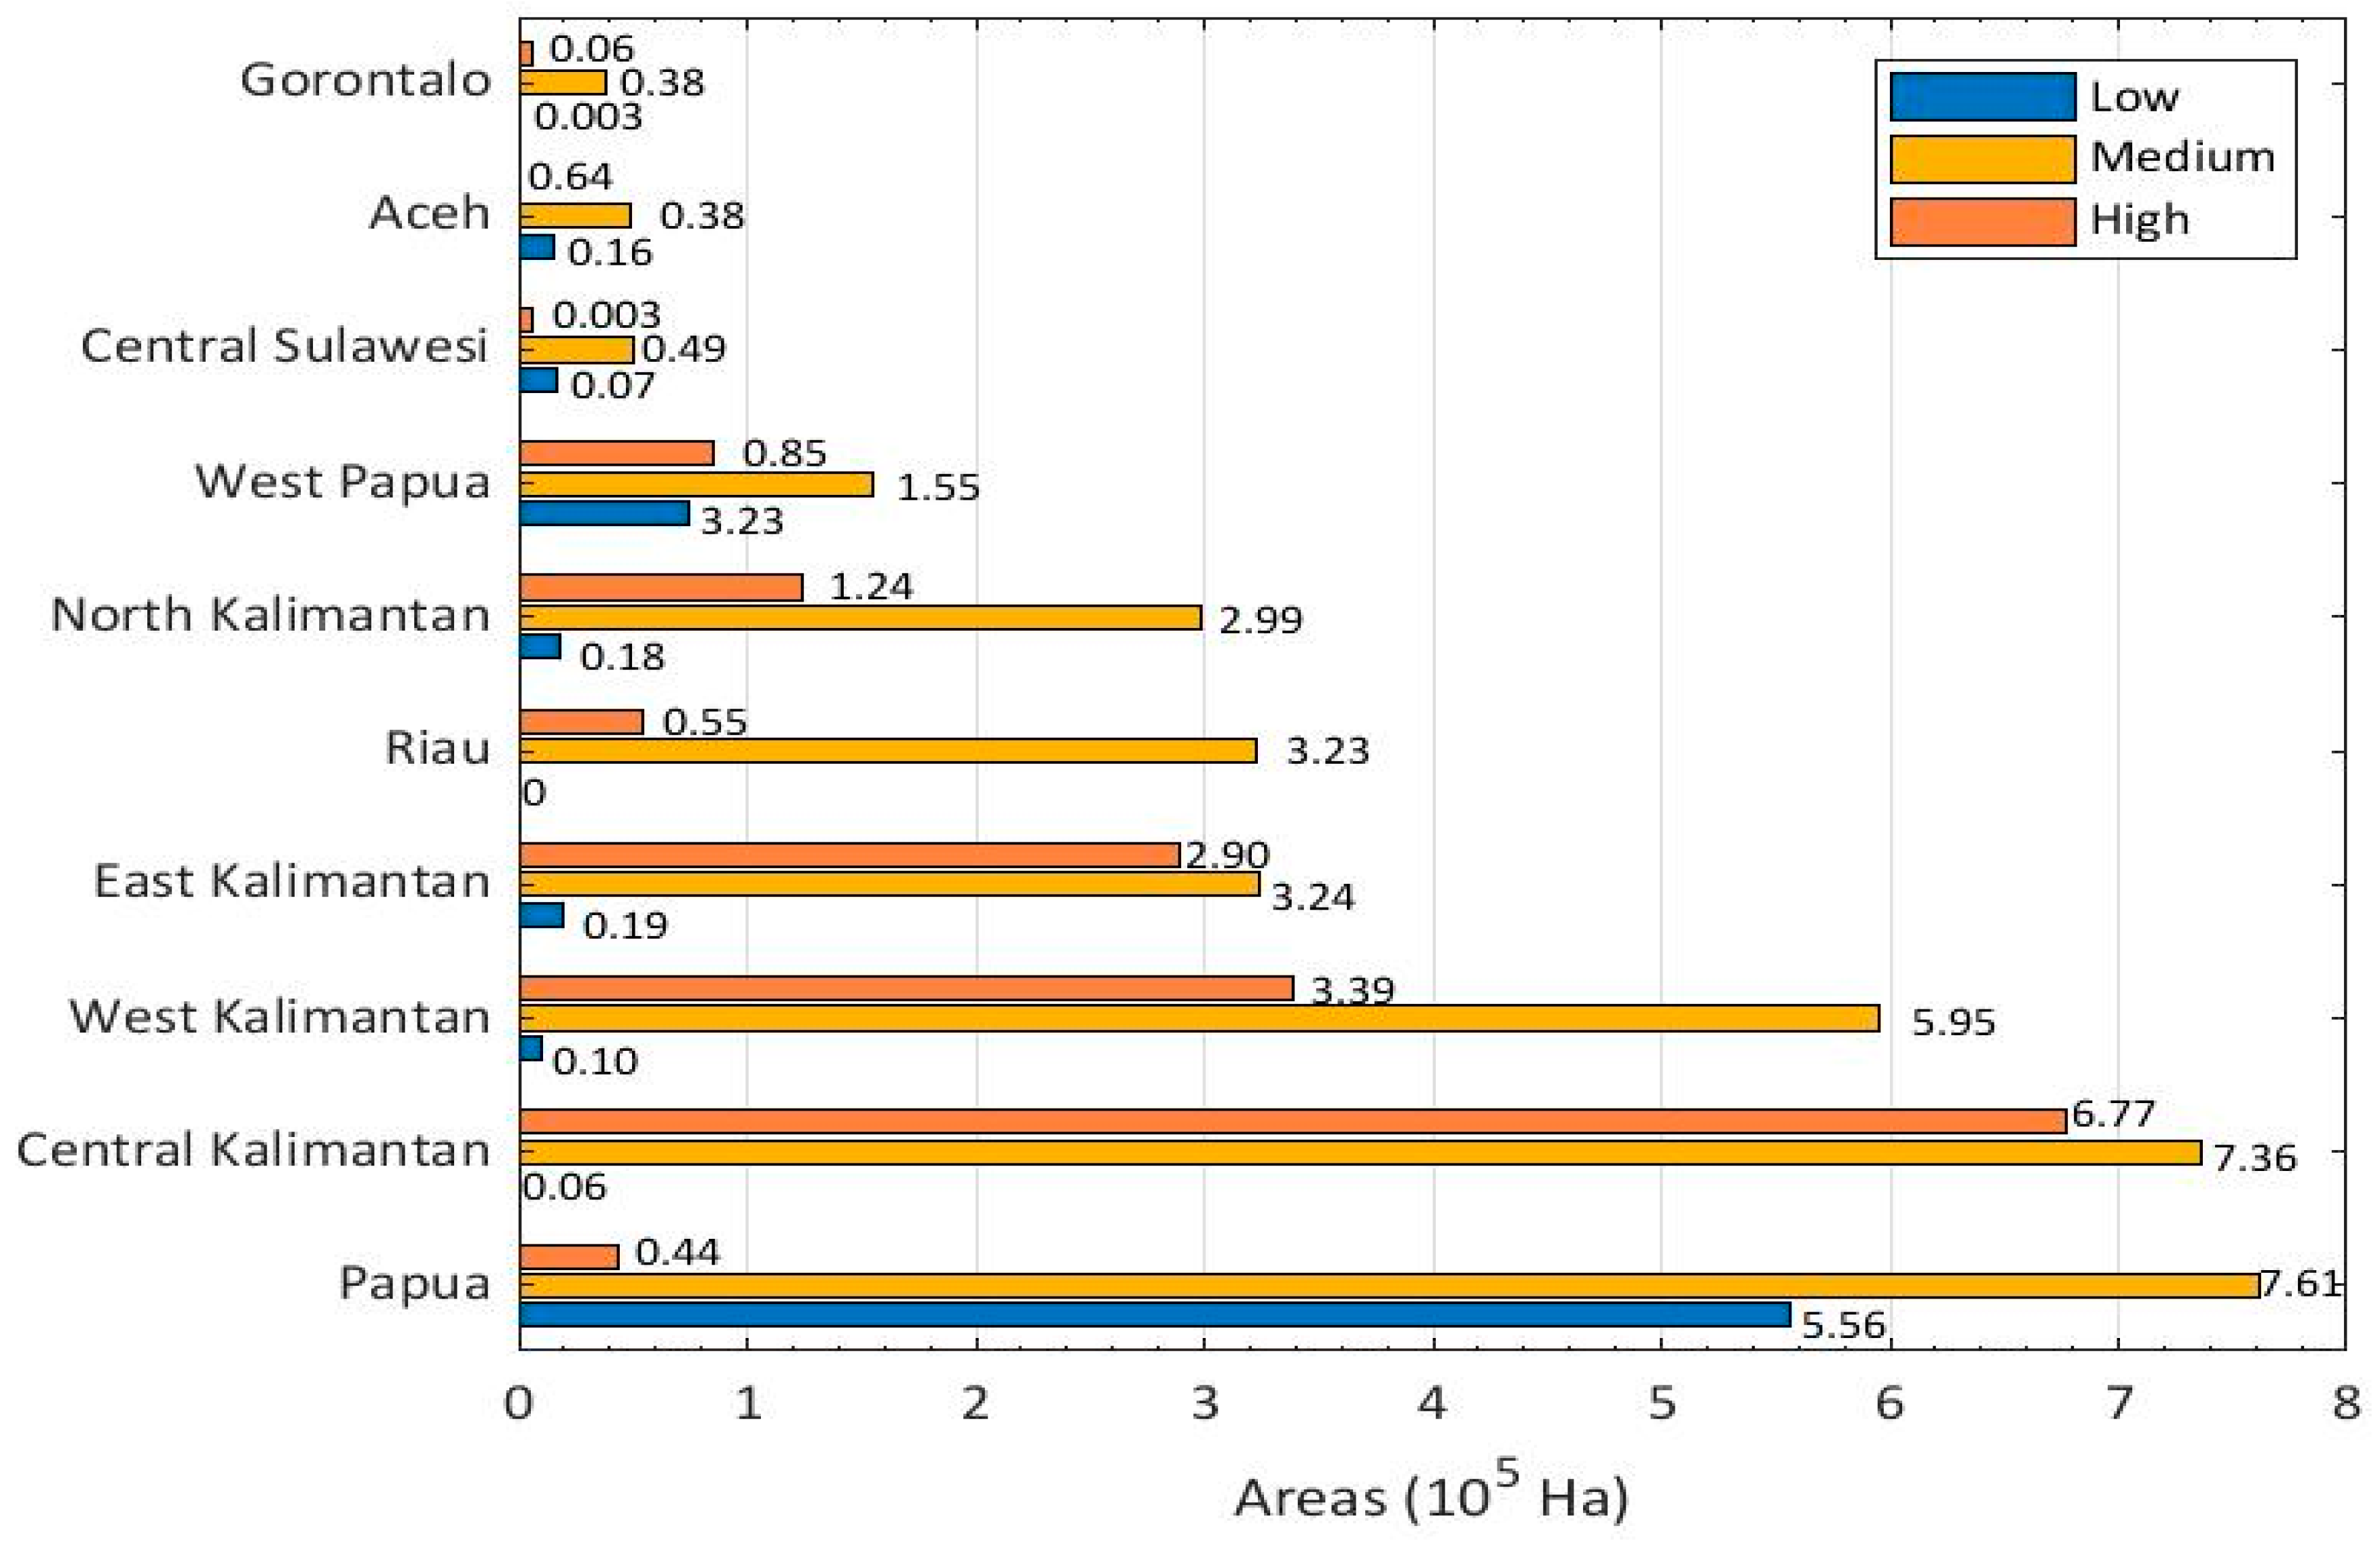
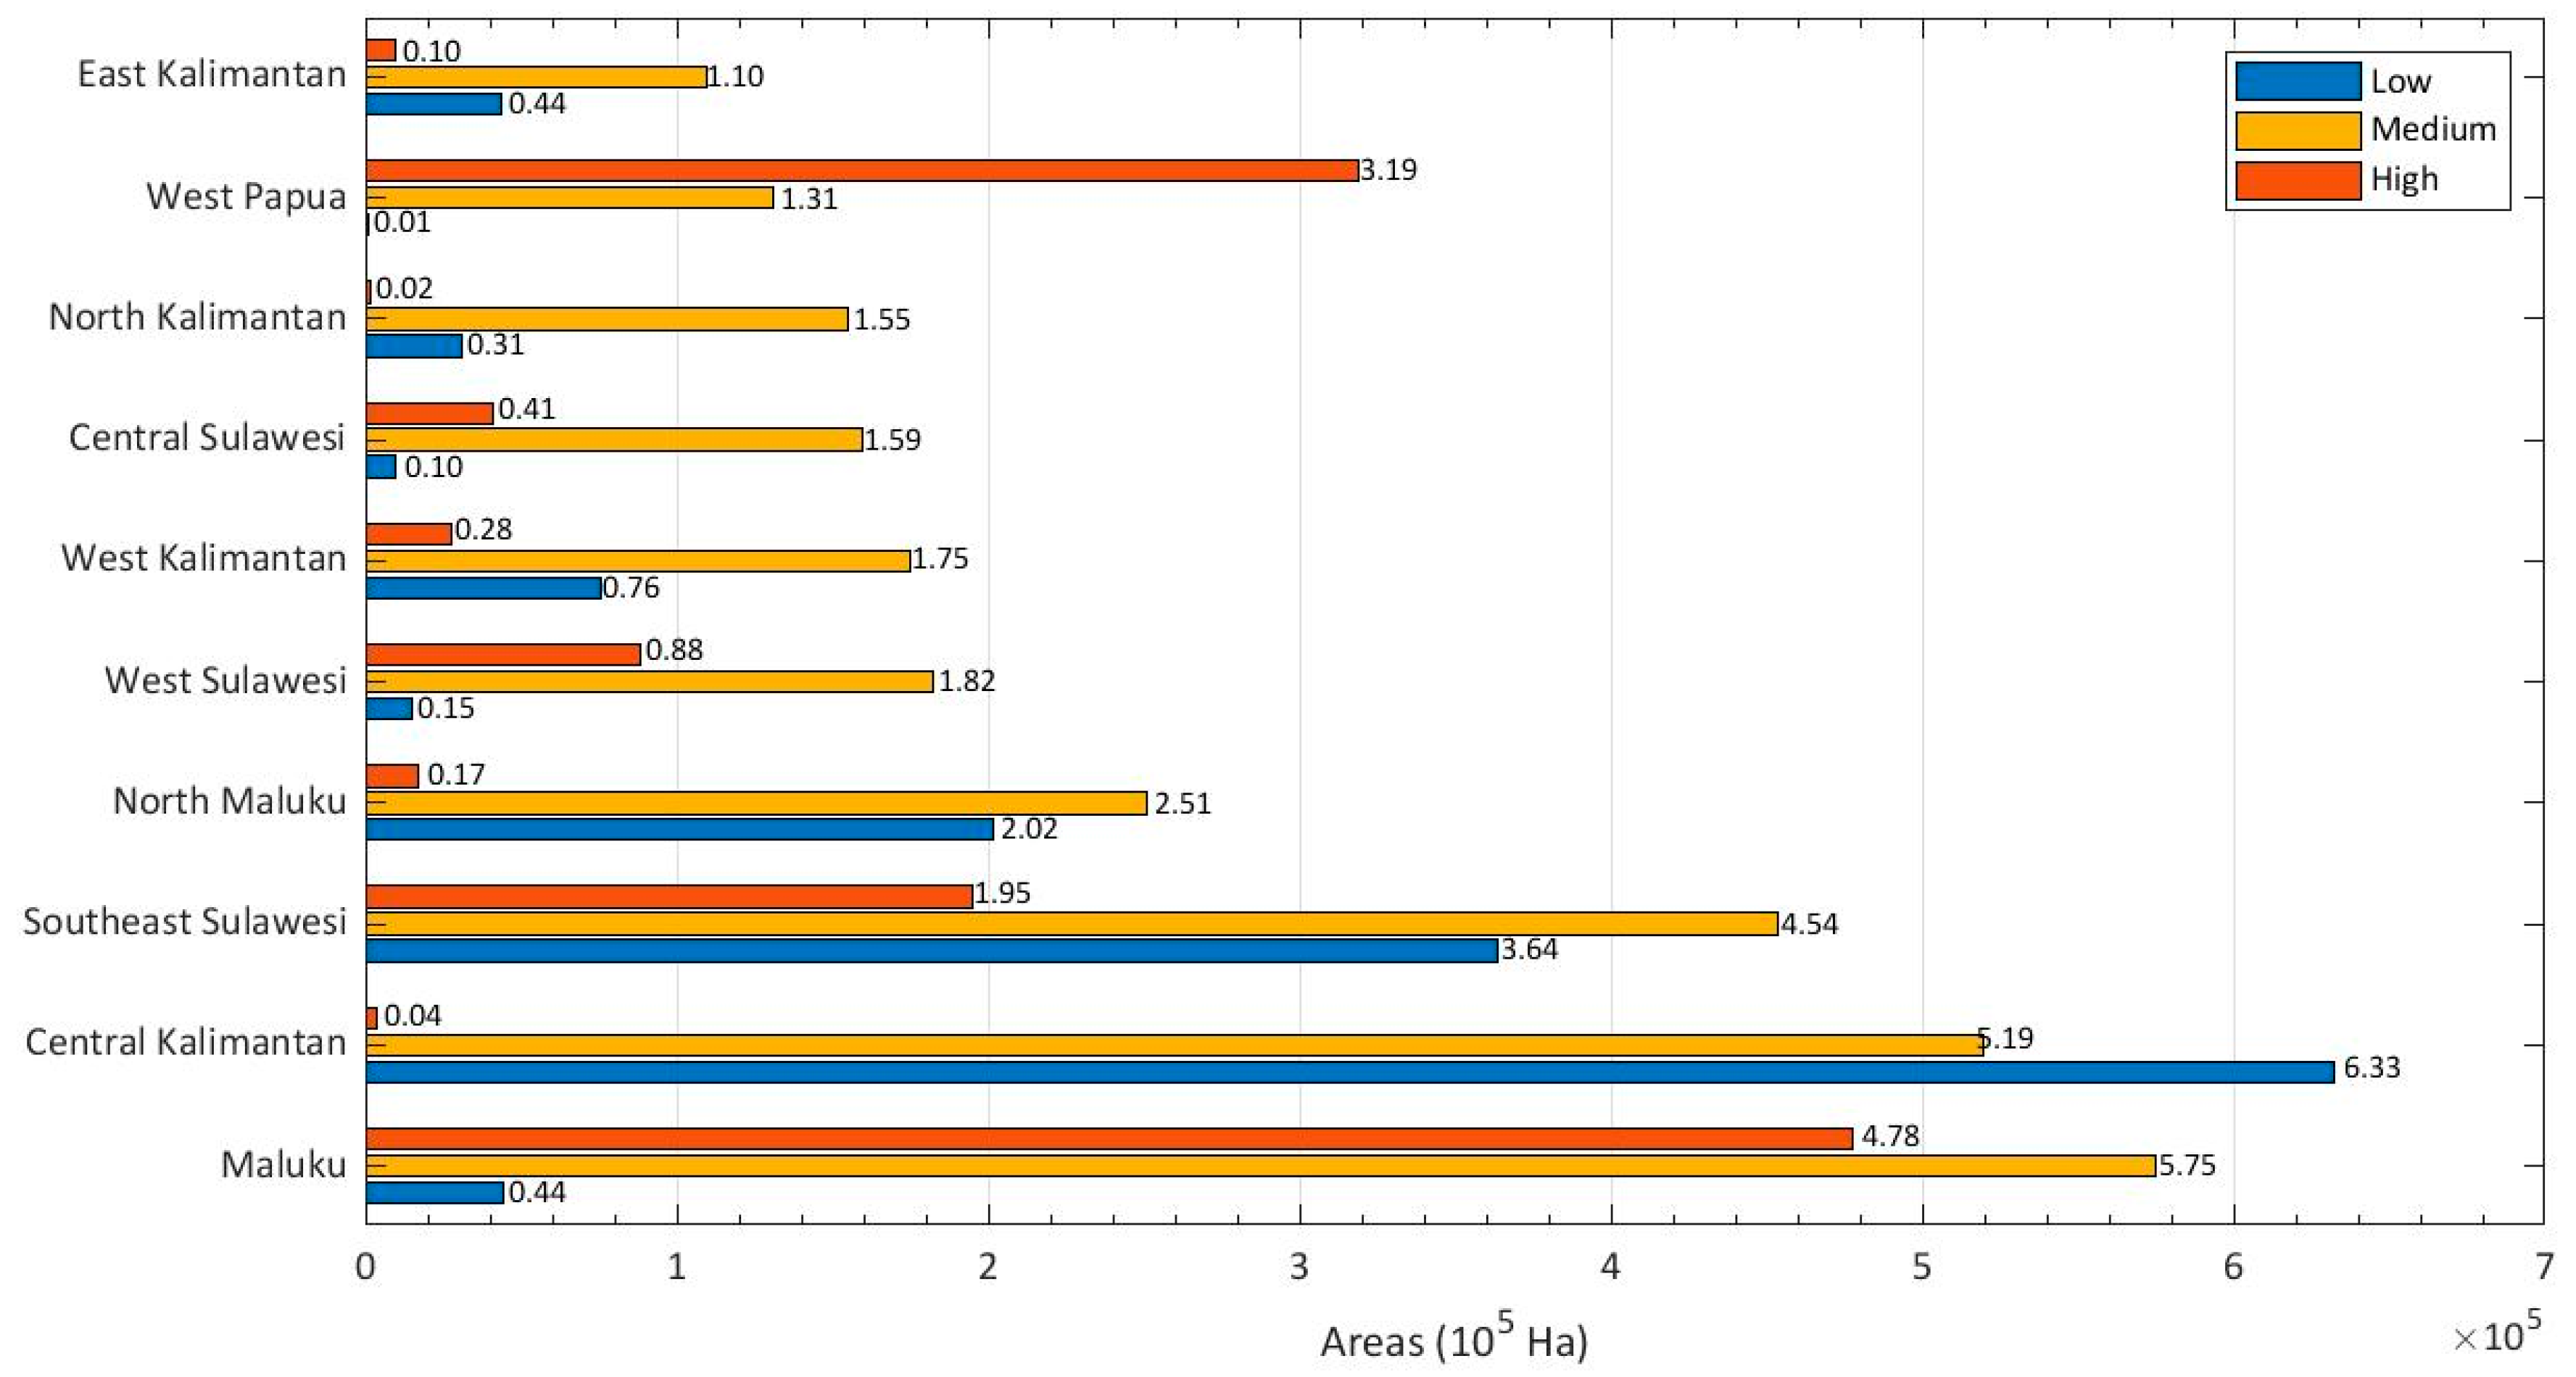
4.2. Policy Intervention
4.3. Study Limitation
4.4. Future Research
5. Conclusions
Author Contributions
Funding
Institutional Review Board Statement
Informed Consent Statement
Data Availability Statement
Acknowledgments
Conflicts of Interest
References
- Pawar, K.V.; Rothkar, R.V. Forest Conservation & Environmental Awareness. Procedia Earth Planet. Sci. 2015, 11, 212–215. [Google Scholar] [CrossRef] [Green Version]
- Waring, R.H. Forest Ecosystems||Carbon Cycle. 2007. Available online: https://zh.booksc.eu/book/73075476/08b8ea (accessed on 7 January 2022).
- FAO; UNEP. The World’s Forests; FAO: Rome, Italy; UNEP: Nairobi, Kenya, 2020; ISBN 9789251324196. [Google Scholar]
- Wicaksono, D.A.; Yurista, A.P. Konservasi Hutan Partisipatif Melalui REDD+ (Studi Kasus Kalimantan Tengah Sebagai Provinsi Percontohan REDD+). J. Wil. Dan Lingkung. 2013, 1, 189–200. [Google Scholar] [CrossRef] [Green Version]
- Turubanova, S.; Potapov, P.V.; Tyukavina, A.; Hansen, M.C. Ongoing primary forest loss in Brazil, Democratic Republic of the Congo, and Indonesia. Environ. Res. Lett. 2018, 13, 074028. [Google Scholar] [CrossRef] [Green Version]
- Global Forest Watch Indonesia Deforestation Rates & Statistics|GFW. Available online: https://www.globalforestwatch.org/dashboards/country/IDN/ (accessed on 19 November 2020).
- Certini, G. Effects of fire on properties of forest soils: A review. Oecologia 2005, 143, 1–10. [Google Scholar] [CrossRef]
- Dennis, R.; Meijaard, E.; Applegate, G.; Nasi, R.; Moore, P. Impacts of Human-Caused Fires on Biodiversity and Ecosystem Functioning, and their Causes in Tropical, Temperate and Boreal Forest Biomes; Secretariat of the Convention on Biological Diversity: Montreal, QC, Canada, 2001; ISBN 9280721127. [Google Scholar]
- Jones, M.W.; Smith, A.; Betts, R.; Canadell, J.G.; Prentice, I.C.; Le Quéré, C. Climate Change increases the risk of wildfires. Sci. Rev. 2020, 116, 117. [Google Scholar]
- Heidari, H.; Arabi, M.; Warziniack, T. Effects of Climate Change on Natural-Caused Fire Activity in Western U.S. National Forests. Atmosphere 2021, 12, 981. [Google Scholar] [CrossRef]
- Dawud, Y. Dawud Smoke episodes and assessment of health impacts related to haze from forest fires: Indonesian experience. The Indonesian Association of Pulmonologist. J. R. Soc. West. Aust. 1999, 88, 133–138. [Google Scholar]
- Muhammad, S.; Long, X.; Salman, M. COVID-19 pandemic and environmental pollution: A blessing in disguise? Sci. Total Environ. 2020, 728, 138820. [Google Scholar] [CrossRef] [PubMed]
- WHO. Ambient Air Pollution: A Global Assessment of Exposure and Burden of Disease; World Health Organization: Geneva, Switzerland, 2016; Volume 360. [Google Scholar]
- Reid, C.E.; Brauer, M.; Johnston, F.H.; Jerrett, M.; Balmes, J.R.; Elliott, C.T. Critical review of health impacts of wildfire smoke exposure. Environ. Health Perspect. 2016, 124, 1334–1343. [Google Scholar] [CrossRef] [Green Version]
- KLHK Rekapitulasi Luas Kebakaran Hutan dan Lahan (Ha) Per Provinsi di Indonesia Tahun 2015–2020. Available online: http://sipongi.menlhk.go.id/hotspot/luas_kebakaran (accessed on 28 November 2020).
- RENSTRA. Peraturan Menteri Lingkungan Hidup dan Kehutanan RI No P/16/MENLHK/SETJEN/SET.1/8/2020 Tentang Rencana Strategis Kementerian Lingkungan Hidup Dan Kehutanan Tahun 2020–2024; Kementerian Lingkungan Hidup dan Kehutanan Republik Indonesia: Jakarta, Indonesia, 2020; Volume 53, ISBN 9788578110796.
- KLHK. Status Hutan dan Kehutanan Indonesia 2018; Kementerian Lingkungan Hidup dan Kehutanan Republik Indonesia: Jakarta, Indonesia, 2018; ISBN 9786028358859.
- Erten, E.; Kurgun, V.; Musao, N. Forest Fire Risk Zone Mapping From Satellite. Civ. Eng. 1996, 1, 1–27. [Google Scholar]
- Jaiswal, R.K.; Mukherjee, S.; Raju, K.D.; Saxena, R. Forest fire risk zone mapping from satellite imagery and GIS. Int. J. Appl. Earth Obs. Geoinf. 2002, 4, 1–10. [Google Scholar] [CrossRef]
- Ghorbanzadeh, O.; Blaschke, T.; Gholamnia, K.; Aryal, J. Forest fire susceptibility and risk mapping using social/infrastructural vulnerability and environmental variables. Fire 2019, 2, 50. [Google Scholar] [CrossRef] [Green Version]
- Ma, W.; Feng, Z.; Cheng, Z.; Chen, S.; Wang, F. Identifying forest fire driving factors and related impacts in china using random forest algorithm. Forests 2020, 11, 507. [Google Scholar] [CrossRef]
- Baccini, A.; Goetz, S.J.; Walker, W.S.; Laporte, N.T.; Sun, M.; Sulla-Menashe, D.; Hackler, J.; Beck, P.S.A.; Dubayah, R.; Friedl, M.A.; et al. Estimated carbon dioxide emissions from tropical deforestation improved by carbon-density maps. Nat. Clim. Chang. 2012, 2, 1354. [Google Scholar] [CrossRef]
- Spawn, S.A.; Sullivan, C.C.; Lark, T.J.; Gibbs, H.K. Harmonized global maps of above and belowground biomass carbon density in the year 2010. Sci. Data 2020, 7, 112–122. [Google Scholar] [CrossRef]
- Soto-Navarro, C.; Ravilious, C.; Arnell, A.; De Lamo, X.; Harfoot, M.; Hill, S.L.L.; Wearn, O.R.; Santoro, M.; Bouvet, A.; Mermoz, S.; et al. Mapping co-benefits for carbon storage and biodiversity to inform conservation policy and action. Philos. Trans. R. Soc. B Biol. Sci. 2020, 375, 20190128. [Google Scholar] [CrossRef] [Green Version]
- ESA Sentinel-5P TROPOMI User Guide—Sentinel Online—Sentinel. Available online: https://sentinel.esa.int/web/sentinel/user-guides/sentinel-5p-tropomi (accessed on 20 November 2020).
- Barbosa, J.M.; Asner, G.P. Prioritizing landscapes for restoration based on spatial patterns of ecosystem controls and plant–plant interactions. J. Appl. Ecol. 2017, 54, 1459–1468. [Google Scholar] [CrossRef] [Green Version]
- Etter, A.; Andrade, A.; Nelson, C.R.; Cortés, J.; Saavedra, K. Assessing restoration priorities for high-risk ecosystems: An application of the IUCN red list of ecosystems. Land Use Policy 2020, 99, 104874. [Google Scholar] [CrossRef]
- Reddy, C.S.; Faseela, V.S.; Unnikrishnan, A.; Jha, C.S. Earth observation data for assessing biodiversity conservation priorities in South Asia. Biodivers. Conserv. 2019, 28, 2197–2219. [Google Scholar] [CrossRef]
- Tracey, J.A.; Rochester, C.J.; Hathaway, S.A.; Preston, K.L.; Syphard, A.D.; Vandergast, A.G.; Diffendorfer, J.E.; Franklin, J.; MacKenzie, J.B.; Oberbauer, T.A.; et al. Prioritizing conserved areas threatened by wildfire and fragmentation for monitoring and management. PLoS ONE 2018, 13, e0200203. [Google Scholar] [CrossRef]
- Raharjo, B.; Nakagoshi, N. Priorities mapping in landscape: Spatial decision support of the Indonesian forest landscape. In Landscape Ecology for Sustainable Society; Springer: Cham, Switzerland, 2018; pp. 155–180. [Google Scholar] [CrossRef]
- Silva, F.R.Y.; Martínez, J.R.M.; González-Cabán, A. A methodology for determining operational priorities for prevention and suppression of wildland fires. Int. J. Wildland Fire 2014, 23, 544–554. [Google Scholar] [CrossRef]
- Irwansyah Fauzi, A.; Dimara Sakti, A.; Fajri Yayusman, L.; Budi Harto, A.; Budi Prasetyo, L.; Irawan, B.; Wikantika, K. Evaluating mangrove forest deforestation causes in Southeast Asia by analyzing recent environment and socio-economic data products. In Proceedings of the 39th Asian Conference on Remote Sensing Enabling Prosper ACRS 2018, Kuala Lumpur, Malaysia, 15–19 October 2018; Volume 2, pp. 880–889. [Google Scholar]
- Fauzi, A.; Sakti, A.; Yayusman, L.; Harto, A.; Prasetyo, L.; Irawan, B.; Kamal, M.; Wikantika, K. Contextualizing mangrove forest deforestation in southeast asia using environmental and socio-economic data products. Forests 2019, 10, 952. [Google Scholar] [CrossRef] [Green Version]
- Sakti, A.D.; Rinasti, A.N.; Agustina, E.; Diastomo, H.; Muhammad, F.; Anna, Z.; Wikantika, K. Multi-scenario model of plastic waste accumulation potential in indonesia using integrated remote sensing, statistic and socio-demographic data. ISPRS Int. J. Geo-Inf. 2021, 10, 481. [Google Scholar] [CrossRef]
- Xu, Y.; Mo, Y.; Zhu, S. Poverty mapping in the dian-gui-qian contiguous extremely poor area of southwest china based on multi-source geospatial data. Sustainability 2021, 13, 8717. [Google Scholar] [CrossRef]
- Chen, C.; He, X.; Liu, Z.; Sun, W.; Dong, H.; Chu, Y. Analysis of regional economic development based on land use and land cover change information derived from Landsat imagery. Sci. Rep. 2020, 10, 12721. [Google Scholar] [CrossRef]
- Sakti, A.D.; Fauzi, A.I.; Wilwatikta, F.N.; Rajagukguk, Y.S.; Sudhana, S.A.; Yayusman, L.F.; Syahid, L.N.; Sritarapipat, T.; Principe, J.A.; Quynh Trang, N.T.; et al. Multi-source remote sensing data product analysis: Investigating anthropogenic and naturogenic impacts on mangroves in southeast asia. Remote Sens. 2020, 12, 2720. [Google Scholar] [CrossRef]
- Fauzi, A.I.; Sakti, A.D.; Robbani, B.F.; Ristiyani, M.; Agustin, R.T.; Yati, E.; Nuha, M.U.; Anika, N.; Putra, R.; Siregar, D.I.; et al. Assessing potential climatic and human pressures in indonesian coastal ecosystems using a spatial data-driven approach. ISPRS Int. J. Geo-Inf. 2021, 10, 778. [Google Scholar] [CrossRef]
- Sakti, A.D.; Ario, M.; Rahadianto, E.; Pradhan, B.; Muhammad, H.N.; Andani, I.G.A.; Sarli, P.W.; Abdillah, M.R.; Anggraini, T.S.; Purnomo, A.D.; et al. School Location Analysis by Integrating the Accessibility, Natural and Biological Hazards to Support Equal Access to Education. ISPRS Int. J. Geo-Inf. 2021, 11, 12. [Google Scholar] [CrossRef]
- BIG Indonesia Geospatial Portal. Available online: https://tanahair.indonesia.go.id/portal-web (accessed on 19 November 2020).
- CSM Earth Observation Goup. Available online: https://eogdata.mines.edu/products/vnl/ (accessed on 20 August 2021).
- NASA LP DAAC—MOD11A1. Available online: https://lpdaac.usgs.gov/products/mod11a1v006/ (accessed on 18 May 2021).
- WorldPop Open Spasial Demographic Data and Research. Available online: https://www.worldpop.org/ (accessed on 20 November 2020).
- Funk, C.; Peterson, P.; Landsfeld, M.; Pedreros, D.; Verdin, J.; Shukla, S.; Husak, G.; Rowland, J.; Harrison, L.; Hoell, A.; et al. The climate hazards infrared precipitation with stations—A new environmental record for monitoring extremes. Sci. Data 2015, 2, 150066. [Google Scholar] [CrossRef] [Green Version]
- Takeuchi, W.; Darmawan, S.; Shofiyati, R.; Khiem, M.V.; Oo, K.S.; Pimple, U.; Heng, S. Near-real time meteorological drought monitoring and early warning system for croplands in Asia. In Proceedings of the ACRS 2015—Asian Conference on Remote Sensing 2015: Fostering Resilient Growth in Asia, Metro Manila, Philippines, 24–28 October 2015. [Google Scholar]
- ECMWF Copernicus Climate Change Service (C3S). ERA5: Fifth generation of ECMWF atmospheric reanalyses of the global climate. Copernic. Clim. Change Serv. Clim. Data Store 2017. Available online: https://cds.climate.copernicus.eu/cdsapp#!/home (accessed on 10 August 2020).
- Weiss, D.J.; Nelson, A.; Gibson, H.S.; Temperley, W.; Peedell, S.; Lieber, A.; Hancher, M.; Poyart, E.; Belchior, S.; Fullman, N.; et al. A global map of travel time to cities to assess inequalities in accessibility in 2015. Nature 2018, 553, 333–336. [Google Scholar] [CrossRef] [PubMed]
- Hansen, M.C.; Potapov, P.V.; Moore, M.; Hancher, S.A.; Turubanova, A.; Tyukavina, D.; Thau, S.V.; Stehman, S.J.; Goetz, T.R.; Loveland, A.; et al. High-resolution global maps of 21st-century forest cover change. Science 2013, 850, 2011–2014. [Google Scholar] [CrossRef] [PubMed] [Green Version]
- Pettinari, M.L.; Lizundia-Loiola, J.; Chuvieco, E. ESA CCI ECV Fire Disturbance: D4.2 Product User Guide—MODIS, Version 1.0; 2020. Available online: https://www.esa-fire-cci.org/documents (accessed on 18 May 2021).
- Giglio, L.; Boschetti, L.; Roy, D.; Hoffman, A.A.; Humber, M. Collection 6 MODIS Burned Area product User Guide. Nasa 2016, 3, 1–26. [Google Scholar]
- FWI Konsesi Perusahaan. Available online: https://petahutan.fwi.or.id/web/map/name/konsesiperusahaan (accessed on 20 November 2020).
- Misra, P.; Fujikawa, A.; Takeuchi, W. Novel decomposition scheme for characterizing urban air quality with MODIS. Remote Sens. 2017, 9, 812. [Google Scholar] [CrossRef] [Green Version]
- Hennig, C.; Viroli, C. Quantile-based classifiers. Biometrika 2016, 103, 435–446. [Google Scholar] [CrossRef] [PubMed] [Green Version]
- Esri How Emerging Hot Spot Analysis works—ArcGIS Pro|Documentation. Available online: https://pro.arcgis.com/en/pro-app/latest/tool-reference/space-time-pattern-mining/learnmoreemerging.htm (accessed on 26 April 2021).
- Kurniawan, A.; Sadali, M.I. Pemanfaatan Analisis Spasial Hot Spot (Getis Ord Gi*) untuk Pemetaan Klaster Industri di Pulau Jawa dengan Memanfaatkan Sistem Informasi Geografi. OSF Preprints 2020, 1, 1–21. [Google Scholar] [CrossRef]
- Pribadi, A.; Kurata, G. Greenhouse gas and air pollutant emissions from land and forest fire in Indonesia during 2015 based on satellite data. In Proceedings of the IOP Conference Series: Earth and Environmental Science, Bogor, Indonesia, 25–26 October 2016; Volume 54. [Google Scholar]
- BPS Badan Pusat Statistik. Available online: https://www.bps.go.id/indicator/12/141/1/kepadatan-penduduk-menurut-provinsi.html (accessed on 19 November 2020).
- KLHK Data Matrix Titik Panas TERRA/AQUA (LAPAN). Available online: http://sipongi.menlhk.go.id/hotspot/matrik_tahunan?satelit=LPN-MODIS&thn=2019 (accessed on 20 November 2020).
- LAPAN LAPAN Fire Hotspot. Available online: http://modis-catalog.lapan.go.id/monitoring/ (accessed on 19 August 2021).
- Zheng, Z.; Yang, Z.; Wu, Z.; Marinello, F. Spatial variation of NO2 and its impact factors in China: An application of sentinel-5P products. Remote Sens. 2019, 11, 1939. [Google Scholar] [CrossRef] [Green Version]
- Miettinen, J. Burnt Area Mapping in Insular Southeast Asia Using Medium Resolution Satellite Imagery; Dissertationes Forestales: Helsinki, Finlandia, 2007; Volume 2007, ISBN 9789516511781. [Google Scholar]
- Carvalho, A.; Monteiro, A.; Flannigan, M.; Solman, S.; Miranda, A.I.; Borrego, C. Forest fires in a changing climate and their impacts on air quality. Atmos. Environ. 2011, 45, 5545–5553. [Google Scholar] [CrossRef]
- Sastry, N. Forest fires, air pollution, and mortality in Southeast Asia. Demography 2002, 39, 1–23. [Google Scholar] [CrossRef]
- de Gouw, J.A.; Warneke, C.; Stohl, A.; Wollny, A.G.; Brock, C.A.; Cooper, O.R.; Holloway, J.S.; Trainer, M.; Fehsenfeld, F.C.; Atlas, E.L.; et al. Volatile organic compounds composition of merged and aged forest fire plumes from Alaska and western Canada. J. Geophys. Res. Atmos. 2006, 111, 1–20. [Google Scholar] [CrossRef] [Green Version]
- Sakti, A.D.; Takeuchi, W.; Wikantika, K. Development of Global Cropland Agreement Level Analysis by Integrating Pixel Similarity of Recent Global Land Cover Datasets. J. Environ. Prot. 2017, 8, 1509–1529. [Google Scholar] [CrossRef] [Green Version]
- Herold, M.; Mayaux, P.; Woodcock, C.E.; Baccini, A.; Schmullius, C. Some challenges in global land cover mapping: An assessment of agreement and accuracy in existing 1 km datasets. Remote Sens. Environ. 2008, 112, 2538–2556. [Google Scholar] [CrossRef]
- Lu, M.; Wu, W.B.; Zhang, L.; Liao, A.P.; Peng, S.; Tang, H.J. A comparative analysis of five global cropland datasets in China. Sci. China Earth Sci. 2016, 59, 2307–2317. [Google Scholar] [CrossRef]
- Rajagukguk, Y.S.; Sakti, A.D.; Yayusman, L.F.; Harto, A.B.; Prasetyo, L.B.; Irawan, B.; Wikantika, K. Evaluation of Southeast Asia mangrove forest deforestation using longterm remote sensing index datasets. In Proceedings of the 39th Asian Conference on Remote Sensing: Remote Sensing Enabling Prosperity, ACRS 2018, Kuala Lumpur, Malaysia, 15–19 October 2018; Asian Association on Remote Sensing: Kuala Lumpur, Malaysia, 2018; Volume 2, pp. 931–937. [Google Scholar]
- Sakti, A.D.; Takeuchi, W. A data-intensive approach to address food sustainability: Integrating optic and microwave satellite imagery for developing long-term global cropping intensity and sowing month from 2001 to 2015. Sustainability 2020, 12, 3227. [Google Scholar] [CrossRef] [Green Version]
- Decuyper, M.; Chávez, R.O.; Lohbeck, M.; Lastra, J.A.; Tsendbazar, N.; Hackländer, J.; Herold, M.; Vågen, T.G. Continuous monitoring of forest change dynamics with satellite time series. Remote Sens. Environ. 2022, 269, 112829. [Google Scholar] [CrossRef]
- Nath, A.J.; Kumar, R.; Devi, N.B.; Rocky, P.; Giri, K.; Sahoo, U.K.; Bajpai, R.K.; Sahu, N.; Pandey, R. Agroforestry land suitability analysis in the Eastern Indian Himalayan region. Environ. Chall. 2021, 4, 100199. [Google Scholar] [CrossRef]
- Ahmad, F.; Uddin, M.M.; Goparaju, L.; Rizvi, J.; Biradar, C. Quantification of the Land Potential for Scaling Agroforestry in South Asia. KN-J. Cartogr. Geogr. Inf. 2020, 70, 71–89. [Google Scholar] [CrossRef]
- Özkan, B.; Dengiz, O.; Turan, İ.D. Site suitability analysis for potential agricultural land with spatial fuzzy multi-criteria decision analysis in regional scale under semi-arid terrestrial ecosystem. Sci. Rep. 2020, 10, 22074. [Google Scholar] [CrossRef]
- Sakti, A.D.; Tsuyuki, S. Spectral Mixture Analysis of Peatland Imagery for Land Cover Study of Highly Degraded Peatland in Indonesia. In The International Archives of the Photogrammetry, Remote Sensing and Spatial Information Science; Copernicus Publications: Göttingen, Germany, 2015; Volume XL-7/W3. [Google Scholar]
- Jain, P.; Coogan, S.C.P.; Subramanian, S.G.; Crowley, M.; Taylor, S.; Flannigan, M.D. A review of machine learning applications in wildfire science and management. Environ. Rev. 2020, 28, 478–505. [Google Scholar] [CrossRef]
- Monaco, S.; Greco, S.; Farasin, A.; Colomba, L.; Apiletti, D.; Garza, P.; Cerquitelli, T.; Baralis, E. Attention to Fires: Multi-Channel Deep Learning Models for Wildfire Severity Prediction. Appl. Sci. 2021, 11, 11060. [Google Scholar] [CrossRef]
- Guede-Fernández, F.; Martins, L.; de Almeida, R.V.; Gamboa, H.; Vieira, P. A Deep Learning Based Object Identification System for Forest Fire Detection. Fire 2021, 4, 75. [Google Scholar] [CrossRef]
- Saponara, S.; Elhanashi, A.; Gagliardi, A. Real-time video fire/smoke detection based on CNN in antifire surveillance systems. J. Real-Time Image Proc. 2021, 18, 889–900. [Google Scholar] [CrossRef]
- Wang, B.; Waters, C.; Anwar, M.R.; Cowie, A.; Liu, D.L.; Summers, D.; Paul, K.; Feng, P. Future climate impacts on forest growth and implications for carbon sequestration through reforestation in southeast Australia. J. Environ. Manag. 2022, 302, 113964. [Google Scholar] [CrossRef] [PubMed]
- Syahid, L.N.; Sakti, A.D.; Virtriana, R.; Wikantika, K.; Windupranata, W.; Tsuyuki, S.; Caraka, R.E.; Pribadi, R. Determining optimal location for mangrove planting using remote sensing and climate model projection in southeast asia. Remote Sens. 2020, 12, 3734. [Google Scholar] [CrossRef]
- Yospin, G.I.; Bridgham, S.D.; Neilson, R.P.; Bolte, J.P.; Bachelet, D.M.; Gould, P.J.; Harrington, C.A.; Kertis, J.A.; Evers, C.; Johnson, B.R. A new model to simulate climate-change impacts on forest succession for local land management. Ecol. Appl. 2015, 25, 226–242. [Google Scholar] [CrossRef] [Green Version]


| S. No. | Data | Source | Temporal Resolution | Spatial Resolution | Reference |
|---|---|---|---|---|---|
| 1 | NO2 | ESA | Monthly | 3.5 × 7 km | [25] |
| 2 | SO2 | ESA | Monthly | 3.5 × 7 km | [25] |
| 3 | CO | ESA | Monthly | 3.5 × 7 km | [25] |
| 4 | Administration data | BIG | 2020 | Vector | [40] |
| 5 | Night light | VIIRS | Yearly | 450 m | [41] |
| 6 | Land surface temperature | MODIS TERRA | Yearly | 1 km | [42] |
| 7 | Population | WorldPop | Monthly and yearly | 100 m | [43] |
| 8 | Precipitation | CHIRPS | Daily | 5.55 km | [44] |
| 9 | Drought | KBDI | Daily | 4 km | [45] |
| 10 | Wind speed | ERA5 | Daily | 30 km | [46] |
| 11 | Accessibility | Accessibility to Cities 2015 | 2015 | 900 m | [47] |
| 12 | Tropical forest | Primary humid tropical forest | 2001 | 30 m | [5] |
| 13 | Global forest change | USGS | 2000–2020 | 30 m | [48] |
| 14 | Global aboveground and belowground biomass carbon density maps | NASA | 2010 | 300 m | [23] |
| 15 | WCMC aboveground and belowground biomass carbon density | UNEP–WCMC | 2010 | 300 m | [24] |
| 16 | WHRC pantropical national level carbon stock dataset | Woodwell Climate Research Center | 2012 | 500 m | [22] |
| 17 | Burned area (FireCCI51) | ESA | Monthly (2001–2019) | 250 m | [49] |
| 18 | Burned area (MCD64A1) | NASA | Monthly (2000–2020) | 500 m | [50] |
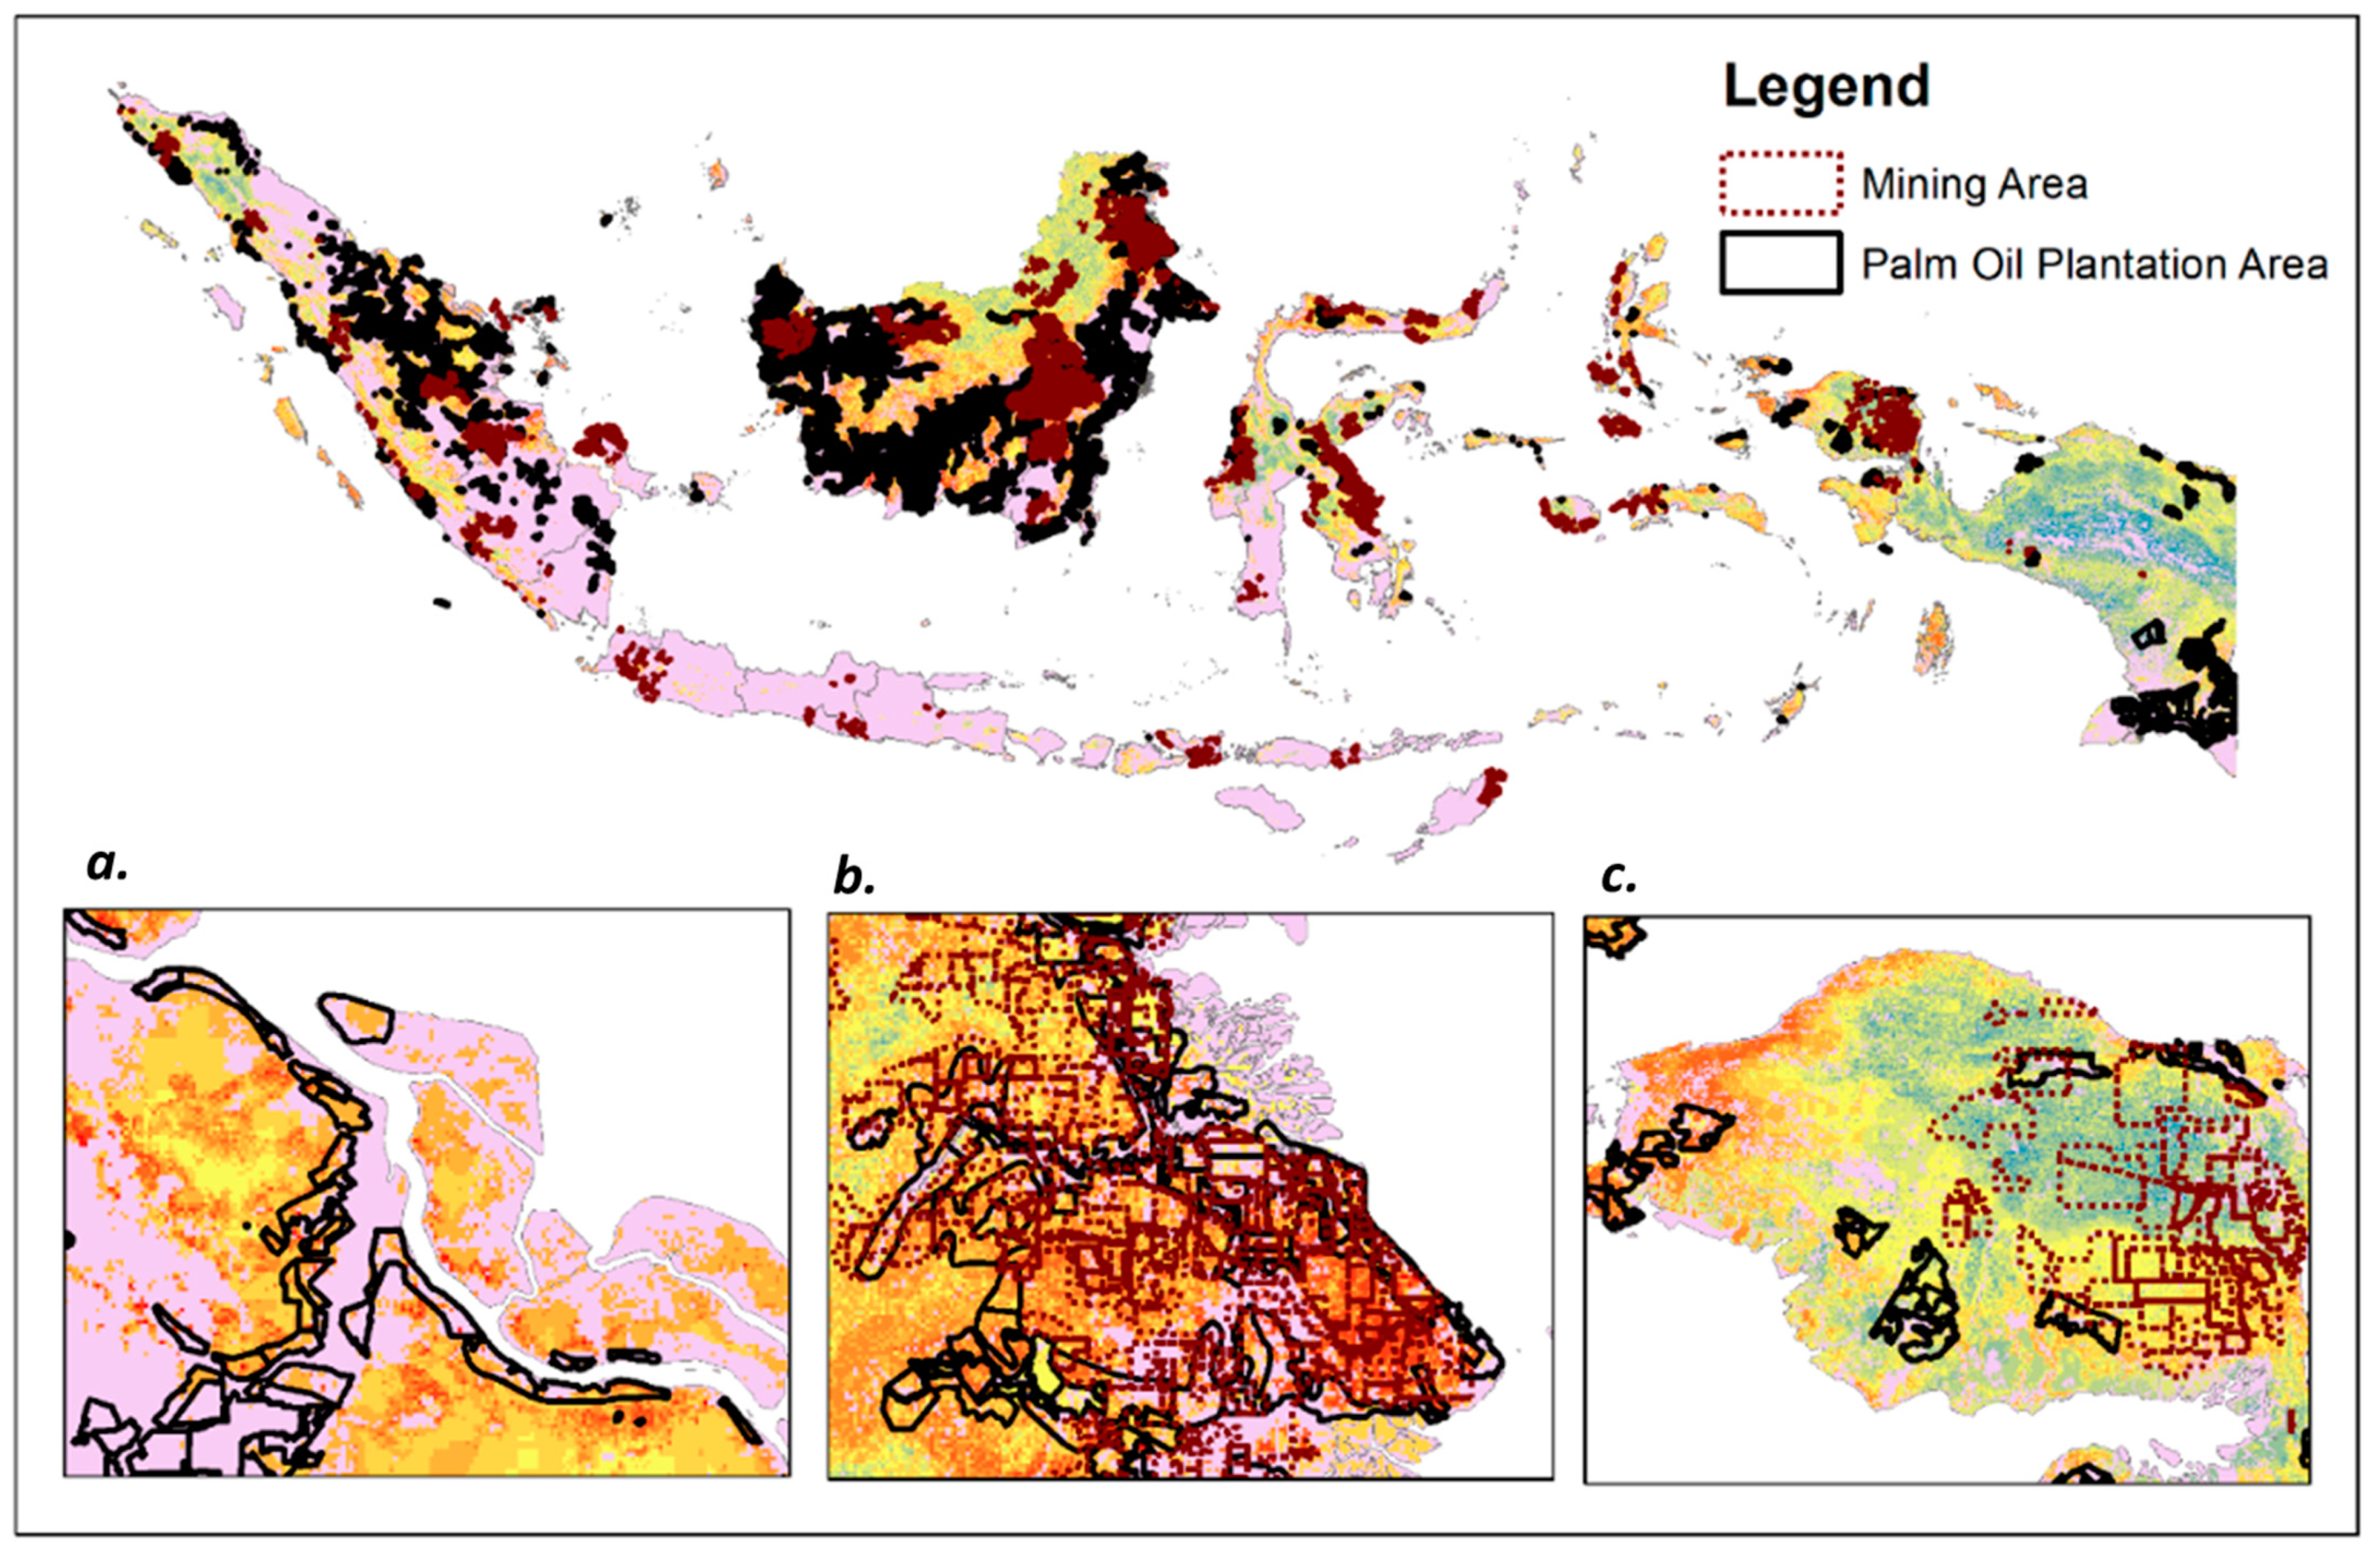
| 19 | Mining area | FWI | 2019 | Vector | [51] |
| 20 | Palm oil plantation area | FWI | 2019 | Vector | [51] |
| S. No. | Data | Wildfire Susceptibility Index | Carbon Stock Index | Carbon Emission Index |
|---|---|---|---|---|
| 1 | NO2 | - | - | ✓ |
| 2 | SO2 | - | - | ✓ |
| 3 | CO | - | - | ✓ |
| 4 | Administration data | ✓ | ✓ | ✓ |
| 5 | Night light | - | - | ✓ |
| 6 | Land surface temperature | - | - | ✓ |
| 7 | Population | ✓ | - | - |
| 8 | Precipitation | ✓ | - | - |
| 9 | Drought | ✓ | - | - |
| 10 | Wind speed | ✓ | - | - |
| 11 | Accessibility | ✓ | - | - |
| 12 | Tropical forest | ✓ | ✓ | ✓ |
| 13 | Global Forest change | - | ✓ | - |
| 14 | Global biomass carbon density maps | - | ✓ | - |
| 15 | WCMC biomass carbon density | - | ✓ | - |
| 16 | WHRC carbon stock dataset | - | ✓ | - |
| Category | Emerging Hotspot (km2) | Emerging Hotspot in Priority Area (km2) | Percentage |
|---|---|---|---|
| New Hotspot | 1603 | 272 | 16.968% |
| Oscillating Hotspot | 4442 | 485 | 10.919% |
| Consecutive Hotspot | 14 | 1 | 7.143% |
| Oscillating Coldspot | 15,121 | 3647 | 24.119% |
| Persistent Coldspot | 57 | 11 | 19.298% |
| Sporadic Coldspot | 1631 | 45 | 2.759% |
Publisher’s Note: MDPI stays neutral with regard to jurisdictional claims in published maps and institutional affiliations. |
© 2022 by the authors. Licensee MDPI, Basel, Switzerland. This article is an open access article distributed under the terms and conditions of the Creative Commons Attribution (CC BY) license (https://creativecommons.org/licenses/by/4.0/).
Share and Cite
Sakti, A.D.; Fauzi, A.I.; Takeuchi, W.; Pradhan, B.; Yarime, M.; Vega-Garcia, C.; Agustina, E.; Wibisono, D.; Anggraini, T.S.; Theodora, M.O.; et al. Spatial Prioritization for Wildfire Mitigation by Integrating Heterogeneous Spatial Data: A New Multi-Dimensional Approach for Tropical Rainforests. Remote Sens. 2022, 14, 543. https://doi.org/10.3390/rs14030543
Sakti AD, Fauzi AI, Takeuchi W, Pradhan B, Yarime M, Vega-Garcia C, Agustina E, Wibisono D, Anggraini TS, Theodora MO, et al. Spatial Prioritization for Wildfire Mitigation by Integrating Heterogeneous Spatial Data: A New Multi-Dimensional Approach for Tropical Rainforests. Remote Sensing. 2022; 14(3):543. https://doi.org/10.3390/rs14030543
Chicago/Turabian StyleSakti, Anjar Dimara, Adam Irwansyah Fauzi, Wataru Takeuchi, Biswajeet Pradhan, Masaru Yarime, Cristina Vega-Garcia, Elprida Agustina, Dionisius Wibisono, Tania Septi Anggraini, Megawati Oktaviani Theodora, and et al. 2022. "Spatial Prioritization for Wildfire Mitigation by Integrating Heterogeneous Spatial Data: A New Multi-Dimensional Approach for Tropical Rainforests" Remote Sensing 14, no. 3: 543. https://doi.org/10.3390/rs14030543