Article

On the Processing of Dual-Channel Receiving Signals of the LuTan-1 SAR System

1
Space Microwave Remote Sensing System Department, Aerospace Information Research Institute, Chinese Academy of Sciences, Beijing 100094, China
2
School of Electronic, Electrical and Communication Engineering, University of Chinese Academy of Sciences, Beijing 100094, China
3
Faculty of Information Science and Engineering, College of Marine Technology, Ocean University of China, Qingdao 266100, China
*
Author to whom correspondence should be addressed.
Remote Sens. 2022, 14(3), 515; https://doi.org/10.3390/rs14030515
Submission received: 10 December 2021 / Revised: 13 January 2022 / Accepted: 18 January 2022 / Published: 21 January 2022

Abstract

:
LuTan-1 (LT-1) is an innovative spaceborne radar Earth observation mission including two satellites equipped with synthetic aperture radar (SAR) which will be launched in 2022. Active phased array antennas that can be divided into two physical channels are equipped on each satellite. The signal can be transmitted through the full antenna without broadening and recorded by each channel. Therefore, two methods can be used to preprocess the dual-channel receiving signals, referred to as dual-channel echo reconstruction and dual-channel echo synthesis. The former is inherited from the traditional high-resolution wide-swath mode and the latter is a method that takes coherent superposition as the reference. This paper researches the impacts of the two methods in system performance and imaging quality. Principles and theoretical models are firstly given. Furthermore, the system performance under the “L1A_SM_S” working mode of the LT-1 is simulated to compare the differences between the two methods, which mainly focuses on azimuth ambiguity-to-signal ratio, noise equivalent sigma zero, and the performance of block adaptive quantization. Afterwards, the test data acquired by the ground validation system of the LT-1 are used for the hardware-in-the-loop simulation to demonstrate the imaging quality between the two methods. Finally, a quantitative comparison is given.

1. Introduction

Synthetic aperture radar (SAR) can provide remote sensing abilities during the day and night regardless of weather conditions, so it plays an important role in Earth and planetary observation [1,2]. The ability of SAR satellites to measure the displacement of landmasses cross the country, even on the global scale, can effectively deal with disasters including landslides and earthquakes [2,3]. Furthermore, to pursue better penetration capacity, the L-band has been adopted in more and more spaceborne SAR missions, such as ALOS-2 launched in 2014 [4], SAOCOM-CS [5,6,7], TanDEM-L [8,9,10,11], and LuTan-1 (LT-1) introduced in this paper. The longer wavelength (24 cm) enables the much-improved temporal coherence in measuring deformations, especially over vegetation areas. Meanwhile, with the continuous development of spaceborne SAR technology, some state-of-the-art techniques have also been applied to SAR systems [1,12,13,14], such as azimuth multichannel technology, which aims to solve the inherent system limitations of high-resolution wide-swath imaging [15,16,17].
LT-1 is a novel spaceborne L-band bistatic SAR (BiSAR) Earth observation mission, which will be launch in 2022. Two satellites are equipped with an advanced full-polarimetric SAR system [18,19], and a larger single-pass interferometric SAR system is formed due to the flexible formation flying. LT-1 will serve civil applications in China by providing capabilities of remote sensing including interferometry, differential interferometry, and full polarization, as well as obtaining a global digital elevation model (DEM). After launch, LT-1 will continually provide the radar images to the research and application institutes, including the glaciology, cryosphere, biosphere, hydrosphere, and permafrost. In addition, the demonstration of some advanced SAR technologies will also be carried out in-orbit, for example, the performance of the non-interrupted phase synchronization scheme [18,20], the demonstration of the distribution SAR imaging, the verification of the nonlinear frequency modulation signal for spaceborne SAR imaging [21,22], and so on. The DEM generation and the deformation measurement are the two main tasks in the LT-1 mission, and they are arranged in the two separated stages of the mission lifetime. In phase I, the LT-1 mission will work in the bistatic interferometry mode using a close formation to obtain the DEM (see Figure 1a). In phase II, the monostatic fast-revisit mode is adopted for deformation measurement, and the two satellites fly in the same reference orbit with a 180-degree orbital phasing difference to shorten the revisit time to 4 days (see Figure 1b).
In order to balance the swath width and the azimuth resolution, both satellites of the LT-1 mission use azimuth dual-channel technology. Traditionally, the equivalent single-channel signal can be reconstructed from the multichannel receiving signals [23]. According to the generalized sampling theorem, Krieger et al. proposed a method of constructing a filter bank through a transfer function to reconstruct multichannel SAR signals without ambiguity [24]. However, in some working modes of the LT-1, the dual-channel echoes can be superposed directly using the idea of forming an antenna pattern through the full antenna, which is interesting and worthy of research.
In a sense, the preprocessing methods of dual-channel SAR signals are closely related to the signal receiving strategy of the SAR system. Therefore, this relationship is explained first. Then, the reason why the two methods can be used to preprocess the dual-channel receiving signals of the LT-1 SAR system is given.
First of all, the two different signal receiving strategies in the spaceborne dual-channel SAR system, namely the traditional strategy and the new strategy adopted in LT-1, are explained, and diagrams of the two strategies are shown in Figure 2. Traditionally, the signal receiving strategy in the spaceborne dual-channel SAR system is that the receiving signals are recorded after being summed up into one signal by the merge link on board, which is shown in Figure 2a. However, a new strategy is adopted in the SAR system of LT-1 as the merge link is not arranged on board. The active phased array antennas, which can be divided into two physical channels, are equipped on each satellite. Therefore, the strategy of the LT-1 SAR system is that the receiving signals are recorded by the fore (CH1) and aft (CH2) antenna parts, respectively, shown in Figure 2b. For the traditional strategy, there is only one signal being downlinked to the ground processing system but in the case of LT-1, there are two signals being downlinked. The comparison of these two strategies is not the focus in this paper.
Secondly, the two preprocessing methods are closely related to the broadening, or not, of the transmitting beam. The following studies are combined with the working mode of LT-1, and the parameters of the working modes are given in Table 1. The signals of the “L1A/B_SM_S” (explanation of nomenclature: the first part denotes the satellite and will be either L1A for the LT-1A instrument or L1B for the LT-1B instrument. The second part “SM” denotes that the SAR system works in stripmap mode. The third part, “S”, stands for single polarization.) and “L1A_SM_S” working modes can be transmitted though the full antenna with broadening and without broadening, respectively. When the transmitting beam is broadened, the receiving signal of each channel is undersampled because the pulse repetition frequency (PRF) is insufficient. Thus, only the reconstruction method can be used to obtain an unambiguous echo signal. When the transmitting beam is not broadened, the receiving beam in azimuth is equivalent to a narrow beam because the PRF is greater than the Doppler bandwidth. Thus, both the reconstruction method and a method that directly synthesizes dual-channel receiving signals through a superposition operation (called the synthesis method in this paper) can be used to preprocess the dual-channel receiving signals. The physical mechanisms of the two methods are different. The reconstruction method is achieved by the matrix inversion and the reconstruction filter weighting, and the synthesis method draws on the idea of coherent superposition, which is simpler. Thus, the two methods require a comparative study of system performance and imaging quality, which has not been researched publicly. Some similar studies include the error analysis of the multichannel reconstruction in the spaceborne SAR system [25,26], the comparison of two processing methods [27], and the performance evaluation [28] for ground target moving target indication on multi-channel SAR, and the demonstration for the fore and aft channel reconstruction of dual receive antenna mode in TerraSAR-X [29]. Thus, this paper will research the impacts of the two methods on system performance and imaging quality in detail with simulations, including azimuth ambiguity-to-signal ratio (AASR), noise equivalent sigma zero (NESZ), the performance of block adaptive quantization (BAQ), and focusing and phase-preserving of imaging. The test data acquired by the ground validation system of the LT-1 is used for hardware-in-the-loop simulation with point targets and distributed targets to compare the imaging quality between the two methods, and this evaluation can reasonably demonstrate the imaging performance of the actual system in the LT-1 mission.
This paper is organized as follows. Section 2 describes the principles and theoretical models of the two methods. In Section 3, the impacts on the system performance and the imaging quality between the two methods are given. A quantitative comparison is discussed in Section 4. Finally, Section 5 concludes this paper.

2. Materials and Methods

In this section, the principles of the two methods are illustrated first. Then, theoretical models of the two methods are given. In the following, the research is carried out in the “L1A_SM_S” working mode, i.e., the monostatic fast-revisit mode of the LT-1, as shown in Figure 1b.

2.1. Principles of Methods

In the past, multichannel reconstruction methods were usually used to preprocess the dual-channel receiving signals to obtain an unambiguous echo. However, as mentioned above, in the “L1A_SM_S” working mode of the LT-1, the signal is transmitted though the full antenna without broadening. Thus, a method that takes coherent superposition as the reference can also be used to preprocess the dual-channel receiving signals.
The premise that the echo is correctly processed in azimuth is that the PRF is greater than the Doppler bandwidth, which is determined by the antenna length in azimuth [30]:
B d = 2 v s L a
where the relationship between the antenna length L a and the beam width satisfies θ b w = 0.886 · λ / L a and v s is the radar speed. According to the parameters in Table 1, when the SAR system is working in “L1A/B_SM_S” mode, the equivalent beam width in azimuth is 2.27°. In this case, the Doppler bandwidth is 2546 Hz, which is greater than PRF. As a result, the multichannel reconstruction method is required to recover the unambiguous signal. When the SAR system is working in “L1A_SM_S” mode, the equivalent beam width in azimuth is 1.23°, corresponding to the Doppler bandwidth of 1379 Hz. Therefore, echoes received by two apertures can be directly synthesized into an equivalent echo through a superposition operation because the Doppler bandwidth is smaller than the PRF. Of course, the reconstruction method can also be used in this case, which gives the ground processing more flexibility.
The procedure of the processing of dual-channel receiving signals in the LT-1 is shown in Figure 3. The in-orbit processing part is implemented in the SAR system, including low noise amplification (LNA), sampling, and BAQ compression. Then, the signals are downlinked to the ground processing system, and the ground processing part is carried out. The focus of this paper is the differences between the two different preprocessing methods in the ground processing part.

2.2. Echo Model

In this subsection, the echo model of the dual-channel receiving signals is introduced. Assuming that the closest slant range from the target to the satellite is R 0 , the azimuth signal of a single point target received by the nth channel can be expressed as [23]
s n ( η ) = σ · a θ η · exp j 2 π λ R 0 2 + v s η 2 + R 0 2 + v s η Δ x n 2
where σ is the backscatter coefficient of the target; η is the azimuth time; a θ η represents the radar antenna pattern in azimuth; θ η represents the instantaneous squint angle; Δ x n = n r e f n · d a z represents the phase center distance between the reference channel n r e f and the nth receiving channel; d a z is the interval between the two adjacent phase centers.
Upon performing Taylor series expansion of (2) and related derivations, the signal can be written as [23]
s n ( η ) σ · a θ η · exp [ j 4 π λ R 0 j π Δ x n 2 2 λ R 0 j 2 π v s 2 λ η Δ x n 2 v s 2 R 0 ]
If the first channel is used as the reference channel, signals in azimuth received by two apertures are given by
s 1 ( η ) σ · a θ η · exp j 4 π λ R 0 j 2 π v s 2 λ η 2 R 0
s 2 ( η ) σ · a θ η · exp [ j 4 π λ R 0 j π d a z 2 2 λ R 0 j 2 π v s 2 λ η d a z 2 v s 2 R 0 ]
Thus, the frequency domain relationship of multichannel signals can be expressed as [23]
S n f η exp j π Δ x n 2 2 λ R 0 j π Δ x n v s f η · S r e f f η
where f η is the azimuth frequency; S r e f f η refers to the frequency domain form of the reference signal.

2.3. Azimuth Ambiguity

As the actual antenna pattern is not ideal, there are side lobes outside the 3 dB main lobe. Thus, the actual SAR signal in azimuth is not strictly bandlimited. The nonbandlimited signal in azimuth will generate azimuth ambiguous energy, thereby deteriorating the performance of the SAR system. The AASR is a crucial indicator used to evaluate the azimuth ambiguity performance. In this subsection, the theoretical models of the AASR between the two methods are derived.

2.3.1. Dual-Channel Echo Reconstruction

The filter bank method is adopted in dual-channel echo reconstruction [24], and the prefilter H f η and the reconstruction filter P f η are used, which satisfies P f η = H 1 f η [24].
Thus, the reconstructed signal in the Doppler domain S a f η is given by
S a f η = S 1 f η , , S N f η · P f η
where N represents the number of channels. In (7), the useful signal in each channel is weighted and superimposed by the reconstruction filter, and ambiguous signals are also weighted and superimposed. After the ith-order ambiguous signal is processed by the operation of prefiltering and reconstruction weighting, it can be expressed as
S a m b , i = S a f η + i · PRF
where f η N 2 · PRF , N 2 · PRF ; i is the order of the ambiguous signal, which determines the number of the ambiguous signal. For example, for the 3rd-order ambiguity signal, the value range of i includes −3, −2, −1, 1, 2, 3.
Ambiguous signals can be expressed in the form of an energy integral, and all the ambiguous energy can be obtained by accumulation, as follows:
P a m b , r = i 0 B d 2 B d 2 | S a m b , i | 2 d f η
where the subscript a m b represents ambiguous energy and r indicates that the formula corresponds to the reconstruction method.
The calculation formula of the AASR based on the reconstruction method is given by
A A S R r = P a m b , r P t o t a l
where P t o t a l refers to the total energy of the signal.
Due to device quality, system operation, and atmospheric effects, the multichannel system is usually affected by channel mismatch, and channel mismatch exists in the echo in the form of the amplitude and phase error. In addition, some factors may cause the change of the along-track baseline, which leads to the non-ideal sampling in azimuth, such as the change of the size and shape of the antenna in the harsh space environment and the change of the satellite attitude [31].
Suppose the channel amplitude error factor is α , the channel phase error is exp j Δ φ , and the along-track baseline error is Δ x b (the first channel is used as the benchmark, and the error is aggregated into the along-track offset of the phase center of the second channel). The system transfer function in the reconstruction method can be re-expressed as follows:
H err f η · P f η = H f η · P err f η
where H err f η indicates the error between the dual-channel echoes, which is given by
H err f η = H ¯ err · Λ
where Λ is a diagonal matrix with the elements: exp j π Δ x 1 2 2 λ R 0 and exp j π Δ x 2 + Δ x b 2 2 λ R 0 ; and H ¯ err is
H ¯ err = exp j 2 π f η Δ x 1 v s α exp j 2 π f η Δ x 2 + Δ x b v s exp j Δ φ exp j 2 π f η + PRF Δ x 1 v s α exp j 2 π f η + PRF Δ x 2 + Δ x b v s exp j Δ φ
The errors in (12), i.e., the channel mismatch error and the along-track baseline error, can be understood as the errors of the reconstruction filter P err f η . The effects of both are exactly the same.
In this case, the derivations are similar to (7) and (8), and the reconstructed signal with errors is expressed as S a e r r f η . The azimuth ambiguous energy is given by
P a m b , r e r r = i 0 B d 2 B d 2 | S a e r r f η + i · PRF | 2 d f η
where the superscript e r r indicates that the formula corresponds to the case of channel mismatch. Therefore, the AASR of the reconstruction method with channel mismatch is
A A S R r e r r = P a m b , r e r r P t o t a l

2.3.2. Dual-Channel Echo Synthesis

A method that takes coherent superposition as a reference, which is called dual-channel echo synthesis in this paper, can also be used to preprocess the dual-channel receiving signals in the LT-1. This preprocessing method will have different effects on azimuth ambiguity. The AASR of this method is deduced as follows.
As the PRF is greater than the Doppler bandwidth, the synthesized equivalent echo is an unambiguous signal. The echoes from two apertures can be given as (4) and (5). Their frequency domain expressions can be written according to the principle of stationary phase:
S 1 f η σ · a θ f η K a · exp [ j 4 π λ R 0 j f η 2 K a 2 ]
S 2 f η σ · a θ f η K a · exp [ j 4 π λ R 0 j π d a z 2 2 λ R 0 j f η K a d a z 2 v s ) 2 ]
where K a is the azimuth frequency-modulated rate, which is given by K a = 2 v s 2 / λ · R 0 . Therefore, the ith-order ambiguous signal can be expressed as
P a m b , s = i 0 [ B d 2 B d 2 | S 1 f η + i · P R F + S 2 f η + i · P R F | 2 d f η ]
where the subscript s indicates that the formula corresponds to the synthesis method. Therefore, the AASR is given by
A A S R s = P a m b , s P t o t a l
In the case of channel mismatch and the non-ideal sampling in azimuth, assuming that the first channel is the reference channel, the frequency domain form of the signal in the second channel can be re-expressed as
S 2 e r r f η α · σ · a θ f η K a · exp [ j 4 π λ R 0 j π d a z + Δ x b 2 2 λ R 0 j f η K a d a z + Δ x b 2 v s 2 ] · exp j Δ φ
In this case, the azimuth ambiguous energy is given by
P a m b , s e r r = i 0 [ B d 2 B d 2 | S 1 f η + i · P R F + S 2 e r r f η + i · P R F | 2 d f η ]
Therefore, the AASR of the synthesis method with channel mismatch is given by
A A S R s e r r = P a m b , s e r r P t o t a l

2.4. Noise Equivalent Sigma Zero

The physical meaning of the NESZ is the backscatter coefficient of the corresponding ground target when the signal-to-noise ratio (SNR) output by the radar system is 1. For the two methods, the azimuth loss factor will be different due to the difference in the equivalent beam width in azimuth. Furthermore, the reconstruction method will also be affected by the SNR scaling factor of the reconstruction filter. The signal of each channel will be weighted by the reconstruction filter, resulting in a change in the SNR gain. The NESZ of the multichannel SAR system and the detailed meaning of each parameter in the formula can be found in [23]:
N E S Z = 256 π 3 · k · B r · v s · L · L a z · Θ b f · Θ N E S Z P t · G θ 0 R 3 θ 0 · 1 sin θ i n c · λ 3 · c · N · P R F · T p
It is worth mentioning that as Θ b f is normalized to P R F u n i , an additional compensation factor Θ N E S Z = P R F / P R F u n i is required; P R F u n i is the ideal pulse repetition frequency. The SNR scaling factor is given by [23]
Θ b f N · i = 1 N E | P i f η | 2 · rect f η B d
where E · represents the expected value operation.
Both methods can calculate the NESZ according to (23). It should be noted that the azimuth loss factor L a z of the two methods is different, and the synthesis method does not need to consider the SNR scaling factor Θ b f of the reconstruction filter.

2.5. Block Adaptive Quantization

A technique called BAQ is commonly used for raw data compression in SAR systems. For the LT-1 SAR system, the BAQ compression levels can be selected between 8:6, 8:4, 8:3, and 8:2, where the first digit stands for the 8-bit analog-to-digital converter quantization, while the second digit is the number of bits per I/Q-sample resulting after BAQ compression. As shown in Figure 3, the two receiving signals are compressed by the BAQ algorithm and downlinked to the ground processing system. Therefore, whether the two preprocessing methods have differences under different BAQ compression levels is researched.
The performance of the BAQ can be evaluated by [32]
S N R b a q = S N R i n 1 + E | n b a q t | 2 C G 2 E | n n o i t | 2
where the receiver noise n n o i t is modeled as additive white Gaussian noise that is uncorrelated to the input signal, and n b a q t represents the quantization noise caused by the BAQ compression. Compared with n b a q t , the influence of sampling quantization noise on signal noise power is very small and can be ignored. C G refers to the conversion gain (CG).
According to (25), the input SNR is not sufficient to evaluate the performance of the BAQ. A more important performance parameter is the CG, which can be expressed as C G = C x y / R x x [32]. R x x represents the auto-correlation of the input signal x t before the BAQ, and C x y represents the cross-correlation of the input signal x t and the BAQ output y t . The CG can be regarded as the figure-of-merit of the loss of BAQ compression.

3. Results

The differences between the two methods on the system performance and imaging quality are shown in this section. The system performance indicators, including the AASR, the NESZ, and the CG, are given in Section 3.1. The imaging quality under the two methods, together with hardware-in-the-loop simulation with point targets and distributed targets, is demonstrated in Section 3.2.

3.1. System Performance

In this subsection, the research of the system performance under the “L1A_SM_S” working mode is performed to compare the differences between the two preprocessing methods. In the “L1A_SM_S” working mode, the SAR system is driven in stripmap mode with a swath width of 100 km. In order to avoid the interference of the transmitted signal and the nadir echo, and take into account the resolution and swath width, the five beam configurations (beam1 to beam5) are selected in this mode. The detailed parameters of the five beams are given in Table 2, and the detailed performance requirements of this working mode are shown in Table 3. More visually, a timing diagram can be used to reflect the selection of the five beam configurations. In Figure 4a, the red solid lines represent the transmission events, the green solid lines represent the nadir echo, and the blue solid lines represent the five beam configurations. The ground resolution corresponding to the five beams is shown in Figure 4b, which is a reference for the performance in the range direction of this working mode.

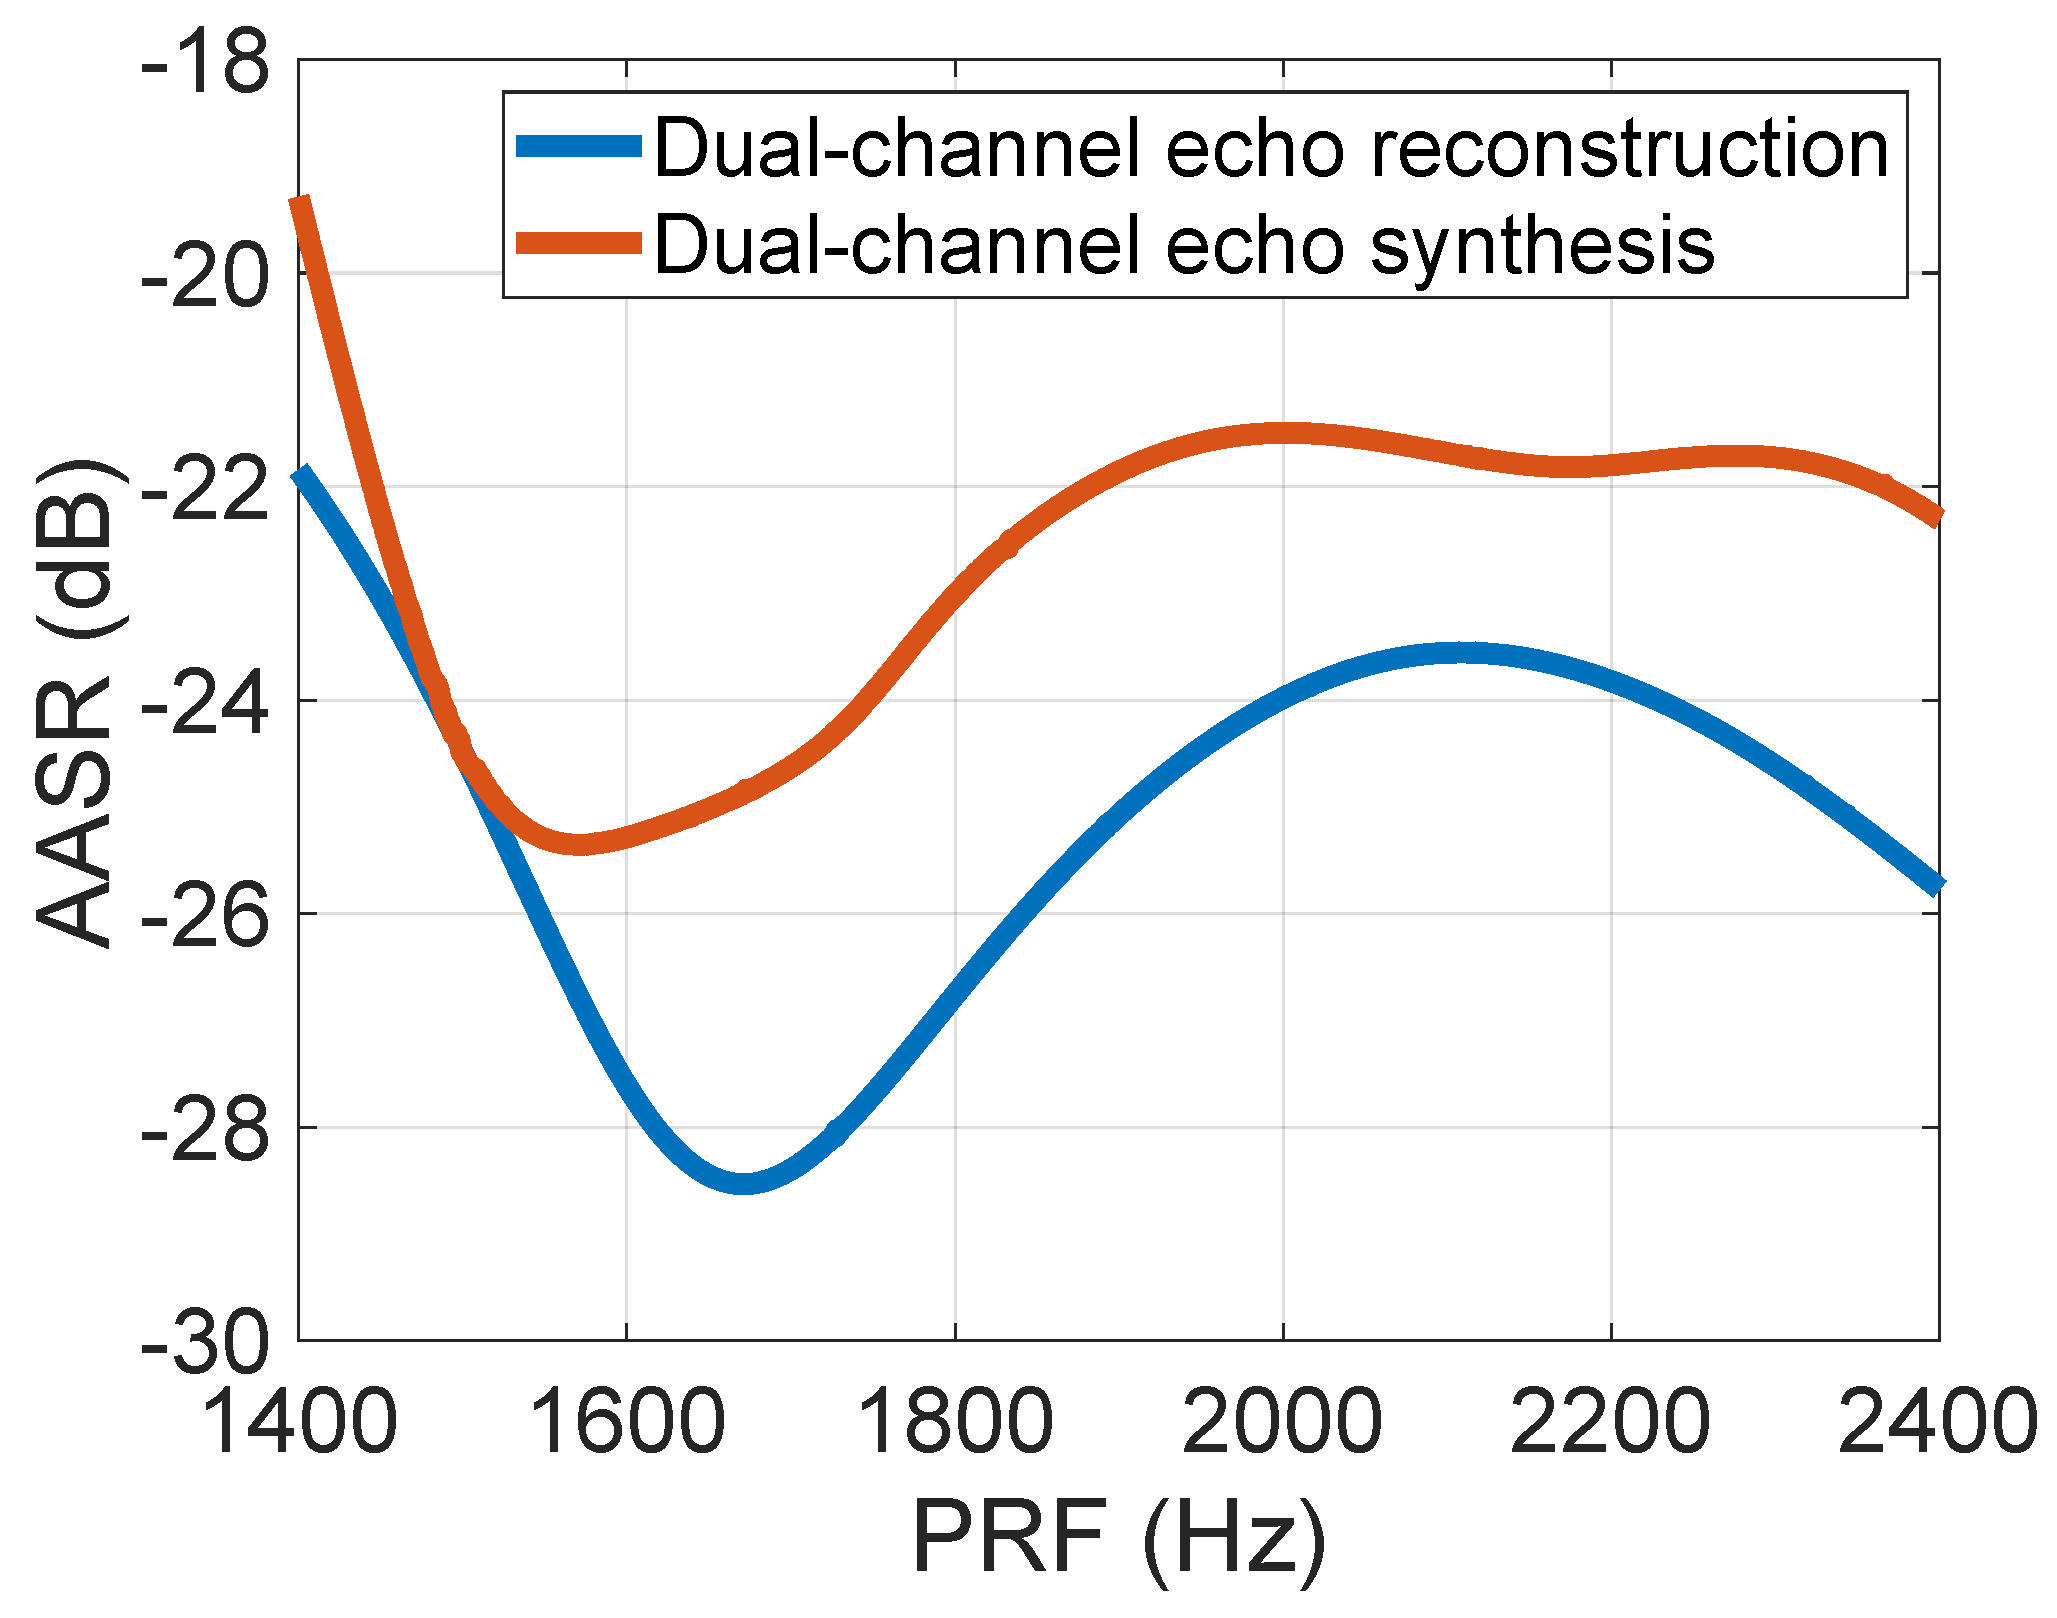
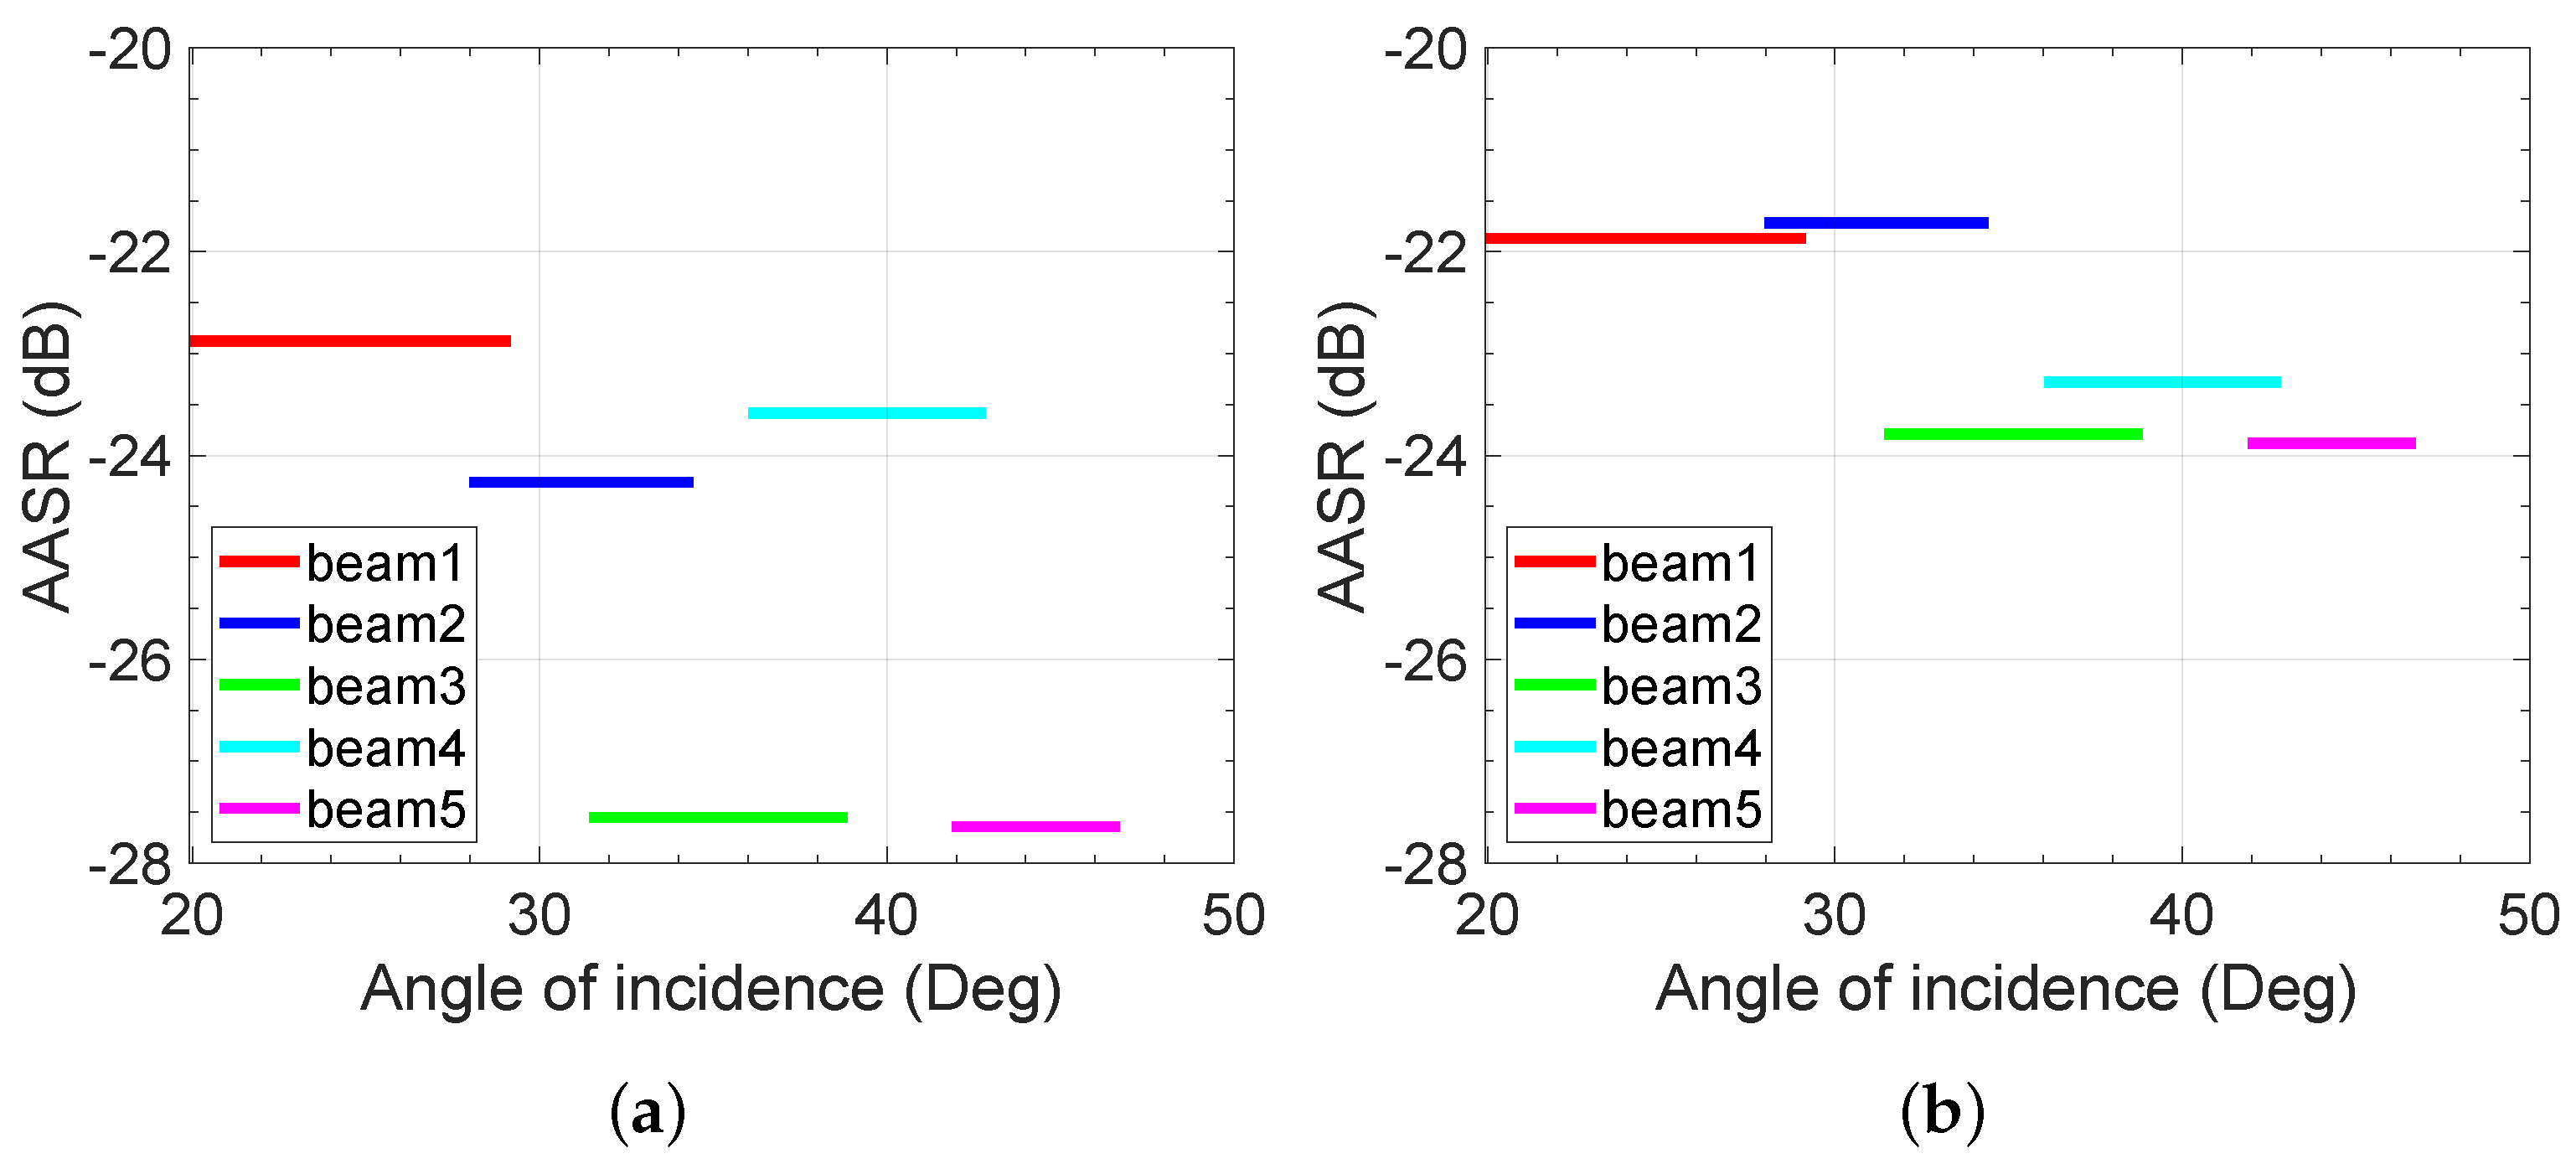
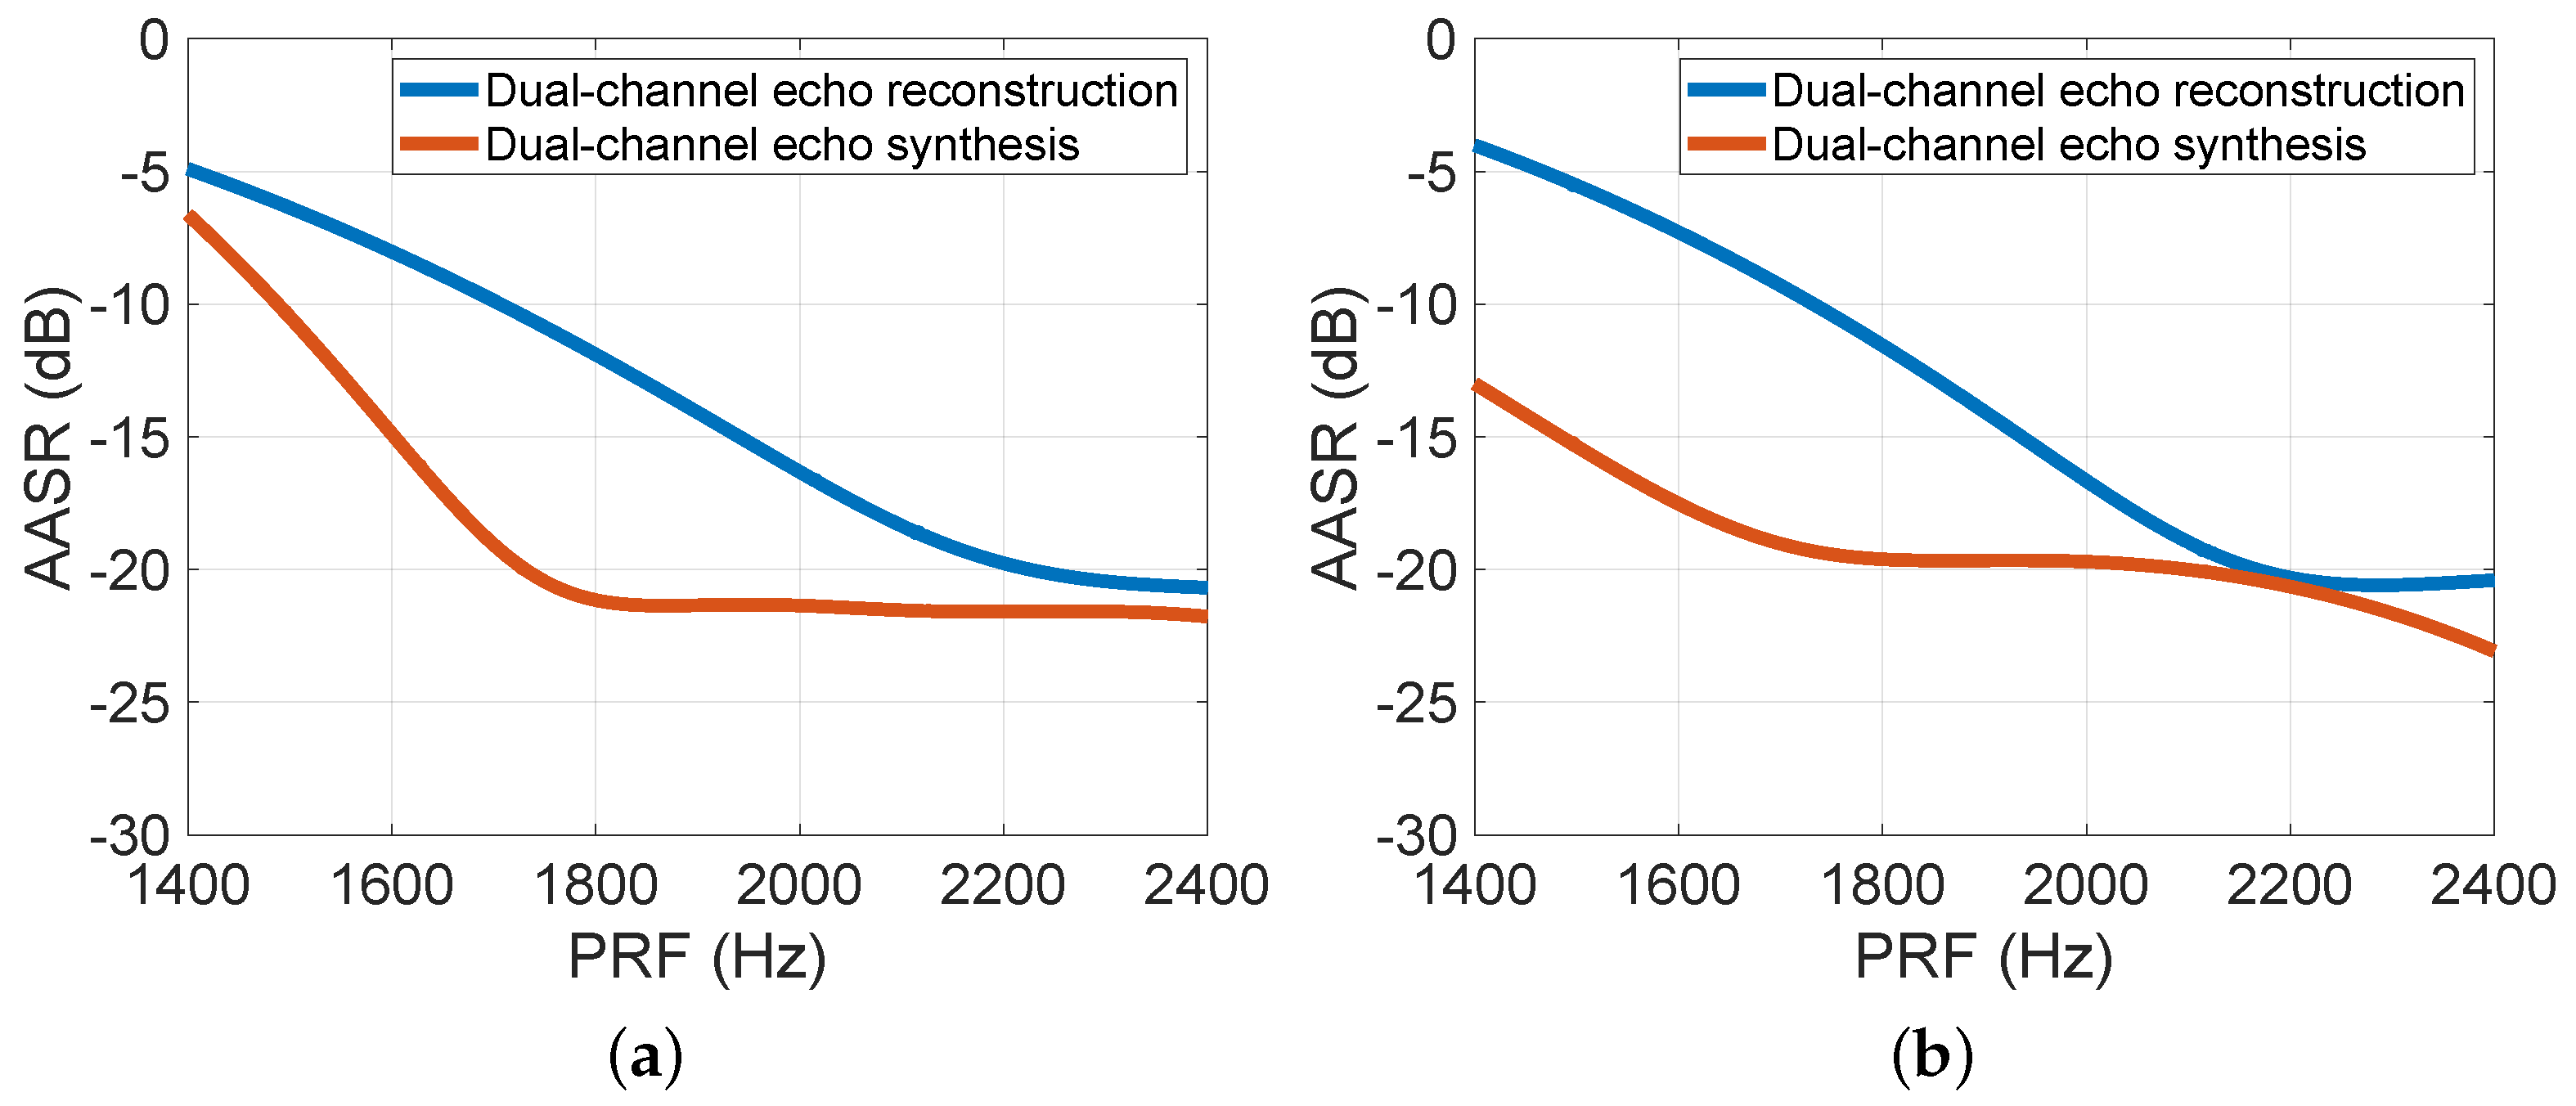
3.1.1. Azimuth Ambiguity-to-Signal Ratio
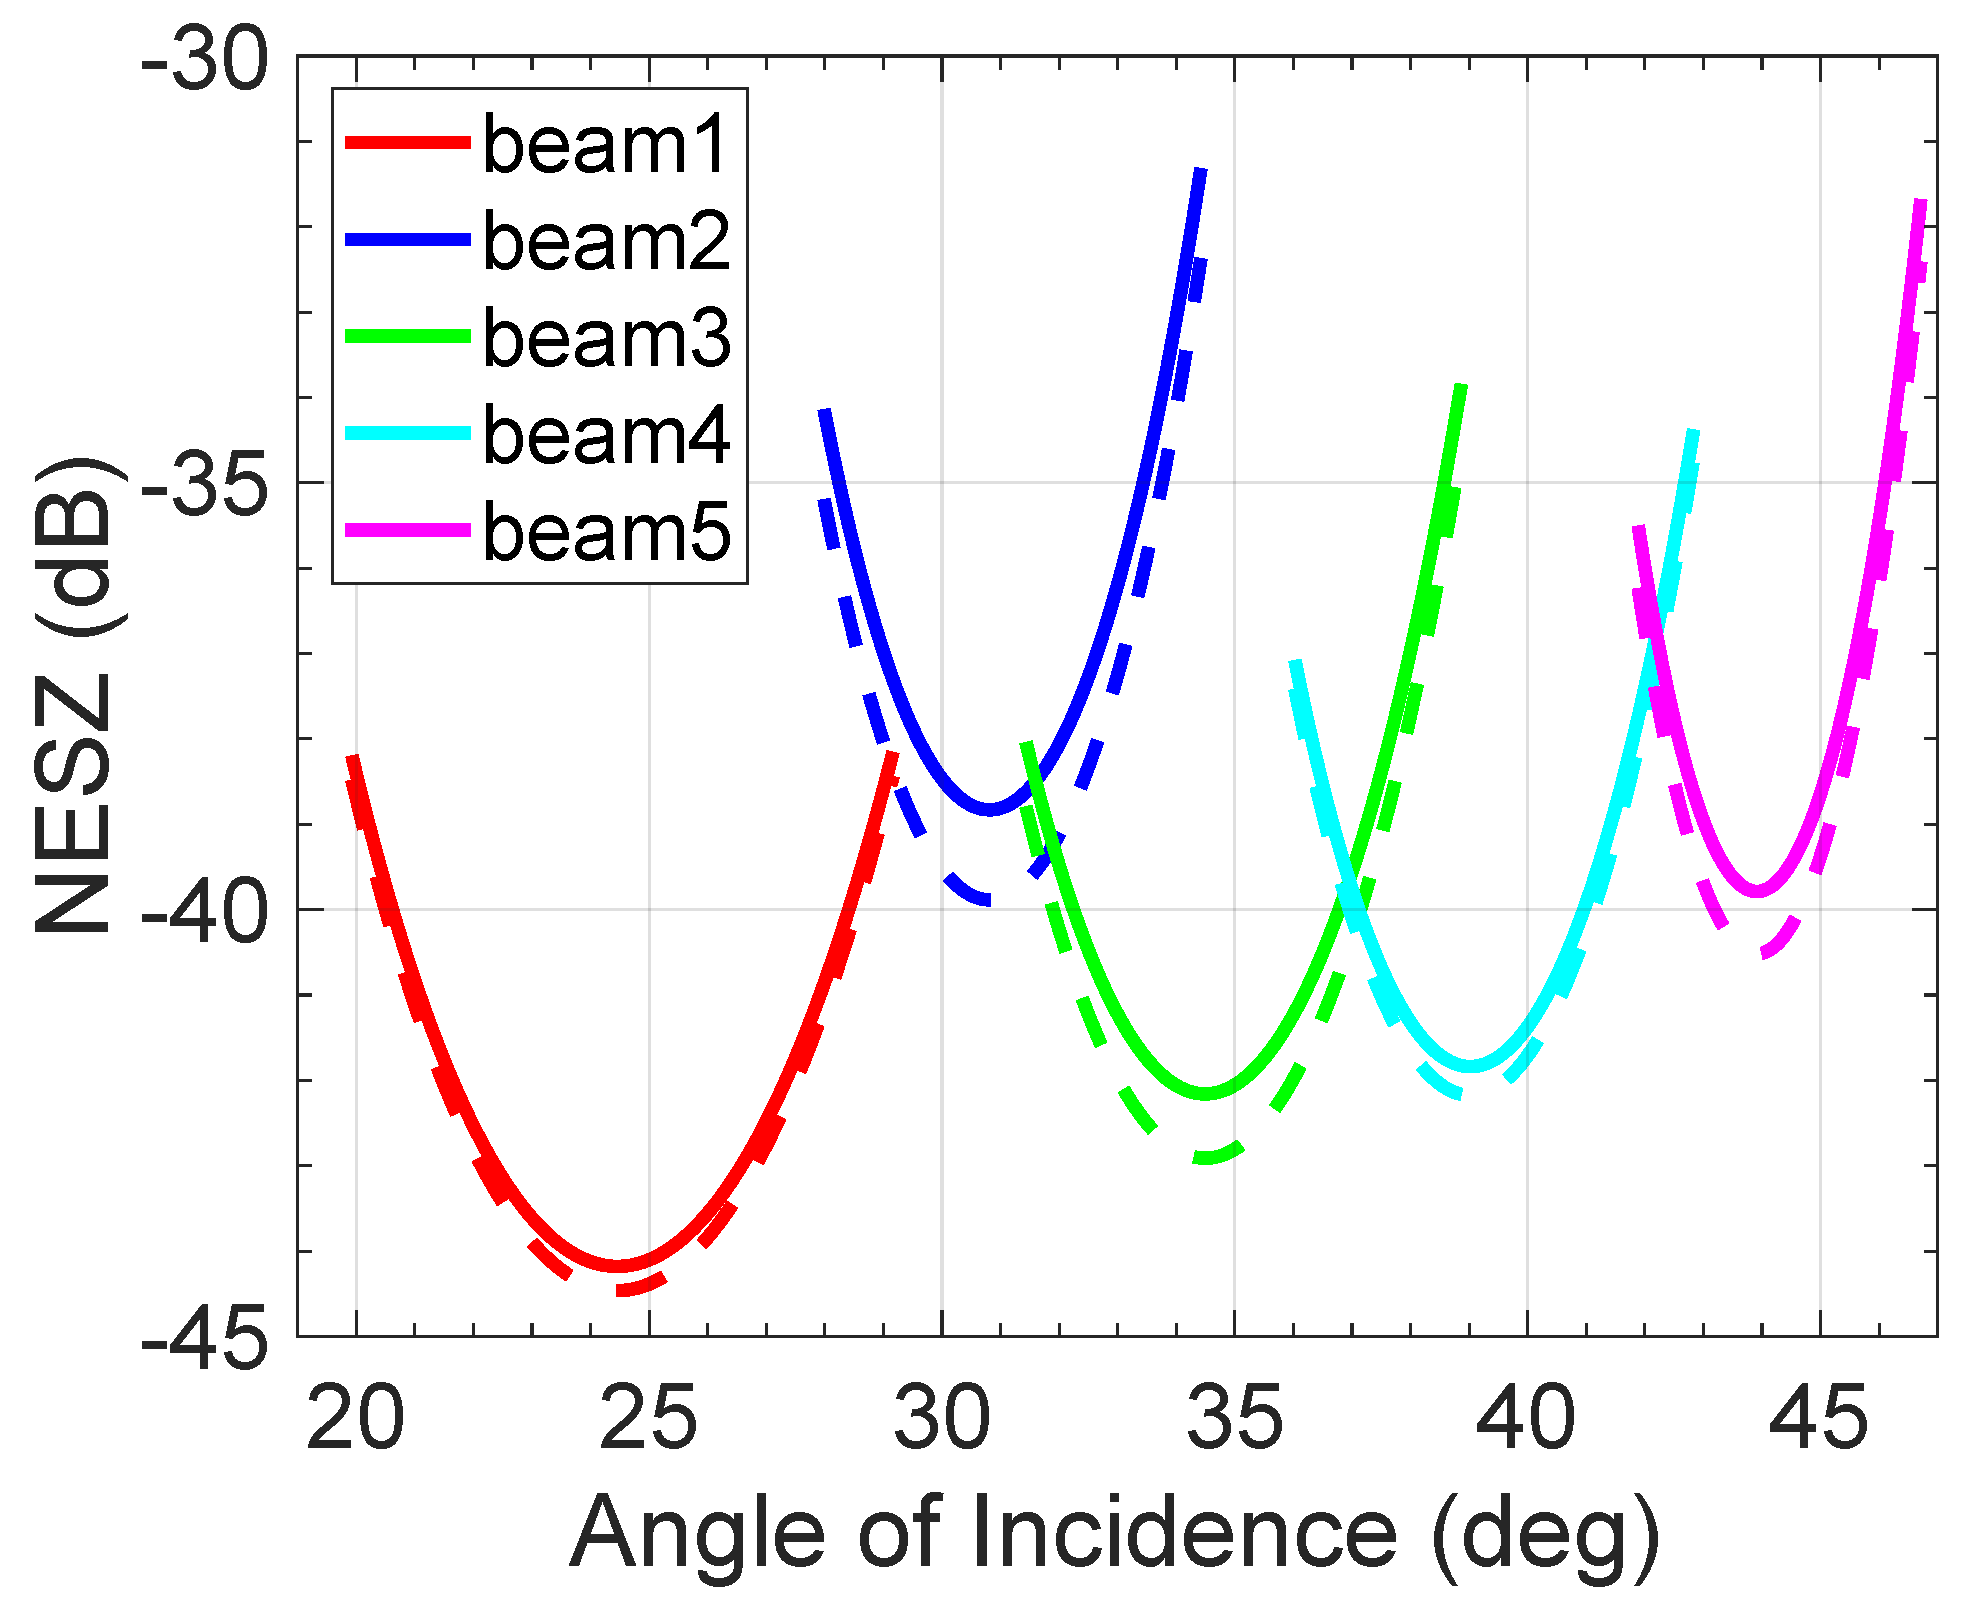
The two preprocessing methods may have different effects on azimuth ambiguity performance. According to the derivation results in Section 2.3, simulations of the AASR under the two methods referring to Table 1 and Table 2 are carried out [25]. It should be noted that the equivalent beam angle in azimuth corresponding to the two methods is different, which will lead to different Doppler bandwidths. The influence of the AASR under the two methods is shown in Figure 5, in which the channel mismatch is accurately corrected and the along-track baseline error is not considered. The overall azimuth ambiguous performance of the synthesis method is worse than that of the reconstruction method. This is because when echoes from two apertures are directly synthesized under the synthesis method, the energy of the mainlobe signal is summed, and the energy of ambiguous signals is also superimposed, which causes a sharp deterioration of the AASR. Although ambiguous signals are also weighted by the reconstruction filter when Doppler spectrum reconstruction is performed under the reconstruction method, the effect of weighting on the AASR is inferior to the direct superposition of ambiguous signals. The AASR of the five beams in the “L1A_SM_S” working mode under the two methods is shown in Figure 6. The AASR under both methods is less than −20 dB, which meets the performance requirements of the LT-1 SAR system. Therefore, under the ideal case, the reconstruction method has better azimuth ambiguity performance than the synthesis method.
Then, the AASR of the two methods is evaluated separately under the additional errors of the channel mismatch error and the along-track baseline error. Firstly, the channel mismatch caused by the system and calibration error will affect the AASR [25]. Although channel mismatch correction needs to be carried out before the preprocessing step, there will still be residual channel phase error in some special cases, for example, in the case of low SNR. As the influence of channel phase error is more significant in the azimuth ambiguity compared with the amplitude error, in the next simulations of channel mismatch the value of 5° (the channel phase error) is chosen as the realistic value of the achievable accuracy of modern hardware [25]. According to the derivation results in Section 2.3, the influence of the AASR in the case of a 5° channel phase error under the two methods is shown in Figure 7a. The overall azimuth ambiguous performance of the synthesis method is better than that of the reconstruction method in the case of a 5° channel phase error. When the Doppler spectrum reconstruction is performed under the reconstruction method, in addition to the energy of ambiguous signals being weighted by the reconstruction filter, the additional error signal introduced by channel errors is also weighted. This will cause the mismatch of the reconstruction filter, which will aggravate the azimuth ambiguity of the reconstructed signal. Secondly, the along-track baseline error will deteriorate azimuth ambiguity performance, and simulation results are given in Figure 7b. It can be seen that the AASR affected by the along-track baseline error is similar to phase imbalance. The mismatch of the equivalent phase center causes the mismatch of the reconstruction filter and also affects the coherent superposition of the synthesis method. In summary, the synthesis method will have better azimuth ambiguity performance than the reconstruction method when considering the possible systematic errors.

3.1.2. NESZ

The different effects of the two methods on the NESZ are given. According to the derivation in Section 2.4, the simulation results are shown in Figure 8. The x-axis represents the incident angle of the beam, and the beams are derived from the “L1A_SM_S” working mode in the LT-1 mission. The solid line represents the NESZ under the reconstruction method, and the dashed line represents the NESZ under the synthesis method. The NESZ under the two methods is less than 31 dB, but the synthesis method causes the system to have a better NESZ. The main reason is that the reconstruction filter will reduce the SNR of the system, i.e., the useful signal can be reconstructed by the reconstruction filter while the noise signal cannot. Therefore, the synthesis method can reduce the lowest backscatter coefficient of the imaging target compared with the reconstruction method.

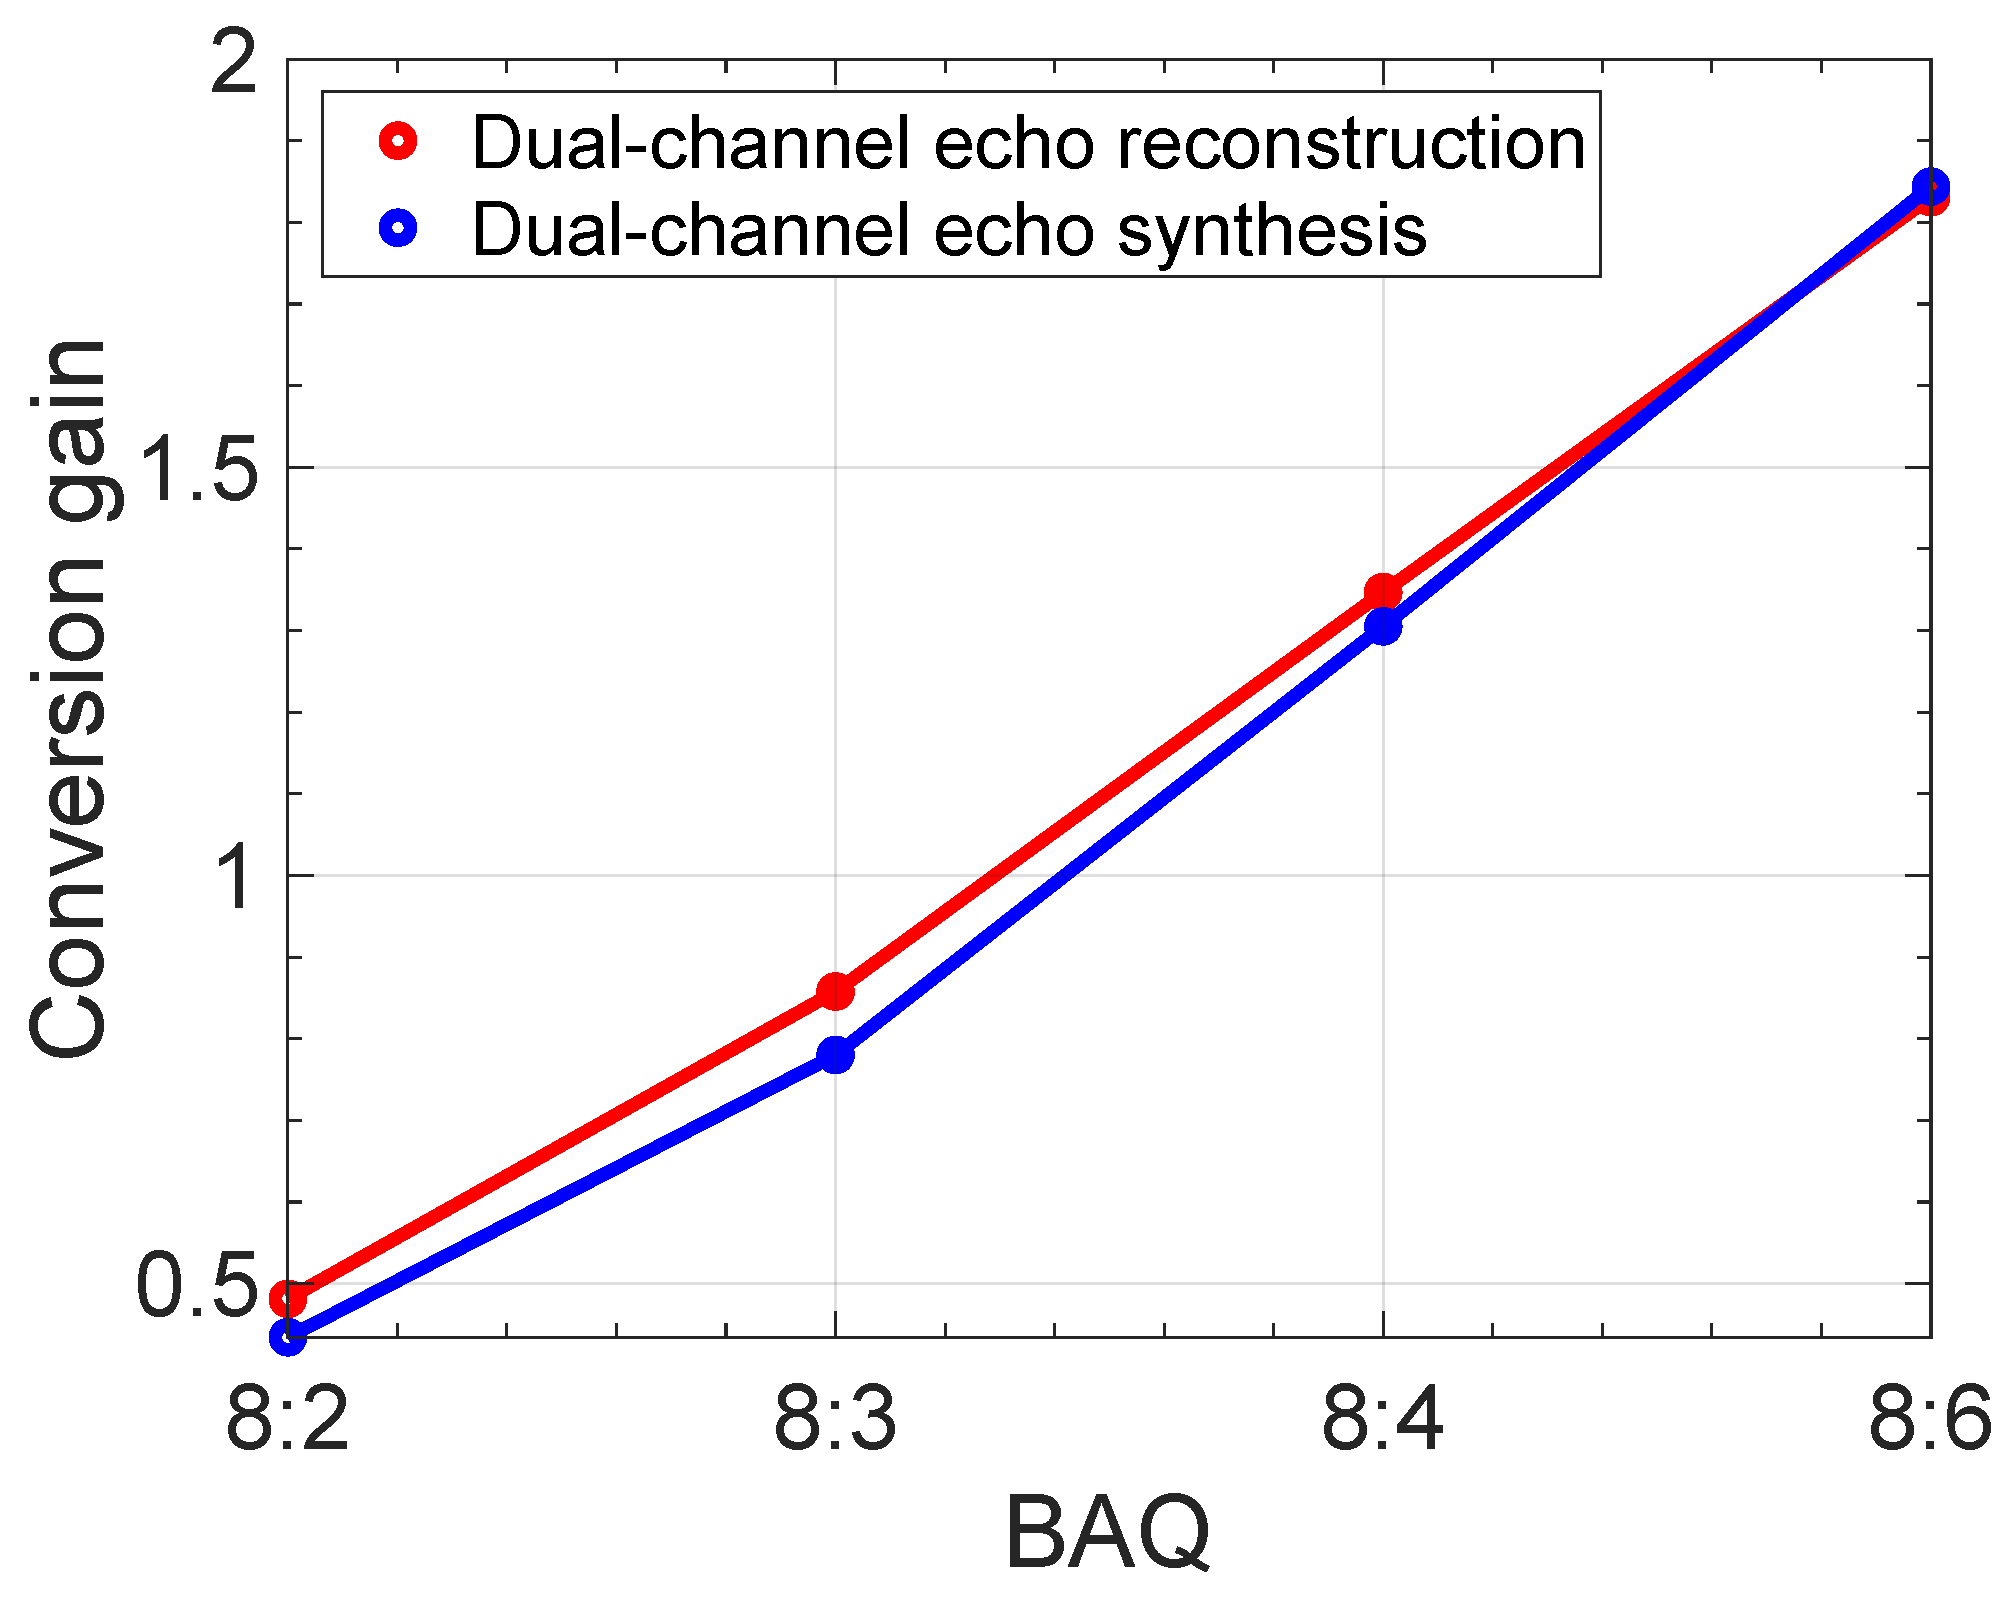
3.1.3. BAQ Performance

According to the derivation in Section 2.5, the CG is used as an indicator [32], and the echo simulator of the ground verification system of the LT-1 is used to evaluate the BAQ performance under the two preprocessing methods in the “L1A_SM_S” working mode. The simulated digital echo signal is injected into the echo simulator, and the radar receiver is used to receive the echo signal output from the echo simulator. The 8-bit uncompressed data are taken as x t , and the output signal of each BAQ compression level is taken as y t . Thus, the CG of the two methods under different BAQ compression levels can be calculated, which is shown in Figure 9. When the BAQ compression level is high, such as 8:6, the CG of the synthesis method is larger. However, when the BAQ compression level is low, such as 8:2, the CG of the reconstruction method is larger. BAQ compression will bring quantization loss, and the reconstruction filter will aggravate the quantization loss. Therefore, when the BAQ compression level is small, the quantization noise loss is larger, and the effect of the reconstruction filter on quantization noise is not significant; however, when the BAQ compression level is large, the quantization noise is relatively smaller, and the effect of the reconstruction filter on quantization noise is relatively greater.

3.2. Imaging Quality

In this subsection, the test data acquired by the ground validation system of the LT-1 is used for the hardware-in-the-loop simulation with point targets and distributed targets to compare the imaging quality between the two preprocessing methods, and this approach can reasonably demonstrate the imaging performance of the actual system in the LT-1. The so-called hardware-in-the-loop simulation is characterized by the SAR payload, antenna, and other physical equipment contained in the simulation loop, which can truly reflect the error characteristics of the actual system. Therefore, the radar signal from the real SAR system will be used as the reference signal of the echo simulation, and the azimuth modulation term of the echo will be provided by the all-digital simulation. Then, the two methods will be used to preprocess the echo signal after the channel mismatch correction, and imaging processing will be performed later.

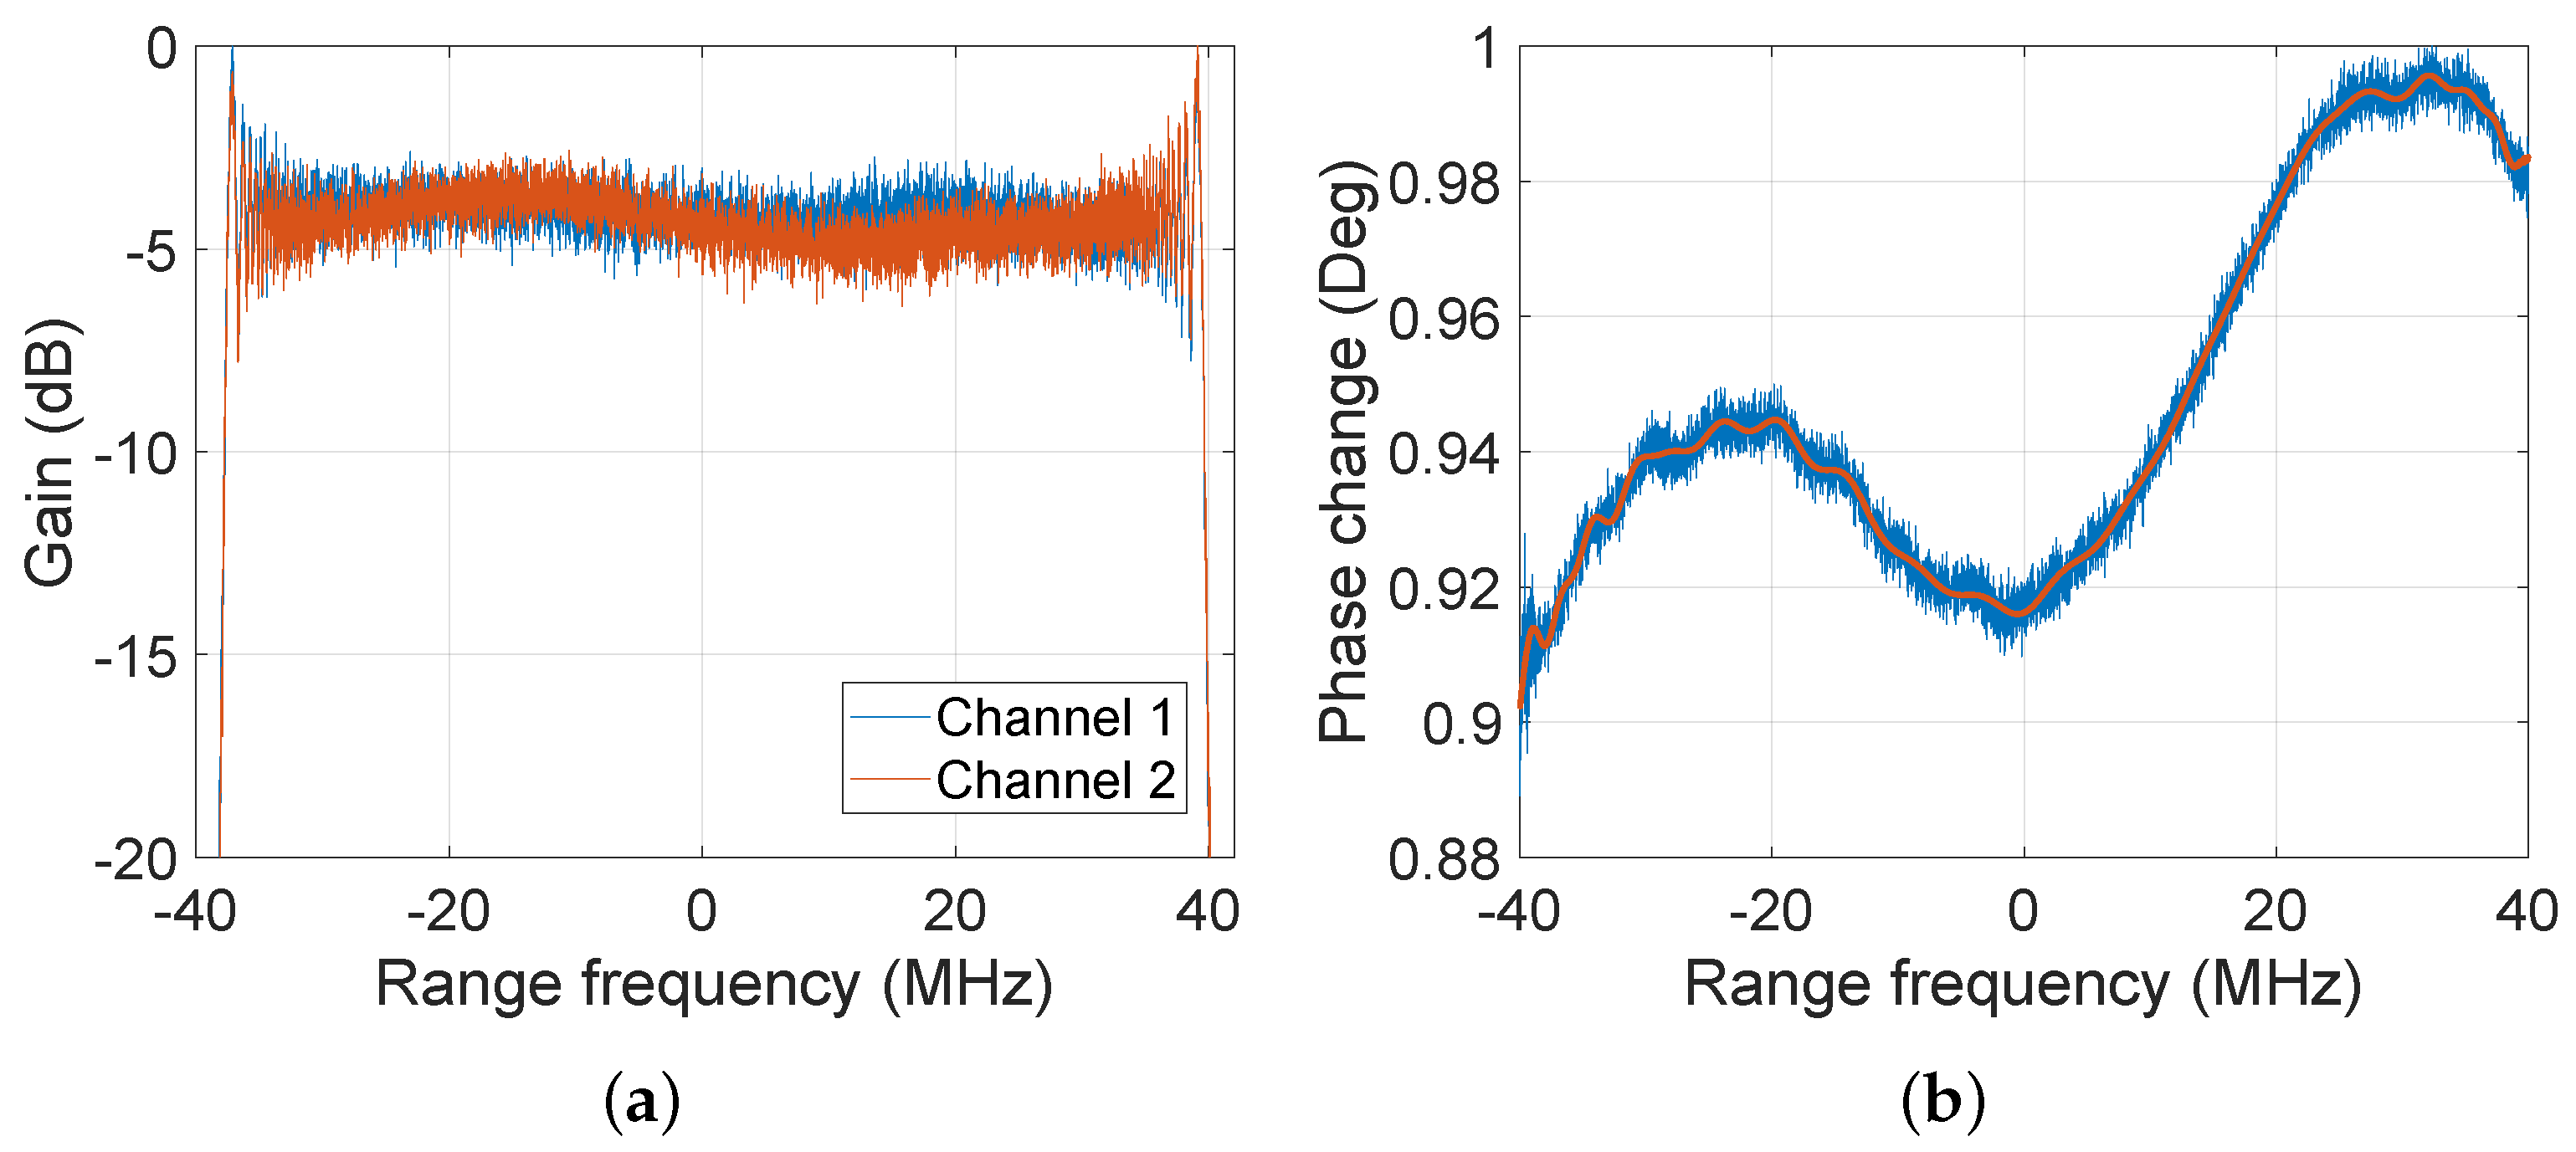
3.2.1. System Calibration Signal

In the actual system, there will inevitably be differences in signals between different channels. Thus, the system calibration signals are used as the reference signals of the hardware-in-the-loop simulation. The amplitude–frequency characteristic curve of the dual-channel receiving signals from the ground verification system of the LT-1 is shown in Figure 10a. It can be clearly seen that the amplitude–frequency characteristics are different, and the amplitude–frequency error factor between the two channels is approximately 0.9652. An additional constant phase error will be introduced to the echo due to the device and the link of the instrument. Using the azimuth cross-correlation method [33], we can accurately estimate the phase error between the two channels and compensate for it. After removing the inherent constant phase error of the hardware, the phase change curve between the dual-channel receiving signals is shown in Figure 10b. The red line in the figure represents the fitted curve. The phase change is within 0.1°, which is small enough.

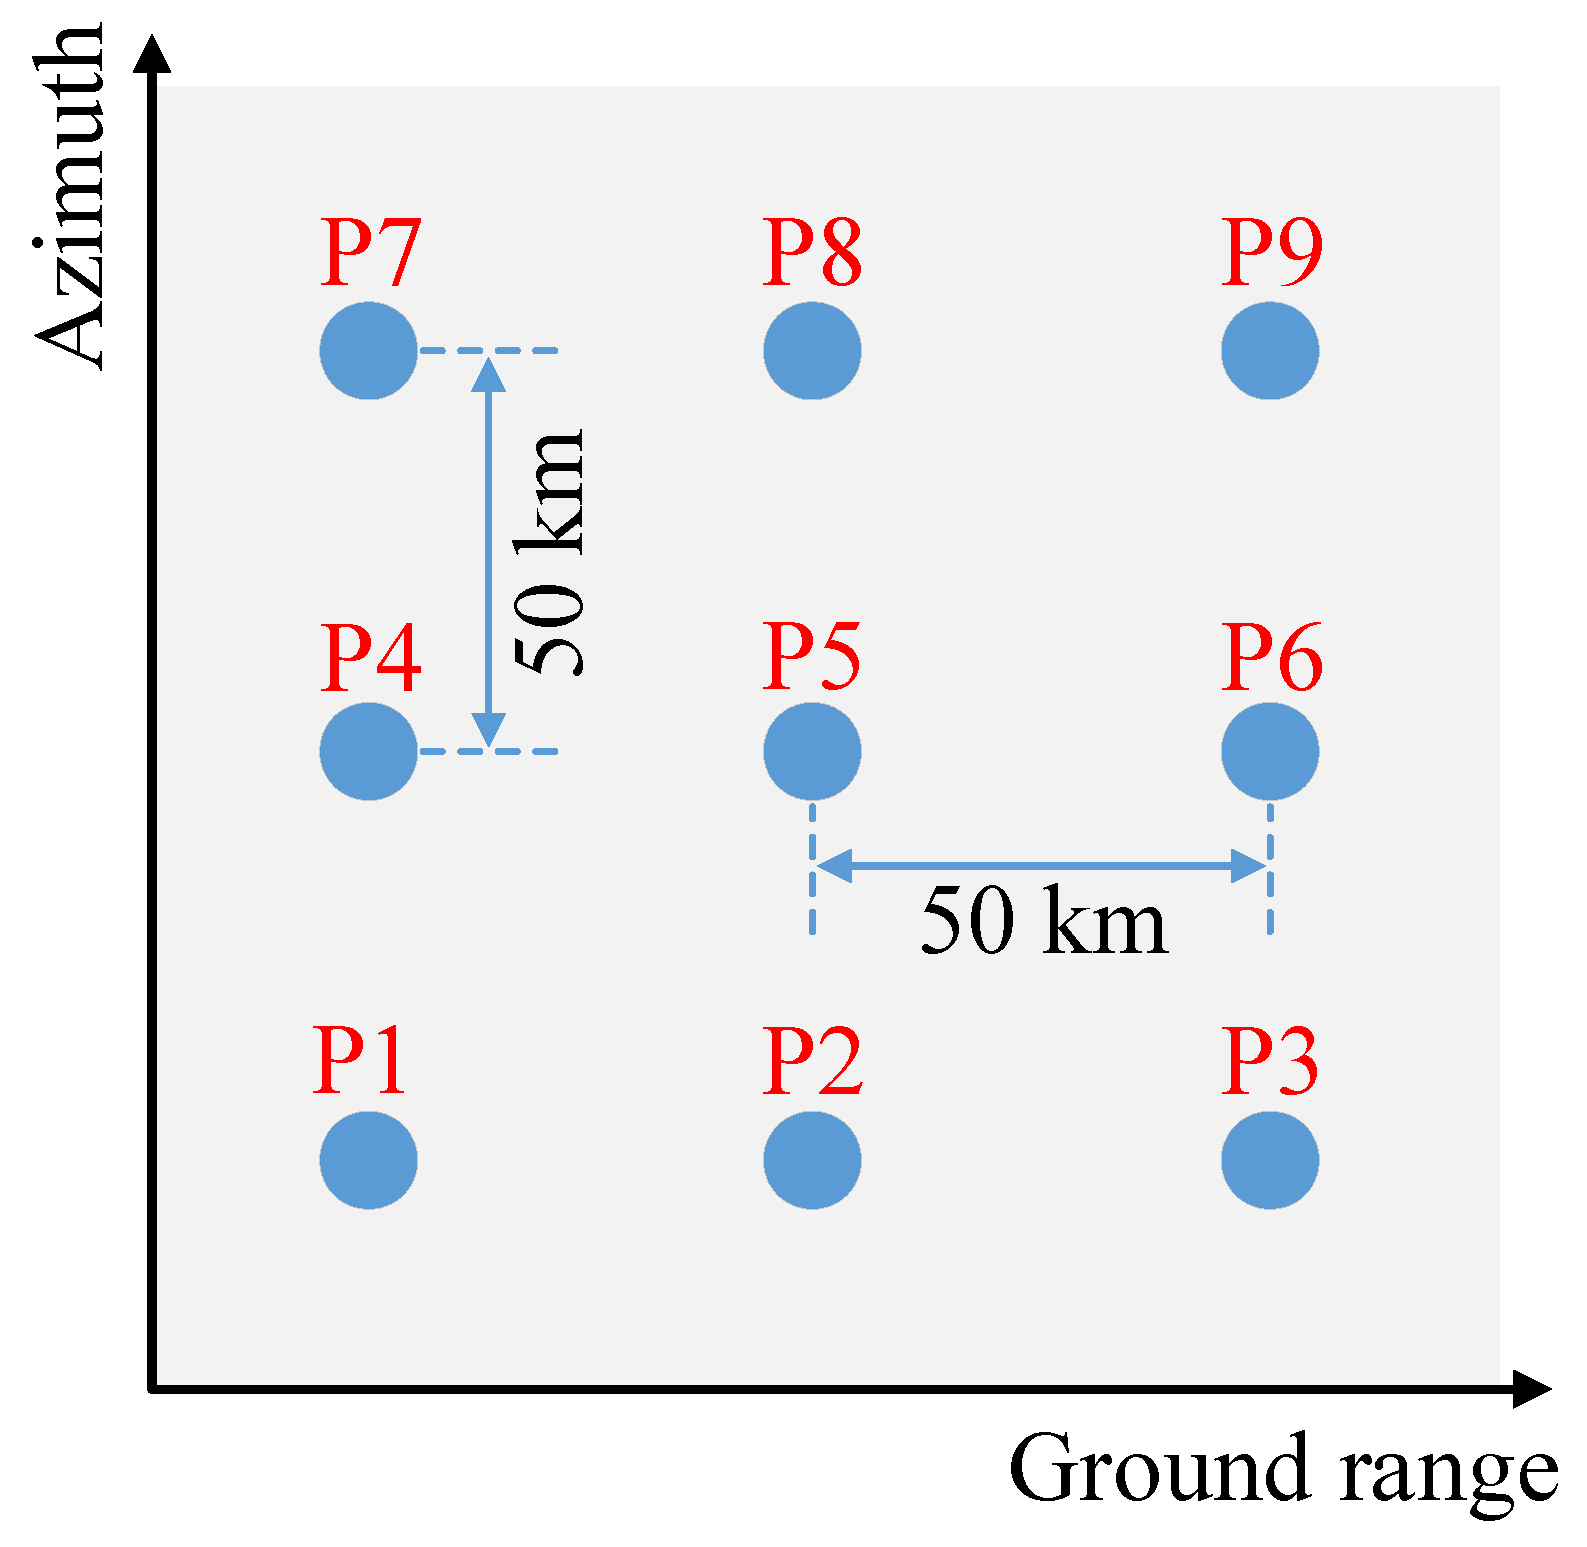
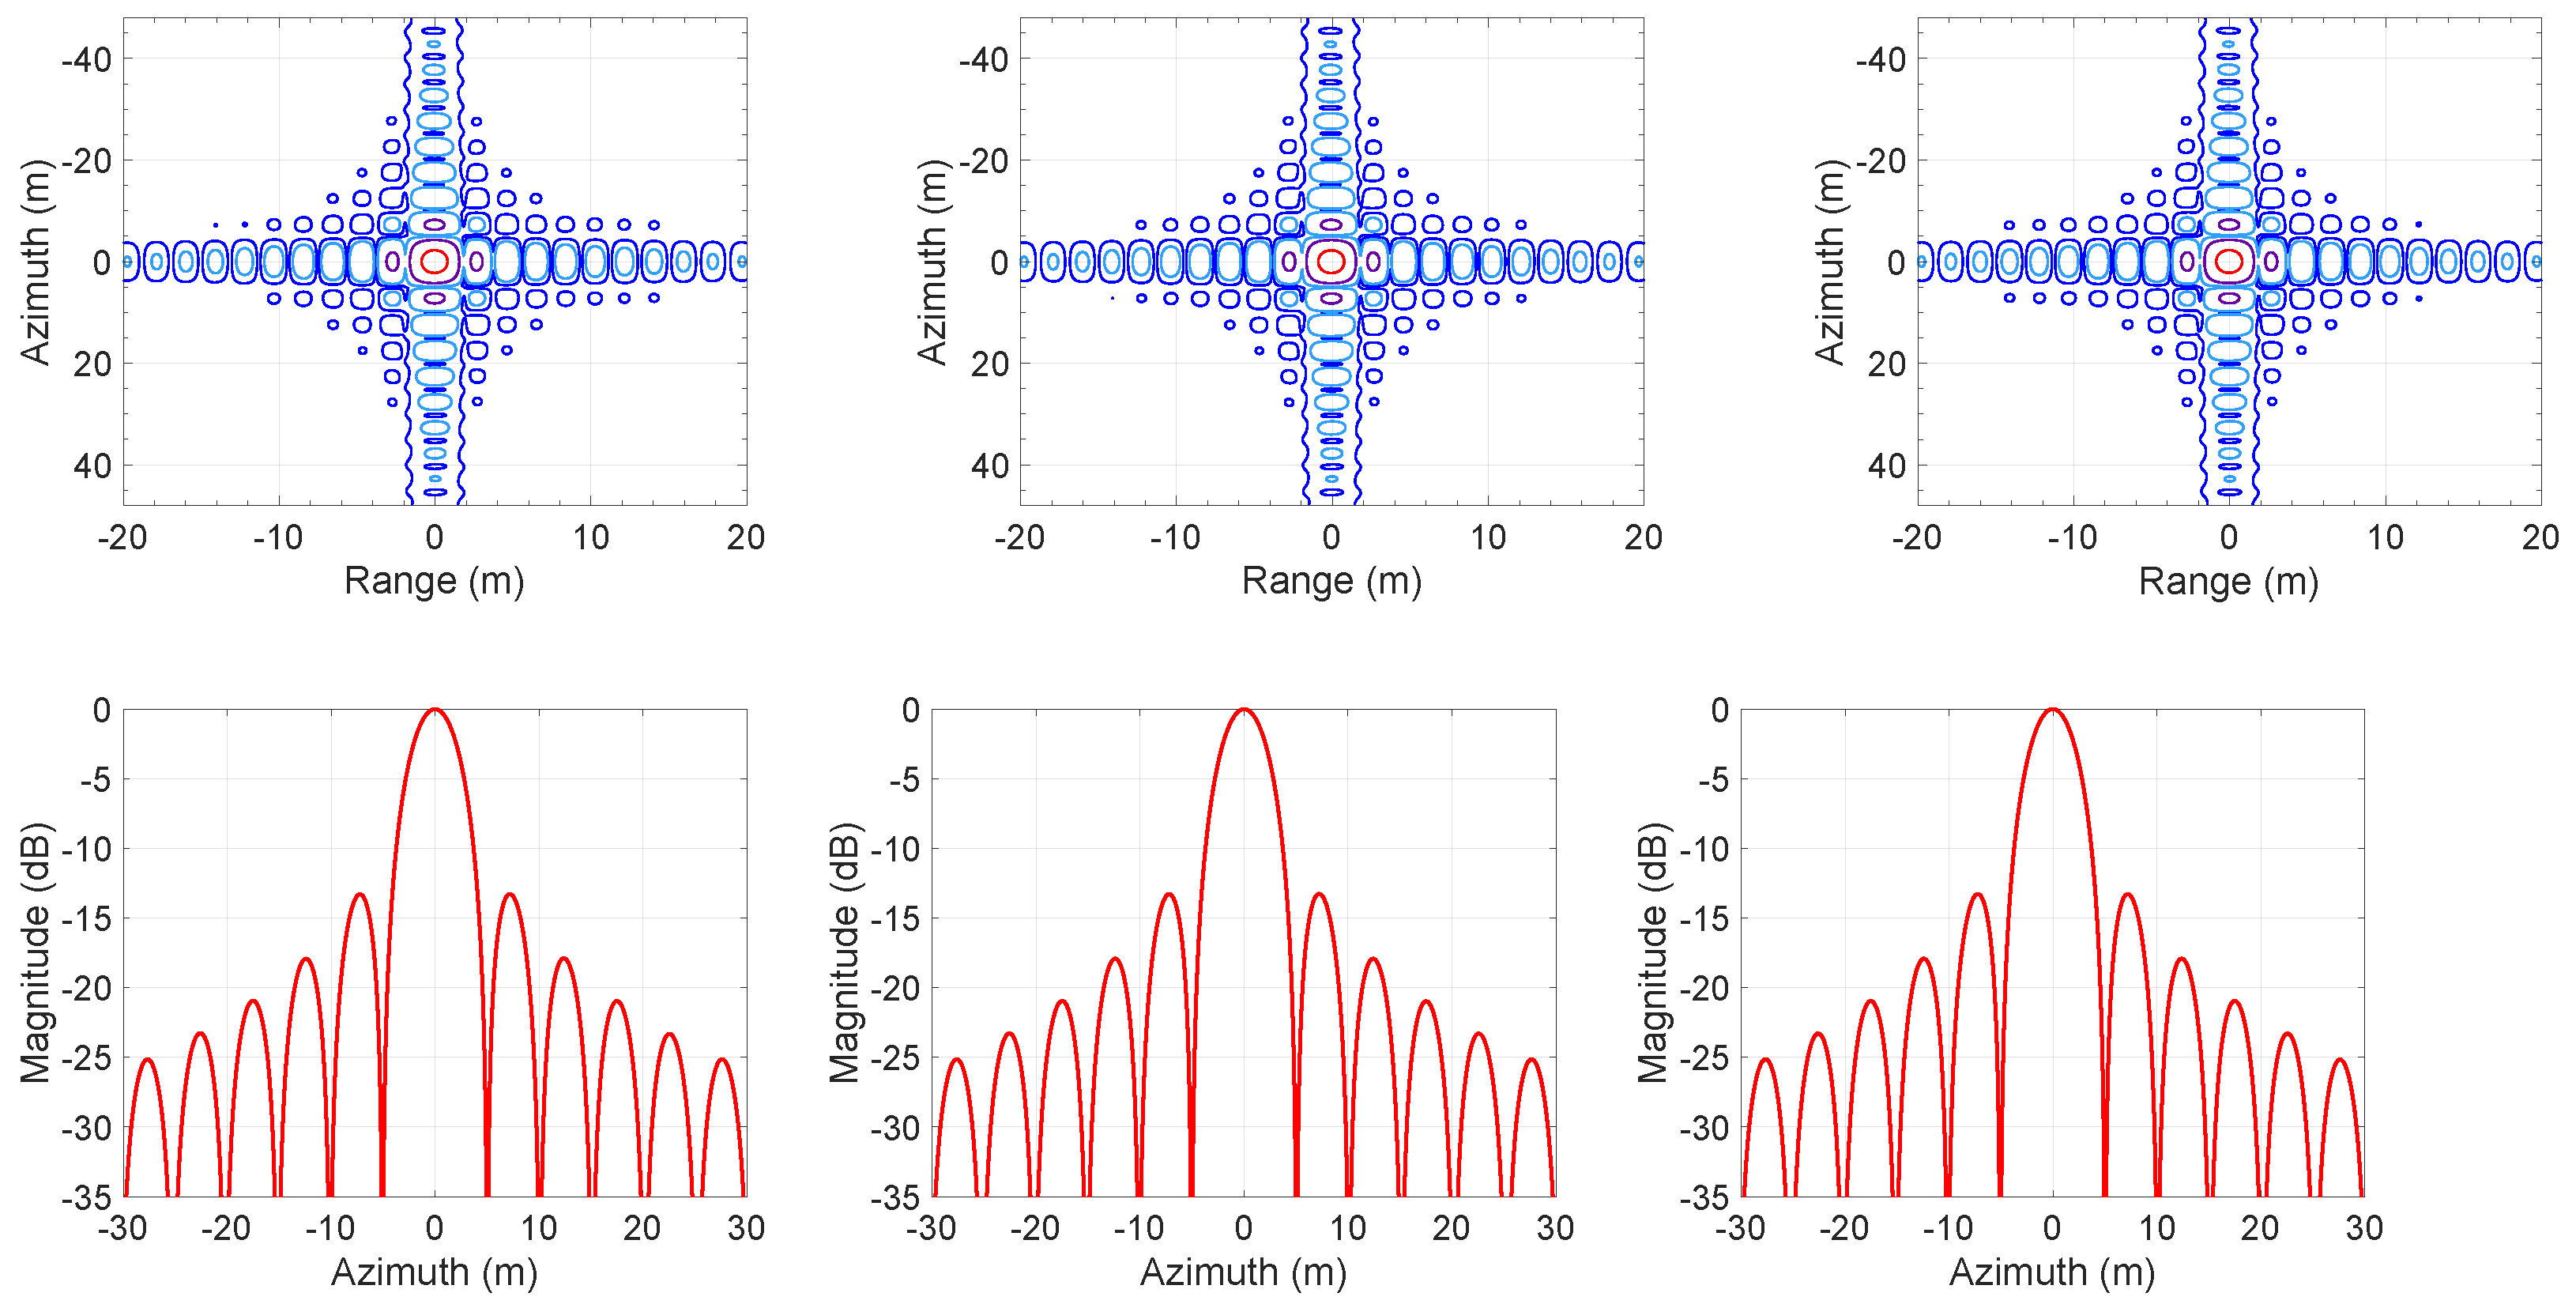
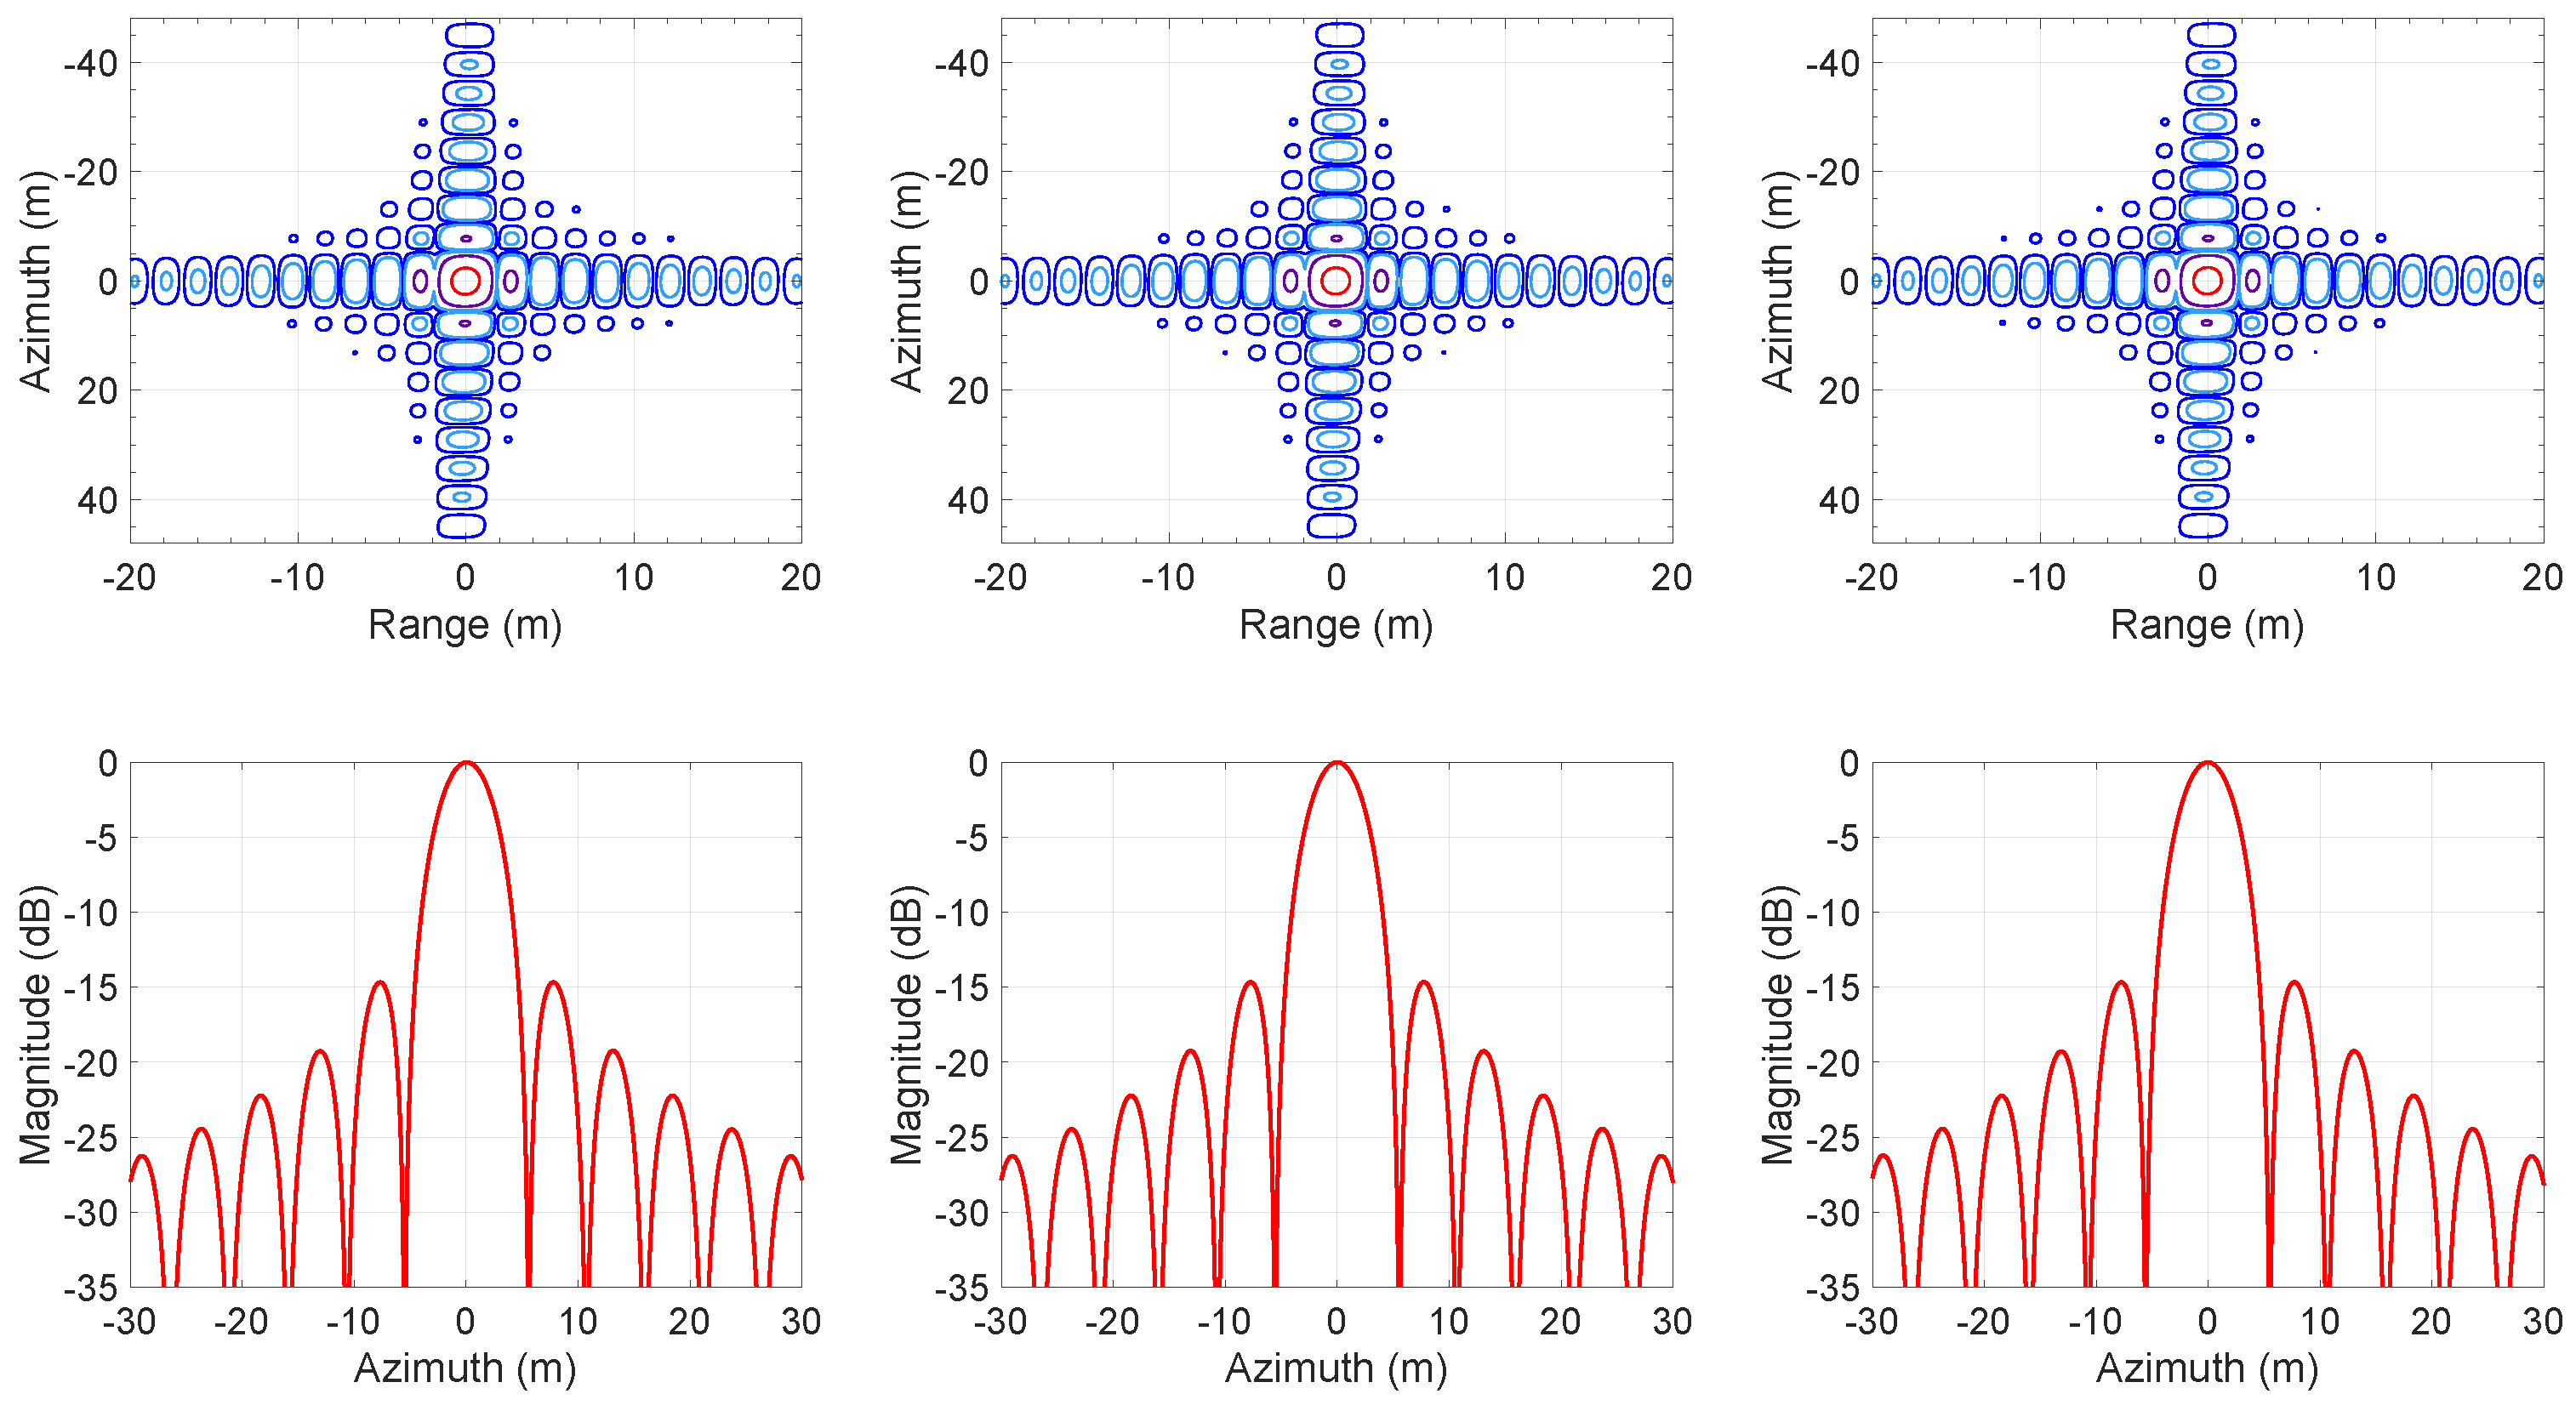
3.2.2. Results of Point Targets

The simulation of point targets adopts a nine-point grid, which is distributed in a 100 km × 100 km scene grid in ground range/azimuth, as shown in Figure 11. Beam1 of the “L1A_SM_S” working mode is adopted to parameterize the simulation, which is shown in Table 1 and Table 2. A rectangular window is used in both the range and azimuth processing instead of an actual antenna pattern, i.e., no weighting is used, which enables a more quantitative evaluation of imaging results. This paper uses a fast echo generation algorithm [34] to generate echoes, which can quickly and accurately realize BiSAR echo simulation.
Without loss of generality, point targets P1, P5, and P9 are chosen for analyzing the imaging quality, where P5 is the center of the scene (which is also the reference point target). The imaging results of the two methods are shown in Figure 12 and Figure 13, and the evaluation of imaging results is shown in Table 4. It is apparent that both methods can well realize the preprocessing of the dual-channel receiving signals and achieve the ideal focusing effect after the imaging processing. The theoretical ground range resolution of the two methods is the same; both are 3.96 m. However, due to the difference of the Doppler bandwidth, the theoretical azimuth resolution of the two methods is different, which is 4.68 m under the synthesis and 3.61 m under the reconstruction method corresponding to the Doppler frequencies of 1379 Hz and 1721 Hz, respectively. The evaluation of resolution in Table 4 is equal to theoretical values, and the evaluation of the PSLR and the ISLR is also normal. The reason why the side-lobe level is lower in the synthesis method is that more energy is concentrated in the main lobe, so the energy of the side lobe is decreased under the premise of a constant total energy. It can be concluded that the difference in imaging quality between the two methods is that the reconstruction method has a higher azimuth resolution than the synthesis method, which is in exchange for a doubled data volume to be processed.
As interference processing needs to ensure extremely high phase accuracy, it is necessary to verify whether these two preprocessing methods will affect the phase-preserving ability of the imaging algorithm. Suppose that the phase of the slant range R of the point target that needs to be retained after imaging processing is exp j 4 π R / λ . The phase-preserving evaluation obtains the phase difference between the phase of the focused point target and the abovementioned phase that needs to be retained, and the evaluation results are also shown in Table 4. Similarly, taking P1, P5, and P9 as examples, the phase-preserving accuracy of the two methods is approximately 0.1°, which is small enough, and can be ignored.

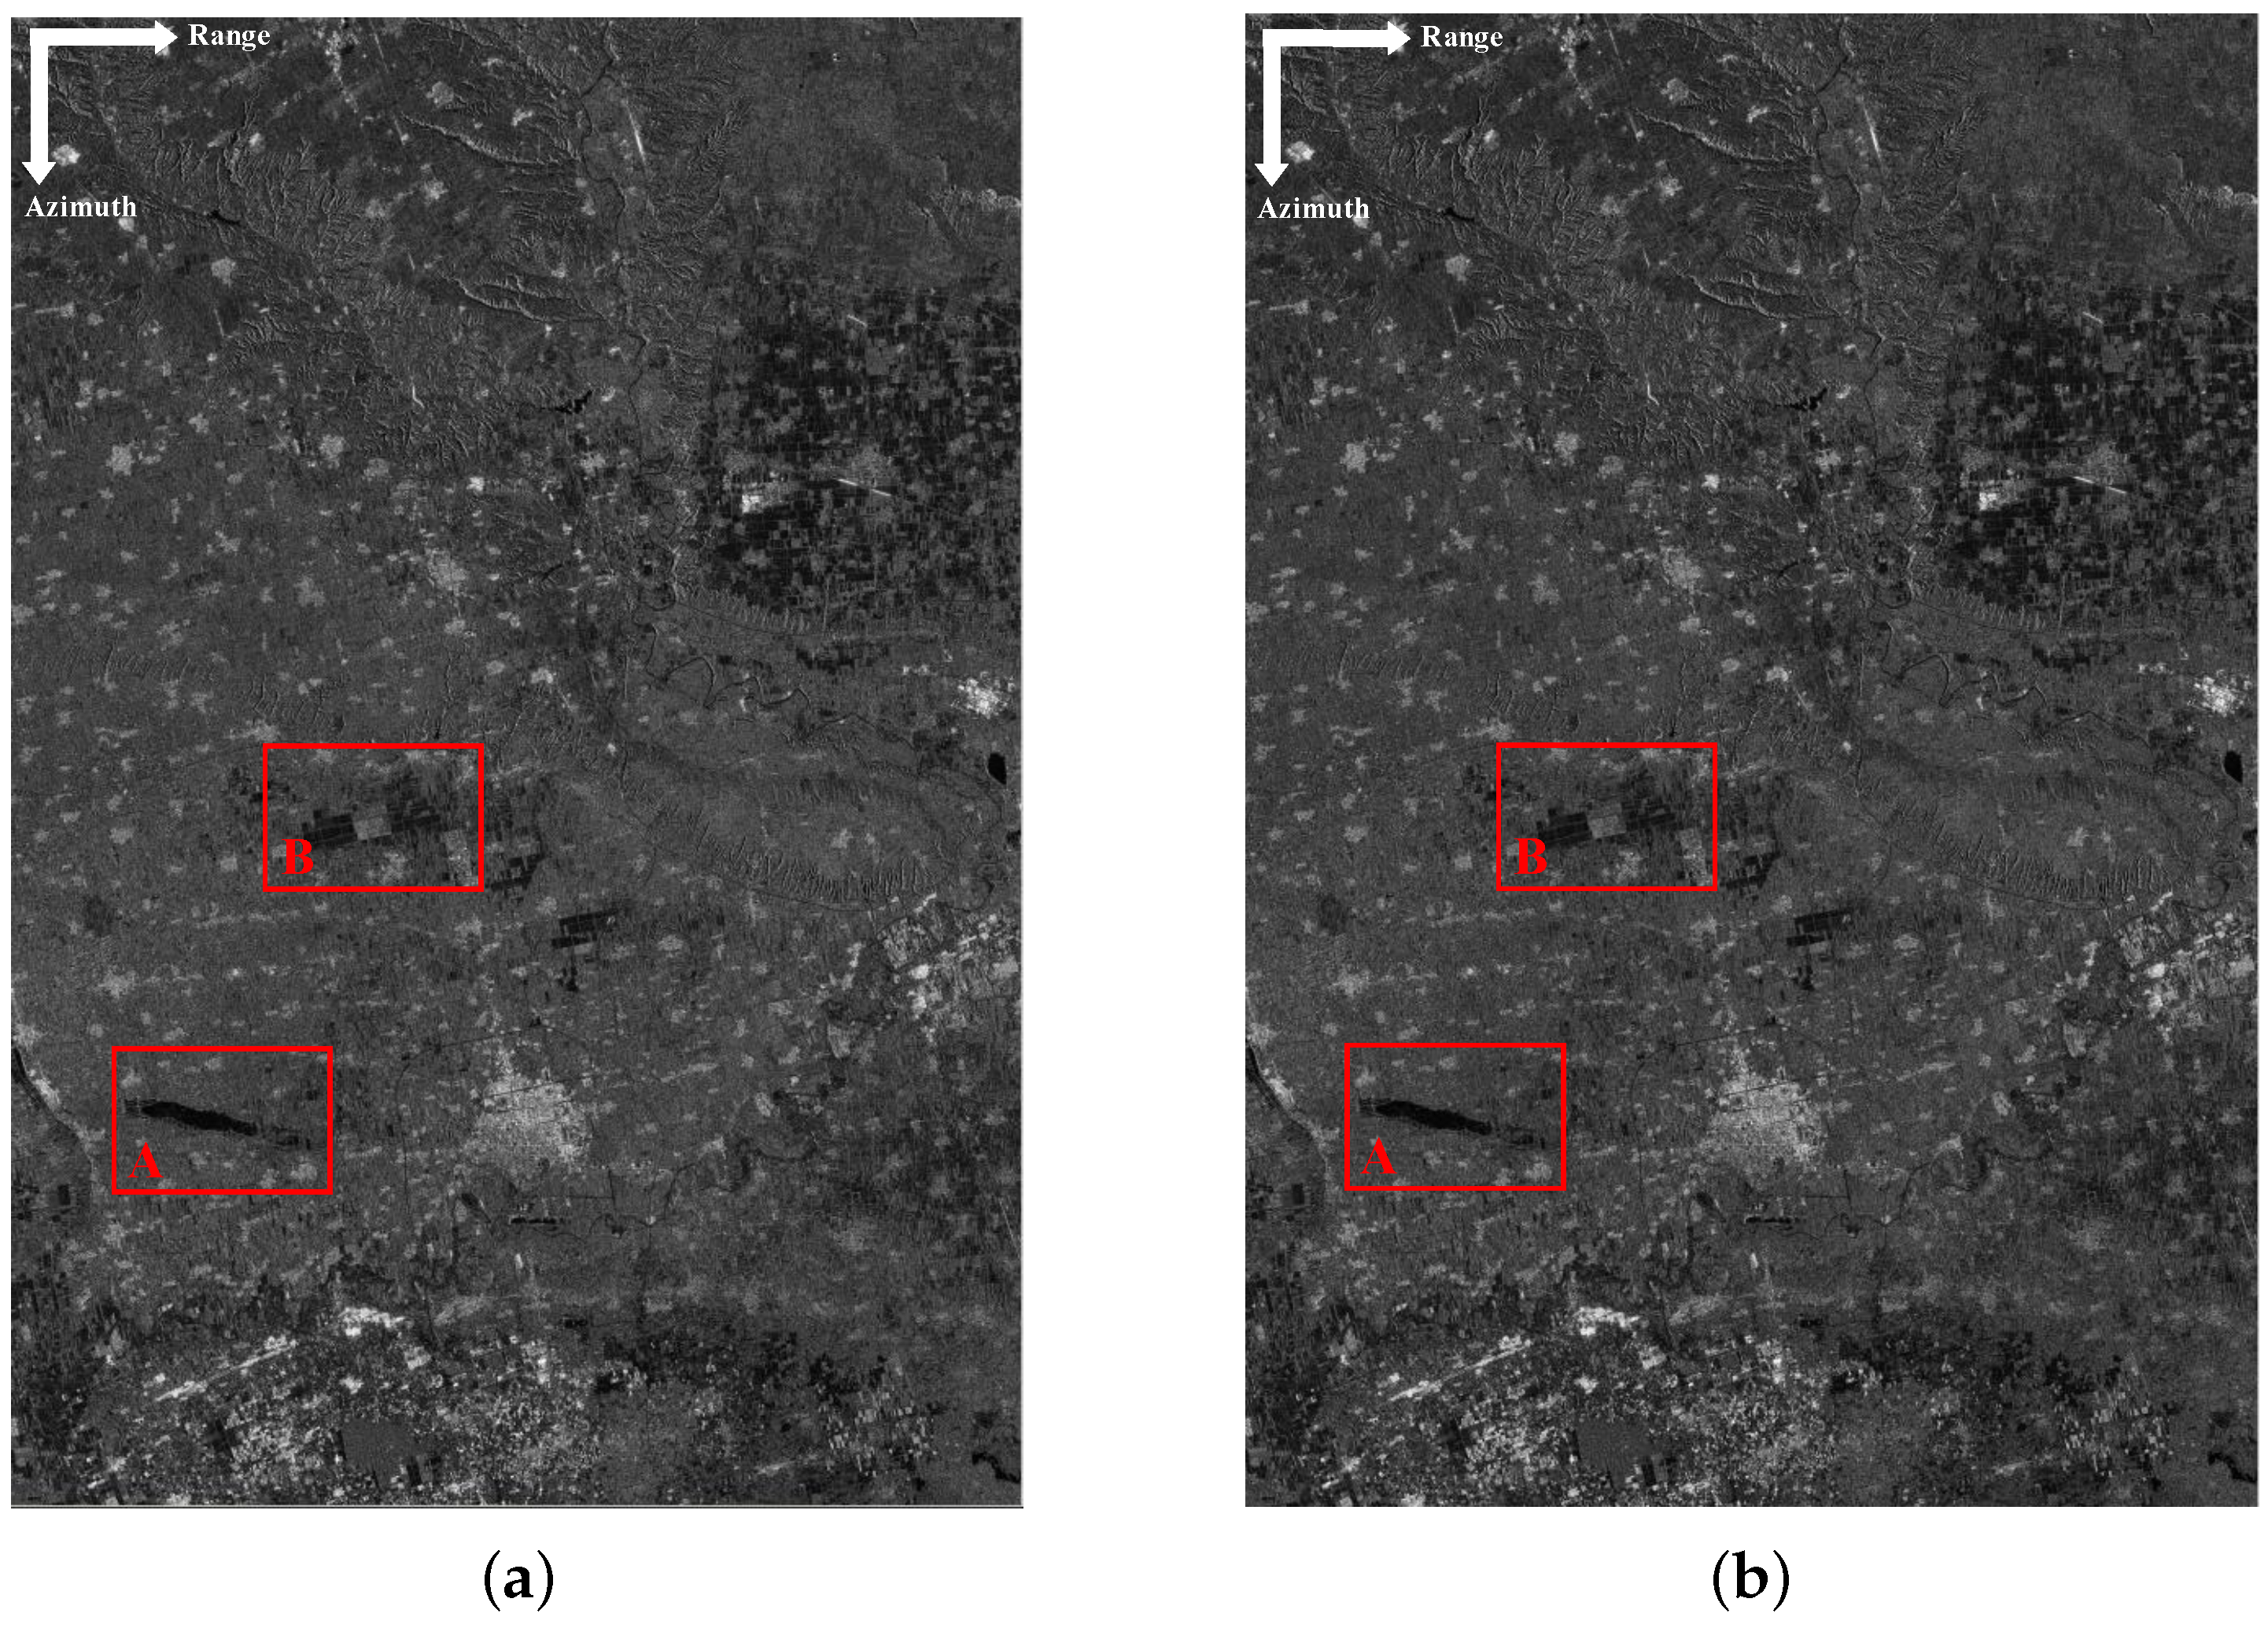
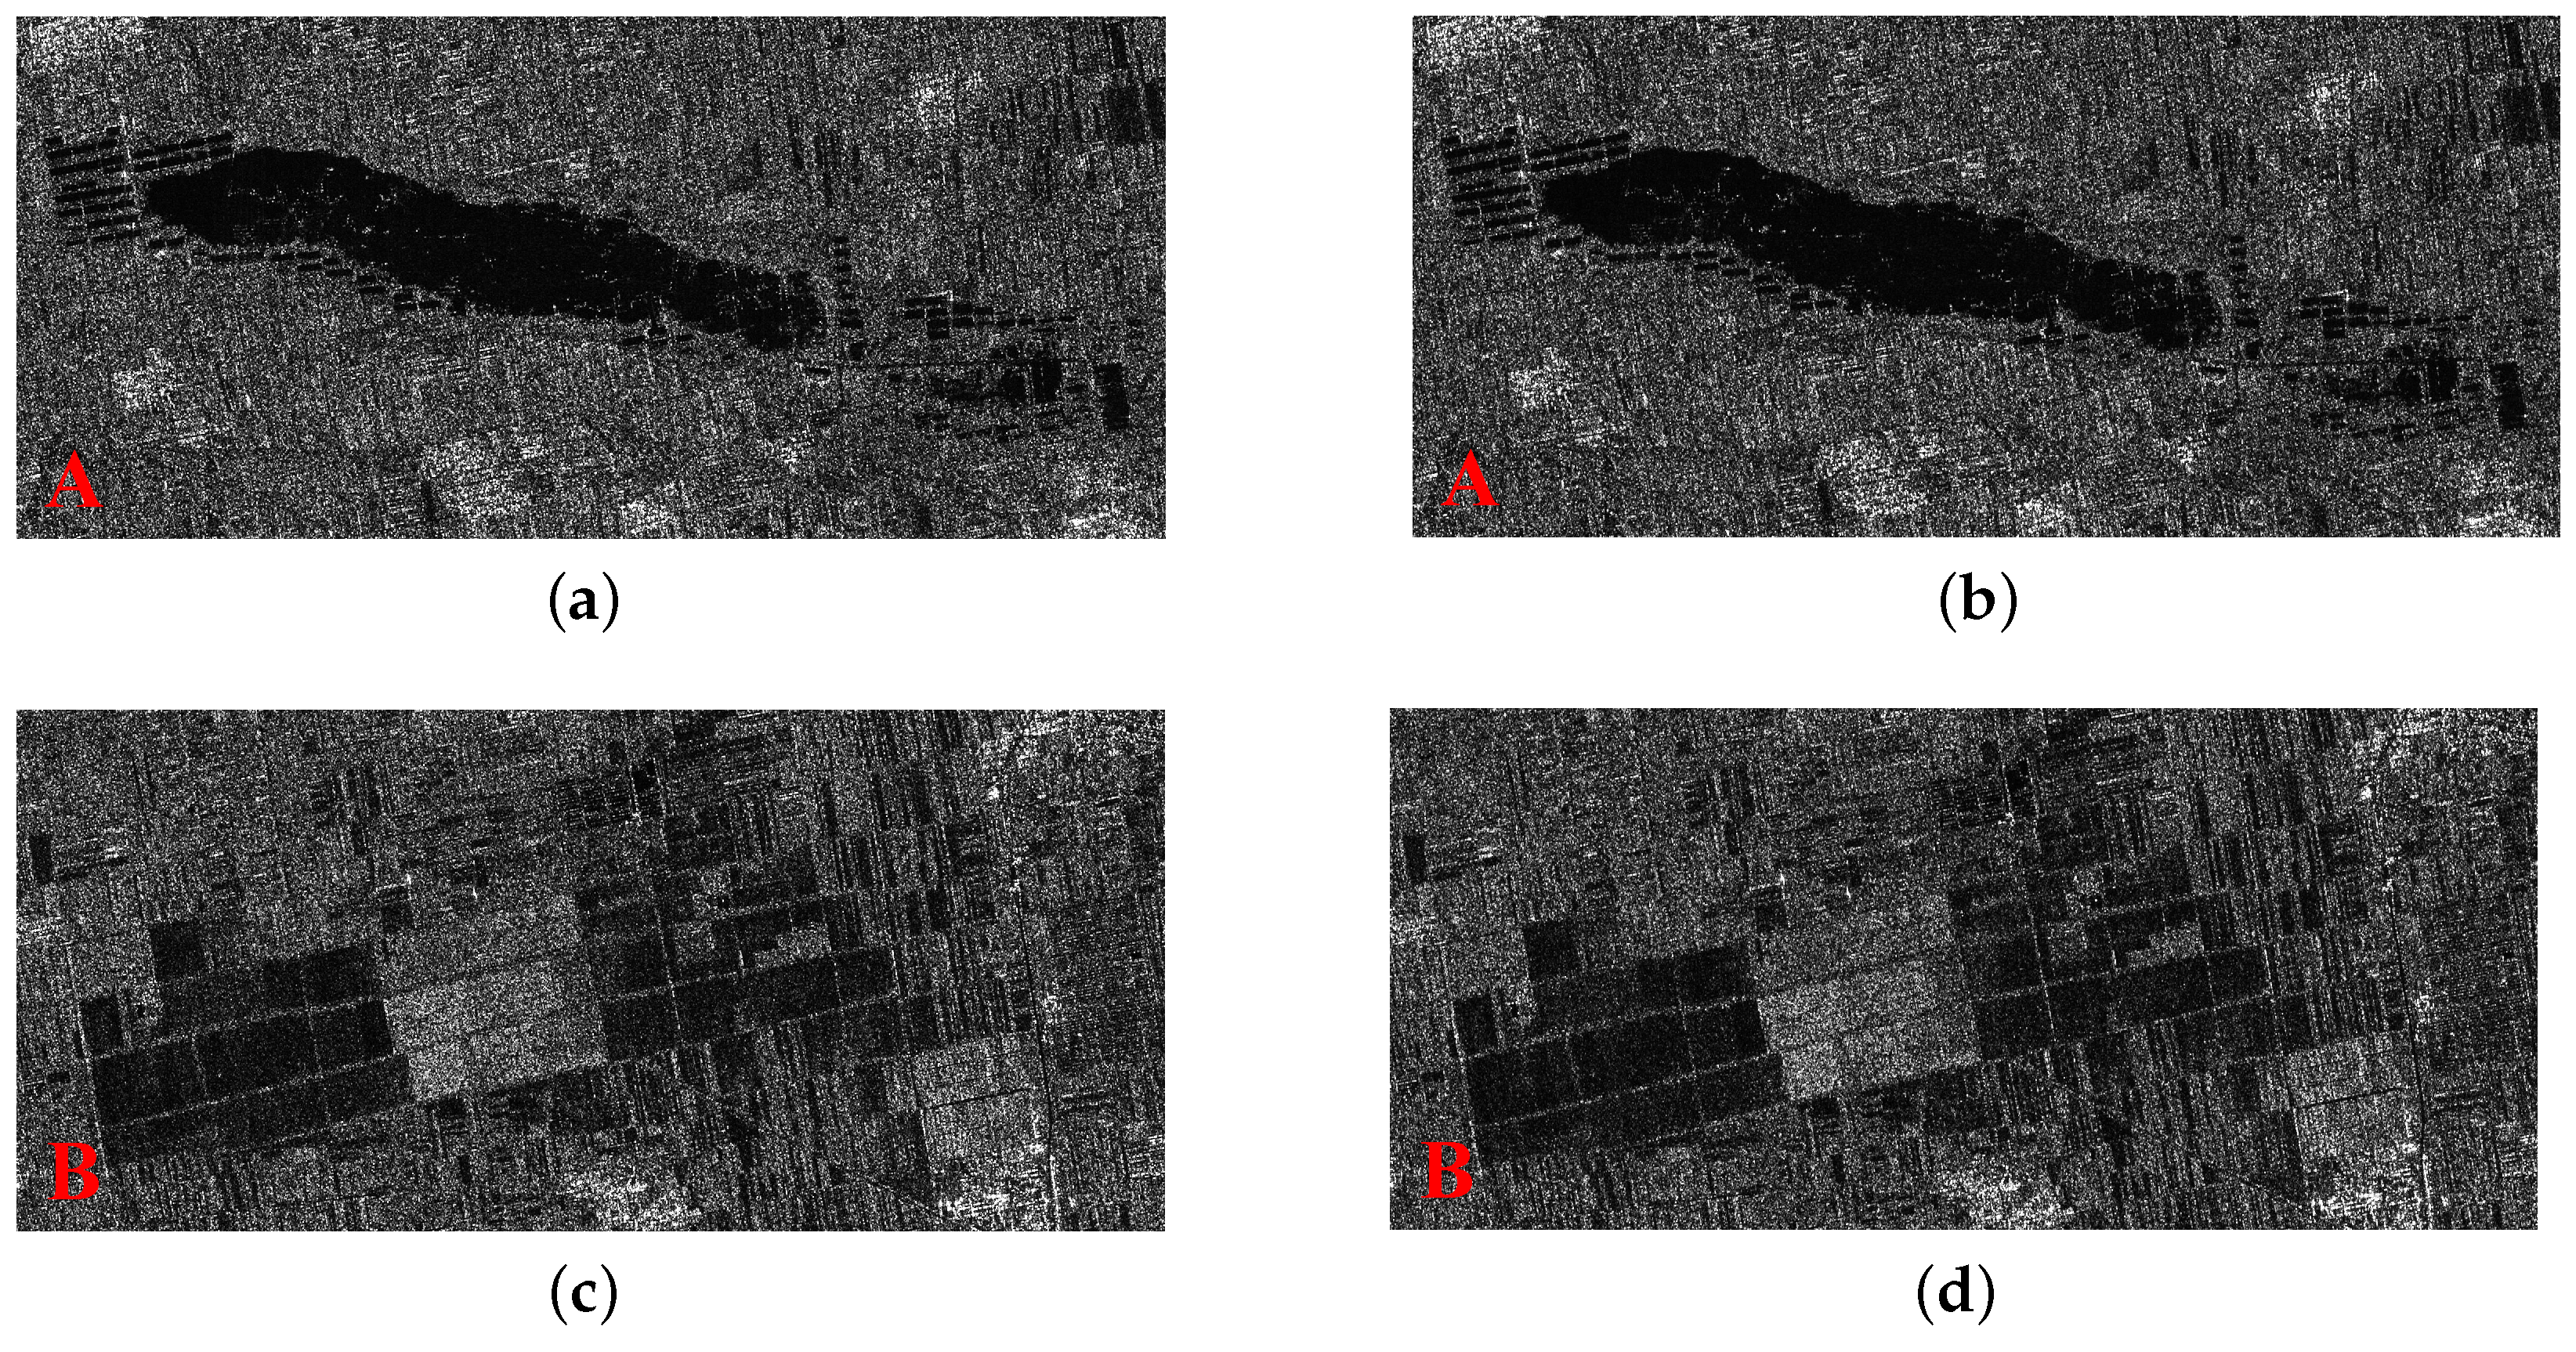
3.2.3. Results of Distributed Targets

Afterwards, the imaging results of distributed targets with hardware-in-the-loop simulation are given to verify the imaging performance of the two methods, which is shown in Figure 14. The amplitude intensity of the real SAR images (part of Xi’an city, China) sourced from GAOFEN-3 is regarded as the target radar cross-section (RCS) information. The scene includes lakes, farmlands, and urban areas, which are typical plain areas. The complete imaging results are shown in Figure 14, and two typical features, i.e., lake and farmland, are selected to scale up. The local enlarged images are shown in Figure 15. Obviously, the two methods can achieve good focusing of distributed targets.

4. Discussion

Dual-channel echo reconstruction and dual-channel echo synthesis are two feasible signal preprocessing methods in the “L1A_SM_S” working mode of the LT-1. According to the results in Section 3, the two methods have their advantages and disadvantages. A quantitative comparison result is given in Table 5, which summarizes the above research results combined with specific evaluation values. The symbols “R”, “S”, and “≈” are used to more clearly reflect the advantages of the two methods in Table 5. The differences between the two methods are due to the different physical mechanisms. The essence of the reconstruction method is to use a reconstruction filter to weigh the dual-channel signals. Under the ideal conditions, the performance of the reconstruction method is better than the synthesis method. However, since the reconstruction filter will mismatch under the additional error conditions (such as the channel phase error, the along-track baseline error, and the quantization loss of the BAQ compression), the error tolerance of the reconstruction method is worse. The synthesis method uses the idea of forming an antenna pattern through the full antenna, and, compared with the filter band method, the preprocessing of coherent superposition is more straightforward. Of course, in the case of the cross-track baseline error, neither of the two methods can achieve a good focusing effect due to the distortion of spatial sampling. The two methods give the ground processing system of the LT-1 more flexibility in the preprocessing of dual-channel receiving signals. Thus, a more suitable signal preprocessing method can be selected depending on different application scenarios.
To further deepen the reader’s understandings of the “L1A_SM_S” working mode, two practical application examples are briefly described. As mentioned above, the main task of this mode is deformation measurement, and two satellites in this mode shall share the common reference orbit with a 180-degree orbital phasing difference. Thus, the revisit time can be shortened from 8 days to 4 days, and the shorter revisit time improves the ability to measure deformation. Two application examples of deformation measurement, i.e., the earthquake and landslide, are the main applications of the LT-1 mission in this mode. We take two published research results as examples to illustrate these two examples: (1) The descending coseismic interferograms of the Wenchuan earthquake (Sichuan, China) given in [35] using the datasets of the ALOS-2 data (larger map) and Envisat data (smaller map), and (2) the evolution of the 2018 Jinsha River landslide (Tibet, China) given in [2] using the SAR data from the GAOFEN-3 (GF-3) satellite. Other practical deformation measurement examples can be found in [3,36,37,38,39]. After the LT-1 enters the service, its data will support the deformation measurement applications described above. It is worth mentioning that the additional ScanSAR mode of ultra-wide swath in LT-1 will provide radar images with a swath of up to 400 km and a nominal spatial resolution of 30 m. The data from the ScanSAR mode in LT-1 can be used to obtain the land deformation information across an ultra-large area, such as ice and continental glaciers monitoring and agriculture and forest mapping.

5. Conclusions

In the LT-1 mission, two satellites adopt active phased array antennas, which can be divided into two physical channels. The signal can be transmitted through the full antenna without broadening and is recorded by each channel. In the “L1A_SM_S” working mode of the LT-1, two feasible signal preprocessing methods attracted the attention of this paper. They are dual-channel echo reconstruction and dual-channel echo synthesis. Therefore, relevant research was conducted to illustrate similarities and differences between the two methods. First, principles and theoretical models of the two methods were presented. Then, the system performance analysis was carried out, which includes the AASR, the NESZ, and the BAQ performance. Afterwards, the test data acquired by the ground validation system of the LT-1 were used for the hardware-in-the-loop simulation with point targets and distributed targets to compare the imaging quality between the two methods. Consequently, the conclusions have referencing significance for the ground processing system of the LT-1 and the data preprocessing of dual-channel SAR systems.

Author Contributions

Conceptualization, H.L., H.Z., and D.L. (Da Liang); methodology, H.L., H.Z., and D.L. (Da Liang); software, H.L.; validation, H.L., D.L. (Dacheng Liu), and T.F.; formal analysis, H.L.; investigation, H.L., and D.L. (Dacheng Liu); resources, Y.D., and R.W.; data curation, T.F.; writing—original draft preparation, H.L.; writing—review and editing, H.L., H.Z., and D.L. (Da Liang); visualization, H.L., and D.L. (Da Liang); supervision, R.W.; project administration, Y.D.; funding acquisition, H.Z., and R.W. All authors have read and agreed to the published version of the manuscript.

Funding

This work was supported in part by the National Natural Science Fund under Grant 61901443 and in part by the Medium- and Long-Term Development Plan for China’s Civil Space Infrastructure, LuTan-1.

Institutional Review Board Statement

Not applicable.

Informed Consent Statement

Not applicable.

Data Availability Statement

Not applicable.

Conflicts of Interest

The authors declare no conflict of interest.

References

  1. Moreira, A.; Prats-Iraola, P.; Younis, M.; Krieger, G.; Hajnsek, I.; Papathanassiou, K.P. A tutorial on synthetic aperture radar. IEEE Geosci. Remote Sens. Mag. 2013, 1, 6–43. [Google Scholar] [CrossRef] [Green Version]
  2. Jia, H.; Wang, Y.; Ge, D.; Deng, Y.; Wang, R. Improved offset tracking for predisaster deformation monitoring of the 2018 Jinsha River landslide (Tibet, China). Remote Sens. Environ. 2020, 247, 111899. [Google Scholar] [CrossRef]
  3. Balbi, E.; Terrone, M.; Faccini, F.; Scafidi, D.; Barani, S.; Tosi, S.; Crispini, L.; Cianfarra, P.; Poggi, F.; Ferretti, G. Persistent Scatterer Interferometry and Statistical Analysis of Time-Series for Landslide Monitoring: Application to Santo Stefano d’Aveto (Liguria, NW Italy). Remote Sens. 2021, 13, 3348. [Google Scholar] [CrossRef]
  4. Motohka, T.; Kankaku, Y.; Suzuki, S.; Shimada, M. Status of the advanced land observing satellite-2 (ALOS-2) and its follow-on L-band SAR mission. In Proceedings of the 2017 IEEE International Geoscience and Remote Sensing Symposium, IGARSS 2017, Fort Worth, TX, USA, 23–28 July 2017; pp. 2427–2429. [Google Scholar]
  5. Gebert, N.; Carnicero Dominguez, B.; Davidson, M.W.J.; Diaz Martin, M.; Silvestrin, P. SAOCOM-CS—A passive companion to SAOCOM for single-pass L-band SAR interferometry. In Proceedings of the 2014 IEEE International Geoscience and Remote Sensing Symposium (IGARSS), Quebec City, QC, Canada, 13–18 July 2014; pp. 1251–1254. [Google Scholar]
  6. Giardino, A.; Defilippi, M.; Pasquali, P.; Buck, C. Experimental SAR Processors for Bistatic Concepts Considering Companion Satellites. In Proceedings of the 2019 IEEE International Geoscience and Remote Sensing Symposium, Yokohama, Japan, 28 July–2 August 2019; pp. 1128–1131. [Google Scholar]
  7. Valentino, A.; Daria, D.; Piantanida, R.; Witte, E.D.; Dominguez, B.C. Data Focusing Solutions for Future Bi-static SAR Missions. In Proceedings of the 12th European Conference on Synthetic Aperture Radar, Aachen, Germany, 4–7 June 2018; pp. 810–815. [Google Scholar]
  8. Moreira, A.; Krieger, G.; Hajnsek, I.; Papathanassiou, K.; Younis, M.; Lopez-Dekker, P.; Huber, S.; Villano, M.; Pardini, M.; Eineder, M.; et al. TanDEM-L: A Highly Innovative Bistatic SAR Mission for Global Observation of Dynamic Processes on the Earth’s Surface. IEEE Trans. Geosci. Remote Sens. 2015, 3, 8–23. [Google Scholar] [CrossRef]
  9. Huber, S.; de Almeida, F.Q.; Villano, M.; Younis, M.; Krieger, G.; Moreira, A. TanDEM-L: A Technical Perspective on Future Spaceborne SAR Sensors for Earth Observation. IEEE Trans. Geosci. Remote Sens. 2018, 56, 4792–4807. [Google Scholar] [CrossRef] [Green Version]
  10. Krieger, G.; Hajnsek, I.; Papathanassiou, K.; Eineder, M.; Younis, M.; De Zan, F.; Huber, S.; Lopez-Dekker, P.; Prats, P.; Werner, M.; et al. TanDEM-L: An innovative interferometric and polarimetric SAR mission to monitor earth system dynamics with high resolution. In Proceedings of the 2010 IEEE International Geoscience and Remote Sensing Symposium (IGARSS), Honolulu, HI, USA, 25–30 July 2010; pp. 253–256. [Google Scholar]
  11. Moreira, A.; Krieger, G.; Hajnsek, I.; Papathanassiou, K.; Younis, M.; Lopez-Dekker, F.; Huber, S.; Eineder, M.; Shimada, M.; Motohka, T.; et al. ALOS-Next/TanDEM-L: A highly innovative SAR mission for global observation of dynamic processes on the earth’s surface. In Proceedings of the 2015 IEEE International Geoscience and Remote Sensing Symposium (IGARSS), Milan, Italy, 26–31 July 2015; pp. 1253–1256. [Google Scholar]
  12. Kraus, T.; Braeutigam, B.; Bachmann, M.; Krieger, G. Multistatic SAR Imaging: First Results of a Four Phase Center Experiment with TerraSAR-X and TanDEM-X. In Proceedings of the 11th European Conference on Synthetic Aperture Radar (EUSAR), Hamburg, Germany, 6–9 June 2016; pp. 1–5. [Google Scholar]
  13. Wang, R.; Wang, W.; Shao, Y.; Hong, F.; Wang, P.; Deng, Y.; Zhang, Z.; Loffeld, O. First Bistatic Demonstration of Digital Beamforming in Elevation With TerraSAR-X as an Illuminator. IEEE Trans. Geosci. Remote Sens. 2016, 54, 842–849. [Google Scholar] [CrossRef]
  14. An, H.; Wu, J.; Sun, Z.; Yang, J. A Two-Step Nonlinear Chirp Scaling Method for Multichannel GEO Spaceborne–Airborne Bistatic SAR Spectrum Reconstructing and Focusing. IEEE Trans. Geosci. Remote Sens. 2019, 57, 3713–3728. [Google Scholar] [CrossRef]
  15. Krieger, G.; Gebert, N.; Younis, M.; Bordoni, F.; Patyuchenko, A.; Moreira, A. Advanced Concepts for Ultra-Wide-Swath SAR Imaging. In Proceedings of the 7th European Conference on Synthetic Aperture Radar (EUSAR), Friedrichshafen, Germany, 2–5 June 2008; pp. 1–4. [Google Scholar]
  16. Sakar, N.; Rodriguez-Cassola, M.; Prats-Iraola, P.; Moreira, A. Azimuth Reconstruction Algorithm for Multistatic SAR Formations With Large Along-Track Baselines. IEEE Trans. Geosci. Remote Sens. 2020, 58, 1931–1940. [Google Scholar] [CrossRef]
  17. Guccione, P.; Monti Guarnieri, A.; Rocca, F.; Giudici, D.; Gebert, N. Along-Track Multistatic Synthetic Aperture Radar Formations of Minisatellites. Remote Sens. 2020, 12, 124. [Google Scholar] [CrossRef] [Green Version]
  18. Jin, G.; Liu, K.; Liu, D.; Liang, D.; Zhang, H.; Ou, N.; Zhang, Y.; Deng, Y.; Li, C.; Wang, R. An Advanced Phase Synchronization Scheme for LT-1. IEEE Trans. Geosci. Remote Sens. 2020, 58, 1735–1746. [Google Scholar] [CrossRef]
  19. Liang, D.; Liu, K.; Yue, H.; Chen, Y.; Deng, Y.; Zhang, H.; Li, C.; Jin, G.; Wang, R. An Advanced Non-Interrupted Synchronization Scheme for Bistatic Synthetic Aperture Radar. In Proceedings of the 2019 IEEE International Geoscience and Remote Sensing Symposium (IGARSS), Yokohama, Japan, 28 July–2 August 2019; pp. 1116–1119. [Google Scholar]
  20. Liang, D.; Liu, K.; Zhang, H.; Chen, Y.; Yue, H.; Liu, D.; Deng, Y.; Lin, H.; Fang, T.; Li, C.; et al. The Processing Framework and Experimental Verification for the Noninterrupted Synchronization Scheme of LuTan-1. IEEE Trans. Geosci. Remote Sens. 2021, 59, 5740–5750. [Google Scholar] [CrossRef]
  21. Jin, G.; Liu, K.; Deng, Y.; Sha, Y.; Wang, R.; Liu, D.; Wang, W.; Long, Y.; Zhang, Y. Nonlinear Frequency Modulation Signal Generator in LT-1. IEEE Geosci. Remote Sens. Lett. 2019, 16, 1570–1574. [Google Scholar] [CrossRef]
  22. Zhang, Y.; Wang, W.; Wang, R.; Deng, Y.; Jin, G.; Long, Y. A Novel NLFM Waveform With Low Sidelobes Based on Modified Chebyshev Window. IEEE Geosci. Remote Sens. Lett. 2020, 17, 814–818. [Google Scholar] [CrossRef]
  23. Gebert, N. Multi-Channel Azimuth Processing for High-Resolution Wide-Swath SAR Imaging; DLR Deutsches Zentrum fur Luft- und Raumfahrt e.V.: Cologne, Germany, 2009. [Google Scholar]
  24. Krieger, G.; Gebert, N.; Moreira, A. Unambiguous SAR signal reconstruction from nonuniform displaced phase center sampling. IEEE Geosci. Remote Sens. Lett. 2004, 1, 260–264. [Google Scholar] [CrossRef] [Green Version]
  25. Laskowski, P.; Bordoni, F.; Younis, M. Error analysis and calibration techniques for multichannel SAR instruments. In Proceedings of the 2013 IEEE International Geoscience and Remote Sensing Symposium (IGARSS), Melbourne, Australia, 21–26 July 2013; pp. 4503–4506. [Google Scholar]
  26. Queiroz de Almeida, F.; Younis, M.; Krieger, G.; Moreira, A. An Analytical Error Model for Spaceborne SAR Multichannel Azimuth Reconstruction. IEEE Geosci. Remote Sens. Lett. 2018, 15, 853–857. [Google Scholar] [CrossRef]
  27. Rousseau, L.P.; Chouinard, J.Y.; Gierull, C.H.; Deslauriers, C.G. Comparison of two processing methodologies for ScanSAR-GMTI. In Proceedings of the 2017 IEEE Radar Conference (RadarConf), Seattle, WA, USA, 8–12 May 2017; pp. 1191–1195. [Google Scholar]
  28. Makhoul, E.; Broquetas, A.; Ruiz Rodon, J.; Zhan, Y.; Ceba, F. A Performance Evaluation of SAR-GMTI Missions for Maritime Applications. IEEE Trans. Geosci. Remote Sens. 2015, 53, 2496–2509. [Google Scholar] [CrossRef] [Green Version]
  29. Gabele, M.; Brautigam, B.; Schulze, D.; Steinbrecher, U.; Tous-Ramon, N.; Younis, M. Fore and Aft Channel Reconstruction in the TerraSAR-X Dual Receive Antenna Mode. IEEE Trans. Geosci. Remote Sens. 2010, 48, 795–806. [Google Scholar] [CrossRef]
  30. Cumming, I.G.; Wong, F.H. Digital Processing of Synthetic Aperture Radar Data: Algorithms and Implementation; Artech House: Norwood, MA, USA, 2005. [Google Scholar]
  31. Shang, M.; Qiu, X.; Han, B.; Ding, C.; Hu, Y. Channel Imbalances and Along-Track Baseline Estimation for the GF-3 Azimuth Multichannel Mode. Remote Sens. 2019, 11, 1297. [Google Scholar] [CrossRef] [Green Version]
  32. Younis, M.; Boer, J.; Ortega, C.; Schulze, D.; Huber, S.; Mittermayer, J. Determening the optimum compromise between SAR data compression and radiometric performance—An approach based on the analysis of TerraSAR-X data-. In Proceedings of the 2008 IEEE International Geoscience and Remote Sensing Symposium (IGARSS), Boston, MA, USA, 7–11 July 2008; pp. III-107–III-110. [Google Scholar]
  33. Feng, J.; Gao, C.; Zhang, Y.; Wang, R. Phase Mismatch Calibration of the Multichannel SAR Based on Azimuth Cross Correlation. IEEE Geosci. Remote Sens. Lett. 2013, 10, 903–907. [Google Scholar] [CrossRef]
  34. Zhang, H.; Deng, Y.; Wang, R.; Wang, W.; Jia, X.; Liu, D.; Li, C. End-to-end Bistatic InSAR Raw Data Simulation for TwinSAR-L Mission. In Proceedings of the 2019 IEEE International Geoscience and Remote Sensing Symposium (IGARSS), Yokohama, Japan, 28 July–2 August 2019; pp. 3519–3522. [Google Scholar]
  35. Guangcai, F.; Sigurjon, J.; Yann, K. Which Fault Segments Ruptured in the 2008 Wenchuan Earthquake and Which Did Not? New Evidence from Near-Fault 3D Surface Displacements Derived from SAR Image Offsets. Bull. Seismol. Soc. Am. 2017, 107, 1185–1200. [Google Scholar]
  36. Bowen, Z.; Robert, W.; Yunkai, D.; Ma, P.; Lin, H.; Wang, J. Mapping the Yellow River Delta land subsidence with multitemporal SAR interferometry by exploiting both persistent and distributed scatterers. ISPRS J. Photogramm. Remote Sens. 2019, 148, 157–173. [Google Scholar]
  37. Liu, X.; Zhao, C.; Zhang, Q.; Yang, C.; Zhu, W. Heifangtai loess landslide type and failure mode analysis with ascending and descending Spot-mode TerraSAR-X datasets. Landslides 2020, 17, 205–215. [Google Scholar] [CrossRef] [Green Version]
  38. Ma, P.; Lin, H.; Wang, W.; Yu, H.; Chen, F.; Jiang, L.; Zhou, L.; Zhang, Z.; Shi, G.; Wang, J. Toward Fine Surveillance: A Review of Multitemporal Interferometric Synthetic Aperture Radar for Infrastructure Health Monitoring. IEEE Geosci. Remote Sens. Mag. 2021, 205–215. [Google Scholar] [CrossRef]
  39. Agarwal, V.; Kumar, A.; Gee, D.; Grebby, S.; Gomes, R.L.; Marsh, S. Comparative Study of Groundwater-Induced Subsidence for London and Delhi Using PSInSAR. Remote Sens. 2021, 13, 4741. [Google Scholar] [CrossRef]
Figure 1. Diagrams of the acquisition plan of LuTan-1. (a) The bistatic dual-channel interferometry SAR mode. (b) The monostatic dual-channel SAR fast-revisit mode.
Remotesensing 14 00515 g001
Figure 2. The two different signal receiving strategies in the spaceborne dual-channel SAR system. (a) The traditional signal receiving strategy, i.e., the receiving signals are recorded after being summed up into a signal by the merge link on board. (b) The new signal receiving strategy adopted in the LT-1 SAR system, i.e., the receiving signals are recorded by each channel.
Remotesensing 14 00515 g002
Figure 3. The procedure of the processing of dual-channel receiving signals in the LT-1.
Remotesensing 14 00515 g003
Figure 4. (a) Timing diagram used in the “L1A_SM_S” working mode. (b) The ground resolution corresponding to the five beam configurations.
Remotesensing 14 00515 g004
Figure 5. The AASR of the “L1A_SM_S” working mode changes with the PRF under the two preprocessing methods, assuming that the channel mismatch is accurately corrected and the along–track baseline error is not considered.
Remotesensing 14 00515 g005
Figure 6. The AASR of the five beam configurations in the “L1A_SM_S” working mode, assuming that the channel mismatch is accurately corrected and the along–track baseline error is not considered. (a) The reconstruction method. (b) The synthesis method.
Remotesensing 14 00515 g006
Figure 7. The AASR of the “L1A_SM_S” working mode changes with PRF under the two preprocessing methods. (a) Assuming that there is still a 5° channel phase error after correcting channel mismatch. (b) Assuming that there is an along–track baseline error of 10 cm.
Remotesensing 14 00515 g007
Figure 8. The NESZ corresponding to the two methods. The solid line represents dual–channel echo reconstruction, and the dashed line represents dual–channel echo synthesis.
Remotesensing 14 00515 g008
Figure 9. The conversion gain of the two preprocessing methods under different BAQ compression levels with the test data from the echo simulator of the ground verification system of the LT-1.
Remotesensing 14 00515 g009
Figure 10. The dual-channel receiving signals in the ground validation system of the LT-1. (a) The amplitude–frequency curve of the signals. (b) The phase change curve between the dual–channel receiving signals after removing the inherent constant phase error of the hardware, where the red line in the figure represents the fitted curve.
Remotesensing 14 00515 g010
Figure 11. Nine simulated point targets.
Remotesensing 14 00515 g011
Figure 12. Contour plots and azimuth profiles of P1 (the first column), P5 (the second column), and P9 (the third column) preprocessed by the reconstruction method.
Remotesensing 14 00515 g012
Figure 13. Contour plots and azimuth profiles of P1 (the first column), P5 (the second column), and P9 (the third column) preprocessed by the synthesis method.
Remotesensing 14 00515 g013
Figure 14. Distributed target imaging results of the hardware-in-the-loop simulation processed by (a) the reconstruction method and (b) the synthesis method. A and B are two areas that are used for local enlarging, where A is a lake area and B is a farmland area.
Remotesensing 14 00515 g014
Figure 15. Local enlarged image in Figure 14. (a,c) refer to Figure 14a. (b,d) refer to Figure 14b. A and B are two areas that are used for local enlarging, where A is a lake area and B is a farmland area.
Remotesensing 14 00515 g015
Table 1. The parameters of the specific beam configurations under two typical working modes in the LT-1 mission.
ParametersL1A/B_SM_SL1A_SM_S
Carrier frequency1.26 GHz
Antenna length9.8 m
View of angle20.31°22.68°
Transmitting beam width2.13°1.23°
Receiving beam width2.47°1.23°
Equivalent beam width2.27°1.23°
Pulse repetition frequency1723 Hz1444 Hz
Table 2. Five beam configurations under the “L1A_SM_S” working mode in the LT-1 mission.
Parametersbeam1beam2beam3beam4beam5
PRF1444 Hz2262 Hz1758 Hz1470 Hz1753 Hz
Near angle18.15°25.40°28.47°32.52°37.61°
Far angle26.45°31.11°35.00°38.42°41.71°
Center angle22.68°28.12°31.44°35.36°39.46°
Scanning angle−7.82°−2.38°0.94°4.86°8.96°
Table 3. The performance requirements of the “L1A_SM_S” working mode in the LT-1 mission.
IndexRequirement
Range of incident angle20°∼46.78°
Swath width80 km∼100 km
Azimuth resolution6 m
Range resolution5.5 m∼3.3 m
AASR≤−20 dB
NESZ≤−31 dB
Table 4. Evaluation of the imaging quality in point target simulation.
MethodsTargetsRangeAzimuthResidual Phase
IRW (m)PSLR (dB)ISLR (dB)IRW (m)PSLR (dB)ISLR (dB)
ReconstructionP13.96−13.12−9.603.61−13.23−9.980.0988°
P53.96−13.17−9.633.61−13.23−9.970.1025°
P93.96−13.11−9.613.61−13.23−9.970.1188°
SynthesisP13.96−13.10−9.594.68−14.73−11.730.0988°
P53.96−13.14−9.654.68−14.76−11.700.1025°
P93.96−13.13−9.624.68−14.74−10.690.1188°
Table 5. A quantitative comparison of the two preprocessing methods.
Items 1Beam ConfigurationsReconstructionSynthesisComparison 2
AASRbeam1−22.88 dB−21.87 dBR
beam2−24.26 dB−21.72 dBR
beam3−27.55 dB−23.79 dBR
beam4−23.58 dB−23.28 dBR
beam5−27.64 dB−23.88 dBR
AASR with 5° error 3beam1−5.53 dB−8.24 dBS
beam2−20.26 dB−21.58 dBS
beam3−11.03 dB−20.61 dBS
beam4−5.91 dB−9.26 dBS
beam5−10.93 dB−20.51 dBS
AASR with 10 cm error 3beam1−4.65 dB−14.04 dBS
beam2−20.05 dB−21.23 dBS
beam3−10.58 dB−19.47 dBS
beam4−5.05 dB−14.66 dBS
beam5−10.46 dB−19.45 dBS
NESZ 4beam1−44.18 dB−44.46 dBS
beam2−38.83 dB−39.88 dBS
beam3−42.16 dB−42.91 dBS
beam4−41.83 dB−42.17 dBS
beam5−39.79 dB−40.52 dBS
CG under BAQ 8:6beam11.8311.844S
CG under BAQ 8:4beam11.3471.305R
CG under BAQ 8:3beam10.8580.780R
CG under BAQ 8:2beam10.4810.434R
Range resolutionbeam13.96 m3.96 m
Range PSLRbeam1−13.17 m−13.14 m
Range ISLRbeam1−9.63 m−9.65 m
Azimuth resolutionbeam13.61 m4.68 mR
Azimuth PSLRbeam1−13.23 m−14.76 mS
Azimuth ISLRbeam1−9.97 m−11.70 mS
Data volume to be processed-Reconstruction is double that of synthesis
1 The numerical evaluation results are taken from the ideal simulation, and the evaluation results of the actual system will be announced after the launch of the LT-1. 2 The symbol “R” represents that the reconstruction method is better under the corresponding item, the symbol “S” represents that the synthesis method is better, and the symbol “≈” represents that there is no significant difference between the two methods. 3 Refers to where the channel phase error is 5° and the along-track baseline error is 10 cm. 4 The evaluation values of the NESZ under the two methods are obtained at the same incident angle.
Publisher’s Note: MDPI stays neutral with regard to jurisdictional claims in published maps and institutional affiliations.

