Article

Spectral Comparison of UAV-Based Hyper and Multispectral Cameras for Precision Viticulture

1
Institute of BioEconomy National Research Council (CNR IBE), Via Caproni 8, 50145 Florence, Italy
2
Department of Sustainable Crop Production, Università Cattolica del Sacro Cuore, Via Emilia Parmense 84, 29122 Piacenza, Italy
3
Institute of Geosciences and Earth Resources, National Research Council (CNR-IGG), Via Moruzzi 1, 56124 Pisa, Italy
*
Author to whom correspondence should be addressed.
Remote Sens. 2022, 14(3), 449; https://doi.org/10.3390/rs14030449
Submission received: 9 December 2021 / Revised: 12 January 2022 / Accepted: 15 January 2022 / Published: 18 January 2022
(This article belongs to the Special Issue Precision Agriculture Using Hyperspectral Images)

Abstract

:
Analysis of the spectral response of vegetation using optical sensors for non-destructive remote monitoring represents a key element for crop monitoring. Considering the wide presence on the market of unmanned aerial vehicle (UAVs) based commercial solutions, the need emerges for clear information on the performance of these products to guide the end-user in their choice and utilization for precision agriculture applications. This work aims to compare two UAV based commercial products, represented by DJI P4M and SENOP HSC-2 for the acquisition of multispectral and hyperspectral images, respectively, in vineyards. The accuracy of both cameras was evaluated on 6 different targets commonly found in vineyards, represented by bare soil, bare-stony soil, stony soil, soil with dry grass, partially grass covered soil and canopy. Given the importance of the radiometric calibration, four methods for multispectral images correction were evaluated, taking in account the irradiance sensor equipped on the camera (M1–M2) and the use of an empirical line model (ELM) based on reference reflectance panels (M3–M4). In addition, different DJI P4M exposure setups were evaluated. The performance of the cameras was evaluated by means of the calculation of three widely used vegetation indices (VIs), as percentage error (PE) with respect to ground truth spectroradiometer measurements. The results highlighted the importance of reference panels for the radiometric calibration of multispectral images (M1–M2 average PE = 21.8–100.0%; M3–M4 average PE = 11.9–29.5%). Generally, the hyperspectral camera provided the best accuracy with a PE ranging between 1.0% and 13.6%. Both cameras showed higher performance on the pure canopy pixel target, compared to mixed targets. However, this issue can be easily solved by applying widespread segmentation techniques for the row extraction. This work provides insights to assist end-users in the UAV spectral monitoring to obtain reliable information for the analysis of spatio-temporal variability within vineyards.

Graphical Abstract

1. Introduction

The spectral canopy response to solar radiation analysed through calculation of a wide range of vegetation indices (VIs) is the basis of remote sensing applications in agriculture. Both structural aspects, biochemical composition, physiological processes and foliar symptoms influence the ways in which vegetation reflects light in different regions of the electromagnetic spectrum [1,2,3]. Spectral analysis therefore provides important information on the vegetative state and needs of crops, however optimal acquisition of the spectral data must consider the peculiarities of each crop, since there are structure and characteristics that influence the spectral response. Among different kinds of crops, discontinuous woody crops such as grapevine present high heterogeneity in light reflecting behaviour due to row-based architecture, complex vertical trellis systems [4,5,6,7], in addition to the vegetation including different soil conditions (bare, tilled and stony), interrow grass cover and shadows and frequently in sloping conditions. In these cases, it is therefore essential to recognize and separate the canopy from other elements. Considering the various remote sensing platforms available, the best solution to optimally address these needs is the use of unmanned aerial vehicles (UAVs), which in the last decade had an exponential spread for a wide range of scientific researches and applications in viticulture [7,8,9,10,11]. Those platforms allow an accurate in-field variability characterization, providing vine features characterization at high temporal frequency and spatial resolution [12,13,14,15].
Since 2010, there has been a continuous technological advance in the integration of drones with cost-effective sensing technologies, such as digital cameras able to acquire images in the visible, near infrared (nir) and thermal spectral region, and accurate Global Satellite Positioning (GPS) and Global Navigation Satellite System (GNSS) technologies [2,16]. At the same time, there has been an increasing availability on the market of commercial products at low prices, ready and easy to use for users with very limited technological know-how [9,17,18]. These factors have aided the widespread adoption of UAVs in agriculture [19]. Among the different types of sensors, the consolidated and wide use of VIs for crop vegetative monitoring, has raised attention on the development of several commercial solutions of UAV based multispectral imaging systems. High resolution RGB and CIR (modified RGB cameras able to acquire green, red and nir bands) cameras can also be used to capture spectral data if they are spectrally and radiometrically characterized, but as reported by Aasen et al. [17], the main limitations are low overlap between spectral bands which generally do not comply with the bands originally used in standard Vis, low radiometric resolution and stability.
The first available solutions that became a standard for agriculture applications were the multispectral cameras developed by Tetracam company (Tetracam Inc., Chatsworth, CA, USA). In particular, the ADC (Agriculture Digital Camera) family of imaging systems, such as the wide diffused ADC Lite model released at the beginning of 2009 [20], based on a single high-resolution image sensor divided into a mosaic of filters, each one allows either red, green or nir radiation to pass through. At the end of 2009, Tetracam unveiled the Mini MCA model [21], which is a miniaturization of a previous MCA model [22], with 4, 6 or 12 synchronized cameras, each one equipped with a customer-specified narrow-band filter, requiring a multilayer image reconstruction processing step. This first generation of cameras used a rolling shutter sensor, where not all parts of the image are recorded at the same time, leading to distortions due to camera movement in flight [17]. To overcome that issue, a second generation of UAV cameras used a global shutter technology, which allows all the sensor’s pixels to start and stop exposing simultaneously (snapshot), providing non-distorted images also for high-speed moving objects. New cameras with snapshot sensors appeared on the market, such as the Tetracam Snap (single camera) or the Tetracam Macaw (multi cameras). Meanwhile, other global shutter imaging solutions were developed from different companies, such as the Parrot Sequoia (Parrot Drone SAS, Paris, France), Micasense RedEdge (MicaSense Inc., Seattle, WA, USA) and recently the DJI P4M (SZ DJI Technology Co., Ltd., Shenzhen, China). Those systems consist of cameras able to capture reflected light with 10–40 nm bandwidth in the visible, red edge and nir spectral channels, then co-registered to create a composite image with several spectral bands [23]. The multispectral cameras are considered consolidated tools for the calculation of the main vegetative indices, however the reduced number of spectral bands acquired (generally five bands: blue, green, red, red edge and nir), and the discrete bandwidth (average 10–40 nm), do not allow high detail analyses, by means investigating the spectral response of the canopy in further specific wavelength indices. A new solution to overcome these limitations is the development of specific hyperspectral cameras to be mounted on UAV platforms [2,3,24,25,26]. These sensors provide a spectral signature per pixel of each image creating a three-dimensional data cube or hypercube. In detail, a frame hypercube is composed by a sequence of images each corresponding to individual bands acquired by the camera. The hyperspectral cameras can be classified according to the methodology by which these sensors build the hypercube. A pushbroom sensor, such as the Headwall micro-Hyperspec VNIR (Headwall Photonics Inc., Bolton, MA, USA), records images line by line in motion, while snapshot sensors, such as the Senop HSC-2 (Senop Oy, Kangasala, Finland) record single images for each band selected sequentially in time. Considering this functionality aspect, it can be assessed that a snapshot hyperspectral camera is conceptually more similar to the previously described commercial global shutter multispectral camera, where each optic per channel acquires all pixels of the image simultaneously. Simplifying, the main difference compared to those cameras, is that a hyperspectral snapshot camera generates a multilayer cube from bands acquired sequentially over time, while in a global shutter multispectral camera such as DJI P4M, the multilayer image is generated by bands acquired simultaneously from five separate optics. As reported by Aasen et al. [17], multispectral and hyperspectral sensors based on different lens or tuneable filters produce non-aligned spectral band images. This issue is critical in case of low altitude and high-speed flight, and high number of acquired bands. Considering the last generation models of multispectral cameras typically 4 or 5 lenses, the software implements very accurate bands co-registration algorithms, which allows to generate good quality multilayer images and orthomosaic. This aspect is more critical and still challenging with hyperspectral snapshot technologies where, for a huge number of spectral bands acquisition, a spatial shift between each single band image is present. To overcome this issue, Honkavaara et al. [27] suggested a co-registration methodology, based on the orientations of few selected bands using photogrammetric approach, then used as references bands to perform the matching of the other non-aligned bands.
There are numerous types of software on the market, such as Pix4D (Pix4D S.A., Prilly, Switzerland), DJI Terra (SZ DJI Technology Co., Ltd., Shenzhen, China) or Agisoft Metashape (AgiSoft LLC, St. Petersburg, Russia), to automate the image post-processing capable of recognizing the characteristics of the multispectral camera used and making the necessary geometric corrections (lens distortion and de-vignetting). As next step, the GPS metadata are used for unsupervised geo-positioning and photogrammetric reconstruction [28,29], and finally these software generate the accurate orthomosaic and digital surface model (DSM) of the monitored field. However, the most critical phase in the processing flow is the radiometric correction, which is fundamental to guarantee correct and comparable spectral data, normalized with respect to the different environmental light conditions [30,31]. The radiometric calibration process allows the conversion of image raw digital numbers (DN) to reflectance data related to canopy spectral response, which is necessary to compute a wide range of VIs [1,32]. The most common approach to solve this issue is the empirical line method (ELM) based on the acquisition during the flight of at least one reference panel with known reflectance and Lambertian properties, which means that surface reflectance is not affected by the illumination angle [29,33]. Following this method, the relationship between reference panel DN extracted from the UAV image and the known reflectance value of that panel are used to convert the DNs of all image pixels into reflectance values [14,34,35].
On the other hand, some consumer-grade multispectral cameras could improve the quality of spectral data by means the use of an irradiance sensor mounted on the top of the UAV platform, capable of measuring the global incident irradiance in synchrony with vegetation radiance captured by the camera. Higher accuracy can be obtained using other cameras (such as Tetracam Mini MCA, MicaSense RedEdgeM or DJI P4M) equipped with a band by band incident light sensor, which allows to measure irradiance for each band acquired from the camera. This condition allows another radiometric calibration approach, defined by Cao et al. [36] as measured incident radiation (MIR), using data collected by the camera irradiance sensor during flights for image reflectance assessing. The authors report that many types of image processing software are able to perform automatic correction using the irradiance metadata of each image.
Different sensors may use different conversion methods, but the process has a strong impact on the reflectance value, which in turn would have an impact on the VIs calculation. Without the need for an empirical calibration, many camera manufacturers have their radiometric calibration methods. As reported by Fraser and Congalton [37], it is difficult to thoroughly investigate those commercial solutions due to the “black box” processing imposed at several steps in either software package. The DJI Phantom 4 Multispectral (P4M), unlike many others, provides users with DN numbers, which can then be transformed into reflectance to measure the VIs [38], using the software DJI Terra or applying an empirical line method performed by the user. This aspect opened a research perspective, allowing the performances of the commercial DJI software in providing an accurate radiometric correction of the DN of the RAW images to be investigated. Considering the wide use of VIs in precision agriculture, this study aims to evaluate and compare remote sensed imagery provided by two well diffused commercial cameras with snapshot approach but different spectral detection power, represented by P4M multispectral and SENOP HSC-2 hyperspectral sensors. As underlined by several authors [39,40,41], to correctly perform that comparison, a portable field spectroradiometer was used for evaluating the accuracy and performance of remote sensing data.
For all kinds of user in both the research and operating sector, knowledge of the pro and cons of commercial sensors could be crucial in the choice of the correct sensor for a specific requirement, and correctly invest money in hardware that is still expensive for agriculture applications, especially a hyperspectral camera. However, there are few reports that simultaneously compare the performance of different UAV-based cameras, in crop monitoring under the same light condition.
von Bueren et al. [42] compared four optical UAV-based sensors with ground spectral measurements to evaluate their suitability for agricultural applications, finding higher performance with a non-imaging spectroradiometer (R2 = 0.98) and Tetracam Mini-MCA6 (R2 = 0.92), while lower with a Canon PowerShot SD780 RGN (red-green-nir) camera (R2 = 0.65) and SONY Nex5n RGB camera (R2 = 0.63).
Bareth et al. [43] compared two hyperspectral cameras, the Cubert UHD185 (Cubert GmbH, Ulm, Germany) and the Rikola (Rikola Ltd., Oulu, Finland), and showed that both sensors matched very well with ground-based field spectrometer measurements. Nebiker et al. [44] investigated the performance of two multispectral cameras mounted on the light-weight fixed-wing eBee platform (SenseFly, Cheseaux-sur-Lausanne, Switzerland) using a portable spectroradiometer HandySpec Field (tec5, Oberursel, Germany). The comparison was performed using the low-cost single-lens camera Canon S110 NIR (Canon U.S.A. Inc., Melville, NY, USA) with modified Bayer colour filters (green, red and nir) and the high-end four-optics camera with band-pass interference filters (green, red, red edge and nir) multiSPEC 4C (SenseFly, Cheseaux-sur-Lausanne, Switzerland). The results showed that measurements with the high-end camera correlate very well with ground-based field spectrometer measurements, with an average difference of 0.01–0.04 NDVI values. As regards the low-cost camera, despite being able to provide a noticeably superior spatial resolution (12MP vs. 1.2MP), it reveals a significant bias of −0.26 NDVI values, primarily caused by the overlapping spectral channels.
A comparison between two models of multispectral cameras, the narrowband Mini-MCA6 and broadband Parrot Sequoia, was conducted by Deng et al. [35]. The authors acquired remote sensed data simultaneously with six standard diffuse reflectance panels (4.5%, 20%, 30%, 40%, 60% and 65%), and collected ground vegetative chlorophyll measurements. The results showed that the reflectance of the Mini-MCA6 camera had higher accuracy in the nir band but required an accurate radiometric nonlinear calibration method, while the reflectance accuracy of the Sequoia was higher in the red edge band.
Lu et al. [38] analysed the performance of the Parrot Sequoia and DJI P4M sensors using different combinations of correlation coefficients and accuracy assessments. The results showed that Sequoia and P4M are highly correlated with ASD portable spectroradiometer (R2 > 0.90) and provide good accuracy (Sequoia RMSE < 0.07; P4M RMSE < 0.09).
As reported by Crucil et al. [45], an aspect to consider is that the performances of a multispectral camera can vary if used in the estimation of specific parameters related to the state of crops or soil. In fact, the authors demonstrated how different resolution provided by Parrot Sequoia and Tetracam Mini-MCA6 in some regions of the spectrum, can be more functional to identify and model qualitative aspects of the observed target, represented by soil organic content (SOC). In detail, authors reported that narrow bands used in the Sequoia camera, centred at 660 and 790 nm, cover a spectral range more correlated to SOC (RMSE = 2.7, R2 = 0.94) than the narrow bands available on a Mini-MCA6 in the same regions (RMSE = 3.3, R2 = 0.93), however both of them reached a similar performance to ASD spectra resampled on the cameras’ windows (RMSE = 2.6, R2 = 0.94).
Given the wide use of UAV both by researchers and consultant service companies there is the need for further performance assessment. Moreover, VIs are often taken into consideration, while little attention is paid to the evaluation of the entire spectral signatures. There is also a lack of studies which consider not only the canopy, but also other targets that may be present in the field, such as bare or stony soil, grass cover and mixed conditions, which are integral elements of a spectral analysis in field monitoring activities. This work aims to investigate all these aspects.
In detail, the purpose of this study is to analyse the accuracy of multispectral and hyperspectral high-resolution images acquired in flight by a UAV platform equipped with different commercial cameras, the DJI P4M and SENOP HSC-2. To achieve this objective, firstly the accuracy of the SENOP HSC-2 hyperspectral camera was assessed using a GER 3700 (Spectra Vista Corporation, Poughkeepsie, NY, USA) reference spectroradiometer taking into account 8 reflectance reference panels and 5 different targets that can commonly be found in vineyards and acquired during field monitoring activities. To perform that analysis, both scatter plots (sensors vs. reference panels) and visual comparison (sensors vs. reference panels and sensors vs. field common targets) of each spectral signature were considered. Secondly, the performance of hyperspectral and multispectral camera was evaluated by means of the calculation of VIs, versus the ground truth values provided by the spectroradiometer. The vegetation indices used in this study were selected with the aim of testing each channel available on both spectral cameras, so considering the wide use in remote sensing of nir based normalized indices. 3 vegetation indices (GNDVI, NDVI, NDRE) were evaluated. In general, we want to provide insights to assist end users (drone users, policy makers, researchers) in identifying appropriate calibration solutions to obtain reliable information from different UAV sensors for the analysis of spatial and temporal variability within vineyards.

2. Materials and Methods
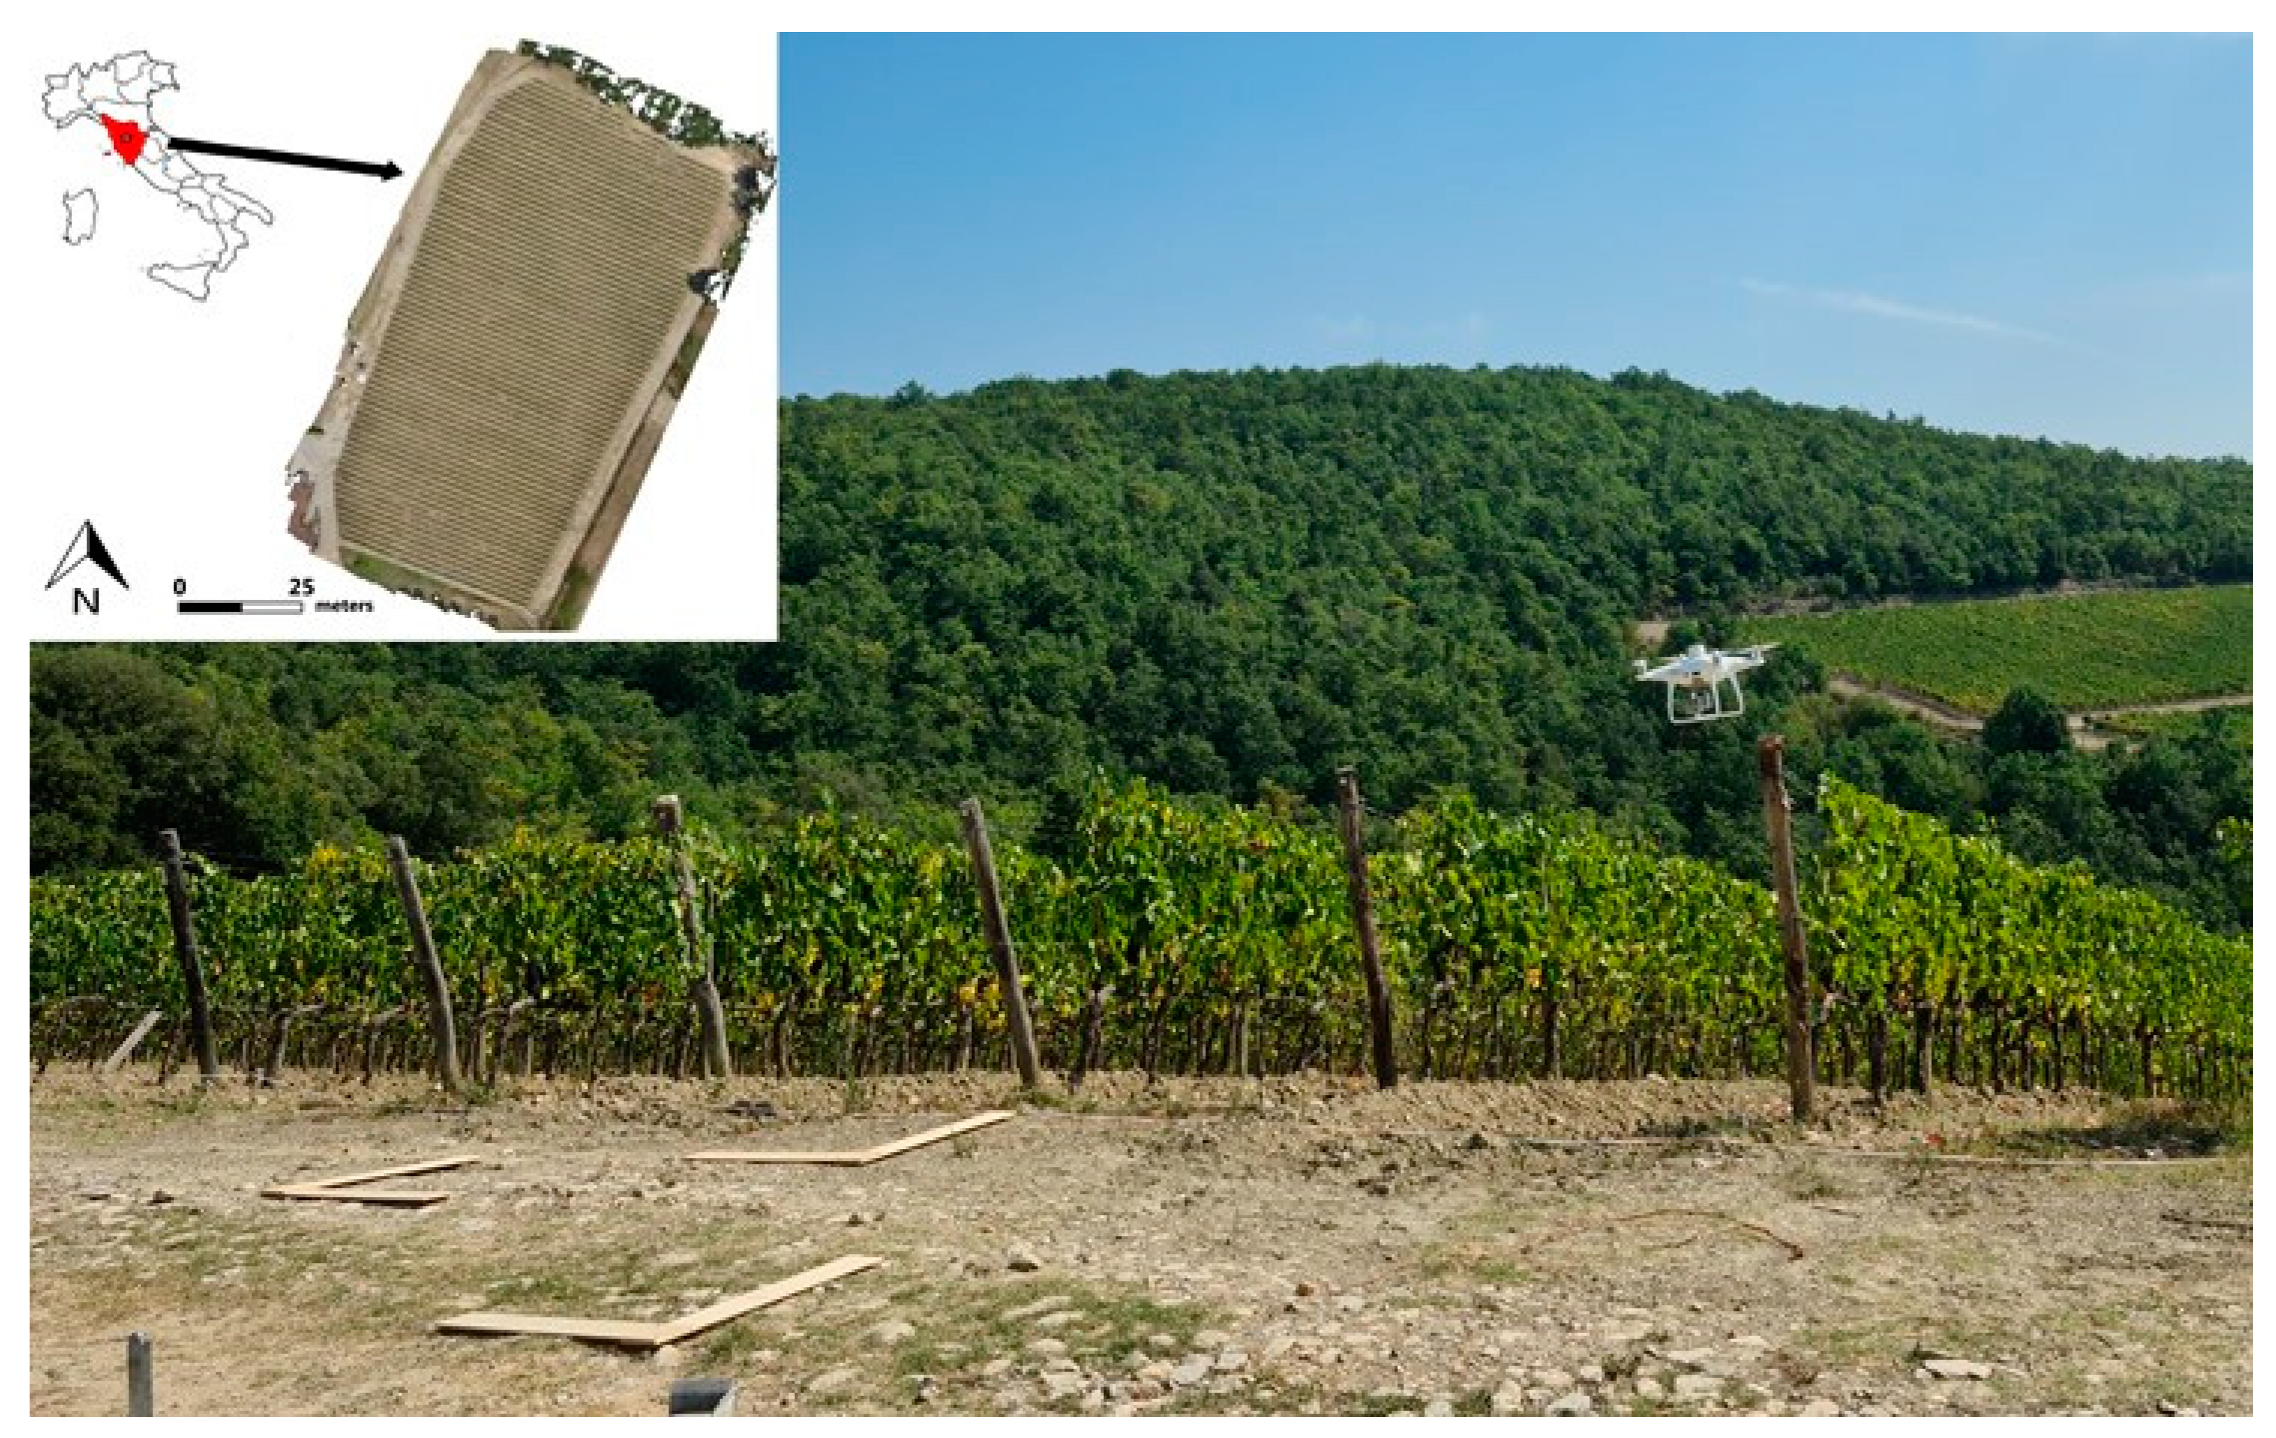
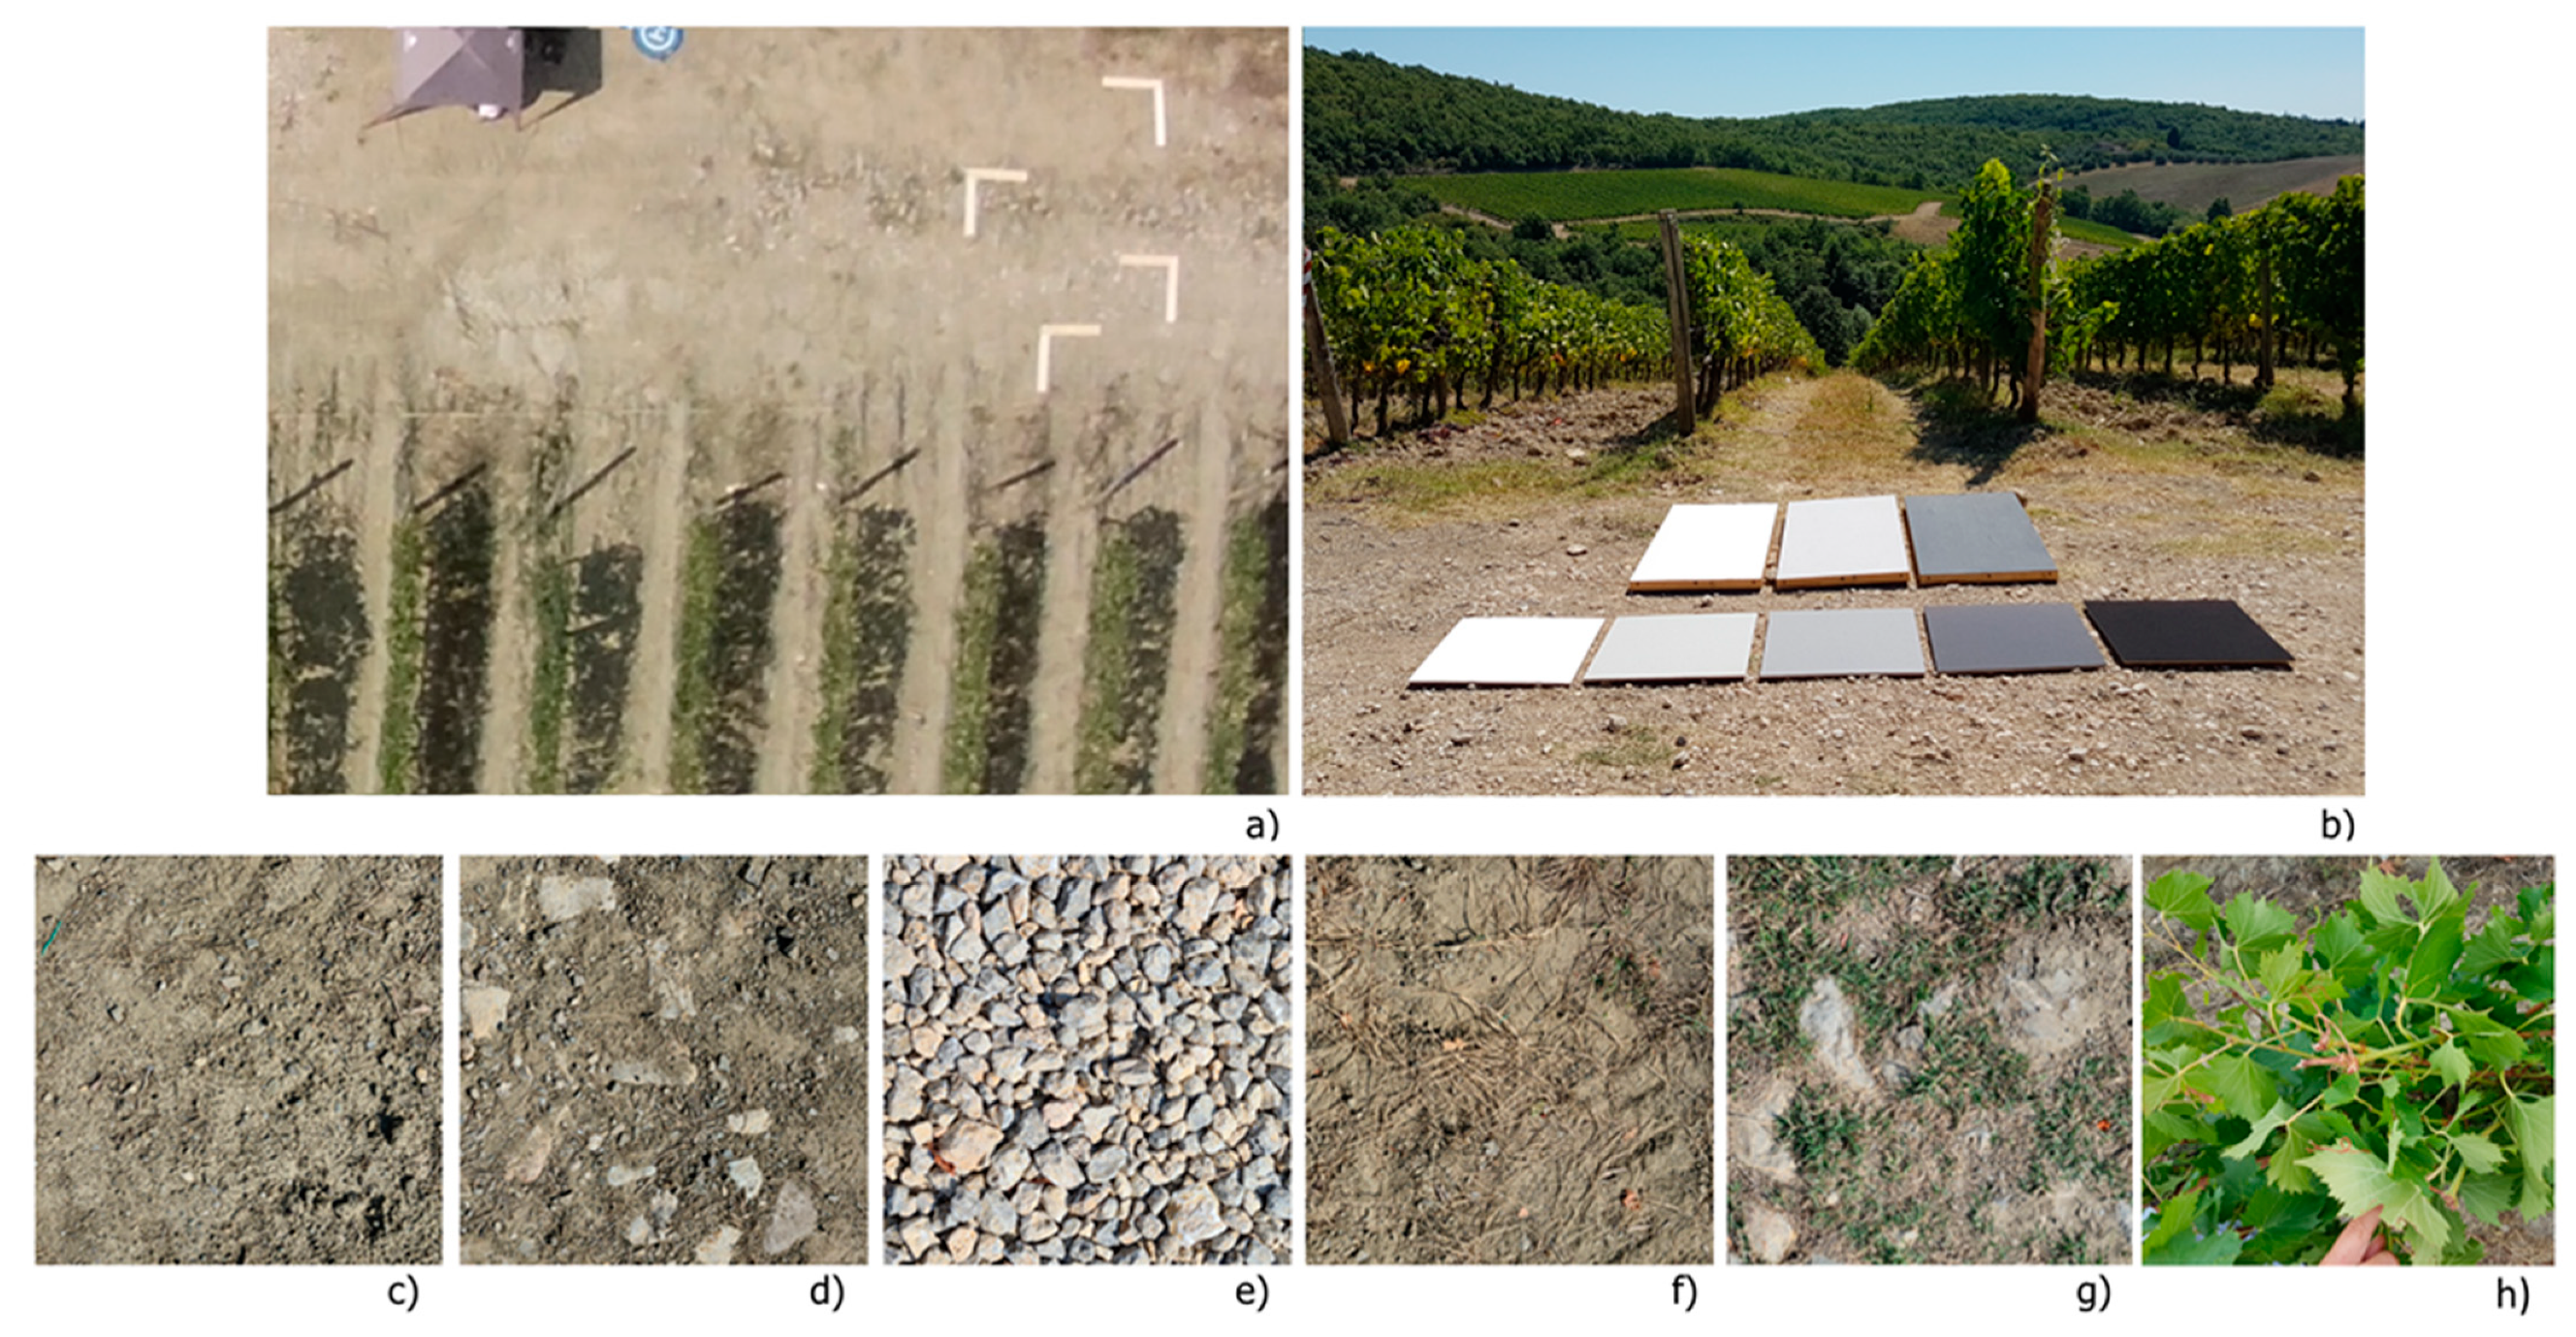
2.1. Study Area

The research was undertaken during the 2020 growing season in a 1.4 ha vineyard (355 m above sea level) planted in 2008, owned by Castello di Fonterutoli farm (Marchesi Mazzei Spa) and located in Castellina in Chianti (Siena, Italy) (43°25′45.30″ N, 11°17′17.92″ E) (Figure 1). Sangiovese cultivar (Vitis vinifera) vines were trained with spur-pruned single cordon and vertical shoot-positioned trellis system. The vine spacing was 2.20 × 0.75 m (inter-row and intra-row distance) and the rows were NW-SE oriented on a southern sloping vineyard.

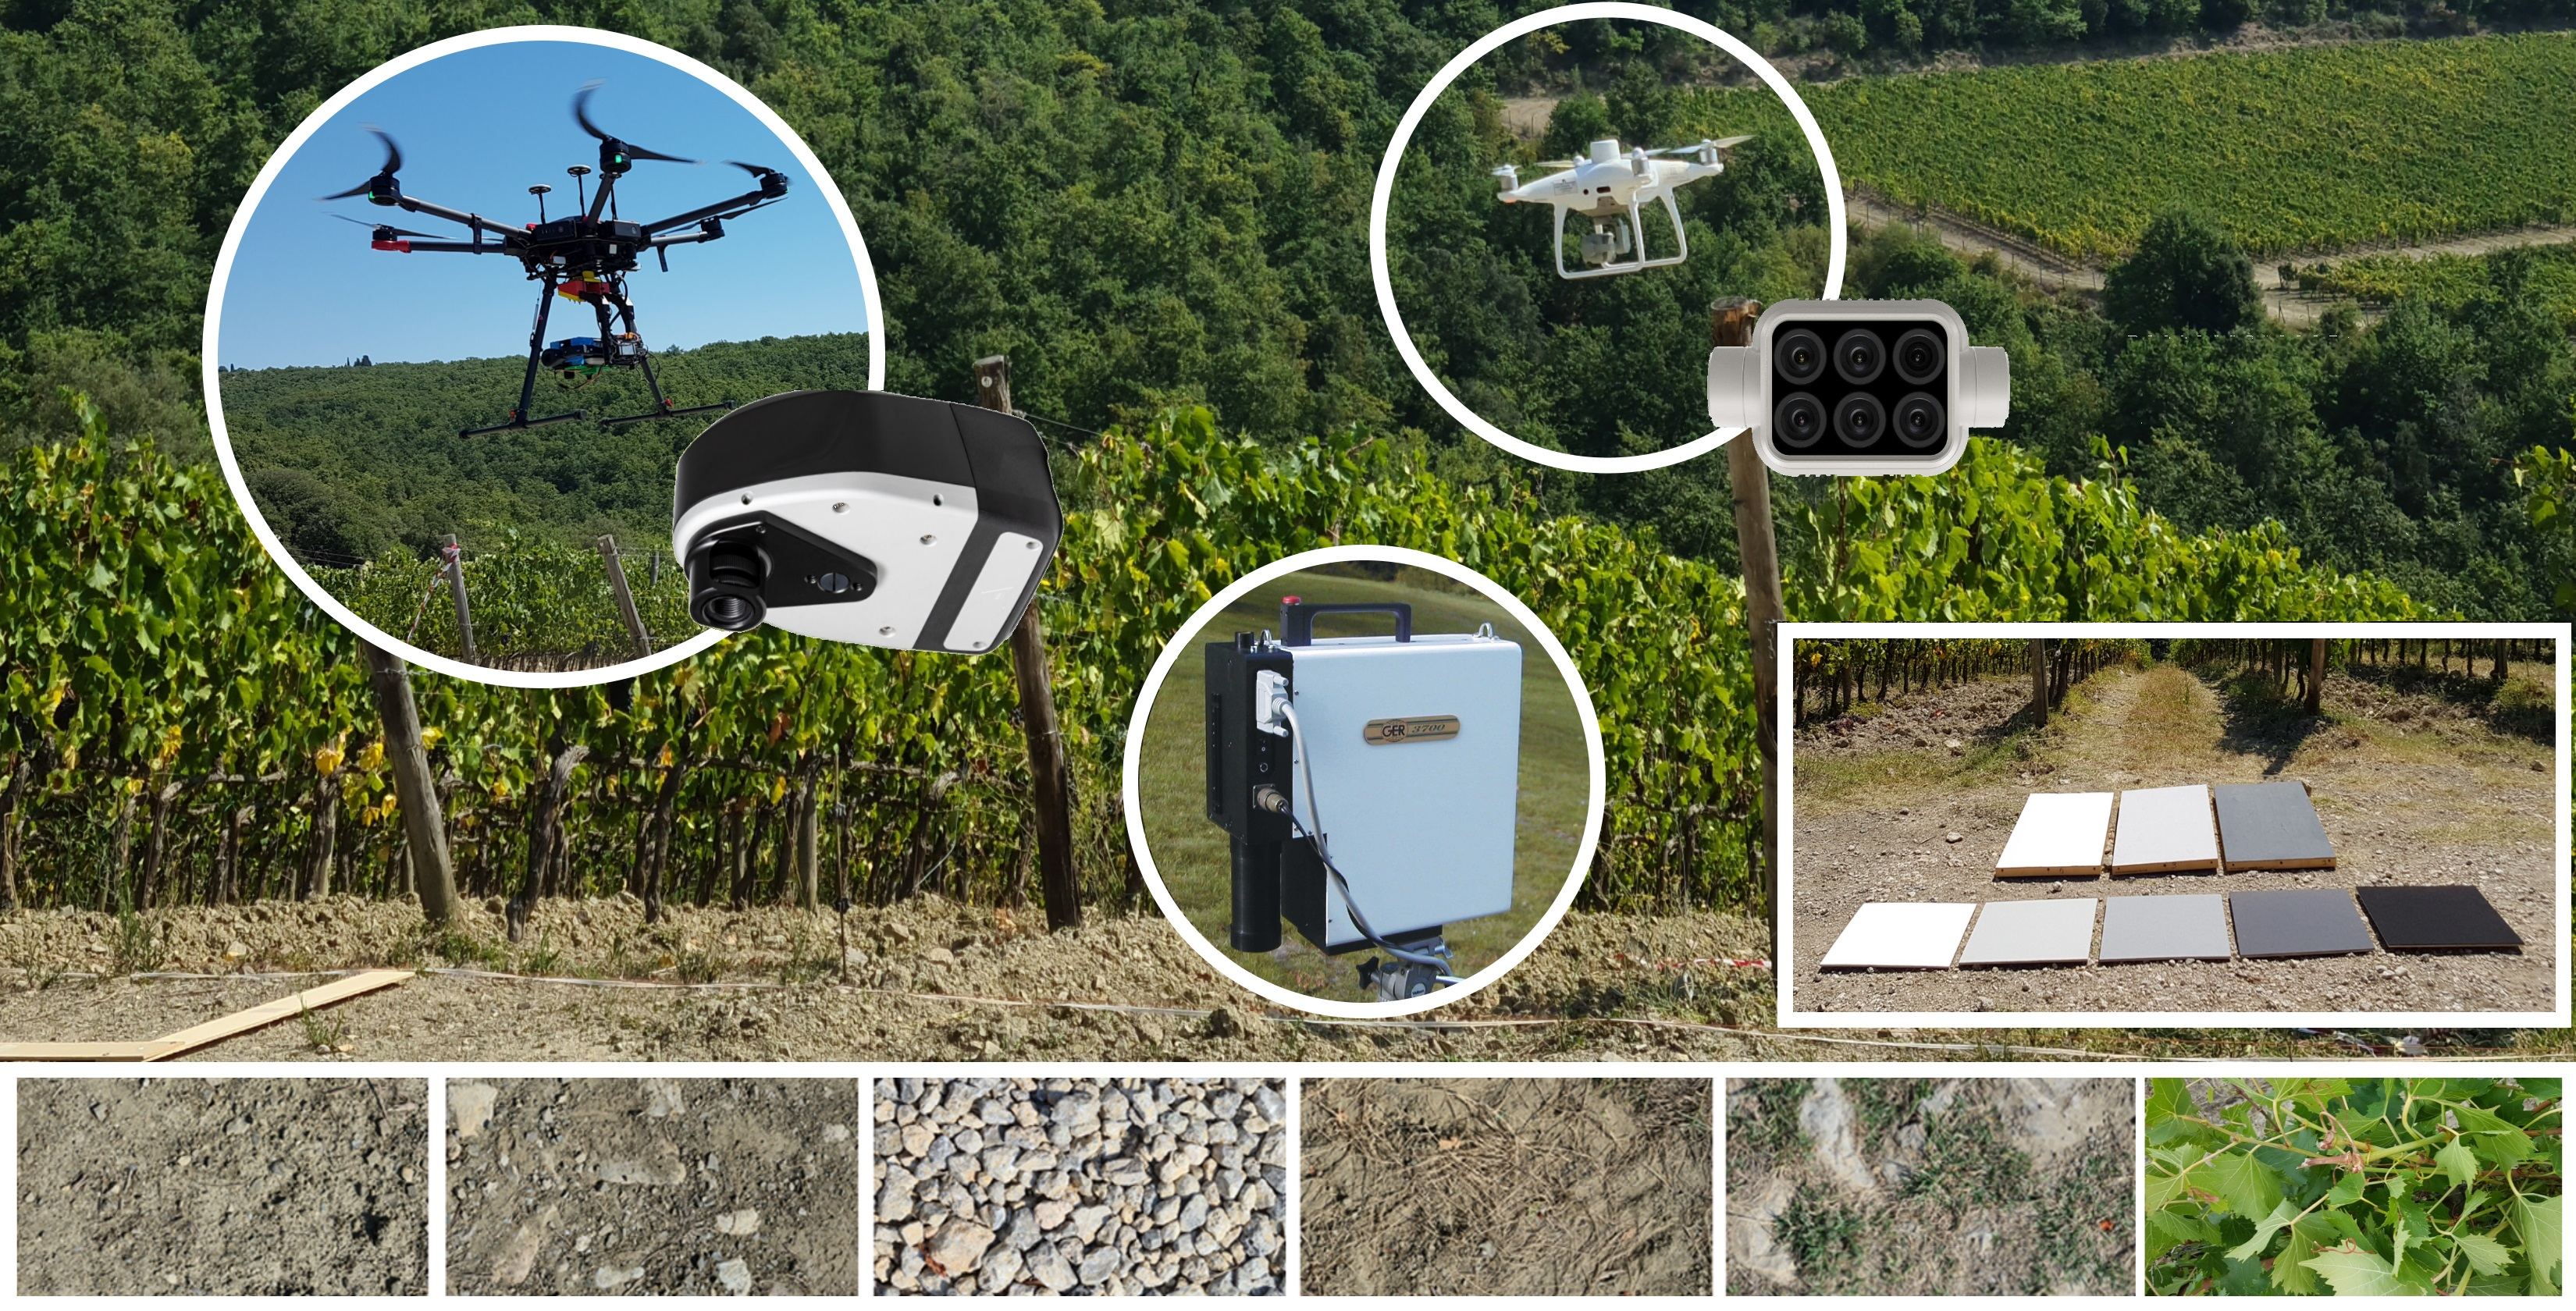
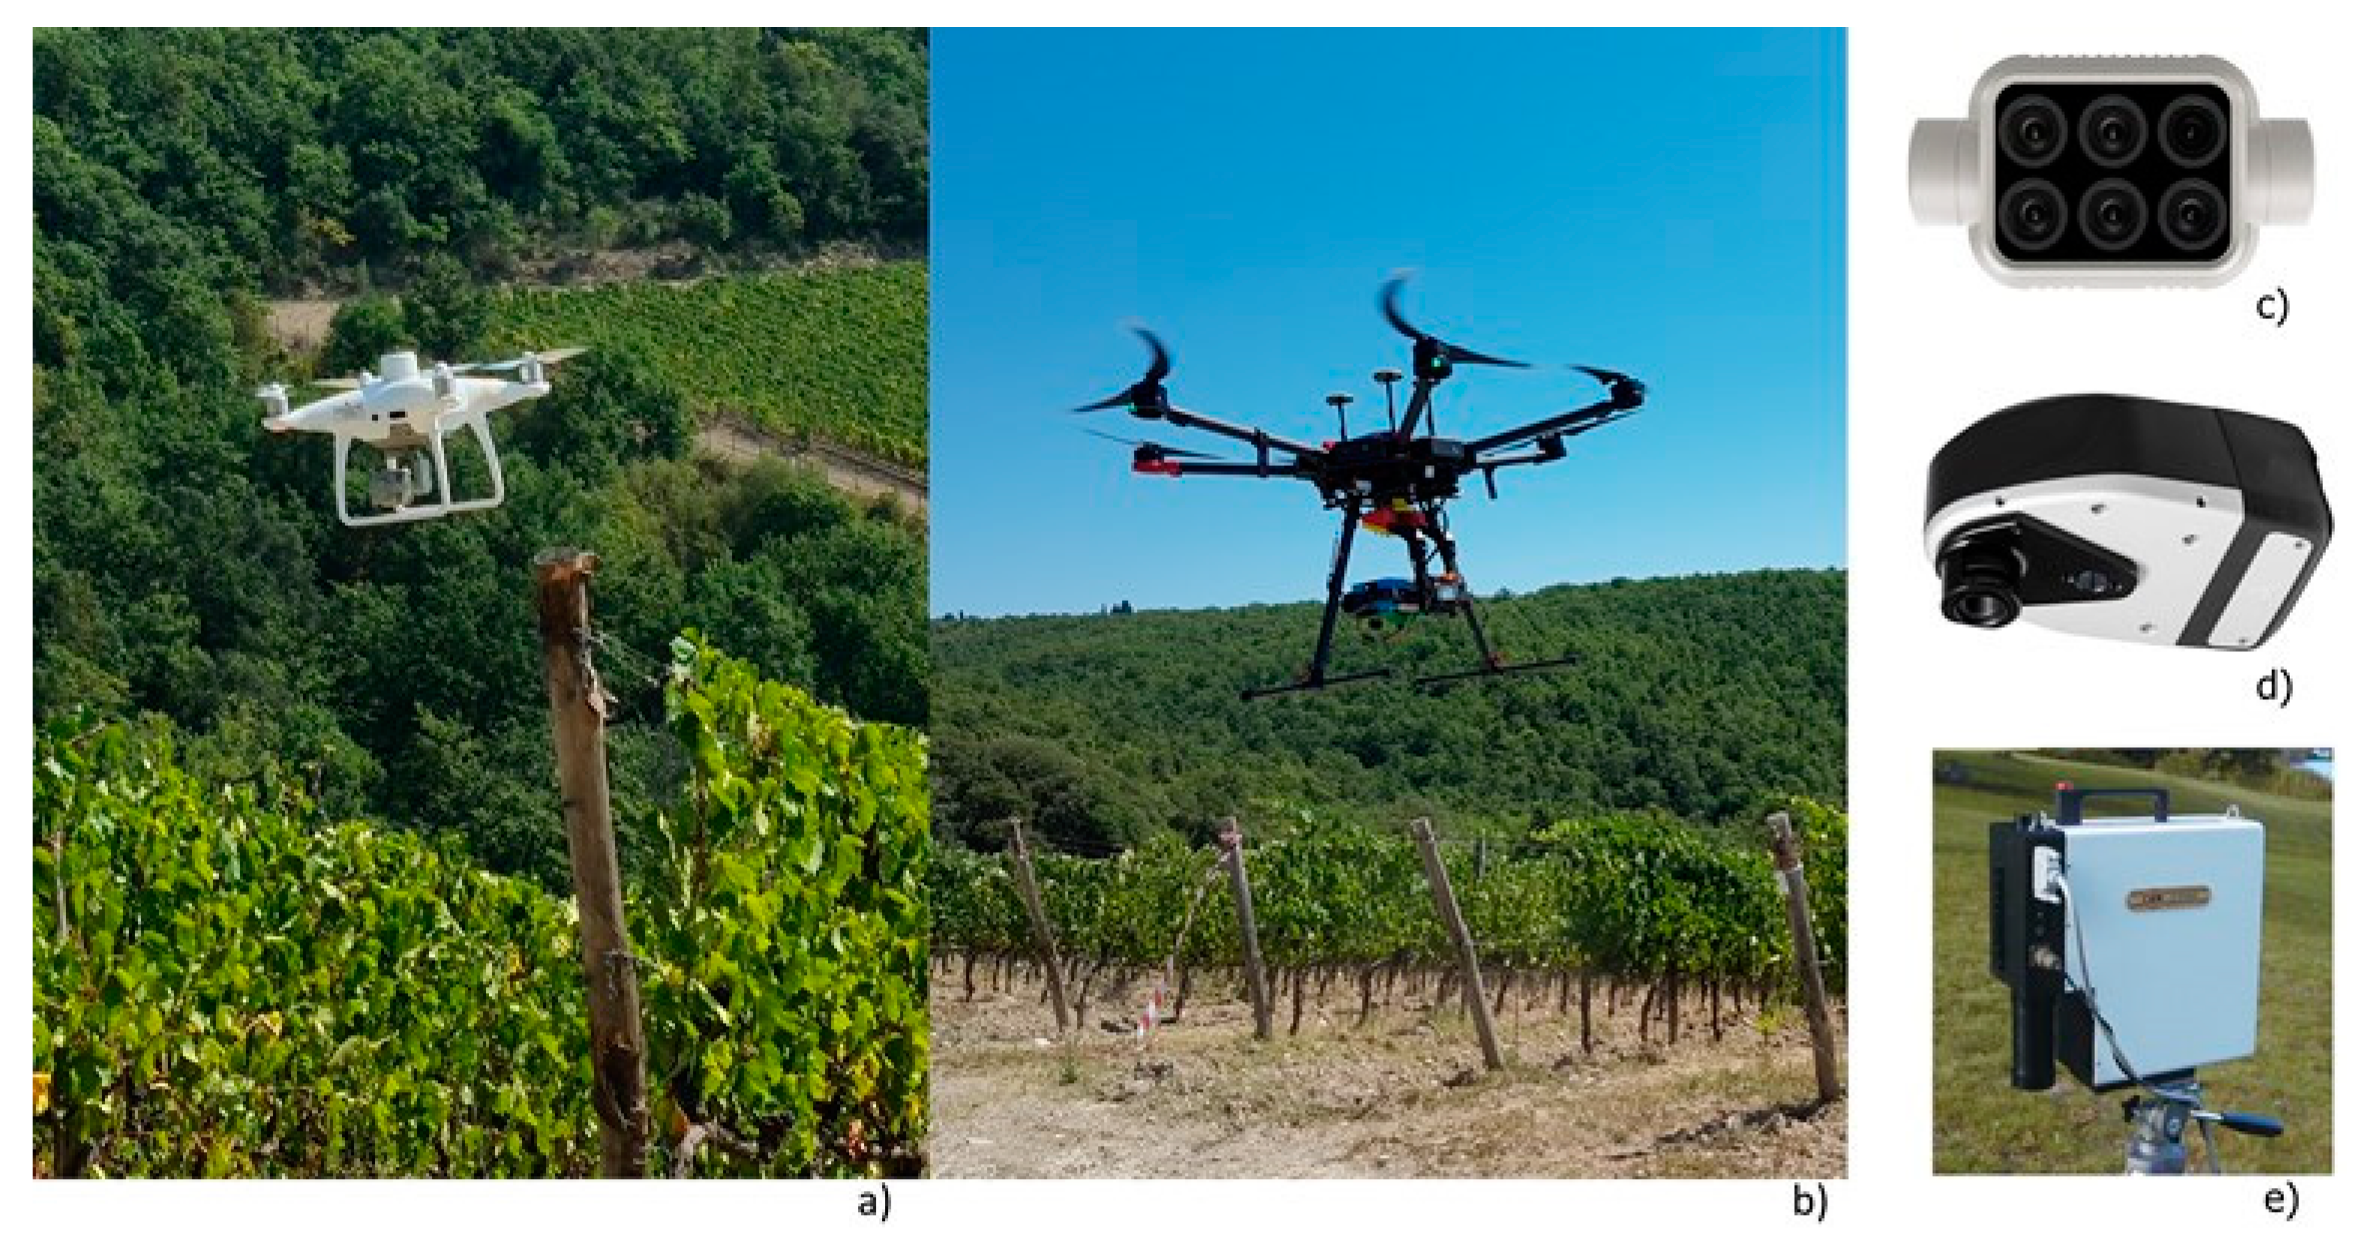
2.2. Hardware Description

The dataset used in this work to perform a spectral comparison between different imaging sensors, was acquired by means a series of flight campaigns using two distinct UAV platforms equipped with multispectral and hyperspectral cameras. Different targets were previously identified and then acquired during each flight to have representative spectra of the different conditions that may occur in the field, such as soil, grass cover and canopy and their combination. In addition, 8 reference panels with known reflectance were used for radiometric correction of the sensors. Proximal measurements acquired with a reference spectrometer were used to assess the accuracy of the remote spectral data.
Multispectral image acquisition was performed using the camera mounted on the DJI Phantom 4 Multispectral (P4M) (SZ DJI Technology Co., Ltd., Shenzhen, China) (Figure 2c). The P4M camera has six 1/2.9” CMOS sensors mounted, including one RGB sensor and five monochrome sensors to measure spectral response in the blue, green, red, red edge and nir bands. Each sensor provides global shutter 1600 × 1300 pixels image resolution (2.08 MP effective pixels). The P4M camera is also equipped with an irradiance sensor, used to normalize the DN of each band, providing an output identified by DJI as “reflectivity”, which is not real reflectance data. The UAV platform has a take-off weight of 1487 g and the average flight time is 27 min.
The imaging sensor used for the hyperspectral sensing is a SENOP HSC-2 camera (Figure 2d), which acquires snapshot images of up to 1000 narrow bands in the 500–900 nm spectral range. This camera provides true image pixels with a 1024 × 1024 resolution without any interpolation. The Senop HSC-2 camera features a true global shutter snapshot sensor based on Fabry-Pérot Interferometer (FPI) technology, which is made up of two separate CMOS sensors (visible and nir) that use a beam splitting system and a beam splitting part to redirect light rays. By grabbing successive frames, a set of different spectral bands is created. In addition, the user can choose the spectral bands, range limits, and spectral resolution of the hyperspectral cubes that the sensor will acquire. The main limitation of this camera is a direct consequence of the management of the 2 separate sensors in an acquisition step with high noise data near the gap of about 14 nm (636–650) at the junction point of the 2 sensors. However, as reported by Tommaselli et al. [46], this technical issue does not affect the rest of the spectrum.
For this reason, the graphs of the spectral signatures presented in the results section of this paper show missing data in that area.
Ground truth spectral validation was performed using the field portable spectroradiometer GER-3700 as reference, which acquires 704 bands in the 350–2500 nm in spectral range (Figure 2e). This spectroradiometer measures single point data using a 1.5 m length fibre optic with 25° FOV, and allows automatic dark current correction, auto integration and selectable spectrum averaging. The GER-3700 needs to be connected to a Windows laptop for real-time acquisition and display of spectra stored in ASCII format file.
The specifics of each sensor used in this research are reported in Table 1.

2.3. Data Acquisition

The UAV flights were conducted in clear sky conditions from 11:30 to 12:30 on 15 September 2020, acquiring images of the study site, including 6 different ground targets representing common surface types which can occur in a vineyard and 8 reference panels for radiometric correction. Those targets and panels were also used as ground control points (GCPs) for georeferencing process. During data collection, a total of 6 flights were performed using the P4M mounted on the own DJI UAV platform (Figure 2a), and a Matrice 600 Pro UAV (SZ DJI Technology Co., Ltd., Shenzhen, China) carrying the SENOP HSC-2 (Figure 2b). Multispectral image acquisition was performed at 50 m above the ground, yielding a ground resolution of 0.03 m/pixel and 70% of overlap in both directions. A series of 6 surveys with identical flight planning were made with P4M camera to evaluate the configuration parameters impact versus light condition, setting different combinations of exposure time (ET) and exposure value (EV) 1/10,000_0, 1/8000_0, 1/8000_-0.7, 1/8000_1, AUTO_0, AUTO_-1. Regarding the hyperspectral sensing, the flight altitude was set at 32 m above the ground, providing a ground resolution of 0.02 m/pixel, while the flight speed and flight line distance were set to obtain the same overlap as the multispectral flight (70% of overlap in both directions). HSC-2 was configured with 200 spectral bands with a Full Width at Half Maximum (FWHM) of 10 nm. The integration time was 1 ms to avoid saturation effect, especially with white reference panels. During the UAV flight, a GER 3700 spectroradiometer was used to perform synchronous ground measurements of the spectral signature of vine canopy, ground targets and reference panels to ensure a correct remote data validation.

2.4. Target Characterization and Reference Reflectance Panels

The performance of the imaging sensors examined in this study on precision agriculture sensing activities was evaluated using a series of different targets identified on the ground and marked with wooden frames built ad hoc by the authors to extract them correctly from the remote images. The choice of the type and therefore positioning of the targets was made to meet the need to analyse the spectral response of the most common surfaces that may occur in vineyards (without grass cover practices in the interrow zones), and which can therefore be included in the images acquired in flight by a drone during crop monitoring. Figure 3a reports in detail the position on the ground of 6 targets chosen in an area close to the study site. Specifically, the targets that were chosen concern 5 typical soil conditions, represented by bare soil (Figure 3c), bare-stony soil (Figure 3d), stony soil (Figure 3e), soil with dry grass (Figure 3f) and partially grass covered soil (Figure 3g), and the vine canopy (Figure 3h).
The radiometric correction process was performed through a vicarious calibration based on the absolute radiance method using eight homogeneous and Lambertian surfaces panels placed on the ground close to the take-off location (Figure 3b). Reference panels characteristics are detailed in Table 2.

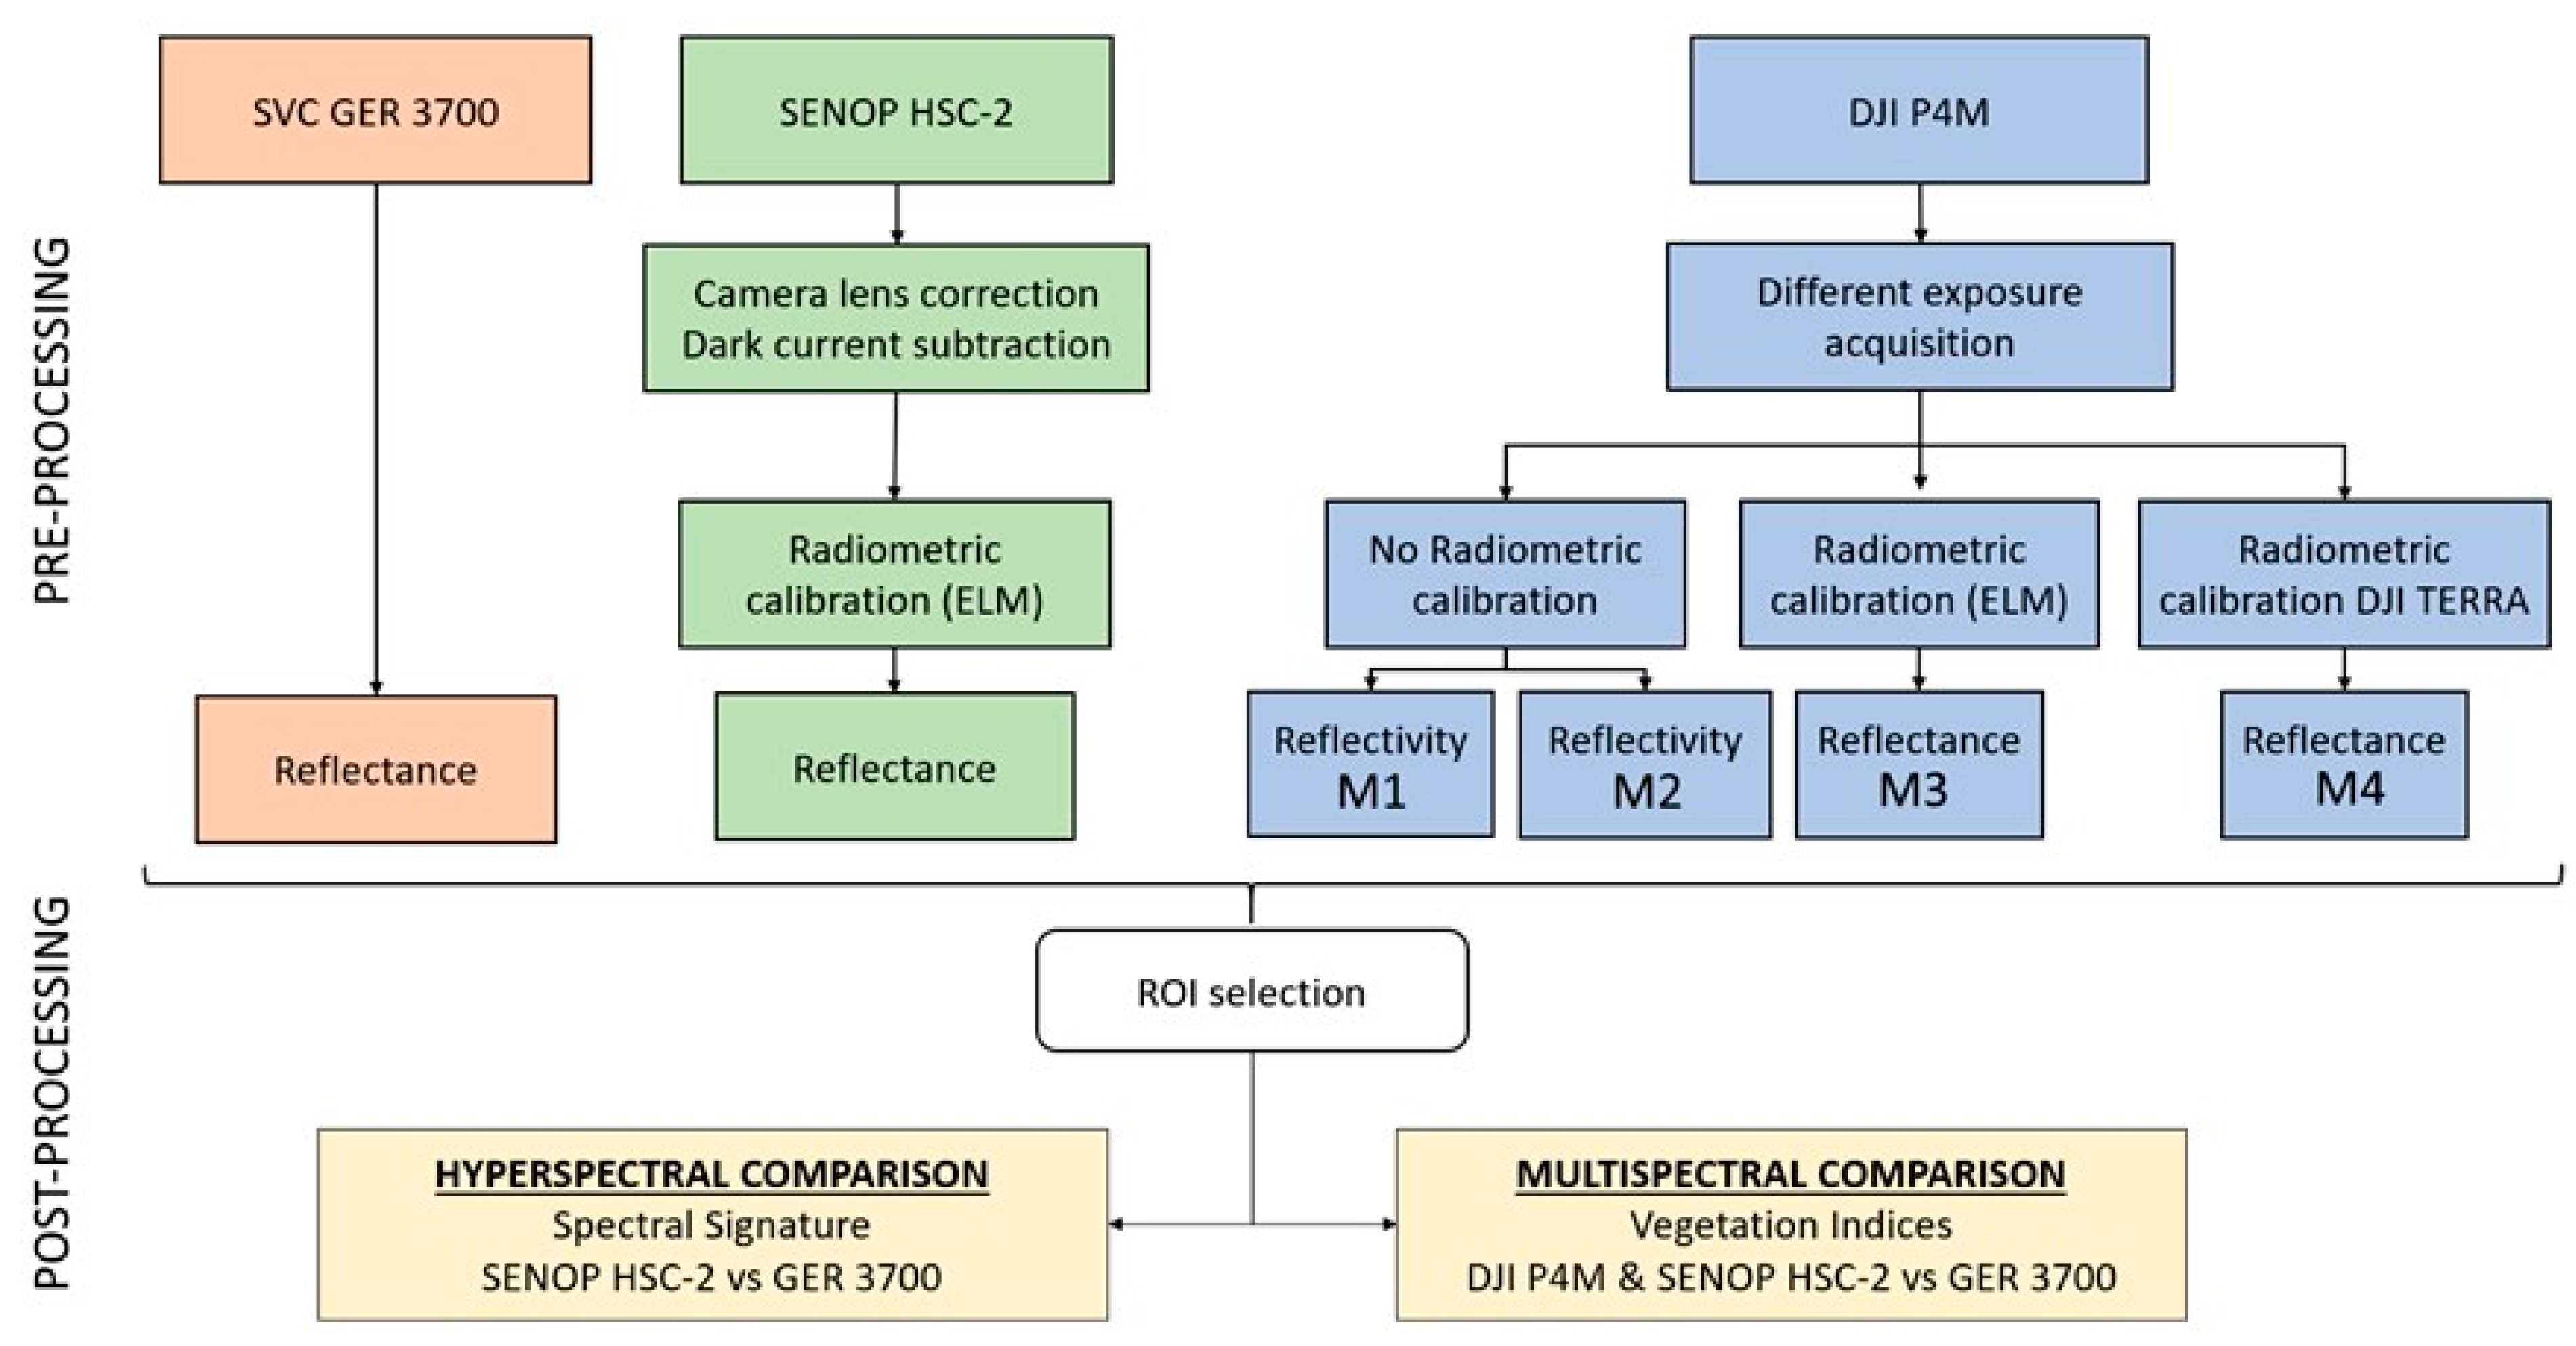
2.5. Image Pre-Processing

The conceptual image processing workflow proposed is summarized in Figure 4.
The first pre-processing step performed in this research was the radiometric correction. This step allows the conversion of each pixel value, defined as Digital Number (DN), into radiance, which is the amount of radiation coming from a surface affected by solar radiation.
Since the relationship between DN and radiance is always linear [47], a gain and offset derived from factory calibration must be applied to the pixel values to transform an uncalibrated image into radiance. Radiance is then converted to reflectance to allow spectral comparison between different sensors, as it reflects the proportion of the radiation striking a surface to the radiation reflecting from it. In fact, reflectance is a property of a surface that is expected to remain constant when determined by different radiometers under identical geometric conditions.
Concerning the radiometric correction process, the multispectral camera under consideration presents a complex situation. The orthomosaics generated by DJI Terra software are not in reflectance, but in a specific format defined by the DJI company as “reflectivity”, represented by DN normalized with the information provided by the irradiance sensor placed on the top of the UAV. In the comparison between multispectral and hyperspectral sensors vs. the ground truth represented by the reference spectroradiometer, this peculiarity provided by P4M has been deepened. In that direction, the VIs used as comparison dataset were calculated with input bands both as reflectivity and reflectance.
The P4M multispectral camera dataset acquired with different exposure times and values, was pre-processed with four different radiometric approaches, two of which not calibrated in DN (M1 and M2) and the other two calibrated in reflectance (M3 and M4). In detail the four methodologies are:
  • M1, spectral comparison performed with DN values from the orthomosaic generated using DJI Terra software v. 1.0 without any calibration step;
  • M2, spectral comparison performed with DN values from the orthomosaic generated using DJI Terra software v. 2.0 without any calibration step;
  • M3, spectral comparison performed with reflectance values, obtained pre-processing the DN values from the orthomosaic generated using DJI Terra software v. 1.0, applying an empirical line method on each band (blue, green, red, red edge and nir) based on the eight reference reflectance panels;
  • M4, spectral comparison performed with reflectance values, obtained pre-processing the DN values of each image by means of the new radiometric calibration tool added to the DJI Terra software v. 2.0, which allows calibration parameters to be extracted uploading images with reference panels.
In regard to hyperspectral images pre-processing, four consecutive elaboration steps were taken: (a) geometrical distortion correction using the Lens Tool in Agisoft Metashape software; (b) dark current removal with Matlab (MathWorks, Natick, MA, USA), which allows noise signals to be removed from each image; (c) radiometric correction of the images of each single band applying an empirical line method using the eight reflectance reference panels.
After these pre-processing steps, Agisoft Metashape was used for single bands mosaicking. Then, the 200 orthomosaics obtained were aligned by means of a supervised procedure of georeferencing using GCPs performed in QGIS software (QGIS—http://www.qgis.org/, accessed on 1 January 2022).
Data extraction for each target and panels was performed from the multispectral and hyperspectral orthomosaics by means of average values contained in a ROI (Region Of Interest) defined by a 0.4 m × 0.4 m polygon centred in each object. The polygon size was chosen as effective solution to better distinguish each object from the adjacent ones and remove boundary effects. The correct extraction of pure canopy pixel reflectance values was ensured by a filtering process made on the orthomosaic using the Canopy Height Model (CHM) as described by Di Gennaro and Matese [5], which allows soil, shadows and grass cover to be removed.

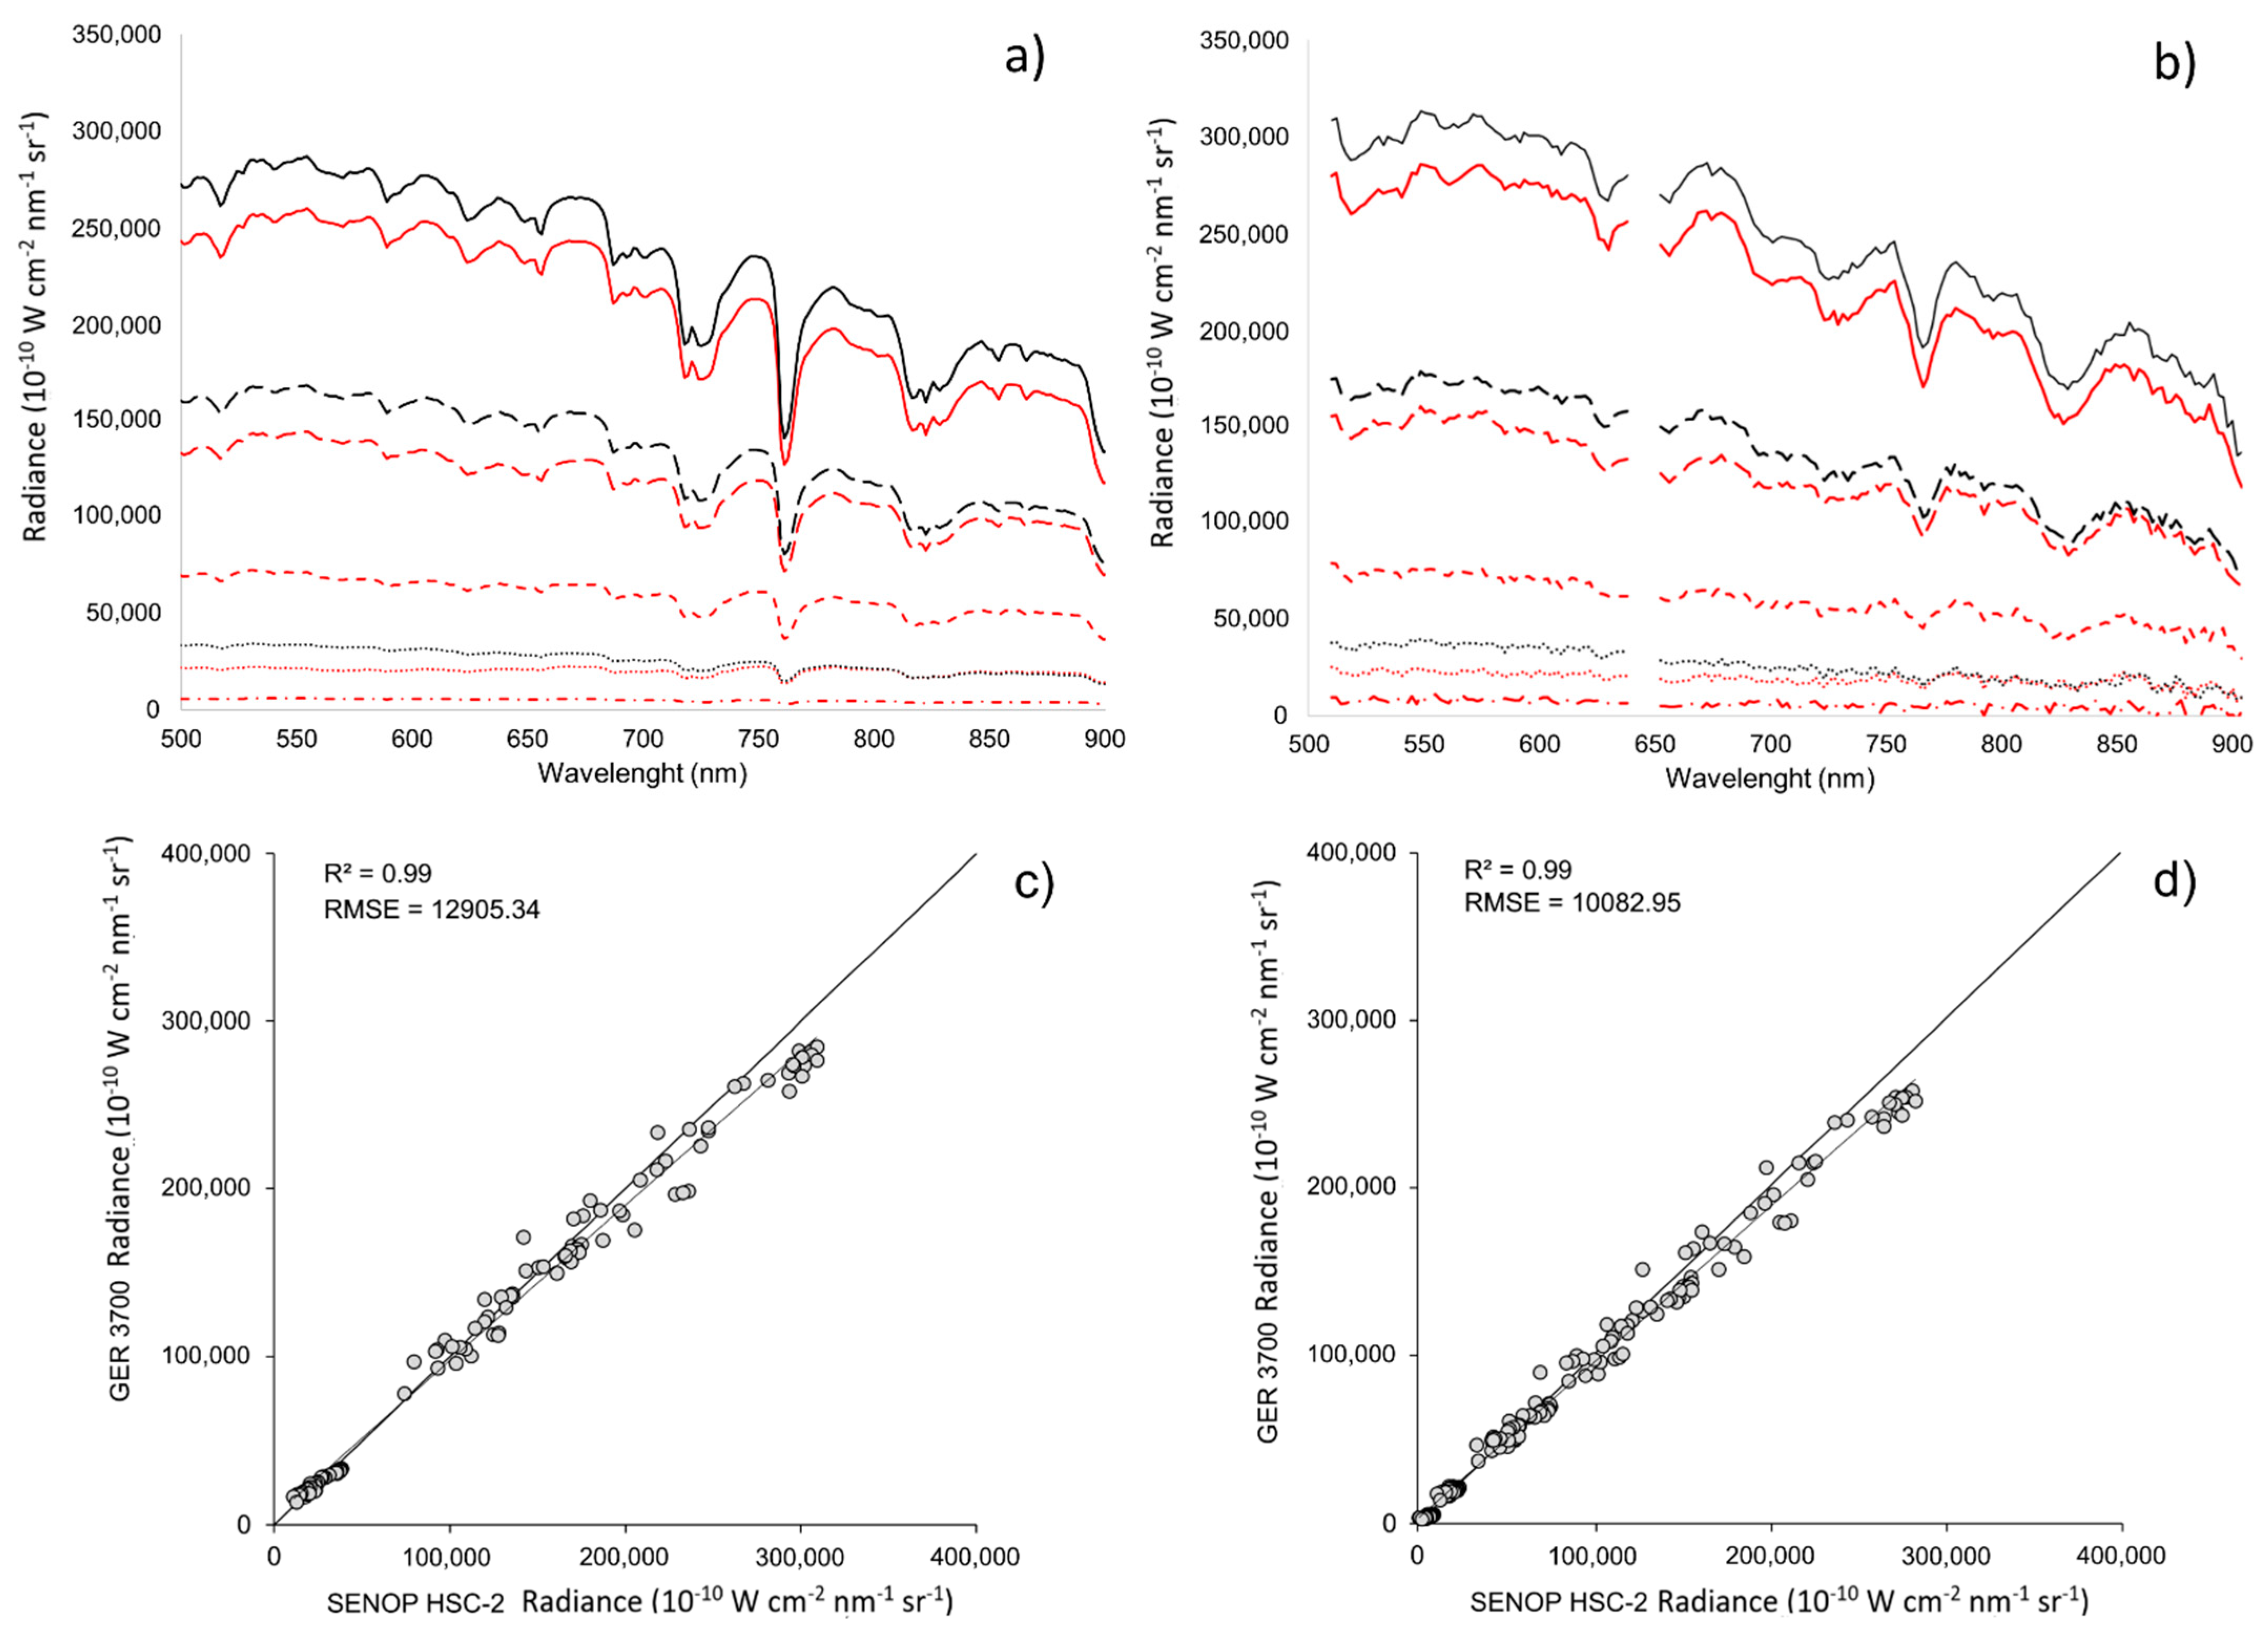
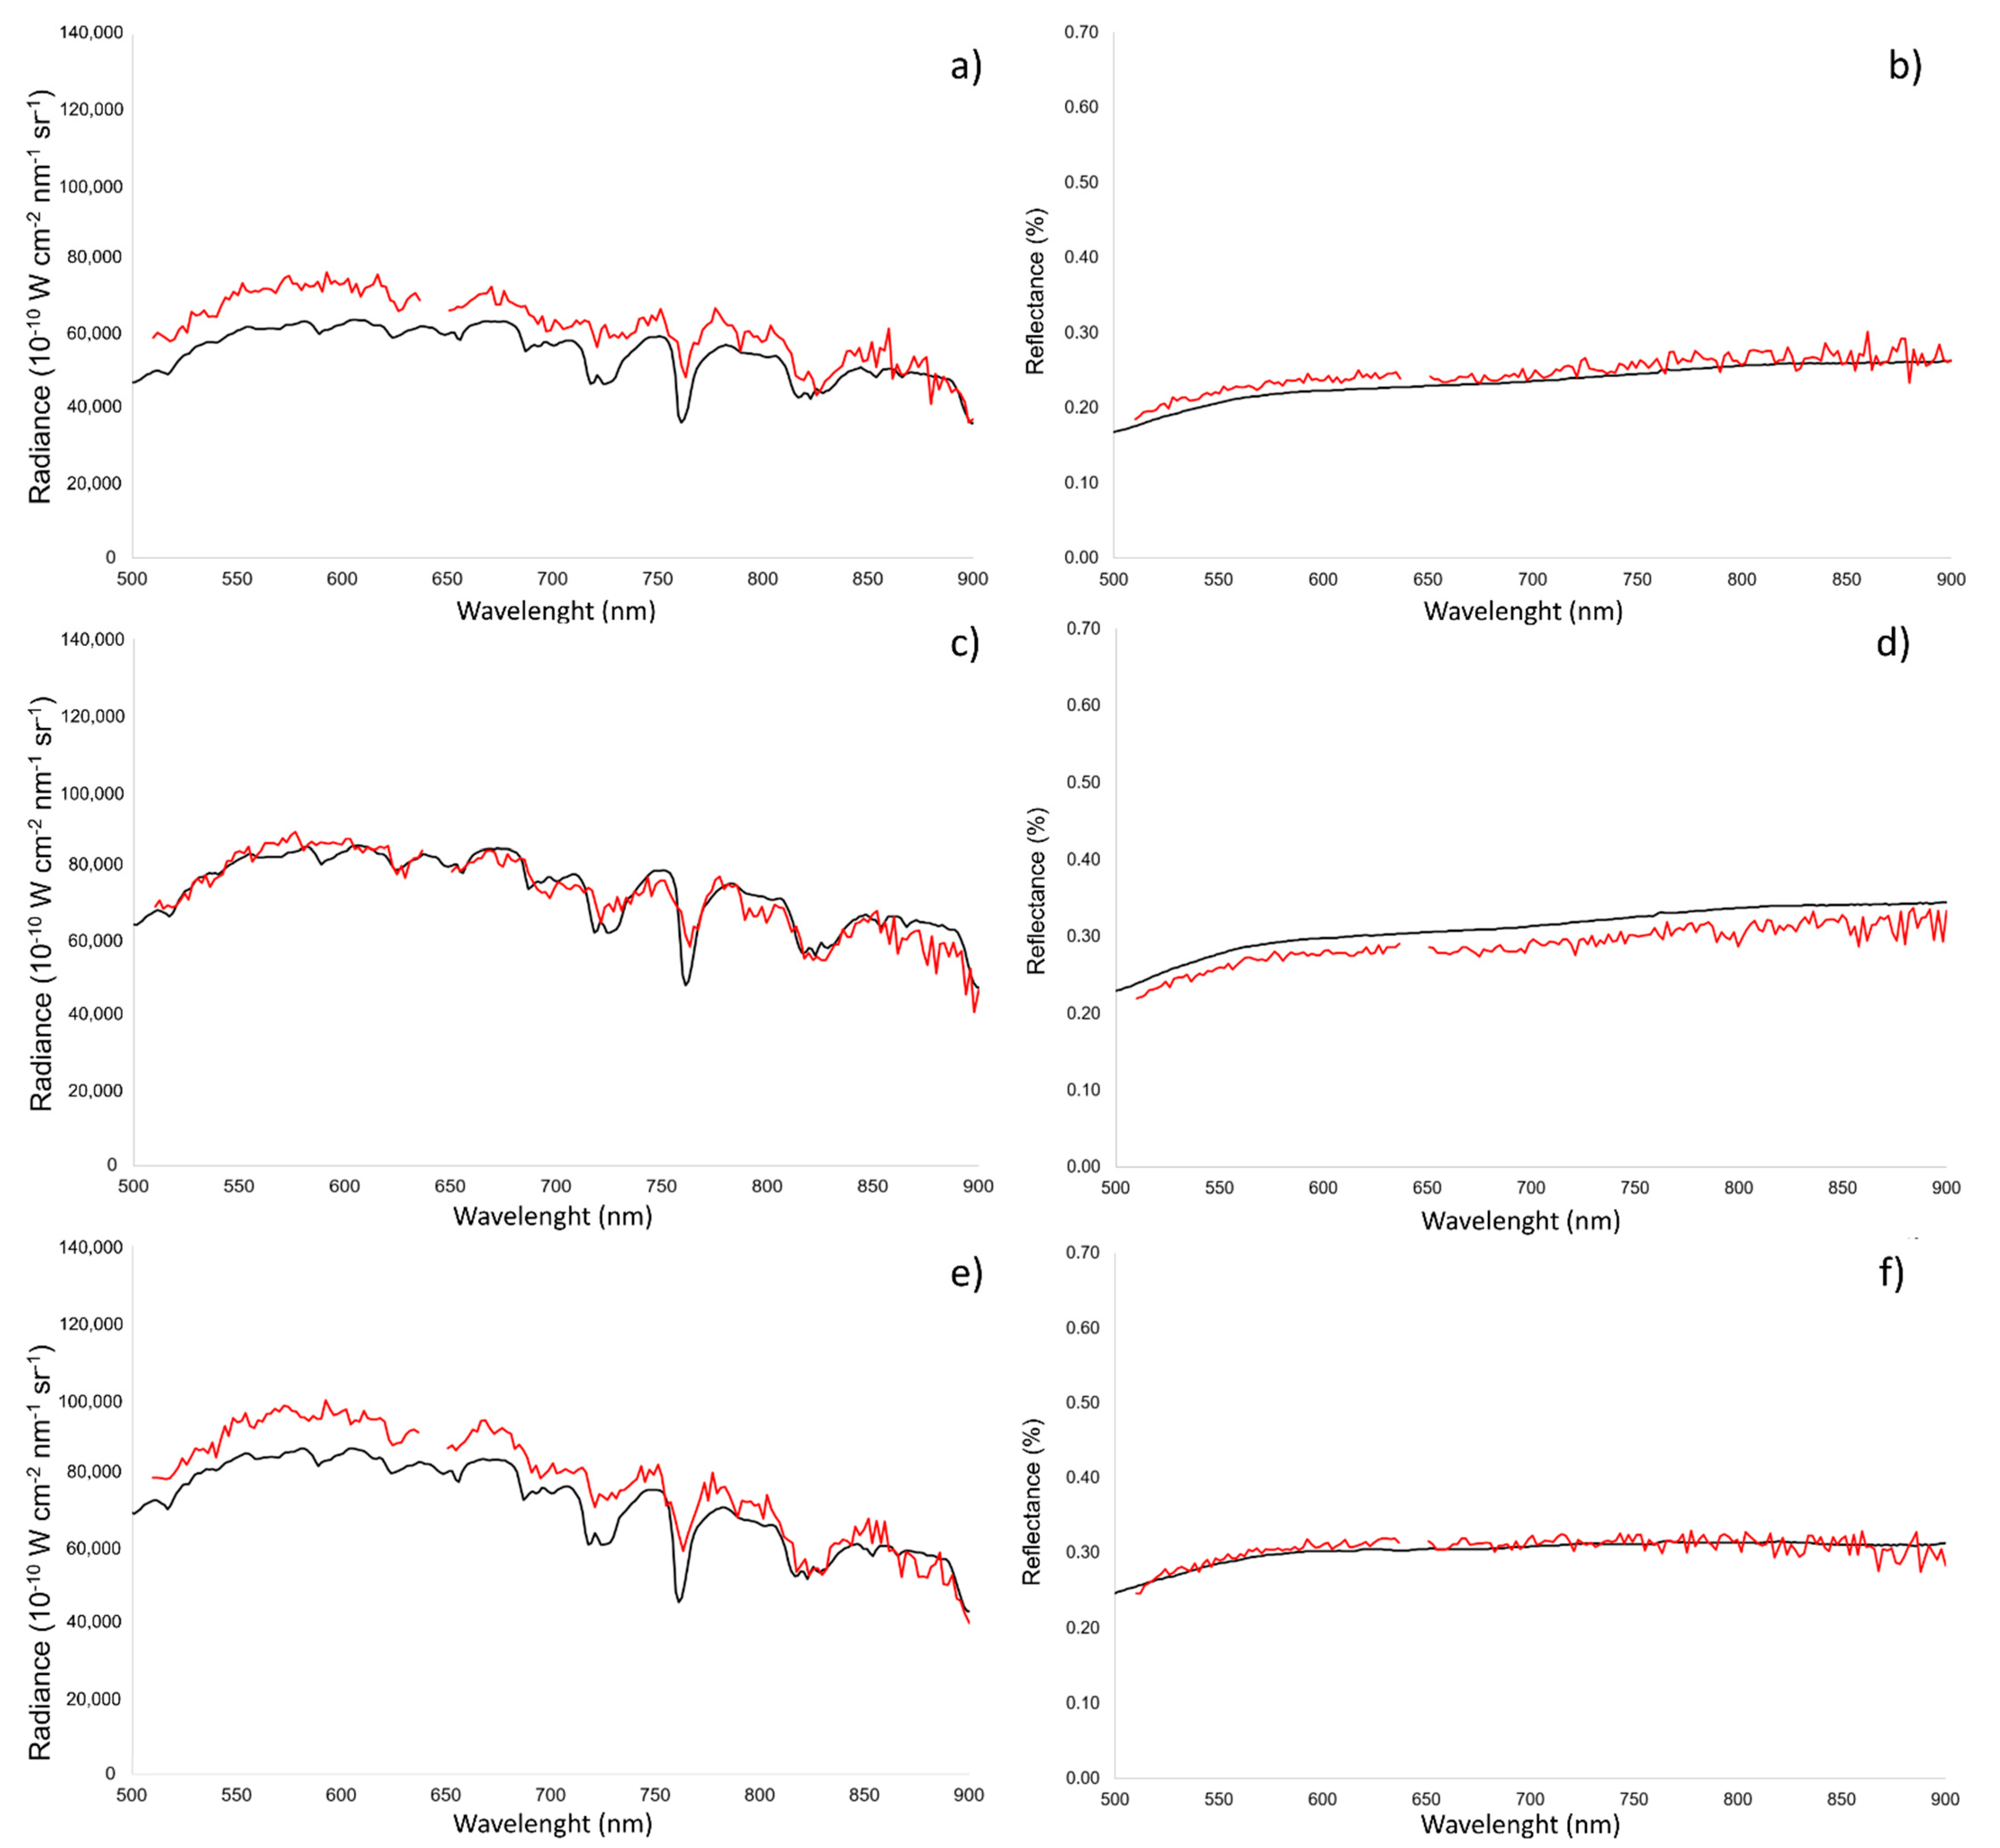
2.6. Hyperspectral Comparison

The first analysis conducted in this study was the evaluation of the accuracy of the spectral data provided by the images of the Senop HSC-2 camera acquired in flight at an altitude of 32 m. The spectral signatures of the reference panels and of the targets identified in the vineyard extracted with the ROIs from the hyperspectral mosaic were compared with the data acquired on the ground with the reference spectroradiometer. Spectral data in both radiance and reflectance were compared for each identified ROI. Then the performance of Senop HSC-2 camera was assessed in terms of coefficient of determination (R2) and root-mean-square error (RMSE), using as dataset the average radiance values for 10 nm interval in the 500–900 nm spectral range, to compare data acquired with GER 3700 which provided different spectral resolution.

2.7. Multispectral Comparison

Considering that the output of the multispectral camera are few discrete spectral values per pixel, the comparison between different sensors taken into account in this study, focused only on 4 spectral bands (green, red, red edge and nir). The blue band (468–496 nm) was not taken into consideration since it is out of the spectral range of the hyperspectral camera (500–900). The spectral bands for the hyperspectral data (Senop HSC-2 and GER 3700) were defined as the average of the spectral values measured within the spectral ranges of each band provided by the DJI P4M camera.
Considering the higher robustness of VIs respect to the use reflectance of individual bands in UAV based sensor comparison analyses, as reported by Olsson et al. [48], the comparison was evaluated by means of the calculation of 3 VIs, based on the normalized difference between the nir band and the other 3 bands provided by the multispectral camera (green, red and red edge), using both the reflectivity (M1 and M2) and reflectance (M3 and M4) values per pixel (Table 3). These VIs have shown good results for different purposes such as to estimate biophysical crop parameters and in vegetation detection [1,38,49]. The accuracy in VIs calculation using the dataset obtained from hyperspectral and multispectral camera with 6 different exposure settings acquisition was then evaluated by means of the percentage error (PE) (Equation (1)) with respect to the true value measured with the GER 3700 reference spectroradiometer.
percentage   error = | m e a s u r e m e n t t r u e   v a l u e | t r u e   v a l u e × 100

3. Results

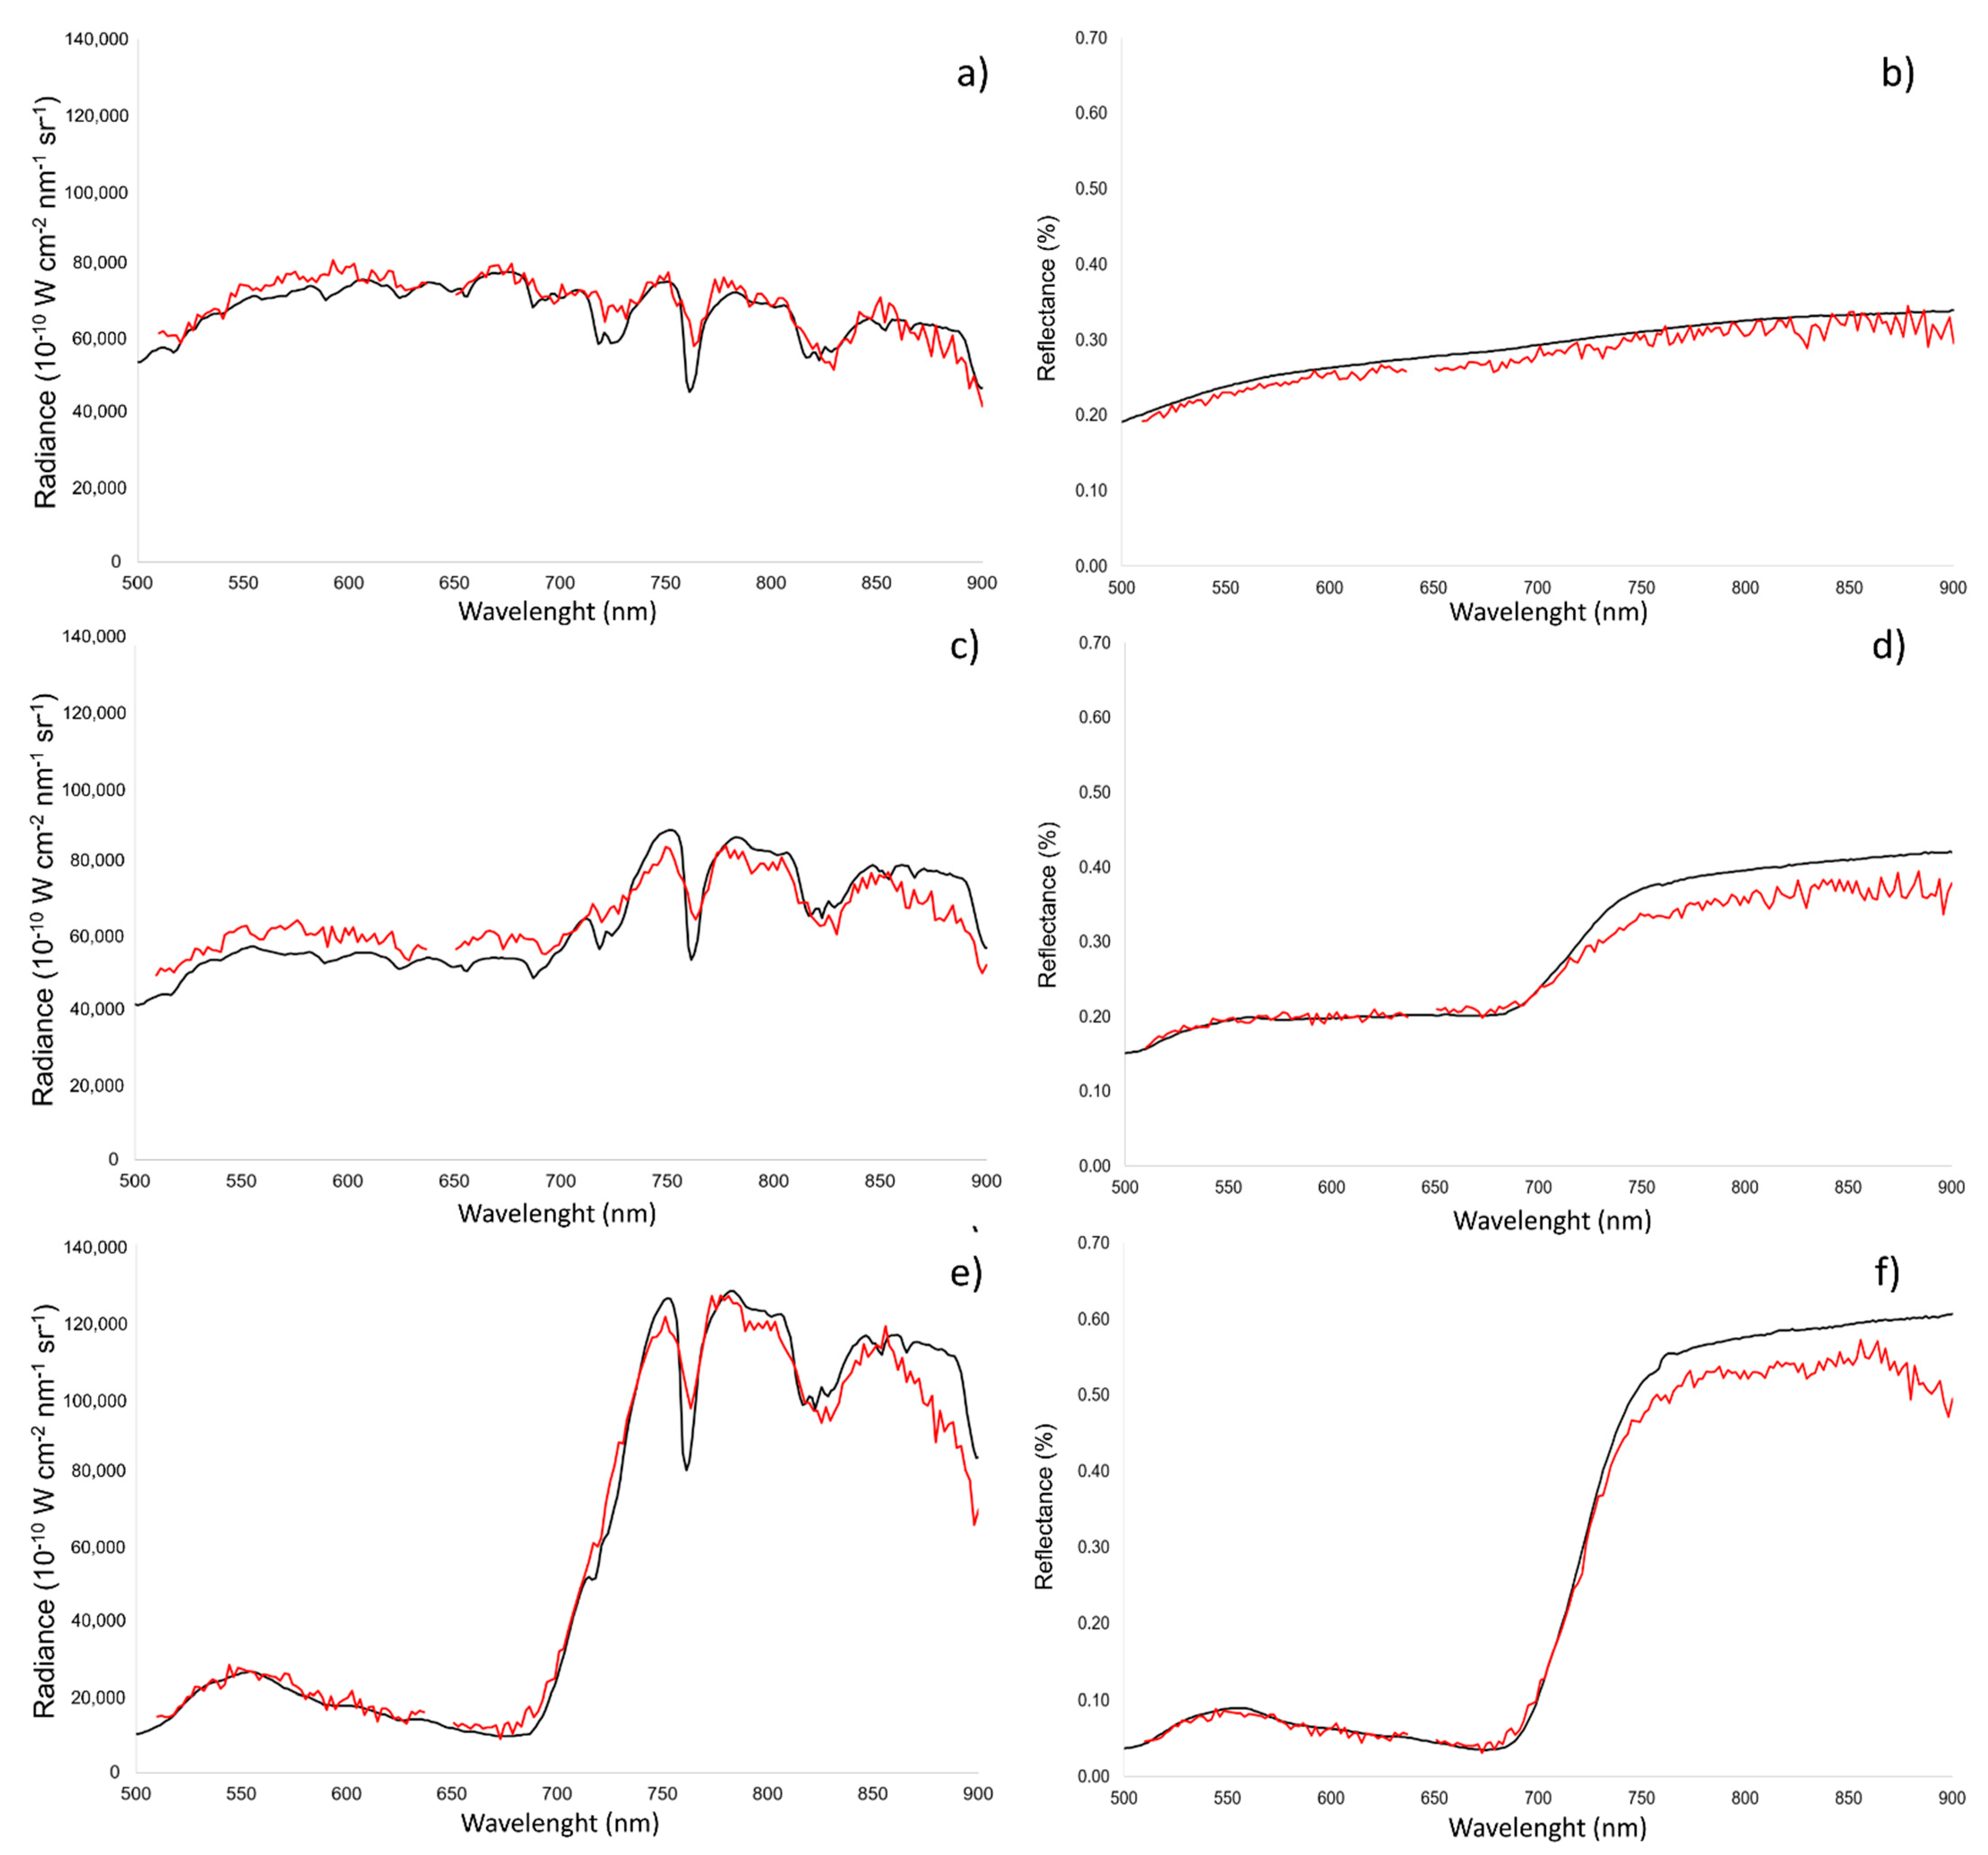
3.1. Hyperspectral Comparison

The first result presented in this paper aims at a comparison of the spectral signatures acquired in flight by the UAV equipped with the hyperspectral camera SENOP HSC-2 and the validation data acquired on the ground with the reference spectroradiometer GER 3700. Figure 5a,b show the spectral signatures in radiance extracted from the 3 OptoPolymer (black lines) and 5 Senop (red lines) reference panels measured respectively with the spectroradiometer and the hyperspectral camera.
Through a visual evaluation of the spectral signatures of the 8 panels presented in Figure 5 it can be observed that both the spectroradiometer (Figure 5a) and hyperspectral camera (Figure 5b) show the same trends, with a slight overestimation by the hyperspectral camera in the visible region (500–700 nm). The evaluation of the hyperspectral camera performance was then deepened by aggregating the spectral data of the GER 3700 and the SENOP HSC-2 by 10 nm clusters. The data acquired on the 3 OptoPolymer panels (Figure 5c) and on the 5 Senop panels (Figure 5d) were separately analysed, and both provided an excellent coefficient of determination (R2 = 0.99), also good results in terms of absolute values with an RMSE of 12,905.34 and 10,082.95 × 10−10 W/cm2/nm/sr for the OptoPolymer and Senop panels, respectively. Evaluation of the spectral data acquired in flight by the SENOP HSC-2 showed that it can provide data in line with the ground truth measurements obtained using the GER 3700. Regarding the absolute values in a full reflectance range provided by the 8 panels (0.02–0.97%), a slight overestimation is observed in the visible region with radiance values higher than 150,000 × 10−10 W/cm2/nm/sr.
Once the accuracy of the hyperspectral camera equipped on the UAV moving at 32 m flight quote had been assessed, the spectral signatures of the main targets that can commonly be found in a field were analysed in detail.
Figure 6 and Figure 7 show graphs in which the spectral signatures extracted from the hyperspectral mosaic are compared with the signatures acquired on the ground with a spectroradiometer both in radiance and in reflectance. Specifically, Figure 6 examines non-vegetated soil targets, i.e., bare soil (Figure 6a,b), mixed bare-stony soil (Figure 6c,d) and stony soil (Figure 6e,f); while Figure 7 presents the spectral signatures extracted from vegetated targets, represented by soil with dry grass (Figure 7a,b), soil with grass (Figure 7c,d) and canopy (Figure 7e,f).
Firstly, the visual analysis of the spectral signatures extracted from the different targets confirms the ability of the SENOP HSC-2 hyperspectral camera to provide the same spectral trend provided by the GER 3700, in line with what was previously observed by the comparison made on the reference panels. Taking into consideration the absolute values of radiance, a slight overestimation is observed in the visible region (500–700 nm approximately) on all the targets acquired on the ground (Figure 6). As for the signatures containing vegetation (Figure 7), the absolute values are much more in line with the data provided by the GER 3700, and on the canopy Figure 7e shows spectral signatures with highly overlapping values. Taking into consideration high values of radiance greater than 60,000 × 10−10 W/cm2/nm/sr in the nir region (wavelengths > 800nm), an underestimation was observed mainly on the vegetated targets, which is consequently also found in the reflectance values.

3.2. Multispectral Comparison

Table 4 shows the results of the evaluation of the accuracy of the hyperspectral SENOP HSC-2 and multispectral DJI P4M cameras through calculation of the vegetation indices commonly used in precision agriculture, based on the normalized difference between the nir band and the green (GNDVI), red (NDVI) and red edge (NDRE) bands. The results focus on the impact of different radiometric calibration approaches considered in the study both without (M1, M2) and with ELM based on reference panels (M3, M4), to assess the impact of this processing step on DJI P4M remote sensing. The results are reported in percentage error (PE) (%) with respect to the reference spectroradiometer of the spectral signatures extracted from the vegetated targets taken into consideration, specifically soil with dry grass, soil with green grass and canopy.
The HSC-2 camera showed optimal results with minimal error on GNDVI (PE = 2.7%) on low signal values (soil with dry grass), while slightly lower accuracy with NDVI and NDRE, PE = 13.6% and PE = 9.3% respectively (Table 4). The intermediate target provided low PE in the GNDVI (13.0%) and NDVI (9.2%), but highest accuracy in the NDRE (PE = 2.2%). Excellent results were found monitoring the pure canopy pixel target both for GNDVI and NDVI (PE = 1.0% and PE = 1.6% respectively), while still low errors with the NDRE (PE = 6.5%). Observing the overall performance of the HSC-2 camera, the results show errors on average equal to 6.7% distributed following a trend linked to vegetation cover and spectrum wavelength. In detail, discrete errors (PE = 9.2–13.6%) are highlighted in the absence (Figure 3f) or low presence (Figure 3g) of active vegetation cover, while on canopy target with full vegetation cover the HSC-2 provided results in line with GER 3700.

4. Discussion

The first result provided in this work compares spectral signatures collected in flight with a SENOP HSC-2 hyperspectral camera and on the ground using the GER 3700 reference spectroradiometer. ByFrom a visual analysis of the spectral signatures extracted both from the reference reflectance panels and the main targets that can commonly be found in a field showed comparable trends. The absolute values in full reflectance range (0.02–0.97%) (Figure 5c,d), showed a slight overestimation for the SENOP HSC-2 camera in the visible region with elevate radiance (over 150,000 × 10−10 W/cm2/nm/sr). However, if we evaluate the use of the camera for crop monitoring, this factor is of minimal influence given that the vegetation radiance of the visible region is much lower. Moreover, the spectral signatures collected from the 2 types of reference panels (Figure 5c,d) provide aligned results, thus adding further robustness to this spectral comparison.
Regarding the ground targets, the full vegetated target (Figure 7e,d) presented spectral signature more in line with data provided by the GER 3700, with highly overlapping values in the visible region (500–700 nm). The underestimation observed in the nir region (>800 nm) is also perceptible in the signatures acquired on the reference panels in Figure 5b, it could therefore be due to a different sensitivity of the SENOP HSC-2 camera in the final part of the spectral operating range. Regarding this issue, other authors [47,52,53] report some discrepancy between ground truth measurements performed with spectroradiometer and remote data acquired in flight, which could suggest that higher distance between target and sensor could affect data quality. Moreover, Stow et al. [52] found a higher impact in the red edge and nir bands respect to green and red. Our slight differences in few spectral signatures behaviour (Figure 6 and Figure 7), can be justified by the fact of being measured with completely different sensors, probably with different sensitivity along the monitored spectrum (500–900 nm), based on opposite acquisition approach (proximal vs. remote, static vs. dynamic), potentially amplified by field condition respect to controlled laboratory studies. A key factor is the monitored surface, in fact while the UAV data was extracted with a square polygon covering the full target surface, the monitored surface within the circular FOV of optical fibre of the spectroradiometer is different and not easily verifiable in field conditions. In this case, slight variations in angle with respect to the axis of the fibre can lead to alterations of the monitored surface. This becomes particularly important in the case of mixed targets with a higher heterogeneity.
About the comparison in terms of accuracy (PE) of the hyperspectral SENOP HSC-2 and multispectral DJI P4M cameras by means the calculation of some Vis (Table 4), the hyperspectral camera generally provided mainly good results in the calculation of the VIs with respect to the ground truth data provided by the GER 3700. Nevertheless, there are some cases with a PE up to about 13.0%, probably due to poor quality signal or presence of noise in some of the regions considered. These behaviours can be explained by examining the spectral signatures of the targets shown in Figure 7. In detail, high noise can be observed in the red and red edge region considered in the study for soil with dry grass target (Figure 7a,b), while in the partially vegetated target (Figure 3g) higher noise can be observed in the green and red bands used. The most plausible explanation could be due to overlap error between the surface monitored with the circular FOV of the GER 3700 fibre and the ROI sampled within the hyperspectral images. Even a minimal overlap error leads to a strong impact in the case of heterogeneous target conditions such as the targets in the absence or partial presence of active vegetation (Figure 3f,g), with bare soil, stones, dry and green grass.
Regarding the P4M camera, all the indices calculated using M1 and M2 generally provided lower performance, up to 100% error in all VIs for all P4M camera setups with soil with dry grass target, and in the soil with grass target using the green based VI. This behaviour highlights the presence of a background noise which is not corrected by the sun sensor (M1 and M2) without a correction based on reference panels (M3 and M4). Therefore, at lower signal values (soil with dry grass), that noise is more effective resulting in high error on data quality. The results show that this noise decreases progressively with the growth of the incoming signal, a consequence of the increase of the vegetated surface in the target (soil with grass). Considering the results of the 3 VIs examined on this intermediate target, it can be observed that this noise is greater in the first part of the spectrum (green) and decreases at higher wavelengths. In fact, lower errors are observed in the red, with excellent results in the red edge channel. This trend in error distribution along the spectrum, is also found on the pure canopy target. High errors were observed on average equal to 38% on the GNDVI index, the NDVI gave lower errors (about 20%), while those methods provided the most accurate values of the overall dataset with the NDRE index. Overall, the two reflectivity-based methods without any calibration step provided similar performance when used as input for the calculation of Vis. This confirms that the Terra DJI software v. 2.0 is not providing any improvement to the DN values extracted using the software v. 1.0.
Improved accuracy was generally provided by the VIs calculated using the two reflectance-based methods obtained applying an ELM on each band based on the reference panels to the DN values from DJI Terra software v. 1.0 (M3) and through the calibration tool available in DJI Terra software v. 2.0 (M4). Both methods gave lower PE on the canopy target and higher on the soil with grass, while the VIs calculated on soil with dry grass showed intermediate values. All VIs calculated using M3 and M4 dataset provided low PE, on average less than 20%, however considering only the canopy target, the NDRE index showed a slightly lower accuracy.
In general, as expected the VIs calculated using the reflectivity values as inputs (M1 and M2) are much less accurate than the indices calculated with reflectance values (M3 and M4). A single exception was identified on the canopy, where the NDRE index calculated with reflectivity data shows 5–10% error lower than using reflectance data. The reason why the red edge values show this trend appears to be a consequence of the normalization effect of the radiometric calibration, but it is unclear and requires further investigation.
The accuracy of the VIs calculated with P4M camera on pure canopy target is in line with findings of Mamaghani et al. [53], where a deep evaluation of the factory radiometric calibration of a Micasense RedEdge camera was assessed. Considering the MicaSense provided method to convert digital counts to radiance images, the red edge band showed the highest error in radiance respect to red band, while the lowest error was identified on the green band. Those errors were propagated in reflectance, and the Micasense RedEdge camera provided on vegetated target lower accuracy with the NDRE respect to NDVI. Overall, [53] demonstrated the importance of the radiometric calibration step and showed how any error can affect spectral accuracy in both the radiance and reflectance domain.
Olsson et al. [48] highlight another factor that could affect spectral data quality, represented by the irradiance sensor. They asses that since the sensor does not have a cosine corrector, the data are influenced by sensor orientation and motions of the UAV, which causes noise especially with multirotor respect to fixed wing platforms.
Recent works [48,52,54] report that the accuracy of normalized VIs is higher than the accuracy of reflectance of the single bands, due to a more robustness against variable light conditions. Those behaviour was identified also by Franzini et al. [55] with Parrot Sequoia camera, finding significant differences among single reflectance maps and VI maps. In detail, computing RMSE to evaluate differences between images in overlapping areas, authors reported highest values for the nir (0.06 < RMSE < 0.12), intermediate values for the red edge (0.02 < RMSE < 0.05), and lowest values for the green (0.04 < RMSE < 0.06) and red (0.01 < RMSE < 0.03). A similar behaviour was then evident for the VIs, where the differences calculated on NDVI reveals the lowest RMSE values (0.02 < RMSE < 0.04), while higher values for GNDVI (0.03 < RMSE < 0.07) and NDRE (0.04 < RMSE < 0.09).
Considering the results provided by the 4 methods, we can confirm the importance to use a set of reference panels that encompass most of the reflectance ranges: in this way the quality of the data is ensured thanks to a correction for the entire spectrum of the signal detectable during a UAV monitoring, from low (soil with dry grass) to high signals (pure canopy). Our findings are in line with other works, such as the results presented by Poncet et al. [29] on the performance evaluation of five radiometric calibration methods using a Parrot Sequoia camera. The results showed that combination of the irradiance sensor self-calibration with an ELM further improved data accuracy achieved in all multispectral bands than just using the irradiance sensor. Opposite results were identified by Cao et al. [36] evaluating different radiometric correction methods using the hyperspectral camera Mjolnir-1240 (Hyspex Neo, Oslo, Norway), where the correction based on the irradiance sensor provided higher accuracy in average spectral absolute error (ASAE = ±2.5%), with respect to ELM (ASAE = ±7.0%). Those results could lead to the consideration that different irradiance sensors could provide different results in terms of spectral data correction to different light conditions.
No marked difference was identified between the performance of the VIs calculated by applying different exposure settings of the multispectral camera, especially on the target of greatest interest represented by the canopy. A lower accuracy in the characterization of the soil spectral response could be acceptable, given that one of the main strengths of the use of UAVs is the extremely high resolution which enable the application of filtering techniques to perform pure canopy pixel analysis [5,12,14,15,56,57]. The results therefore show that different exposure settings provide comparable results to those obtained with auto exposure time setup (AUTO_0), in which, thanks to the sun sensor, the multispectral camera can normalize the spectral data according to the light variations that may occur during the flight activities. This demonstrates the high efficiency of the system, which makes it possible to greatly simplify flight planning and sensor setup, by setting in automatic exposure mode and thus limiting over- or under-exposure issues.
By evaluating the potential of the hyperspectral camera compared to the multispectral one, using broadband indices such as the widely used indices examined (GNDVI, NDVI, NDRE), a higher performance was obtained by the former. However, the true potential of the hyperspectral camera is not exploited using these indices, especially on pure canopy pixels target. In fact, it becomes possible to obtain good results even with a multispectral camera applying common filtering techniques on the vineyard orthomosaic for rows extraction. Regarding the mere application of traditional broadband VIs in viticulture, our findings cannot justify the purchase of a hyperspectral camera (40,000.00$) over a multispectral one (lower than 11,000.00$) such as DJI P4M, which represents a good compromise in terms of accuracy and cost. At the same time, the main limit of widely diffused multispectral cameras is the exclusion of use of narrowband indices identified in the literature [3], or the exploration of new ones, since this research area is still poorly explored given the recent advances in UAV based hyperspectral imaging solutions at more affordable prices for researchers. Moreover, the spectral characterization of specific plant traits such as water stress conditions, pigments concentration, identification of leaf alterations linked to deficiencies of micro or macro elements or to disease symptoms and qualitative analysis of the fruits, can only be processed with a hyperspectral technology.

5. Conclusions

This paper proposes a comparison study in field conditions of two different UAV based spectral imaging sensors by examining the main targets that can be commonly found in vineyard monitoring. Specifically, the accuracy of SENOP HSC-2 hyperspectral and DJI P4M multispectral cameras is compared using traditional broadband VIs respect to ground truth measurements performed using a GER 3700 reference spectroradiometer, for the characterization of homogeneous or mixed ground targets of soil, grass and canopy. Considering the large community of UAV users frequently with low expertise in spectral sensors and the critical issue represented by radiometric calibration, in this study we wanted to analyse in detail different types of camera exposure settings and 4 methods of radiometric calibration of the multispectral images.
A first step assessed the optimal performance of the SENOP HSC-2 in spectral characterization of homogeneous Lambertian reference panels used in this study with respect to GER 3700. Next, the accuracy was described of the hyperspectral camera in the spectral signature analysis of the main targets commonly present in vineyards. Moving to camera comparison, a thorough analysis was presented of spectral performance of both cameras on main targets. In general, the VIs calculated on more homogeneous targets, such as soil with dry grass and canopy conditions, are the most accurate, while those extracted from the target with highest heterogeneity in terms of spatial ratio between soil and green grass show worst accuracy. Probably, an incomplete overlapping of the ground area acquired by the circular FOV of the GER 3700, compared to the polygon extraction done on the UAV images, could explain why lowest accuracy is found on the more heterogeneous target represented by soil with grass in which bare soil, stones and green grass are present at the same time.
Considering the multispectral camera, results demonstrated the importance of radiometric calibration especially in mixed conditions (soil and vegetation), and highest accuracy was obtained using both sun sensor equipped on the P4M and an ELM based on a set of reference panels acquired at time of flight. No marked difference was identified between the performance of different P4M exposure settings, especially with respect to manual or auto setup. These results confirm a high efficiency of the DJI system, which allows good accuracy also in auto-mode exposure, making the use of P4M also possible by users with little optical knowledge.
In conclusion, the choice of the best camera depends on the objective of each monitoring activity and on the VIs to be calculated. Applying filtering techniques multispectral cameras are an excellent solution for vineyard monitoring, however radiometric correction is fundamental. Furthermore, it emerged that the P4M camera also performed well with the auto setup compared to the wide possibility of manually setting exposure parameters. This confirms an excellent technological level achieved by DJI with this product, making this type of multispectral solution extremely user-friendly and ready-to-use even for users with limited expertise.

Author Contributions

Conceptualization, A.M., S.F.D.G.; Methodology, A.M., S.F.D.G., A.B., P.T.; Formal analysis, A.M., S.F.D.G.; Data curation, A.B., P.T.; Writing, review and editing, S.P., M.G., A.M., S.F.D.G., P.T.; Supervision, A.M., P.T., S.F.D.G., S.P. All authors have read and agreed to the published version of the manuscript.

Funding

This research received no external funding.

Institutional Review Board Statement

Not applicable.

Informed Consent Statement

Not applicable.

Data Availability Statement

The data presented in this study are available from the corresponding author upon reasonable request.

Acknowledgments

The authors gratefully acknowledge Castello di Fonterutoli owned by Marchesi Mazzei Spa Agricola for having hosted the experimental activities.

Conflicts of Interest

The authors declare no conflict of interest.

References

  1. Giovos, R.; Tassopoulos, D.; Kalivas, D.; Lougkos, N.; Priovolou, A. Remote Sensing Vegetation Indices in Viticulture: A Critical Review. Agriculture 2021, 11, 457. [Google Scholar] [CrossRef]
  2. Tardaguila, J.; Stoll, M.; Gutiérrez, S.; Proffitt, T.; Diago, M.P. Smart applications and digital technologies in viticulture: A review. Smart Agric. Technol. 2021, 1, 100005. [Google Scholar] [CrossRef]
  3. Matese, A.; Berton, A.; Di Gennaro, S.F.; Gatti, M.; Squeri, C.; Poni, S. Testing performance of UAV-based hyperspectral imagery in viticulture. In Proceedings of the Precision Agriculture ’21; Wageningen Academic Publishers: Wageningen, The Netherlands; Budapest, Hungary, 2021; pp. 509–516. [Google Scholar]
  4. Reynolds, A.G.; Vanden Heuvel, J.E. Influence of Grapevine Training Systems on Vine Growth and Fruit Composition: A Review. Am. J. Enol. Vitic. 2009, 60, 251–268. [Google Scholar]
  5. Di Gennaro, S.F.; Matese, A. Evaluation of novel precision viticulture tool for canopy biomass estimation and missing plant detection based on 2.5D and 3D approaches using RGB images acquired by UAV platform. Plant Methods 2020, 16, 91. [Google Scholar] [CrossRef]
  6. Di Gennaro, S.F.; Dainelli, R.; Palliotti, A.; Toscano, P.; Matese, A. Sentinel-2 Validation for Spatial Variability Assessment in Overhead Trellis System Viticulture Versus UAV and Agronomic Data. Remote Sens. 2019, 11, 2573. [Google Scholar] [CrossRef] [Green Version]
  7. Sozzi, M.; Kayad, A.; Marinello, F.; Taylor, J.; Tisseyre, B. Comparing vineyard imagery acquired from Sentinel-2 and Unmanned Aerial Vehicle (UAV) platform. OENO One 2020, 54, 189–197. [Google Scholar] [CrossRef] [Green Version]
  8. Romboli, Y.; Di Gennaro, S.F.; Mangani, S.; Buscioni, G.; Matese, A.; Genesio, L.; Vincenzini, M. Vine vigour modulates bunch microclimate and affects the composition of grape and wine flavonoids: An unmanned aerial vehicle approach in a Sangiovese vineyard in Tuscany. Aust. J. Grape Wine Res. 2017, 23, 368–377. [Google Scholar] [CrossRef]
  9. Matese, A.; Di Gennaro, S.F. Practical applications of a multisensor UAV platform based on multispectral, thermal and RGB high resolution images in precision viticulture. Agriculture 2018, 8, 116. [Google Scholar] [CrossRef] [Green Version]
  10. Bendel, N.; Backhaus, A.; Kicherer, A.; Köckerling, J.; Maixner, M.; Jarausch, B.; Biancu, S.; Klück, H.-C.; Seiffert, U.; Voegele, R.T.; et al. Detection of Two Different Grapevine Yellows in Vitis vinifera Using Hyperspectral Imaging. Remote Sens. 2020, 12, 4151. [Google Scholar] [CrossRef]
  11. Sassu, A.; Gambella, F.; Ghiani, L.; Mercenaro, L.; Caria, M.; Pazzona, A.L. Advances in Unmanned Aerial System Remote Sensing for Precision Viticulture. Sensors 2021, 21, 956. [Google Scholar] [CrossRef] [PubMed]
  12. Pádua, L.; Marques, P.; Hruška, J.; Adão, T.; Bessa, J.; Sousa, A.; Peres, E.; Morais, R.; Sousa, J.J. Vineyard properties extraction combining UAS-based RGB imagery with elevation data. Int. J. Remote Sens. 2018, 39, 5377–5401. [Google Scholar] [CrossRef]
  13. Pádua, L.; Marques, P.; Adão, T.; Guimarães, N.; Sousa, A.; Peres, E.; Sousa, J.J. Vineyard Variability Analysis through UAV-Based Vigour Maps to Assess Climate Change Impacts. Agronomy 2019, 9, 581. [Google Scholar] [CrossRef] [Green Version]
  14. Matese, A.; Di Gennaro, S.F.; Santesteban, L.G. Methods to compare the spatial variability of UAV-based spectral and geometric information with ground autocorrelated data. A case of study for precision viticulture. Comput. Electron. Agric. 2019, 162, 931–940. [Google Scholar] [CrossRef]
  15. Cinat, P.; Di Gennaro, S.F.; Berton, A.; Matese, A. Comparison of unsupervised algorithms for Vineyard Canopy segmentation from UAV multispectral images. Remote Sens. 2019, 11, 1023. [Google Scholar] [CrossRef] [Green Version]
  16. Matese, A.; Di Gennaro, S.F. Technology in precision viticulture: A state of the art review. Int. J. Wine Res. 2015, 7, 69–81. [Google Scholar] [CrossRef] [Green Version]
  17. Aasen, H.; Honkavaara, E.; Lucieer, A.; Zarco-Tejada, P.J. Quantitative remote sensing at ultra-high resolution with UAV spectroscopy: A review of sensor technology, measurement procedures, and data correctionworkflows. Remote Sens. 2018, 10, 1091. [Google Scholar] [CrossRef] [Green Version]
  18. Ammoniaci, M.; Kartsiotis, S.-P.; Perria, R.; Storchi, P. State of the Art of Monitoring Technologies and Data Processing for Precision Viticulture. Agriculture 2021, 11, 201. [Google Scholar] [CrossRef]
  19. Assmann, J.J.; Kerby, J.T.; Cunliffe, A.M.; Myers-Smith, I.H. Vegetation monitoring using multispectral sensors—Best practices and lessons learned from high latitudes. J. Unmanned Veh. Syst. 2019, 7, 54–75. [Google Scholar] [CrossRef] [Green Version]
  20. Primicerio, J.; Di Gennaro, S.F.; Fiorillo, E.; Genesio, L.; Lugato, E.; Matese, A.; Vaccari, F.P. A flexible unmanned aerial vehicle for precision agriculture. Precis. Agric. 2012, 13, 517–523. [Google Scholar] [CrossRef]
  21. Bendig, J.; Bolten, A.; Bareth, G. Introducing a low-cost mini-uav for thermal- and multispectral-imaging. Int. Arch. Photogramm. Remote Sens. Spat. Inf. Sci. 2012, 39, 345–349. [Google Scholar] [CrossRef] [Green Version]
  22. Suárez, L.; Zarco-Tejada, P.J.; Sepulcre-Cantó, G.; Pérez-Priego, O.; Miller, J.R.; Jiménez-Muñoz, J.C.; Sobrino, J. Assessing canopy PRI for water stress detection with diurnal airborne imagery. Remote Sens. Environ. 2008, 112, 560–575. [Google Scholar] [CrossRef]
  23. Fawcett, D.; Panigada, C.; Tagliabue, G.; Boschetti, M.; Celesti, M.; Evdokimov, A.; Biriukova, K.; Colombo, R.; Miglietta, F.; Rascher, U.; et al. Multi-Scale Evaluation of Drone-Based Multispectral Surface Reflectance and Vegetation Indices in Operational Conditions. Remote Sens. 2020, 12, 514. [Google Scholar] [CrossRef] [Green Version]
  24. Maes, W.H.; Steppe, K. Perspectives for Remote Sensing with Unmanned Aerial Vehicles in Precision Agriculture. Trends Plant Sci. 2019, 24, 152–164. [Google Scholar] [CrossRef] [PubMed]
  25. Shu, M.; Shen, M.; Zuo, J.; Yin, P.; Wang, M.; Xie, Z.; Tang, J.; Wang, R.; Li, B.; Yang, X.; et al. The Application of UAV-Based Hyperspectral Imaging to Estimate Crop Traits in Maize Inbred Lines. Plant Phenomics 2021, 2021, 9890745. [Google Scholar] [CrossRef] [PubMed]
  26. Yan, Y.; Deng, L.; Liu, X.; Zhu, L. Application of UAV-Based Multi-angle Hyperspectral Remote Sensing in Fine Vegetation Classification. Remote Sens. 2019, 11, 2753. [Google Scholar] [CrossRef] [Green Version]
  27. Honkavaara, E.; Rosnell, T.; Oliveira, R.; Tommaselli, A. Band registration of tuneable frame format hyperspectral UAV imagers in complex scenes. ISPRS J. Photogramm. Remote Sens. 2017, 134, 96–109. [Google Scholar] [CrossRef]
  28. Gauci, A.A.; Brodbeck, C.J.; Poncet, A.M.; Knappenberger, T. Assessing the Geospatial Accuracy of Aerial Imagery Collected with Various UAS Platforms. Trans. ASABE 2018, 61, 1823–1829. [Google Scholar] [CrossRef]
  29. Poncet, A.M.; Knappenberger, T.; Brodbeck, C.; Fogle, M.; Shaw, J.N.; Ortiz, B.V. Multispectral UAS Data Accuracy for Different Radiometric Calibration Methods. Remote Sens. 2019, 11, 1917. [Google Scholar] [CrossRef] [Green Version]
  30. Herrero-Huerta, M.; Hernández-López, D.; Rodriguez-Gonzalvez, P.; González-Aguilera, D.; González-Piqueras, J. Vicarious radiometric calibration of a multispectral sensor from an aerial trike applied to precision agriculture. Comput. Electron. Agric. 2014, 108, 28–38. [Google Scholar] [CrossRef]
  31. Iqbal, F.; Lucieer, A.; Barry, K. Simplified radiometric calibration for UAS-mounted multispectral sensor. Eur. J. Remote Sens. 2018, 51, 301–313. [Google Scholar] [CrossRef]
  32. Matese, A.; Di Gennaro, S.F. Beyond the traditional NDVI index as a key factor to mainstream the use of UAV in precision viticulture. Sci. Rep. 2021, 11, 2721. [Google Scholar] [CrossRef] [PubMed]
  33. Wang, C.; Myint, S.W. A Simplified Empirical Line Method of Radiometric Calibration for Small Unmanned Aircraft Systems-Based Remote Sensing. IEEE J. Sel. Top. Appl. Earth Obs. Remote Sens. 2015, 8, 1876–1885. [Google Scholar] [CrossRef]
  34. Liu, T.; Abd-Elrahman, A.; Morton, J.; Wilhelm, V.L. Comparing fully convolutional networks, random forest, support vector machine, and patch-based deep convolutional neural networks for object-based wetland mapping using images from small unmanned aircraft system. GISci. Remote Sens. 2018, 55, 243–264. [Google Scholar] [CrossRef]
  35. Deng, L.; Mao, Z.; Li, X.; Hu, Z.; Duan, F.; Yan, Y. UAV-based multispectral remote sensing for precision agriculture: A comparison between different cameras. ISPRS J. Photogramm. Remote Sens. 2018, 146, 124–136. [Google Scholar] [CrossRef]
  36. Cao, H.; Gu, X.; Wei, X.; Yu, T.; Zhang, H. Lookup Table Approach for Radiometric Calibration of Miniaturized Multispectral Camera Mounted on an Unmanned Aerial Vehicle. Remote Sens. 2020, 12, 4012. [Google Scholar] [CrossRef]
  37. Fraser, B.T.; Congalton, R.G. Issues in Unmanned Aerial Systems (UAS) Data Collection of Complex Forest Environments. Remote Sens. 2018, 10, 908. [Google Scholar] [CrossRef] [Green Version]
  38. Lu, H.; Fan, T.; Ghimire, P.; Deng, L. Experimental Evaluation and Consistency Comparison of UAV Multispectral Minisensors. Remote Sens. 2020, 12, 2542. [Google Scholar] [CrossRef]
  39. Hollberg, J.L.; Schellberg, J. Distinguishing Intensity Levels of Grassland Fertilization Using Vegetation Indices. Remote Sens. 2017, 9, 81. [Google Scholar] [CrossRef] [Green Version]
  40. Lussem, U.; Bolten, A.; Menne, J.; Gnyp, M.L.; Schellberg, J.; Bareth, G. Estimating biomass in temperate grassland with high resolution canopy surface models from UAV-based RGB images and vegetation indices. J. Appl. Remote Sens. 2019, 13, 1–26. [Google Scholar] [CrossRef]
  41. Jenal, A.; Hüging, H.; Ahrends, H.E.; Bolten, A.; Bongartz, J.; Bareth, G. Investigating the Potential of a Newly Developed UAV-Mounted VNIR/SWIR Imaging System for Monitoring Crop Traits—A Case Study for Winter Wheat. Remote Sens. 2021, 13, 1697. [Google Scholar] [CrossRef]
  42. von Bueren, S.K.; Burkart, A.; Hueni, A.; Rascher, U.; Tuohy, M.P.; Yule, I.J. Deploying four optical UAV-based sensors over grassland: Challenges and limitations. Biogeosciences 2015, 12, 163–175. [Google Scholar] [CrossRef] [Green Version]
  43. Bareth, G.; Aasen, H.; Bendig, J.; Gnyp, M.L.; Bolten, A.; Jung, A.; Michels, R.; Soukkamäki, J. Low-weight and UAV-based hyperspectral full-frame cameras for monitoring crops: Spectral comparison with portable spectroradiometer measurements. Photogramm. Fernerkund. Geoinf. 2015, 2015, 69–79. [Google Scholar] [CrossRef]
  44. Nebiker, S.; Lack, N.; Abächerli, M.; Läderach, S. Light-weight multispectral uav sensors and their capabilities for predicting grain yield and detecting plant diseases. Int. Arch. Photogramm. Remote Sens. Spat. Inf. Sci. 2016, 41, 963–970. [Google Scholar] [CrossRef] [Green Version]
  45. Crucil, G.; Castaldi, F.; Aldana-Jague, E.; van Wesemael, B.; Macdonald, A.; Van Oost, K. Assessing the Performance of UAS-Compatible Multispectral and Hyperspectral Sensors for Soil Organic Carbon Prediction. Sustainability 2019, 11, 1889. [Google Scholar] [CrossRef] [Green Version]
  46. Tommaselli, A.M.G.; Santos, L.D.; Berveglieri, A.; Oliveira, R.A.; Honkavaara, E. A study on the variations of inner orientation parameters of a hyperspectral frame camera. Int. Arch. Photogramm. Remote Sens. Spat. Inf. Sci. 2018, XLII–1, 429–436. [Google Scholar] [CrossRef] [Green Version]
  47. Blackburn, G.A. Hyperspectral remote sensing of plant pigments. J. Exp. Bot. 2007, 58, 855–867. [Google Scholar] [CrossRef] [PubMed] [Green Version]
  48. Olsson, P.O.; Vivekar, A.; Adler, K.; Garcia Millan, V.E.; Koc, A.; Alamrani, M.; Eklundh, L. Radiometric correction of multispectral uas images: Evaluating the accuracy of the parrot sequoia camera and sunshine sensor. Remote Sens. 2021, 13, 577. [Google Scholar] [CrossRef]
  49. Rouse, J.W.; Haas, R.H.; Schell, J.A.; Deering, D.W. Monitoring vegetation systems in the Great Plains with ERTS. NASA Spec. Publ. 1974, 351, 309. [Google Scholar]
  50. Gitelson, A.A.; Kaufman, Y.J.; Merzlyak, M.N. Use of a green channel in remote sensing of global vegetation from EOS-MODIS. Remote Sens. Environ. 1996, 58, 289–298. [Google Scholar] [CrossRef]
  51. Gitelson, A.; Merzlyak, M.N. Quantitative estimation of chlorophyll-a using reflectance spectra: Experiments with autumn chestnut and maple leaves. J. Photochem. Photobiol. B Biol. 1994, 22, 247–252. [Google Scholar] [CrossRef]
  52. Stow, D.; Nichol, C.J.; Wade, T.; Assmann, J.J.; Simpson, G.; Helfter, C. Illumination geometry and flying height influence surface reflectance and ndvi derived from multispectral UAS imagery. Drones 2019, 3, 55. [Google Scholar] [CrossRef] [Green Version]
  53. Mamaghani, B.; Salvaggio, C. Multispectral sensor calibration and characterization for sUAS remote sensing. Sensors 2019, 19, 4453. [Google Scholar] [CrossRef] [Green Version]
  54. Guo, Y.; Senthilnath, J.; Wu, W.; Zhang, X.; Zeng, Z.; Huang, H. Radiometric calibration for multispectral camera of different imaging conditions mounted on a UAV platform. Sustainability 2019, 11, 978. [Google Scholar] [CrossRef] [Green Version]
  55. Franzini, M.; Ronchetti, G.; Sona, G.; Casella, V. Geometric and radiometric consistency of parrot sequoia multispectral imagery for precision agriculture applications. Appl. Sci. 2019, 9, 5314. [Google Scholar] [CrossRef] [Green Version]
  56. Primicerio, J.; Gay, P.; Aimonino, D.R.; Comba, L.; Matese, A.; Di Gennaro, S.F. NDVI-based vigour maps production using automatic detection of vine rows in ultra-high resolution aerial images. In Proceedings of the Precision Agriculture 2015; Wageningen Academic Publishers: Wageningen, The Netherlands; Tel-Aviv, Israel, 2015; pp. 465–470. [Google Scholar]
  57. Poblete-Echeverría, C.; Olmedo, G.F.; Ingram, B.; Bardeen, M. Detection and segmentation of vine canopy in ultra-high spatial resolution RGB imagery obtained from Unmanned Aerial Vehicle (UAV): A case study in a commercial vineyard. Remote Sens. 2017, 9, 268. [Google Scholar] [CrossRef] [Green Version]
Figure 1. Study vineyard located in Tuscany, Italy.
Remotesensing 14 00449 g001
Figure 2. UAV platforms DJI P4M (a) and Matrice 600 Pro (b) used in this research to perform multispectral and hyperspectral sensing, respectively. Optical sensors used in this research: P4M multispectral camera (c), SENOP HSC-2 hyperspectral camera (d) and GER3700 spectroradiometer (e).
Remotesensing 14 00449 g002
Figure 3. The ground targets position in the area close to the study vineyard (a). In detail the figure reports the reference reflectance panels used for radiometric correction (b), and targets related to bare soil (c), bare-stony soil (d), stony soil (e), soil with dry grass (f), partially grass covered soil (g) and canopy (h).
Remotesensing 14 00449 g003
Figure 4. Image processing workflow.
Remotesensing 14 00449 g004
Figure 5. Spectral characterization of OptoPolymer (black lines) and Senop (red lines) reference panels using GER 3700 (a) and SENOP HSC-2 (b). Scatter plots related to spectral comparison between GER 3700 and SENOP HSC-2 using OptoPolymer (c) and Senop (d) reference panels legend: 0.97% reflectance (black solid line), 0.56% reflectance (black long-dashed line), 0.10% reflectance (black dotted line), 0.88% reflectance (red solid line), 0.50% reflectance (red long-dashed line), 0.25% reflectance (red dashed line), 0.09% reflectance (red dotted line), 0.02% reflectance (red dotted-dashed line).
Remotesensing 14 00449 g005
Figure 6. Comparison between GER 3700 (black line) and SENOP HSC-2 (red line) spectral signature in radiance and reflectance of bare soil (a,b), bare-stony soil (c,d) and stony soil (e,f) targets.
Remotesensing 14 00449 g006
Figure 7. Comparison between GER 3700 (black line) and SENOP HSC-2 (red line) spectral signature in radiance and reflectance of soil with dry grass (a,b), soil with grass (c,d) and canopy (e,f) targets.
Remotesensing 14 00449 g007
Table 1. Sensors technical specifications.
ManufacturerSensorSpectral Range (nm)No. BandsSpectral Resolution (nm)Spatial Resolution (px)Acquisition ModeWeight (kg)OpticsFOV
Spectra Vista
Corporation
GER 3700350–25007041.5 nm @ 700 nm
6.5 nm @ 1600 nm
9.5 nm @ 2100 nm
No-imagingSingle point data6.3 kg 25.0°
SENOPHSC-2500–90010006–18 nm1024 × 1024Snapshot0.99 kgf/3.2836.8°
DJIP4M450 nm ± 16 nm
560 nm ± 16 nm
650 nm ± 16 nm
730 nm ± 16 nm
840 nm ± 26 nm
1600 × 1300Snapshot<0.1 kgf/2.2062.7°
Table 2. Reflectance reference panels used in this research.
ManufacturerLinkTargetDimension (cm)Reflectance
OptoPolymerhttps://www.optopolymer.de
(accessed on 1 January 2022)
White100 × 5097%
Grey100 × 5056%
Black100 × 5010%
Senophttps://senop.fi
(accessed on 1 January 2022)
White50 × 5088%
Grey light50 × 5050%
Grey50 × 5025%
Grey dark50 × 509%
Black50 × 502%
Table 3. Computed VIs found in the literature and their respective equations. G, R, RE and N are the reflectance (GER, SENOP HSC-2 and DJI P4M) and reflectivity (DJI P4M) pixel values of the green, red, red edge and near infrared bands, respectively.
NameEquationRef.
Green Normalized Difference Vegetation Index GNDVI = N G N + G [50]
Normalized Difference Vegetation Index NDVI = N R N + R [49]
Red edge Normalized Difference Vegetation Index NDRE = N RE N + RE [51]
Table 4. Results of the comparison between 3 vegetation indices (GNDVI, NDVI, NDRE) calculated for canopy, soil with grass and soil with dry grass targets using SENOP HSC-2 hyperspectral and DJI P4M multispectral cameras with 6 different exposure settings and 4 radiometric calibration approaches versus the VIs obtained using the GER 3700 reference spectroradiometer. The table reports the results as percentage error (PE) (%).
GNDVINDVINDRE
TargetDatasetM1M2M3M4M1M2M3M4M1M2M3M4
Soil with dry grass (Figure 3f)SENOP HSC-22.7%13.6%9.3%
DJI P4M 10000_0100.0%100.0%10.2%35.4%100.0%100.0%19.3%18.9%100.0%100.0%33.3%65.4%
DJI P4M 8000_0100.0%100.0%6.5%28.9%100.0%100.0%14.3%43.4%100.0%100.0%20.5%57.5%
DJI P4M 8000_-0.7100.0%100.0%8.1%10.2%100.0%100.0%4.3%13.7%100.0%100.0%0.0%2.0%
DJI P4M 8000_-1100.0%100.0%6.5%11.3%100.0%100.0%10.4%9.3%100.0%100.0%29.6%7.6%
DJI P4M AUTO_0100.0%100.0%11.6%8.3%100.0%100.0%52.0%10.1%100.0%100.0%2.6%6.1%
DJI P4M AUTO_-1100.0%100.0%22.6%29.5%100.0%100.0%11.7%31.2%100.0%100.0%2.6%18.5%
Soil with grass (Figure 3g)SENOP HSC-213.0%9.2%2.2%
DJI P4M 10000_0100.0%100.0%27.6%24.3%82.8%86.4%36.9%35.6%27.0%10.5%31.2%14.5%
DJI P4M 8000_0100.0%100.0%21.8%40.7%79.0%77.1%32.7%45.7%27.8%27.2%14.1%1.7%
DJI P4M 8000_-0.7100.0%100.0%27.3%26.9%85.6%87.3%37.1%35.3%21.6%21.6%26.5%27.9%
DJI P4M 8000_-1100.0%100.0%27.7%26.2%85.6%83.3%39.1%35.0%13.7%19.6%38.1%30.6%
DJI P4M AUTO_0100.0%100.0%23.1%33.0%72.7%73.6%46.6%37.3%26.8%25.2%24.6%25.5%
DJI P4M AUTO_-1100.0%100.0%21.3%20.9%73.1%76.9%32.7%30.4%32.5%20.7%26.4%36.5%
Canopy (Figure 3h)SENOP HSC-21.0%1.6%6.5%
DJI P4M 10000_037.4%37.0%7.0%7.0%19.9%19.0%9.9%9.8%9.7%9.3%17.0%1.8%
DJI P4M 8000_042.2%43.1%2.6%18.7%24.0%24.4%1.9%17.7%6.8%0.1%11.3%13.6%
DJI P4M 8000_-0.738.3%39.4%8.9%10.4%19.8%20.6%10.4%10.9%5.6%1.4%13.4%21.9%
DJI P4M 8000_-135.7%35.7%5.8%8.0%17.5%17.8%7.0%9.2%9.8%11.1%12.1%11.8%
DJI P4M AUTO_035.6%35.6%6.5%12.2%18.4%16.9%17.1%10.4%7.4%6.2%14.0%17.4%
DJI P4M AUTO_-137.2%43.0%9.2%13.6%18.1%21.9%9.9%12.7%5.2%12.4%19.4%39.2%
Publisher’s Note: MDPI stays neutral with regard to jurisdictional claims in published maps and institutional affiliations.

