
Long-Term Loss of Coral Reef in the Gulf of Aqaba Estimated from Historical Aerial Images


Abstract
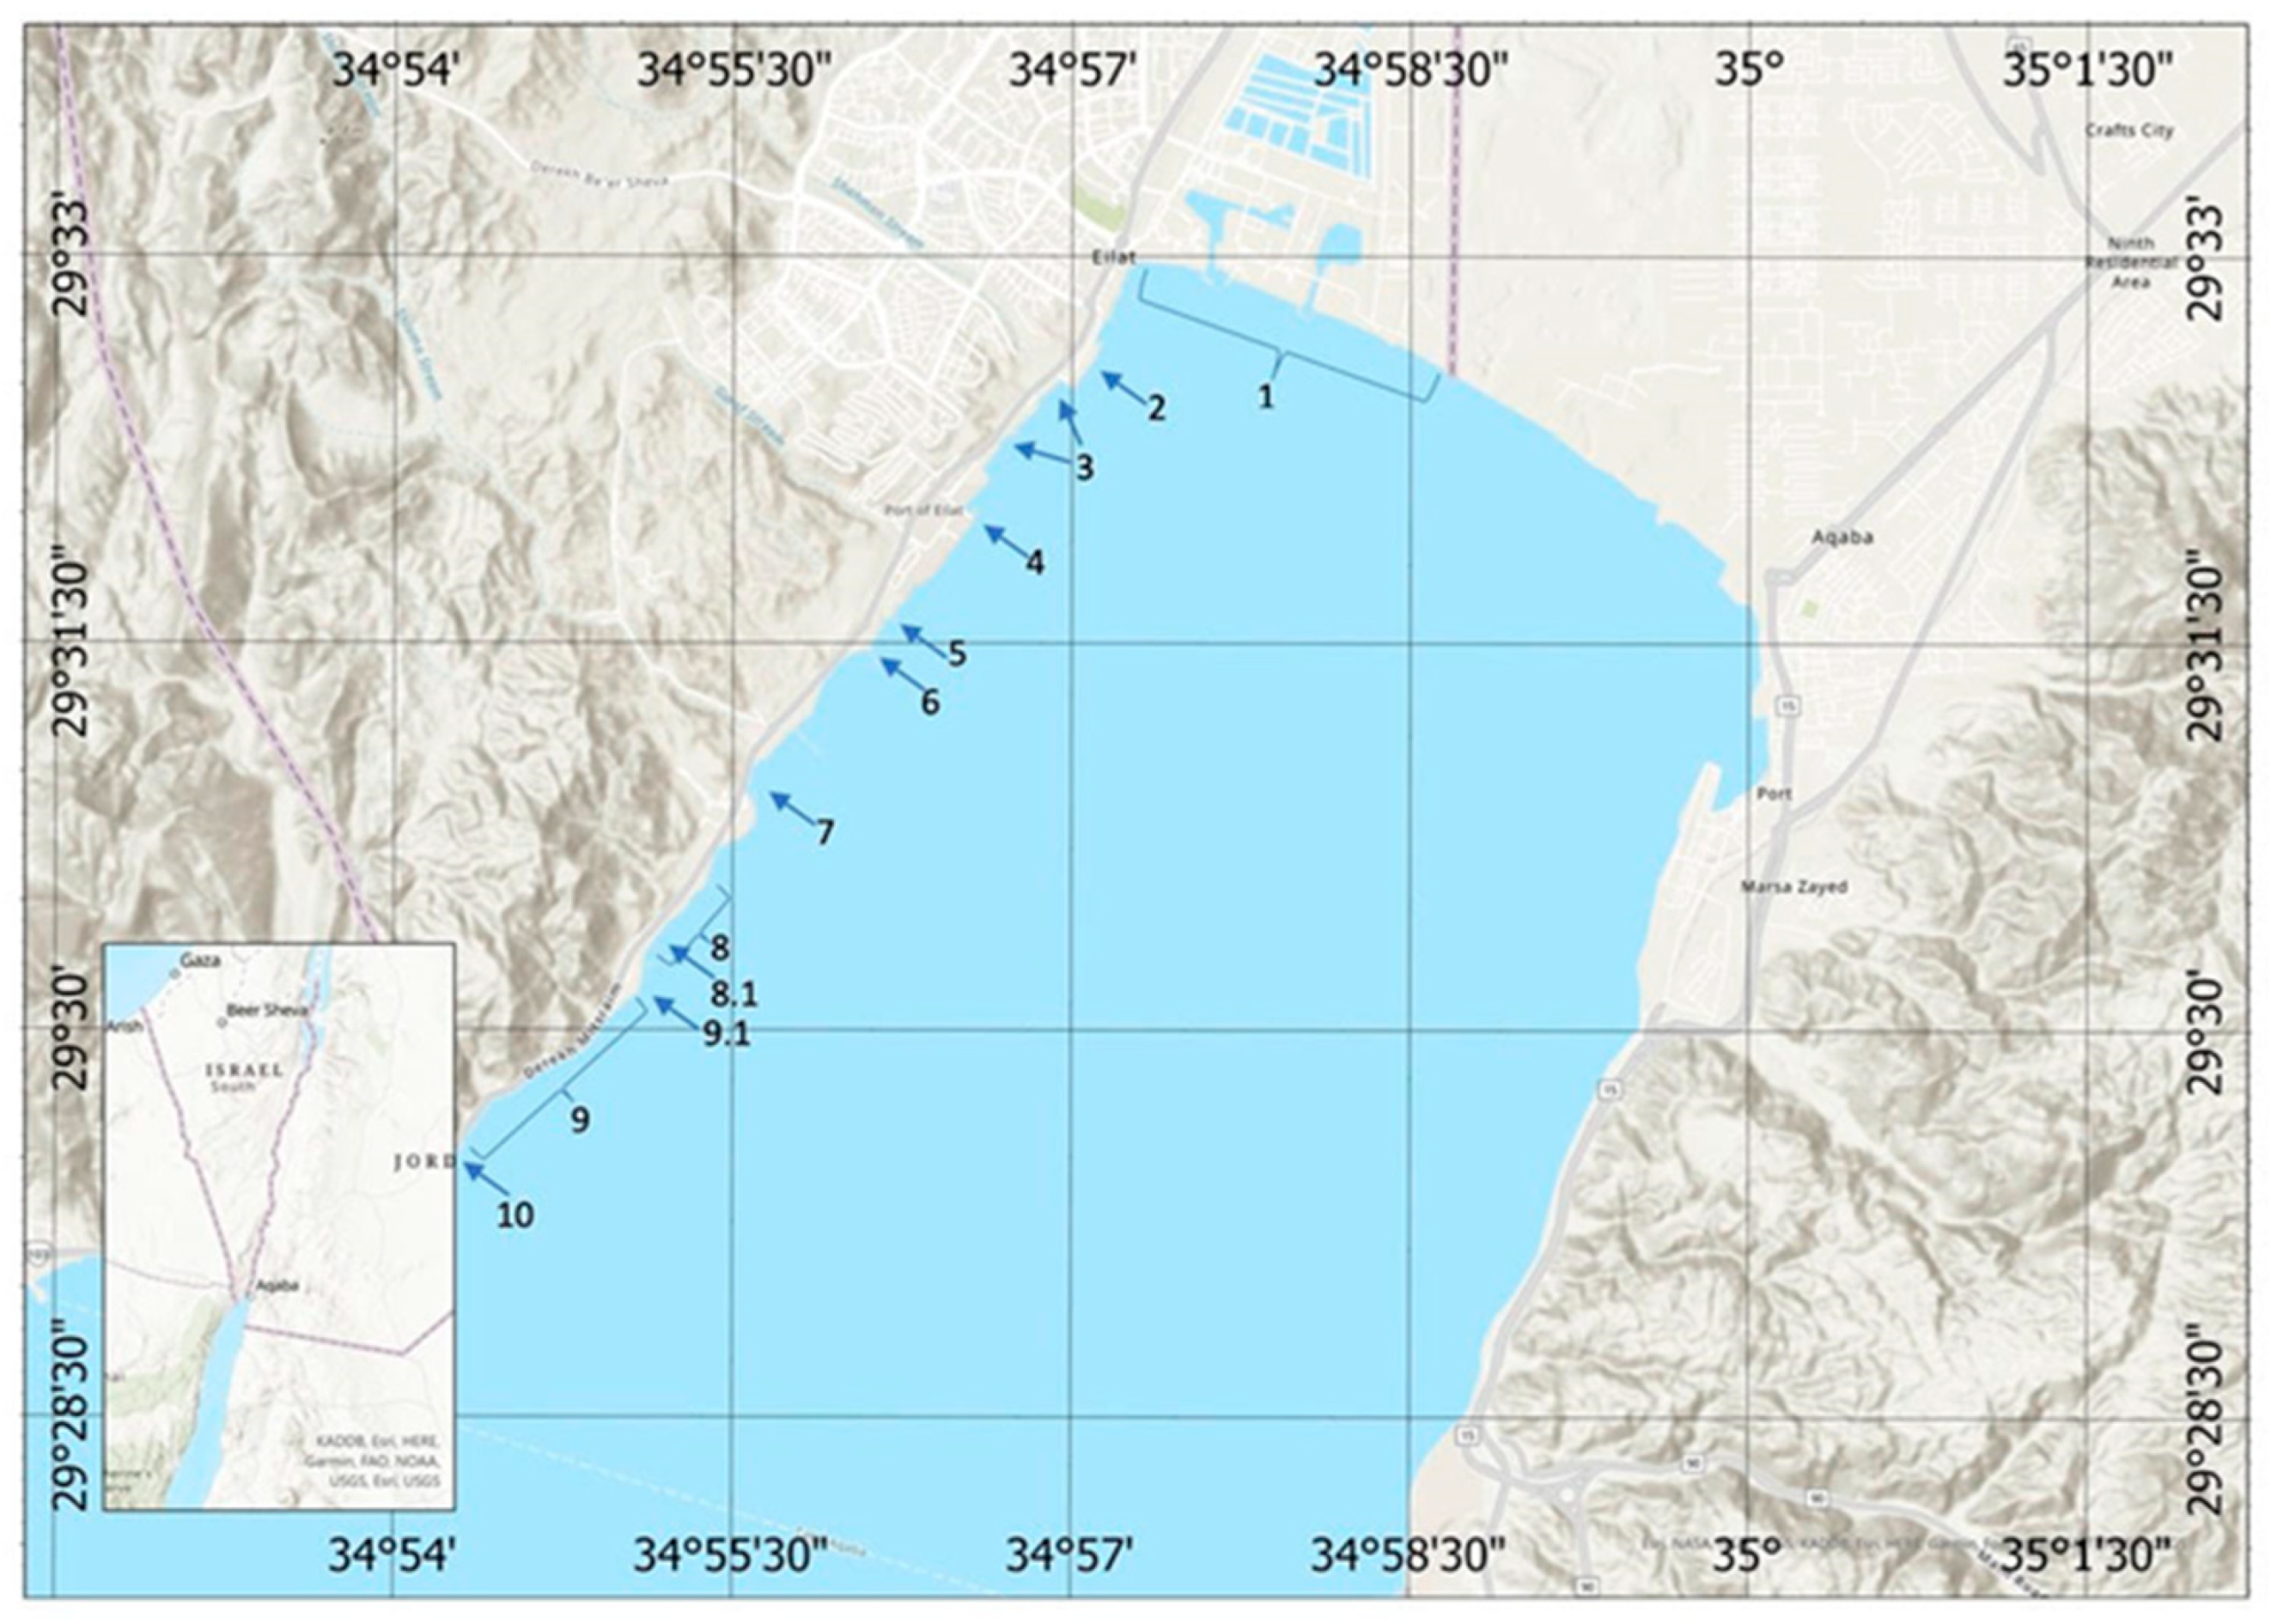
:1. Introduction
2. Materials and Methods
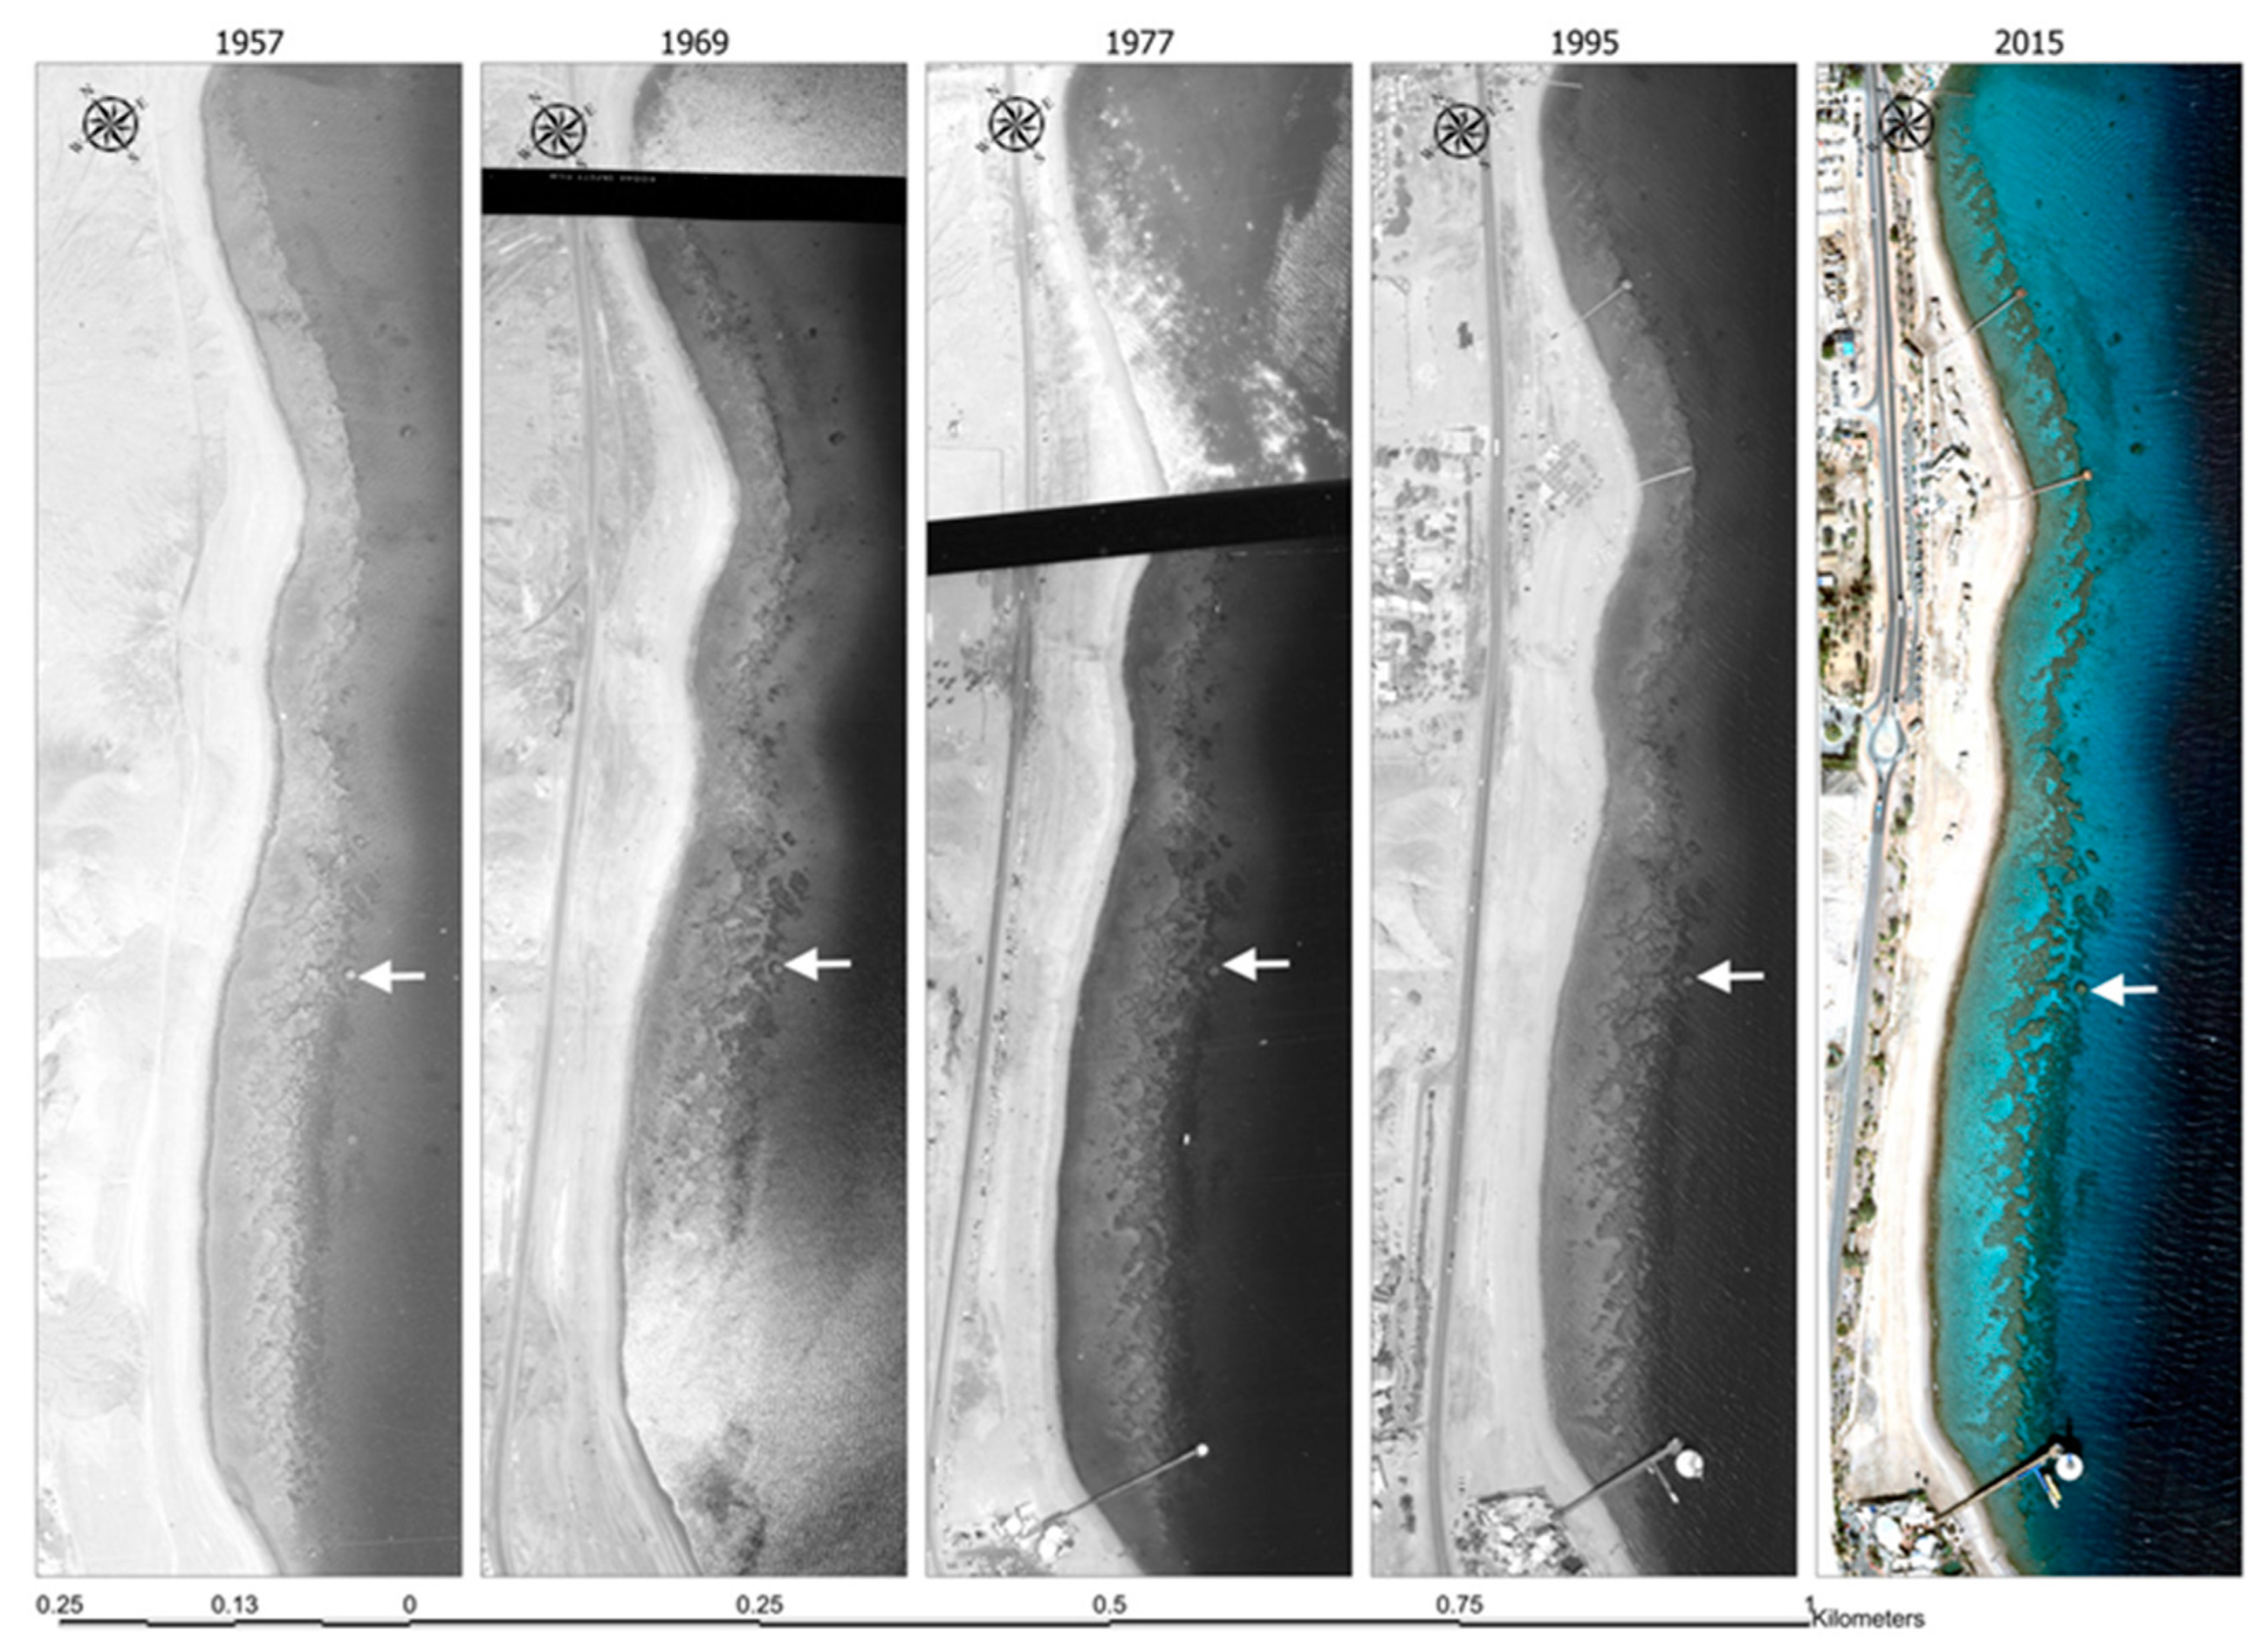
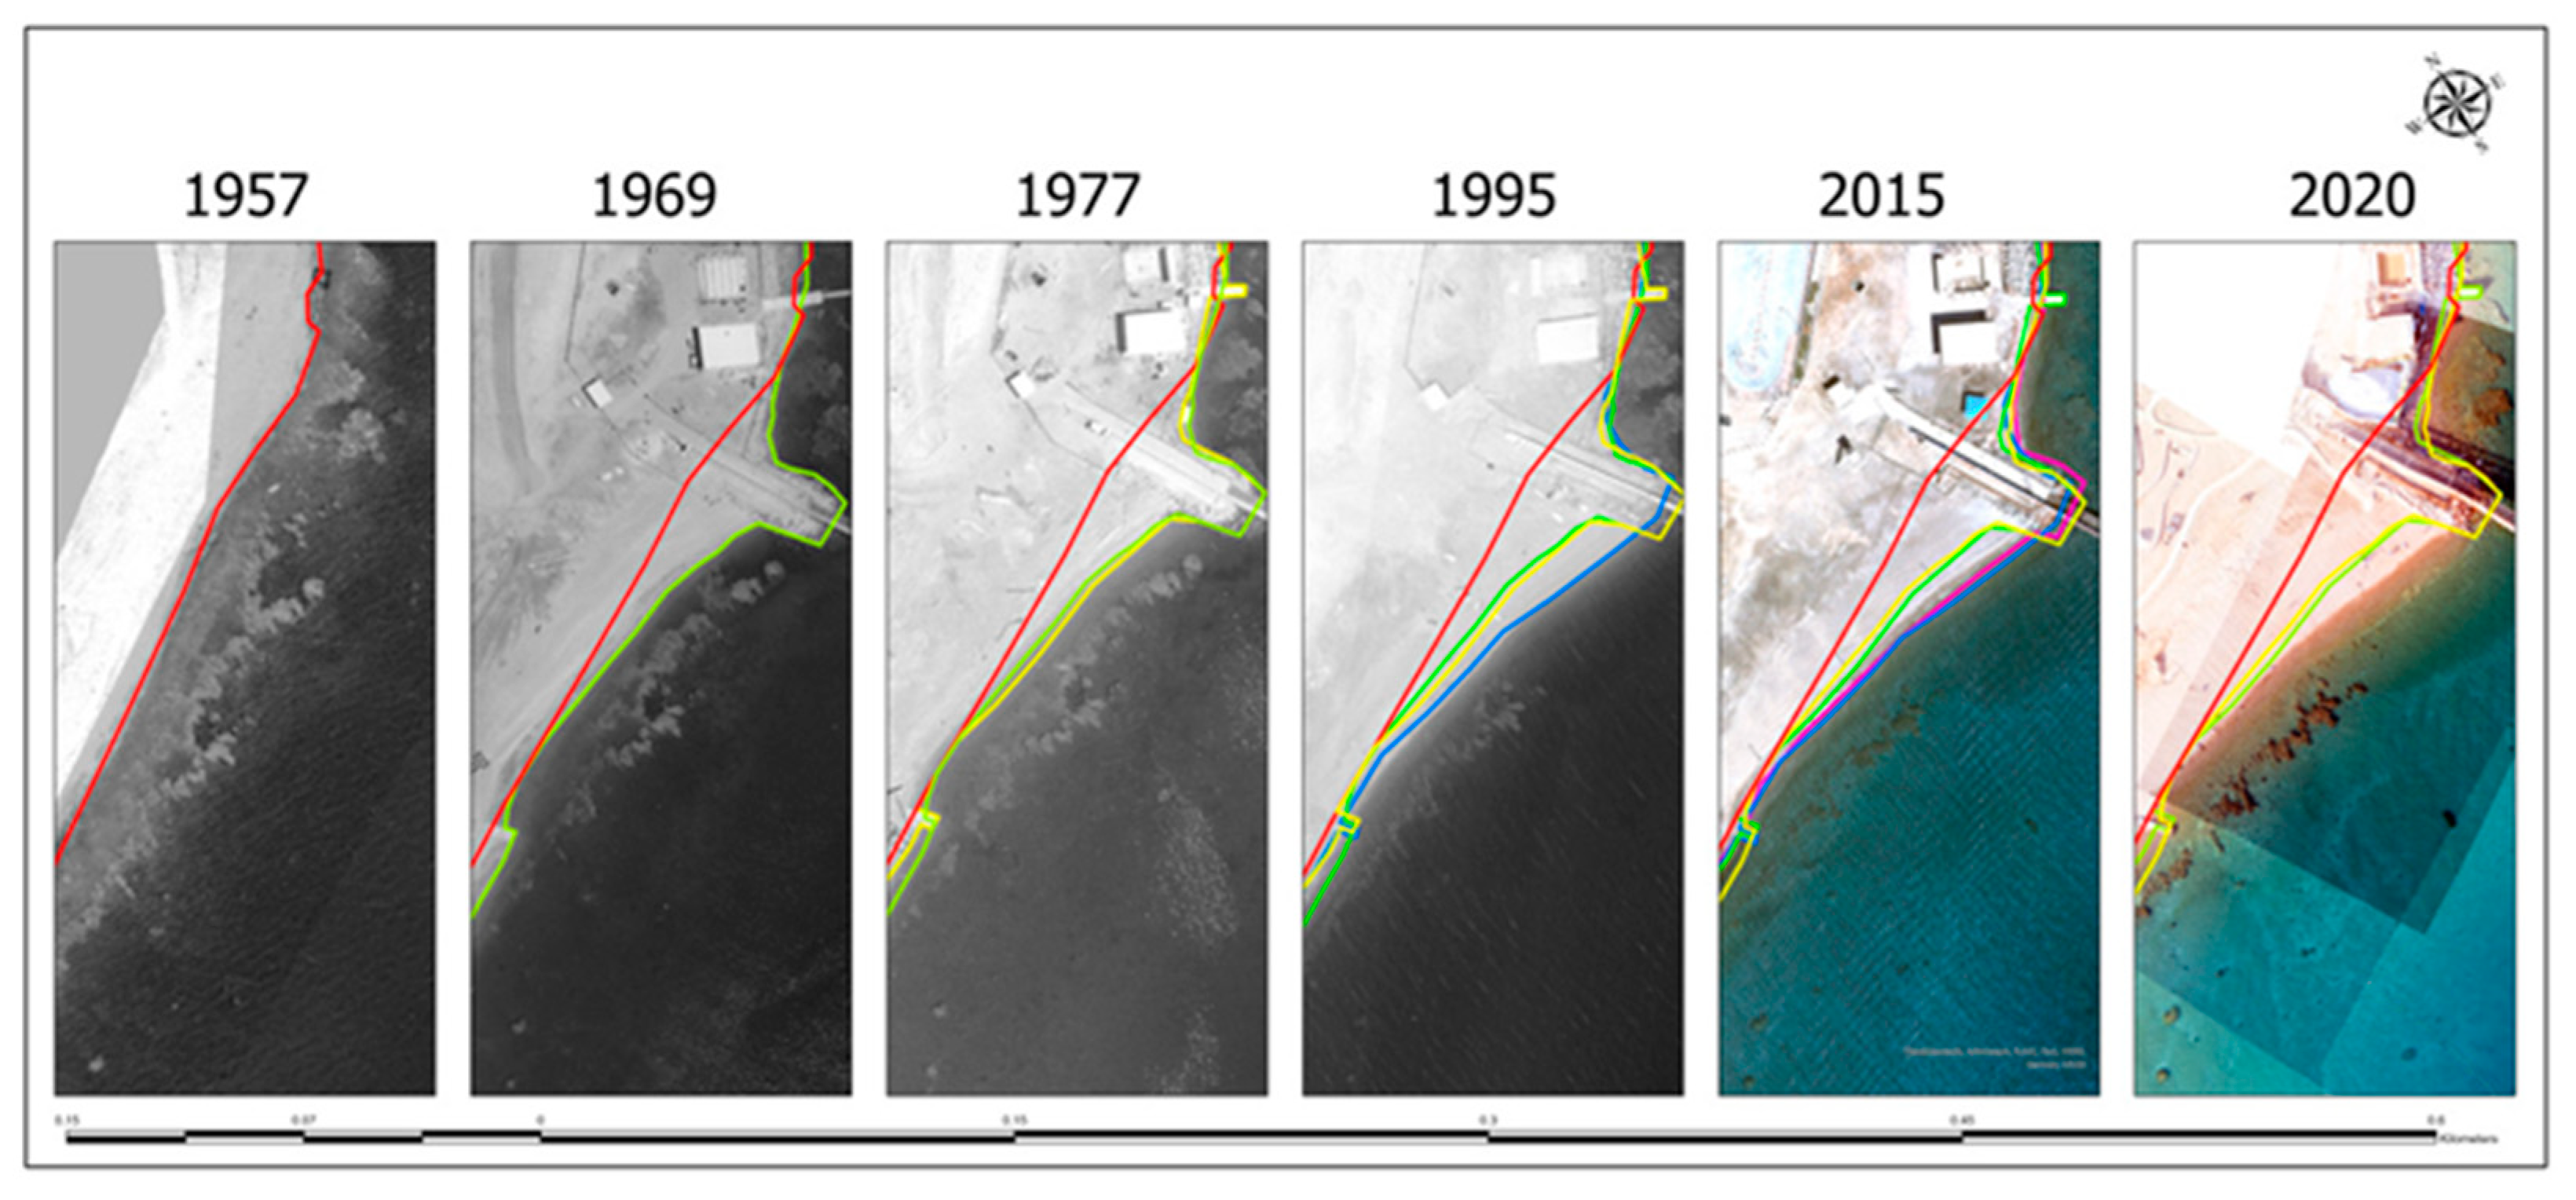
2.1. Aerial Images
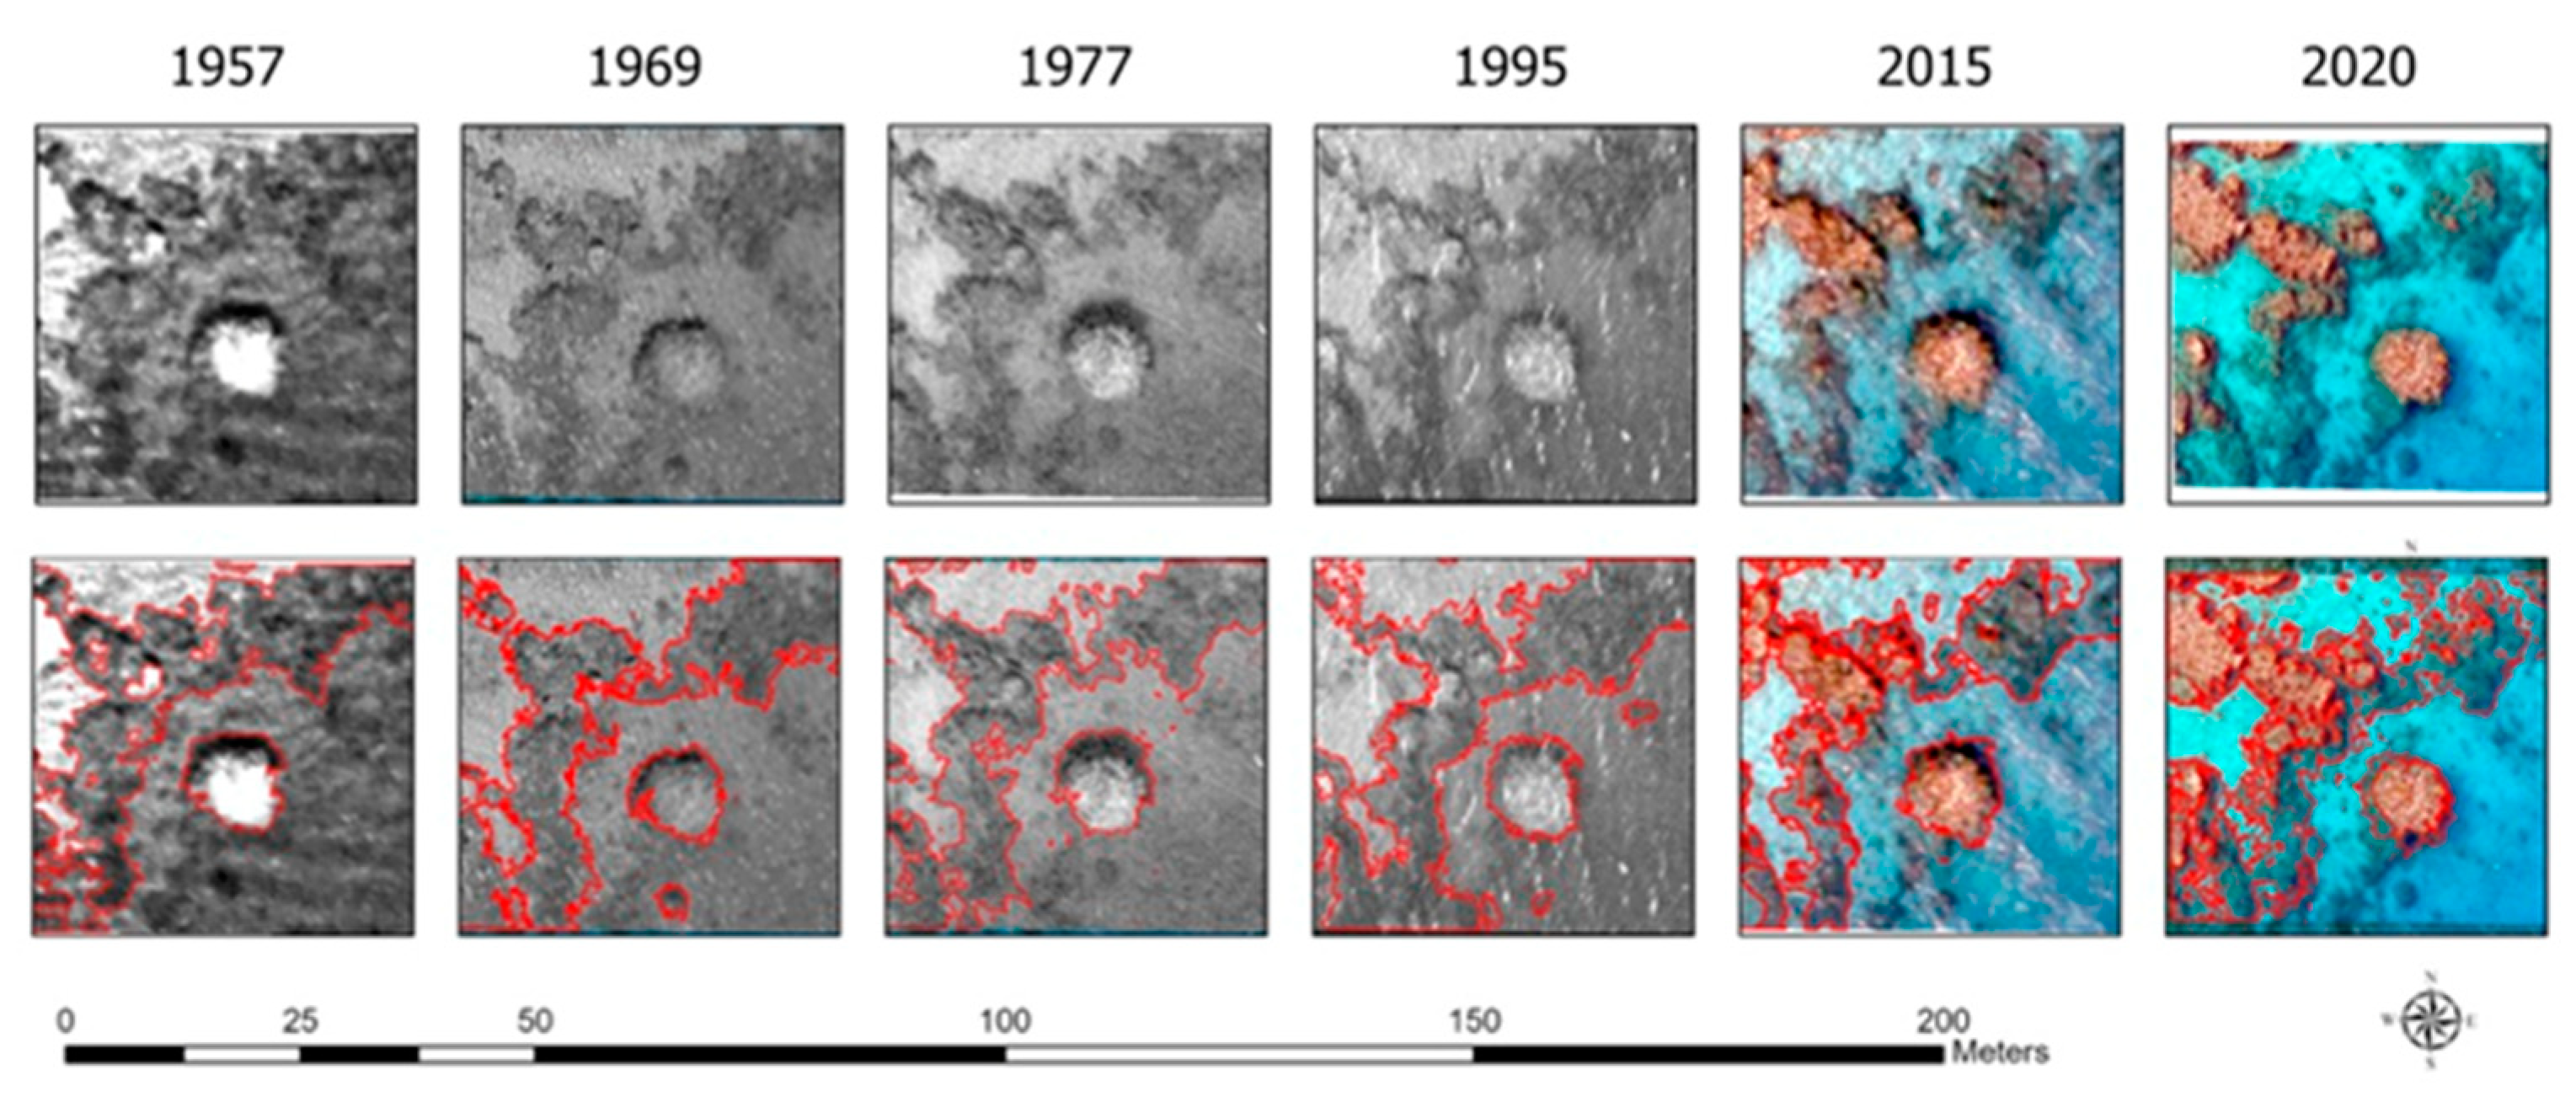
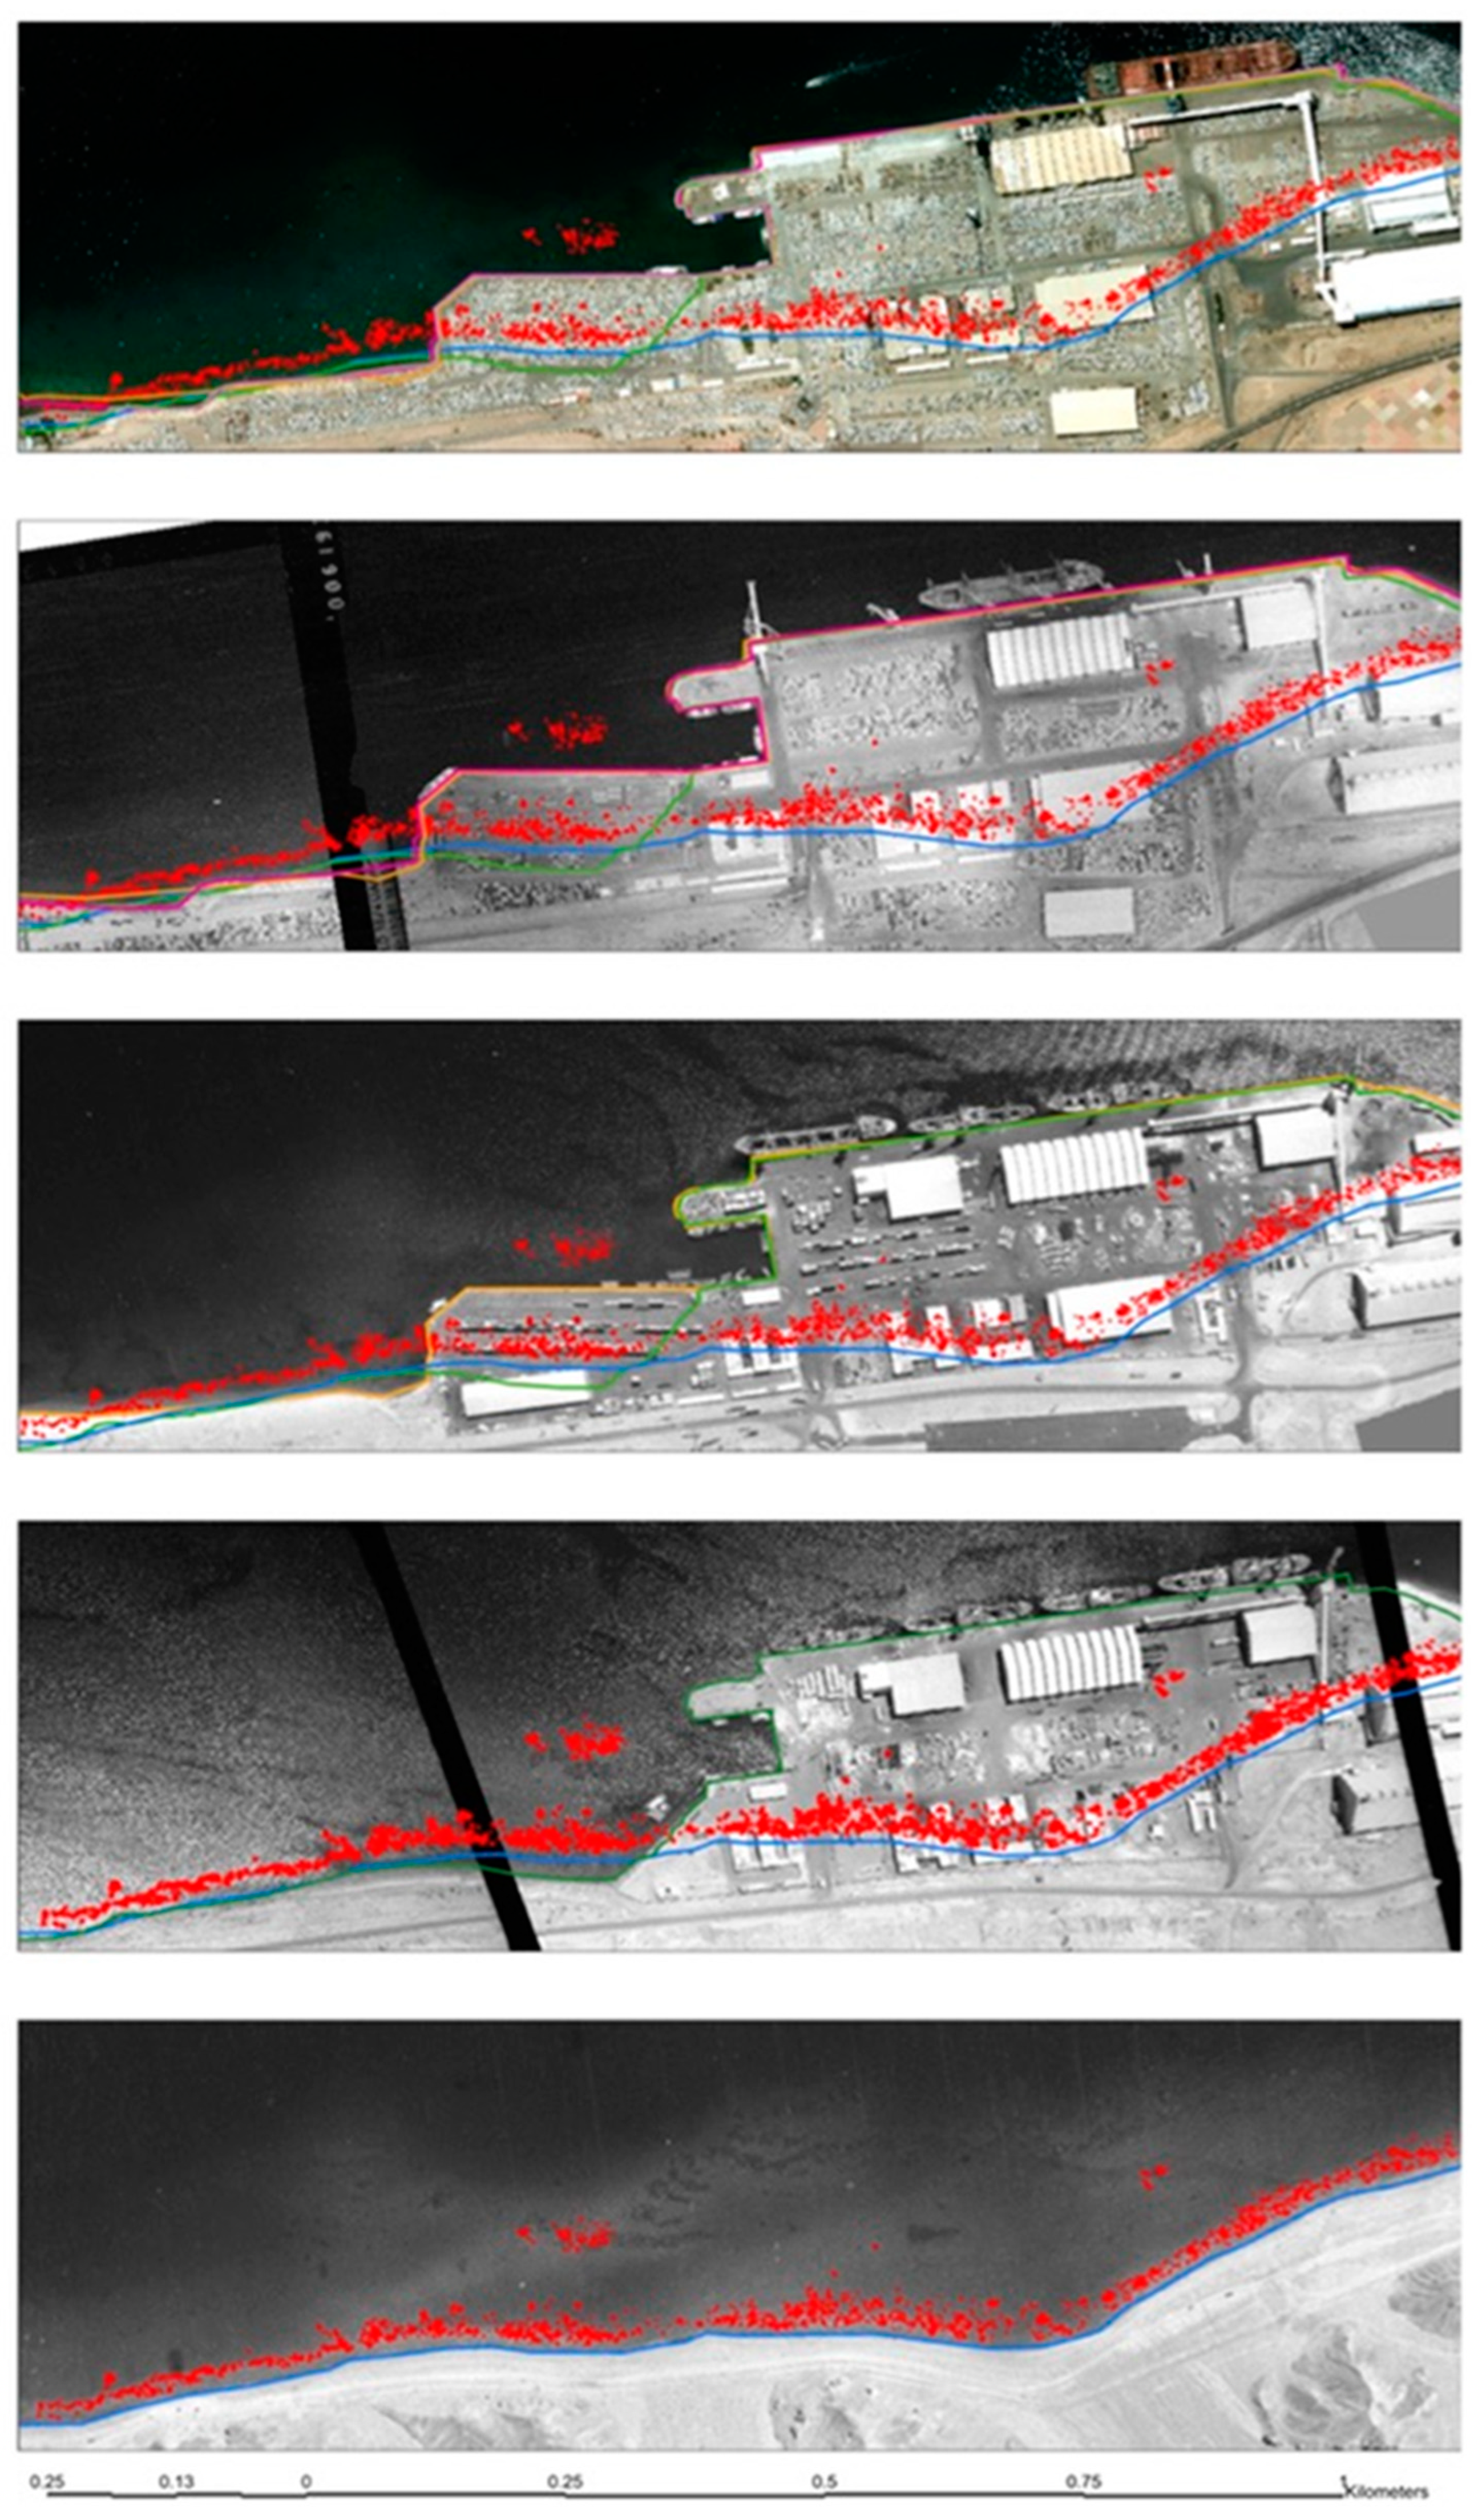
2.2. Image Processing and Analysis
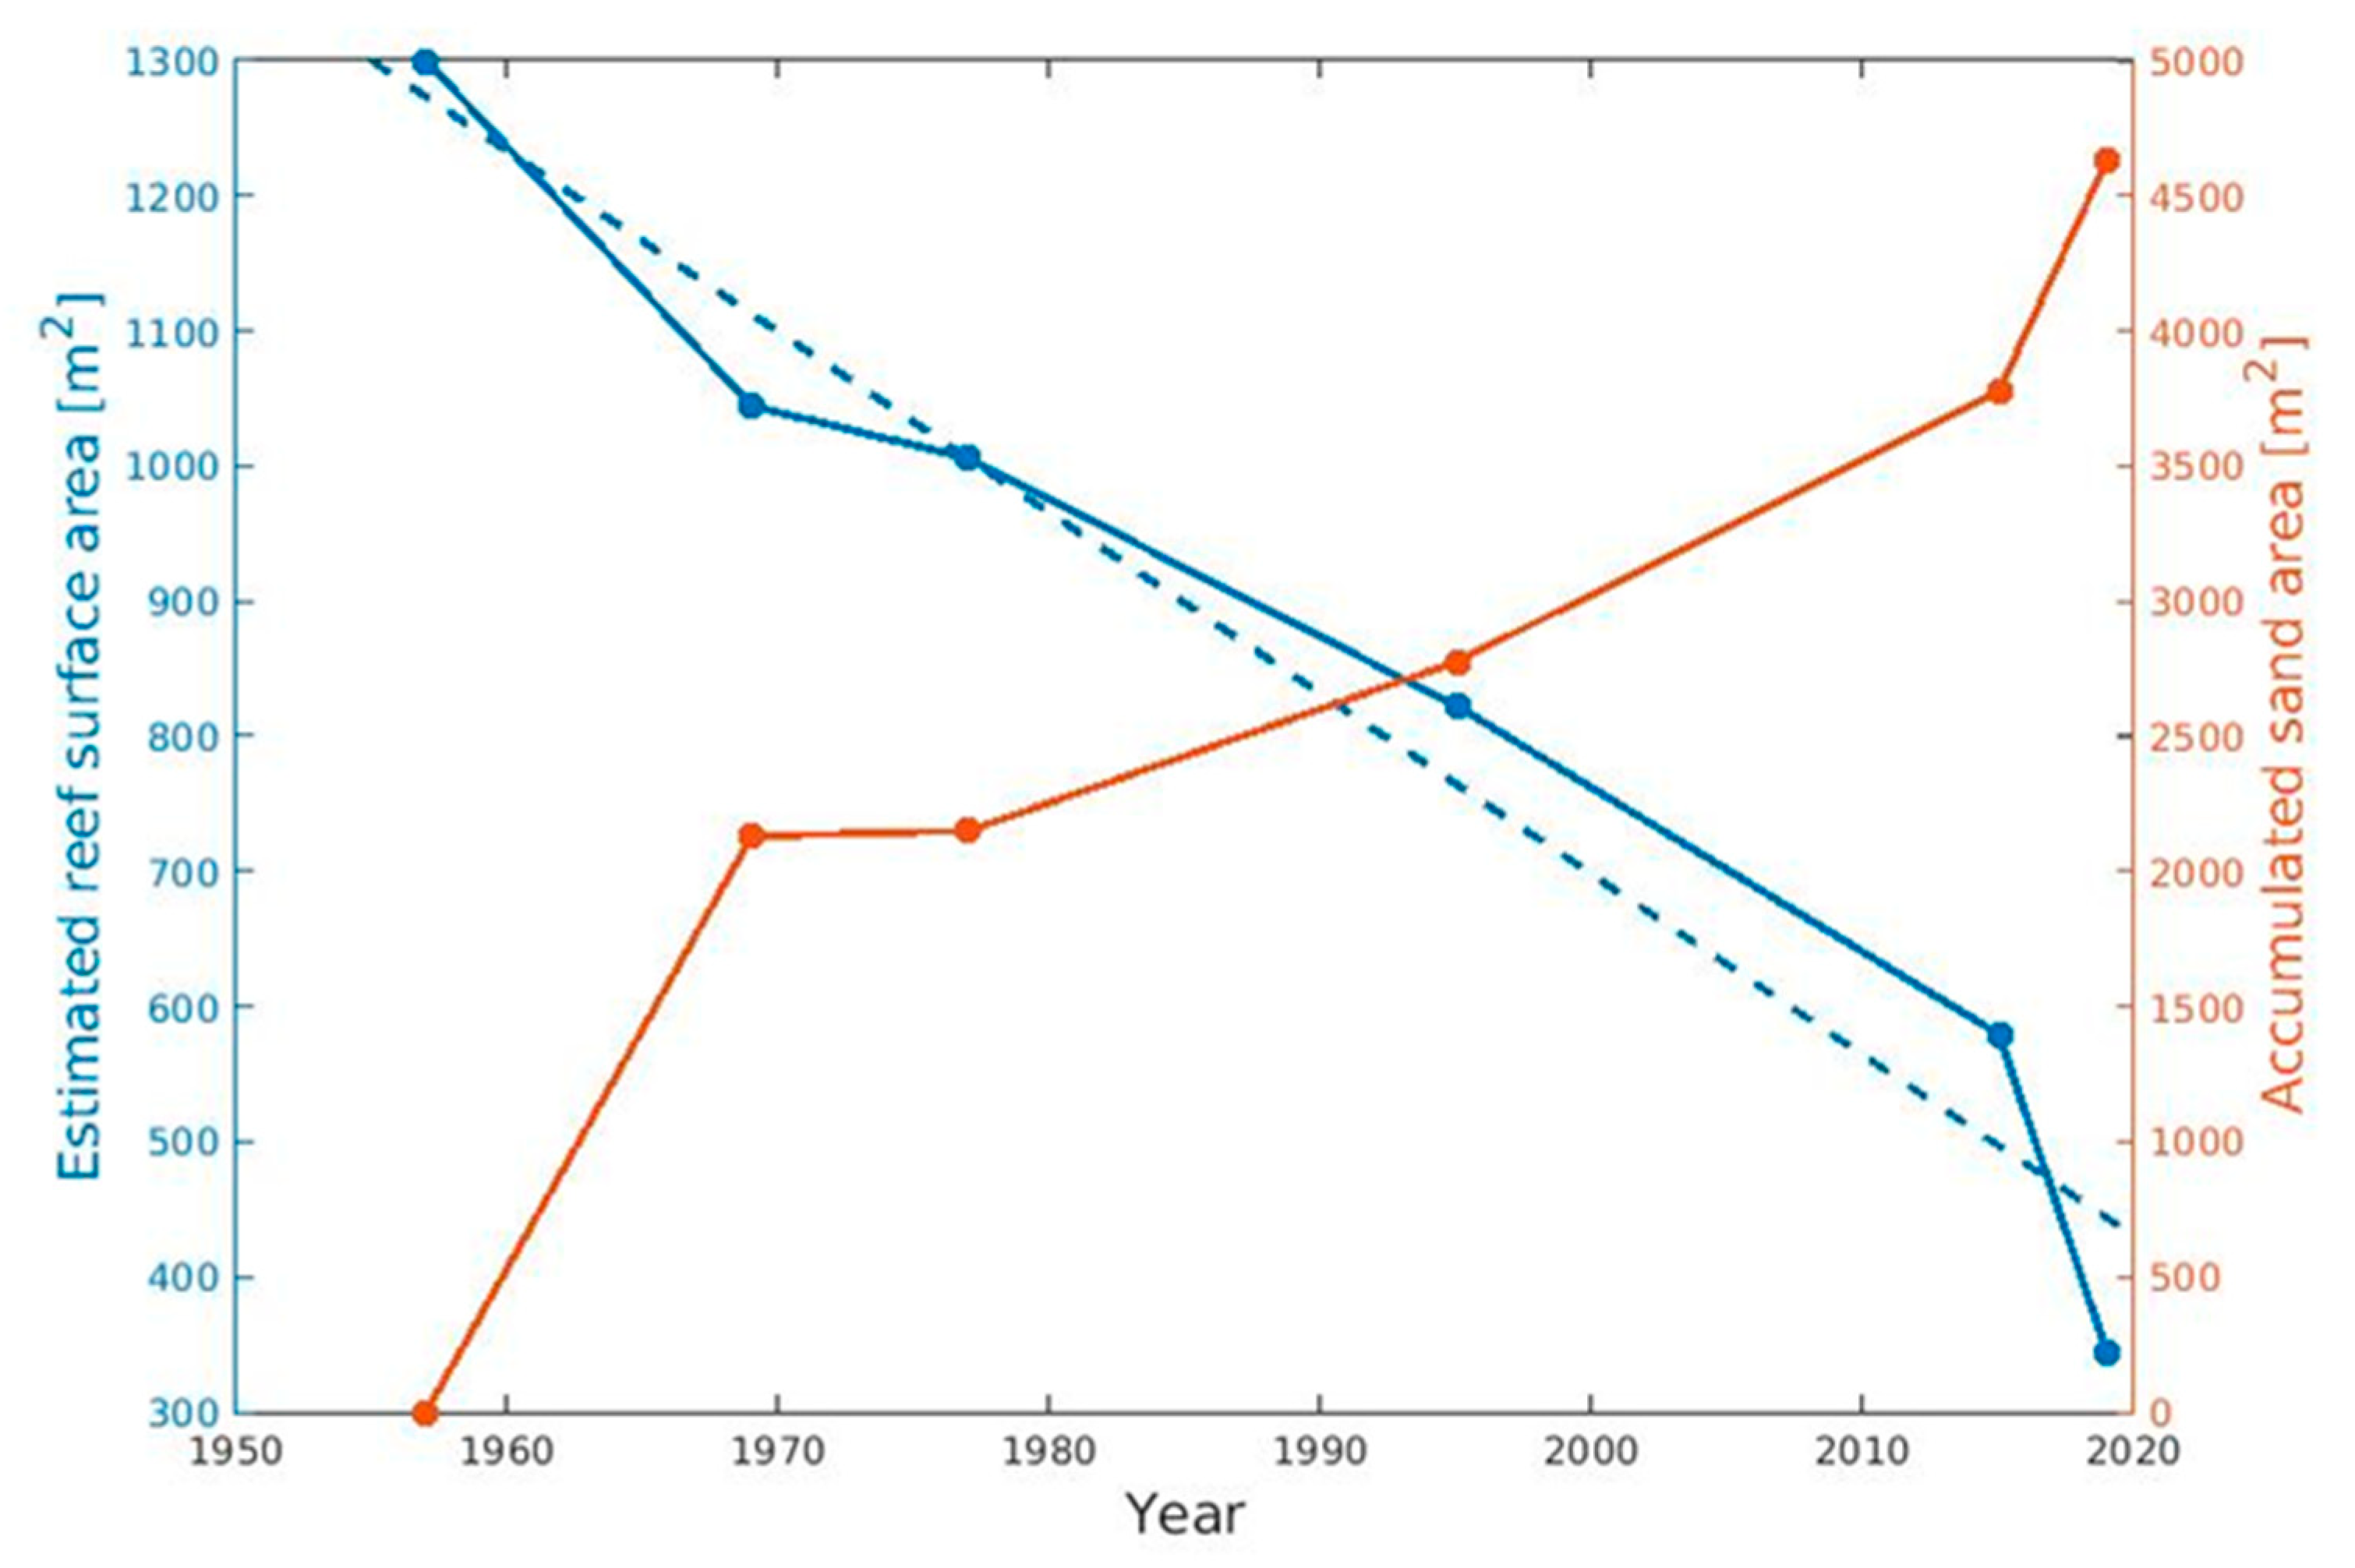
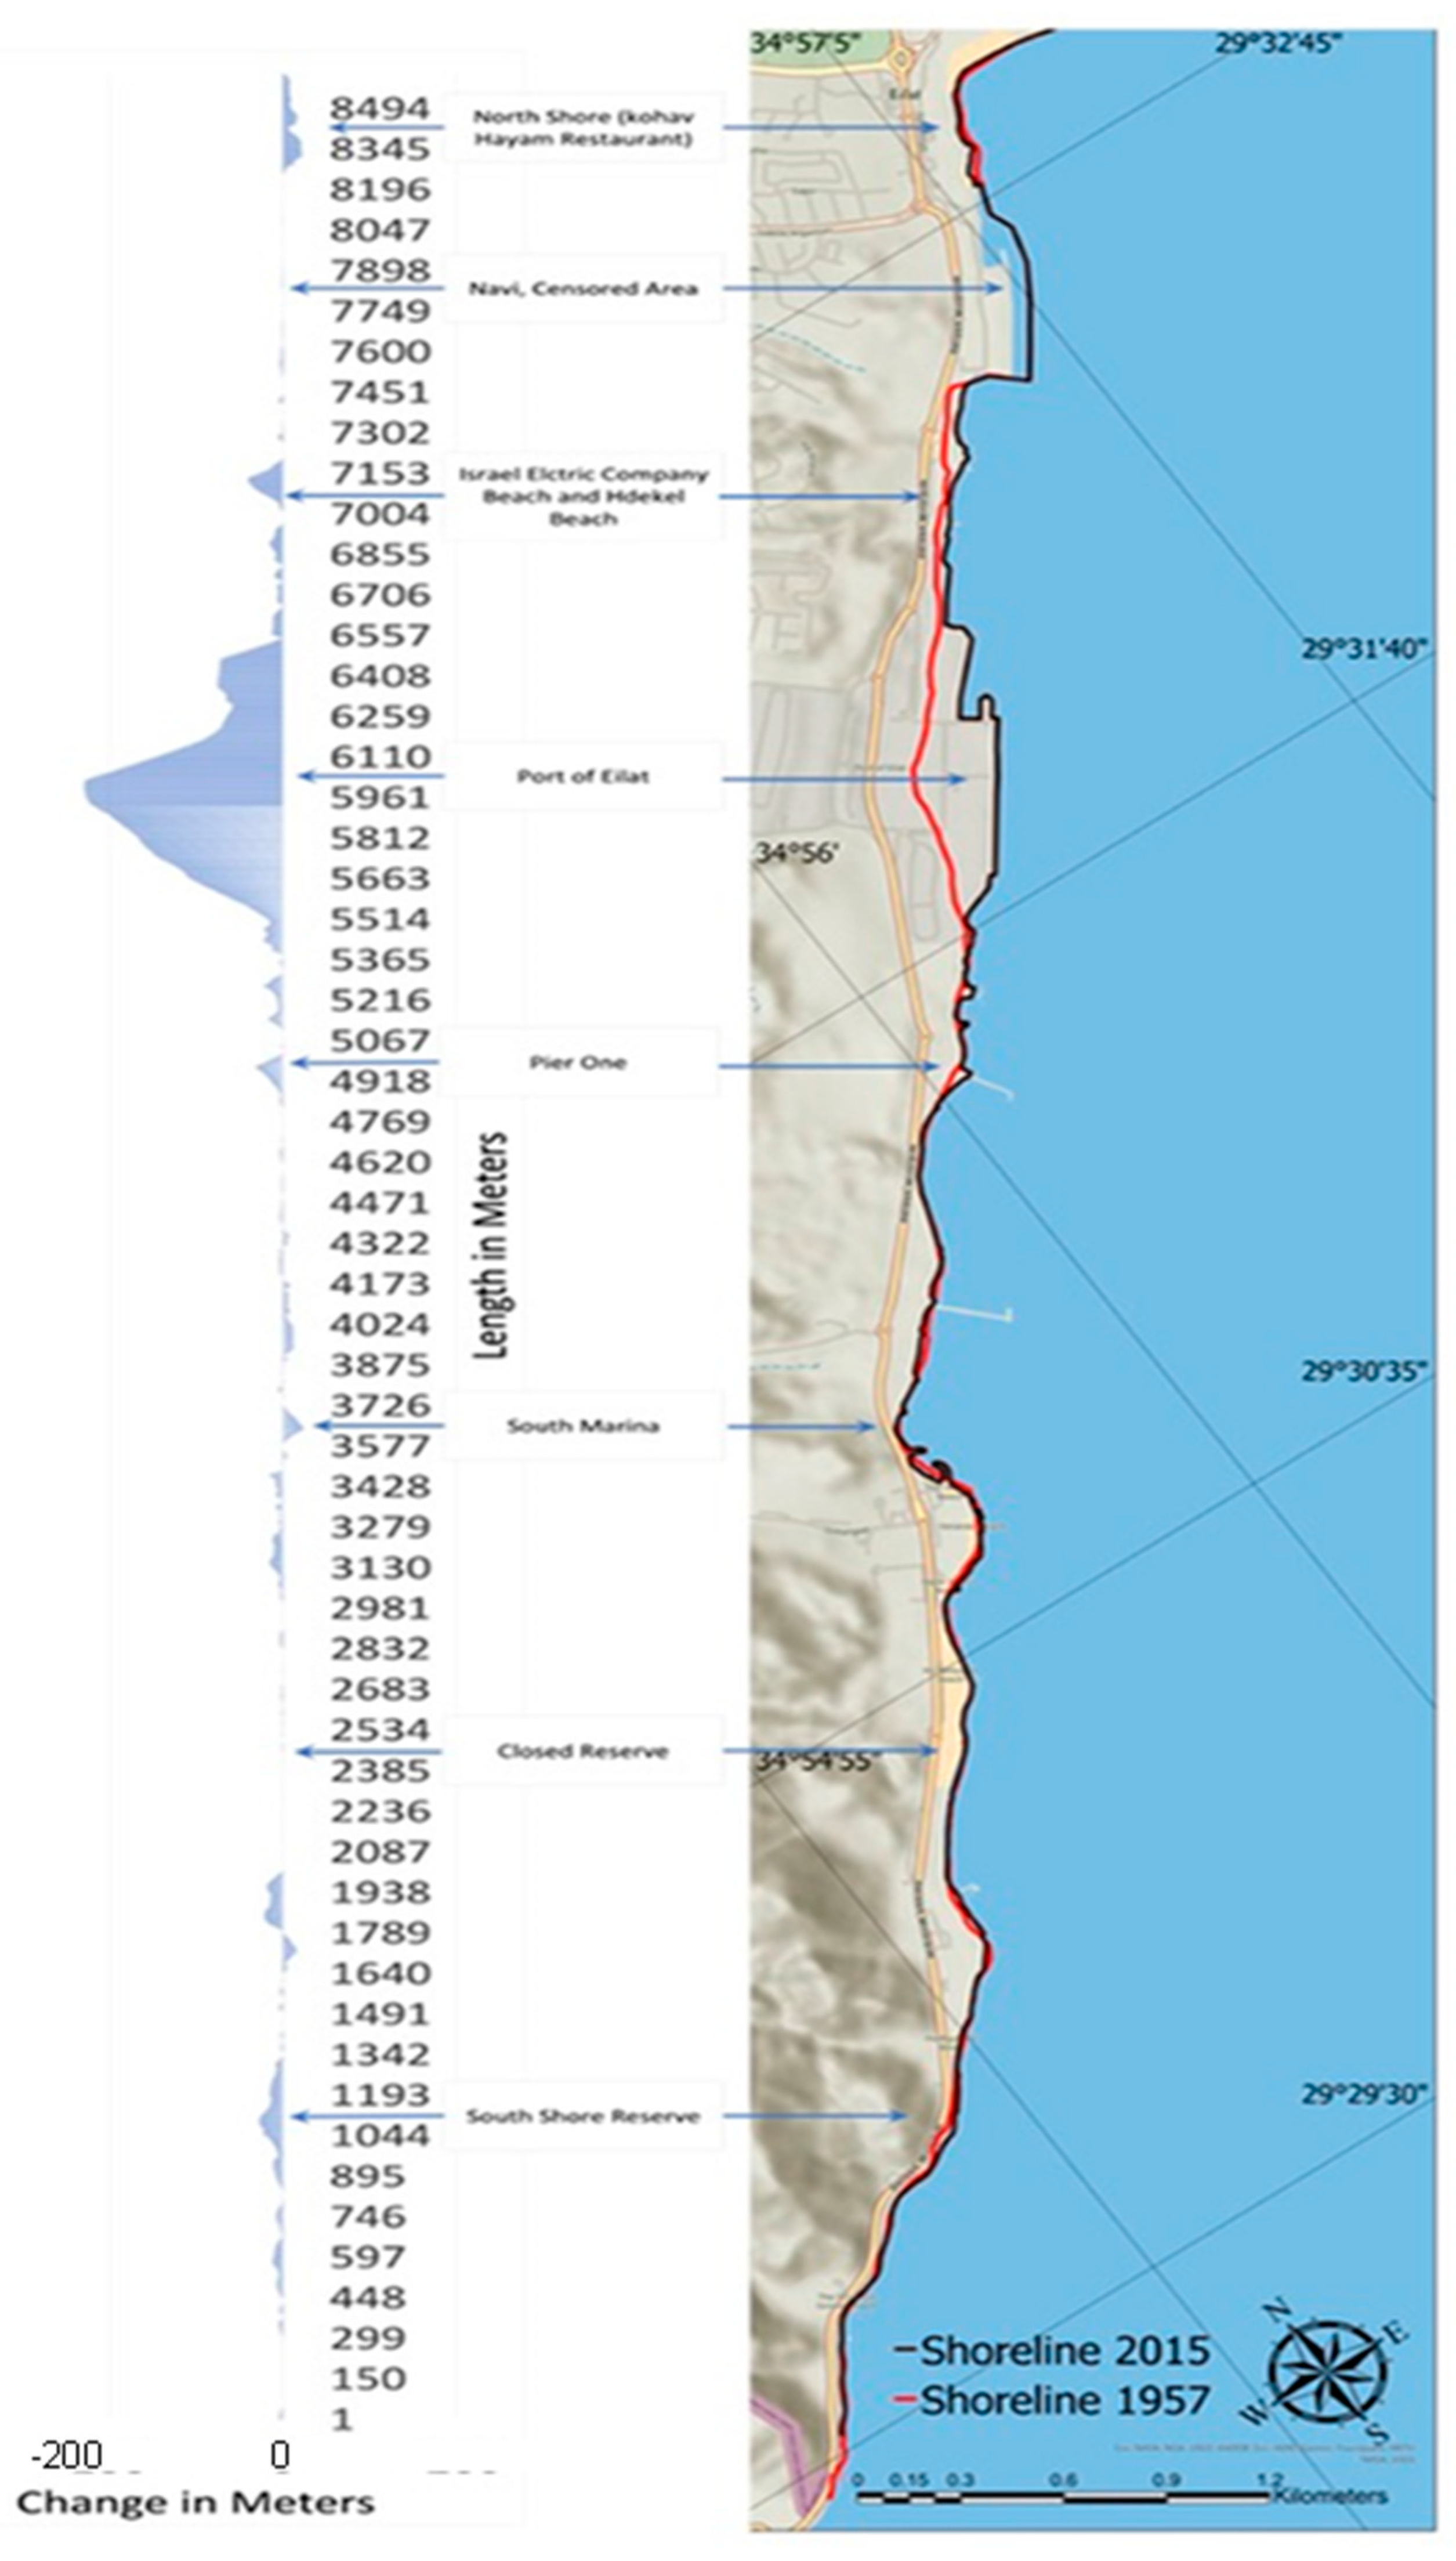
3. Results and Discussion
4. Summary and Conclusions
Author Contributions
Funding
Data Availability Statement
Acknowledgments
Conflicts of Interest
References
- Hoegh-Guldberg, O.; Mumby, P.J.; Hooten, A.J.; Steneck, R.S.; Greenfield, P.; Gomez, E.; Harvell, C.; Sale, P.F.; Edwards, A.; Caldeira, K.; et al. Coral Reefs Under Rapid Climate Change and Ocean Acidification. Science 2008, 318, 1737–1742. [Google Scholar] [CrossRef] [PubMed] [Green Version]
- Loya, Y.; Genin, A.; Al-Zibdah, M.; Naumann, M.S.; Wild, C. Reviewing The Status of Coral Reef Ecology of the Red Sea—The Need to Consider Key Topics and Relevant Research. Coral Reefs 2014, 33, 1179–1180. [Google Scholar] [CrossRef]
- Hedley, J.D.; Roelfsema, C.M.; Chollett, I.; Harborne, A.R.; Heron, S.F.; Weeks, S.; Skirving, W.J.; Strong, A.E.; Eakin, C.M.; Christensen, T.R.L.; et al. Remote Sensing of Coral Reefs for Monitoring and Management: A Review. Remote Sens. 2016, 8, 118. [Google Scholar] [CrossRef] [Green Version]
- Hughes, T.P.; Baird, A.H.; Bellwood, D.R.; Card, M.; Connolly, S.R.; Folke, C.; Grosberg, R.; Hoegh-Guldberg, O.; Jackson, J.B.; Kleypas, J.; et al. Climate Change, Human Impacts, and the Resilience of Coral Reefs. Science 2003, 301, 929–933. [Google Scholar] [CrossRef] [PubMed] [Green Version]
- Bellwood, D.; Hughes, T.; Folke, C.; Nyström, M. Confronting the Coral Reef Crisis. Nature 2004, 429, 827–833. [Google Scholar] [CrossRef]
- Rogers, C.S. Responses of Coral Reefs and Reef Organisms to Sedimentation. Mar. Ecol. Prog. Ser. 1990, 62, 185–202. [Google Scholar] [CrossRef]
- Burke, L.; Reytar, K.; Spalding, M.; Perry, A. Reefs at Risk Revisited in the Coral Triangle; World Resour. Inst: Washington, DC, USA, 2012. [Google Scholar]
- Wielgus, J.; Chadwick, F.N.E.; Dubinsky, Z. Coral Cover and Partial Mortality on Anthropogenically Impacted Coral Reefs at Eilat, Northern Red Sea. Mar. Pollut. Bull. 2004, 48, 248–253. [Google Scholar] [CrossRef]
- De’ath, G.; Fabricius, K.; Sweatman, H.; Puotinen, M. The 27-Year Decline of Coral Cover on the Great Barrier Reef and its Causes. Proc. Natl. Acad. Sci. USA 2012, 109, 17995–17999. [Google Scholar] [CrossRef] [Green Version]
- Fine, M.; Cinar, M.; Voolstra, C.R.; Safa, A.; Rinkevich, B.; Laffoley, D.; Hilmi, N.; Allemand, D. Coral Reefs of The Red Sea—Challenges and potential solutions. Reg. Stud. Mar. Sci. 2019, 25, 100498. [Google Scholar] [CrossRef]
- Chou, L.M.; Toh, T.C.; Toh, K.B.; Cabaitan, P.; Tun, K. Differential Response of Coral Assemblages to Thermal Stress Underscores the Complexity in Predicting Bleaching Susceptibility. PLoS ONE 2016, 11, e0159755. [Google Scholar] [CrossRef]
- Heery, E.C.; Hoeksema, B.W.; Browne, N.K.; Reimer, J.D.; Ang, P.O.; Huang, D.; Todd, P.A.; Friess, D.A.; Friess, L.M.; Loke, L.H.L.; et al. Urban Coral Reefs: Degradation and Resilience of Hard Coral Assemblages in Coastal Cities of East and Southeast Asia. Mar. Pollut. Bull. 2018, 135, 654–681. [Google Scholar] [CrossRef] [PubMed]
- Loya, Y.; Slobodkin, L.B. The Coral Reefs of Eilat (Gulf of Eilat, Red Sea). Proc. Zool. Soc. Lond. 1971, 28, 117–140. [Google Scholar]
- Shlesinger, T.; Loya, Y. Recruitment, Mortality, and Resilience Potential of Scleractinian Corals at Eilat, Red Sea. Coral Reefs 2016, 35, 1357–1368. [Google Scholar] [CrossRef]
- Krueger, T.; Horwitz, N.; Bodin, J.; Giovani, M.E.; Escrig, S.; Meibom, A.; Fine, M. Common Reef-Building Coral in the Northern Red Sea Resistant to Elevated Temperature and Acidification. R. Soc. Open Sci. 2017, 4, 170038. [Google Scholar] [CrossRef] [Green Version]
- Mumby, P.J.; Green, E.P.; Edwards, A.J.; Clark, C.D. Coral reef habitat mapping: How much detail can remote sensing provide? Mar. Biol. 1997, 130, 193–202. [Google Scholar] [CrossRef]
- Mumby, P.J.; Green, E.P.; Clark, C.D.; Edwards, A.J. Digital analysis of multispectral Airborne Imagery of coral reefs. Coral Reefs 1998, 17, 59–69. [Google Scholar] [CrossRef]
- Mumby, P.J.; Skirving, W.; Strong, A.E.; Hardy, J.T.; LeDrew, E.F.; Hochberg, E.J.; Stumpf, R.P.; David, L.T. Remote Sensing of Roral Reefs and TheirPhysical Environment. Mar. Pollut. Bull. 2004, 48, 219–228. [Google Scholar] [CrossRef]
- Palandro, D.; Andre, S.; Dustan, P.; Muller-Karger, F.E. Change Detection in Coral Reef Communities Using Ikonos Satellite Sensor Imagery and Historic Aerial Photographs. Int. J. Remote Sens. 2003, 24, 873–878. [Google Scholar] [CrossRef] [Green Version]
- Wahidin, N.; Siregar, V.; Nababan, B.; Jaya, I.; Wouthuyzen, S. Object-based Image Analysis for Coral Reef Benthic Habitat Mapping with Several Classification Algorithms. Procedia Environ. Sci. 2015, 24, 222–227. [Google Scholar] [CrossRef] [Green Version]
- Casella, E.; Collin, A.; Harris, D.; Ferse, S.; Bejarano, S.; Parravicini, V.; Hench, J.; Rovere, A. Mapping Coral Reefs Using Consumer-Grade Drones and Structure from Motion Photogrammetry Techniques. Coral Reefs 2016, 36, 269–275. [Google Scholar] [CrossRef]
- Ampou, E.; Ouillon, S.; Iovan, C.; Andréfouët, S. Change detection of Bunaken Island Coral Reefs Using 15 Years of Very High-Resolution Satellite Images: A Kaleidoscope of Habitat Trajectories. Mar. Pollut. Bull. 2018, 13, 83–95. [Google Scholar] [CrossRef] [PubMed]
- Newnham, T.J.; Browne, N.K.; Bumbak, J.; Loudon, L.; Wellington, H.; Shedrawi, G.; Hacker, J.; O’Leary, M. Long-Term (70-year) Monitoring of Reef Structure Through High-Resolution Multidecadal Aerial Imagery. Coral Reefs 2020, 39, 1859–1870. [Google Scholar] [CrossRef]
- Mavic 2 pro User Manual. 2018. Available online: https://dl.djicdn.com/downloads/Mavic_2/Mavic+2+Pro+Zoom+User+Manual+V1.4.pdf (accessed on 1 September 2022).
- Elizabeth, H.B.; Ian, L.T. Shoreline Definition and Detection: A Review. J. Coastal Res. 2005, 21, 688–703. [Google Scholar]
- Chalabi, A.; Mohd-Lokman, H.; Mohd-Su-an, I.; Karamali, K.; Karthigeyan, V.; Masita, M. Monitoring Shoreline Change using Ikonos Image and Aerial Photographs: A case study of Kuala Terengganu area, Malaysia. In Proceedings of the ISPRS Commission VII Mid-Term Symposium “Remote Sensing: From Pixels to Processes”, Enschede, The Netherlands, 8–11 May 2006; pp. 8–11. [Google Scholar]
- Paravolidakis, V.; Ragia, L.; Moirogiorgou, K.; Zervakis, M.E. Automatic Coastline Extraction Using Edge Detection and Optimization Procedures. Geosciences 2018, 8, 407. [Google Scholar] [CrossRef]
- Mirza, R.I.B.; Ishita, A.A.; Shahfahad, M.T.; Atiqur, R. Analysis of Shoreline Changes in Vishakhapatnam Coastal Tract of Andhra Pradesh, India: An Application of Digital Shoreline Analysis System (DSAS). Ann. GIS 2020, 26, 361–376. [Google Scholar]


| Year | Spatial Resolution (cm/pixel) | Number of Images Composing the Series | Type | Flight Date |
|---|---|---|---|---|
| 1945 | 1000 cm/pixel | 1 | Scanned Black and White Aerial photograph | May 1945 |
| 1957 | 200 cm/pixel | 6 | Scanned black and white aerial photograph | April 1957 |
| 1969 | 50 cm/pixel | 12 | Scanned black and white aerial photograph | April 1969 |
| 1977 | 50 cm/pixel | 5 | Scanned black and white aerial photograph | January 1977 |
| 1995 | 50 cm/pixel | 9 | Scanned black and white aerial photograph | April 1995 |
| 2015 | 25 cm/pixel | 1 | Orthophoto | April 2015 |
| 2019 | 10 cm/pixel | 9 | Drone Images | July 2019 |
Publisher’s Note: MDPI stays neutral with regard to jurisdictional claims in published maps and institutional affiliations. |
© 2022 by the authors. Licensee MDPI, Basel, Switzerland. This article is an open access article distributed under the terms and conditions of the Creative Commons Attribution (CC BY) license (https://creativecommons.org/licenses/by/4.0/).
Share and Cite
Topel, E.; Lehahn, Y. Long-Term Loss of Coral Reef in the Gulf of Aqaba Estimated from Historical Aerial Images. Remote Sens. 2022, 14, 6305. https://doi.org/10.3390/rs14246305
Topel E, Lehahn Y. Long-Term Loss of Coral Reef in the Gulf of Aqaba Estimated from Historical Aerial Images. Remote Sensing. 2022; 14(24):6305. https://doi.org/10.3390/rs14246305
Chicago/Turabian StyleTopel, Elad, and Yoav Lehahn. 2022. "Long-Term Loss of Coral Reef in the Gulf of Aqaba Estimated from Historical Aerial Images" Remote Sensing 14, no. 24: 6305. https://doi.org/10.3390/rs14246305