
War Related Building Damage Assessment in Kyiv, Ukraine, Using Sentinel-1 Radar and Sentinel-2 Optical Images


Abstract
:
1. Introduction
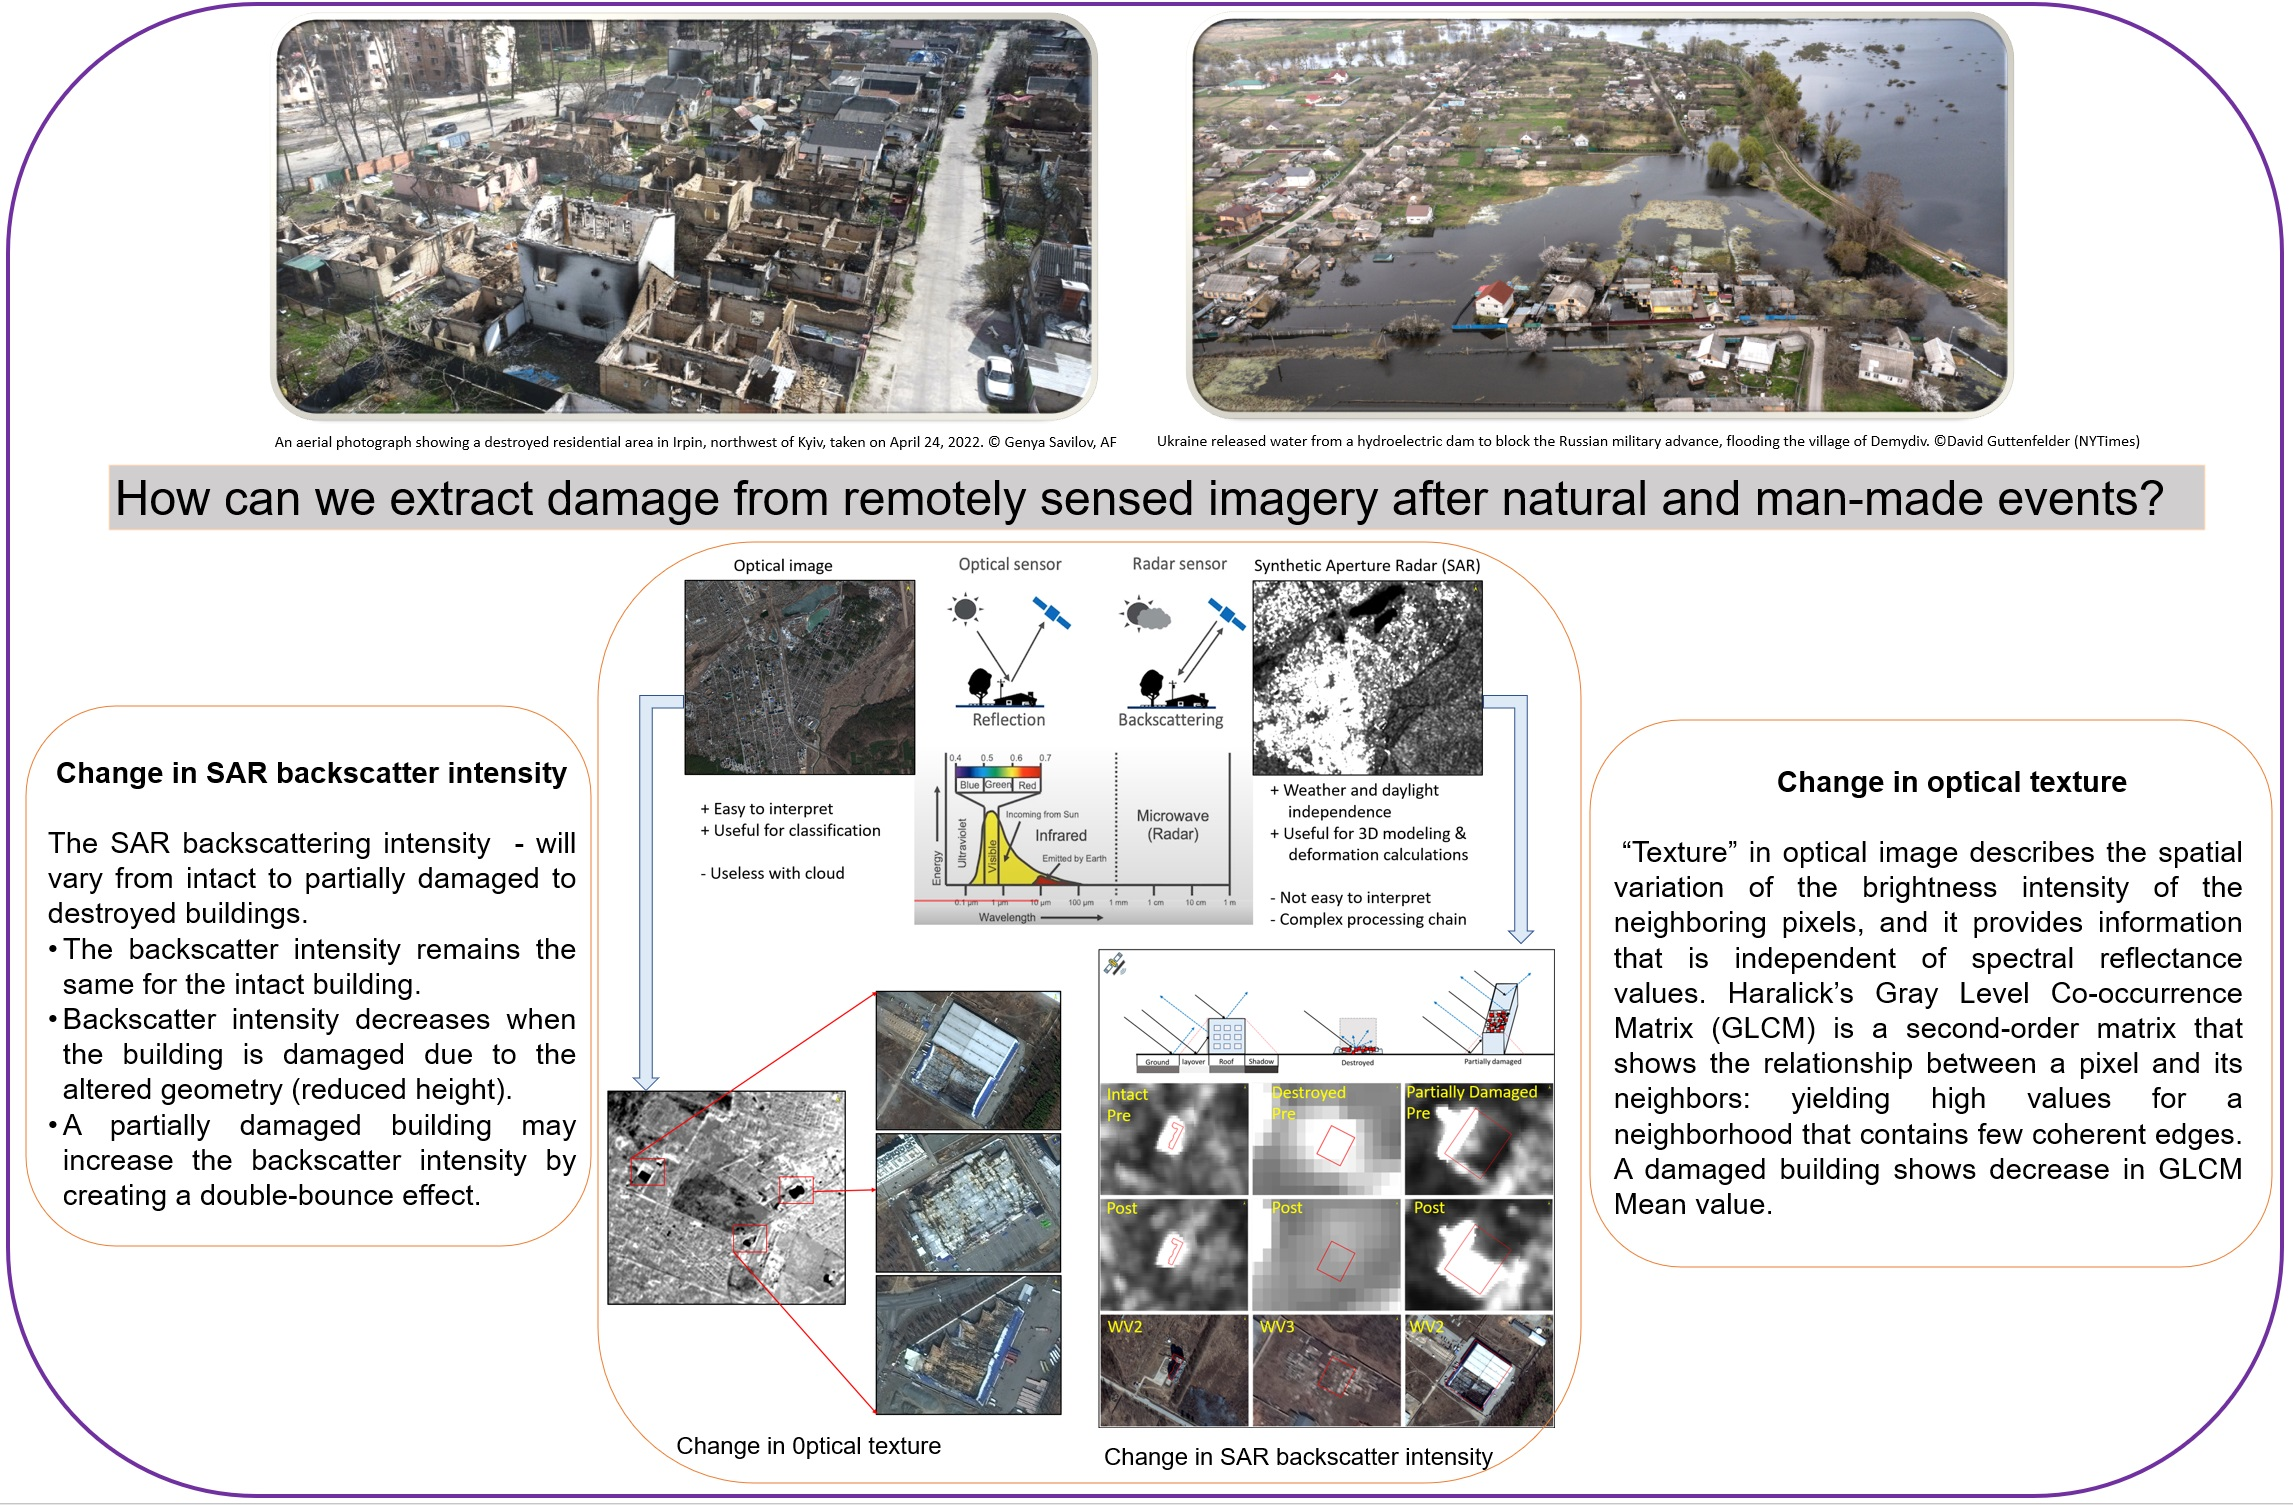
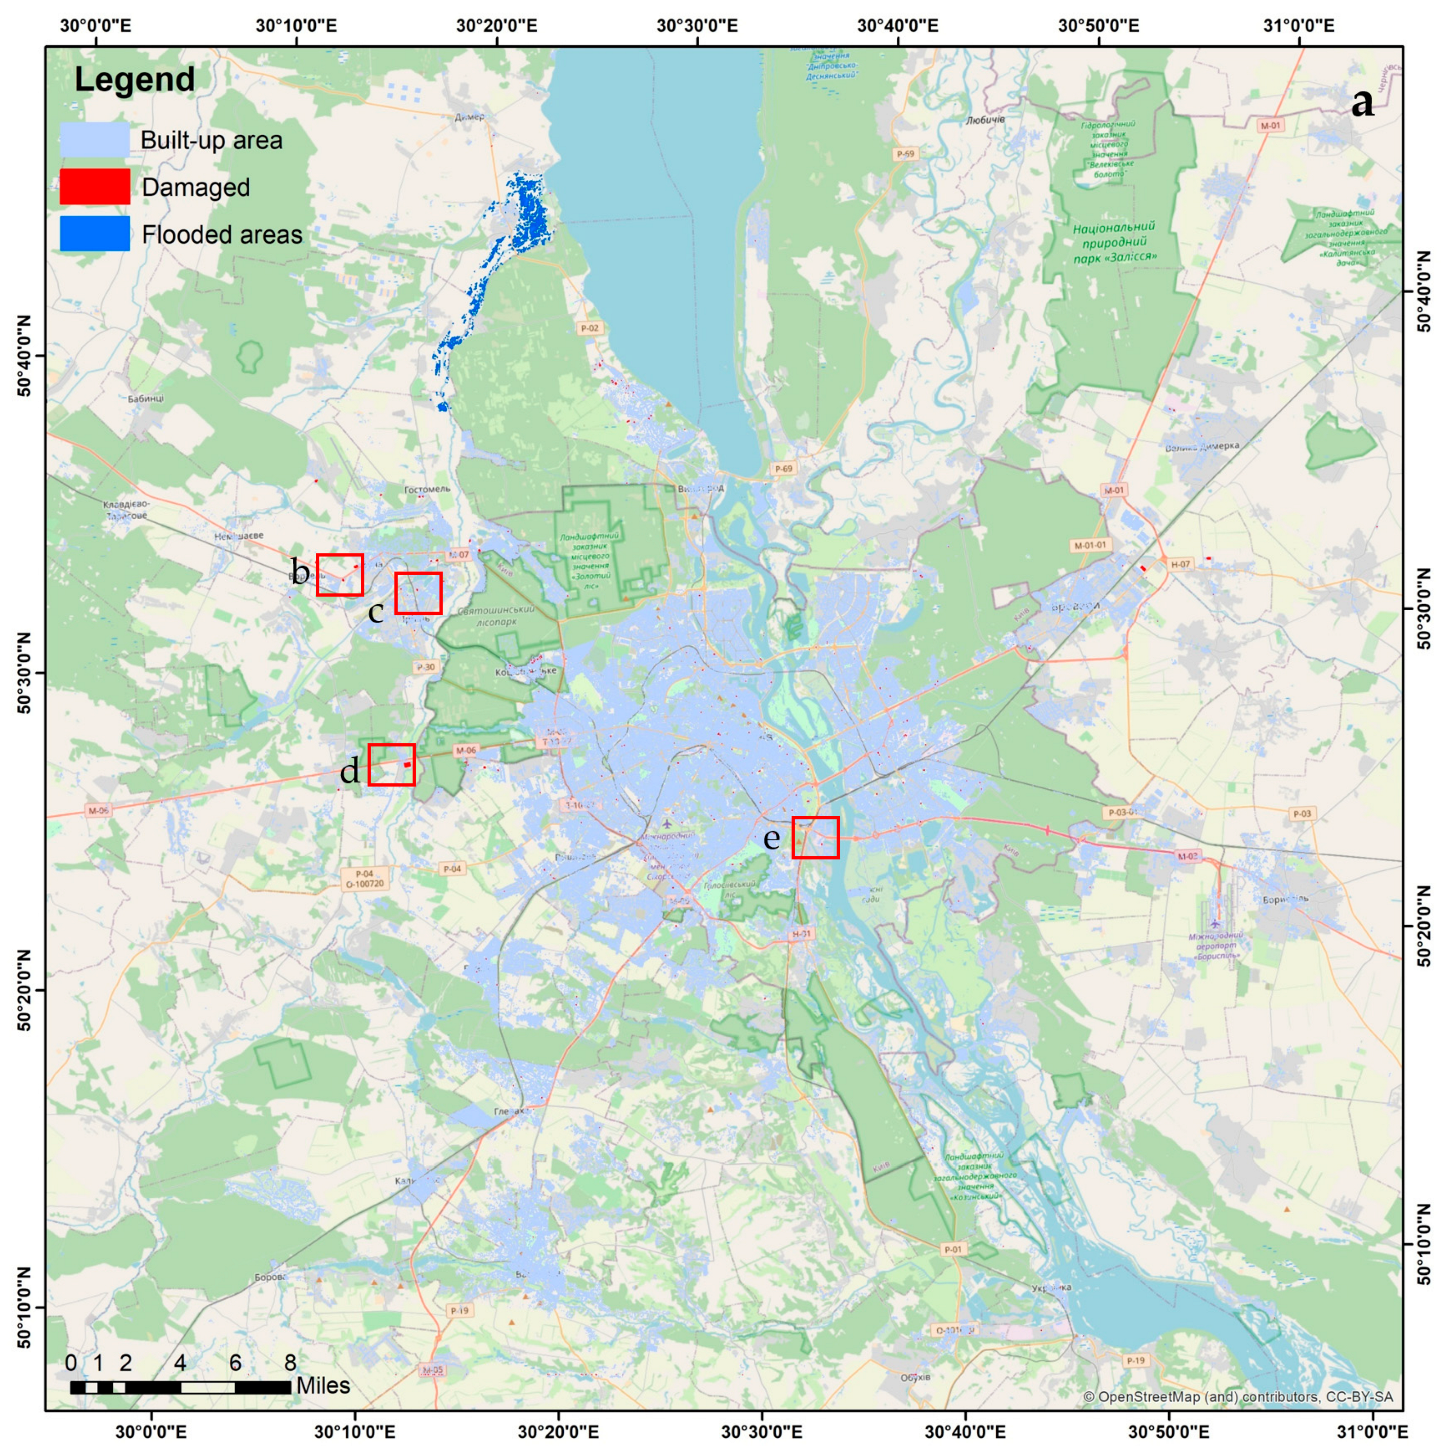
2. Study Area and Data Sets
2.1. Sentinel-1 and Sentinel-2 Data
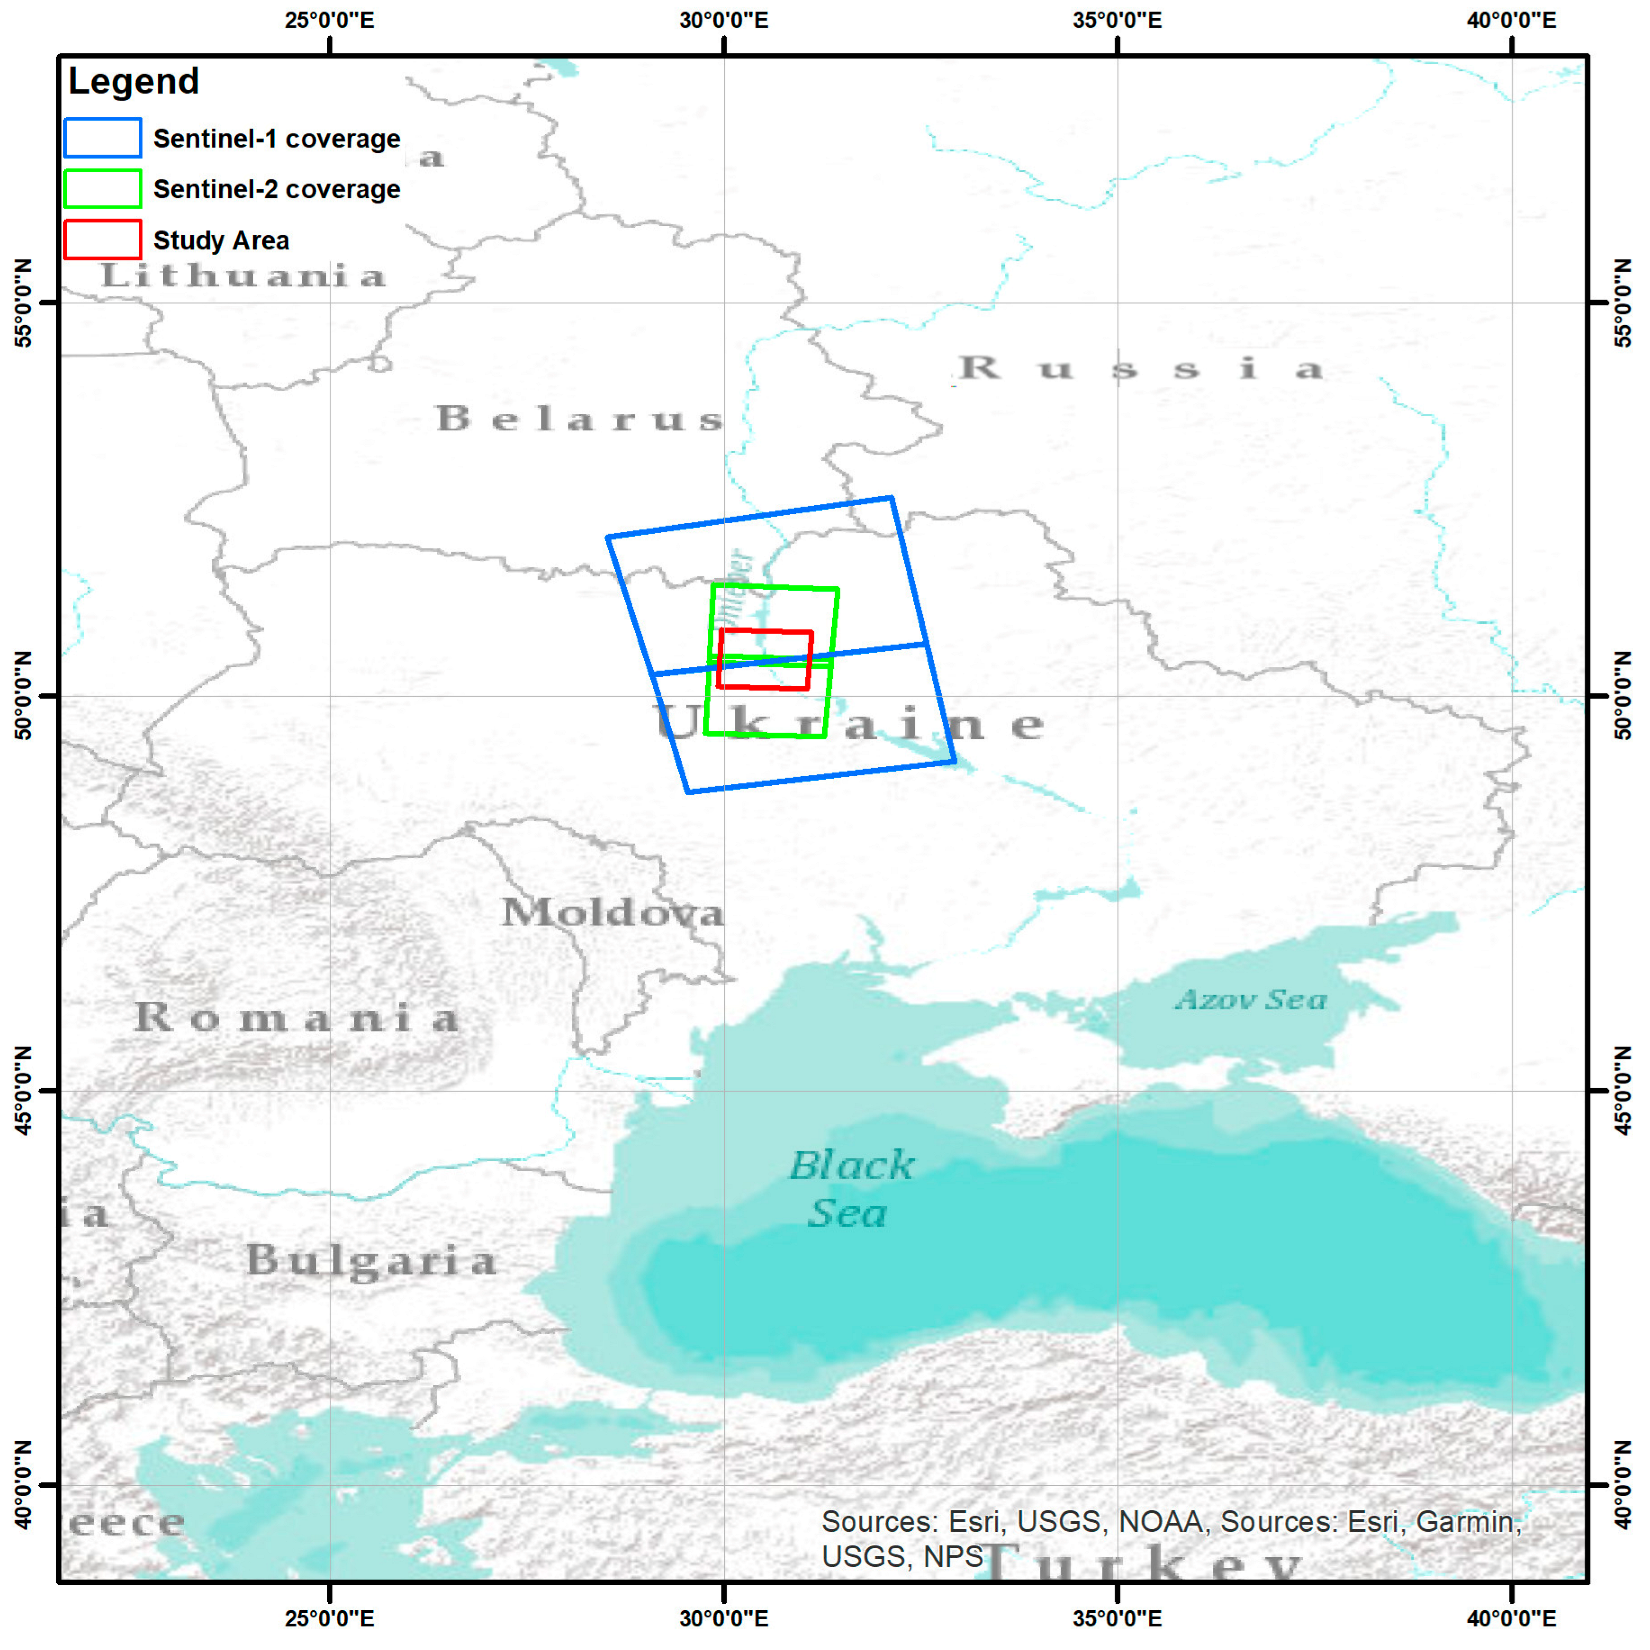
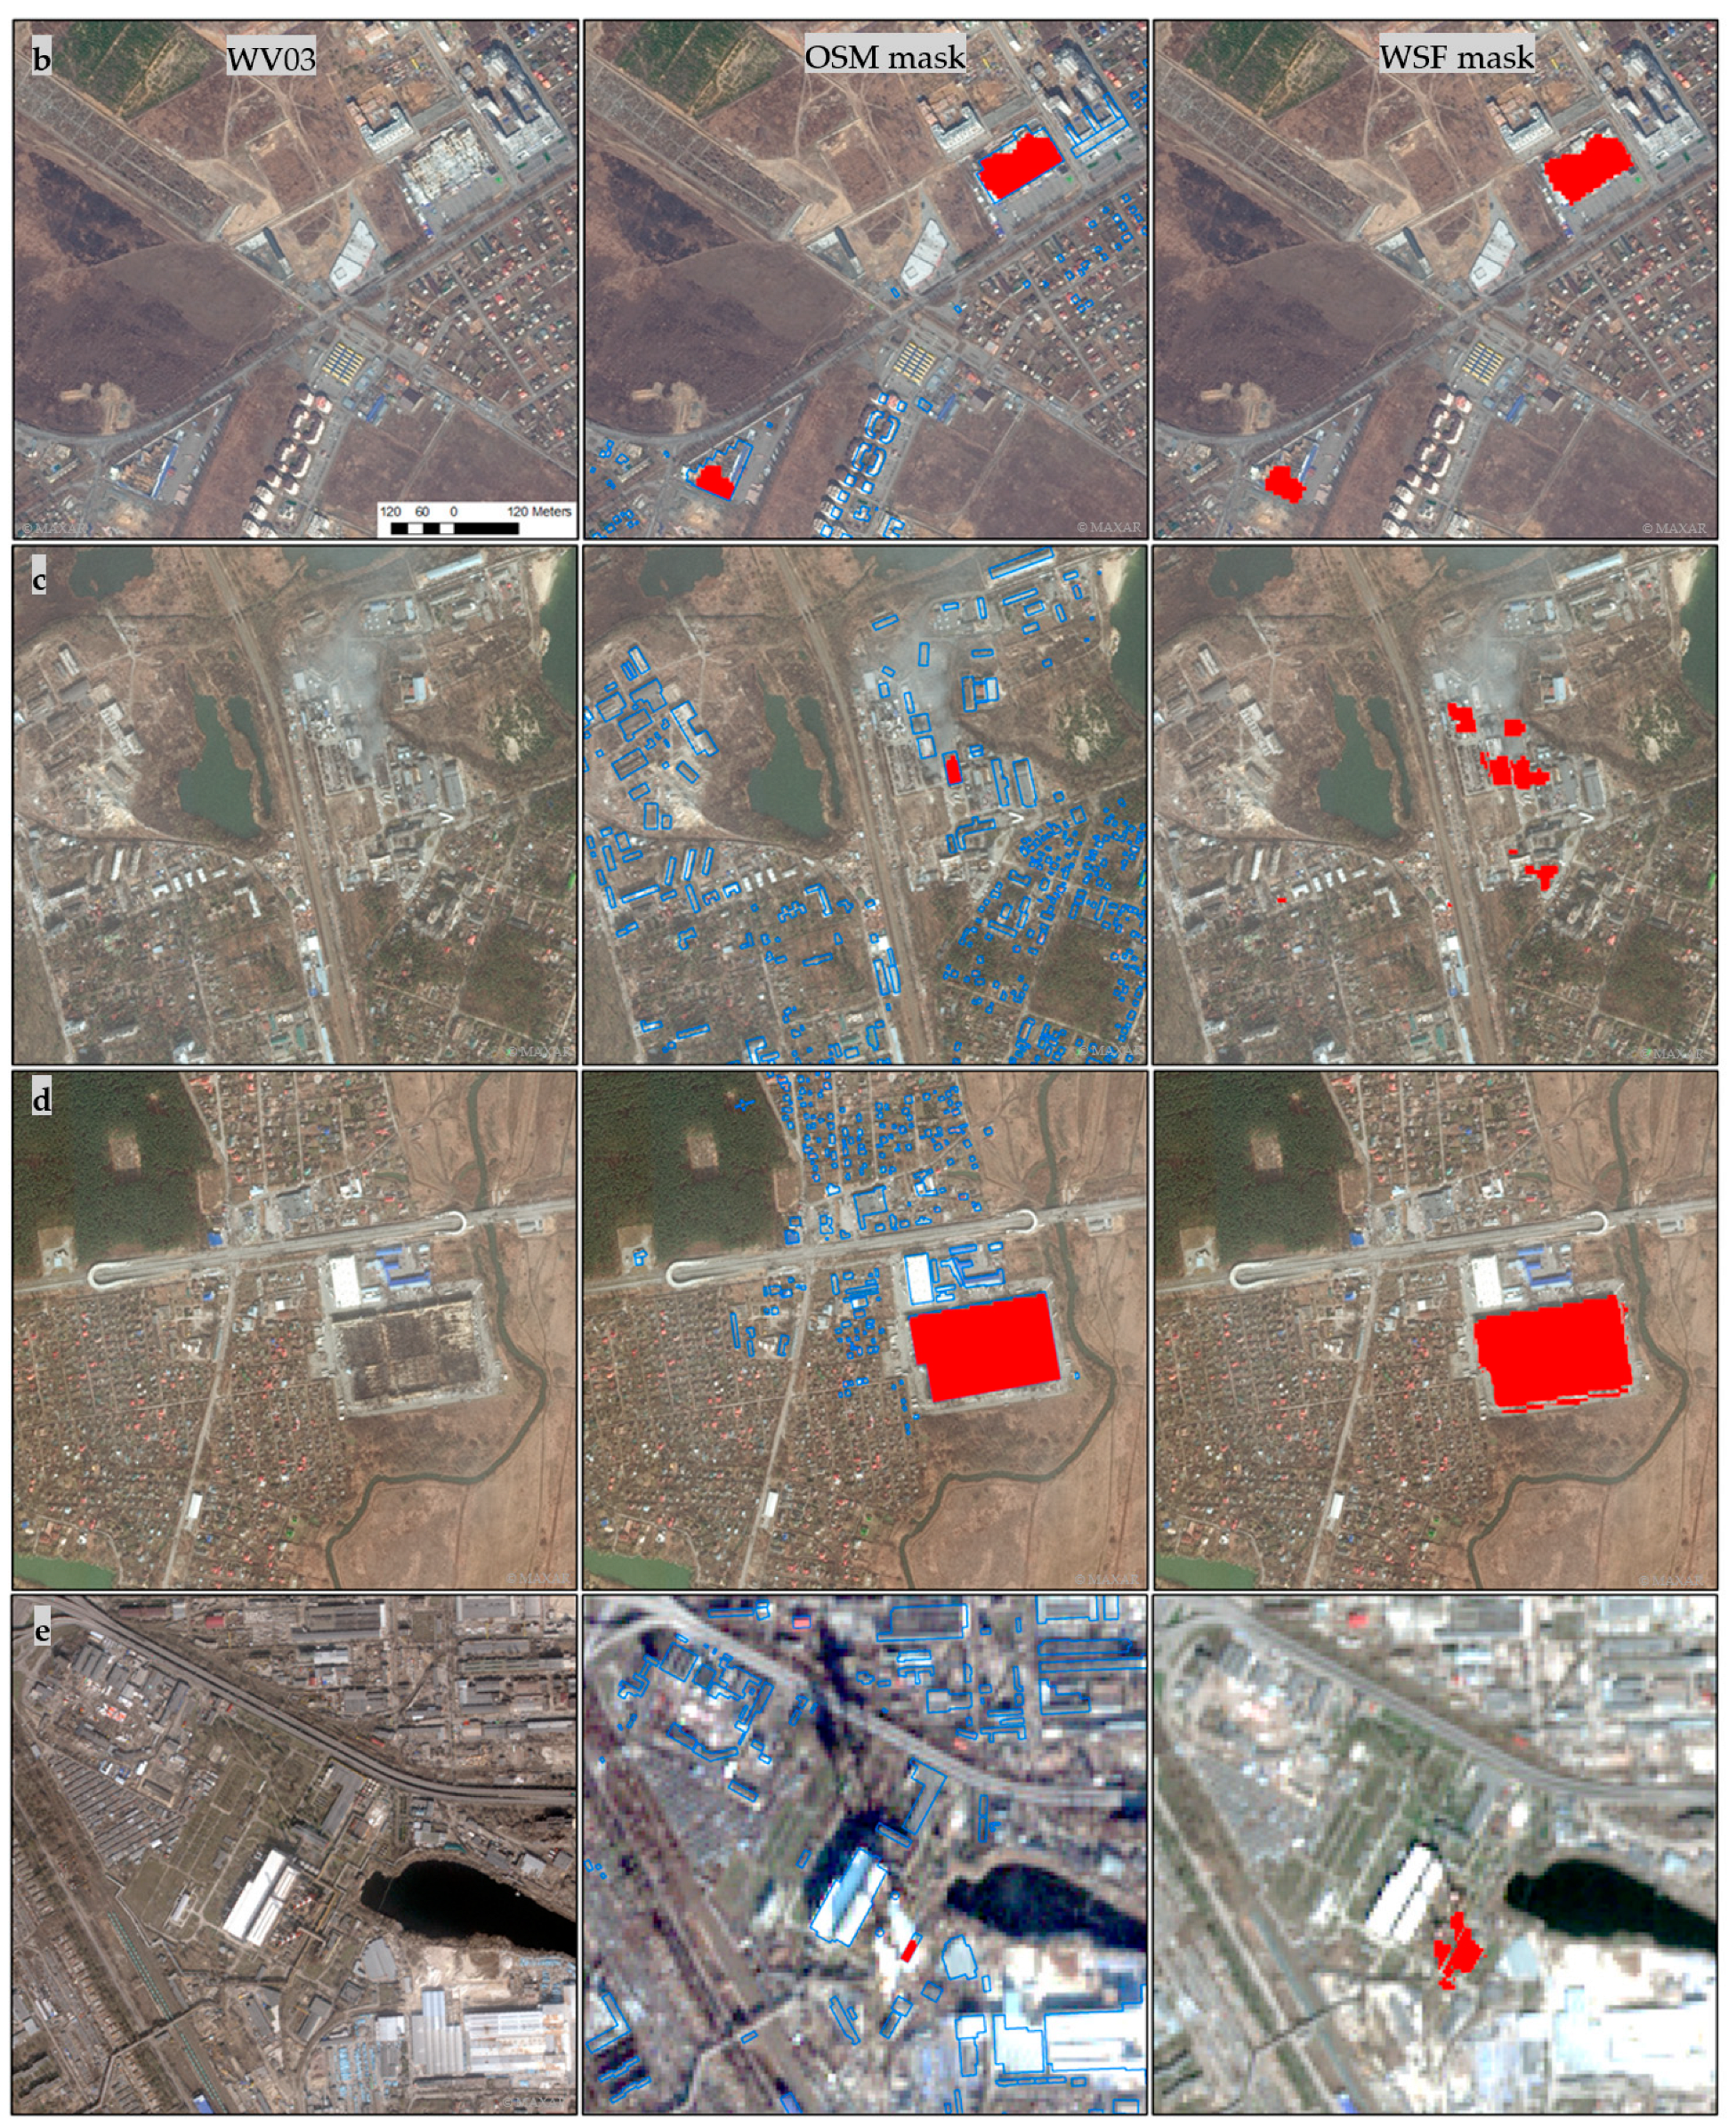
2.2. Reference Data
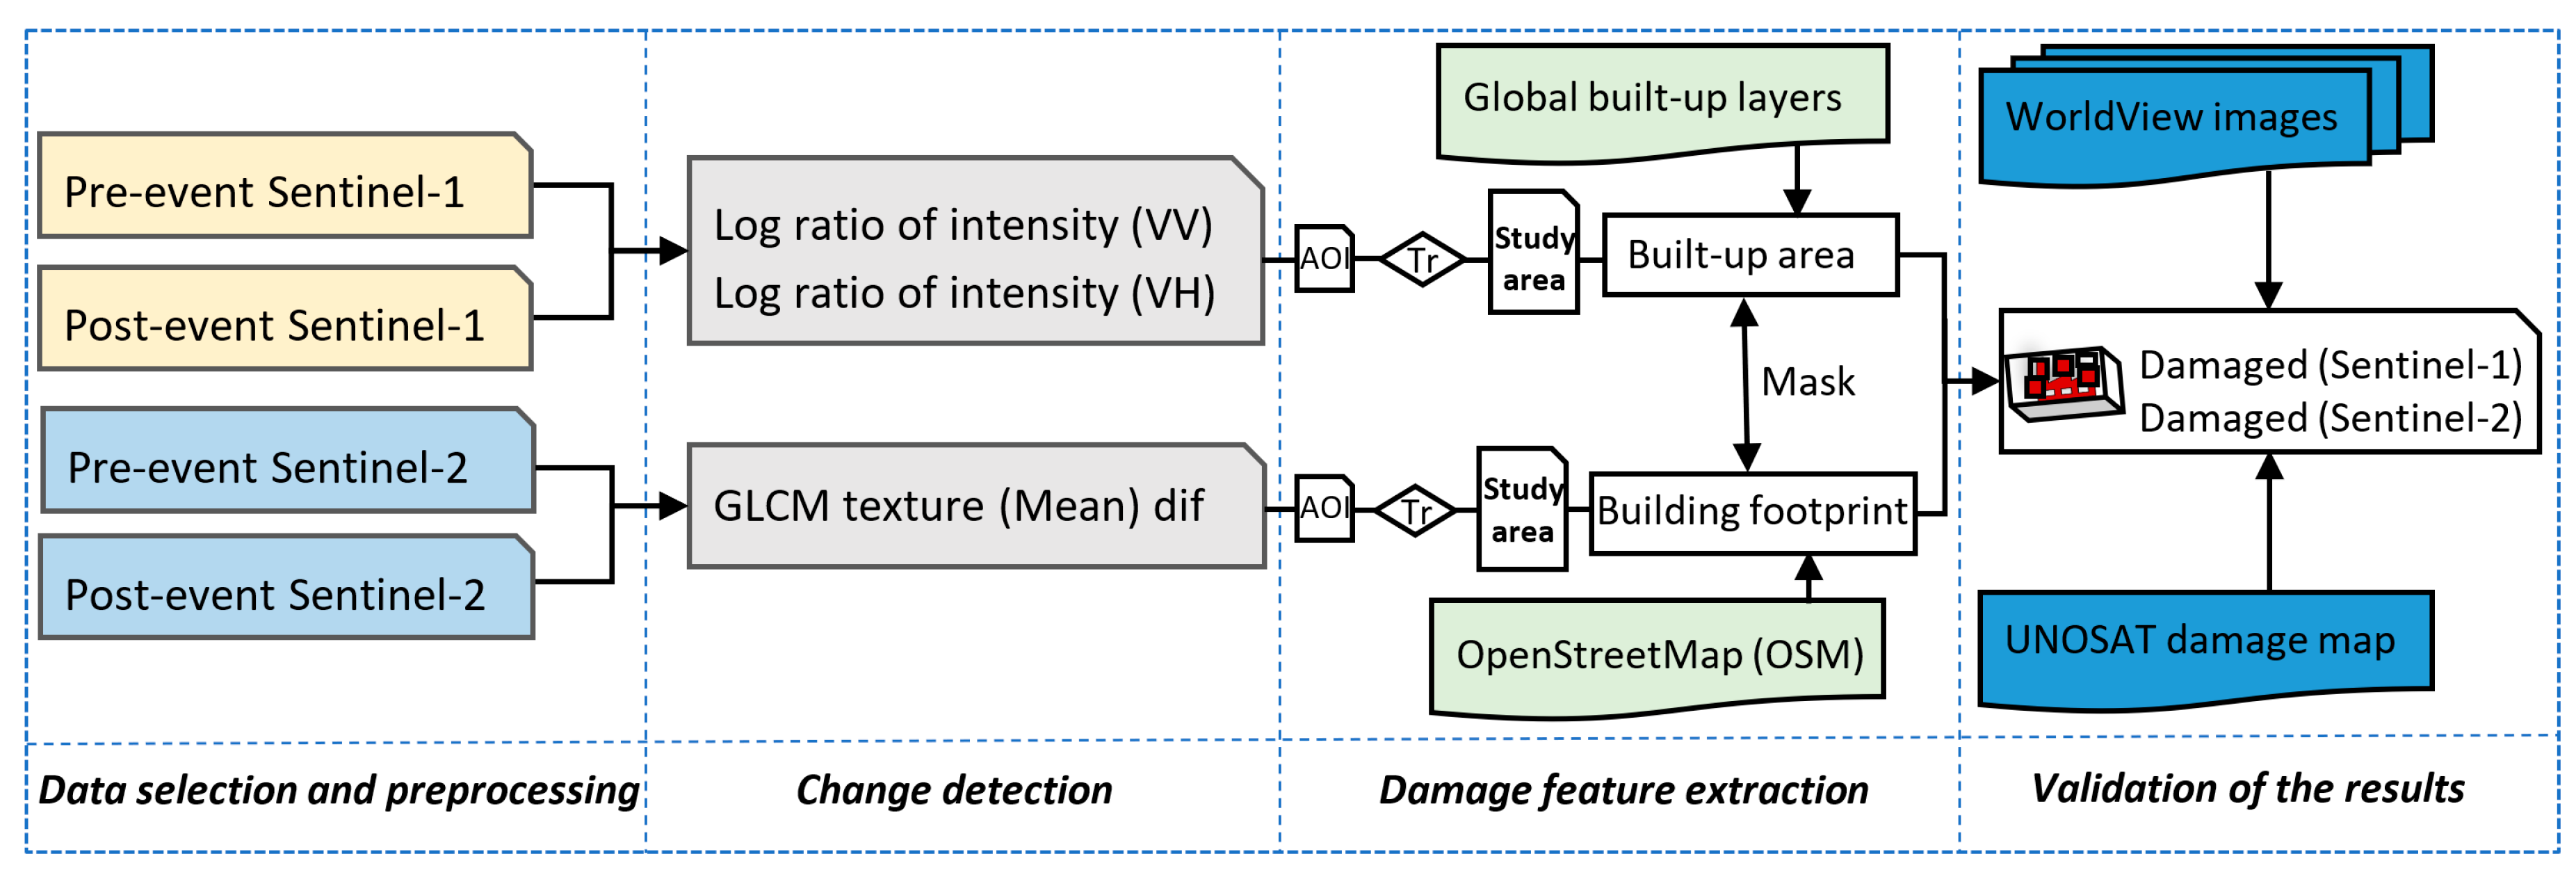
3. Methods
3.1. Image Pre-Processing
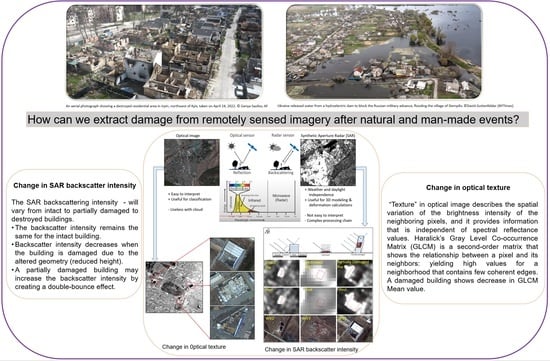
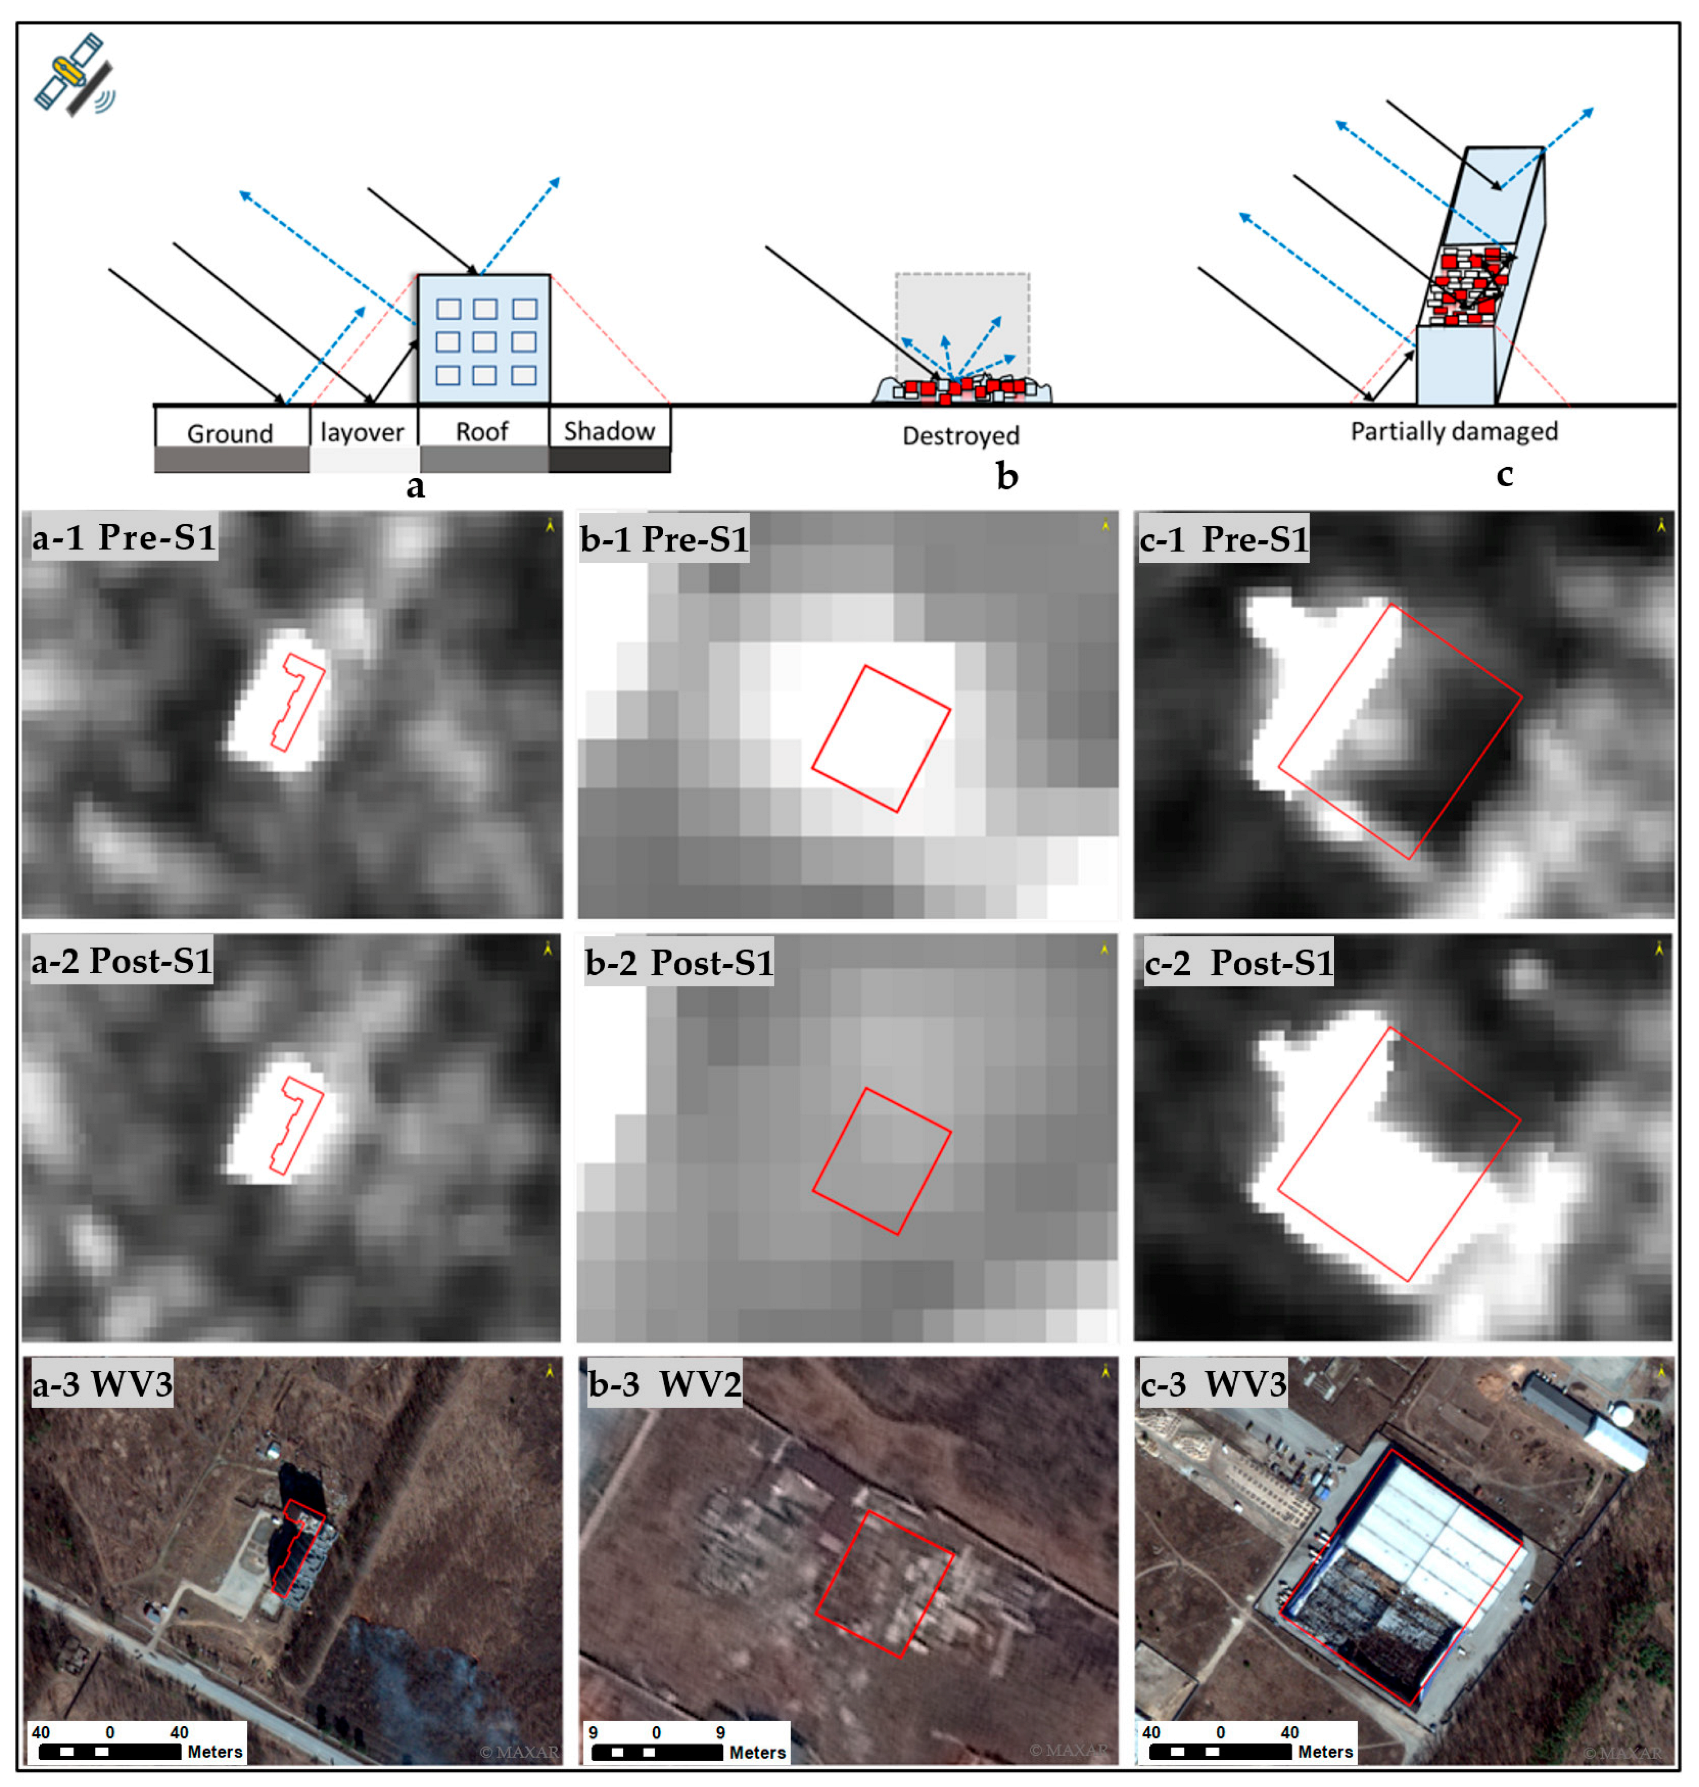
3.2. SAR Intensity Analysis
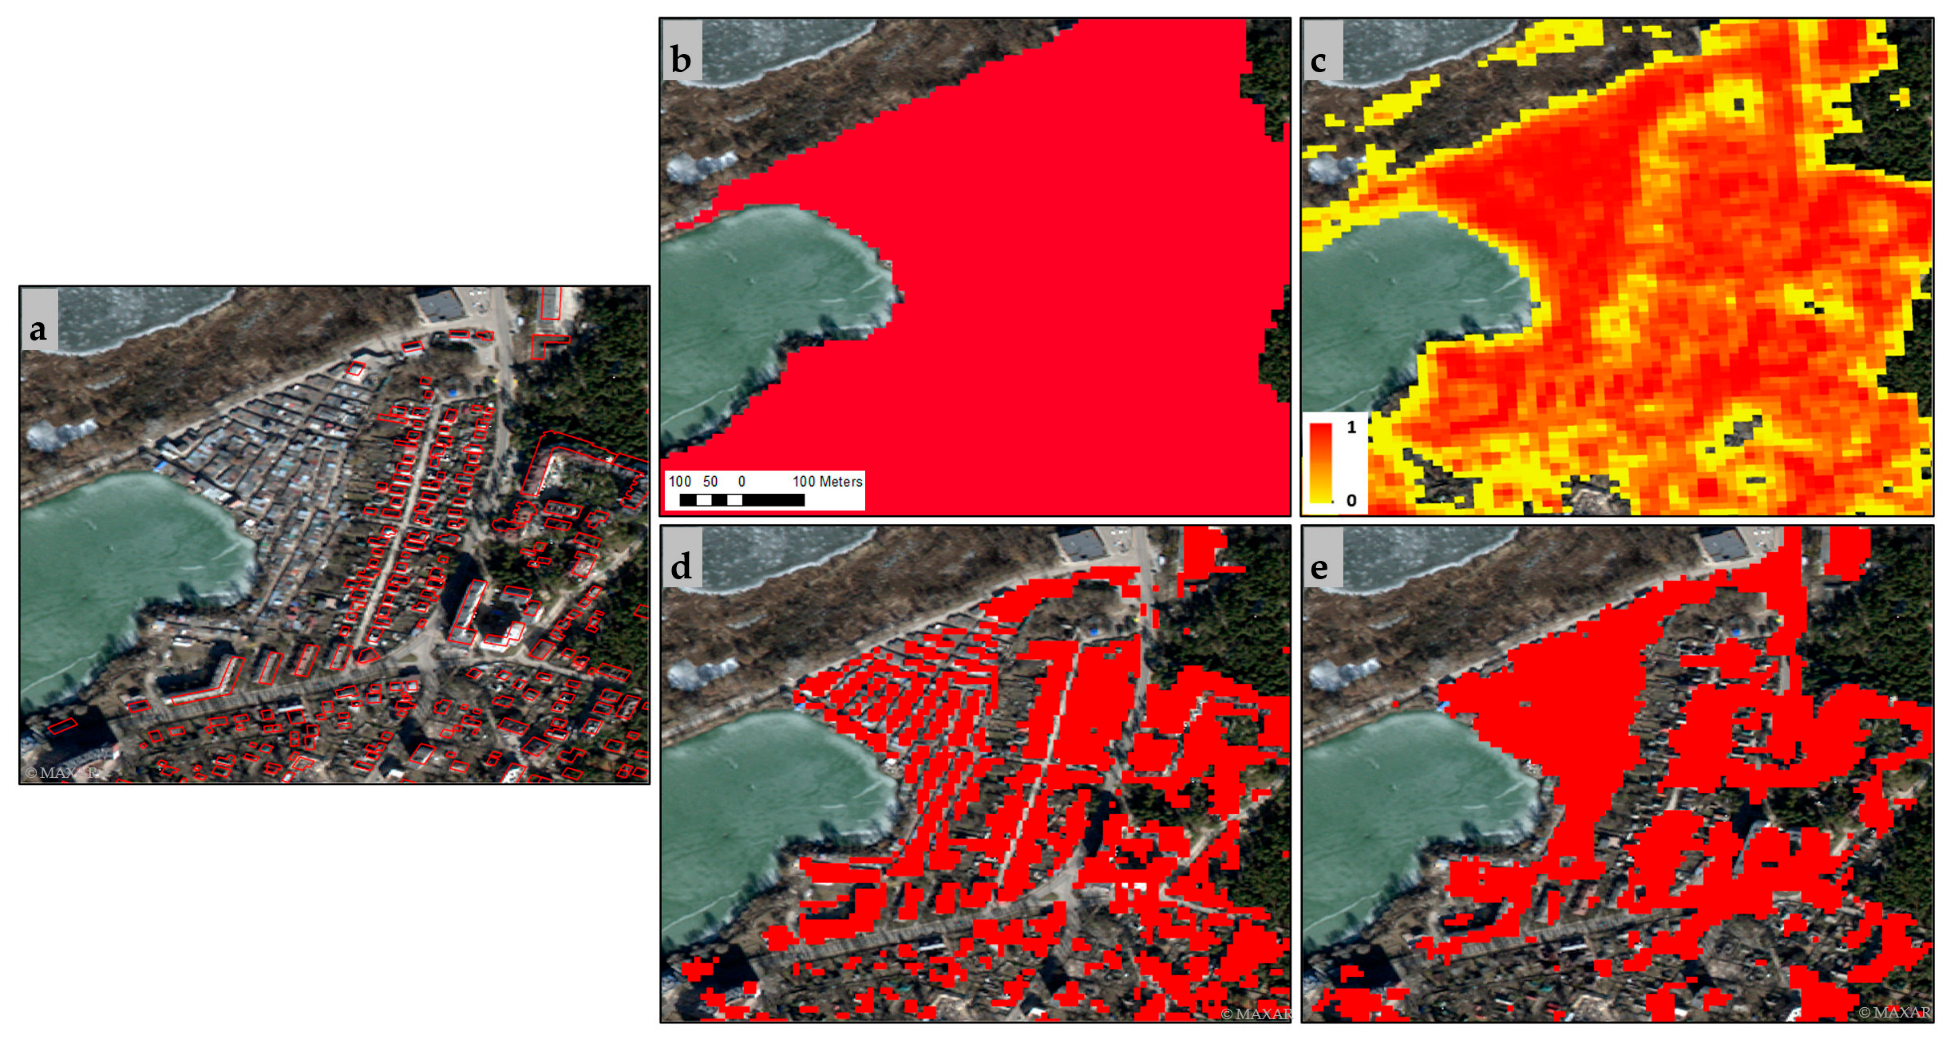
3.3. Optical Texture Analysis
4. Results
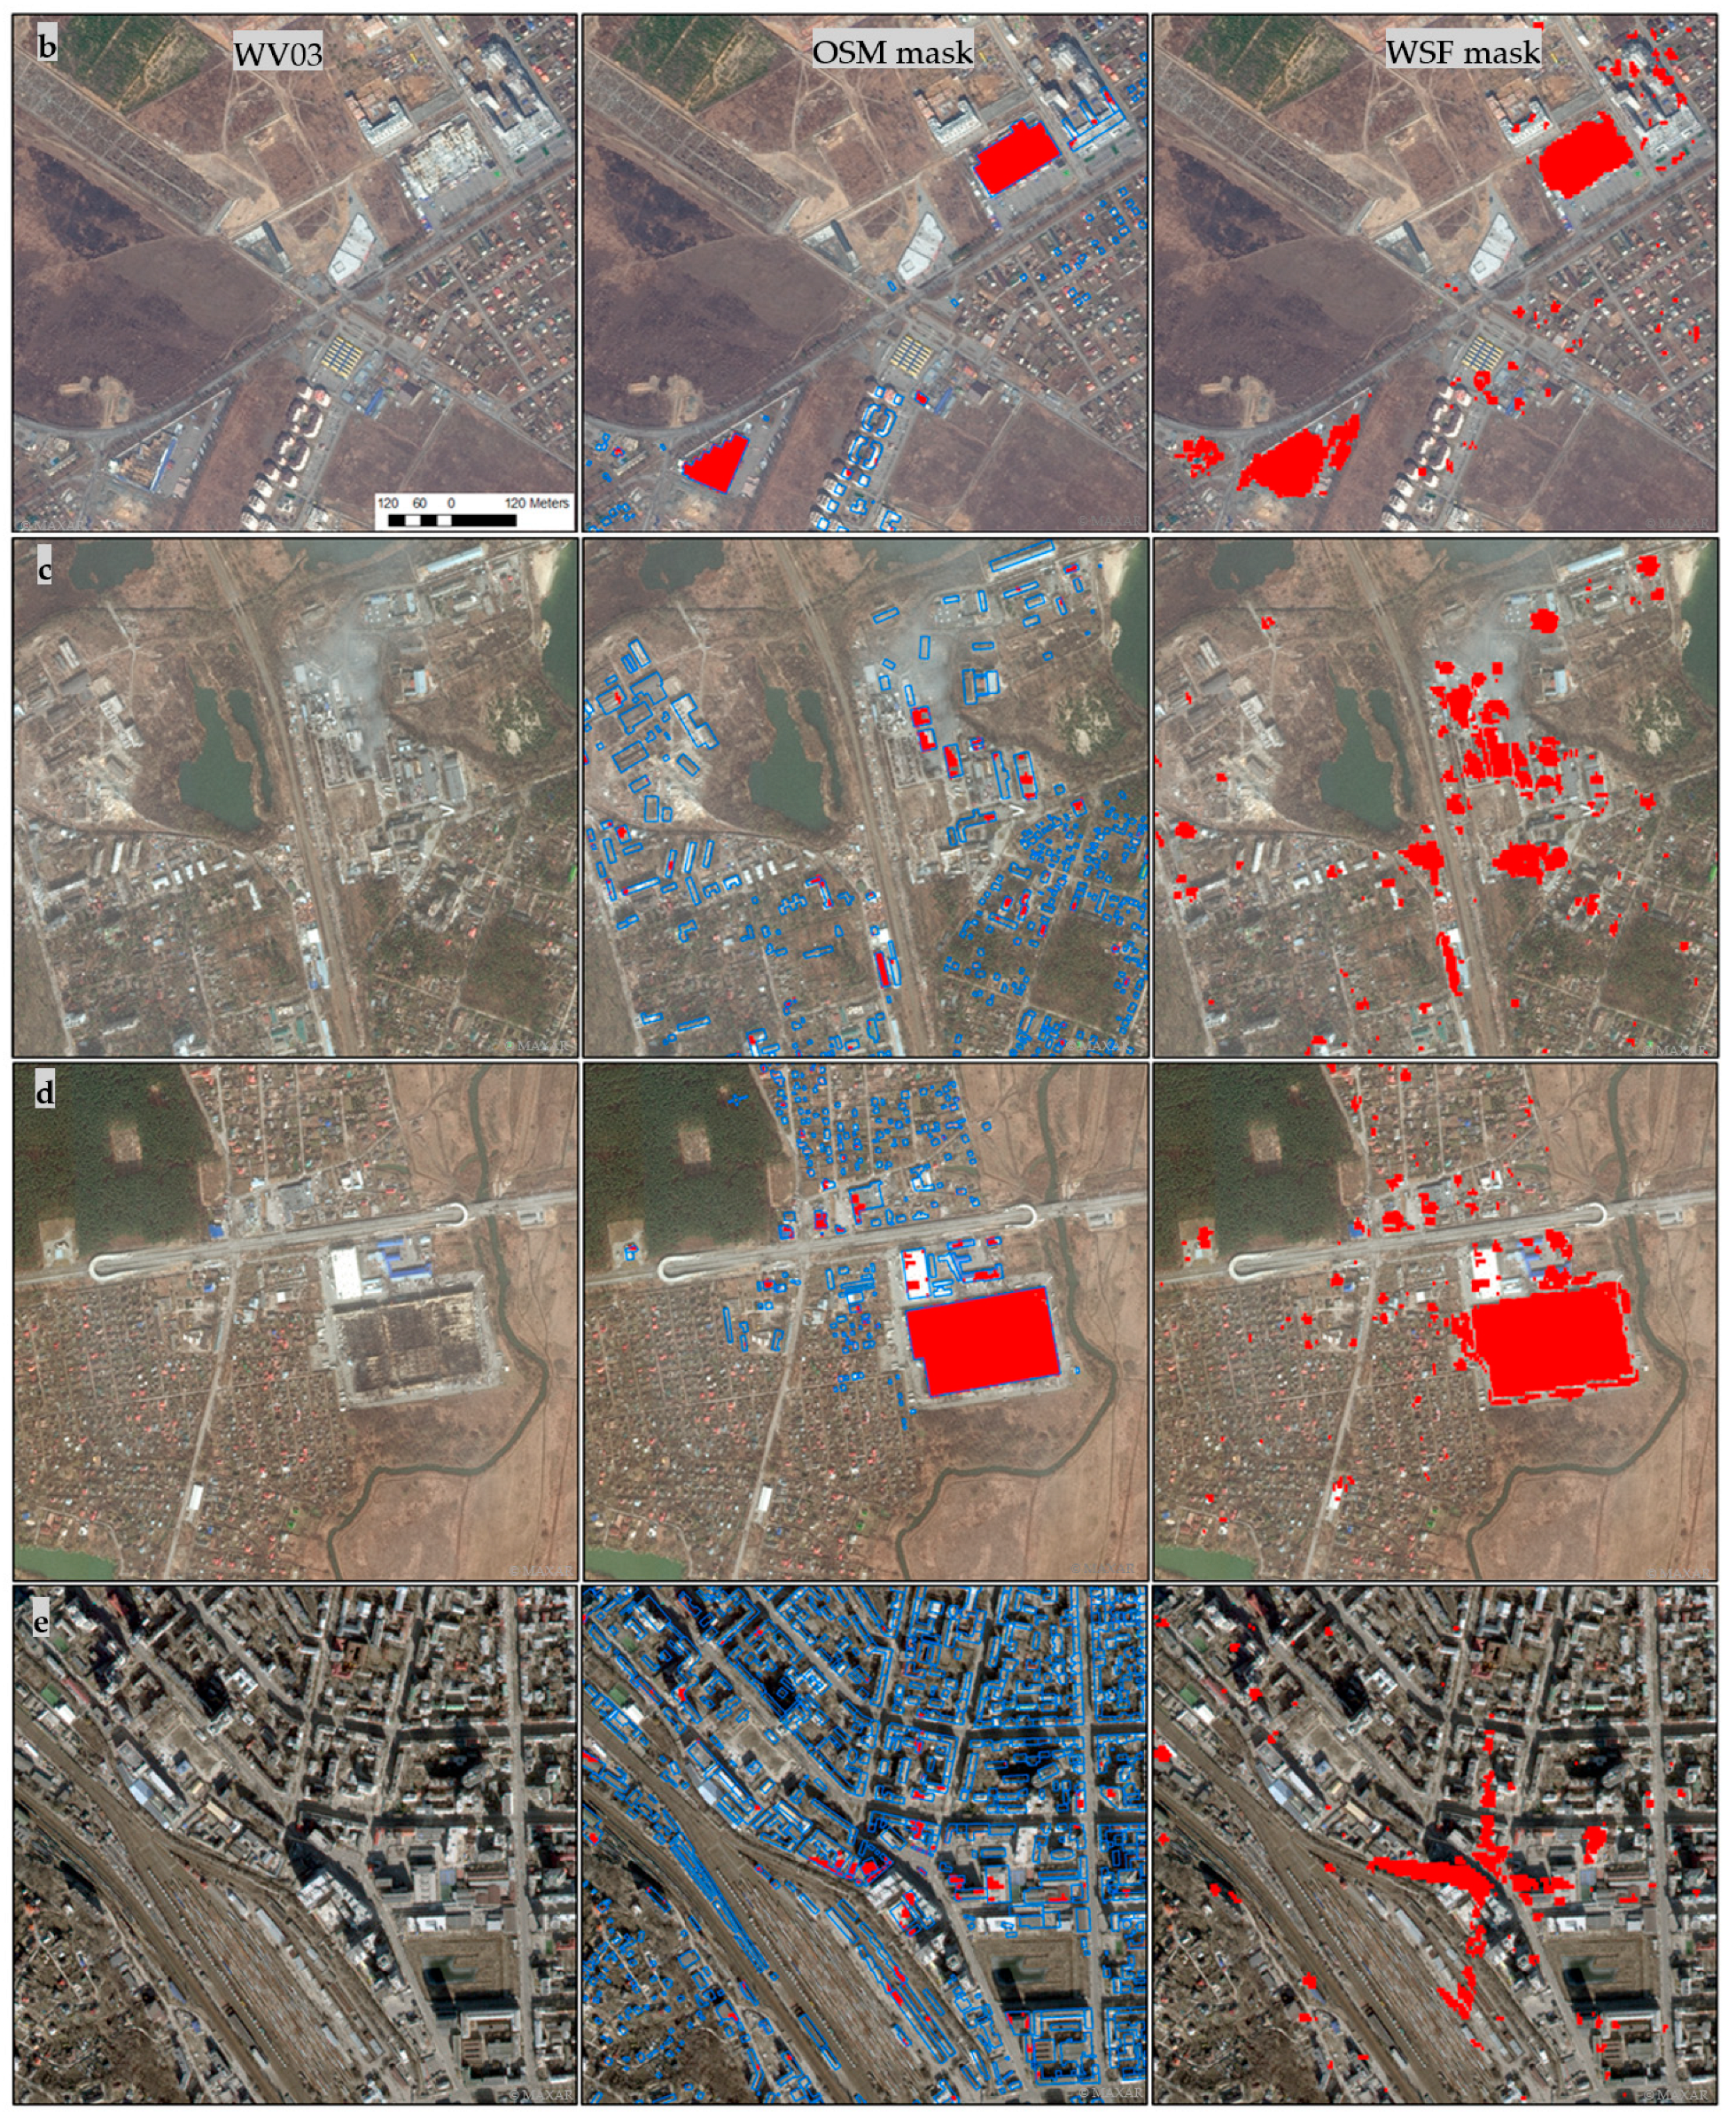
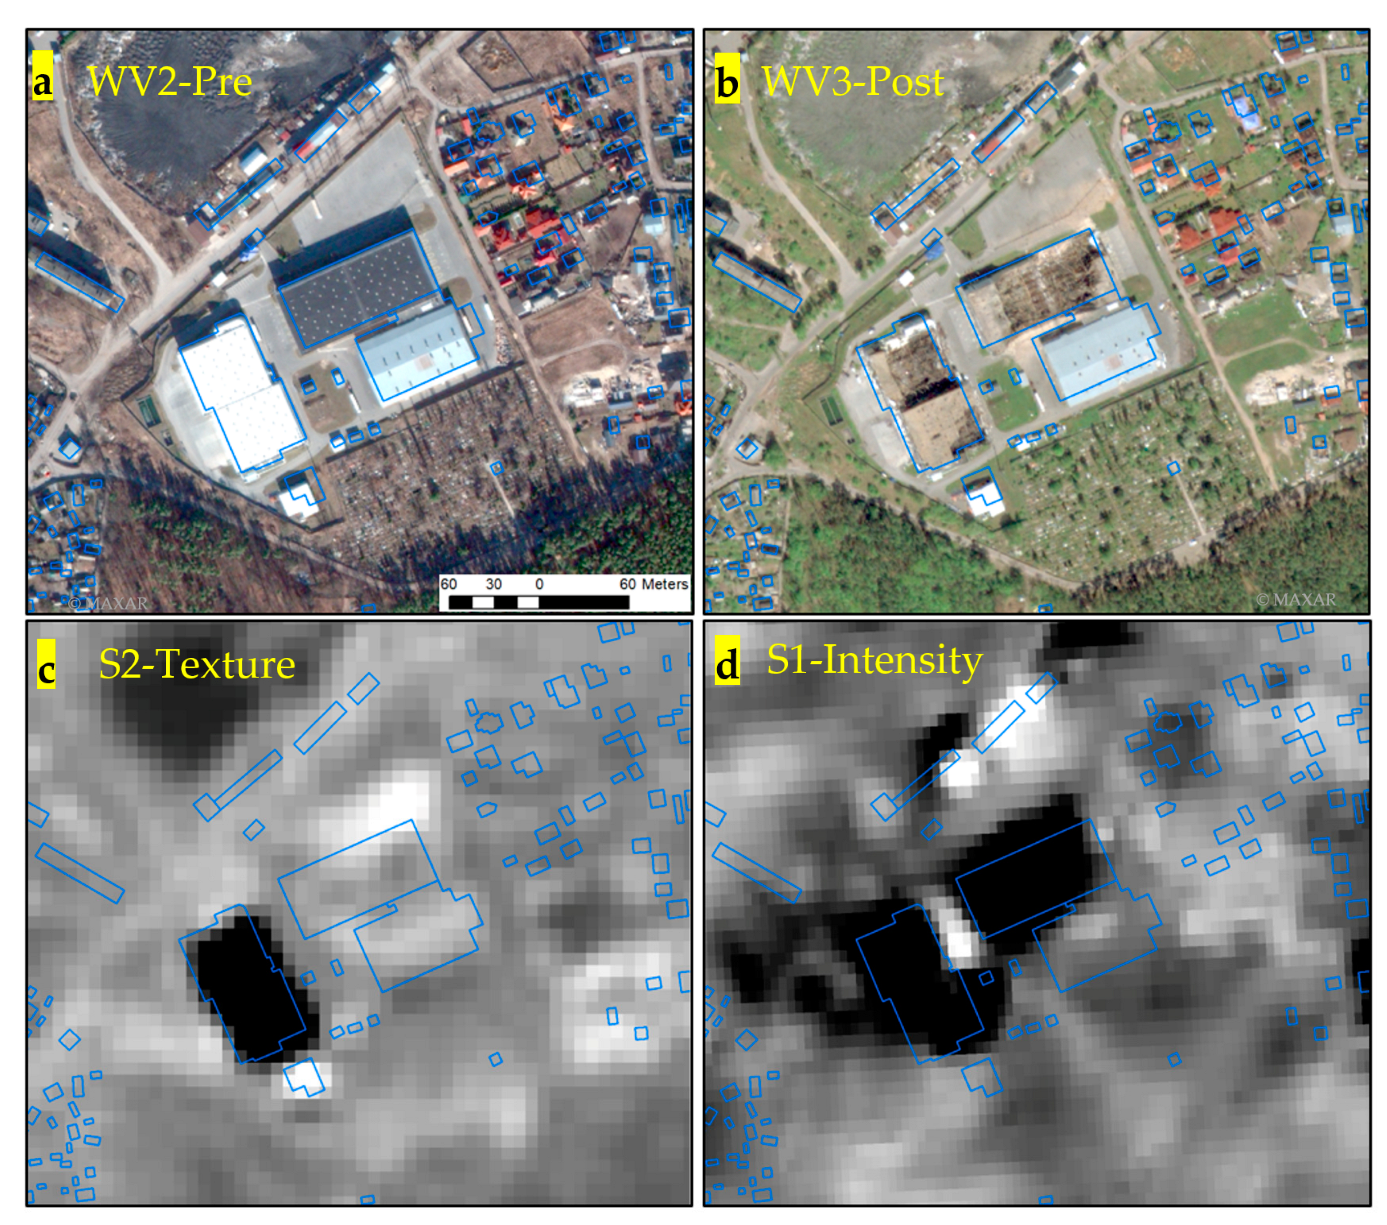
4.1. Damage Assessment Using Sentinel-1
4.2. Damage Assessment Using Sentinel-2
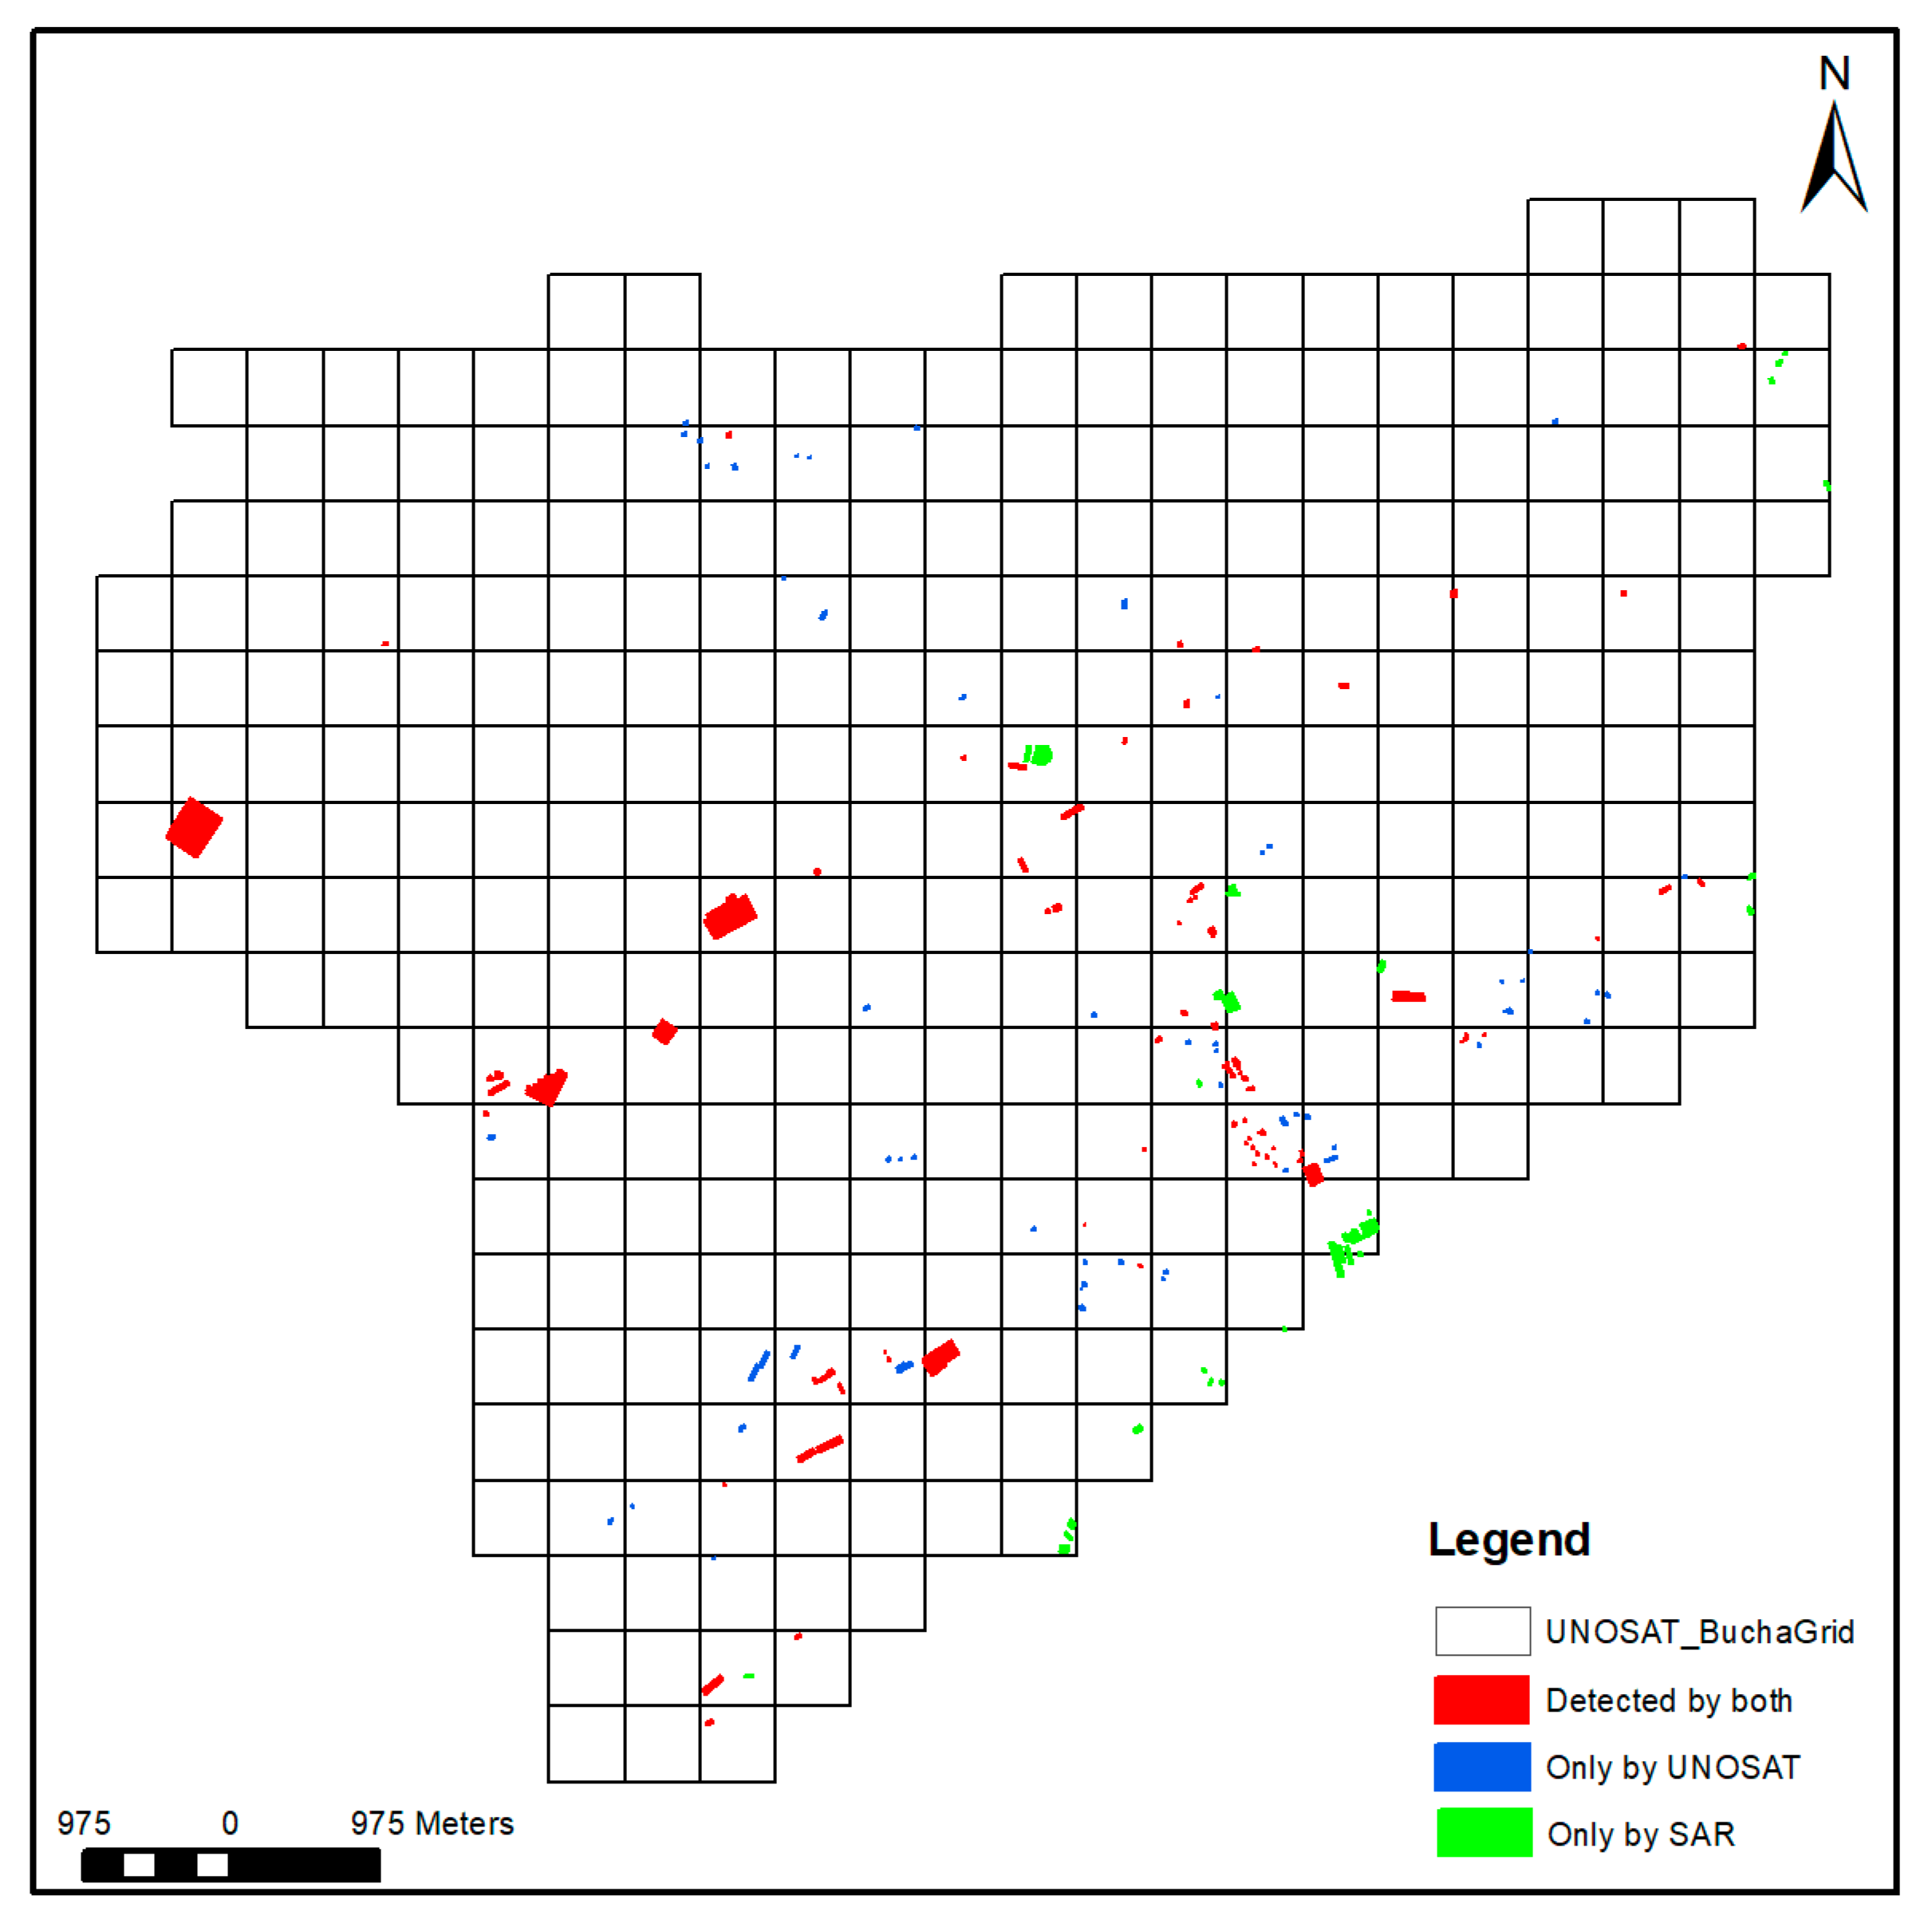
4.3. Quantitative Comparison between the UNOSAT Damage Assesment and Sentinel-1 Intensity Results
5. Discussion
6. Conclusions
Author Contributions
Funding
Data Availability Statement
Acknowledgments
Conflicts of Interest
References
- Yusuf, Y.; Matsuoka, M.; Yamazaki, F. Damage assessment after 2001 Gujarat earthquake using Landsat-7 satellite images. J. Indian Soc. Remote Sens. 2001, 29, 17–22. [Google Scholar] [CrossRef]
- Kohiyama, M.; Yamazaki, F. Damage Detection for 2003 Bam, Iran, Earthquake Using Terra-ASTER Satellite Imagery. Earthq. Spectra 2005, 21, 267–274. [Google Scholar] [CrossRef]
- Moya, L.; Muhari, A.; Adriano, B.; Koshimura, S.; Mas, E.; Marval-Perez, L.R.; Yokoya, N. Detecting urban changes using phase correlation and ℓ1-based sparse model for early disaster response: A case study of the 2018 Sulawesi Indonesia earthquake-tsunami. Remote Sens. Environ. 2020, 242, 111743. [Google Scholar] [CrossRef]
- Tong, X.; Hong, Z.; Liu, S.; Zhang, X.; Xie, H.; Li, Z.; Yang, S.; Wang, W.; Bao, F. Building-damage detection using pre- and post-seismic high-resolution satellite stereo imagery: A case study of the May 2008 Wenchuan earthquake. ISPRS J. Photo-Gramm. Remote Sens. 2012, 68, 13–27. [Google Scholar] [CrossRef]
- Kaya, G.T.; Musaoglu, N.; Ersoy, O.K. Damage Assessment of 2010 Haiti Earthquake with Post-Earthquake Satellite Image by Support Vector Selection and Adaptation. Photogramm. Eng. Remote Sens. 2011, 77, 1025–1035. [Google Scholar] [CrossRef]
- Omarzadeh, D.; Karimzadeh, S.; Matsuoka, M.; Feizizadeh, B. Earthquake Aftermath from Very High-Resolution WorldView-2 Image and Semi-Automated Object-Based Image Analysis (Case Study: Kermanshah, Sarpol-e Zahab, Iran). Remote Sens. 2021, 13, 4272. [Google Scholar] [CrossRef]
- Miura, H.; Aridome, T.; Matsuoka, M. Deep Learning-Based Identification of Collapsed, Non-Collapsed and Blue Tarp-Covered Buildings from Post-Disaster Aerial Images. Remote Sens. 2020, 12, 1924. [Google Scholar] [CrossRef]
- Ma, H.; Liu, Y.; Ren, Y.; Yu, J. Detection of Collapsed Buildings in Post-Earthquake Remote Sensing Images Based on the Improved YOLOv3. Remote Sens. 2019, 12, 44. [Google Scholar] [CrossRef] [Green Version]
- Adriano, B.; Yokoya, N.; Xia, J.; Miura, H.; Liu, W.; Matsuoka, M.; Koshimura, S. Learning from multimodal and multitemporal earth observation data for building damage mapping. ISPRS J. Photogramm. Remote Sens. 2021, 175, 132–143. [Google Scholar] [CrossRef]
- Gupta, R.; Goodman, B.; Patel, N.; Hosfelt, R.; Sajeev, S.; Heim, E.; Doshi, J.; Lucas, K.; Choset, H.; Gaston, M. Creating XBD: A Dataset for Assessing Building Damage from Satellite Imagery. In Proceedings of the IEEE Computer Society Conference on Computer Vision and Pattern Recognition Workshops, Long Beach, CA, USA, 16–17 June 2019. [Google Scholar]
- Lam, D.; Kuzma, R.; McGee, K.; Dooley, S.; Laielli, M.; Klaric, M.K.; Bulatov, Y.; McCord, B. XView: Objects in Context in Overhead Imagery. arXiv 2018, arXiv:1802.07856. [Google Scholar]
- Wu, C.; Zhang, F.; Xia, J.; Xu, Y.; Li, G.; Xie, J.; Du, Z.; Liu, R. Building Damage Detection Using U-Net with Attention Mechanism from Pre- and Post-Disaster Remote Sensing Datasets. Remote Sens. 2021, 13, 905. [Google Scholar] [CrossRef]
- Berezina, P.; Liu, D. Hurricane damage assessment using coupled convolutional neural networks: A case study of hurricane Michael. Geomat. Nat. Hazards Risk 2022, 13, 414–431. [Google Scholar] [CrossRef]
- Tilon, S.; Nex, F.; Kerle, N.; Vosselman, G. Post-Disaster Building Damage Detection from Earth Observation Imagery using Unsupervised and Transferable Anomaly Detecting Generative Adversarial Networks. Remote Sens. 2020, 12, 4193. [Google Scholar] [CrossRef]
- Uprety, P.; Yamazaki, F.; Dell’Acqua, F. Damage Detection Using High-Resolution SAR Imagery in the 2009 L’Aquila, Italy, Earthquake. Earthq. Spectra 2013, 29, 1521–1535. [Google Scholar] [CrossRef] [Green Version]
- Yun, S.-H.; Hudnut, K.; Owen, S.; Webb, F.; Simons, M.; Sacco, P.; Gurrola, E.; Manipon, G.; Liang, C.; Fielding, E.; et al. Rapid Damage Mapping for the 2015 Mw 7.8 Gorkha Earthquake Using Synthetic Aperture Radar Data from COSMO–SkyMed and ALOS-2 Satellites. Seism. Res. Lett. 2015, 86, 1549–1556. [Google Scholar] [CrossRef] [Green Version]
- Park, S.-E.; Jung, Y.T. Detection of Earthquake-Induced Building Damages Using Polarimetric SAR Data. Remote Sens. 2020, 12, 137. [Google Scholar] [CrossRef] [Green Version]
- Chen, Q.; Yang, H.; Li, L.; Liu, X. A Novel Statistical Texture Feature for SAR Building Damage Assessment in Different Polarization Modes. IEEE J. Sel. Top. Appl. Earth Obs. Remote Sens. 2019, 13, 154–165. [Google Scholar] [CrossRef]
- Endo, Y.; Adriano, B.; Mas, E.; Koshimura, S. New Insights into Multiclass Damage Classification of Tsunami-Induced Building Damage from SAR Images. Remote Sens. 2018, 10, 2059. [Google Scholar] [CrossRef] [Green Version]
- Brunner, D.; Lemoine, G.; Bruzzone, L. Earthquake Damage Assessment of Buildings Using VHR Optical and SAR Imagery. IEEE Trans. Geosci. Remote Sens. 2010, 48, 2403–2420. [Google Scholar] [CrossRef] [Green Version]
- Putri, A.F.S.; Widyatmanti, W.; Umarhadi, D.A. Sentinel-1 and Sentinel-2 data fusion to distinguish building damage level of the 2018 Lombok Earthquake. Remote Sens. Appl. Soc. Environ. 2022, 26, 100724. [Google Scholar] [CrossRef]
- Adriano, B.; Xia, J.; Baier, G.; Yokoya, N.; Koshimura, S. Multi-Source Data Fusion Based on Ensemble Learning for Rapid Building Damage Mapping during the 2018 Sulawesi Earthquake and Tsunami in Palu, Indonesia. Remote Sens. 2019, 11, 886. [Google Scholar] [CrossRef]
- Dell’Acqua, F.; Gamba, P. Remote Sensing and Earthquake Damage Assessment: Experiences, Limits, and Perspectives. Proc. IEEE 2012, 100, 2876–2890. [Google Scholar] [CrossRef]
- Lee, J.; Xu, J.Z.; Sohn, K.; Lu, W.; Berthelot, D.; Gur, I.; Khaitan, P.; Huang, K.; Koupparis, K.M.; Kowatsch, B. Assessing Post-Disaster Damage from Satellite Imagery Using Semi-Supervised Learning Techniques. arXiv 2020, arXiv:2011.14004. [Google Scholar]
- Boloorani, A.; Darvishi, M.; Weng, Q.; Liu, X. Post-War Urban Damage Mapping Using InSAR: The Case of Mosul City in Iraq. ISPRS Int. J. Geo-Inf. 2021, 10, 140. [Google Scholar] [CrossRef]
- Filippi, A.M. Remote Sensing-Based Damage Assessment for Homeland Security. GeoJ. Libr. 2008, 94, 125–169. [Google Scholar] [CrossRef]
- ICRC. Urban Services during Protracted Armed Conflict: A Call for a Better Approach to Assisting Affected People; International Committee of the Red Cross: Geneva, Switzerland, 2015. [Google Scholar]
- Neta, C. Crawford Reliable Death Tolls from the Ukraine War Are Hard to Come by—The Result of Undercounts and Manipulation. The Conversation, 4 April 2022. [Google Scholar]
- Ukraine: UN Rights Office Probe Spotlights Harrowing Plight of Civilians|UN News. Available online: https://news.un.org/en/story/2022/05/1117902 (accessed on 12 May 2022).
- Ukraine War: $100 Billion in Infrastructure Damage, and Counting|UN News. Available online: https://news.un.org/en/story/2022/03/1114022 (accessed on 12 May 2022).
- United Nations Satellite Centre UNOSAT|UNITAR. Available online: https://www.unitar.org/sustainable-development-goals/united-nations-satellite-centre-UNOSAT (accessed on 11 May 2022).
- Bucha Rapid Damage Assessment Overview Map—Humanitarian Data Exchange. Available online: https://data.humdata.org/dataset/bucha-rapid-damage-assessment-overview-map (accessed on 11 May 2022).
- USGS EROS Archive—Sentinel-2|U.S Geological Survey. Available online: https://www.usgs.gov/centers/eros/science/usgs-eros-archive-sentinel-2?qt-science_center_objects=0#qt-science_center_objects (accessed on 14 June 2022).
- European Space Agency Sentinel-2 User Handbook. 2015. Available online: https://sentinels.copernicus.eu/web/sentinel/user-guides/document-library/-/asset_publisher/xlslt4309D5h/content/sentinel-2-user-handbook (accessed on 5 December 2022).
- Sirko, W.; Kashubin, S.; Ritter, M.; Annkah, A.; Salah, Y.; Bouchareb, E.; Dauphin, Y.; Keysers, D.; Neumann, M.; Cisse, M.; et al. Continental-Scale Building Detection from High Resolution Satellite Imagery. arXiv 2021, arXiv:2107.12283. [Google Scholar] [CrossRef]
- Building Footprints—Bing Maps. Available online: https://www.microsoft.com/en-us/maps/building-footprints (accessed on 5 July 2022).
- EOC Geoservice Maps—World Settlement Footprint (WSF)—Sentinel-1/Sentinel-2—Global. 2019. Available online: https://geoservice.dlr.de/web/maps/eoc:wsf2019 (accessed on 26 June 2022).
- European Commission. Global Human Settlement. Available online: https://ghsl.jrc.ec.europa.eu/datasets.php (accessed on 15 July 2018).
- Sentinel-2 10 m Land Use/Land Cover Timeseries—Overview. Available online: https://www.arcgis.com/home/item.html?id=d3da5dd386d140cf93fc9ecbf8da5e31 (accessed on 26 June 2022).
- WorldCover|WORLDCOVER. Available online: https://esa-worldcover.org/en (accessed on 26 June 2022).
- WorldView Series—Earth Online. Available online: https://earth.esa.int/eogateway/missions/worldview (accessed on 14 June 2022).
- Mondini, A.C.; Santangelo, M.; Rocchetti, M.; Rossetto, E.; Manconi, A.; Monserrat, O. Sentinel-1 SAR Amplitude Imagery for Rapid Landslide Detection. Remote Sens. 2019, 11, 760. [Google Scholar] [CrossRef] [Green Version]
- Jung, J.; Yun, S.-H. Evaluation of Coherent and Incoherent Landslide Detection Methods Based on Synthetic Aperture Radar for Rapid Response: A Case Study for the 2018 Hokkaido Landslides. Remote Sens. 2020, 12, 265. [Google Scholar] [CrossRef] [Green Version]
- Haralick, R.M.; Shanmugam, K.; Dinstein, I.H. Textural Features for Image Classification. IEEE Trans. Syst. Man Cybern. 1973, SMC-3, 610–621. [Google Scholar] [CrossRef] [Green Version]
- Moya, L.; Zakeri, H.; Yamazaki, F.; Liu, W.; Mas, E.; Koshimura, S. 3D gray level co-occurrence matrix and its application to identifying collapsed buildings. ISPRS J. Photogramm. Remote Sens. 2019, 149, 14–28. [Google Scholar] [CrossRef]
- Sonobe, M. Characteristics of Texture Index of Damaged Buildings Using Time-Series High-Resolution Optical Satellite Images. Int. Arch. Photogramm. Remote Sens. Spat. Inf. Sci. 2020, 43, 1709–1714. [Google Scholar] [CrossRef]
- Lubin, A.; Saleem, A. Remote sensing-based mapping of the destruction to Aleppo during the Syrian Civil War between 2011 and 2017. Appl. Geogr. 2019, 108, 30–38. [Google Scholar] [CrossRef]
- Braun, A. Sentinel-1 Toolbox Tutorial: SAR-Based Landcover Classification with Sentinel-1 GRD Products SAR-Based Land Cover Classification 2020. Available online: http://step.esa.int/docs/tutorials/S1TBX%20Landcover%20classification%20with%20Sentinel-1%20GRD.pdf (accessed on 5 December 2022).
- Plank, S. Rapid Damage Assessment by Means of Multi-Temporal SAR—A Comprehensive Review and Outlook to Sentinel-1. Remote Sens. 2014, 6, 4870–4906. [Google Scholar] [CrossRef] [Green Version]
- Yamazaki, F.; Iwasaki, Y.; Liu, W.; Nonaka, T.; Sasagawa, T. Detection of Damage to Building Side-Walls in the 2011 Tohoku, Japan Earthquake Using High-Resolution TerraSAR-X Images. In Proceedings of the Image and Signal Processing for Remote Sensing XIX-SPIE, Gainesville, FL, USA, 25–28 June 2013; Volume 8892, pp. 299–307. [Google Scholar] [CrossRef]
- Ge, P.; Gokon, H.; Meguro, K. A review on synthetic aperture radar-based building damage assessment in disasters. Remote Sens. Environ. 2020, 240, 111693. [Google Scholar] [CrossRef]
- Koppel, K.; Zalite, K.; Voormansik, K.; Jagdhuber, T. Sensitivity of Sentinel-1 backscatter to characteristics of buildings. Int. J. Remote Sens. 2017, 38, 6298–6318. [Google Scholar] [CrossRef]
- Matsuoka, M.; Yamazaki, F. Use of Satellite SAR Intensity Imagery for Detecting Building Areas Damaged Due to Earthquakes. Earthq. Spectra 2004, 20, 975–994. [Google Scholar] [CrossRef]
- Matsuoka, M.; Yamazaki, F.; Ohkura, H. Damage Mapping for the 2004 Niigata-Ken Chuetsu Earthquake Using Radarsat Images. In Proceedings of the 2007 Urban Remote Sensing Joint Event, Paris, France, 11–13 April 2007. [Google Scholar]
- Powers, D.M.W. Evaluation: From Precision, Recall and F-Measure to ROC, Informedness, Markedness and Correlation. arXiv 2020, arXiv:2010.16061. [Google Scholar]
- Hall-Beyer, M. Practical guidelines for choosing GLCM textures to use in landscape classification tasks over a range of moderate spatial scales. Int. J. Remote Sens. 2017, 38, 1312–1338. [Google Scholar] [CrossRef]
- Flood Saves Ukrainian Village from Russian Occupation|Reuters. Available online: https://www.reuters.com/world/europe/flood-saves-ukrainian-village-russian-occupation-2022-05-15/ (accessed on 19 July 2022).
- ARIA|Home. Available online: https://aria.jpl.nasa.gov/ (accessed on 1 June 2022).
- ElGharbawi, T.; Zarzoura, F. Damage detection using SAR coherence statistical analysis, application to Beirut, Lebanon. ISPRS J. Photogramm. Remote Sens. 2021, 173, 1–9. [Google Scholar] [CrossRef]
- Watanabe, M.; Thapa, R.B.; Ohsumi, T.; Fujiwara, H.; Yonezawa, C.; Tomii, N.; Suzuki, S. Detection of damaged urban areas using interferometric SAR coherence change with PALSAR-2. Earth Planets Space 2016, 68, 131. [Google Scholar] [CrossRef] [Green Version]
- Mazzanti, P.; Scancella, S.; Virelli, M.; Frittelli, S.; Nocente, V.; Lombardo, F. Assessing the Performance of Multi-Resolution Satellite SAR Images for Post-Earthquake Damage Detection and Mapping Aimed at Emergency Response Management. Remote Sens. 2022, 14, 2210. [Google Scholar] [CrossRef]
- Ge, P.; Gokon, H.; Meguro, K. Building Damage Assessment Using Intensity SAR Data with Different Incidence Angles and Longtime Interval. J. Disaster Res. 2019, 14, 456–465. [Google Scholar] [CrossRef]
- Miura, H.; Midorikawa, S.; Matsuoka, M. Building Damage Assessment Using High-Resolution Satellite SAR Images of the 2010 Haiti Earthquake. Earthq. Spectra 2016, 32, 591–610. [Google Scholar] [CrossRef]


| Sensor (Mode) | Acquisition Date | Bands/Polarization | Relative Orbit Number | Incidence/Sun Azimuth | Resolution |
|---|---|---|---|---|---|
| Sentinel-1 (Desc *) | 16 February & 5 April 2022 | VV and VH | 36 | 30.16° | 5 × 20 m |
| Sentinel-1 (Asc *) | 19 February & 8 April 2022 | VV and VH | 87 | 30.15° | |
| Sentinel-2 | 2 January & 7 April 2022 28 March 2021 | b2-b8A and b11,12 | 07 | 166.8° | 10/20 m |
| WorldView-2 | 28 February & 25 March 2022 | Red, green, and blue | … | 154.7° | 0.5 m |
| WorldView-3 | 31 March & 9 May 2022 | Red, green, and blue | … | 157.7° | 0.3 m |
| TP | TN | FP | FN | Precision | Recall | F1 | |
|---|---|---|---|---|---|---|---|
| Ascending VH | 16 | 23 | 9 | 6 | 64 | 73 | 68 |
| Ascending VV | 15 | 21 | 11 | 7 | 58 | 68 | 63 |
| Descending VH | 17 | 22 | 10 | 5 | 63 | 77 | 69 |
| Descending VV | 16 | 20 | 12 | 6 | 57 | 73 | 64 |
| S2 Texture | 13 | 30 | 2 | 8 | 87 | 62 | 72 |
| Destroyed | Severe Damage | Moderate Damage | Possible Damage | Total | |
|---|---|---|---|---|---|
| UNOSAT | 19 | 72 | 26 | 28 | 145 |
| Average area m2 | 149 | 1280 | 708 | 441 | 867 |
| SAR damaged | 9 | 46 | 15 | 14 | 84 |
| Percentage % | 47 | 64 | 58 | 50 | 58 |
Publisher’s Note: MDPI stays neutral with regard to jurisdictional claims in published maps and institutional affiliations. |
© 2022 by the authors. Licensee MDPI, Basel, Switzerland. This article is an open access article distributed under the terms and conditions of the Creative Commons Attribution (CC BY) license (https://creativecommons.org/licenses/by/4.0/).
Share and Cite
Aimaiti, Y.; Sanon, C.; Koch, M.; Baise, L.G.; Moaveni, B. War Related Building Damage Assessment in Kyiv, Ukraine, Using Sentinel-1 Radar and Sentinel-2 Optical Images. Remote Sens. 2022, 14, 6239. https://doi.org/10.3390/rs14246239
Aimaiti Y, Sanon C, Koch M, Baise LG, Moaveni B. War Related Building Damage Assessment in Kyiv, Ukraine, Using Sentinel-1 Radar and Sentinel-2 Optical Images. Remote Sensing. 2022; 14(24):6239. https://doi.org/10.3390/rs14246239
Chicago/Turabian StyleAimaiti, Yusupujiang, Christina Sanon, Magaly Koch, Laurie G. Baise, and Babak Moaveni. 2022. "War Related Building Damage Assessment in Kyiv, Ukraine, Using Sentinel-1 Radar and Sentinel-2 Optical Images" Remote Sensing 14, no. 24: 6239. https://doi.org/10.3390/rs14246239