
Application of Remote Sensing Techniques to Identification of Underwater Airplane Wreck in Shallow Water Environment: Case Study of the Baltic Sea, Poland

Abstract
:1. Introduction
2. Materials and Methods
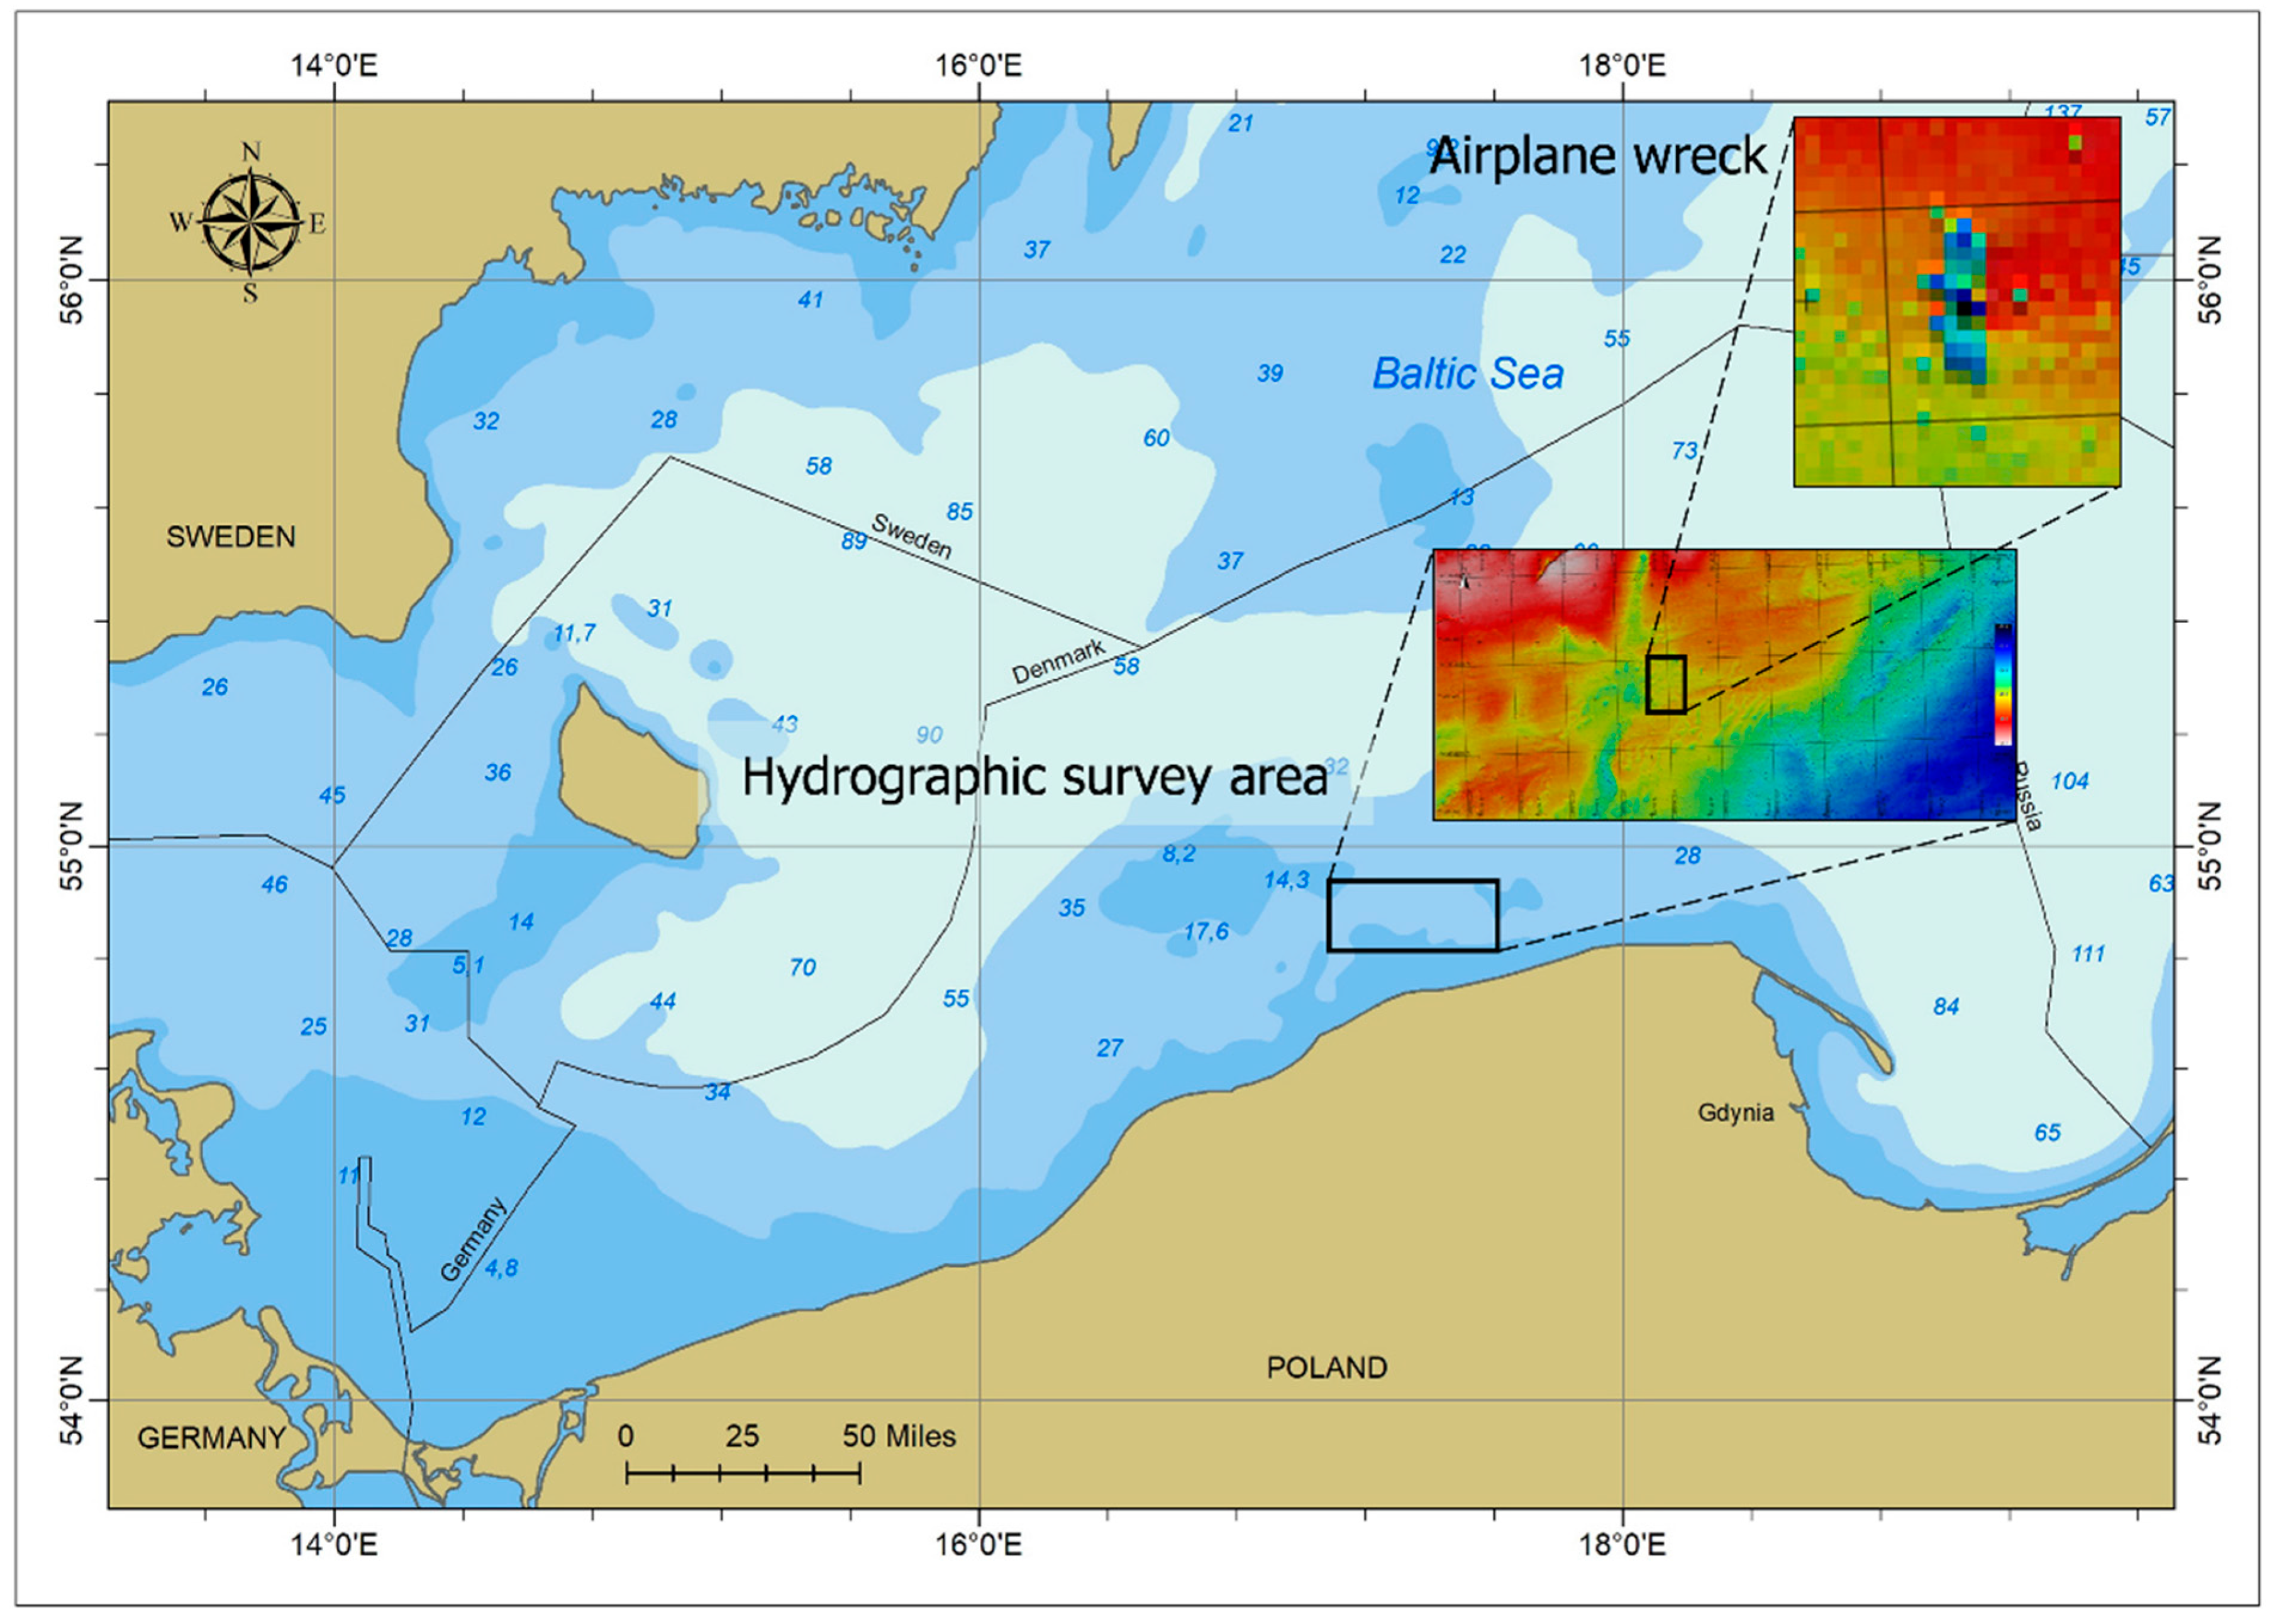
2.1. Study Area
2.2. Survey Design and Instrumentation
2.2.1. Bathymetric Survey Planning and Data Acquisition
2.2.2. Sonar Survey Planning and Data Acquisition
2.2.3. Scanning Sonar
2.2.4. ROV Mission
3. Results
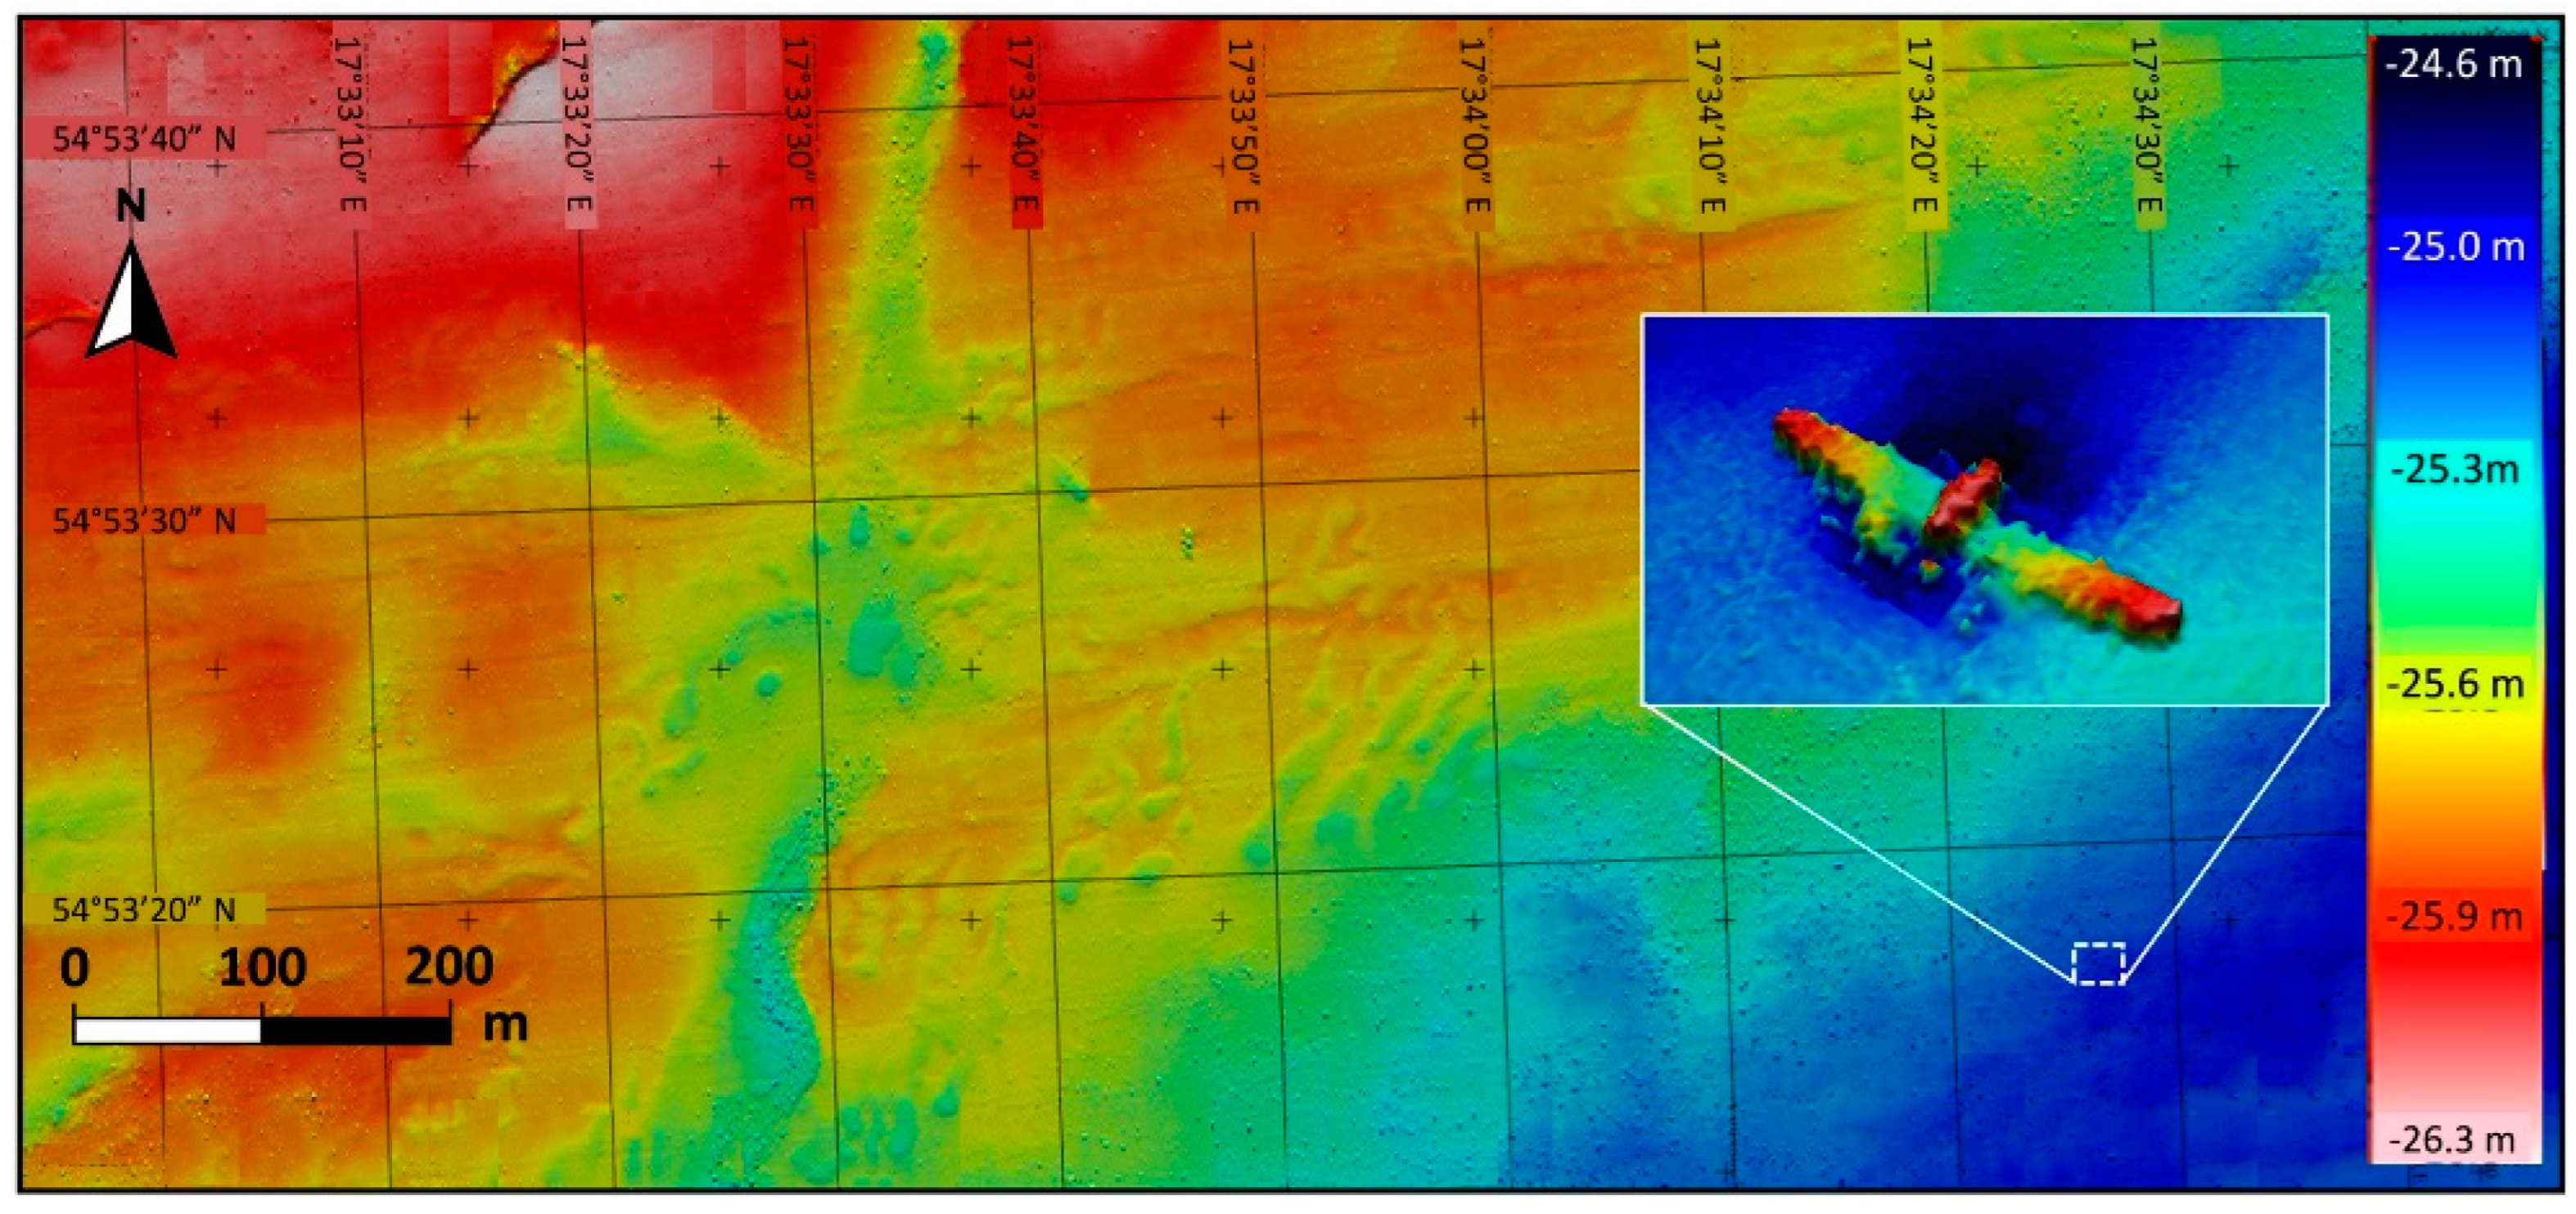
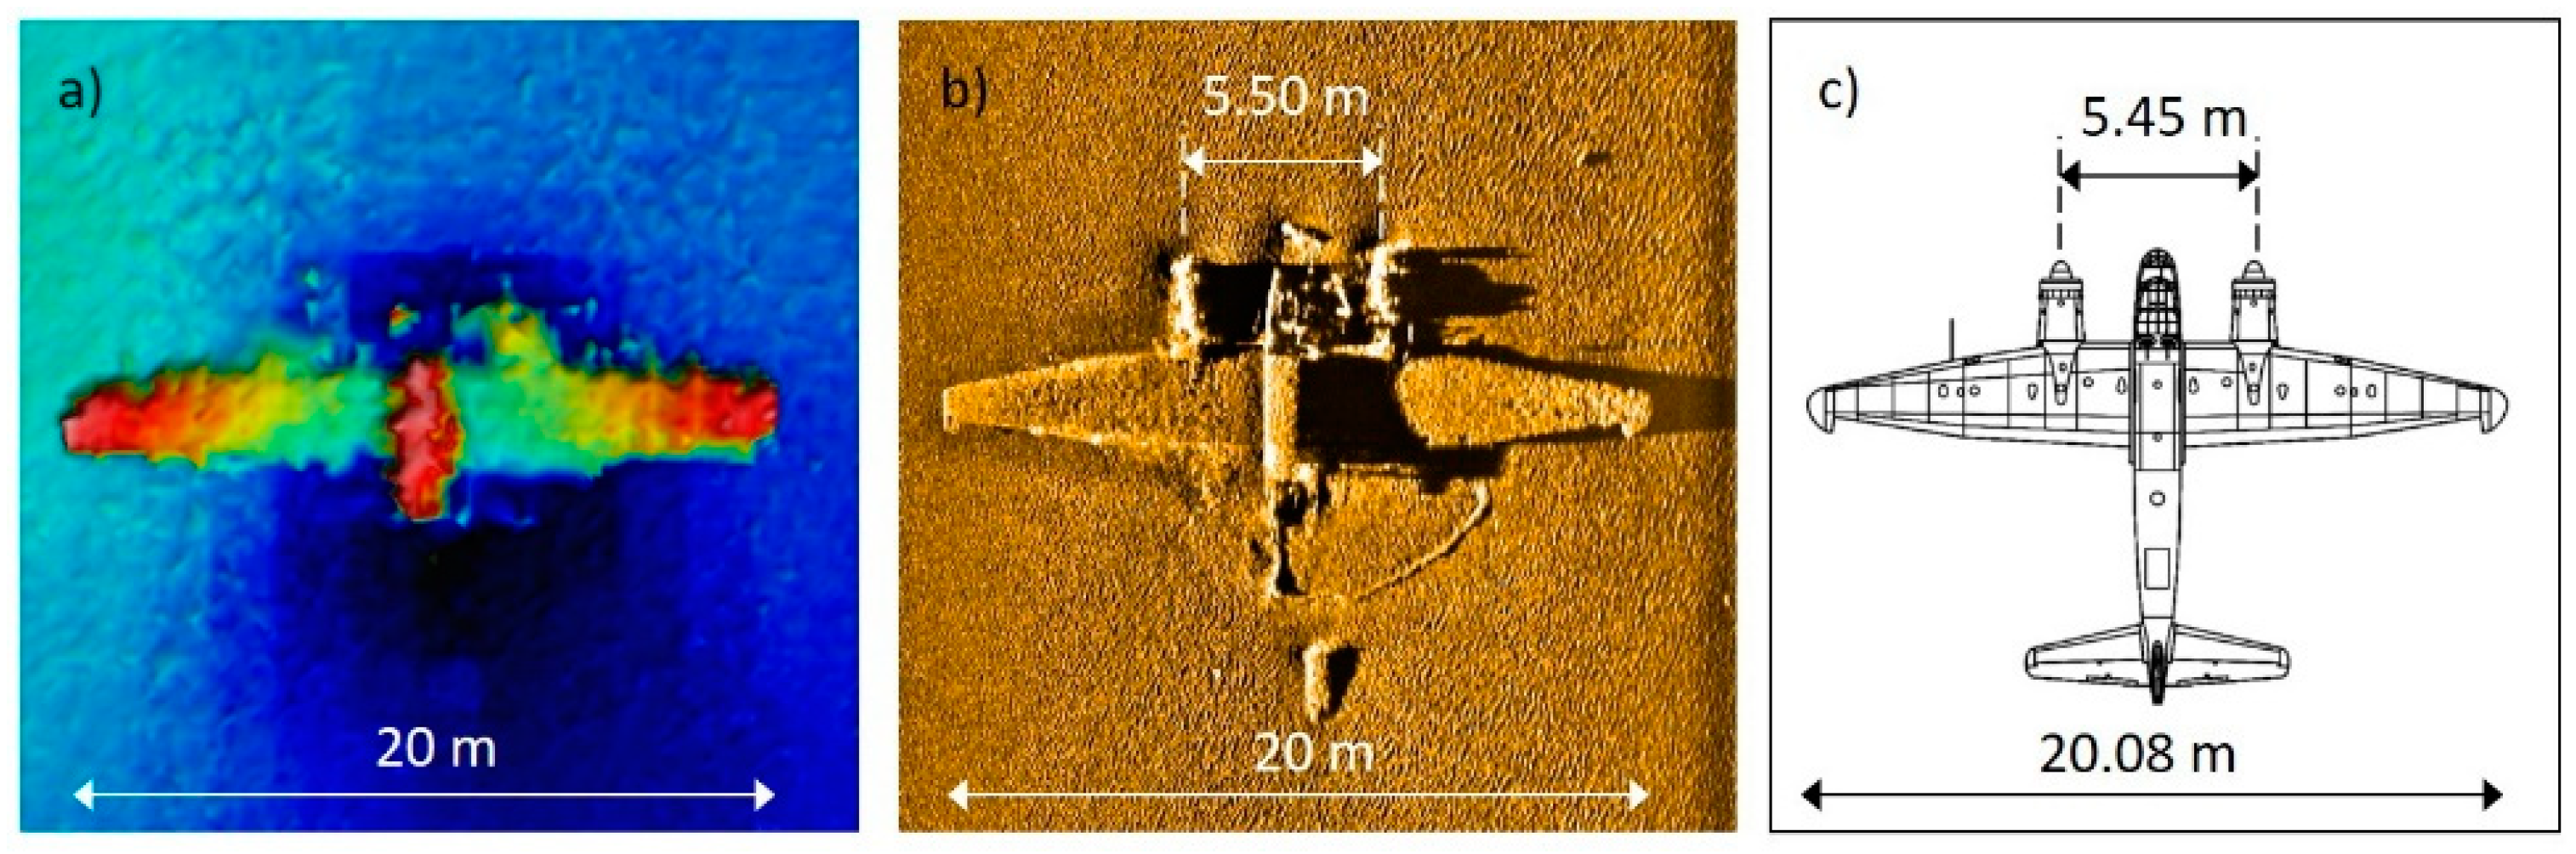
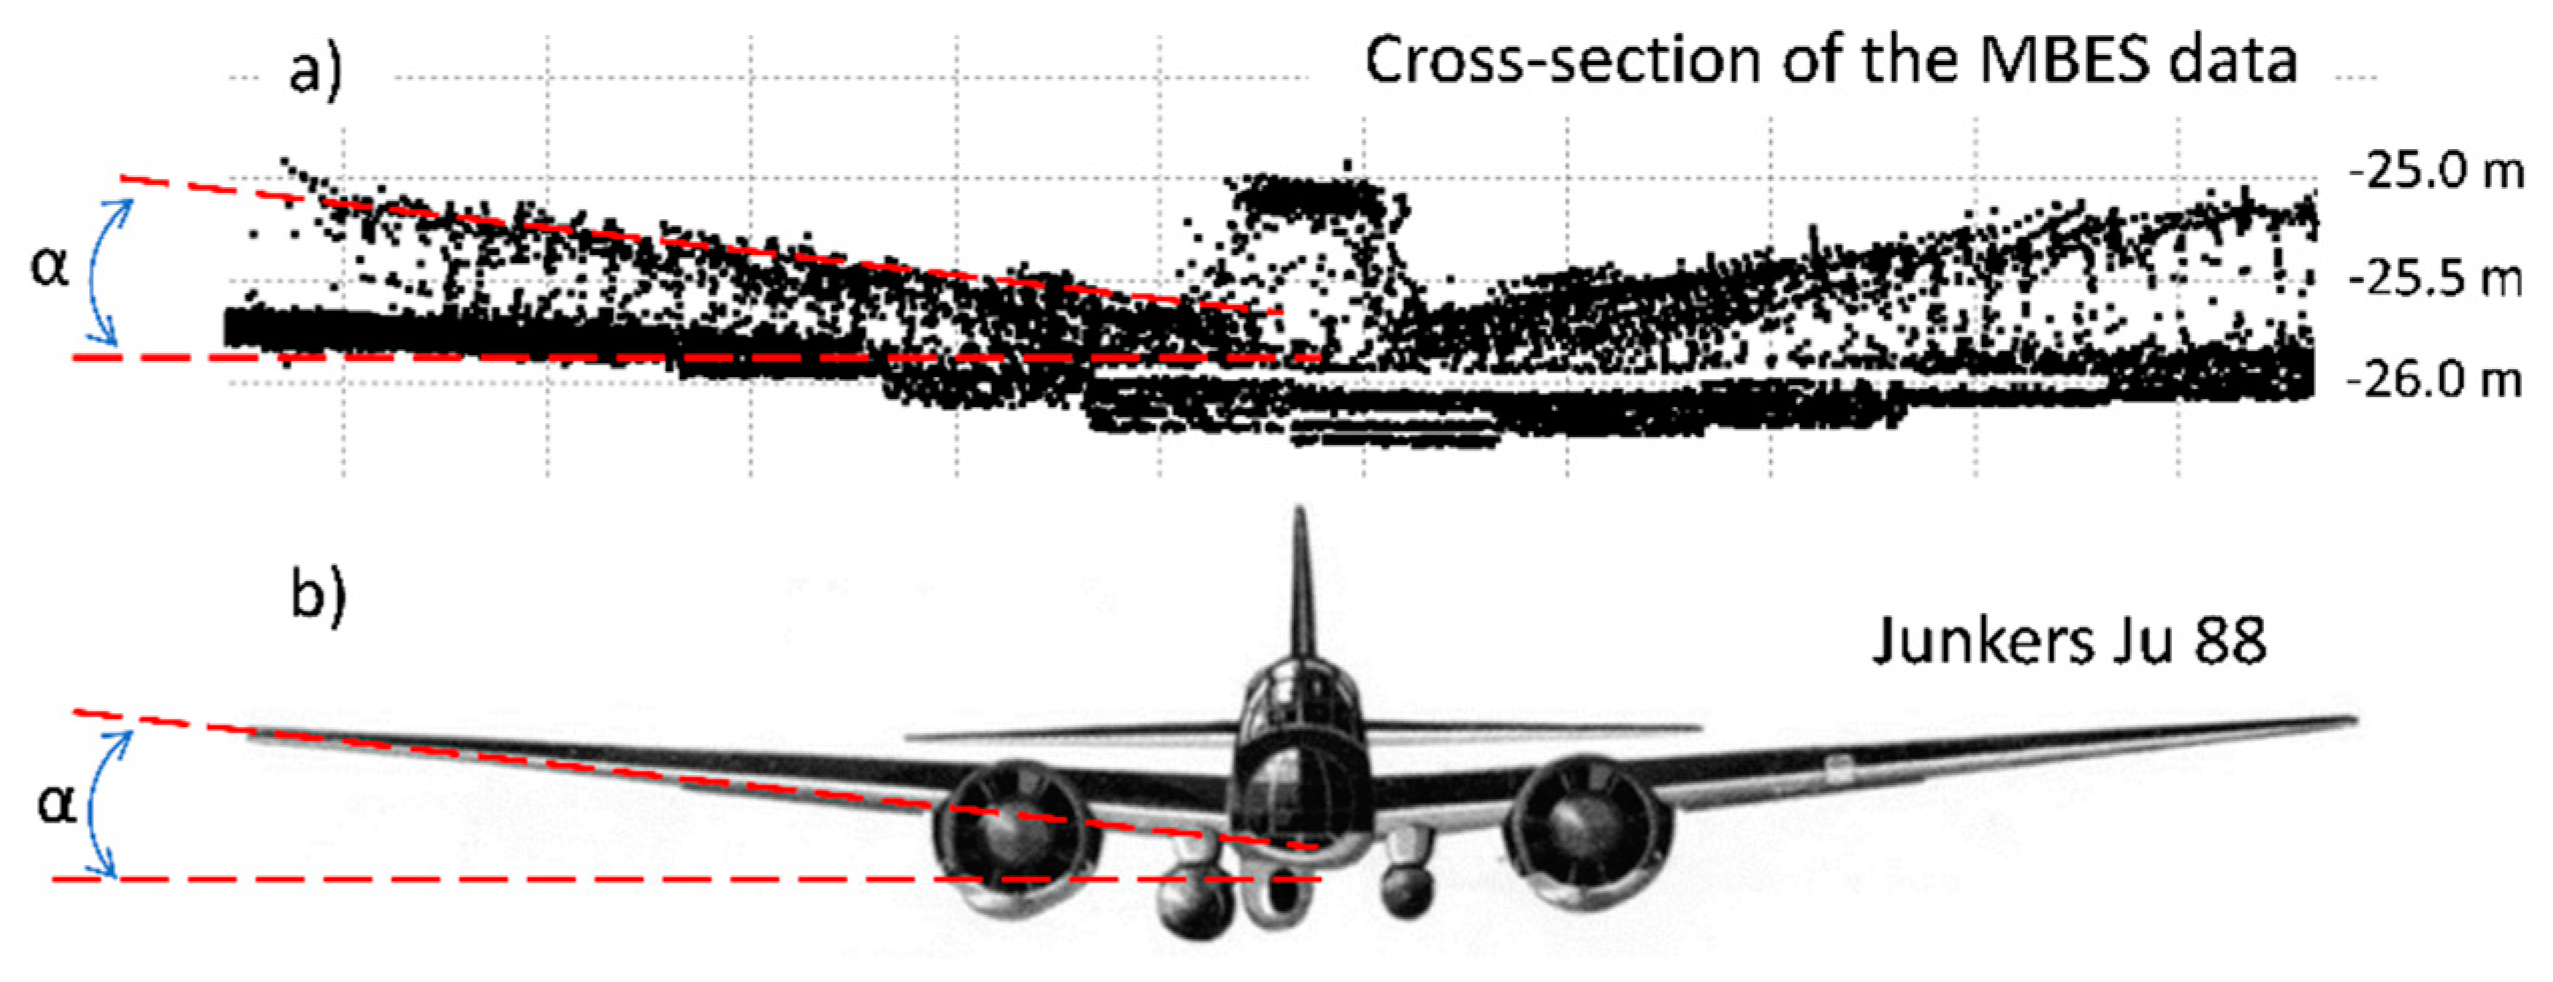
3.1. MBES Data
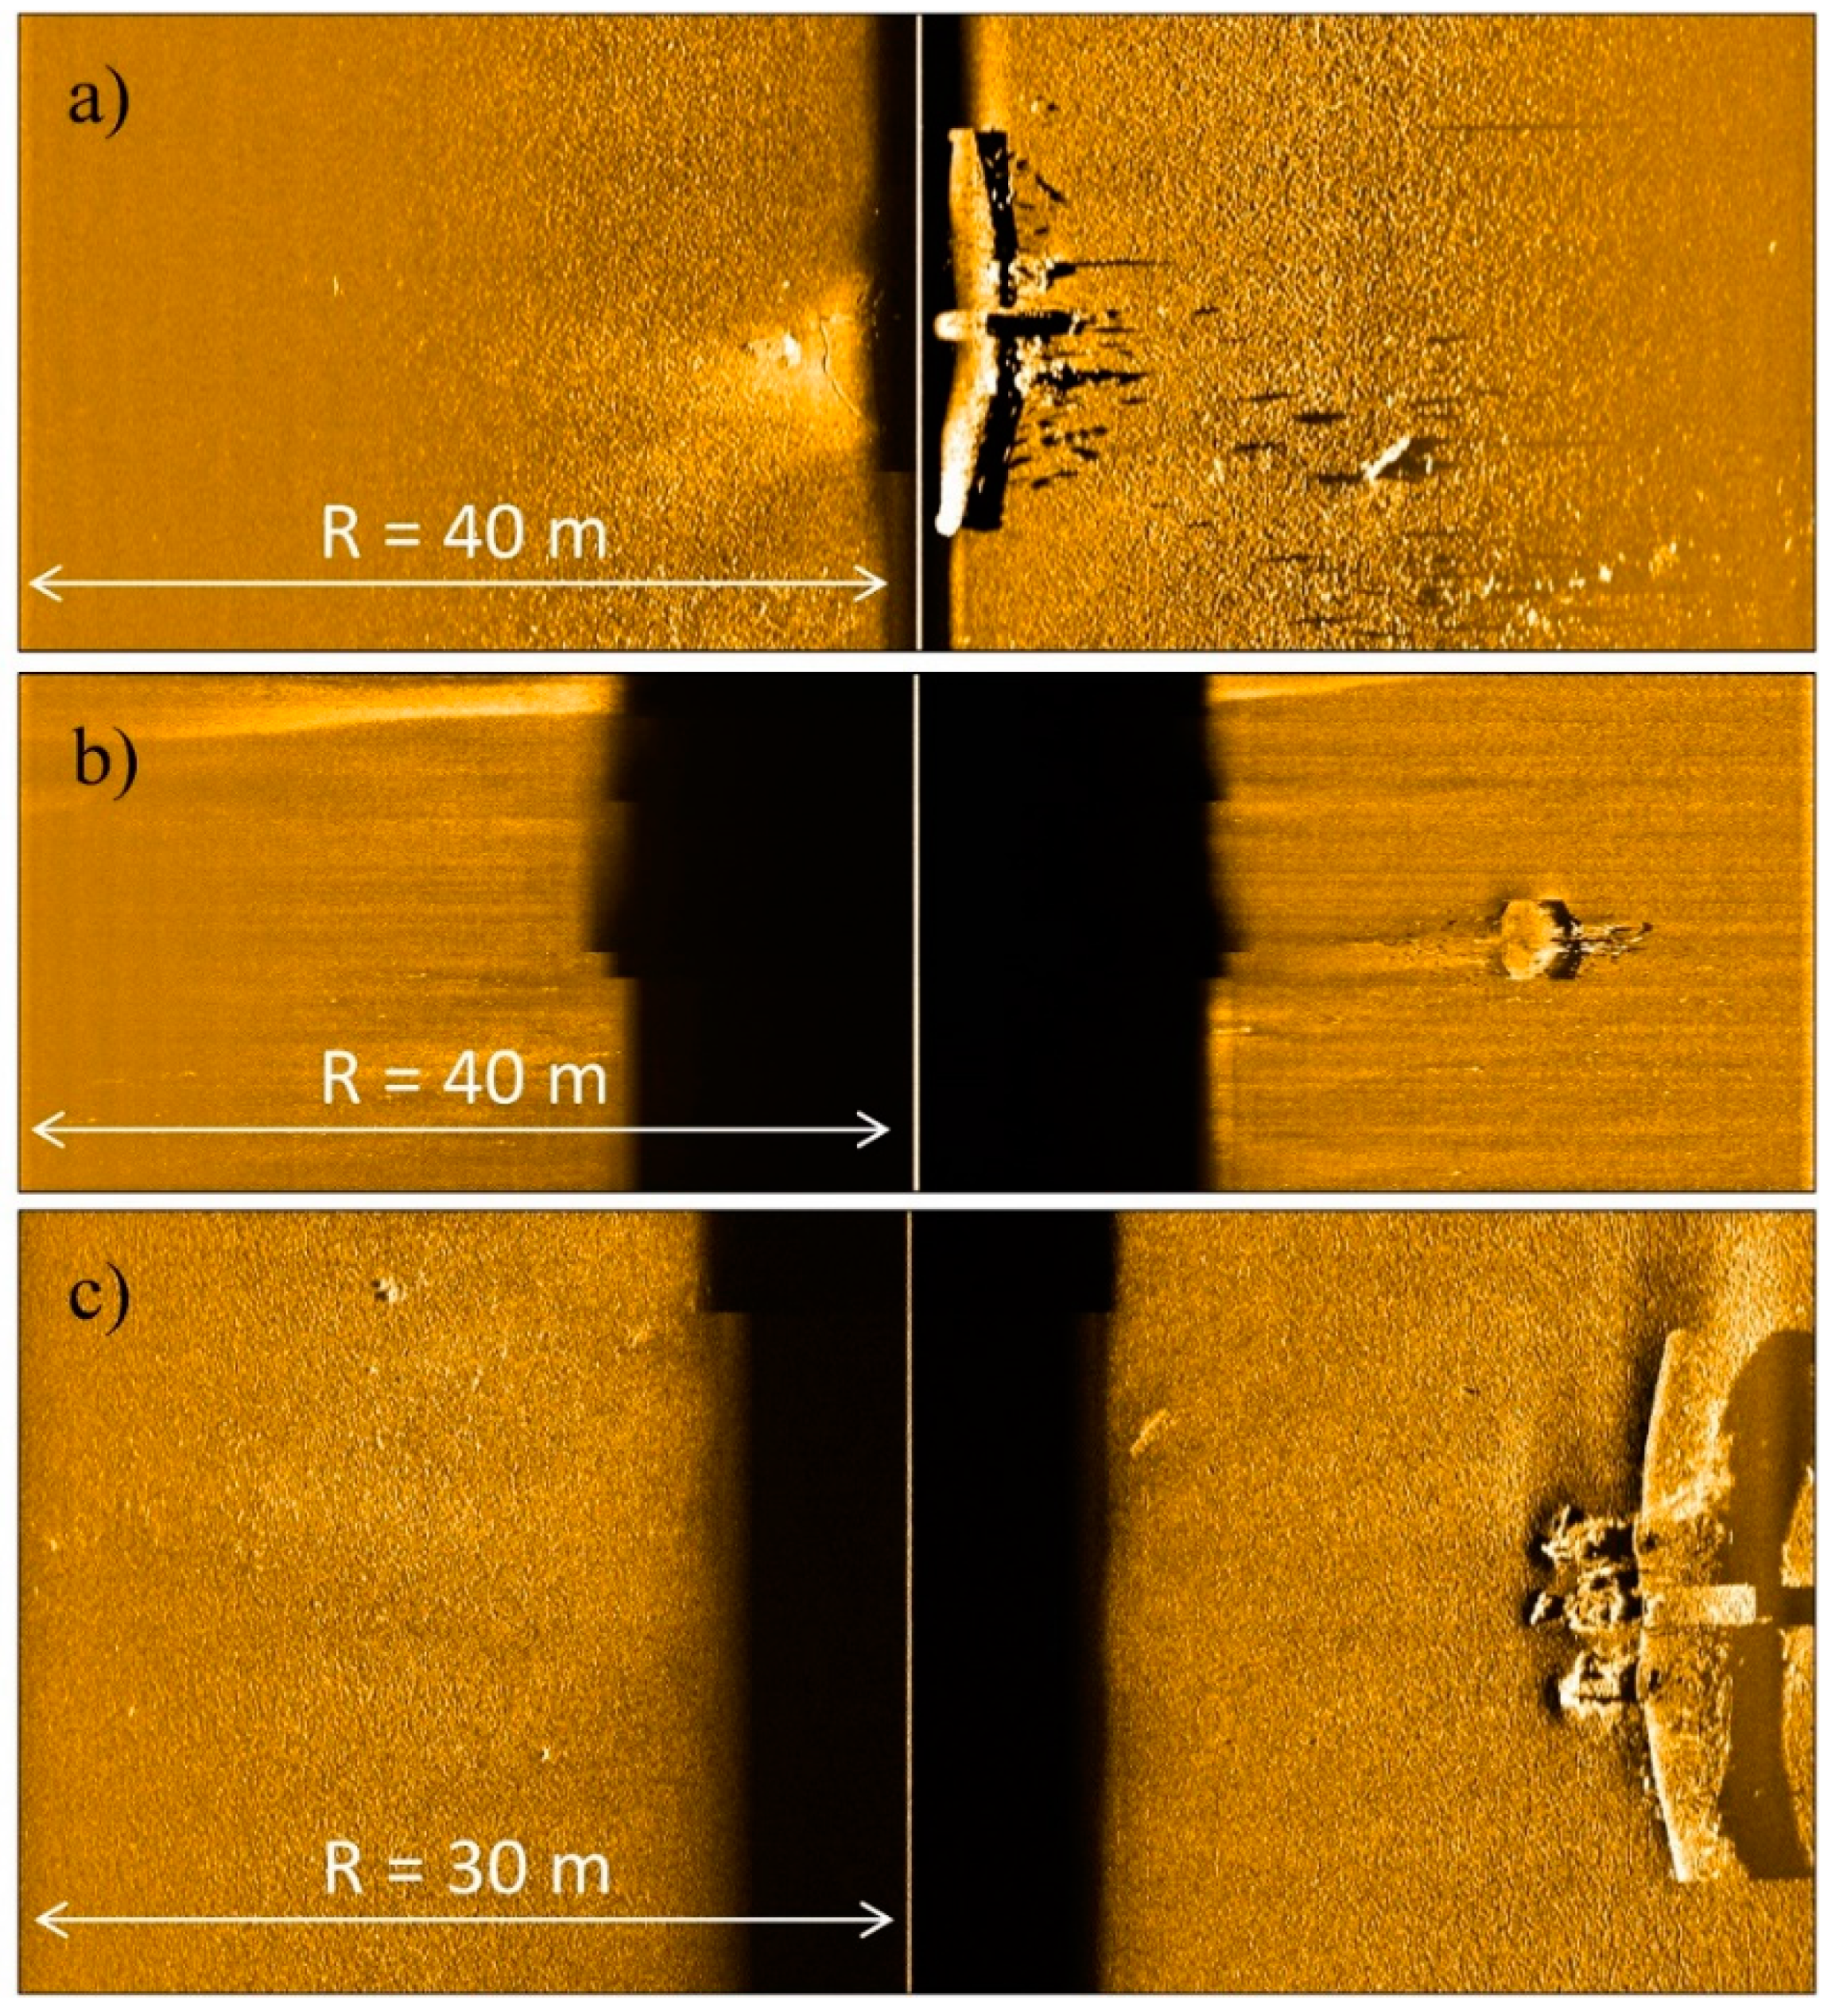
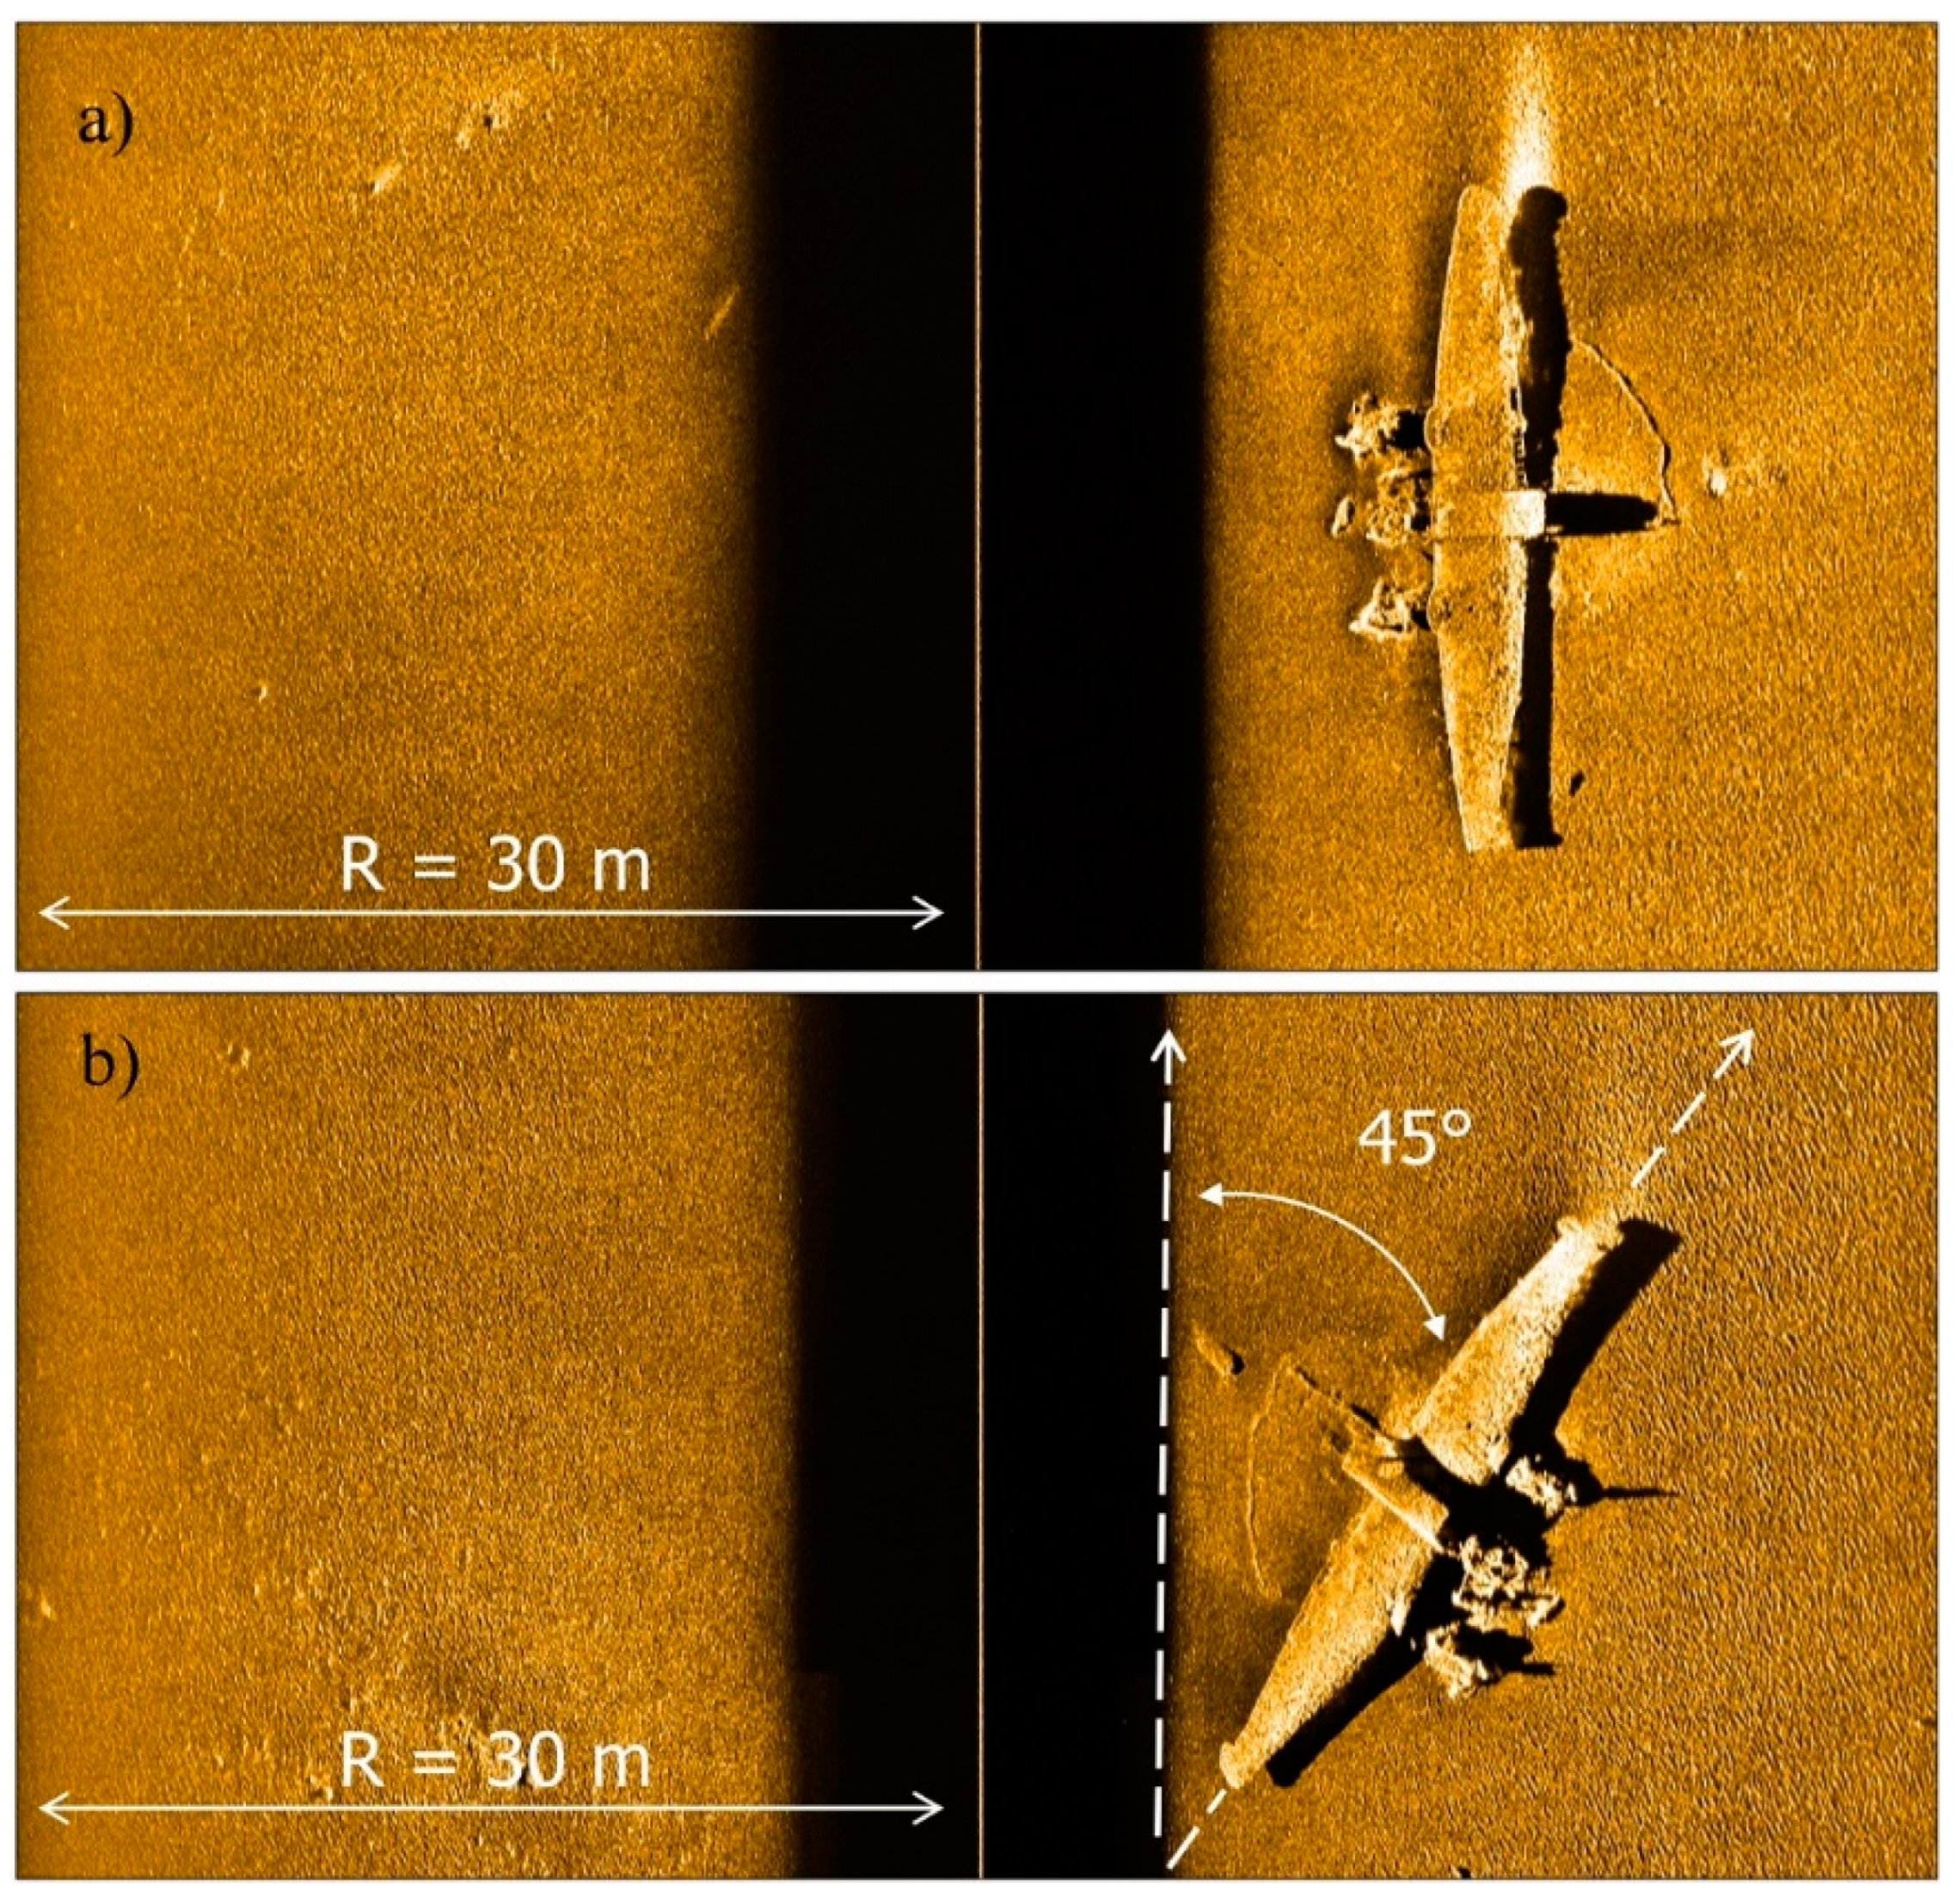
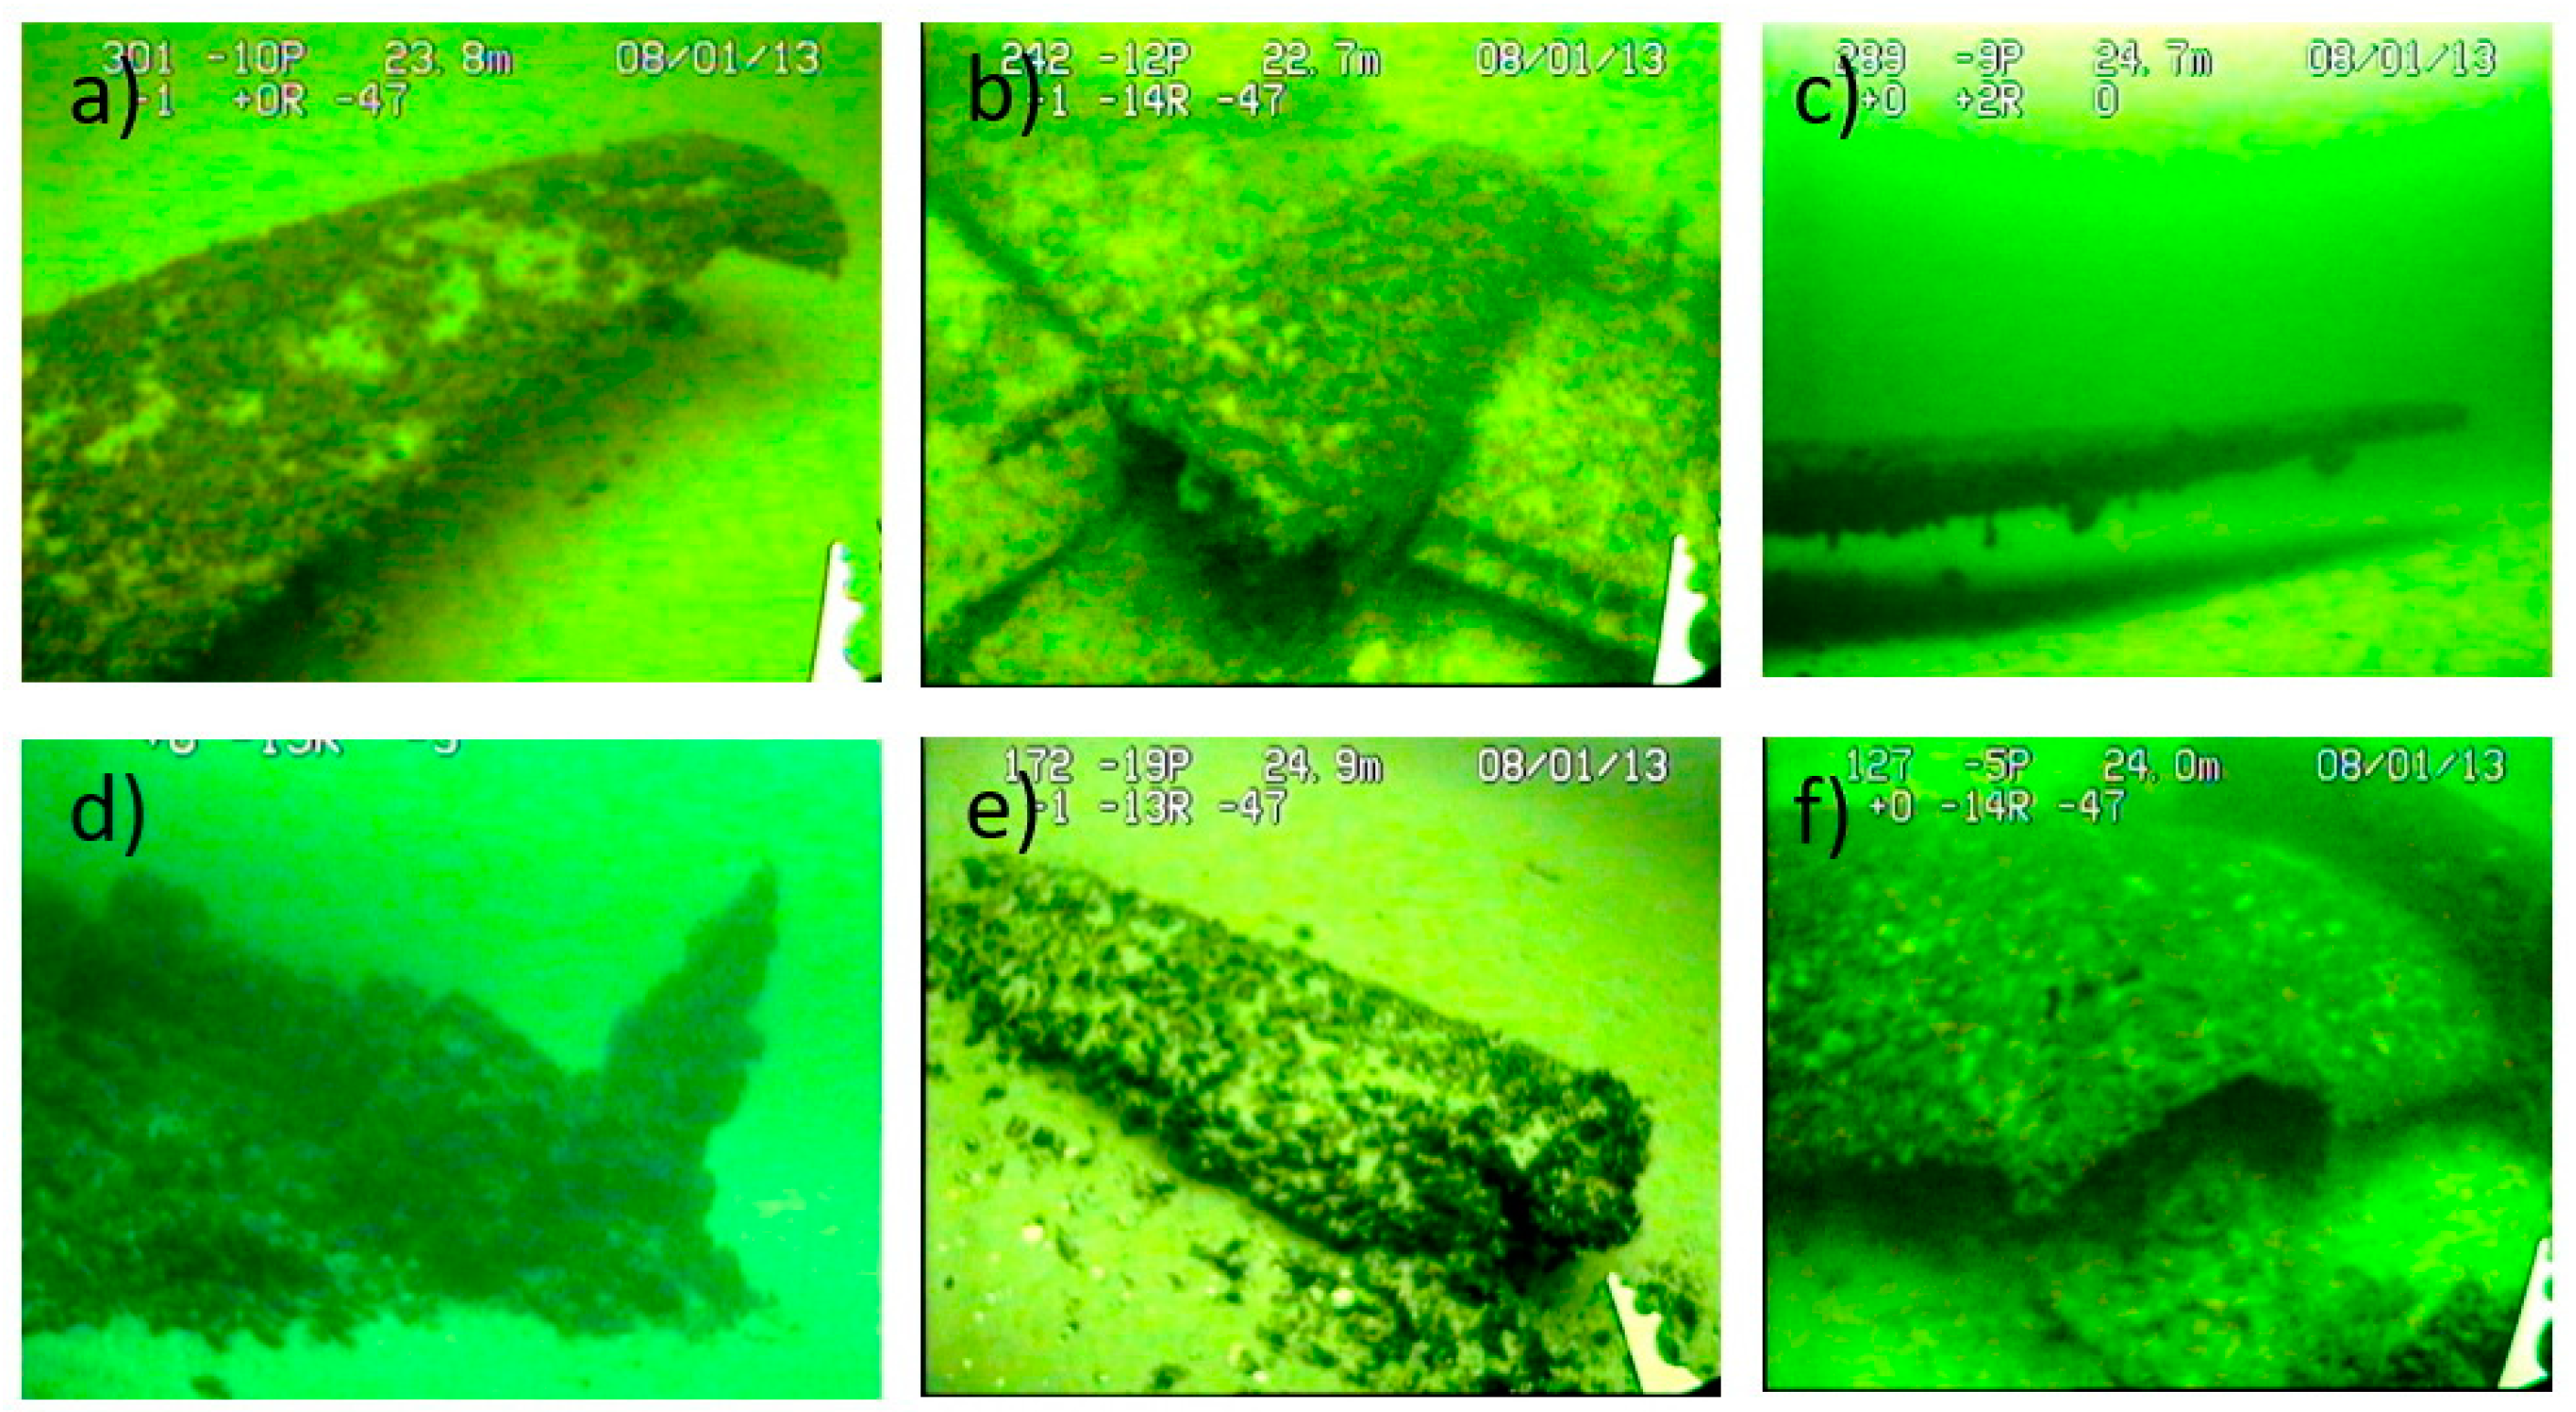
3.2. Sonar Data and Results of ROV Inspection
4. Discussion
5. Conclusions
Funding
Acknowledgments
Conflicts of Interest
References
- UNESCO Convention on the Protection of the Underwater Cultural Heritage. 2007. Available online: https://unesdoc.unesco.org/ark:/48223/pf0000152883 (accessed on 13 August 2021).
- Shipwrecks. Global Foundation for Ocean Exploration. Available online: https://www.engineeringfordiscovery.org/education/shipwrecks/ (accessed on 26 January 2022).
- IOC-UNESCO. Global Ocean Science Report—The Current Status of Ocean Science around the World; Valdés, L., Crago, M., Enevoldsen, H., Garcia, H.E., Horn, L., Inaba, K., Inniss, L., Isensee, K., Keeley, B., Mees, J., et al., Eds.; UNESCO Publishing: Paris, France, 2017; Available online: https://en.unesco.org/gosr (accessed on 21 February 2022).
- Mayer, L.; Jakobsson, M.; Allen, G.; Dorschel, B.; Falconer, R.; Ferrini, V.; Lamarche, G.; Snaith, H.; Weatherall, P. The Nippon Foundation—GEBCO Seabed 2030 Project: The Quest to See the World’s Oceans Completely Mapped by 2030. Geosciences 2018, 8, 63. [Google Scholar] [CrossRef] [Green Version]
- Koutsi, D.; Stratigea, A. Unburying Hidden Land and Maritime Cultural Potential of Small Islands in The Mediterranean for Tracking Heritage-Led Local Development Paths. Heritage 2019, 2, 62. [Google Scholar] [CrossRef] [Green Version]
- Argyropoulos, V.; Stratigea, A. Sustainable Management of Underwater Cultural Heritage: The Route from Discovery to Engagement—Open Issues in The Mediterranean. Heritage 2019, 2, 98. [Google Scholar] [CrossRef] [Green Version]
- Hac, B.; Sarna, O. General Methodology of Oil Removal Operations on Baltic Shipwrecks; Report; The MARE Foundation: Warsaw, Poland, 2021; ISBN 978-83-959773-0-5. Available online: http://fundacjamare.pl/file/repository/2021_MARE_METODYKA_oczyszczania_wrakow_RAPORT_pl.pdf (accessed on 20 July 2022).
- Counteracting the Threats Resulting from the Deposit of Hazardous Materials on the Baltic Sea [in Polish]. Information on the inspection results. Registration number: 192/2019/P/19/068/LGD. Supreme Chamber of Control, Branch office in Gdańsk. Warsaw 2020. Available online: https://www.nik.gov.pl/kontrole/P/19/068/ (accessed on 14 June 2022).
- Geraga, M.; Papatheodorou, G.; Ferentinos, G.; Fakiris, E.; Christodoulou, D. The study of an ancient shipwreck using marine remote sensing techniques, in Kefalonia Island (Ionian Sea), Greece. Archaeol. Mariti. Mediterr. 2015, 12, 183–200. [Google Scholar]
- Bates, C.R.; Lawrence, M.; Dean, M.; Robertson, P. Geophysical Methods for Wreck-Site Monitoring: The Rapid Archaeological Site Surveying and Evaluation (RASSE) programme. Int. J. Naut. Archaeol. 2011, 40, 404–416. [Google Scholar] [CrossRef]
- Analysis of the Pollution of the Baltic Sea, with Particular Emphasis on Ships Sunk during World War I and II. Information on Pollution Action Taken by the European Parliament, the Helsinki Commission and Other Governments [in Polish]. Opinions and Expertise OE-364, Analysis, Documentation and Correspondence Office. Chancellery of the Senate, Warsaw 2021. Available online: https://www.senat.gov.pl/gfx/senat/pl/senatekspertyzy/6049/plik/oe-364.pdf (accessed on 14 March 2022).
- Initial Assessment of the Marine Water Environment of the Polish Baltic Sea Zone [In Polish]—Report to the European Commission of the Marine Branch IMGW-PIB in Gdynia; Krzymiński, W. (Ed.) IMGW: Gdynia, Poland. Available online: http://www.gios.gov.pl/bip/zalaczniki/konsultacje_spoleczne/folder_C/wstepna_ocena_stanu_srodowiska_wod_morskich_wyniki_konsultacji_i_uzgodnien.pdf (accessed on 11 November 2021).
- Poleszak, S. (Ed.) Wrecks of the Baltic Sea. A Guide for Divers; Wydawnictwo Książki Nurkowe; Oficyna Wydawnicza Eliza Poleszak: Gdynia, Poland, 2005; p. 43. ISBN 83-920563-1-0. (In Polish) [Google Scholar]
- Hac, B. Retrieval activities on the Franken shipwreck. Bull. Marit. Inst. Gdańsk 2018, 33, 172–177. [Google Scholar] [CrossRef]
- Godø, O.R.; Tenningen, E. Remote Sensing. In Computers in Fisheries Research; Megrey, B.A., Moksness, E., Eds.; Springer: Dordrecht, The Netherland, 2009. [Google Scholar] [CrossRef]
- Strong, J.A.; Elliott, M. The value of remote sensing techniques in supporting effective extrapolation across multiple marine spatial scales. Mar. Pollut. Bull. 2017, 116, 405–419. [Google Scholar] [CrossRef] [PubMed]
- Unninayar, S.; Olsen, L.M. Monitoring, observations, and remote sensing—Global dimensions. In Encyclopedia of Ecology; Academic Press: Oxford, UK, 2008; pp. 2425–2446. [Google Scholar] [CrossRef]
- Rindfuss, R.R.; Stern, P.C. Linking Remote Sensing and Social Science: The Need and the New Challenges. In People and Pixels: Linking Remote Sensing and Social Science; National Academy Press: Washington, DC, USA, 1998; pp. 1–28. [Google Scholar] [CrossRef]
- Mayer, L.A. Frontiers in Seafloor Mapping and Visualization. Mar. Geophys. Res. 2006, 27, 7–17. [Google Scholar] [CrossRef]
- Gaida, T.C.; Mohammadloo, T.H.; Snellen, M.; Simons, D.G. Mapping the Seabed and Shallow Subsurface with Multi-Frequency Multibeam Echosounders. Remote Sens. 2020, 12, 52. [Google Scholar] [CrossRef] [Green Version]
- IHO—International Hydrographic Organization. S-44: IHO Standards for Hydrographic Surveys. Special Publication No. 44—6.0.0. ed.; International Hydrographic Bureau: Monte Carlo, Mônaco, 2020; 41p, Available online: https://iho.int/uploads/user/pubs/standards/s-44/S-44_Edition_6.0.0_EN.pdf (accessed on 19 June 2022).
- Martí, A.; Portell, J.; Amblas, D.; de Cabrera, F.; Vilà, M.; Riba, J.; Mitchell, G. Compression of Multibeam Echosounders Bathymetry and Water Column Data. Remote Sens. 2022, 14, 2063. [Google Scholar] [CrossRef]
- Mohammadloo, T.H.; Geen, M.; Sewada, J.S.; Snellen, M.; Simons, D.G. Assessing the Performance of the Phase Difference Bathymetric Sonar Depth Uncertainty Prediction Model. Remote Sens. 2022, 14, 2011. [Google Scholar] [CrossRef]
- Grządziel, A. Baltic Titanics—History and current state. Marit. Rev. 2005, 6, 13–26. (In Polish) [Google Scholar]
- Grządziel, A.; Wąż, M. Estimation of Effective Swath Width for Dual-Head Multibeam Echosounder. Annu. Navig. 2016, 23, 173–183. [Google Scholar] [CrossRef]
- Grządziel, A.; Wąż, M. Multibeam Echosounder System in Bathymetric Survey of Planned Shipping Routes [in Polish]. Logistyka 2014, 6, 4250–4256. [Google Scholar]
- IHO C-13. Manual on Hydrography, 1st ed.; International Hydrographic Organization: Monte Carlo, Monaco, 2011. [Google Scholar]
- Fish, J.P.; Carr, H.A. Sound Underwater Images. A Guide to the Generation and Interpretation of Side-Scan Sonar Data; Lower Cape Publishing: Orleans, France, 1990; 188p. [Google Scholar]
- Wu, Z.; Yang, F.; Tang, Y. Side-scan Sonar and Sub-bottom Profiler Surveying. In High-resolution Seafloor Survey and Applications; Springer: Singapore, 2021. [Google Scholar] [CrossRef]
- Wang, Q.; Wu, M.; Yu, F.; Feng, C.; Li, K.; Zhu, Y.; Rigall, E.; He, B. RT-Seg: A Real-Time Semantic Segmentation Network for Side-Scan Sonar Images. Sensors 2019, 19, 1985. [Google Scholar] [CrossRef] [PubMed] [Green Version]
- Georgiou, N.; Dimas, X.; Fakiris, E.; Christodoulou, D.; Geraga, M.; Koutsoumpa, D.; Baika, K.; Kalamara, P.; Ferentinos, G.; Papatheodorou, G. A Multidisciplinary Approach for the Mapping, Automatic Detection and Morphometric Analysis of Ancient Submerged Coastal Installations: The Case Study of the Ancient Aegina Harbour Complex. Remote Sens. 2021, 13, 4462. [Google Scholar] [CrossRef]
- Jaśniewicz, D.; Klusek, Z.; Brodecka-Goluch, A.; Bolałek, J. Acoustic investigations of shallow gas in the southern Baltic Sea (Polish Exclusive Economic Zone): A review. Geo-Mar. Lett. 2019, 39, 1–17. [Google Scholar] [CrossRef] [Green Version]
- Huang, J. Maritime archaeology and identification of historic shipwrecks: A legal perspective. Marine Policy 2014, 44, 256–264. [Google Scholar] [CrossRef] [Green Version]
- Berg, D. Shipwreck Diving, Instant Downloadable E-Book; Aqua Explorers: Baldwin, NY, USA, 2015; p. 90. ISBN1 # 10096161675X. ISBN2 -10 096161675X. [Google Scholar]
- Keatts, H.; Skerry, B. Complete Wreck Diving: A Guide to Diving Wrecks, 1st ed.; Aqua Quest Publications: Locust Valley, NY, USA, 1999; p. 270. ISBN -10 0922769389. [Google Scholar]
- Harpster, M. Shipwreck Identity, Methodology, and Nautical Archaeology. J. Archaeol. Method Theory 2013, 20, 588–622. [Google Scholar] [CrossRef]
- Grabiec, D.; Olejnik, A. Searching for and identifying underwater objects. In Baltic Wrecks: Guide for Divers; Poleszak, S., Ed.; Eliza Poleszak: Gdynia, Poland, 2005; pp. 81–105. ISBN 83-920563-1-0. [Google Scholar]
- Grządziel, A. Using side scan sonar imagery to identify the wrecks. In The II Hydrographic Workshop, Pomeranian Science and Technology Park; Hydrographic Support Squadron of the Polish Navy: Gdynia, Poland, 2008. [Google Scholar]
- Sobczak, K. Encyclopedia of World War II; Wydawnictwo Ministerstwa Obrony Narodowej: Warszawa, Poland, 1975; p. 793. (In Polish) [Google Scholar]
- Marud, W.; Zieliński, T. Aviation in Air War. Concepts. History. Present; Wydawnictwo Naukowe PWN: Warszawa, Poland, 2022; p. 350. ISBN 9788301204792. (In Polish) [Google Scholar]
- Królikiewicz, T. Polish Plane and Colour; Wydawnictwo Ministerstwa Obrony Narodowej: Warszawa, Poland, 1981; p. 198. ISBN 8311065462. [Google Scholar]
- Goss, C. Junkers ju 88 the Luftwaffes Most Versatile Aircraft; Frontline Books: London, UK, 2017; p. 160. ISBN 9781848324756. (In Polish) [Google Scholar]
- Murawki, M.J.; Ryś, M. Junkers Ju 88 vol. I; Kagero: Lublin, Poland, 2014; p. 120. ISBN 9788364596117. (In Polish) [Google Scholar]
- Weal, J. Junkers Ju 88 Kampfgeschwader on the Russian Front; Bloomsbury Publishing PLC: London, UK, 2010; p. 96. ISBN -10 1846034191. [Google Scholar]
- Donald, D. Bombers of World War II. Brown Packaging Books Ltd.: London, UK, 1998; p. 44, ISBN 1-56799-683-3. [Google Scholar]
- Ledwoch, J. Junkers Ju 88; A.J.-Press: Gdańsk, Poland, 1992; p. 44. ISBN -10 0867-7867. [Google Scholar]


| Parameter | Value |
|---|---|
| Total swath coverage | 100° |
| Horizontal range | 70 m |
| Line spacing | 56 m |
| Overlap | 20% |
| Bottom coverage | 200% |
| Survey speed | 5 knots |
| Specifications | |
|---|---|
| Frequency | 300 kHz |
| Max ping rate | 40 Hz |
| Beamwidth | 1.5° × 1.5° |
| Depth resolution | 1 cm |
| Pulse length | 150 μs |
| Tilt angle | 40° |
| Specifications | |
|---|---|
| Frequencies | 455 kHz, 900 kHz |
| Beams | horizontal 0.21°; vertical 40° |
| Max range | 150 m @ 445 kHz; 50 m @ 900 kHz |
| Depth rating | 200 m |
| Sensors | Roll, pitch, heading |
| Options | Pressure sensor |
| Specifications | |
| Operating frequency | 675 kHz |
| Beam width | 0.9° × 30° Fan |
| Range | 20–25 m |
| Scan angle | 360° |
| Step size | 0.225° |
| Pulse lengths | 25 μs |
Publisher’s Note: MDPI stays neutral with regard to jurisdictional claims in published maps and institutional affiliations. |
© 2022 by the author. Licensee MDPI, Basel, Switzerland. This article is an open access article distributed under the terms and conditions of the Creative Commons Attribution (CC BY) license (https://creativecommons.org/licenses/by/4.0/).
Share and Cite
Grządziel, A. Application of Remote Sensing Techniques to Identification of Underwater Airplane Wreck in Shallow Water Environment: Case Study of the Baltic Sea, Poland. Remote Sens. 2022, 14, 5195. https://doi.org/10.3390/rs14205195
Grządziel A. Application of Remote Sensing Techniques to Identification of Underwater Airplane Wreck in Shallow Water Environment: Case Study of the Baltic Sea, Poland. Remote Sensing. 2022; 14(20):5195. https://doi.org/10.3390/rs14205195
Chicago/Turabian StyleGrządziel, Artur. 2022. "Application of Remote Sensing Techniques to Identification of Underwater Airplane Wreck in Shallow Water Environment: Case Study of the Baltic Sea, Poland" Remote Sensing 14, no. 20: 5195. https://doi.org/10.3390/rs14205195