1. Introduction
When the moon moves between the sun and the Earth, the extreme ultraviolet (EUV) radiation of the sun is completely/partially blocked by the moon, resulting in a total/annular or partial solar eclipse. It is a rare astronomical phenomenon and the rapid solar radiation variations produced by a solar eclipse can bring an unusual influence on the atmosphere and ionosphere of the Earth [
1,
2,
3]. Due to the decreased solar flux during a solar eclipse, an electron density depletion in the ionospheric F-layer has often been observed [
4,
5]. However, there are many contradictory observations about Sporadic-E (Es) responses to a solar eclipse. The top frequency of Es (ftEs) was observed to rise during several solar eclipses [
6,
7] and in other eclipse events, this parameter was found to decline [
8,
9]. What is more fascinating are the eclipse-related field-aligned irregularities (FAIs) in Es. There are only a few reports about this type of FAI. Most of them were recorded during the total solar eclipse of 22 July 2009 over East Asia [
10,
11,
12]; two other events were observed by the Gadanki radar during the solar eclipses on 11 August 1999 and 15 January 2010, respectively [
13,
14]. In short, there are few reports about solar eclipse-associated E-region FAIs.
Whilst reviewing the observation data of the eclipse day of 22 July 2009, we found anomalous echoes on the Wuhan–Huaian link recorded by the Wuhan Ionospheric Oblique Backscatter Sounding System (WIOBSS) [
15]. It is very likely that the ionospheric irregularities associated with the eclipse resulted in the anomalous echoes. A traditional monostatic radio system receives backscattering echoes to observe FAIs; a bistatic radio system receiving the forward scattered echoes can also research the FAIs in the ionosphere. The bistatic system has been widely used for ionospheric and atmospheric research. Haldoupis et al. [
16,
17] observed QP echoes and Type Ⅰ echoes with the continuous wave bistatic radar, SESCAT. Stober et al. [
18] introduced a multistatic novel approach for specular meteor radars and Tuysuz et al. [
19,
20] introduced an FM-based passive VHF radar system to investigate ionospheric irregularities. We introduce the arrangement of the observation for the Es responses to the 22 July 2009 solar eclipse in
Section 2 and present the initial observation results. In
Section 2, we also compare and analyze the anomalous echoes and try to prove their relationship with the FAIs in the ionospheric E-region. Bistatic positioning technology is applied on the scattered echoes to estimate the locations of the FAIs in
Section 3. The possible generation mechanism of the irregularities that occurred in the middle of the solar eclipse is discussed in
Section 4. We draw the conclusions in
Section 5.
2. Experiment Arrangement and Observations
The solar eclipse of 22 July 2009 began in India, crossed through China and ended its journey in the Pacific Ocean. Whilst the shadow of the moon went through the Yangtze valley of China, we carried out experimental observations for abnormal structures in the ionospheric E-region. The WIOBSS was operated at a high frequency as a bistatic radio system [Chen et al., 2009]. Its transmitter was located in Wuhan [30.54° N, 114.37° E] and its receiver was located in Huaian [33.69° N, 119.58° E]. The Huaian receiver recorded the oblique-incidence (OI) waves from Wuhan and the receiver was located on the eclipse path with a maximum coverage of 93.3% at a 100 km height. In this experiment, the WIOBSS transmitted the phase coded waveform modulated by a 256 bit m-sequence. The key wave parameters were a 41.66 μs pulse width, a 20% duty cycle and 128 pulse train repetition numbers. Thus, the radio system could theoretically obtain a 24 dB pulse compression gain, 21 dB integration gain, 12.5 km range resolution and 0.07 Hz Doppler resolution. The transmitter located in Wuhan used a log-periodic antenna with a broad-beam and the transmitting power was set as 1 kW. The high gain guaranteed that the system could receive the signal with a low transmitting power. The receiver located in Huaian used a two-wire antenna to receive the waves from Wuhan. The transmitted waves were reflected by the ionosphere or scattered by ionospheric irregularities and the receiver received the one-hop and multi-hop echoes from the Wuhan transmitter.
The observation campaign was carried out on 22 and 23 July 2009 to study the influence of the solar eclipse on the ionospheric E-region.
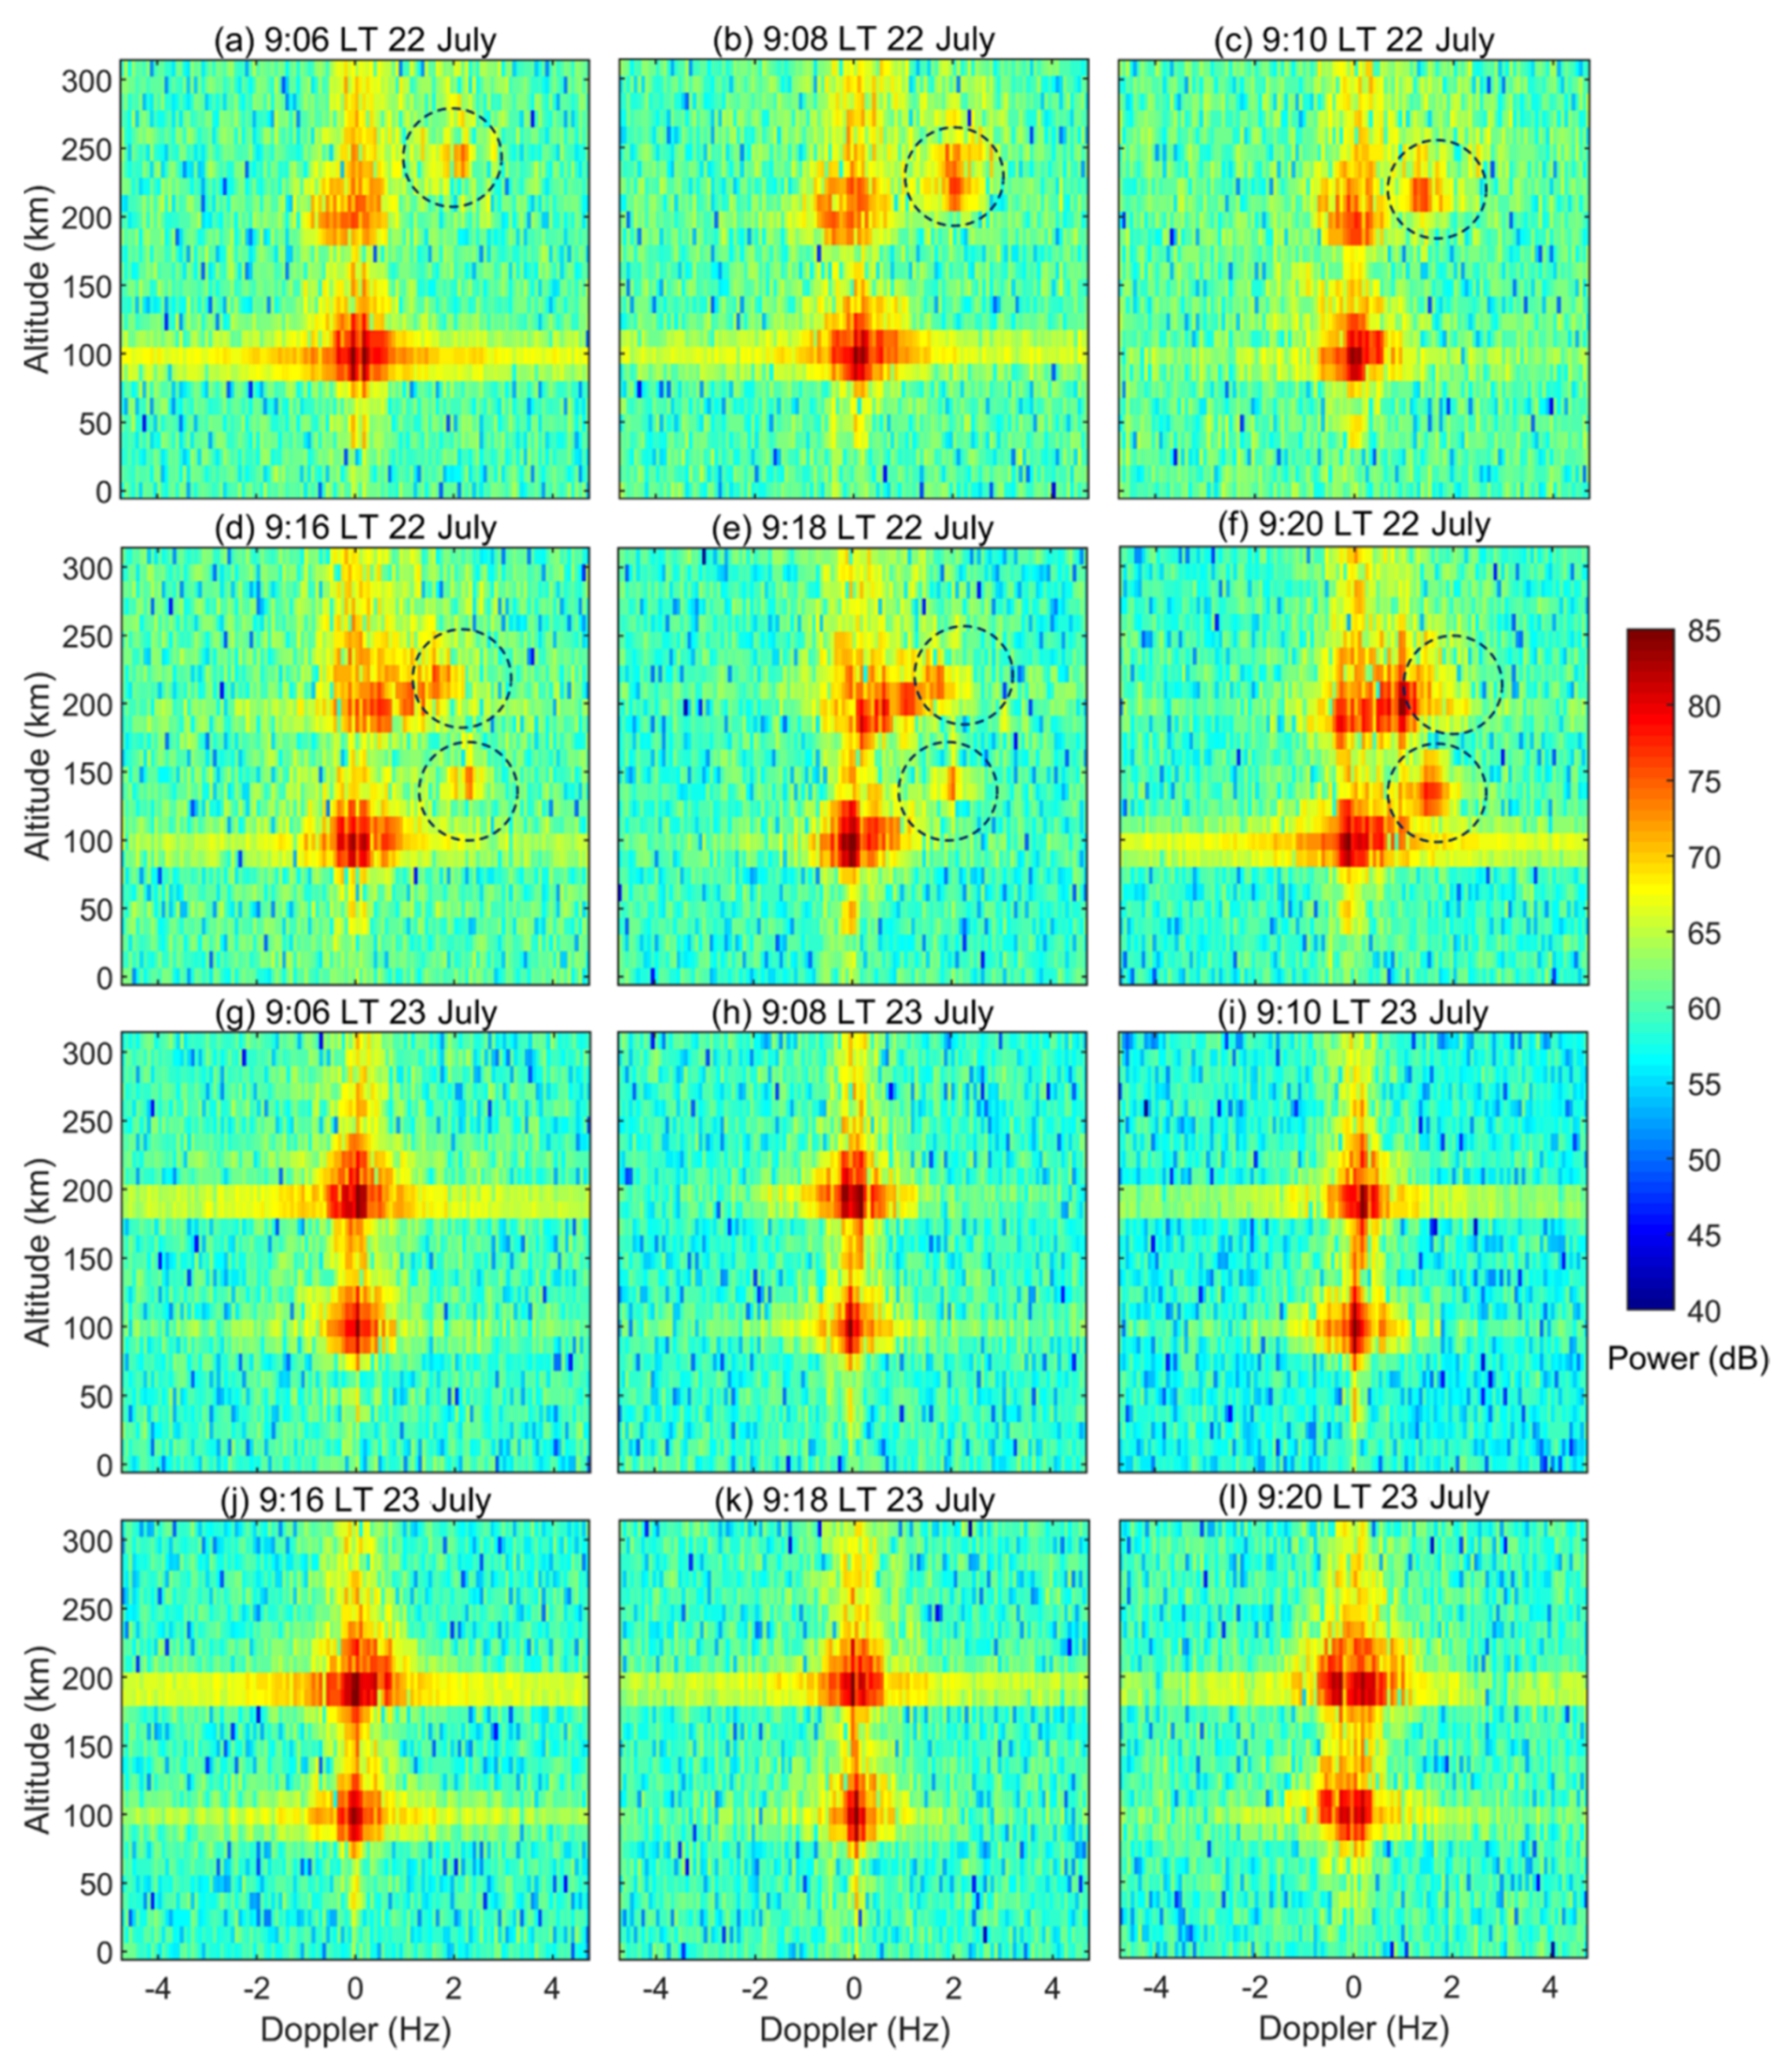
Figure 1 displays the echo spectra recorded by the Huaian receiver with a 10.6 MHz operating frequency. The vertical/horizontal axis of each plot represents the altitude/Doppler shift. The echo altitude was estimated by triangular geometry with the group ranges of the echoes and the distance between Wuhan and Huaian (~603.2 km). Due to the short ground distance, the curvature of the Earth was ignored whilst estimating the echo altitudes. The spectra recorded on the reference day of 23 July in the bottom two rows of
Figure 1 represent the typical E-region reflected echoes observed by an OI ionosonde. All the echoes were reflected by the Sporadic-E (Es) layer between the transmitter and receiver. Es is a sporadic concentration of the E-layer ionization into thin layers of high plasma density with relatively fixed heights. Thus, the Doppler shifts of the echoes reflected from the Es were close to zero and the echo ranges in the observation period were almost constant as our observations in the reference day. There were two patches of echoes; one was at altitudes of ~100 km and the other was at ~200 km altitudes. The lower echoes came from the one-hop waves and were reflected by the Es layer one time. The higher echoes came from the two-hop waves and were reflected by the Es layer two times. Except for the normal echoes reflected from the Es, the echo spectra recorded on 22 July on the top two rows in
Figure 1 represent more anomalous echoes, as indicated by the blue circles. At 9:06 LT in
Figure 1a, the anomalous echoes appeared at 234.0 km with a 2.2 Hz Doppler shift and then the echoes continued dropping with decreasing Doppler values. At 9:16 LT in
Figure 1d, new anomalous echoes occurred at 123.3 km with a 2.3 Hz Doppler value and they also descended with a decreasing Doppler. The varying range and Doppler indicated that the echoes were not due to the Fresnel flection from the Es layer. The Doppler shift of the anomalous echoes varied from 2 to 1 Hz with time and their Doppler width was ~1 Hz. It is quite possible that the E-region FAIs acted on the transmitted waves by a Bragg scatter [
21,
22].
The experiment implemented by the WIOBSS on the eclipse day of 22 July 2009 was firstly reported by Chen et al. [
23]. Four and even five-hop waves were found appearing between the transmitter and receivers at around the eclipse maximum, indicating that the Es reflection was enhanced during the solar eclipse. However, the possibility of eclipse-induced FAIs was overlooked. Years later, the obvious scattered echoes observed by the Wuhan receiver were reported and their relationship with the gravity waves was clearly illuminated [
12]. It should be noted that the reported irregularities occurred in the recovery phase of the eclipse and lasted for more than one hour after the eclipse end. However, the Wuhan receiver also recorded the anomalous echoes at around the eclipse maximum between 9:20–9:35 LT. The Huaian receiver of the bistatic system also observed the anomalous echoes in the middle of the solar eclipse, as shown in
Figure 1.
Compared with the reflected echoes at around the zero Doppler axis, the anomalous echoes appeared at farther ranges with larger Doppler shifts and a much lower echo power than the reflected echoes. The range of the anomalous echoes was ~50 km more than that of the reflected echoes. If they were reflected at F-layer altitudes, the range difference would be much greater than 50 km. Therefore, we surmised that the anomalous echoes were scattered by the FAIs in the Es. To investigate further,
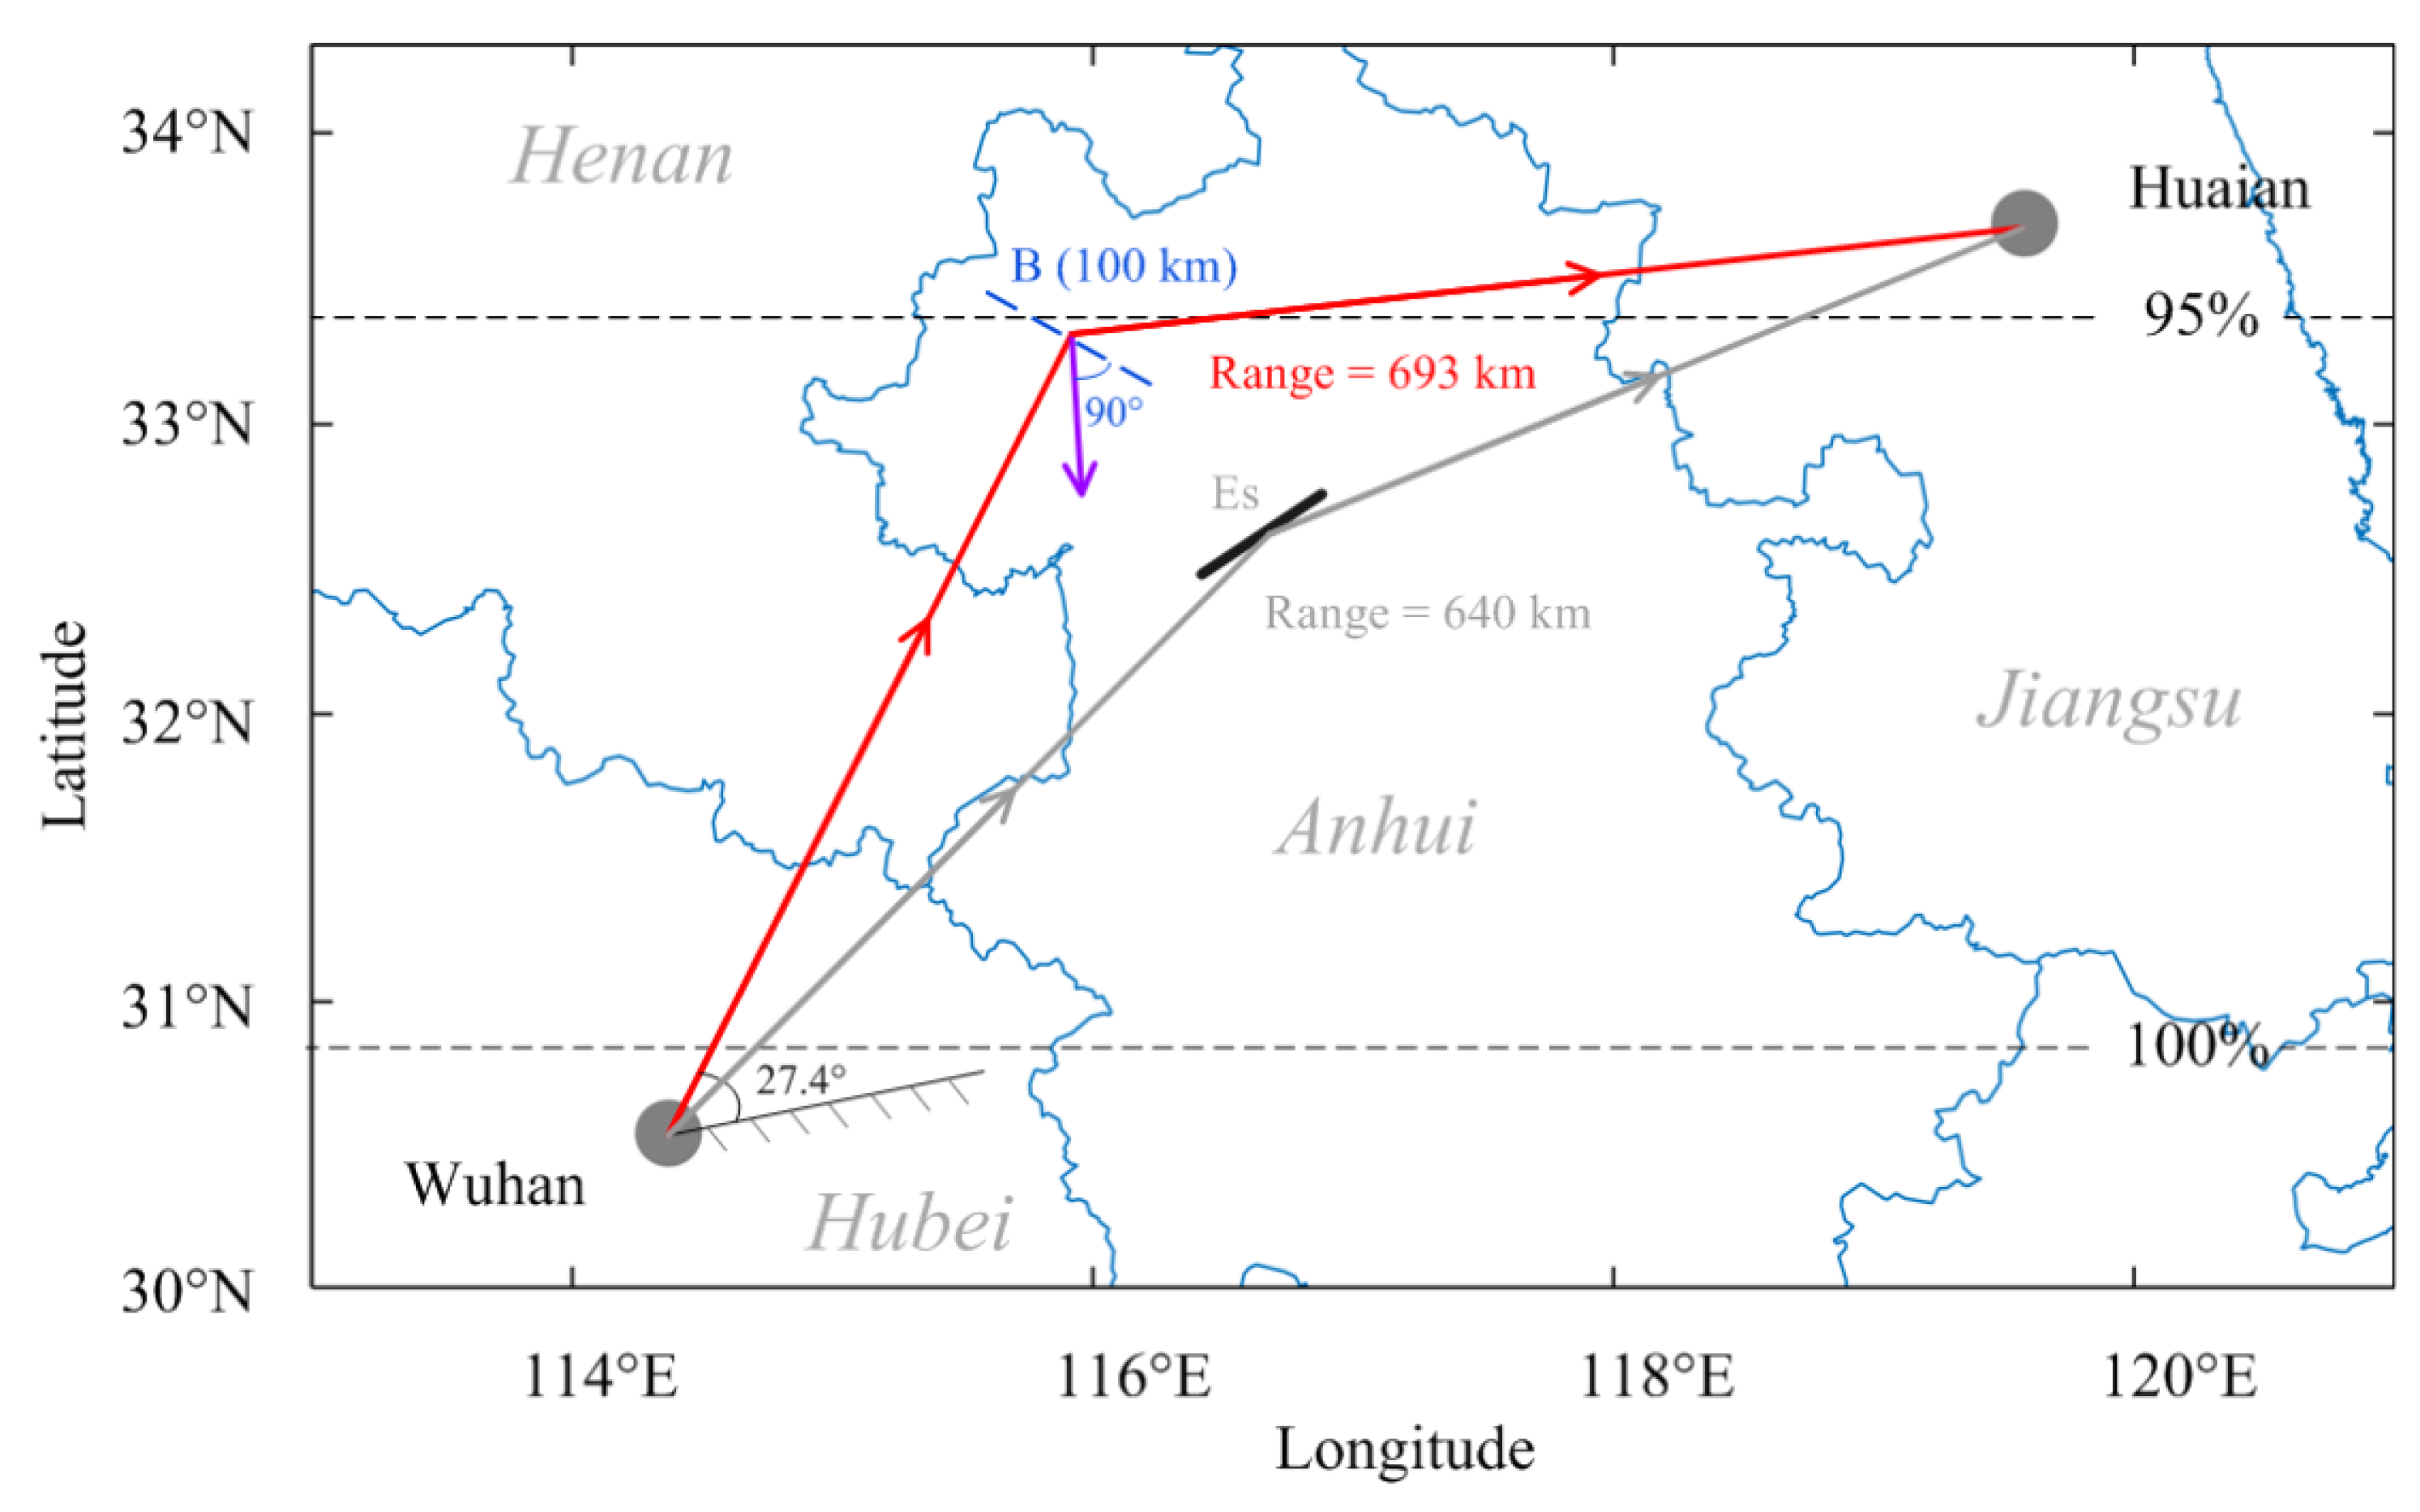
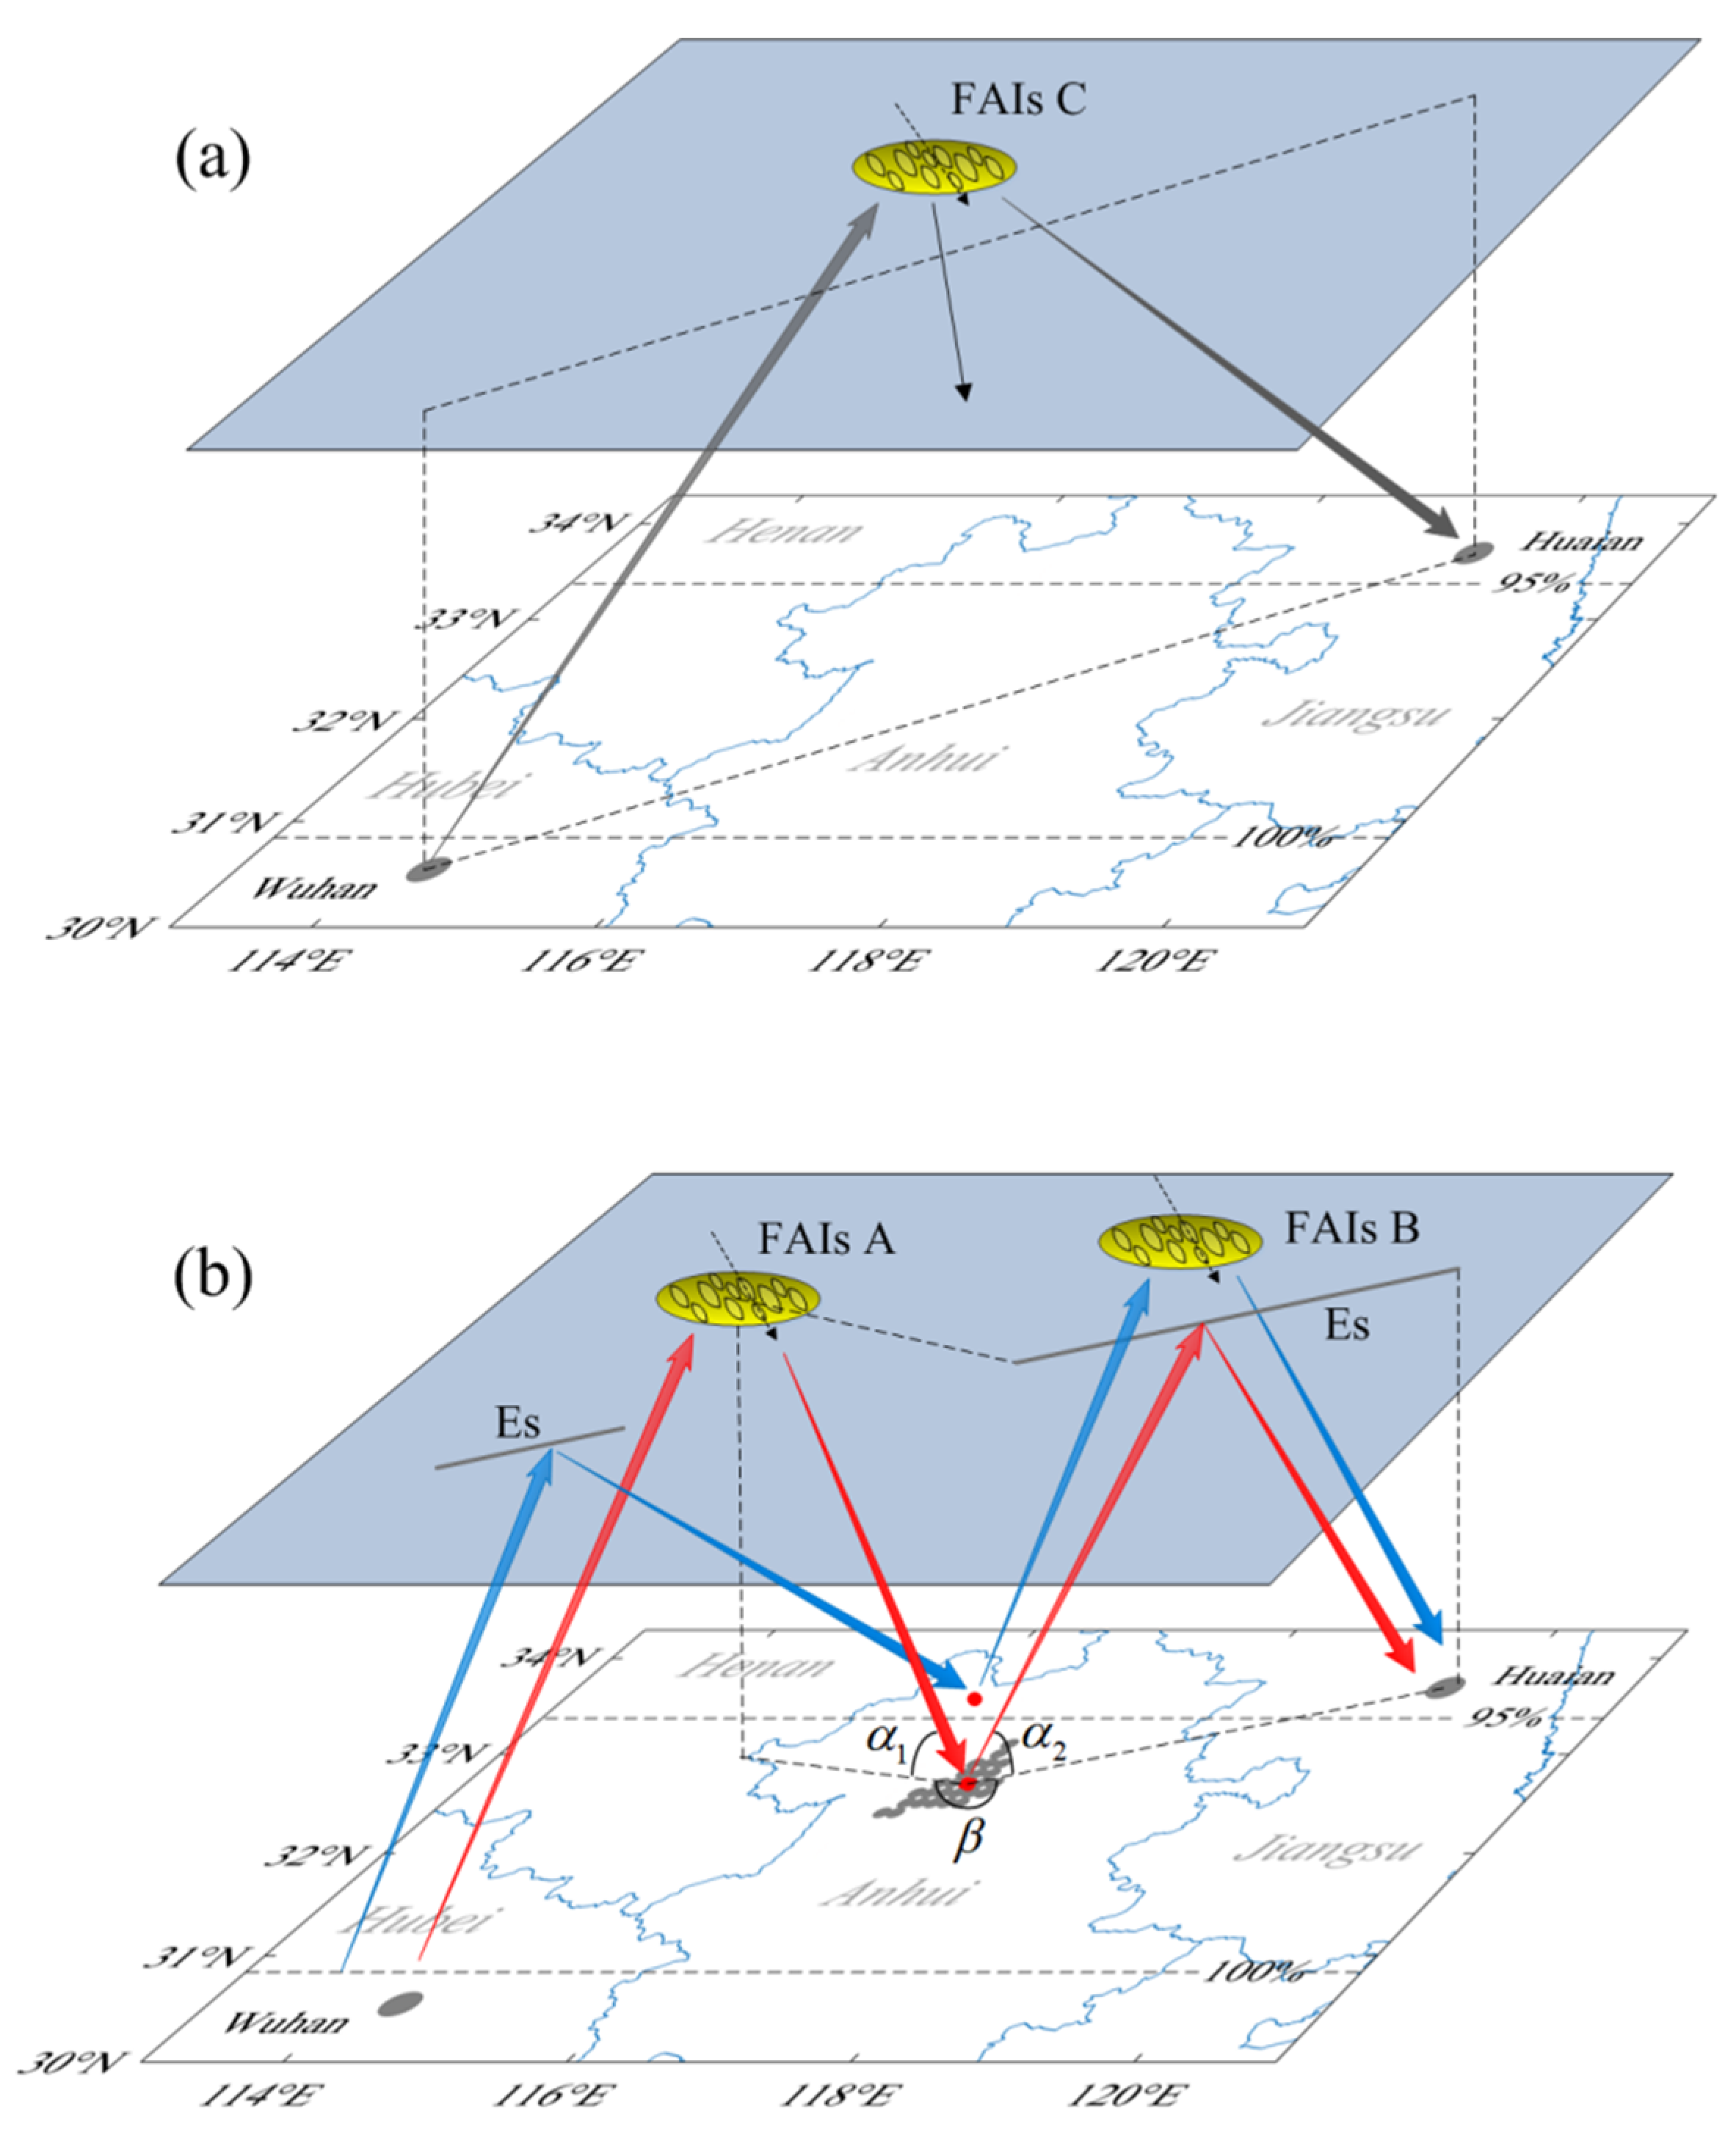
Figure 2 presents the possible ray propagation paths of the echoes received by the Huaian receiver through the FAI scatter and ionospheric reflection. In the bistatic mode of the Huaian receiver, there were two types of one-hop wave paths. The gray lines show the wave path through the Es reflection in the middle of the transmitter and receiver and the red lines show the scattered wave path due to the E-region field-aligned plasma structures. The scattering difference vector of the incident and scattered waves is shown by the purple down arrow, which should be perpendicular to the geomagnetic field B. Given the FAIs hovered at a 100 km altitude, we searched in the International Geomagnetic Reference Field (IGRF) [
24] to find the red ray path, the scattering difference vector of which is vertical to the geomagnetic field, and the scattering point was found at the location 33.12 ± 0.04° N, 116.13 ± 0.16° E. The estimated path length was ~693 km, similar to the 675–712.5 km anomalous echo range in the bottom row of
Figure 2. The elevation angle of the ray from Wuhan was estimated as ~27.4°. As the receiver was in the north-east of the transmitter and the declination of the geomagnetic field in the mid-latitude of China is north-west, the scattering point was in the south of the receiver. The beam elevation of the log-periodic antenna reached 31.8° at a 10.6 MHz frequency. According to its radiation pattern, the elevation angle was close to the computed elevation angle in
Figure 2, so it received the echoes scattered by the FAIs at 10.6 MHz. In brief, it is very likely that the anomalous echoes recorded by the Huaian receiver at around the eclipse maximum were scattered by the FAIs in the E-region.
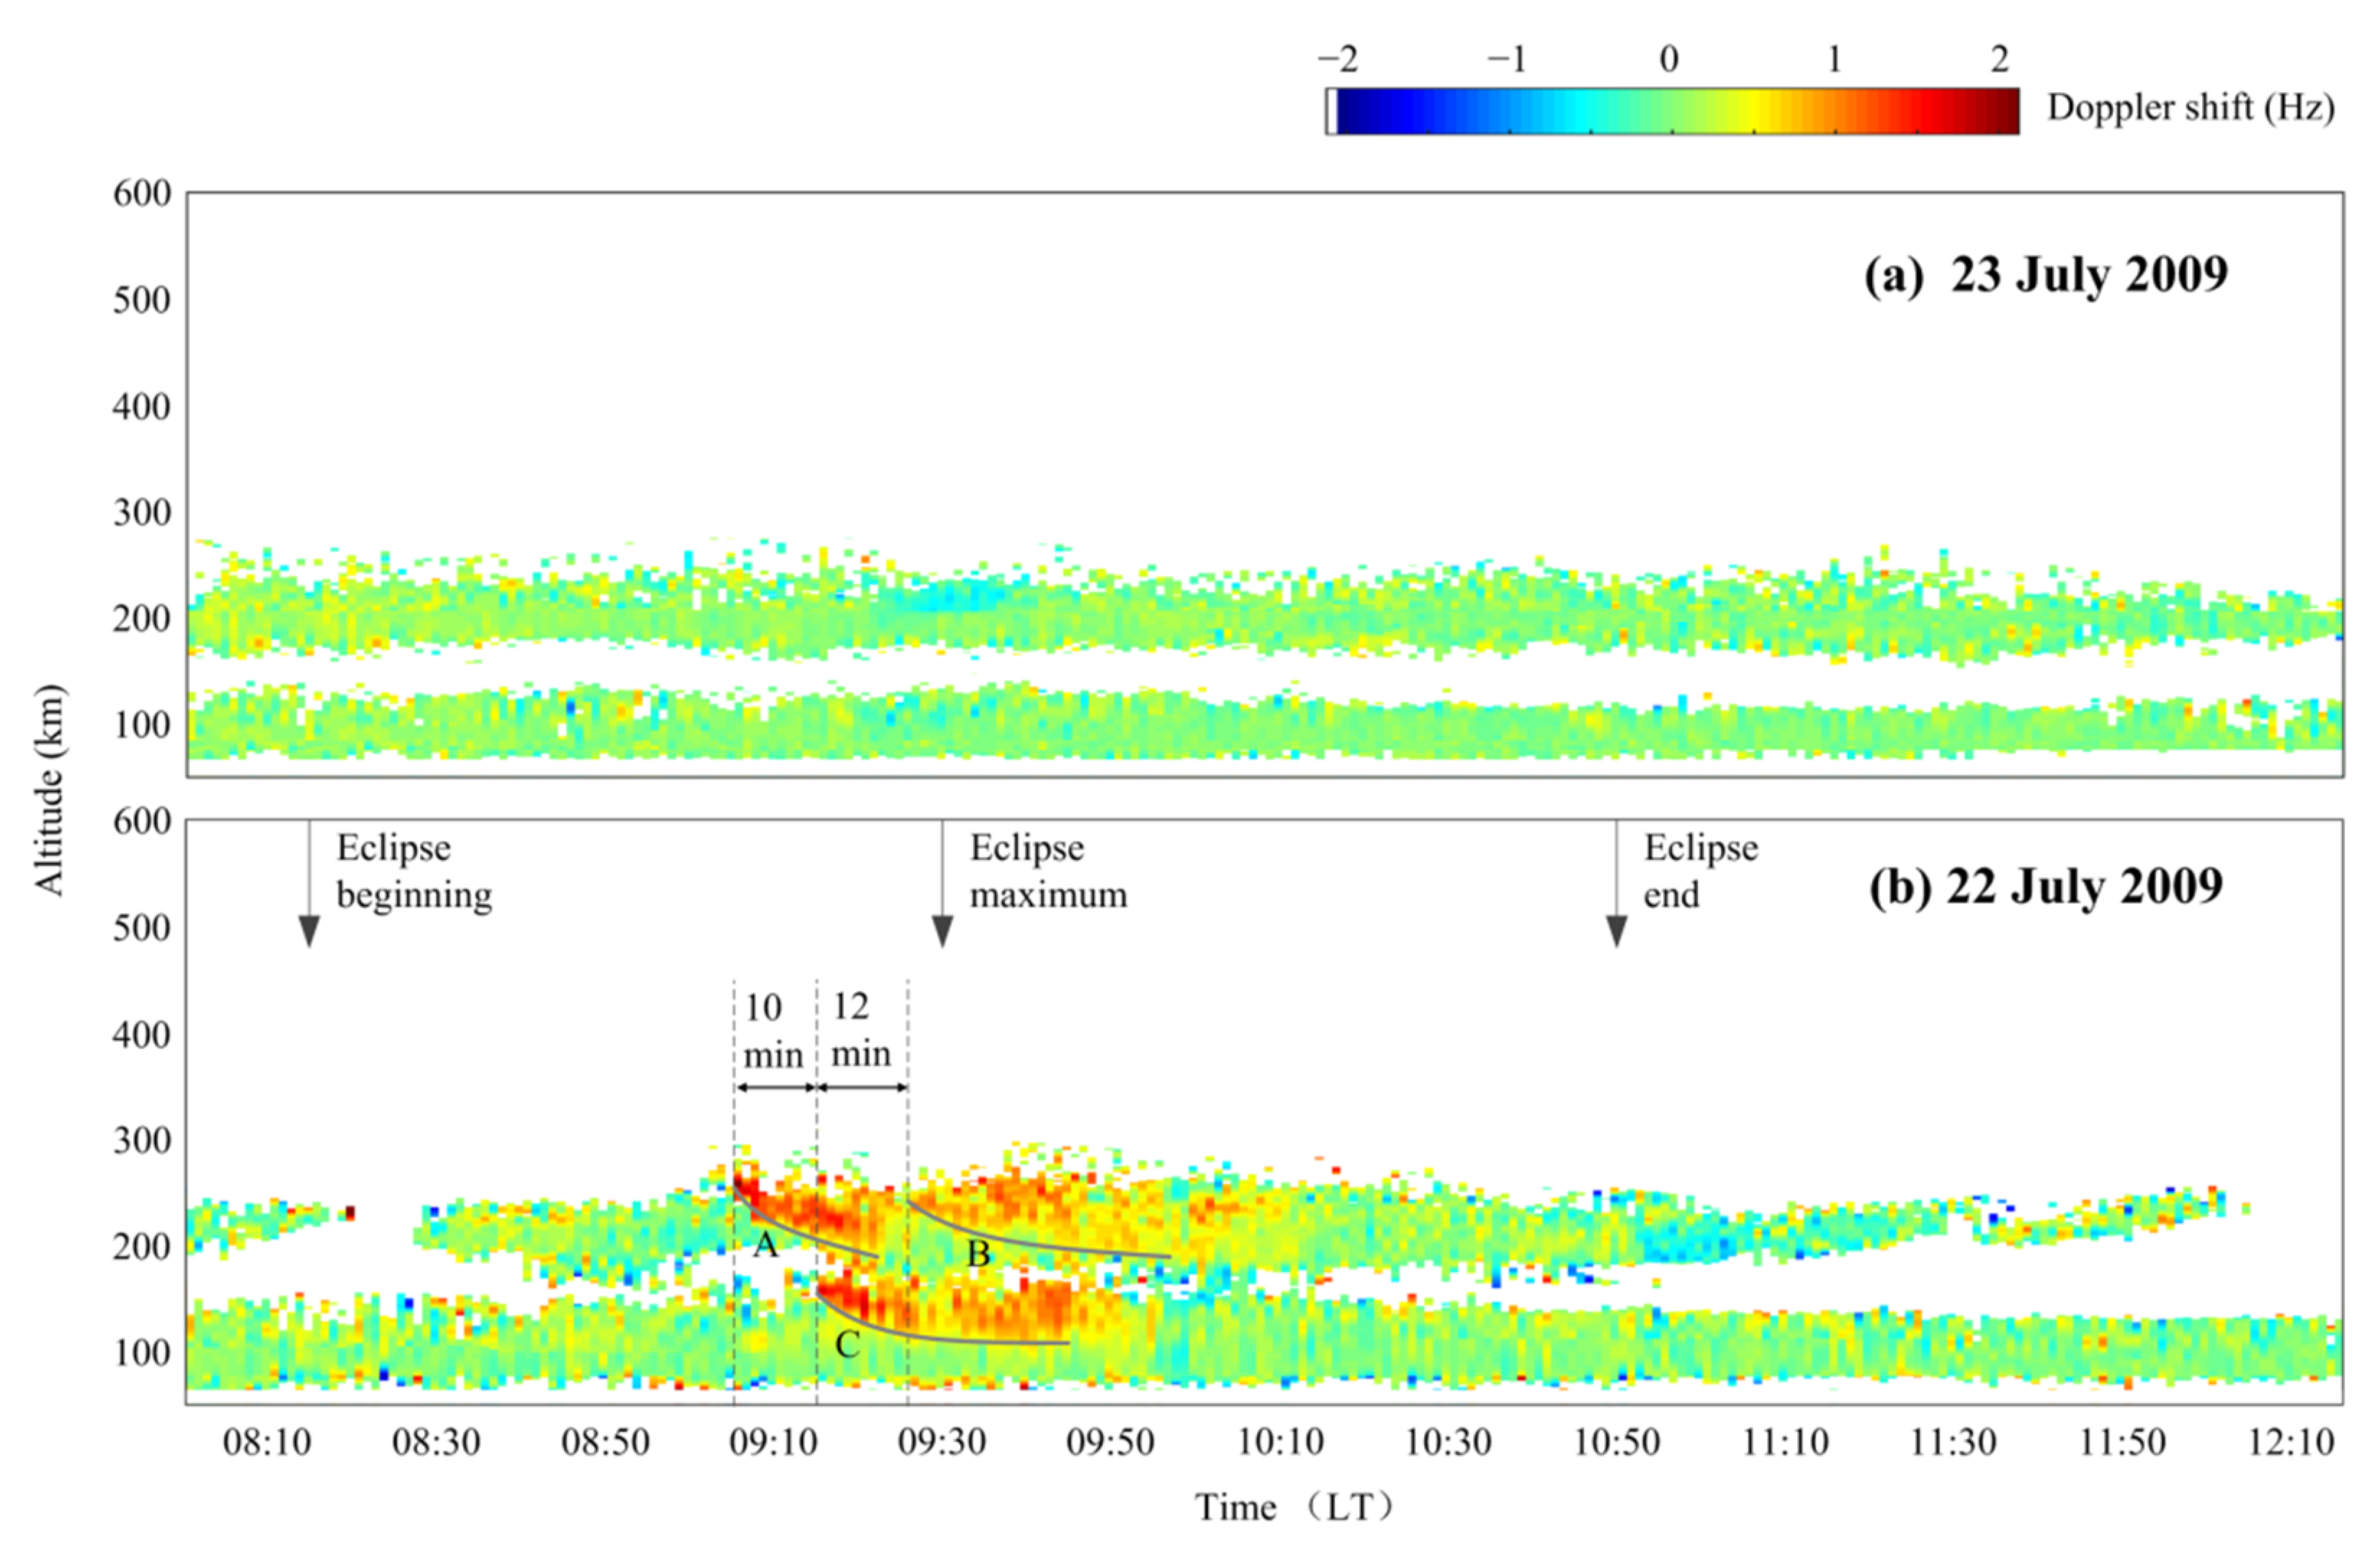
To present the spatial-temporal characteristics of the irregularities, the Doppler shift of each echoes received by the Huaian receiver was gained and drawn in the altitude–time Doppler maps, as shown in
Figure 3. When the reflected and scattered echoes appeared in the same range-gate simultaneously, the Doppler shift of the scattered echo was selected for presentation. The echo Doppler shifts recorded from 08:00 to 12:15 LT on 22 and 23 July 2009 were compared. As shown in
Figure 3a, the echoes observed on the reference day mainly came from the one-hop and two-hop radio waves reflected by the Es layer and most of the echo Doppler shifts were smaller than 0.5 Hz. The midpoint between Wuhan and Huaian is near Hefei (32.12° N, 116.97° E) where the solar eclipse began at 8:16 LT and ended at 10:50 LT. The maximum eclipse happened at 9:29 LT and the maximum eclipse coverage was 99.5%. This eclipse information is labeled as the down arrows in
Figure 3b for reference. On 22 July, anomalous echoes with larger positive Doppler shifts were recorded around the maximum phase of the solar eclipse. The positive Doppler measured by the WIOBSS denoted the downward/southward drifting tendency. Considering the morphological structures of the echoes, we used black curves to indicate the front edges of the three E-region irregularity groups and named them Groups A, B and C. The irregularities of Group C were distributed between 110–171 km and appeared from 9:16 to 9:54 LT. They scattered the one-hop echoes from Wuhan to Huaian and their group ranges were a little more than those of the one-hop reflected echoes. The echoes from irregularity Groups A and B almost overlapped with the two-hop reflected waves and they were the two-hop waves between Wuhan and Huaian. Group A appeared at 9:06 LT and disappeared at 9:26 LT and Group B appeared at 9:28 LT and disappeared at 10:11 LT. As indicated by the vertical dotted lines in
Figure 3b, the irregularities of Group A occurred earliest; ten minutes later, Group C occurred and twelve more minutes passed before Group B appeared. In the next section, we estimate the temporal and spatial dependence of the three groups of irregularities.
3. Positioning of the FAIs
As mentioned before, the anomalous echoes received in Huaian were very likely to have been scattered by the FAIs. According to the field-aligned feature, we estimated the locations of the irregularities. On the basis of rationality and easy operation, broad-beam antennas were used for both transmission and reception in this experiment. The large scattering volume of the broad-beams was unfavorable for the positioning of the observed target. However, E-region FAIs are highly aspect-sensitive and their scattering difference vector is nearly perpendicular to the magnetic field pf the Earth [
25]. Referring to the multistatic meteor radar [
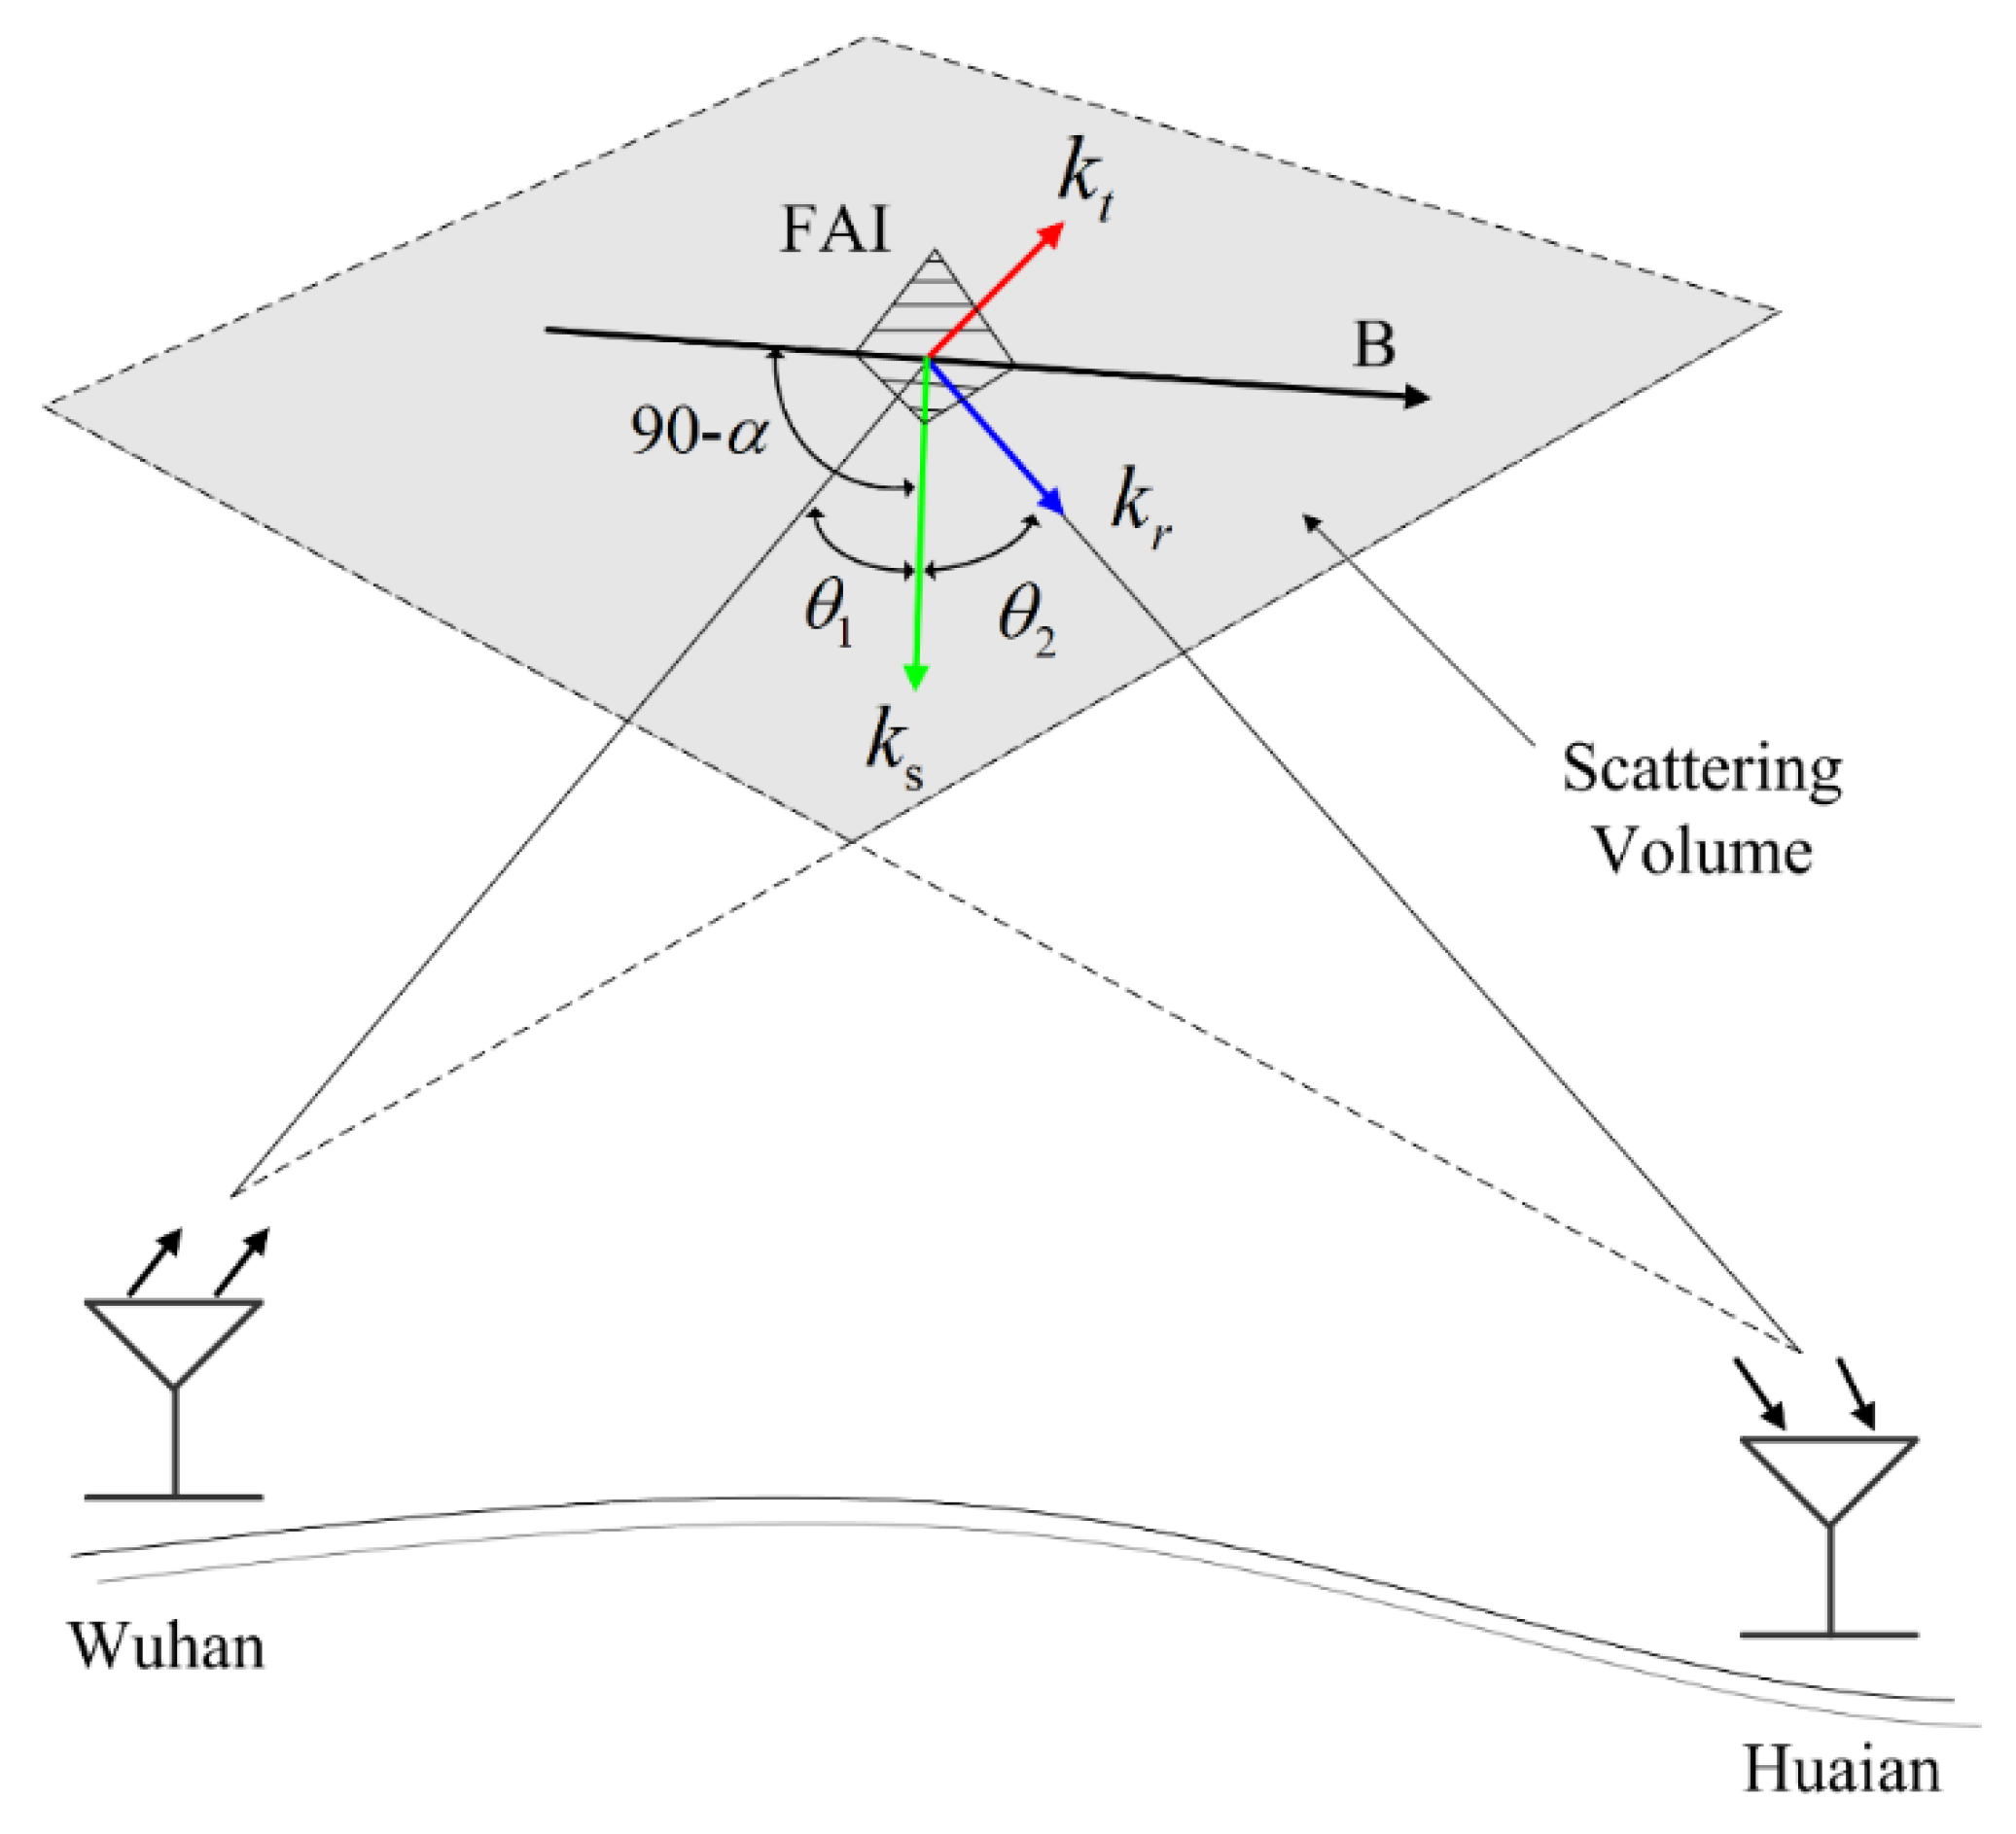
18], the typical FAI scatter geometry for a bistatic radar with broad transmitting and receiving beams is shown in
Figure 4. The red arrow k
t and the blue arrow k
r denote the vectors of the incident and scattered waves, respectively. The scattering difference vector of the incident and scattered waves is displayed by the green arrow (k
s = k
t − k
r). The aspect angle α is the angle between the scattering difference vector ks and the normal to magnetic field vector of the Earth, B; θ
1/θ
2 represents the angle between the vector k
s and the incoming/outgoing ray. When the Bragg scatter occurs on the FAIs, the angle difference (θ = θ
1 − θ
2) should be close to zero. Therefore, for the ideal bistatic observation of the field-aligned plasma structure, both the angle difference θ and the aspect angle α should be equal to zero. Actually, the backscatter vector from E-region FAIs is usually perpendicular to the geomagnetic field within ±0.5° for a monostatic VHF band coherence scatter observation [
26] and it is usually set within ±1° for HF electromagnetic waves [
27]. As for the θ, we allowed a tolerance of ±5° [
28]. Therefore, when estimating the positions of the E-region FAIs recorded by the bistatic WIOBSS, we restricted |α| ≤ 1° and |θ| ≤ 5°.
The irregularities of Group C in
Figure 3b scattered the one-hop waves; the wave path is indicated by the gray arrows in
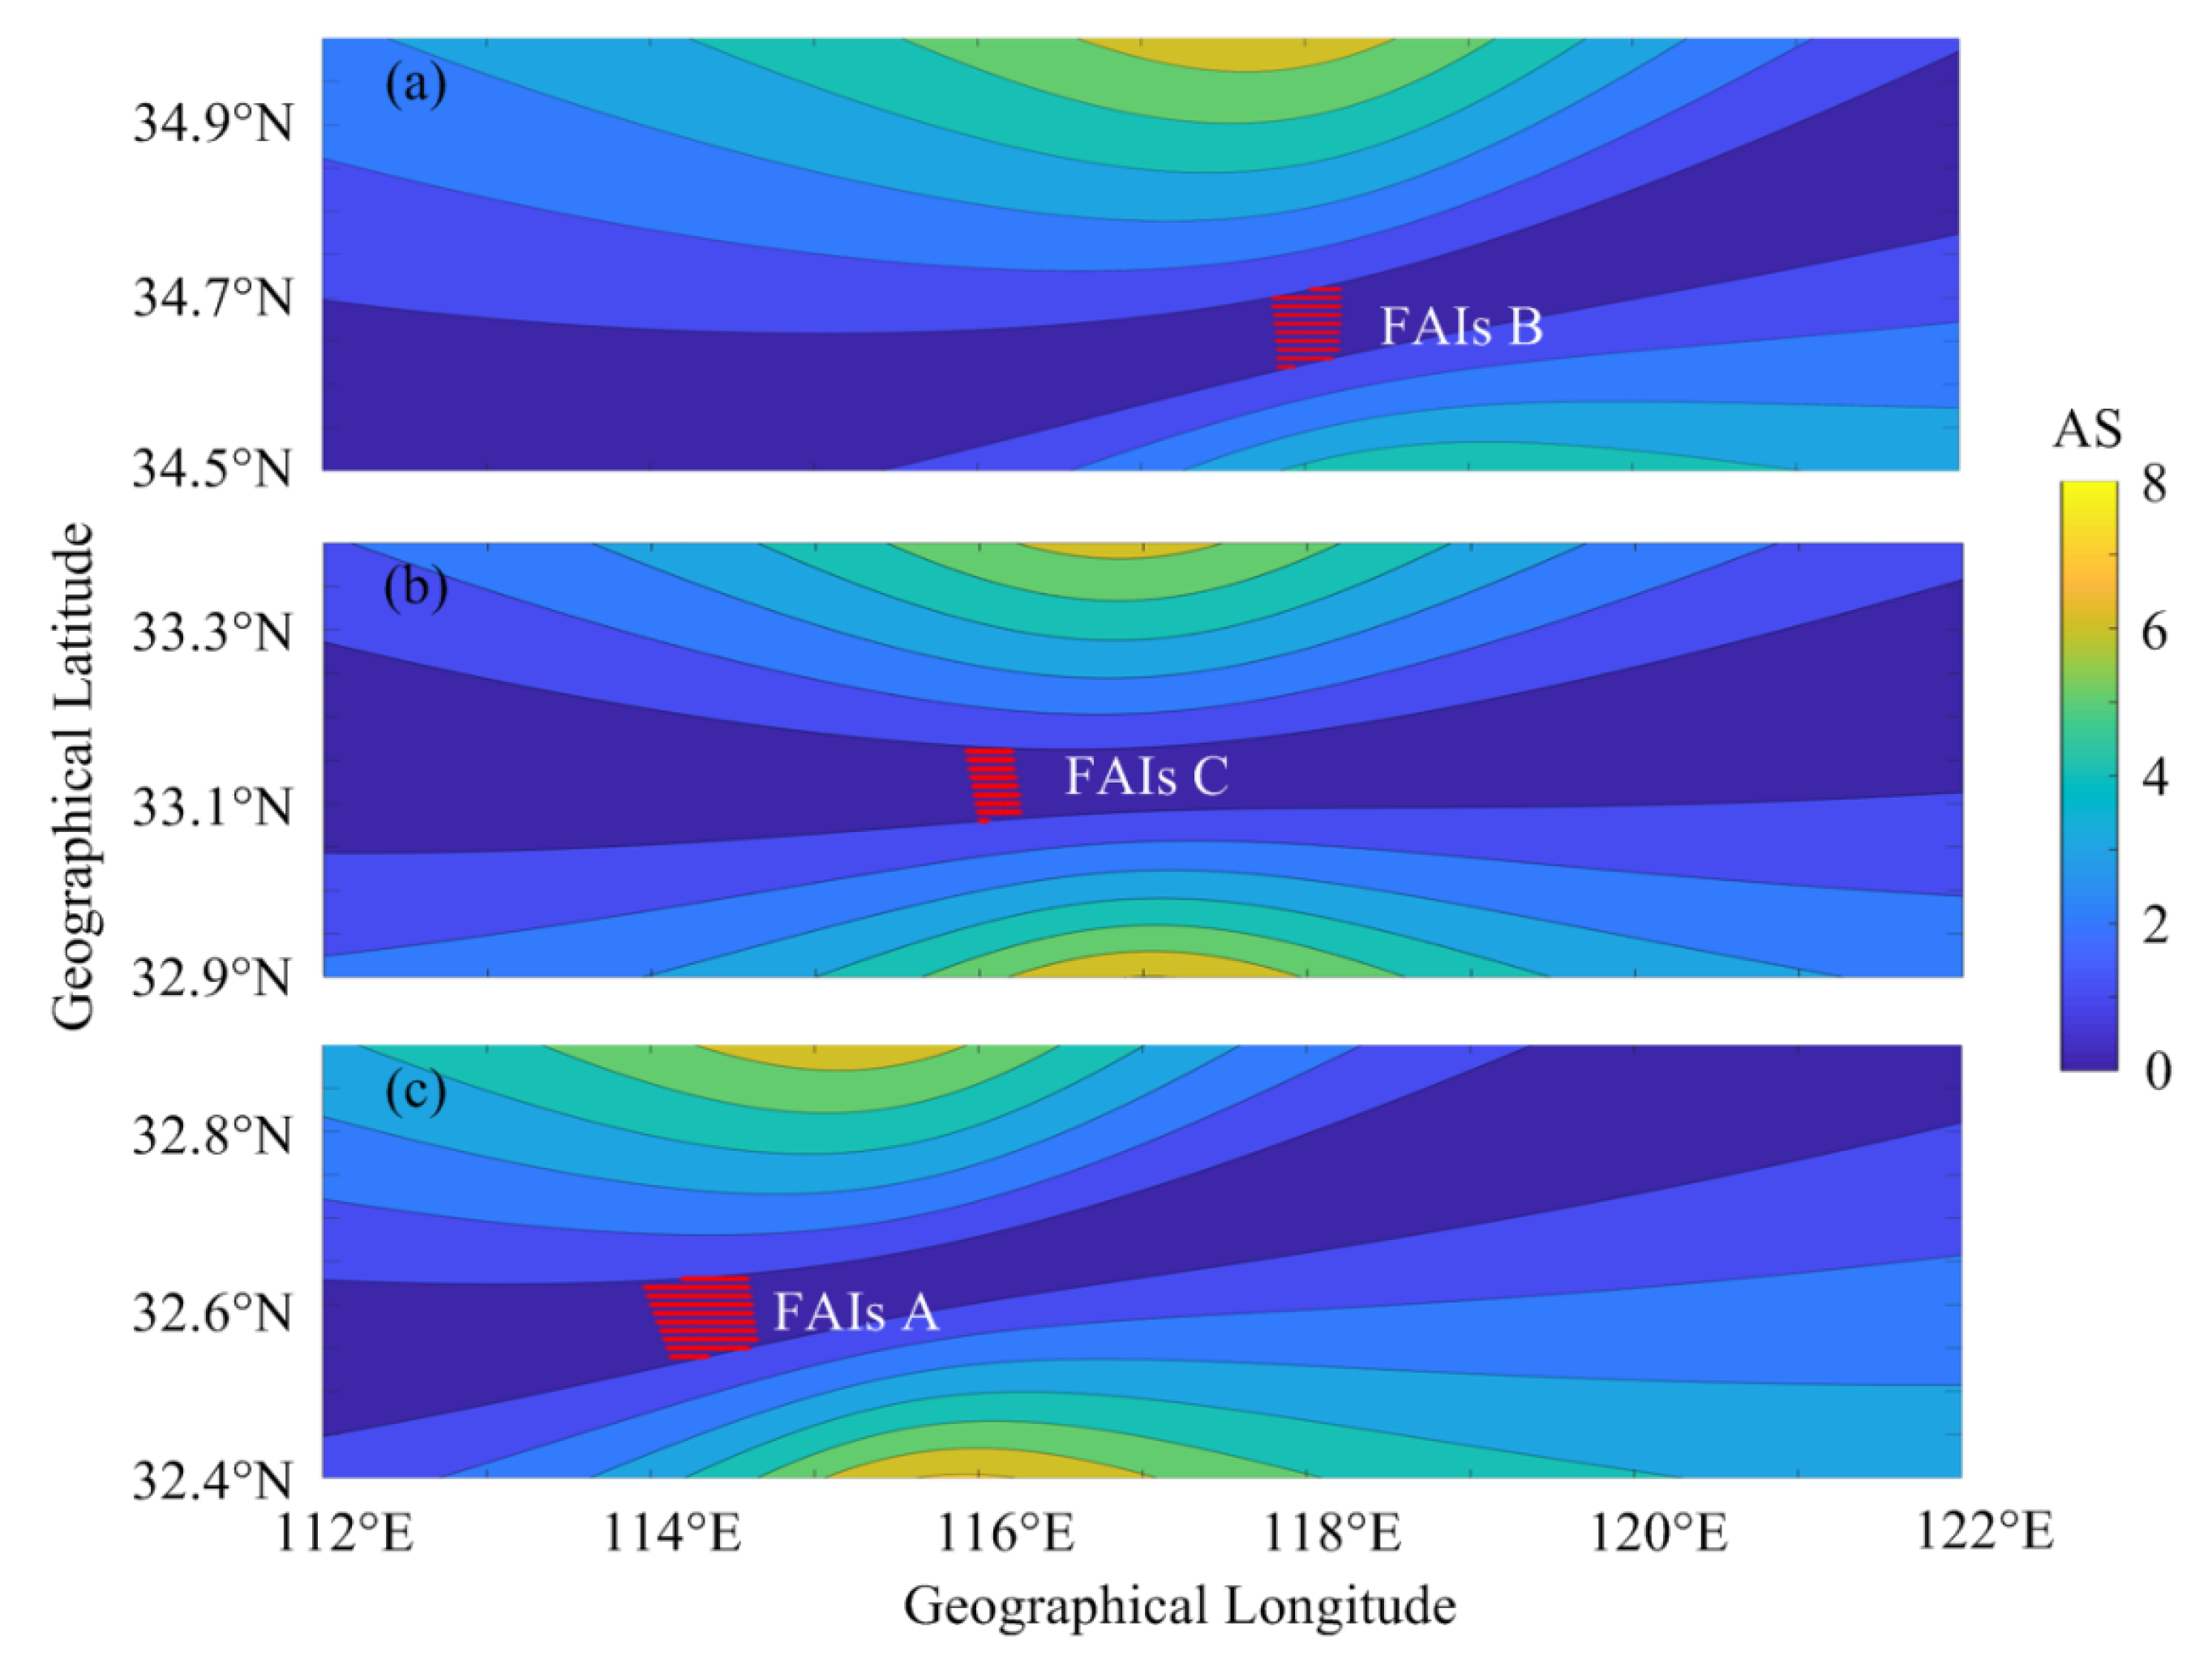
Figure 5a. The positioning of the irregularities for one-hop waves was relatively simple. Firstly, we built the magnetic field model over East China by the IGRF. According to the vertical-incidence ionosonde observations in Wuhan and the one-hop oblique-incidence observations between Wuhan and Huaian, the Es layer spread from 90 to 110 km altitudes at around the eclipse maximum [Chen et al., 2010; 2014]. We searched in the magnetic field model for the positions satisfying the constraint conditions mentioned in the above paragraph in the Es altitudes and with the same group ranges as the one-hop waves. The color bar on the right side of the maps in
Figure 6 denotes the calculated aspect angle (AS) of the scatter points in the maps. It can be seen in
Figure 6b that the perpendicular region (AS = 0) was a belt shape in the east–west direction. The scattering region was then further reduced to the red rectangle region according to the conditions of |α| ≤ 1°, |θ| = 5° and this was the estimated position of irregularity Group C.
The Doppler shifts of Groups A and B were similar to those of Group C but not double those of Group C; therefore, the anomalous two-hop echoes were not scattered twice by the FAIs.
Figure 5b presents two possible paths for the two-hop waves; one was scattered by the FAIs firstly and then reflected by the Es layer as indicated by the red arrows and the other was reflected by the Es firstly and then scattered by the FAIs as indicated by the blue arrows. All the anomalous echoes occurred at around the eclipse maximum and they were very possibly related to the solar eclipse. The lunar shadow moved from west to east and the eclipse-induced irregularities in the west should have appeared earlier. Therefore, as shown in
Figure 5b, the FAIs in the west corresponded with irregularity Group A in
Figure 3b and the eastern FAIs corresponded with irregularity Group B. Taking the two-hop echoes indicated by the red arrows as an example, we estimated the positions of irregularity Group A. The parameters α
1 and α
2 in
Figure 5b are the reflection angles at the ground reflection point and β is the azimuth angle of the reflection rays. Supposing that the ground reflection was a mirror flection, the ideal conditions for the ground reflection points was expected at the areas where α
1 = α
2, β = 180°. According to these conditions, the ground reflection points for the red arrows could be located. Considering the actual situation of the undulating ground, the conditions were set to |α
1 − α
2| ≤ 15°, |β − 180°| ≤ 30°. We then searched in the magnetic field model for all the possible propagation paths of the echoes. The calculation was limited to the range between 30°N and 34.3°N latitudes and between 112° E and 122° E longitudes. The gray spots in the map of
Figure 5b are the possible locations of the ground reflection points. The mean position of the ground reflection points was located at 32.7° N, 116.8° E, which is represented by a red circle. Finally, the estimated positions of irregularity Group A are displayed in
Figure 6c. Similarly, the positions of irregularity Group B were estimated and are shown in
Figure 6a. The emerging locations and times of irregularity Groups A, C and B as well as the corresponding local eclipse information at a 100 km altitude are provided in
Table 1 [
29].
4. Discussion
It is very rare to record eclipse-associated ionospheric FAIs and a large part of the reason may be because there is no coherent scatter radar on most solar eclipse paths. Therefore, although a few cases have been recorded, we are not totally sure of their relationship to the eclipse. The first solar eclipse-induced E-region plasma irregularities were observed by the Gadanki radar on 11 August 1999 [
13]. Other cases were reported during the solar eclipse of 22 July 2009. The MU radar observed the quasi-periodic (QP) echoes at around the eclipse maximum [
10]. The Chung-Li radar observed two patches of the FAIs; one patch appeared at the eclipse maximum with a remarkable Es peak frequency (ftEs) enhancement and the following irregularities occurred with a much higher signal-to-noise ratio (SNR) in the recovery phase and lasted after the eclipse with many periodic ftEs peaks [
11]. The observations over Wuhan, China, also recorded the irregularities appearing in the recovery phase of the eclipse and they continued more than one hour after the eclipse end. The in-phase periodic movement of the ftEs and the Doppler variations of the irregularities implied the possible driver of the gravity waves [
12]. The E-region irregularities were also recorded around the eclipse maximum, as shown in
Figure 3. There are two types of eclipse-related E-region irregularities. One is driven by the eclipse-induced gravity waves, which appear in the recovery phase of an eclipse and can last after the eclipse is over. The other is directly related to the solar eclipse and occurs in the middle of an eclipse period. As indicated in
Table 1, all three FAI groups recorded by the Huaian receiver occurred at around the eclipse maximum and the local eclipse coverage was close to or exceeded 90%. The Wuhan receiver also observed the FAIs at the same period. These may have been the second type of irregularity. In short, the radio systems in East Asia all observed the “rare” E-region irregularities at the eclipse maximum on the 22 July 2009. In particular, the WIOBSS recorded the FAIs at different locations on the eclipse path. Thus, there was a high probability that the solar eclipse induced the E-region FAIs.
It is generally believed that most of the middle latitude E-region irregularities are generated through a gradient drift instability [
30,
31,
32]. As there are no strong electric fields in the mid-latitude E-region, the excitation of the gradient drift instability requires a steep plasma density gradient. When the solar radiation is fully or partially covered by the moon during a solar eclipse, it can create night-like ionospheric conditions. The E-region electron densities had a 20% decrease ~30 min after the beginning of the partial solar eclipse on 23 September 1987 [
33]. During the solar eclipse of 21 August 2017, the E-region electron density in four locations of America was found to have an in-phase decrease and recovered with the eclipse; the maximum density depletion appeared around mid-eclipse [
34]. As the recombination of the molecular ions outside the Es layer is faster than that of the metallic ions inside the Es layer [
35], the metallic ions inside the Es layer are left to form the high plasma density gradient, which is beneficial to the occurrence of the gradient drift instability to generate FAIs. The enhanced echo power as well as the newly emerging four- and five-hop waves recorded by the Huaian and Suzhou receivers showed that more waves were scattered due to the steeper plasma density gradient forming during the solar eclipse [
23]. The fast E-region plasma density decrease under the lunar shadow reduces the field line integrated Pedersen conductivity and so maintains the polarization electric field in the irregularities [
10]. When the solar flux begins to recover, the enhanced photo ionization smooths the plasma density gradient and shortens the polarization electric field, so the eclipse-induced E-region FAIs disappear quickly.


 ,
, 


