Article

Automatic Extraction of Damaged Houses by Earthquake Based on Improved YOLOv5: A Case Study in Yangbi

1
Aerospace Information Research Institute, Chinese Academy of Sciences, Beijing 100101, China
2
University of Chinese Academy of Sciences, Beijing 100049, China
*
Author to whom correspondence should be addressed.
These authors contributed equally to this work.
Remote Sens. 2022, 14(2), 382; https://doi.org/10.3390/rs14020382
Submission received: 8 December 2021 / Revised: 7 January 2022 / Accepted: 10 January 2022 / Published: 14 January 2022
(This article belongs to the Special Issue Intelligent Damage Assessment Systems Using Remote Sensing Data)

Abstract

:
Efficiently and automatically acquiring information on earthquake damage through remote sensing has posed great challenges because the classical methods of detecting houses damaged by destructive earthquakes are often both time consuming and low in accuracy. A series of deep-learning-based techniques have been developed and recent studies have demonstrated their high intelligence for automatic target extraction for natural and remote sensing images. For the detection of small artificial targets, current studies show that You Only Look Once (YOLO) has a good performance in aerial and Unmanned Aerial Vehicle (UAV) images. However, less work has been conducted on the extraction of damaged houses. In this study, we propose a YOLOv5s-ViT-BiFPN-based neural network for the detection of rural houses. Specifically, to enhance the feature information of damaged houses from the global information of the feature map, we introduce the Vision Transformer into the feature extraction network. Furthermore, regarding the scale differences for damaged houses in UAV images due to the changes in flying height, we apply the Bi-Directional Feature Pyramid Network (BiFPN) for multi-scale feature fusion to aggregate features with different resolutions and test the model. We took the 2021 Yangbi earthquake with a surface wave magnitude (Ms) of 6.4 in Yunan, China, as an example; the results show that the proposed model presents a better performance, with the average precision (AP) being increased by 9.31% and 1.23% compared to YOLOv3 and YOLOv5s, respectively, and a detection speed of 80 FPS, which is 2.96 times faster than YOLOv3. In addition, the transferability test for five other areas showed that the average accuracy was 91.23% and the total processing time was 4 min, while 100 min were needed for professional visual interpreters. The experimental results demonstrate that the YOLOv5s-ViT-BiFPN model can automatically detect damaged rural houses due to destructive earthquakes in UAV images with a good performance in terms of accuracy and timeliness, as well as being robust and transferable.

Graphical Abstract

1. Introduction

China is one of the countries with the highest earthquake losses in the world. More than 50% of the total cities and 70% of the great and middle cities in China are located within areas with more than VII degree of earthquake intensity [1] and are threatened by moderate and massive earthquakes. China has experienced many devastating earthquakes with heavy losses. For example, the 12 May 2008 Wenchuan Ms8.0 earthquake in Sichuan Province, with an epicentral intensity of degree XI, led to more than 440,000 square kilometers of affected area, and more than 15 million rooms collapsed [2]. On 14 April 2010, the Yushu Ms7.1 earthquake in Qinghai Province caused more than 80% of the buildings in Jiegu Town to be destroyed [3]. According to China Earthquake Administration (CEA), 80,900 houses collapsed and 129,100 were severely damaged as a result of the 2014 Ludian Ms6.5 earthquake in Yunnan Province [4]. In 2021, the Yangbi Ms6.4 earthquake in Dali Prefecture, Yunnan Province caused damage to many rural houses [5].
After an earthquake, there is an urgent need to quickly and accurately acquire information on the damaged houses or buildings for emergency rescue and damage assessment purposes [6]. However, this has remained a challenging problem in disaster’s emergency management. Generally, field investigation cannot meet the above requirements because it consumes a lot of manpower and material resources with poor efficiency. In addition, it is difficult to carry out field investigations to obtain detailed information on extreme earthquake areas shortly after a strong earthquake, which often not only destroys houses or buildings but also severely interrupts ground transportation and communication with accompanying geological disasters, such as landslide, mudslide, and barrier lake. As remote sensing technology is rapid, macroscopic, and dynamic, it has gradually become one of the most effective means for disaster information acquisition, emergency responses, and disaster assessment. Due to the advantages of low-altitude flexible deployment, UAV remote sensing has increasingly become more important than satellite remote sensing for automated building damage assessment owing to its higher resolution and the lessened impact from clouds [7].
A lot of progress has been made in the detection of damaged houses from damaged roofs to damage degree classification via UAV remote sensing. The representative methods include modified Chinese Restaurant Franchise (CRF)-based unsupervised classification, object-oriented classification, and the deep-learning-based method. In addition, there are some methods that integrate features of the 3D point cloud of Lidar. Li S. et al. proposed a modified Chinese Restaurant Franchise (CRF) unsupervised classification model, which used color and shape features to segment the “roof holes” of slightly damaged rural houses [8]. Its accuracy was 98.62%, showing an improvement of 2.29% and 2.24%, respectively, compared with unsupervised K-means classification and ISODATA. Moreover, Li S. et al. divided the damaged houses into four tiers: basically intact, slightly damaged, partially collapsed, and completely collapsed, based on the elevation information of point cloud data and the spectral and morphological characteristics of UAV orthophotos acquired after the earthquake [9]. Çömert et al. used the object-oriented classification method to extract damaged houses through two UVA images from before and after the simulated earthquake [10]. Mainly based on the spectral, texture, and morphological features of the damaged houses, these methods have their own advantages, but their construction is time consuming, and it is difficult to simultaneously balance their accuracy and efficiency. In recent years, deep learning has benefited from the availability of large datasets and recent advances in architectures, algorithms, and computational hardware [11]. At present, this progress is widely used in some typical applications, such as machine translation, face recognition, autonomous driving, etc. The combination of remote sensing and deep learning is emerging as a fundamentally new approach that could detect damaged houses. Vetrivel et al. used Multiple Kernel Learning (MKL), integrating the features from AlexNet (a Convolutional Neural Network (CNN)) and 3D point cloud features for the detection of damaged houses [12]. The average accuracy when only using CNN features is about 91%; via the integration of 3D point cloud features, a 3% improvement can be attained.
Object detection plays an important role in the interpretation of remote sensing images [13], such as intelligent monitoring, urban planning, precision agriculture, and disaster loss assessment. The current mainstream object detection algorithms are mainly based on deep learning models, which can be divided into region-based algorithms and regression-based algorithms. The former, such as the R-CNN family, in which the region proposals are first generated and then classified, demonstrates a high accuracy but slow speed. The latter is based on the end-to-end concept. For efficient object detection, the representative algorithm is YOLO (You Only Look Once), proposed by Redmon et al. [14,15,16]. YOLOv1 can carry out region proposal, classify proposed boxes, refine the bounding boxes, eliminate duplicate detections, and rescore the boxes being connected together [14]. Therefore, YOLOv1 greatly improves the speed of object detection compared with R-CNN. YOLOv2 [15] uses DarkNet-19 [17] as a Backbone to extract the features, which can increase the resolution of the input image, delete the fully connected layer, and learn better boxes for object detection by K-means and multi-scale training. Pi Y. et al. applied YOLOv2 to detect the roof damage from UAV and helicopter images [18]. It was found that the detection ability is insufficient for small scale targets. Therefore, to improve this, YOLOv3 [16] adopts Darknet-53 as the Backbone for the deeper feature extraction and multi-scale prediction. In order to establish a damaged-houses detection model for earthquake emergency response, Ma H and Liu Y et al. [19] used YOLOv3 and made some improvements by replacing the Darknet53 with ShuffleNet v2 [20], which is a lightweight CNN. This method greatly reduced the number of network parameters, and by using the Generalized Intersection over Union (GIoU) loss function as the bounding box loss function, the speed and accuracy of the detection were significantly improved. Their tests showed that the improved YOLO has the potential to detect damaged houses [18,19]. For the new generation networks, the improvements in data enhancement and network architecture are commonly used. Based on YOLOv1, YOLOv2, and YOLOv3, YOLOv4 [21] was constructed by Bochkovskiy A. through optimizing the data enhancement algorithm, the Backbone, the Neck, etc., to improve the detection accuracy while simultaneously ensuring the detection speed. Jocher G. et al. proposed the latest YOLOv5 [22] via a series of improvements, such as utilizing the Pytorch deep learning framework, mixed precision and distributed training, optimization for the trunk network, etc. The training time was reduced and the detection accuracy was improved. In addition, the experiment showed that the fastest detection speed for natural images can reach 0.007 s per frame, and the model can realize real-time detection for natural images. Lema D.G et al. found that YOLOv5 could achieve the highest accuracy compared with YOLOv2, SSD, and Azure Custom Vision for the detection of livestock activity scenes [23]. Moreover, some studies have also transferred YOLOv5 to remote sensing images and have demonstrated the adaptability of YOLOv5 in different scenarios. YOLOv5 mainly includes four models, named YOLOv5s, YOLOv5m, YOLOv5l, and YOLOv5x [22]. YOLOv5s has the smallest depth and width for the network. To reduce the misdetection rate for occluded and densely arrayed ships in aerial images, Zhang H. et al. improved YOLOv5s by using the Complete Intersection over Union (CIoU) loss function and Distance Intersection over Union_Non-Maximum Suppression (DIoU_NMS) algorithm to replace the GIoU loss function and NMS algorithm, respectively [24]. To solve the problem of the high density and overlap of wheat spikes, Zhao J. et al. improved YOLOv5 by adding a microscale detection layer to detect small-sized wheat spikes in UAV images [25]. These two applications successfully transferred YOLOv5 to aerial and UAV images.
To meet the post-earthquake emergency response requirements, in our study we attempt to transfer YOLOv5 to the detection of damaged houses using UAV images. Regarding the complex background to damaged houses in earthquake-stricken areas due to the influence of the undamaged houses, the stacking of building materials and occlusion by trees, as well as the inconsistent resolution of UAV images, YOLOv5s, which has the smallest volume in YOLOv5, was selected to improve the model due to the strong demand for time efficiency. Based on this, YOLOv5s-ViT-BiFPN was established. To verify our model’s feasibility, we used it to detect the damaged houses in areas that were seriously stricken by the Yangbi Ms6.4 earthquake in Yunnan Province using UAV orthophotos.

2. Materials and Methods

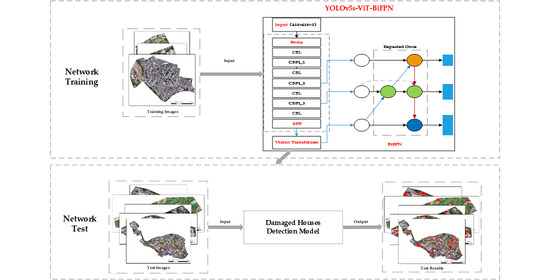
This study constructed an improved YOLOv5, named YOLOv5s-ViT-BiFPN, to detect houses damaged by the earthquake. Its main steps include: (1) standard block clipping and annotation for the UAV orthophotos; (2) constructing YOLOv5s-ViT-BiFPN; (3) model training and validation; (4) using the well-trained YOLOv5s-ViT-BiFPN to detect the damaged houses for each standard image block with a size of 416 pixels; and (5) recovering the geographical coordinate information for the detection results. The flow is shown in Figure 1.
The construction and the improvements for YOLOv5s-ViT-BiFPN are introduced in the following parts.

2.1. Study Area and Data

At 21:48:34 on 21 May 2021, the Ms6.4 earthquake occurred in Yangbi County, Dali Prefecture, Yunnan Province, in China. The epicenter was located at (25.67° N, 99.87° E) and the focal depth was 8 km. The earthquake, which had a maximum epicentral intensity of VIII and covered an area of about 170 km2, mainly affected the three towns of Cangshanxi, Yangjiang, and Taiping in Yangbi County. As several small earthquakes occurred before this earthquake, the local people became alert about the earthquakes, so there were few casualties. However, the houses in these rural areas were built with low seismic capacity due to economic reasons and weak awareness of seismic prevention [26,27,28], so the earthquake caused a number of houses to become severely damaged or collapse in the VII–VIII intensity zone. According to the statistics from the local government, the damaged houses involved nine towns of Yangbi County, so 232 rooms collapsed and 13,930 suffered medium and slight damage [5].
Cangshanxi Town of Dali Prefecture was the most seriously stricken area of the seismic intensity VIII zone, involving eight villages of Beiyinpo, Jinniu, Xiajie, Baiyang, Cunwei, Baimu, Hetaoyuan, and Longjing. We used this as our study area, as shown in Figure 2. Their locations were labeled by red dots and letters from a to h. The categories for the house structures in the study areas were soil/beam, soil/wood, stone/wood, brick/wood, brick/concrete, and frame structure. A total of 80% of the houses were the first three structures, which have poor anti-seismicity [26]. The damaged houses in this study were mostly the soil/beam, soil/wood, and stone/wood structures. The main types of damage for houses in the area were roof cracks, partial roof collapse, and total roof collapse. This was verified by field investigation, as shown in Figure 3.
The UAV data for above eight villages were acquired and processed to eight ortho images by the Shanghai Ocean University and the Aerospace Information Research Institute, Chinese Academy of Sciences (AIR/CAS). The post-seismic UAV images were acquired by DJI Phantom 4 on 23–25 May 2021, and the flying heights were between 50 and 200 m. All of the images we used were taken from repeated paths of UAV flight, as shown in Figure 4. The spatial resolution of the orthophotos is between 0.01 and 0.06 m. The data were divided into two parts for individual training and testing for our proposed model.
In order to prepare the training samples for YOLOv5, 400 image samples (including 860 damaged houses) were selected from the images (a–c) shown in Figure 4. Each sample image contained at least one damaged house. The default size of the input image for YOLOv5 is 640 × 640 pixels. However, considering its training efficiency and the comparison with YOLOv3, for which the default size of input image is 416 × 416 pixels, we adopted the smaller input size, as used for YOLOv3. The three training UAV images were separately clipped into sub-images of 416 × 416 pixels. The sub-images that contained the damaged houses were manually and randomly selected as the samples. Each damaged house was annotated with a vertical bounding box by LabelImg (a free annotation tool). Figure 5 shows examples of damaged houses annotated by the LabelImg, which can save the annotations as XML files. The annotation files contain the corresponding information of the coordinates and classes of each ground truth bounding box for the images. In order to verify the detection accuracy by YOLOv5 and to test its robustness performance, images (d–h) were taken as the transferability scenes for this model.

2.2. Improvement of YOLOv5s

YOLOv5 is the latest YOLO object detection model. The improvements in the optimization of trunk network and the use of the latest Pytorch framework can reduce the training time and improve the detection speed [22]. Its network architecture consists of four modules, including input, Backbone, Neck, and Head [24,29], as shown in Figure 6. We depicted the network structure of YOLOv5 by referencing [22].
For the input images for YOLOv5, to improve the generalization performance of the model, generally, data enhancement is used as the essential procedure. The common methods, such as image rotation, image reversal, and color space transformation, are broadly used. Additionally, mosaic data enhancement is used in most cases to reduce the generalization errors [22]. This combines four images into one image in a certain proportion to increase the background complexity, reducing the amount of computation and improving the robustness and detection speed. Examples are shown in Figure 7.
The Backbone module for YOLOv5 is used to extract the features of the damaged house from the input image [25]. It is based on the Focus structure [22], Cross Stage Partial Network (CSPNet), and Spatial Pyramid Pooling (SPP). Conv refers to the convolutional operation for feature processing. CBL, as shown in Figure 6, consists of a convolutional (Conv) layer, batch normalization (BN) layer, and activation layer using a Leaky ReLU. Concat is used to combine features. CSP is short for CSPNet.
The Focus structure is shown in Figure 8. The Focus can reduce the parameters of the model and memory space of GPU for themodel’s execution and speed up the model. The first step in its construction is to slice the input image, and the second is to merge the results into Concat operation. After these two processes, the number of channels for the merged image is increased by four times compared to those of the former images without information loss. The final step is to implement the convolution operation to expand the number of channels of the feature map. We depicted the structure of Focus as in reference [22].
The structure of CSPNet is shown in Figure 6. CSPNet includes two types of structures; the difference is the repeated numbers of ResUnit. CSP2 has deeper layers that can extract deeper features [30]. The input feature layer is divided into two parts by splitting the channels equally. One part is transformed into a cross-stage hierarchical structure and then concatenated with the other to the next convolutional layer. This structure not only reduces the computations of the model but also achieves a richer combination of features and improves the speed and accuracy of the detection.
The SPP module can increase the receptive field. A large receptive field can perceive the target information and separate the most important context features from the input feature layer [31].
The Neck module’s main function is to generate the feature pyramid, so that the model can identify targets at different scales. YOLOv5 uses Path Aggregation Network (PANet) [32], which makes it easier to transfer low-level features to high-level features using the bottom-up path on the basis of the Feature Pyramid Network (FPN).
The function of the Head module is the same as YOLOv3 and YOLOv4, which can predict the class probabilities and the bounding boxes of the targets on three scales (13 × 13, 26 × 26, 52 × 52).
YOLOv5s has the smallest network depth and width, the shortest training time, and the fastest detection speed compared with YOLOv5m, YOLOv5l, and YOLOv5x. For this reason, we utilized it to construct the damaged houses detection model.
However, the original YOLOv5s cannot fully meet the testing requirements due to the complexity of the background of damaged houses in UAV orthophotos, such as the influence of undamaged houses, stacked construction materials and other objects, the shading of trees, and the scale of the damaged houses, which are inconsistent in the different images due to the changes in flying height. Therefore, we proposed an improved model, YOLOv5s-ViT-BiFPN, based on YOLOv5s network architecture, for the detection of damaged houses. Firstly, Vision Transformer was introduced to modify the backbone network to integrate information from global features and focus on the target characteristics. Secondly, the feature fusion network was further optimized, and the original feature extraction network PANet of YOLOv5s was replaced by BiFPN to enhance the ability to fuse multi-scale information due to the different scales of damaged houses.

2.2.1. Improvements for Backbone

As the current CNN struggled to extract features from global features, the use of Multi-Head Attention, Transformer, allows the model to jointly integrate to the information from the whole inputs at different positions [33]. For a standard Transformer, the input is one-dimensional data. The Vision Transformer attempted to transfer the Transformer into image-processing domains and verified that a pure Transformer can perform well in image classification tasks [34]. Regarding the complexity of remote sensing images, we utilized a hybrid form by adding a Transformer to the CNN. Thus, the model could maintain the feature-extraction ability of CNN for deep features and the ability to extract the global features of Transformer at the same time.
Vision Transformer consists of Patch Embedding and Transformer Encoder. Firstly, Path Embedding was used to make the input’s dimension fit in the Transformer Encoder. Secondly, due to the loss of the descending dimension, the position embedding operation was added to restore the position information. Finally, the vector sequence was provided to a Transformer Encoder. The original Transformer encoder consists of multi-head attention and Multilayer Perception (MLP) layers. To allow the model to focus more on the target features and increase the number of parameters as little as possible by the Vision Transformer structure, we replaced the MLP layer with two fully connected (FC) layers and chose four heads for multi-head attention.
In this study, a Vision Transformer was introduced into the Backbone by adding the last layer of the Backbone feature extraction module. Furthermore, 416 × 416 × 3 (height × width × channel) refers to the size of the input image, with three channels. After the feature extraction by Backbone, the original image was transformed into the feature map with the size of 13 × 13 × 512 (height × width × channel). Therefore, the input size for Vision Transformer was 13 × 13 × 512 (height × width × channel). Through Patch Embedding, the dimensions for the feature map were 169 × 512 (length × channel). Positional Embedding uses a simple additive operation by a learnable vector. The input and output vectors for Transformer Encoder had the same dimension, as shown in Figure 9. We depicted the structure of our modified Vision Transformer by referencing [34].
The YOLOv5s-ViT was constructed by integrating the relationship between pixels in different locations in the feature map to enhance the key information.

2.2.2. Improvements for Neck

Generally, it is hard to maintain the exact same initial resolution for UAV images due to the changes in flying height. For this study, the resolution of the UAV images we obtained was between 0.01 and 0.06 m. Therefore, for damaged houses with multiple scales, we improved the Neck module in order to improve the detection accuracy.
Although PANet in YOLOv5 achieved good results for multi-scale fusion through up-sampling and down-sampling [21], its volume of computations was large. However, the Bi-Directional Feature Pyramid Network (BiFPN) could allow for an easy and fast multi-scale feature fusion. It adopted the cross-scale connection to remove the nodes which contribute less to feature fusion in PANet and added the additional connections between input and output nodes for the same level [35]. We used BiFPN to improve the Neck module for this study, and one-layer structure BiFPN was utilized to improve the training efficiency of the model, as shown in Figure 10.
Using the above improvements for this study, based on Vision Transformer and BiFPN, the YOLOv5s-ViT-BiFPN was established to detect damaged houses in UVA orthophotos. Its structure is shown in Figure 11.

2.3. Experimental Configuration

For training the YOLOv5s-ViT-BiFPN, the hardware configuration includes Intel Core i7-8700@3.7GHz six-core processor, 32 GB memory, and NVIDIA GeForce RTX 2080Ti graphics card. The software environment is Windows 10 Professional 64-bit operating system. Pytorch framework was the tool used to build the damaged houses’ detection model, using Python3.6.13 as the programming language, CUDA11.1 as the GPU computing platform, and the GPU acceleration library by CUDN10.0 deep learning.
The model was trained using an initial learning rate of 0.01, Batch Size 2. Adam’s optimization method was used, with a maximum number of iterations of 200.

2.4. Evaluation Metrics

In order to evaluate the performance of the detection model, Precision (P), Recall (R), Average Precision (AP), and F1 score [19] are usually used for the quantitative analysis. The detection speed of the model was evaluated by Frames Per Second (FPS). P, R, and F1 were assessed by Equations (1)–(3), respectively.
P = TP TP + FP
R = TP TP + FN
where TP refers to the number of correctly detected targets, FP refers to the number of non-targets incorrectly detected as a target, and FN refers to the number of undetected targets. If an object’s predicted bounding box does not completely match the ground truth, it does not mean that the detection is wrong. A common solution is the Intersection over Union (IoU). IoU is the ratio of the bounding box, predicted by the detection and the ground truth bounding box. If the IoU value is greater than the defined threshold, then the detect is correct (TP); otherwise, it is wrong (FP).
F 1 = 2 P · R P + R
The recall Precision–Recall Curve (PRC) is a curve with the recall rate as the abscissa and the accuracy as the ordinate. The area under PRC is called the average precision (AP), which can be assessed by Formula (4).
A P = 0 1 P ( R ) dR
FPS refers to the number of frames that can process a specified size image per second. It is used to measure the running speed of the object detection model. The higher the FPS, the faster the model runs and the better the real-time performance.

3. Results

3.1. Performance of the Model

To verify the accuracy of the improved YOLOv5s-ViT-BiFPN, the same damaged-houses dataset was also used in the training comparison with YOLOv5s and YOLOv5s-ViT. The change curves for the loss function and AP during training are shown in Figure 12. This shows that the curves for loss function and AP for these three models gradually remain stable with the increase in training time, but there are obvious differences in the variation characteristics. In Figure 12a, the amplitude fluctuation of the loss function curve of the YOlOv5s-ViT-BiFPN first remains stable, starting from the purple vertical line, and the loss value is the smallest. The loss function curves of YOLOv5s and YOLOv5s-ViT have a larger amplitude fluctuation and slower convergence speed, and their loss values are larger than that of Yolov5s-ViT-BIFPN. In Figure 12b, the amplitude fluctuation of AP for YOLOv5s-ViT-BiFPN first remains stable starting from the vertical orange line, and its AP value is the largest. The amplitude fluctuations in AP for YOLOv5s and YOLOv5s-ViT are relatively larger, and their AP values are smaller than those of YOLOv5s-ViT-BiFPN.
It was found that the convergence speed of YOLOv5s-ViT-BiFPN is faster, the loss value is smaller, and the accuracy is higher among the three models.
Taking the detection of damaged houses caused by the Yangbi earthquake in Yunnan as a case, the results are shown in Table 1 and Figure 13. Compared with YOLOv3, the accuracies for YOLOv5s, YOLOv5s-ViT, and YOLOv5s-ViT-BiFPN were significantly improved, and the APs increased by 7.54~9.31%. The number of parameters decreased by more than 14 times. The inference efficiencies for the models were increased by about three times; their training time decreased more than four times. Compared with the YOLOv5s, the performance of YOLOv5s-ViT was significantly improved by adding Vision Transformer. The precision, recall rate, F1, and AP increased by 3.49%, 2.78%, 3.14%, and 1.23%, respectively. By adding Vision Transformer structure, the accuracy of YOLOv5s-ViT significantly improved, but the detection speed and the number of parameters for the network were the same as that of YOLOv5s and its training time slightly increased. Compared with YOLOv5s, the precision, recall ratio, F1, and AP of YOLOv5s-ViT-BiFPN improved by 4.04%, 4.81%, 4.43%, and 1.77% respectively. By replacing PANet with BiFPN, more features can be fused, its accuracy is further improved, and the training time was reduced by about 15 min. However, the detection speed was slightly lower than YOLOv5s, which does not impact the real-time detection, because it can be realized so long as the FPS is greater than 30 f/s.

3.2. Applicability of the Model on Test Images

In order to test the detection of damaged houses using YOLOv5s-ViT-BiFPN, the UVA orthophotos for the five test areas mentioned in 2.1 are used. The results are shown in Figure 14. The red spots are the correctly detected damaged houses, and the green spots are the detection omissions. Most of the damaged houses were detected, but a small number of them were omitted. There are two main reasons for the omission: one is the shelter of the surrounding tall houses, and the other is slight damages.
To compare these with the visual interpretation results, the ratio of damaged houses that were correctly detected by the model and visual interpretation was used as the evaluation index in the five test areas. Figure 15 shows example detection results in test areas by YOLOv5s-ViT-BiFPN. The results demonstrate that accuracies of the trained YOLOv5s-ViT-BiFPN were 90.91%, 90.32%, 90.41%, 92.20%, 92.31%, respectively, as shown in Table 2. Its average accuracy was above 90%, and the detection time was less than 95 s. The total amount of data for the test images was 5 GB, and the total detection time was about 4 min. This proves that YOLOv5s-ViT-BiFPN can achieve high accuracy and efficiency in the detection of damaged houses in UAV orthophotos.

3.3. Transferability of the Model in Ya’an Earthquake

When applying our method to different earthquakes or places, limitations can be encountered, including similar spatial resolutions and the same type of rural houses. We used some examples from references [8,9] to test the applicability of our method to the 20 April 2013, Ya’an Ms7.0 earthquake in Sichuan Province. As shown in Figure 16, each damaged house in the six test images can be detected by our method, which also presents a good performance in terms of its detection accuracy.

4. Discussion

In this study, we proposed a damaged-houses detection method named YOLOv5s-ViT-BiFPN based on the improvements to the Backbone and Neck of YOLOV5s. We used samples from the UAV training images to train and to evaluate the adjusted YOLOv5s and examined the transferability of YOLOv5s-ViT-BiFPN with a good performance for the test UAV images. The test areas for our study are independent from the training samples, so the high accuracy in the detection of damaged houses on the five different test images can verify the transferability of our model. In addition, it is usually hard to interpret what the components of CNNs predict. Therefore, we used a Grad-CAM map to visualize the detection process and offer reasonable explanations for seemingly unreasonable predictions. The strengths and weaknesses of this study, as well as future research, will also be discussed.

4.1. Visualization of the Feature Maps

In order to explain how our model makes decisions, we tried to visualize the components of the detection of damaged houses. Simply visualizing the feature maps, as shown in Figure 17, is unclear. Class Activation Mapping (CAM) [36] is a tool used for visualizing CNNs, which can help to identify which regions of an image are used for discrimination. However, this approach needs to perform global average pooling over convolutional maps, which is not applicable to all CNN architectures. Without altering the original architecture, Gradient-Weighted Class Activation Mapping (Grad-CAM) [37] uses the class-specific gradient information in the final convolutional layer to produce heatmaps of the important regions. In this study, we utilized the latter without requiring architectural changes or retraining.
We used four examples to visualize the decision-making process, as shown in Figure 18. We only show some key Grad-CAM maps of the network, including the first layer, the Vision Transformer layer, the BiFPN structure, and the output layer. The heatmaps highlight the regions for the extraction of damaged houses. However, there were no obvious indications of any targets in the heatmap of the first layer because the first-layer features are commonly general features that cannot be used to extract complicated targets. After the feature extraction of the Backbone and Vision Transformer layer, the heat points gradually moved closer to the targets. However, there was still a slight deviation from the real targets. The BiFPN was used to aggregate multi-scale features, excluding other interference and detecting the real target. Through the output layer, the final results were produced and the heatmap showed the exact same locations for damaged houses as the bounding boxes. At this point, the process of detecting damaged houses in the image was finished. This part is important in this study, as it helps to explain the decisions for different layers.

4.2. Further Discussion

Quickly and accurately acquiring the information of houses damaged by earthquake is a challenging problem for disaster emergency management and damage assessment. UAVs can capture data at a higher resolution without cloud cover, which can meet the requirements. However, when using the current unsupervised classification, object-oriented methods, and other traditional methods [8,9,10] for the detection of houses damaged by earthquake, it is difficult to balance accuracy and efficiency, while deep learning has improved the ability to balance the time and accuracy by learning features automatically. Some studies have shown its potential to detect damaged houses using UAVs and deep learning [18,38,39]. Due to the low viewpoint altitude of UAV, the model showed better performance than a helicopter [18]. Hence, we constructed a dataset for damaged house in UAV images. On the basis of the dataset, we employed the latest YOLO model, namely, YOLOv5, and optimized the network architecture for the Backbone and Neck modules to construct a damaged houses’ detection model, YOLOv5s-ViT-BiFPN, to simultaneously improve the accuracy and efficiency. Considering the efficiency, we utilized a YOLOv5s with a minimal volume compared to other YOLOv5 models and added the Vision Transformer structure to the Backbone of the YOLOv5s. To effectively aggregate multi-scale features, the BiFPN structure was used to construct the YOLOv5s-ViT-BiFPN.
In summary, due to the different types and scales of remote sensing data using multiple platforms and sensors after an earthquake, further studies are needed to verify the adaptability of YOLOv5s-ViT-BiFPN to directly transfer it to the areas with large differences in resolution or housing type and different seismic events. Therefore, comprehensive extraction methods should be considered for multi-data source and multi-scale damaged houses.
The main goal of our study is to rapidly acquire the location of damaged houses after an earthquake, so we established the improved YOLOv5 model to detect damaged houses with high accuracy and efficiency. However, the object detection methods do not provide accurate polygons for the damaged houses. While segmentation methods, such as Mask R-CNN [40,41,42,43], could be used to generate the footprints of the targets. Li Y. et al. [40] constructed a Histogram Thresholding Mask Region-Based Convolutional Neural Network (HTMask R-CNN) for the extraction of rural buildings. New and old rural buildings can be classified based on a combination of one-class Mask R-CNN and two-class Mask R-CNN. To generate more regularly shaped polygons for buildings, Zhao K. et al. [43] used the building-boundary regularization algorithm to improve the original Mask RCNN. Future studies will utilize the above research.

5. Conclusions

Regarding the complex background for damaged houses as well as the inconsistent resolution of UAV images, we employed the latest YOLO model, named YOLOv5, and optimized its network architecture for the Backbone and Neck modules to improve the model in view of the demand of high accuracy and strong timeliness and proposed an improved model, YOLOv5s-ViT-BiFPN. We added the Vision Transformer structure to the Backbone of the YOLOv5s. On this basis, the BiFPN structure with was used to construct the YOLOv5s-ViT-BiFPN in order to effectively aggregate multi-scale features. For these improvements, the model has an optimized structure, which can fuse the features better and simultaneously consider the characteristics of multi-scale features. In order to verify its feasibility, we used it to detect the damaged houses for areas that were seriously stricken by the Yangbi Ms6.4 earthquake in Yunnan Province by UAV orthophotos. The results show that the precision, recall rate, F1, and AP increased by 4.04%, 4.81%, 4.43%, and 1.77%, respectively. Compared with the YOLOv5s, the training time decreased by about 15 min, and, in the five test areas mentioned in Section 2.1, the average accuracy was 91.23% and the total detection time was about 4 min, which can verify the model’s transferability to different scenes.
Therefore, the findings from this study demonstrated that the YOLOv5s-ViT-BiFPN model can automatically detect damaged houses in UAV images with a good performance in terms of accuracy and timeliness, as well as being robust and transferable. Although the images in the test areas do not cover every hard-hit area, which probably causes some errors in the number of damaged houses, this model can improve the accuracy and efficiency based on UAVs’ remote sensing and meet the emergency response requirements after an earthquake.
However, due to the different types and scales of remote sensing data, with multiple platforms and sensors, used after earthquakes, the data are quite different. Further studies on this model should aim to validate its adaptability to multi-data sources and multi-resolution damaged houses in rural and urban areas, in order to test its transferability to large areas with great differences in resolution and the type of houses or buildings.

Author Contributions

Conceptualization, Y.J., Y.R. and Y.L.; data curation, Y.J.; formal analysis, Y.J. and Y.R.; investigation, Y.R. and Y.L.; methodology, Y.J. and Y.R.; project administration, D.W. and L.Y.; writings—original draft, Y.J.; writing—review and editing, Y.L. All authors have read and agreed to the published version of the manuscript.

Funding

This research was funded by National Key Research and Development Program, China, grant number, NO. 2017YFC1500902.

Institutional Review Board Statement

Not applicable.

Informed Consent Statement

Not applicable.

Data Availability Statement

Data sharing not applicable.

Acknowledgments

Thanks to the scientists from the Emergency Management Department Emergency Rescue Promotion Center, the Aerospace Information Research Institute, Chinese Academy of Sciences (AIR/CAS), Shanghai Ocean University, who helped in the acquisition of the UAV orthophotos data and ground field investigations used in this article. The authors would like to thank the anonymous reviewers for their very competent comments and helpful suggestions.

Conflicts of Interest

The authors declare no conflict of interest.

References

  1. Nie, G.; Gao, J.; Ma, Z.; Gao, Q.; Su, G. On the Risk of Earthquake Disaster in China in the Coming 10~15 Years. J. Nat. Disasters 2002, 1, 68–73. (In Chinese) [Google Scholar]
  2. Wang, Z. A preliminary report on the Great Wenchuan Earthquake. Earthq. Eng. Eng. Vib. 2008, 7, 225–234. [Google Scholar] [CrossRef]
  3. Chen, L.; Wang, H.; Ran, Y.; Sun, X.; Su, G.; Wang, J.; Tan, X.; Li, Z.; Zhang, X. The MS7.1 Yushu earthquake surface rupture and large historical earthquakes on the Garzê-Yushu Fault. Chin. Sci. Bull. 2010, 55, 3504–3509. [Google Scholar] [CrossRef]
  4. Zhou, S.; Chen, G.; Fang, L. Distribution Pattern of Landslides Triggered by the 2014 Ludian Earthquake of China: Implications for Regional Threshold Topography and the Seismogenic Fault Identification. ISPRS Int. J. Geo. Inf. 2016, 5, 46. [Google Scholar] [CrossRef] [Green Version]
  5. Topics on Earthquake Relief and Disaster Relief from the “5.21” Earthquake in Yangbi, Dali Prefecture. Available online: http://www.dali.gov.cn/dlrmzf/c105806/202105/413a1a71166a4209bb7e2a2b94a3e23e.shtml (accessed on 1 September 2021). (In Chinese)
  6. Wang, X.; Huang, S.; Ding, X.; Cui, L.; Dou, A.; Li, Y. Extraction and Analysis of Building Damage Caused by Nepal Ms8.1 Earthquake from Remote Sensing Images. Technol. Earthq. Disaster Prev. 2015, 10, 481–490. (In Chinese) [Google Scholar]
  7. Tinka, V.; Jacopo, M.; van den Homberg, M.; Jorma, L. Multi-Hazard and Spatial Transferability of a CNN for Automated Building Damage Assessment. Remote Sens. 2020, 12, 2839. [Google Scholar] [CrossRef]
  8. Li, S.; Tang, H.; He, S.; Shu, Y.; Mao, T.; Li, J.; Xu, Z. Unsupervised Detection of Earthquake-Triggered Roof-Holes From UAV Images Using Joint Color and Shape Features. IEEE Geosci. Remote Sens. Lett. 2015, 12, 1823–1827. [Google Scholar] [CrossRef]
  9. Li, S.; Tang, H. Building Damage Extraction Triggered by Earthquake Using the UAV Imagery. In Proceedings of the International Archives of the Photogrammetry, Remote Sensing and Spatial Information Sciences, Beijing, China, 7–10 May 2018; Volume XLII-3, pp. 929–936. [Google Scholar] [CrossRef] [Green Version]
  10. Çömert, R.; Matci, D.K.; Avdan, U. Detection of Collapsed Building from Unmanned Aerial Vehicle Data with Object Based Image Classification. Eskişehir Tech. Univ. J. Sci. Technol. B—Theor. Sci. 2018, 6, 109–116. [Google Scholar] [CrossRef] [Green Version]
  11. So, S.; Badloe, T.; Noh, J.; Bravo-Abad, J.; Rho, J. Deep learning enabled inverse design in nanophotonics. Nanophotonics 2020, 9, 1041–1057. [Google Scholar] [CrossRef] [Green Version]
  12. Vetrivel, A.; Gerke, M.; Kerle, N.; Nex, F.; Vosselman, G. Disaster Damage Detection through Dynergistic Use of Deep Learning and 3D Point Cloud Features Derived from Very High Resolution Oblique Aerial Images, and multiple-kernel-learning. ISPRS J. Photogramm. Remote Sens. 2018, 140, 45–59. [Google Scholar] [CrossRef]
  13. Li, K.; Wan, G.; Cheng, G.; Meng, L.; Han, J. Object detection in optical remote sensing images: A survey and a new benchmark. ISPRS J. Photogramm. Remote Sens. 2020, 159, 296–307. [Google Scholar] [CrossRef]
  14. Redmon, J.; Divvala, S.; Girshick, R.; Farhadi, A. You Only Look Once: Unified, Real-Time Object Detection. In Proceedings of the IEEE Conference on Computer Vision and Pattern Recognition, Las Vegas, NV, USA, 27–30 June 2016; pp. 779–788. [Google Scholar] [CrossRef] [Green Version]
  15. Redmon, J.; Farhadi, A. YOLO9000: Better, Faster, Stronger. In Proceedings of the IEEE Conference on Computer Vision and Pattern Recognition, Honolulu, HI, USA, 21–26 July 2017; pp. 7263–7271. [Google Scholar] [CrossRef] [Green Version]
  16. Redmon, J.; Farhadi, A. YOLOv3: An Incremental Improvement. arXiv 2018, arXiv:1804.02767. Available online: https://arxiv.org/pdf/1804.02767.pdf (accessed on 3 April 2020).
  17. Redmon, J. Darknet: Open source neural networks in c. Available online: https://pjreddie.com/darknet/ (accessed on 11 January 2021).
  18. Pi, Y.; Nath, N.D.; Behzadan, A.H. Convolutional neural networks for object detection in aerial imagery for disaster response and recovery. Adv. Eng. Inform. 2020, 43, 101009. [Google Scholar] [CrossRef]
  19. Ma, H.; Liu, Y.; Ren, Y.; Yu, J. Detection of Collapsed Buildings in Post-Earthquake Remote Sensing Images Based on the Improved YOLOv3. Remote Sens. 2020, 12, 44. [Google Scholar] [CrossRef] [Green Version]
  20. Ma, N.; Zhang, X.; Zheng, H.T.; Sun, J. ShuffleNet v2: Practical guidelines for efficient CNN architecture design. In Proceedings of the European Conference on Computer Vision, Munich, Germany, 8–14 September 2018; pp. 122–138. [Google Scholar] [CrossRef] [Green Version]
  21. Bochkovskiy, A.; Wang, C.Y.; Liao, H.Y.M. YOLOv4: Optimal Speed and Accuracy of Object Detection. arXiv 2020, arXiv:2004.10934. Available online: https://arxiv.org/abs/2004.10934 (accessed on 28 June 2020).
  22. Jocher, G.; Stoken, A.; Borovec, J. Ultralytic/Yolov5. Available online: https://github.com/ultralytics/yolov5 (accessed on 25 June 2021).
  23. Lema, D.G.; Pedrayes, O.D.; Usamentiaga, R.; García, D.F.; Alonso, Á. Cost-Performance Evaluation of a Recognition Service of Livestock Activity Using Aerial Images. Remote Sens. 2021, 13, 2318. [Google Scholar] [CrossRef]
  24. Zhang, H.; Ban, Y.; Guo, L.; Jin, Y.; Chen, L. Detection Method of Remote Sensing Image Ship Based on YOLOv5. Electron. Meas. Technol. 2021, 44, 87–92. (In Chinese) [Google Scholar]
  25. Zhao, J.; Zhang, X.; Yan, J.; Qiu, X.; Yao, X.; Tian, Y.; Zhu, Y.; Cao, W. A Wheat Spike Detection Method in UAV Images Based on Improved YOLOv5. Remote Sens. 2021, 13, 3095. [Google Scholar] [CrossRef]
  26. Zhang, C.M. Seismic risk-coping behavior in rural ethnic minority communities in Dali, China. Nat. Hazards 2020, 103, 3499–3522. [Google Scholar] [CrossRef]
  27. Wang, Y.; Shi, P.; Wang, J. The housing loss assessment of rural villages caused by earthquake disaster in Yunnan Province. Acta Seimol. Sin. 2005, 18, 590–601. [Google Scholar] [CrossRef] [Green Version]
  28. Gao, X.; Ji, J. Analysis of the seismic vulnerability and the structural characteristics of houses in Chinese rural areas. Nat. Hazards 2014, 70, 1099–1114. [Google Scholar] [CrossRef]
  29. Yu, Y.; Zhao, J.; Gong, Q.; Huang, C.; Zheng, G.; Ma, J. Real-Time Underwater Maritime Object Detection in Side-Scan Sonar Images Based on Transformer-YOLOv5. Remote Sens. 2021, 13, 3555. [Google Scholar] [CrossRef]
  30. Wang, C.-Y.; Mark Liao, H.-Y.; Wu, Y.-H.; Chen, P.-Y.; Hsieh, J.-W.; Yeh, I.-H. CSPNet: A New Backbone that can Enhance Learning Capability of CNN. In Proceedings of the 2020 IEEE Computer Society Conference on Computer Vision and Pattern Recognition Workshops, Seattle, WA, USA, 14–19 June 2020; pp. 1571–1580. [Google Scholar] [CrossRef]
  31. He, K.; Zhang, X.; Ren, S.; Sun, J. Spatial Pyramid Pooling in Deep Convolutional Networks for Visual Recognition. IEEE Trans. Pattern Anal. Mach. Intell. 2015, 37, 1904–1916. [Google Scholar] [CrossRef] [PubMed] [Green Version]
  32. Liu, S.; Qi, L.; Qin, H.; Shi, J.; Jia, J. Path Aggregation Network for Instance Segmentation. In Proceedings of the 2018 IEEE Conference on Computer Vision and Pattern Recognition, Salt Lake City, UT, USA, 18–23 June 2018; pp. 8759–8768. [Google Scholar] [CrossRef] [Green Version]
  33. Vaswani, A.; Shazeer, N.; Parmar, N.; Uszkoreit, J.; Jones, L.; Gomez, A.N.; Kaiser, L.; Polosukhin, I. Attention is all you need. In Proceedings of the 31st International Conference on Neural Information Processing Systems (NIPS), Long Beach, USA, 4–9 December 2017; pp. 6000–6010. [Google Scholar]
  34. Dosovitskiy, A.; Beyer, L.; Kolesnikov, A.; Weissenborn, D.; Zhai, X.; Unterthiner, T.; Dehghani, M.; Minderer, M.; Heigold, G.; Gelly, S.; et al. An Image is Worth 16x16 Words: Transformers for Image Recognition at Scale. arXiv 2020, arXiv:2010.11929. Available online: https://arxiv.org/abs/2010.11929 (accessed on 21 August 2020).
  35. Tan, M.; Pang, R.; Le, Q.V. EfficientDet: Scalable and Efficient Object Detection. In Proceedings of the 2020 IEEE Conference on Computer Vision and Pattern Recognition, Seattle, WA, USA, 13–19 June 2020; pp. 10778–10787. [Google Scholar] [CrossRef]
  36. Zhou, B.; Khosla, A.; Lapedriza, A.; Oliva, A.; Torralba, A. Learning Deep Features for Discriminative Localization. In Proceedings of the IEEE Conference on Computer Vision and Pattern Recognition, Las Vegas, NV, USA, 27–30 June 2016; pp. 2921–2929. [Google Scholar] [CrossRef] [Green Version]
  37. Selvaraju, R.R.; Cogswell, M.; Das, A.; Vedantam, R.; Parikh, D.; Batra, D. Grad-CAM: Visual Explanations from Deep Networks via Gradient-Based Localization. In Proceedings of the IEEE International Conference on Computer Vision, Venice, Italy, 22–29 October 2017; pp. 618–626. [Google Scholar]
  38. Nex, F.; Duarte, D.; Steenbeek, A.; Kerle, N. Towards real-time building damage mapping with low-cost UAV solutions. Remote Sens. 2019, 11, 287. [Google Scholar] [CrossRef] [Green Version]
  39. Tilon, S.; Nex, F.; Kerle, N.; Vosselman, G. Post-Disaster Building Damage Detection from Earth Observation Imagery Using Unsupervised and Transferable Anomaly Detecting Generative Adversarial Networks. Remote Sens. 2020, 12, 4193. [Google Scholar] [CrossRef]
  40. Li, Y.; Xu, W.; Chen, H.; Jiang, J.; Li, X. A Novel Framework Based on Mask R-CNN and Histogram Thresholding for Scalable Segmentation of New and Rural Buildings. Remote Sens. 2021, 13, 1070. [Google Scholar] [CrossRef]
  41. Bhuiyan, M.A.E.; Witharana, C.; Liljedahl, A.K. Use of Very High Spatial Resolution Commercial Satellite Imagery and Deep Learning to Automatically Map Ice-Wedge Polygons across Tundra Vegetation Types. J. Imaging 2020, 6, 137. [Google Scholar] [CrossRef]
  42. Mahmoud, A.S.; Mohamed, S.A.; EI-Khoribi, R.A.; AbdelSalam, H.M. Object Detection Using Adaptive Mask RCNN in Optical Remote Sensing Images. Int. J. Intell. Eng. Syst. 2020, 13, 65–76. [Google Scholar] [CrossRef]
  43. Zhao, K.; Kang, J.; Jung, J.; Sohn, G. Building Extraction from Satellite Images Using Mask R-CNN with Building Boundary Regularization. In Proceedings of the 2018 IEEE/CVF Conference on Computer Vision and Pattern Recognition Workshops, Salt Lake City, UT, USA, 18–22 June 2018; pp. 242–244. [Google Scholar]
Figure 1. The flow for the automatic extraction of damaged houses based on YOLOv5s-ViT-BiFPN.
Remotesensing 14 00382 g001
Figure 2. The study area.
Remotesensing 14 00382 g002
Figure 3. The samples of types of damaged houses. The green dots are the locations of field investigation.
Remotesensing 14 00382 g003
Figure 4. The UAV orthophotos acquired after the Yangbi Earthquake in Cangshanxi Town, Yangbi County, Yunnan Province: (a) Beiyinpo; (b) Jinniu; (c) Xiajie; (d) Baiyang (e) Cunwei; (f) Baimu; (g) Hetaoyuan, and (h) Longjing.
Remotesensing 14 00382 g004
Figure 5. The samples of damaged houses by the Yangbi Earthquake. The red boxes are the bounding boxes for damaged houses.
Remotesensing 14 00382 g005
Figure 6. The network architecture of YOLOv5.
Remotesensing 14 00382 g006
Figure 7. Examples of Mosaic data enhancement. Mosaic scales the four different images and arranges them to fit in the desired output size. The red boxes are the bounding boxes for damaged houses.
Remotesensing 14 00382 g007
Figure 8. The Focus structure of YOLOv5.
Remotesensing 14 00382 g008
Figure 9. The structure of the Vision Transformer.
Remotesensing 14 00382 g009
Figure 10. Replacing PANet with BiFPN to improve Feature Fusion Network. For PANet, a top-down and bottom-up pathway were adopted to fuse multi-scale features; for BiFPN, the strategy for top-down and bottom-up bidirectional feature fusion was used and then repeated, applying the same block.
Remotesensing 14 00382 g010
Figure 11. The improved network architecture for YOLOv5s-ViT-BiFPN. The Vision Transformer is inserted behind the Backbone. The PANet is replaced by BiFPN to fuse the multi-scale features and, in this study, only repeated once for efficiency. The blue box is the outputs for different scales.
Remotesensing 14 00382 g011
Figure 12. Comparison of change curves of the loss function and AP for 3 models: (a) Change curve of loss function and (b) change curve of AP.
Remotesensing 14 00382 g012
Figure 13. Accuracy comparison for the performances of the four models based on the metrics Precision (%), Recall (%), F1 (%), AP (%).
Remotesensing 14 00382 g013
Figure 14. The test results of YOLOv5s-ViT-BiFPN for the 5 test area: (d) Baiyang (e) Cunwei; (f) Baimu; (g) Hetaoyuan, and (h) Longjing. The red blocks are the damaged houses, and the green blocks are the missing targets.
Remotesensing 14 00382 g014aRemotesensing 14 00382 g014b
Figure 15. The examples of detection results by YOLOv5s-ViT-BiFPN.
Remotesensing 14 00382 g015aRemotesensing 14 00382 g015b
Figure 16. The samples for UAV images of different types of houses damaged by the Ya’an Ms7.0 earthquake on 20 April. The red vertical bounding boxes are the results of our method. The red irregular polygons are the annotations from references [8,9].
Remotesensing 14 00382 g016
Figure 17. Visualization of the feature maps. (a) The feature maps of the first layer; (b) The feature maps of the Vision Transformer layer; (c) The feature maps of the BiFPN structure; (d)The feature maps of the output layer.
Remotesensing 14 00382 g017aRemotesensing 14 00382 g017b
Figure 18. Visualization of the heatmaps. (a) The original images; (b) The heatmaps of the first layer; (c) The heatmaps of the Vision Transformer layer; (d) The heatmaps of the BiFPN structure; (e) The heatmaps of the output layer; (f) The final results.
Remotesensing 14 00382 g018
Table 1. The comparison for the performances of the four models based on the metrics Precision (%), Recall (%), F1 (%), AP (%), FPS (f/s), Training Time (h), Parameter Size (MB).
ModelPrecision
(%)
Recall
(%)
F1 (%)AP (%)FPS (f/s)Training Time (h)Parameter Size (MB)
YOLOv3---81.63275.6235
YOLOv5s84.9784.5684.7689.171001.41714.4
YOLOv5s-ViT88.4687.3487.9090.401001.46714.4
YOLOv5s-ViT-BiFPN89.0189.3789.1990.94801.20316.5
Table 2. The comparison of visual interpretation and automatic detection for damaged houses in the 5 test areas.
Test AreasThe Number for DetectionThe Number for Visual InterpretationAccuracy (%)Time (s)
(d) Baiyang303390.9136.50
(e) Cunwei283190.3226.46
(f) Baimu667390.4138.02
(g) Hetaoyuan717792.2054.08
(h) Longjing12013092.3194.45
Average Accuracy--91.23-
Publisher’s Note: MDPI stays neutral with regard to jurisdictional claims in published maps and institutional affiliations.

