Article

Multiscale Variability and the Comparison of Ground and Satellite Radar Based Measures of Peatland Surface Motion for Peatland Monitoring

1
Environmental Research Institute, North Highland College, University of the Highlands and Islands, Castle Street, Thurso KW14 7JD, UK
2
Department of Chemical and Environmental Engineering, Faculty of Engineering, Nottingham Geospatial Institute, Innovation Park, Jubilee Campus, Nottingham NG7 2TU, UK
3
Terra Motion Limited, 11 Ingenuity Centre, Innovation Park, Jubilee Campus, University of Nottingham, Nottingham NG7 2TU, UK
4
Department of Chemical and Environmental Engineering, Faculty of Engineering, University of Nottingham, Nottingham NG7 2RG, UK
*
Author to whom correspondence should be addressed.
Remote Sens. 2022, 14(2), 336; https://doi.org/10.3390/rs14020336
Submission received: 29 November 2021 / Revised: 22 December 2021 / Accepted: 23 December 2021 / Published: 12 January 2022
(This article belongs to the Special Issue Satellite and Ground Remote Sensing for Wetland Environments)

Abstract

:
Peatland surface motion is highly diagnostic of peatland condition. Interferometric Synthetic Aperture Radar (InSAR) can measure this at the landscape scale but requires ground validation. This necessitates upscaling from point to areal measures (80 × 90 m) but is hampered by a lack of data regarding the spatial variability of peat surface motion characteristics. Using a nested precise leveling approach within two areas of upland and low-lying blanket peatland within the Flow Country, Scotland, we examine the multiscale variability of peat surface motion. We then compare this with InSAR timeseries data. We find that peat surface motion varies at multiple scales within blanket peatland with decreasing dynamism with height above the water table e.g., hummocks < lawn < hollows. This trend is dependent upon a number of factors including ecohydrology, pool size/density, peat density, and slope. At the site scale motion can be grouped into central, marginal, and upland peatlands with each showing characteristic amplitude, peak timing, and response to climate events. Ground measurements which incorporate local variability show good comparability with satellite radar derived timeseries. However, current limitations of phase unwrapping in interferometry means that during an extreme drought/event InSAR readings can only qualitatively replicate peat movement in the most dynamic parts of the peatland e.g., pool systems, quaking bog.

Graphical Abstract

1. Introduction

Recent developments in the use of Satellite Interferometric Synthetic Aperture Radar (InSAR) to measure seasonal oscillations of peatland surface at the site and landscape scale have been shown to be highly diagnostic of peatland character and condition [1,2,3,4,5,6,7,8]. Developments in the automation of accurate in-situ ground-based peat surface motion techniques also mean that high temporal resolution point records from the peatland surface are now possible at relatively low cost [9,10]. Where automated systems exist or are being trialed, measures are often not designed with the specific requirements of and interoperability with areal earth observation validation in mind. Therefore, using these kind of field measures of surface motion to validate InSAR is fraught with uncertainty. In particular, ground measurements are generally based on a scatter of single points separated by large distances (>1 km) [11,12,13] and often do not consider pixel (e.g., vegetation, micro-topography), site scale and topographic variability, which are incorporated within the area measured by satellite radar. Integrating multiscale observations on peatland is also a common barrier to upscaling ground-based measures to more areal techniques, for example from chamber measurements to eddy covariance methods [14,15], measures of hydrological conductivity in peatlands [16] and vegetation composition from UAV [17]. Consequently, it is not unreasonable to expect similar, scale associated variability within Peatland Surface Motion (PSM).
Ground measures need to match the precision of the satellite radar; although in the tropics PSM can produce oscillations in the range 5–10 cm [12], in northern peatlands this may only be a few millimeters. The use of accuracy as a measure of the success of the InSAR method is also somewhat limiting: a precise but inaccurate surface motion signal (e.g., one that underestimates the magnitude of motion) that can be quantitively linked to ecohydrological parameters and carbon emissions is still extremely useful [1]. In this study we use a clustered approach to the field assessment of multiscale variability in PSM in two contrasting peatland sites. We then compare the results to simultaneous InSAR measures and discuss the design of validation experiments relative to the observed variability. An aspect not covered in this study is the detailed analysis of the mechanical behavior that underlies the observed patterns, which would require specific integration of water level, surface motion and climate that was beyond the scope of this study.
PSM is a mechanical expression of many factors used to evaluate peat condition, such as water balance, vegetational assemblage, erosion and density [18,19,20,21,22,23,24] This phenomenon, sometimes referred to as “bog breathing”, is well recorded, and an example of PSM that indicates an interannual sensitivity to seasonal changes in water balance. The sensitivity of PSM to short term changes (e.g., drainage, drought) means that unlike other measures of peat condition e.g., vegetational succession which have long lag times (years) before changes can be observed, deterioration or improvement in the condition of a peatland can be observed over the short term (days-years) [5]. This is useful as it forewarns longer-term ecological change and carbon loss. As such PSM is an important, if not underutilized, proxy for overall peatland condition.
There are several reasons why PSM has been generally overlooked for peatland monitoring thus far or attempted only on small scale [18]. First, parameters such as a water table depth and vegetational assemblage are more commonly used as measures of condition as they are widely understood, simple and cost-effective to measure at the local scale e.g., [25]. Second, dynamic PSM, as opposed to long-term subsidence, is difficult and time consuming to measure using conventional surveying techniques such as peat subsidence poles, as the measurement precision often falls short of the expected sub-cm variations in peat surface height over monthly timescales. Third, detailed knowledge of the mechanical processes that underpin the variability in peat surface motion belong in a very different academic field to ecology and hydrology and, consequently, knowledge of peat mechanics is underdeveloped relative to other peatland disciplines. Therefore, it is only with the recent moves toward large scale monitoring using InSAR [1,5,7] and LiDAR [26] that there has been an incentive to develop PSM monitoring beyond measures of subsidence.
The subsidence pole (a rod driven into the subsoil) is the most widespread method of PSM measurement [11,12,13,27,28]. It is low cost, easy to install, requires limited training and measurement time and as such is useful for detecting large scale motion trends over long periods. The method cannot achieve millimetric accuracy and precision, particularly where the peat surface has to be defined at each measurement. Often there is a lack of benchmark monitoring with the assumption that benchmarks are fixed and stable. Variations on this method also include measurements of the height above ground surface of PVC piezometers or dip wells [18]. An improvement on this basic approach is the automation of subsidence monitoring using cameras [9,10]; however, this still suffers from the same benchmark issues, is more expensive and therefore not widely deployed.
Several studies have attempted to address some of the above limitations. For example, Kennedy and Price, (2005) and Price (2003) [20,22] used a wire suspended between two subsidence poles to measure elevation change at anchors installed to different depths between the two benchmarks which achieved sub-cm measurement accuracy. This was further developed by Fritz et al. 2008 [21] who added a water filled level gauge to determine benchmark immobility to an accuracy of ±1.5 cm with the height of each benchmark determined by GPS accuracy ±3 cm.
Reeve et al., 2013 [29] used high precision GPS to monitor seasonal changes in PSM. This produced high temporal frequency with precision of ±1 cm. This is similar to other automated approaches and, where installed, can provide high resolution ground motion data over small areas at a temporal frequency unachievable with current ground techniques. The technique also has the advantage of almost eliminating the time required to survey outside of installation and maintenance. However, automated systems can be expensive, have associated replacement costs, and require regular maintenance to avoid data gaps. There may also be issues with regard to local environmental conditions (e.g., wind, precipitation, low temperatures, or animal damage) which require costly adaptations or reduce the lifetime of such approaches.
Precise leveling is a mature and commonly used surveying technique within the Civil Engineering and surveying sectors as it offers sub-millimetric precision over large distances (0.2 mm over 1 km). The approach uses a combination of a precise level and bar-coded staff which, when repeated over time, allows the motion of marked points to be measured. The technique can measure a large number of points at close and long range (<50 m) meaning high spatial resolution can be achieved, with relatively minor additional infrastructure (e.g., fixed and floating benchmarks). Multiple methods of assessing precision and accuracy are already developed and are easily incorporated into the survey design (e.g., closure, standard deviation). Leveling at lower precision has been applied in the north of Scotland to good effect [30] but has proven difficult to validate InSAR due to the survey design and size of the Sentinel 1 derived APSIS (Advanced Pixel System Intermittent Small Baseline Subset) InSAR pixel 80 × 90 m [31]. Thus far, a precise leveling approach has not been applied to PSM monitoring, despite its potential advantages due to the perception that the short-term stability of the peat surface is insufficient for accurate measurements.
This study aimed to characterize the local scale variability in ground-based PSM across different peatland settings and relate it to InSAR-based measures of PSM. More specifically, the objectives were (1) to design and use a precise leveling approach to measure PSM within a range of APSIS InSAR pixel sized areas in one low lying and one upland blanket bog within the Flow Country of northern Scotland; (2) to compare aggregated precise leveling derived PSM data from each pixel with APSIS InSAR derived timeseries data over the same study period (3) to determine whether InSAR data captures similar motion to ground based techniques, and (4) to discuss the implications for InSAR validation survey design and the applicability of InSAR to PSM monitoring applications.

2. Materials and Methods
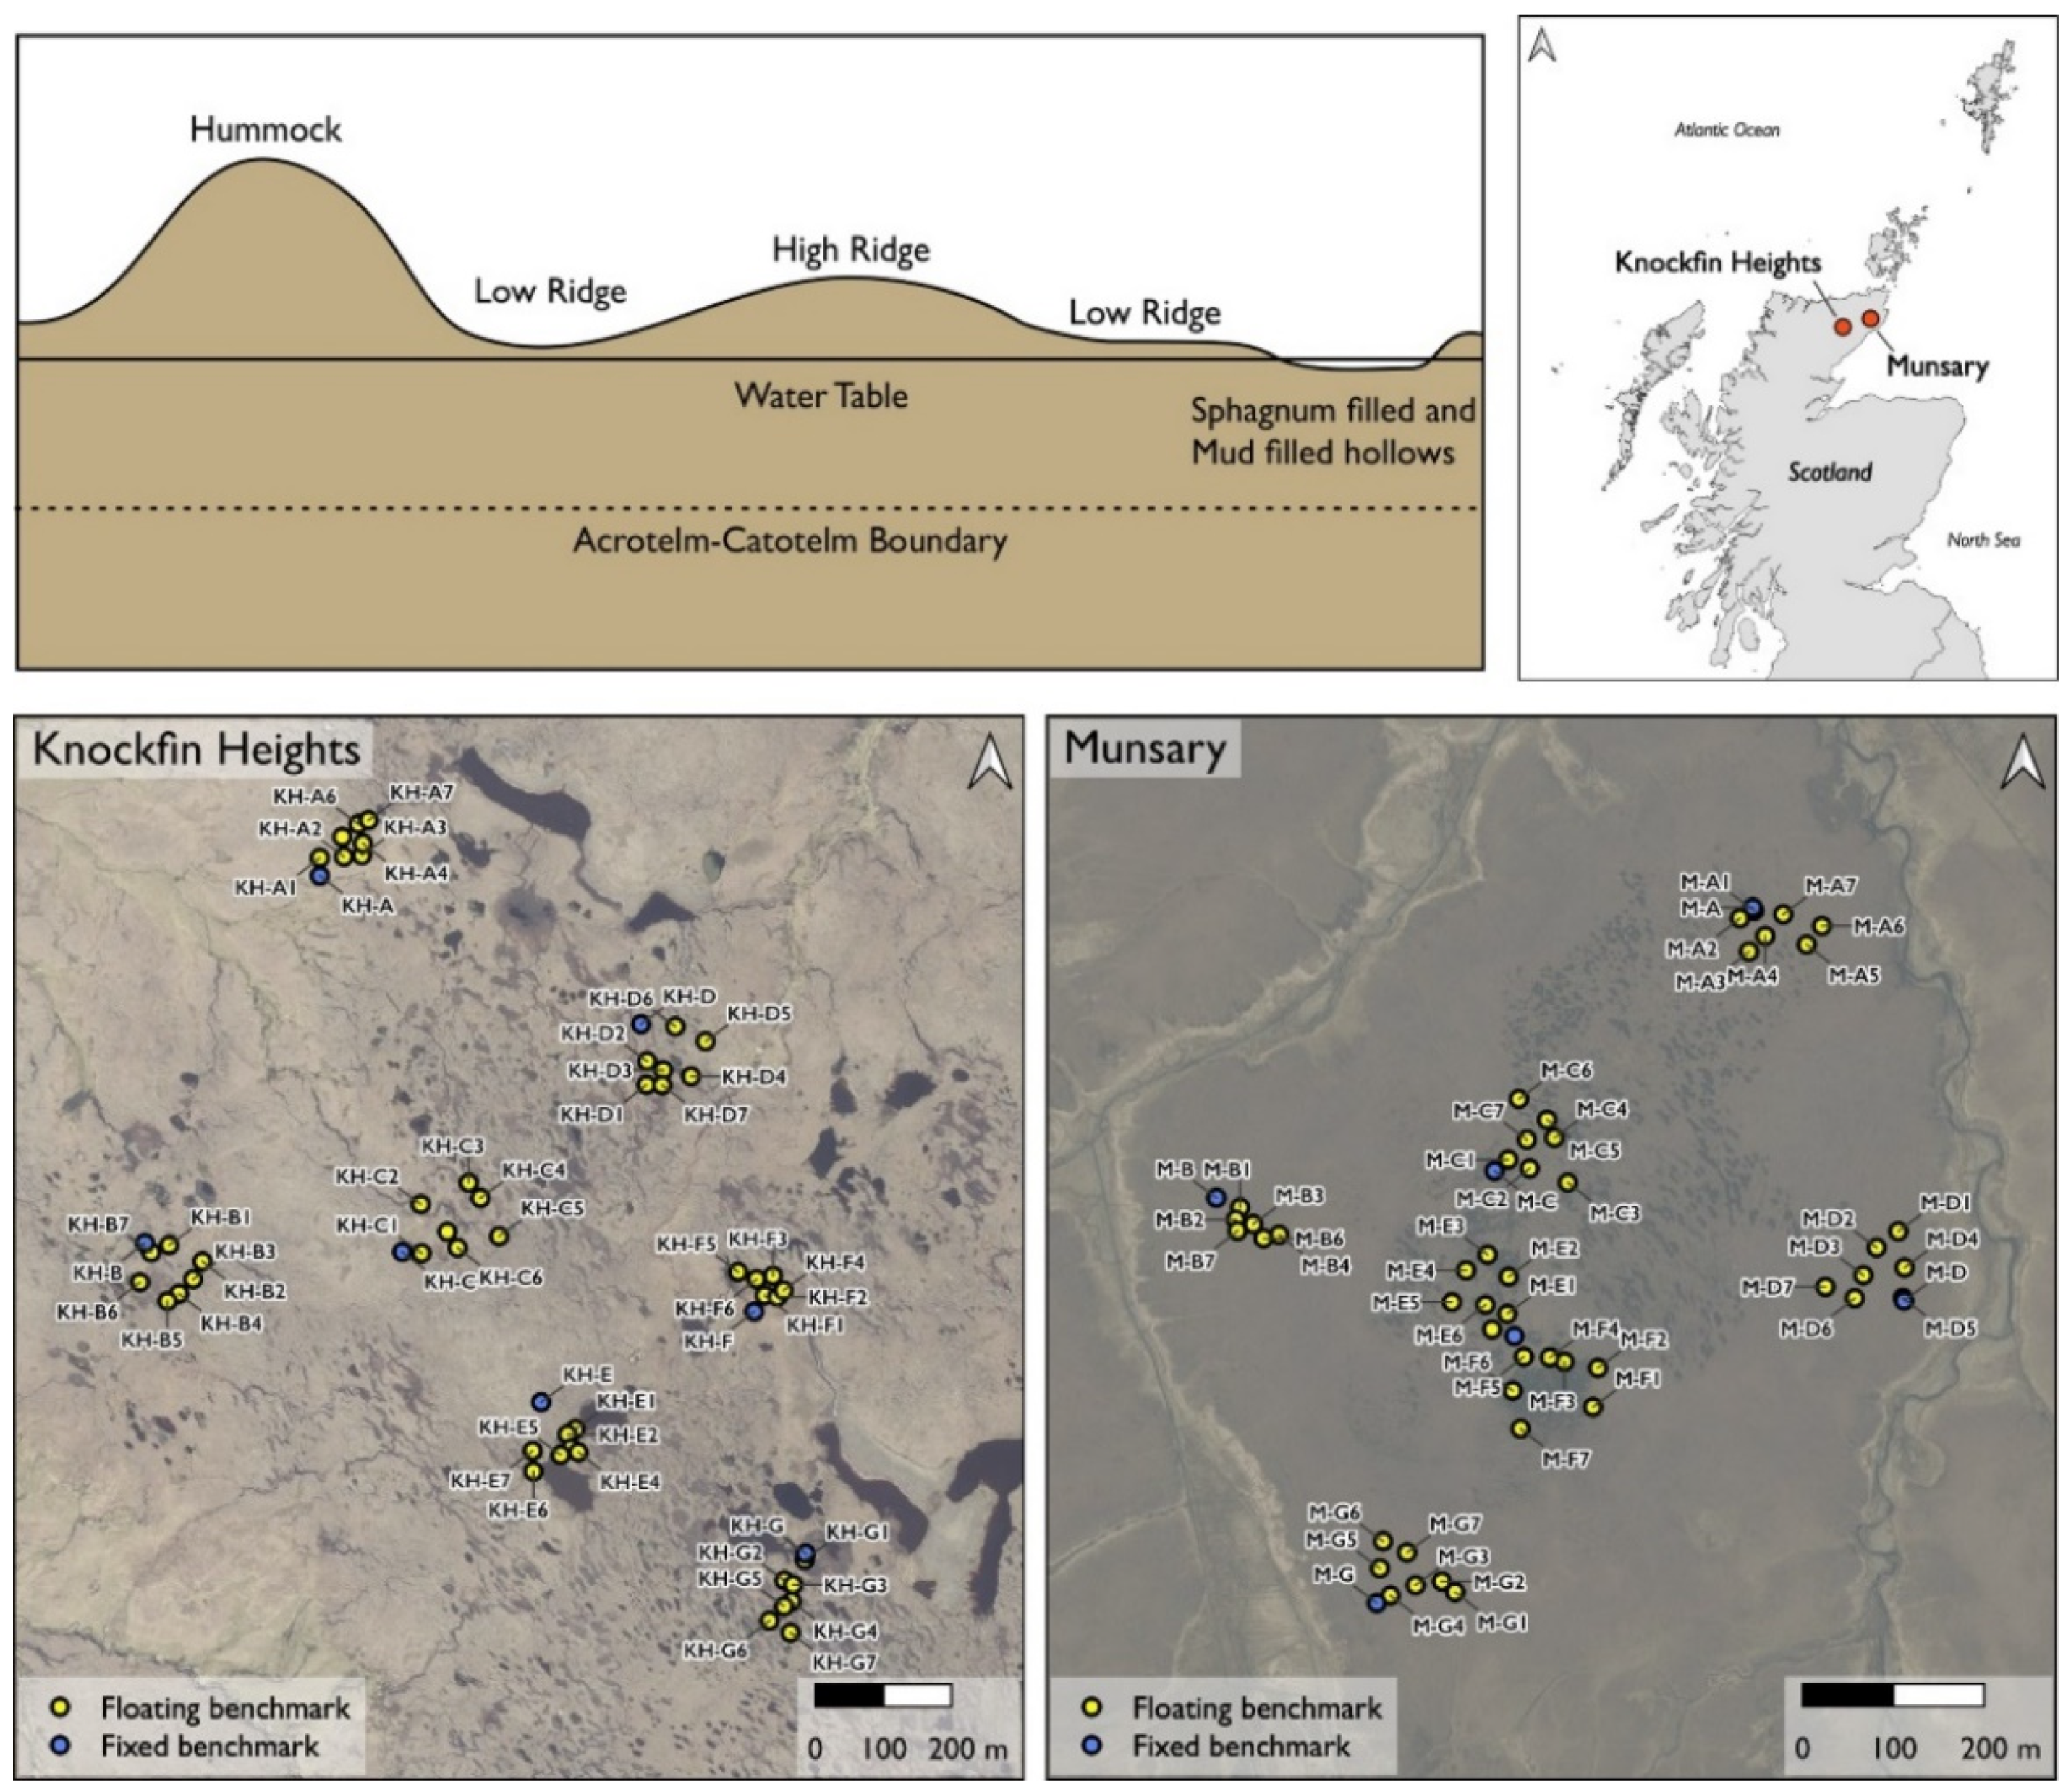
2.1. Study Area

The Flow Country represents the largest expanse of blanket peatland in Europe, covering large parts of Caithness and Sutherland, Scotland [32]. It includes a diverse range of peatland habitats ranging from low lying blanket peatland (c. 100 m Above Ordnance Datum Newlyn; A.O.D.N) with extensive pool systems to heavily incised upland plateau and slope peats (c. 400 m A.O.D.N). Peat depths range from 50 cm to >5 m. Two focus sites (Figure 1) were chosen to represent two typical ‘near natural’ peatland states common within the Flow Country, both of which are currently under conservation management. These are Munsary Dubh Lochans (58°23′44.60″N, 3°20′26.74″W) and Knockfin Heights (58°19′18.45″N, 3°48′28.76″W). A series of 14, 100 × 100 m subsites were created with Munsary sites given the name M-A to G and Knockfin Heights sites KH-A to G with locations in Figure 1.
Munsary Dubh Lochans forms part of the Plantlife Munsary Reserve (Figure 1) and represents an area of low lying blanket peatland (c. 100 m A.O.D.N). The site is constrained to the north, east and west by small streams with a shallow slope upwards towards the South. Unlike adjacent agricultural land, which have been subject to intensive pastoral conversion and forestry development, the study site is largely intact, although has been subject in the past to small-scale peat cutting, burning and drainage at the peatland margins. Drains within the reserve were blocked in 2003 and forestry adjacent to the eastern boundary of the reserve was felled and drain-blocked in 2004.
The 1 km2 low lying study area focused on the core central area (Figure 1) comprising well-developed concentric pool systems with Sphagnum dominated ridge-hummock-hollow systems and an area of quaking bog surrounding the largest pools. The vegetation includes several Sphagnum species (e.g., S. capillifolium, S. medium, S. austinii, S. papillosum, S. cuspidatum) and other bryophytes (e.g., Pleurozium schreberi) as well as sedges (Eriophorum sp., Trichophorum germanicum) and ericaceous shrubs (Erica tetralix, Calluna vulgaris). Peat depths range from 2–5 m. Subsites M-E and M-F lie within the SW part of the pool system and contains central large pools with seasonally dry pools concentrated in lobe like structures extending towards the margins. Subsites M-A and M-C lie within the NE part of the pool systems, in an area of medium scale pools forming a concentric ring around the peat dome, decreasing in size towards the margins. The two types of pool system are separated by a ridge or series of dome structures in the underlying mineral soil. Mean bulk density measurements from the top 50 cm of the pool systems range from 0.044 to 0.061 g/cm3 [33] The margins of the study area (Subsites M-B, M-D, M-G) consist of a thin (<250 m) strip of shrub and sedge dominated peatland, with few pools. Peat depths range from 0–2 m with the interface with adjacent streams either present as a rapid transition towards lag fen or as an erosive contact. Mean bulk density of the top 50 cm in the margins is greater than within the pool systems ranging from 0.063 to 0.085 g/cm3 [33].
The site at Knockfin Heights forms part of the Royal Society for the Protection of Birds (RSPB UK) Forsinard Flows National Nature Reserve (NNR, Highland, Scotland) and is designated as part of the Caithness and Sutherland Peatland Special Area of Conservation (SAC), a Site of Scientific Interest (SSSI) and Special Protection Area (SPA). It represents an area of incised upland (c. 400 m A.O.D.N) peatland with seasonally dry and permanent pool systems [34]. The Knockfin Heights plateau forms the headwaters for many rivers in the area such as the Helmsdale, Halladale, Thurso, Dunbeath, Langwell, and Berriedale. The area is managed for conservation and is subject to annual deer culling. The lower slopes outside of the NNR boundaries are converted for forestry or drained.
The 1 km2 upland focus area covers a section of upland plateau (KH-B-G) and slope peatland (KH-A) containing a mixture of large drained and undrained pools and lochans. The vegetation is mostly dominated by sedges (Eriophorum sp., Trichophorum germanicum) and ericaceous shrubs (Erica tetralix, Calluna vulgaris) with an understorey of bryophytes (e.g., Pleurozium schreberi) lichens as well as Sphagnum species (S. capillifolium, S. tenellum, S. papillosum, S. cuspidatum), often restricted to sheltered areas and seeps. The Knockfin Heights Plateau (Subsites KH-B-E and KH-G) is incised with deep peat hags down to mineral soil and bare peat within former pools. There is also evidence of numerous peat pipes. Other areas (Subsite KH-F) show evidence of natural regeneration with colonization of bare peat areas by sedge species such as Eriophorum Angustifolium and intact hummock, ridge, hollow communities in some areas.

2.2. Precise Leveling

The raw data used in this study and a detailed description of the sampling protocols are available at [35]. Briefly, an approximately 1 km2 area was selected on the basis of previous InSAR measurements [31], aerial photography and site visits at both Munsary (M) and Knockfin Heights (KH; Figure 1). At each site, seven subsites given a letter A-G and notional area 100 × 100 m were selected representing the range of subsidence rates (from InSAR) and peat morphology (from aerial photography) (Figure 1). At each subsite, a permanent fixed benchmark was installed, in the form of a metal rod firmly embedded to the underlying substrate. Within each subsite, seven locations (hereafter coded 1–7) representative of the peat microtopography and vegetation were selected for 500 mm long floating benchmarks. At Knockfin Heights these comprised hummocks, lawns, hollows and bare peat at pool margins and between peat hags (i.e., overhanging remnants of peat). At Munsary, the floating benchmark locations comprised hummocks, lawns, and hollows. This layout allowed the consistent measurement of the floating benchmarks relative to the permanent site benchmark and its underlying substrate at each site. A description of each benchmark is available at [35]. A schematic diagram of the microtopographic classification used can be seen in Figure 1.
Precise leveling surveys were conducted 10 times at the upland Knockfin Heights Site and 16 times at the low lying Munsary site with an approx. 5 weekly return time between 2 August 2017 and 26 February 2019. Knockfin Heights was inaccessible from Dec 2017 to April 2018 due to prolonged snow cover. Measurements also coincided with the 2018 European Drought Event [36] which caused an unusually rapid drop in the peat surface relative to that seen in the preceding year.
Surveys were conducted using a Leica LS15 precise level with a 2 m Invar coded staff. Surveys used the BBFF (backsight, backsight, foresight foresight) method. Equipment was set up in line leveling mode with precise leveling mode, distance balancing (5 m), staff (2 m), staff limits (25 cm–175 cm) and distance-autofocus-measure setting enabled. Readings were taken as the mean of three separate measures. A measurement threshold of <0.5 mm standard deviation was applied, and measurements were repeated if this was not met. This threshold was relaxed to <1 mm during periods of high wind speeds (>30 km/hr), when multiple attempts to reach the <0.5 mm threshold failed.

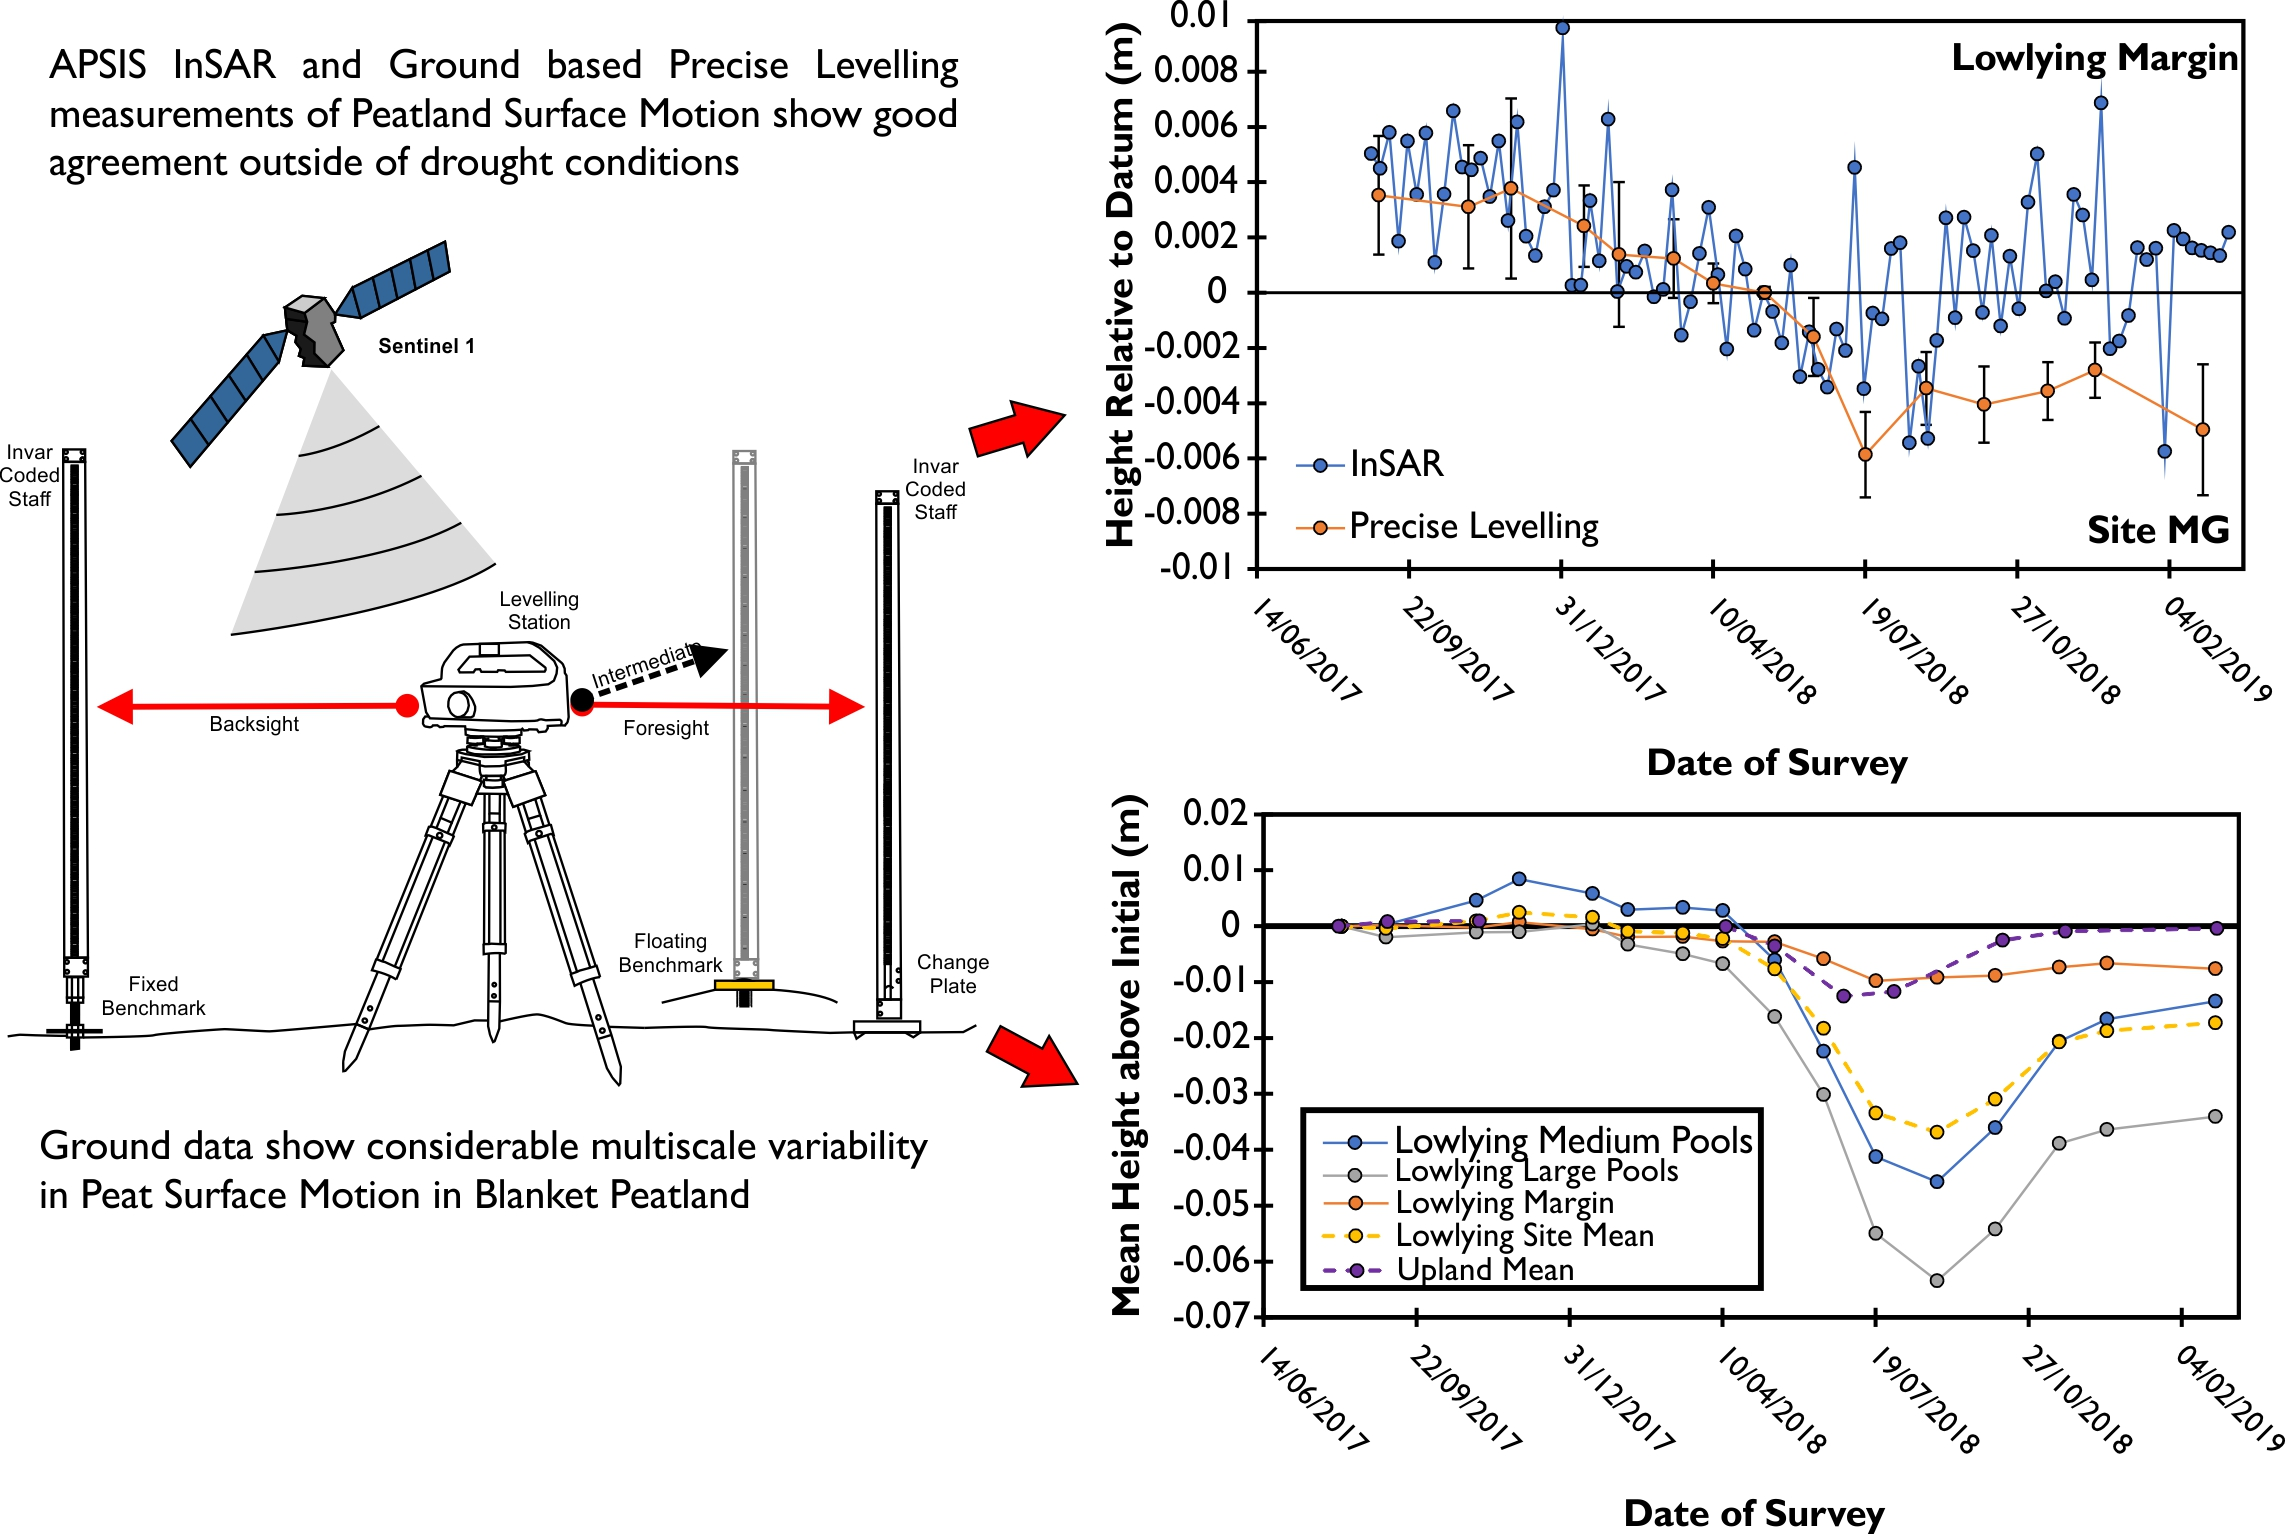
2.3. InSAR Measurements

The raw data used in this study and a detailed description of the processing protocols used are available at [37]. The InSAR data used in this study is the same as used by [7] for large-scale condition mapping in the Flow Country and [5] to assess restoration outcomes.
Briefly, surface motion was determined using 410 Sentinel-1A and -1B interferometric wide swath single look complex Level 1 synthetic aperture radar images Orbit 125 gathered every 6 to 12 days between 12 March 2015 and 1 June 2019 from the European Space Agency Copernicus Open Access Hub (Available online: https://scihub.copernicus.eu (accessed on 1 July 2020)). Satellite interferometry was applied to these images using the Advanced Pixel System Intermittent Small Baseline Subset (APSIS) technique; formerly known as the intermittent small baseline subset (ISBAS) technique. The APSIS technique contains an adapted version of the established low-resolution SBAS DInSAR time series algorithm [38,39] APSIS was used to improve the density and spatial distribution of survey points to return measurements in vegetated areas, where DInSAR processing algorithms habitually struggle due to incoherence [40,41]. The APSIS algorithm was implemented using Terra Motion Limited’s in-house Punnet software, which covers all aspects of processing from the co-registration of SLC (Single Look Complex) data to the generation of time series [42]. Maximum horizontal baseline was restricted to 250 m with maximum temporal separation of 1 year using a coherence threshold of 0.25 and point threshold of 360. Motion was measured relative to a stable reference point at Wick Airport (58.4533°N, 3.0879°W). Phase unwrapping was implemented using an in-house implementation of the SNAPHU algorithm [43]. Using APSIS, two products were produced for each georeferenced pixel location at approximately 80 by 90 m resolution: motion time series of multiannual average line-of-sight velocity (m y−1) and mean velocity in the line-of-sight. Linear Velocity values (vLOS) were then converted into the more useful vertical velocity values (v_(Vert)) for comparison with ground data using the formula V_(Vert) = V_LOS/cosϑ where θ is local incidence angle. This assumes vertical motion dominates at the pixels chosen during the short study period used which is considered highly likely. However, this does not preclude significant horizontal motion over longer timescales or areas of peat failure and LOS is not constant over the study area.

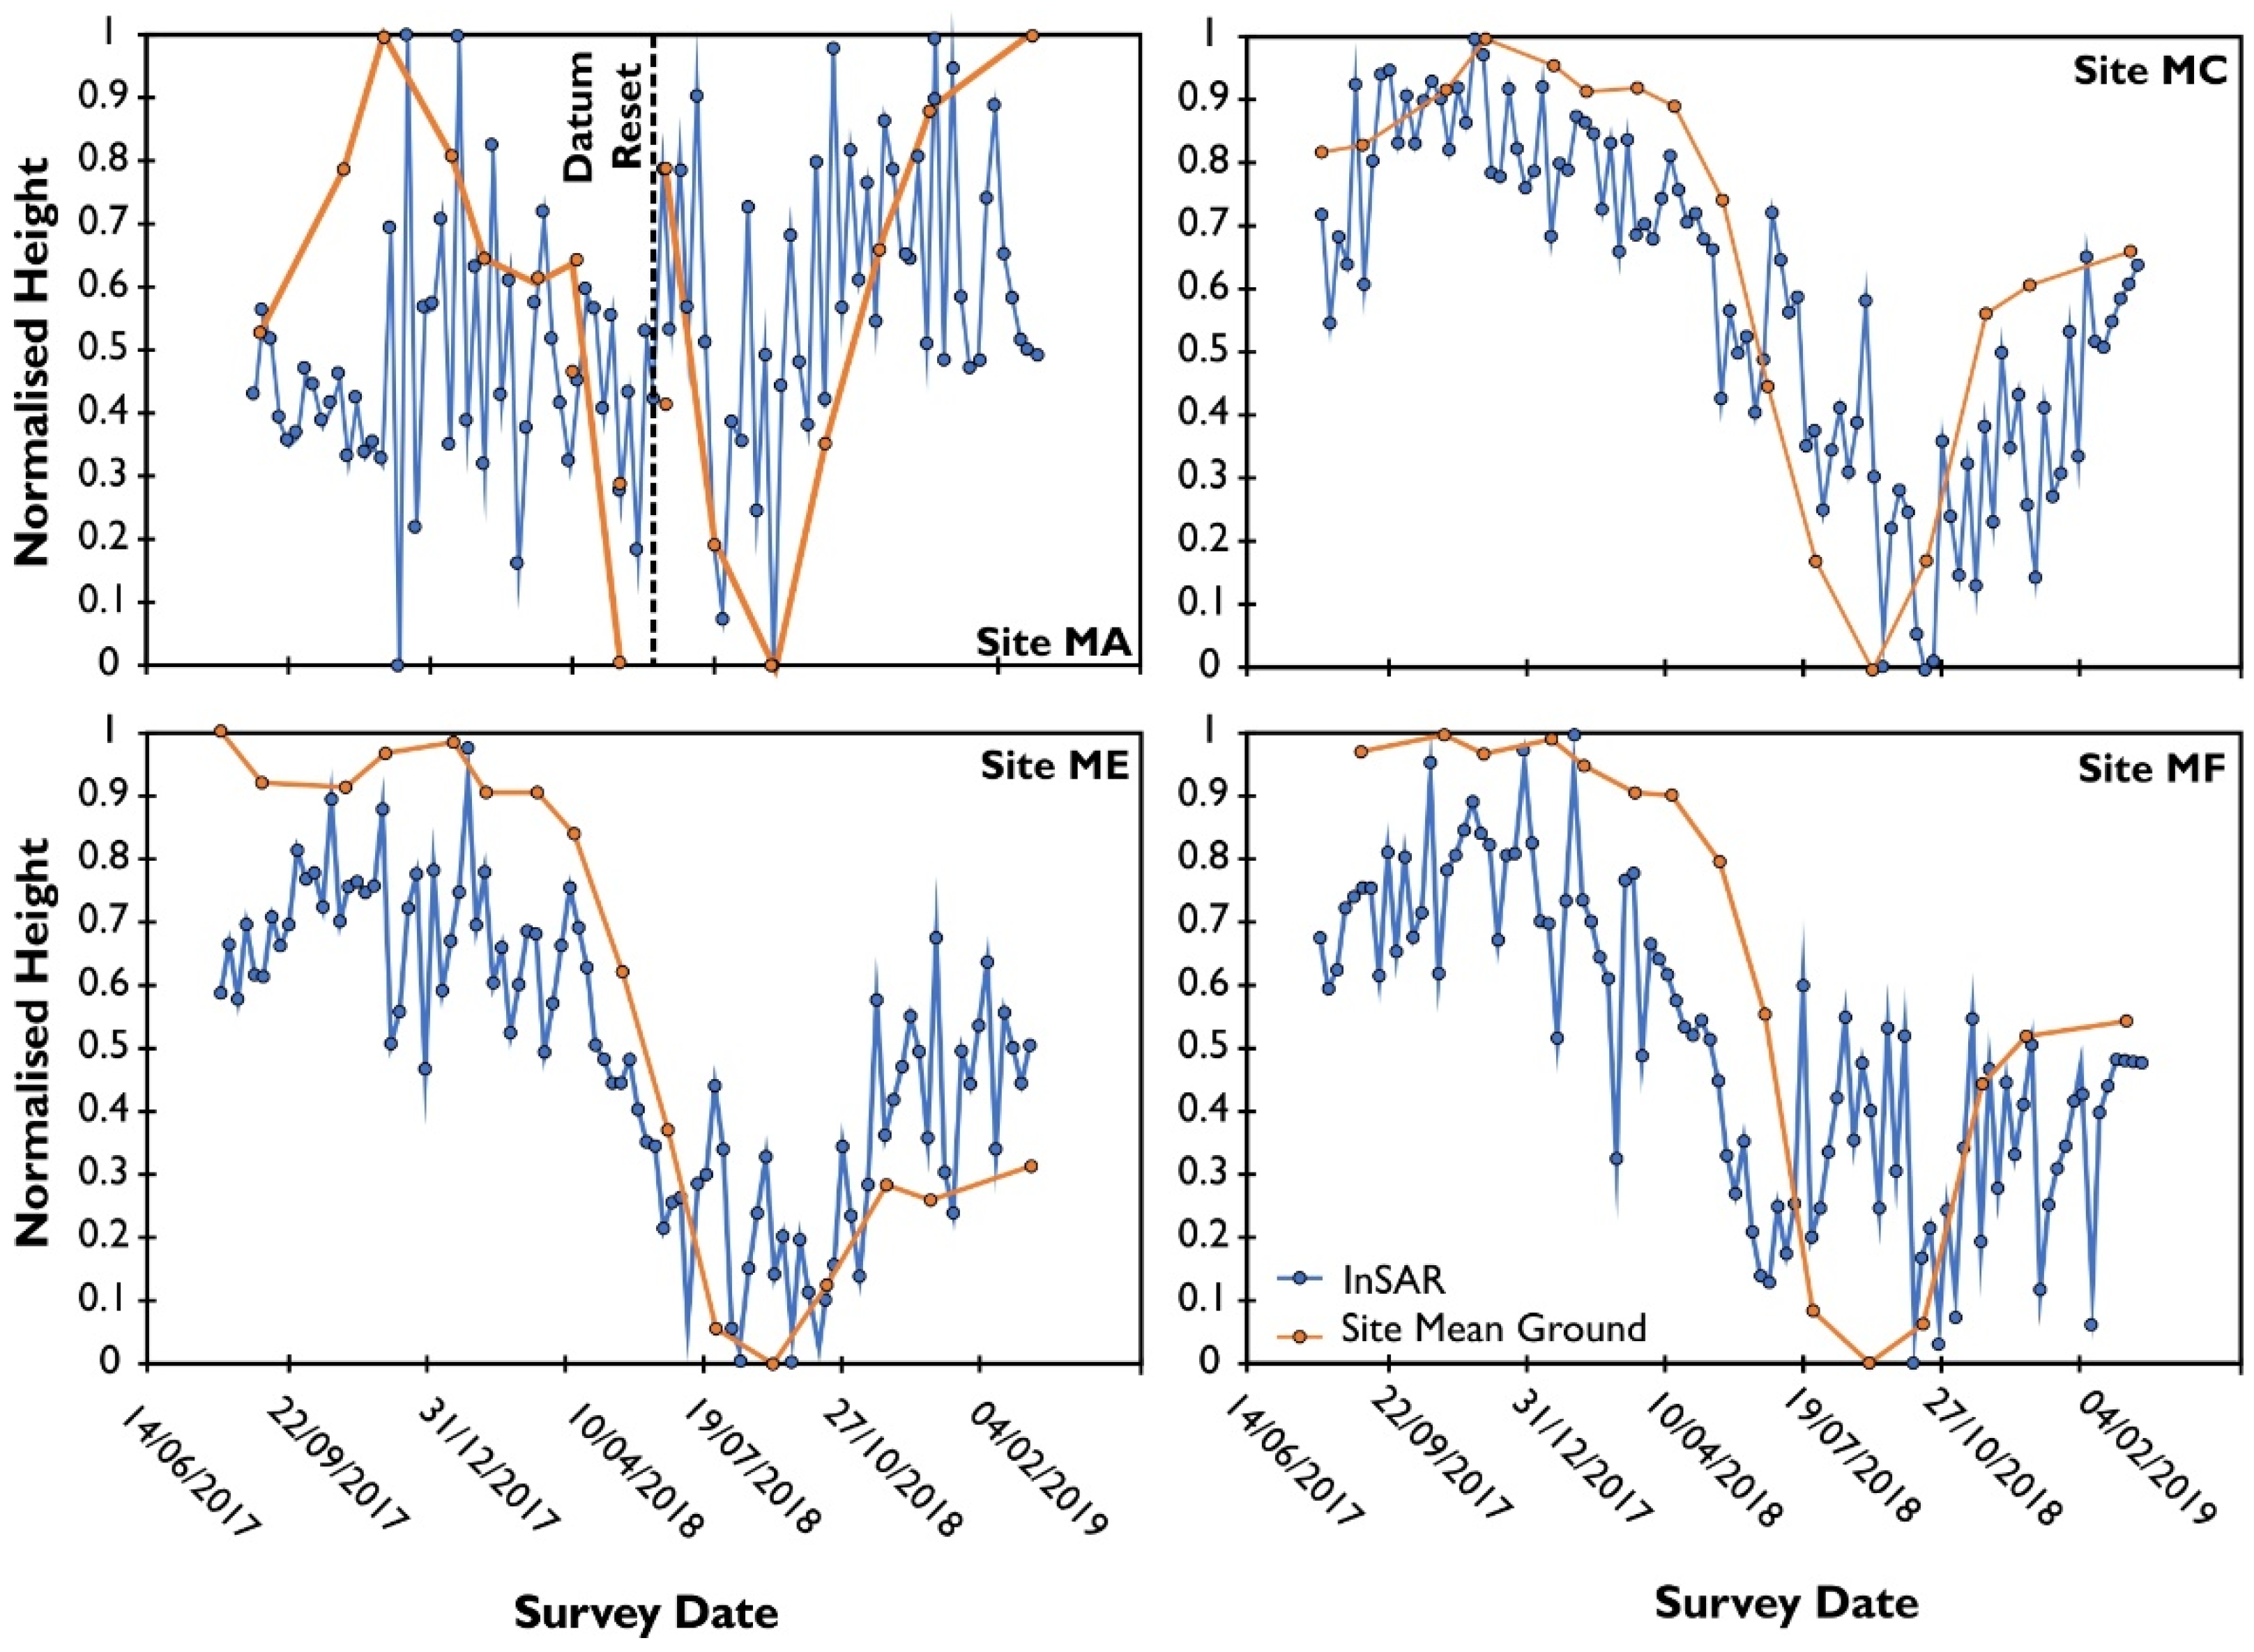
2.4. Comparison of Precise Leveling and InSAR Timeseries

In order to compare the ground based precise leveling and InSAR data a common datum was set at 0 with datum dates for each pixel shown in Table 1. InSAR pixels were selected based on proximity to the center of the ground monitoring subsite. At most sites this was sufficient for the whole survey period, however, the European Drought Event caused motion to exceed ambiguity thresholds during the phase unwrapping stage of the InSAR timeseries processing between June 2018–August 2018 at the most dynamic sites at Munsary, namely sites M-A, M-E and M-F. This was a result of the rate of subsidence exceeding the 1.2 cm maximum resolvable displacement between adjacent radar images. For this reason, a pre and post drought datum (Table 1) was used at these sites to aid comparison in different peat surface motion conditions. The mean of the peat surface height relative to the chosen datum was derived from the mean of the 7 benchmarks within each chosen subsite with the standard deviation from the mean used to indicate within pixel variability. Mean peatland surface motion pre and post drought from APSIS InSAR and Ground measurements was derived from linear regression of timeseries (Pre Drought Period = 4 August 2017 to 15 May 2018; Post Drought Period (10 June 2018–20 February 2019). Raw timeseries from individual benchmarks from the two sites can be seen in Appendix A Figure A1 and Figure A2.

3. Results

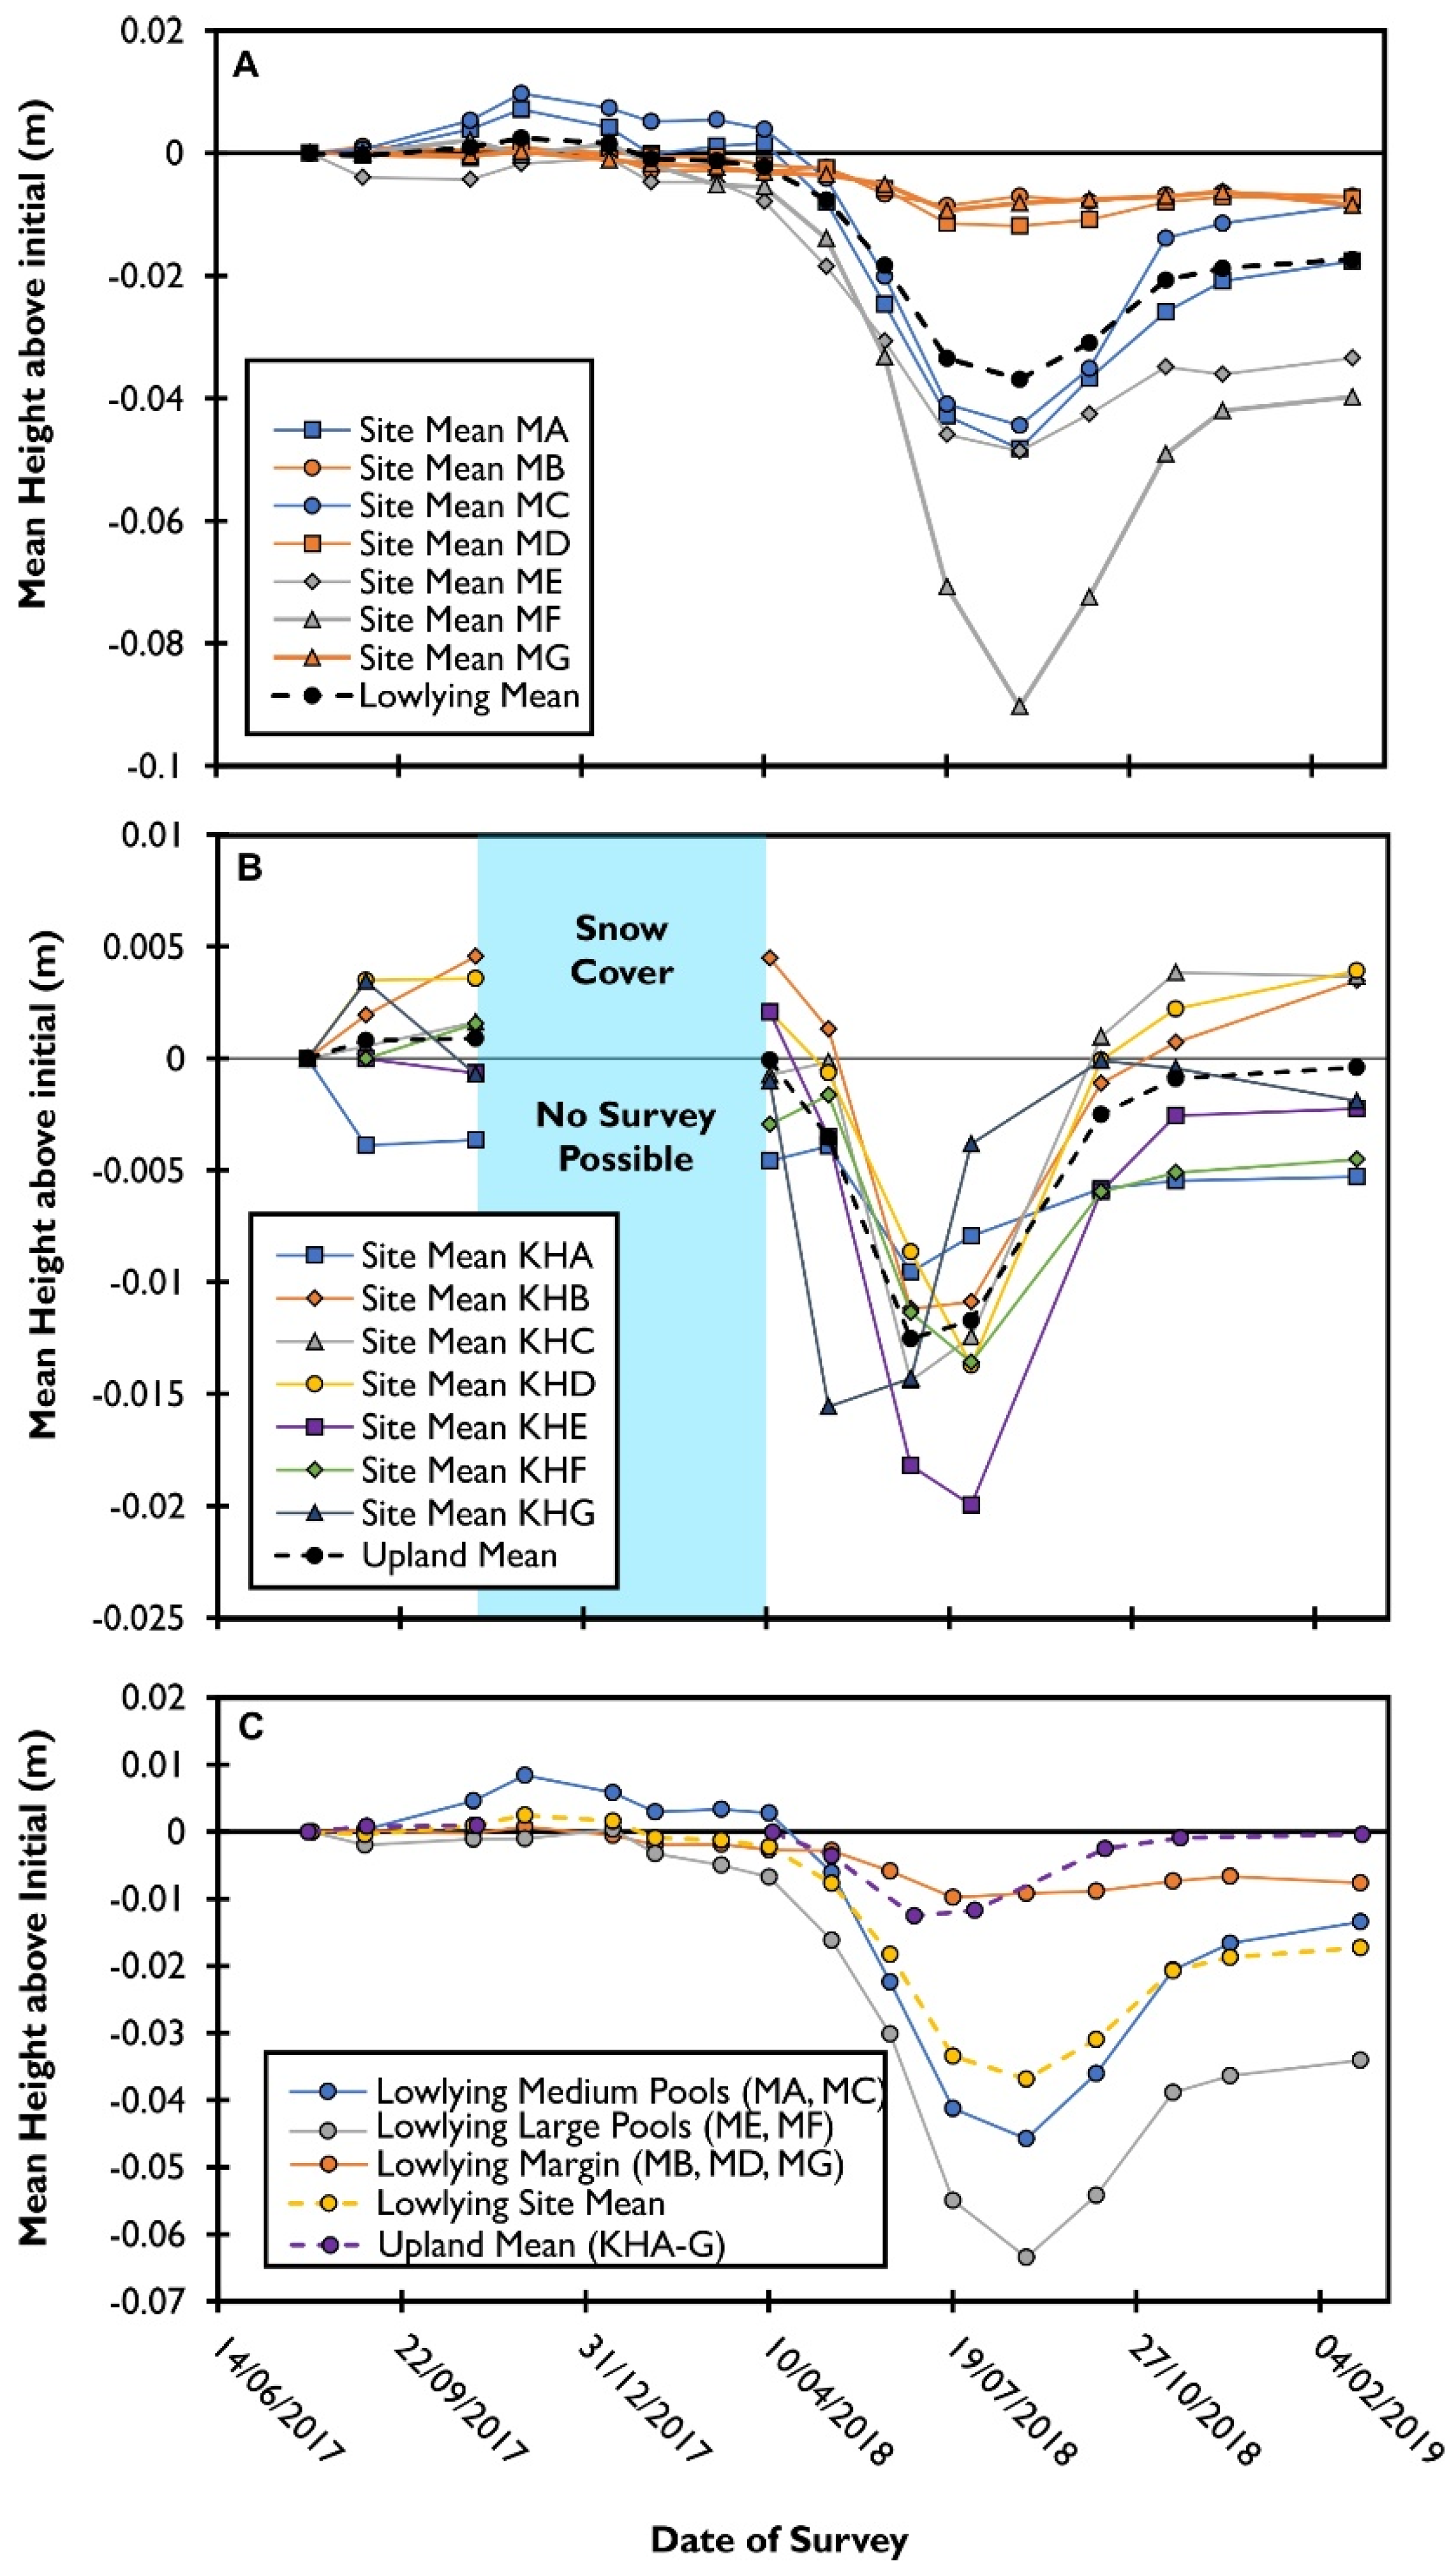
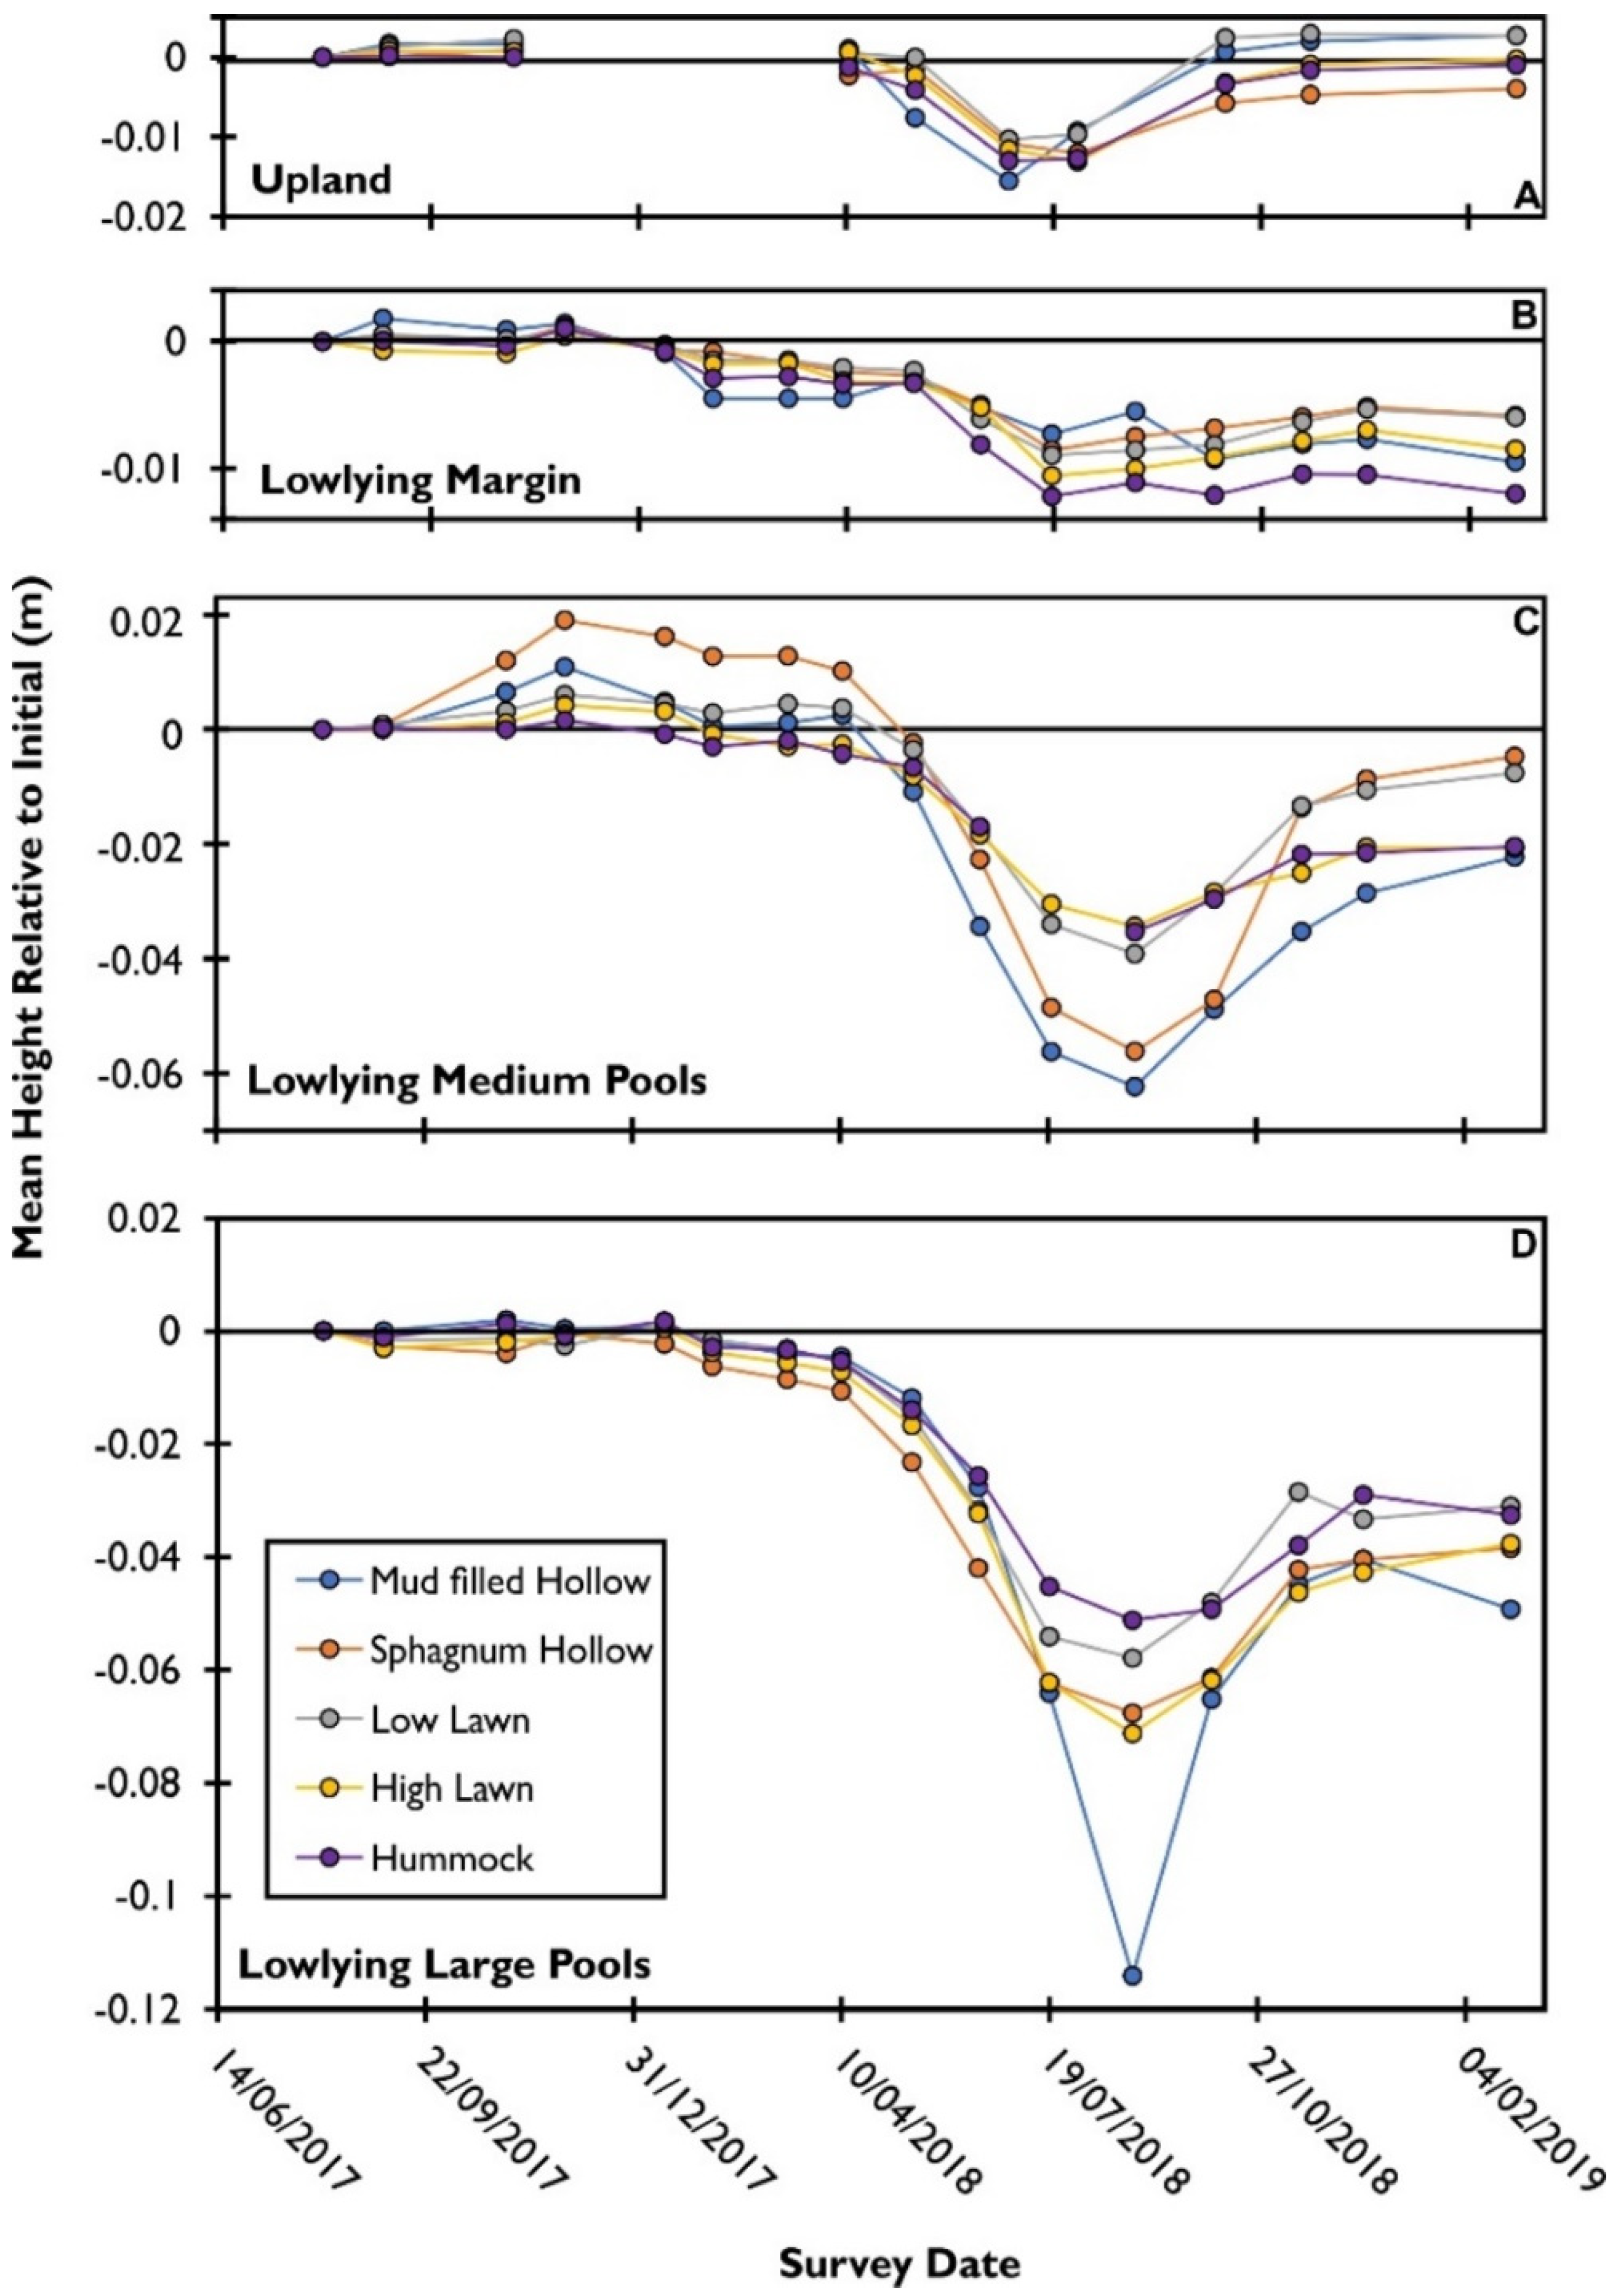
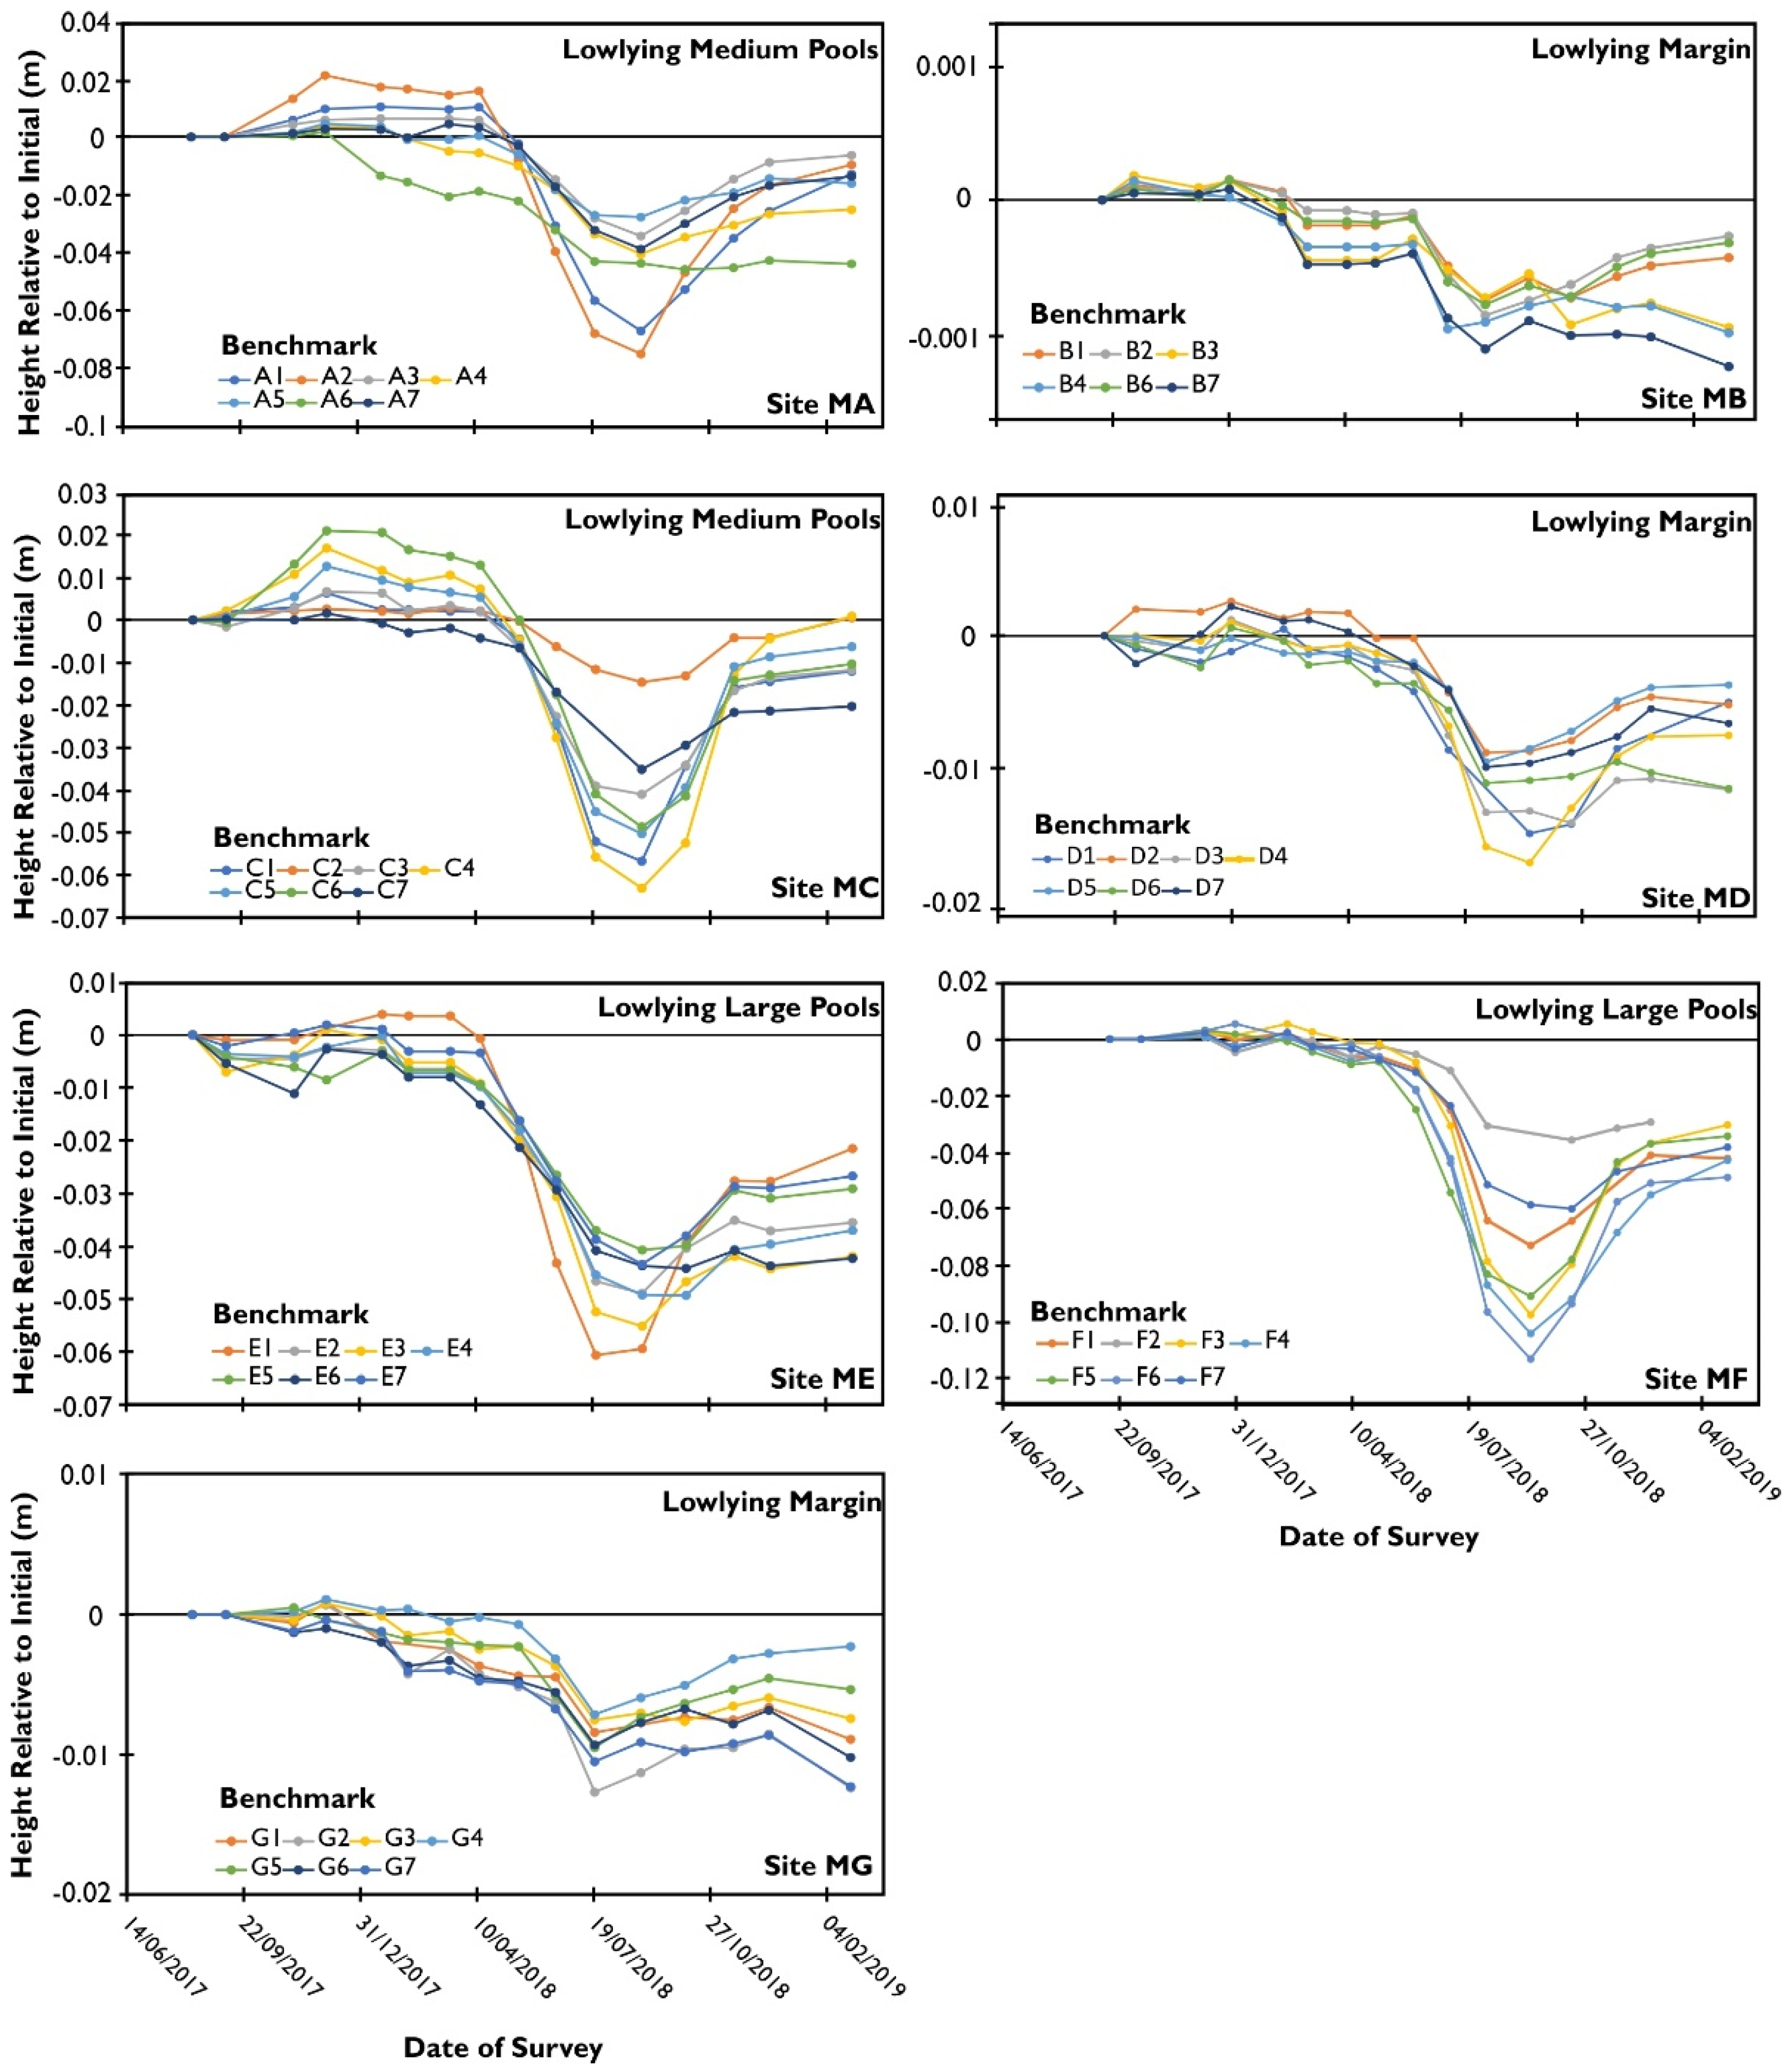
3.1. Quantifying Multi-Scale Variability in Peat Surface Motion within Blanket Peatland

3.1.1. Munsary (Low Lying Blanket Peatland Large Pools)

At Munsary, the subsites within an area of large pools (sites M-E and sites M-F, Figure 1) correspond to an area of quaking peatland. The unstable nature of the peat surface at these sites resulted in higher equipment error compared to elsewhere (0.0005–0.001 m), and this was most pronounced during wet periods.
The mean height of benchmarks at both sites M-E and M-F peaked in November/December, with Site M-F peaking slightly earlier in the season (Figure 2). Benchmarks at both sites reached a minimum in late August. Site M-F shows the most dynamic behavior of all the sites examined with a mean inter-seasonal range in peat surface height in hydrological year 2017–2018 between 0.03 and 0.120 m, with a mean range for all benchmarks of 0.08 m. Site M-E was slightly less dynamic with a range between 0.04 and 0.06 m with a mean range of around 0.05 m in 2017/18. This range is unlikely to be typical as the survey corresponds with the 2018 European Drought event. The effect of the drought resulted in a 0.03–0.035 m drop in peak peat surface height between Autumn 2017 (pre drought) and Autumn 2018 (post drought) producing a subsidence trend at both sites over the monitoring period (Figure 2).
Benchmarks at subsite M-E and M-F showed relatively low variability with a standard deviation of around 0.003 and 0.006 m, respectively (Figure 2). However, during the drought period the behavior of each benchmark diverged, leading to a doubling of the standard deviation (0.006 m and 0.012 m, respectively). The inter benchmark variability subsequently reduced during Autumn 2018 but had not returned to pre-drought levels.
In the Low lying Large Pools subsites, there was no clear trend in the behavior of different microtopographies although hummocks appear to be amongst the most stable (Figure 3). Positional factors appear to have an effect on behavior at both subsites, for example in subsite M-F benchmarks located close to an area of shallower peat appears relatively stable whereas benchmarks which show more dynamic properties are all over deeper quaking peat. At subsite M-E benchmarks located close to a large pool complex show greater dynamism than those located further away from the pool margins. Overall, the low lying large pool systems appear to show the most dynamic behavior of all areas examined (Figure 2).

3.1.2. Munsary (Low Lying Blanket Peatland Medium Pools)

Sites M-A and M-C are located within a stable small to medium scale pool complex aligned parallel to the peatland margin. Equipment error remained relatively constant (<0.5 mm) over the survey period, although on occasions, errors increased due to high wind speeds.
Both sites show strong evidence of seasonal motion with peak surface height achieved in late November and minimum values in late August (2017–2018; Figure 2). Both M-A and M-C show inter-seasonal ranges between 0.02 and 0.09 m for 2017–18 with mean values of 0.055 and 0.045 m, respectively. Sites M-A and M-C show a mean difference between pre and post drought peak surface height of approx. −0.01 mm and −0.025 m, respectively. Both sites show an overall subsidence trend over the survey period although at a lower rate than seen at sites M-E and M-F.
Similar to what was observed for the larger pools, the behavior of most benchmarks in sites M-A and M-C was consistent during the predrought period. This is evidenced by standard deviations of between 0.007 m and 0.004 m, respectively, which doubled during the peak drought period to 0.014 m and 0.012 m. However, unlike sites M-E and M-F variability returned to predrought levels by October 2018 for all but one benchmark (M-A2), which showed a constant subsidence trend and little seasonal variation.
At both low lying medium pool subsites (M-A and M-C), benchmarks show a general trend of decreasing amplitude following mud filled hollows < hollows <low ridge < high ridge < hummocks (Figure 3). This strong microtopographic control is particularly pronounced during the drought period. An exception is benchmark M-C2 which remained relatively stable during the drought period and showed behavior comparable with benchmarks from the peatland margins (sites M-B, M-D and M-G). This benchmark overlies an area of shallower peat without pools, associated with an underlying topographic high, identified previously from peat probing. Overall medium pools exhibit relatively dynamic seasonal behavior compared to peatland margins and upland peats (Figure 2).

3.1.3. Munsary (Low Lying Blanket Peatland Margins)

Sites M-B, M-D and M-G are located close to the margins of the peatland within dense shrub dominated peatland with a few seasonally dry pools (Figure 1). Equipment error for measurements within these areas was <0.0005 m which remained relatively constant over the survey period. Equipment error in marginal sites was in general lower than within the pool systems, due to the increased stability of the peat substrate.
All marginal sites showed a net subsidence trend over the observation period (Figure 2). In general, the marginal sites peaked earlier than the pool systems, in September/October 2017 and November/December 2019. Marginal sites also showed different behavior during the drought period of summer 2018 with minimum peat surface heights in July compared with August for Low lying Medium/Large Pool sites. Interseasonal variability was reduced compared to pool systems. Mean peat surface at sites M-B, M-D and M-G dropped by 0.001 m, 0.013 m and 0.009 m, respectively, during summer 2018. This was followed by relatively limited recovery post drought with a mean difference pre and post drought peak surface height of −0.008 m, −0.0075 m and −0.0075 m, respectively, with rates of recovery much lower than observed within pool system sub-sites. Intra-benchmark variability was reduced compared to pool sites. Pre-drought the standard deviation from mean motion within sites M-B, M-D, M-F was 0.0009 m, 0.001 m and 0.0012 m, respectively. This increased slightly post drought with standard deviations of 0.0014 m, 0.003 m and 0.0015 m, respectively. Increased variability reduced over time post drought but remained higher than pre-drought.
PSM within the low lying marginal subsites (M-B, M-D and M-G) appears to be relatively insensitive to microtopography and therefore has a relatively minor impact on benchmark variability (Figure 3). At subsite D benchmarks from high ridge and hummock communities show lower recovery rates compared to low lawn communities. At subsite B it appears benchmarks separate into two groups post drought with those located deeper within the peatland showing continued subsidence whilst sites closer to the peatland margin show slow recovery. Overall, the peatland margins show a relatively low amplitude peat surface motion and appear to be prone to subsidence (Figure 2). Motion within the Munsary Dubh Lochans focus site appears to be dominated by the pool signal which make up the majority of the peatland area.

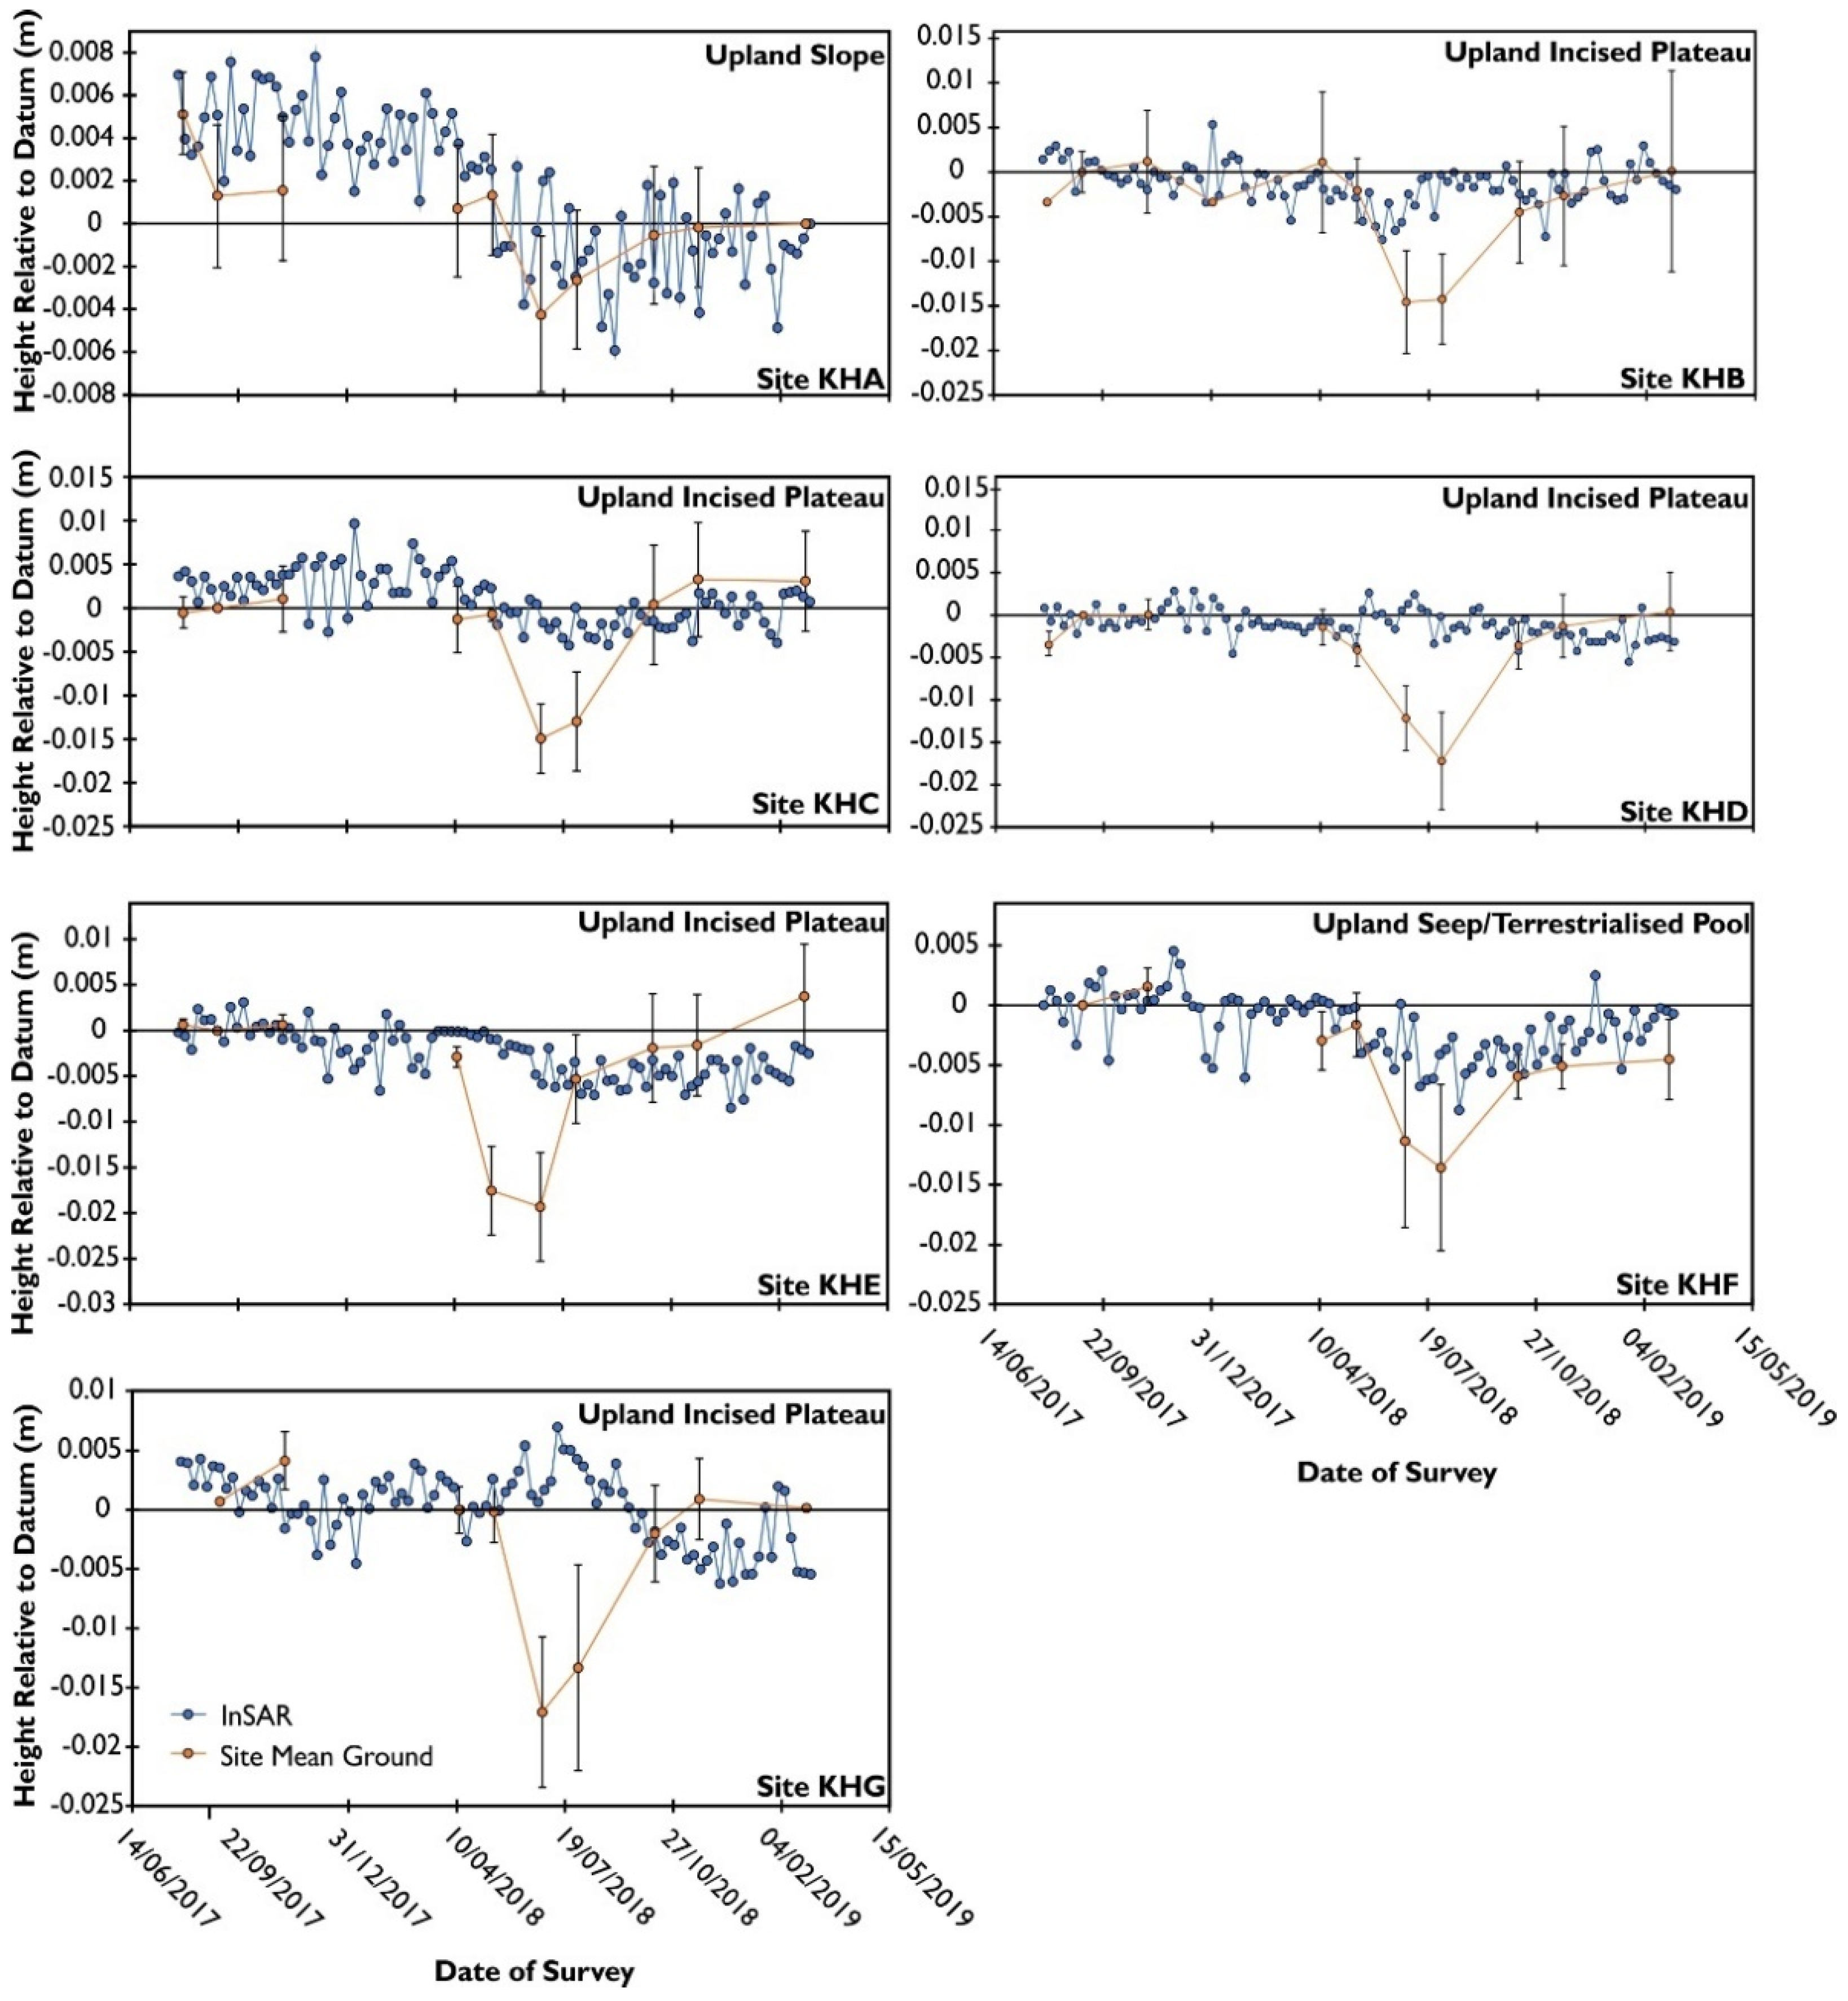
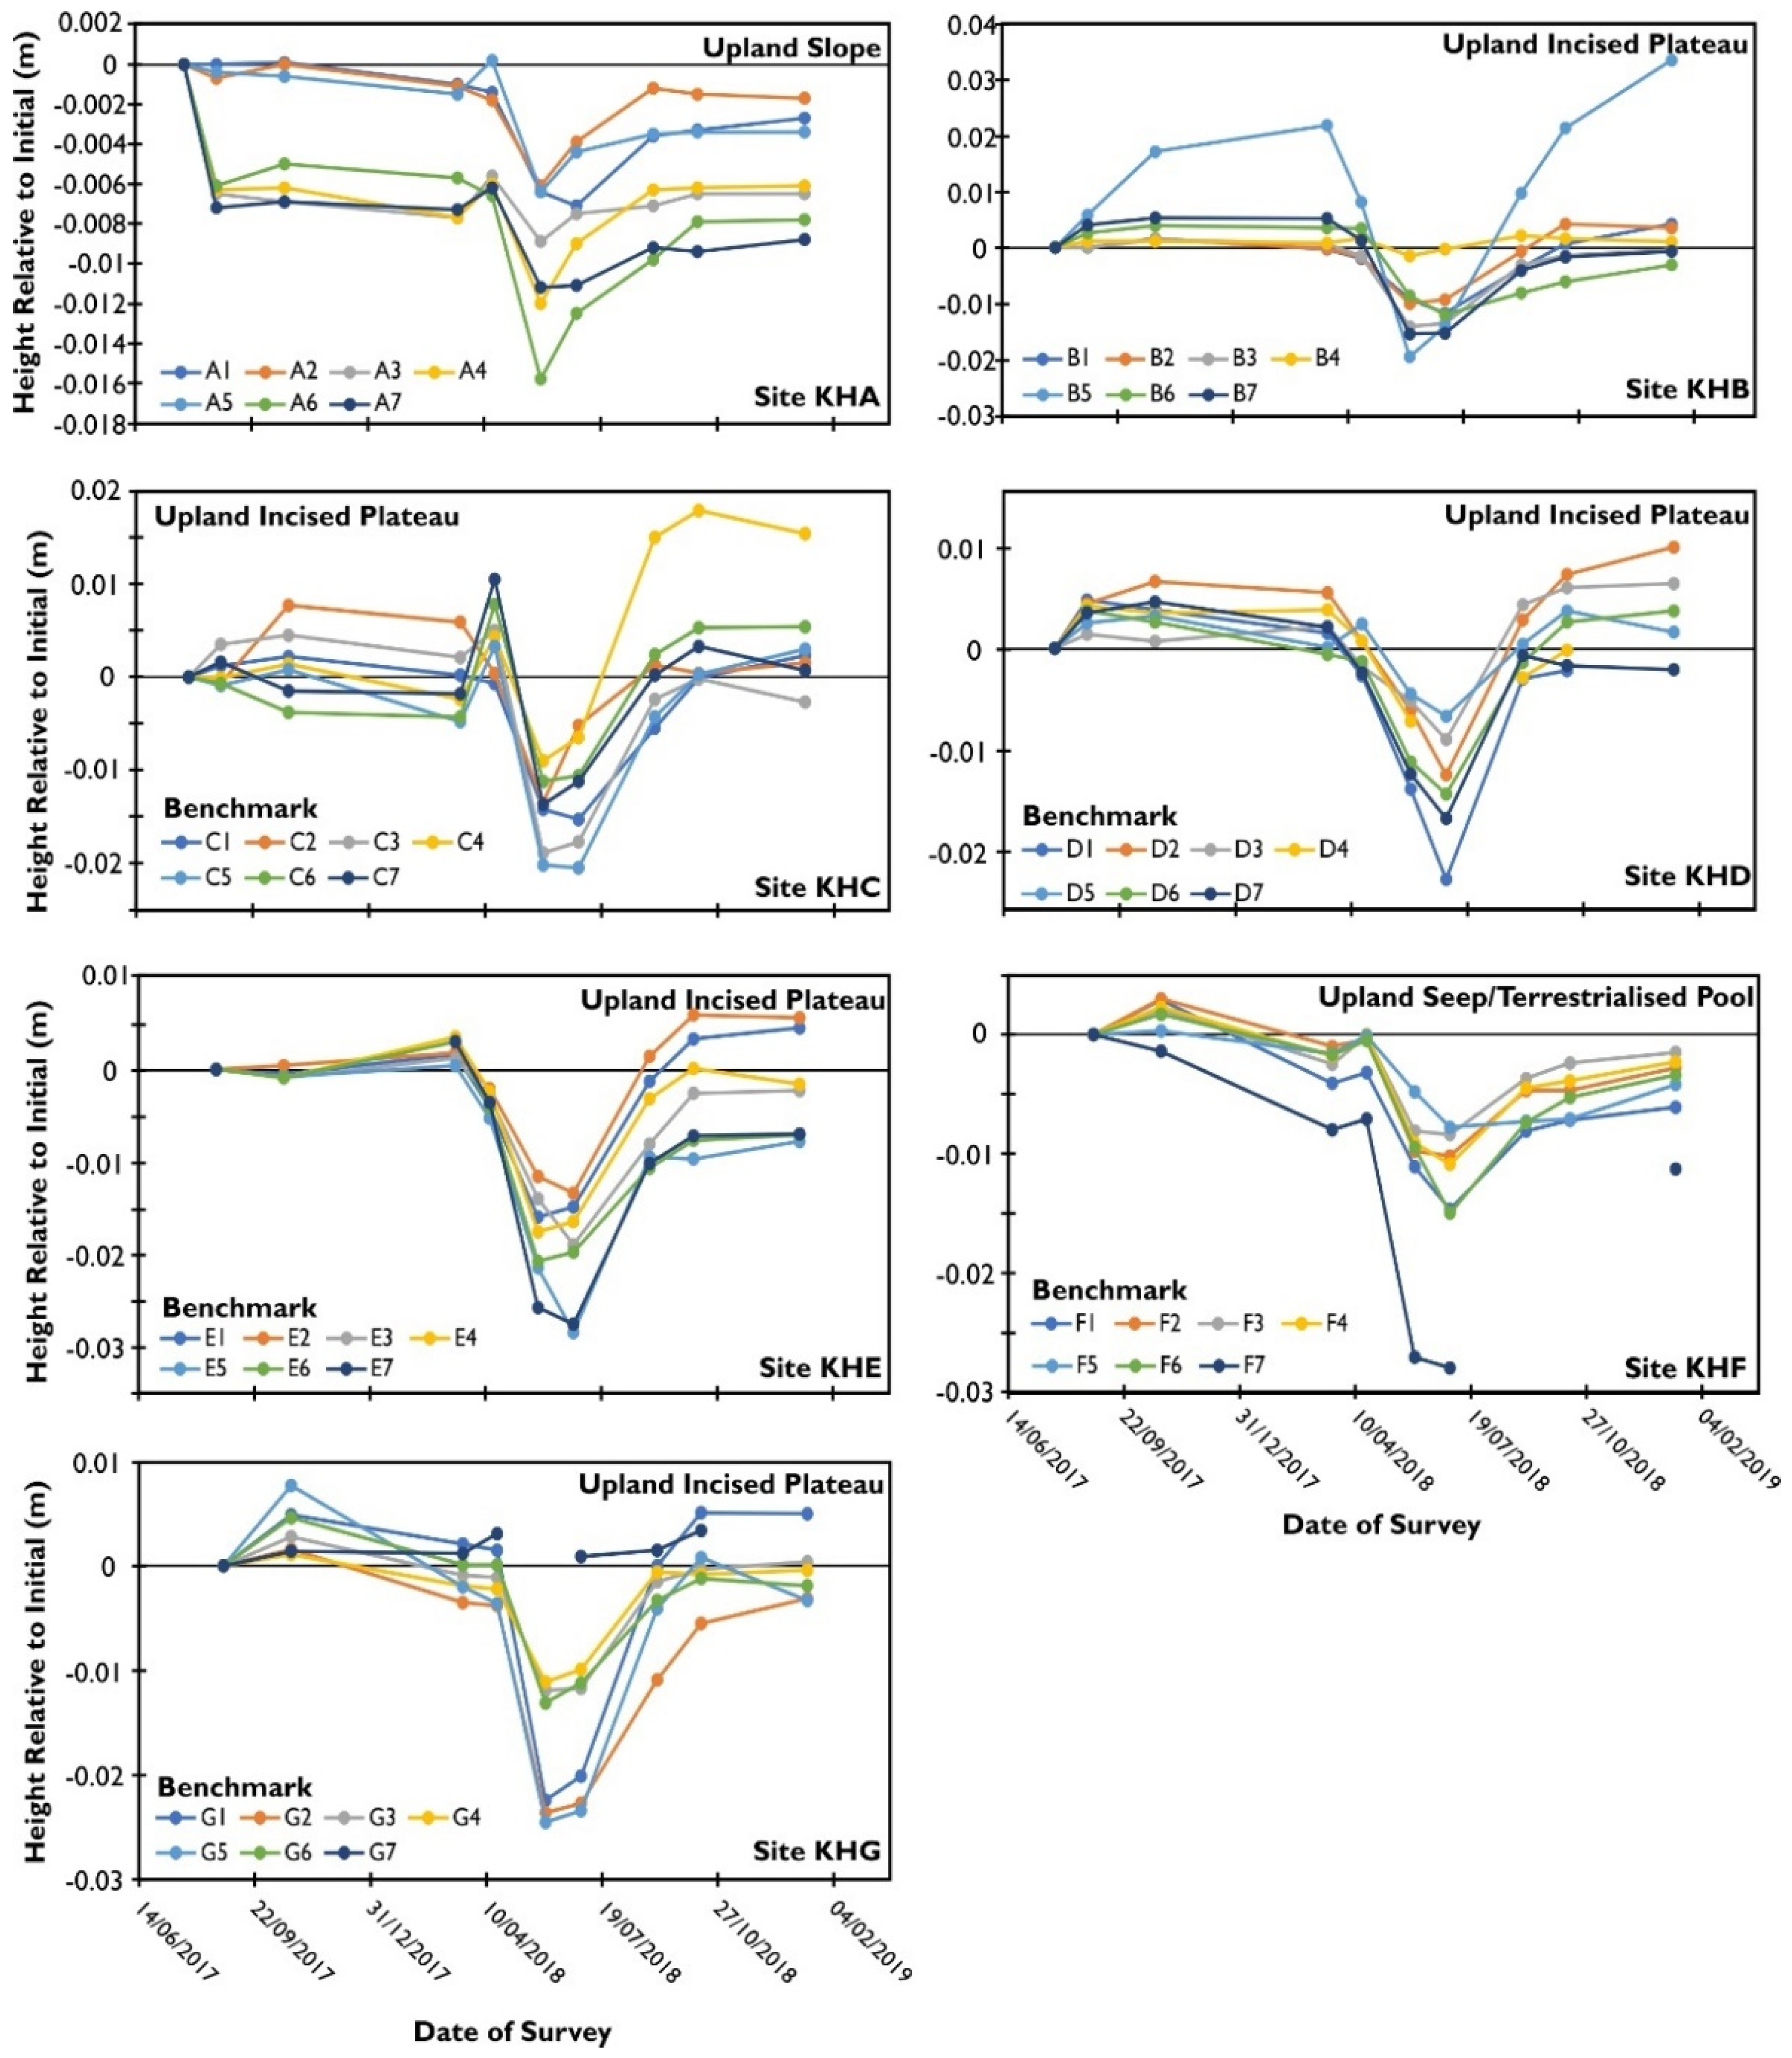
3.1.4. Knockfin Heights (Incised Upland Blanket Peatland)

At the upland Knockfin Heights focus site, mean equipment error was low (<0.0005 m) and remained constant over the survey period across most subsites, similar to the marginal subsites at Munsary. An exception was at Knockfin Heights Subsite C (KH-C) where deep peat hags (>2 m deep) meant surveying was more complex which increased error to (0.0005–0.001 m).
Unlike the low lying Munsary site, the upland Knockfin Heights showed similar peat surface motion characteristics across the site, despite the high degree of fragmentation and variability of peatland environments present (Figure 2). All sites showed a slight subsidence trend across the survey period. Subsites reached a maximum peat surface height between September and December, similar to marginal subsites within the low lying areas. Similarly, subsites reached a minimum during the drought period in June and July 2018. Subsites KH-A, B, C, E and G reached a minimum in June 2018, whereas KH-D and F reached a minimum in late July. Subsites showed a mean drop in peat surface height in response to the drought of between 0.006 m (Subsite KH-A) and 0.0022 m (Subsite KH-E). Recovery began in July 2018 with subsites KH-B, C, D and G exceeding mean peat surface heights measured during the pre-drought period by approx. 0.004 m. Subsites KH-A, E and F did not recover to predrought heights with mean peak surface height lower by 0.0015 m, 0.004 m and 0.0025 m, respectively.
Across Knockfin Heights inter-benchmark variability was reduced compared to the Low lying site with predrought standard deviations between 0.001–0.003 m across all subsites. This variability remained constant at most subsites over the drought and post drought periods. However, at subsites KH-D, E, F, and G variability increased over the drought period before reducing in the post drought period. Microtopography at the upland site had relatively little impact on individual benchmark behavior overall (Figure 3). However, bare peat areas tended to be more dynamic and responsive compared to vegetated areas. At subsite KH-F situated within a revegetated pool or seep, benchmarks were very consistent but responded slower to the impact of the drought. Overall, PSM in the upland sites show great similarity to the low lying margin sites although it tends to be slightly more dynamic (Figure 2). It is also less variable than in low lying sites.

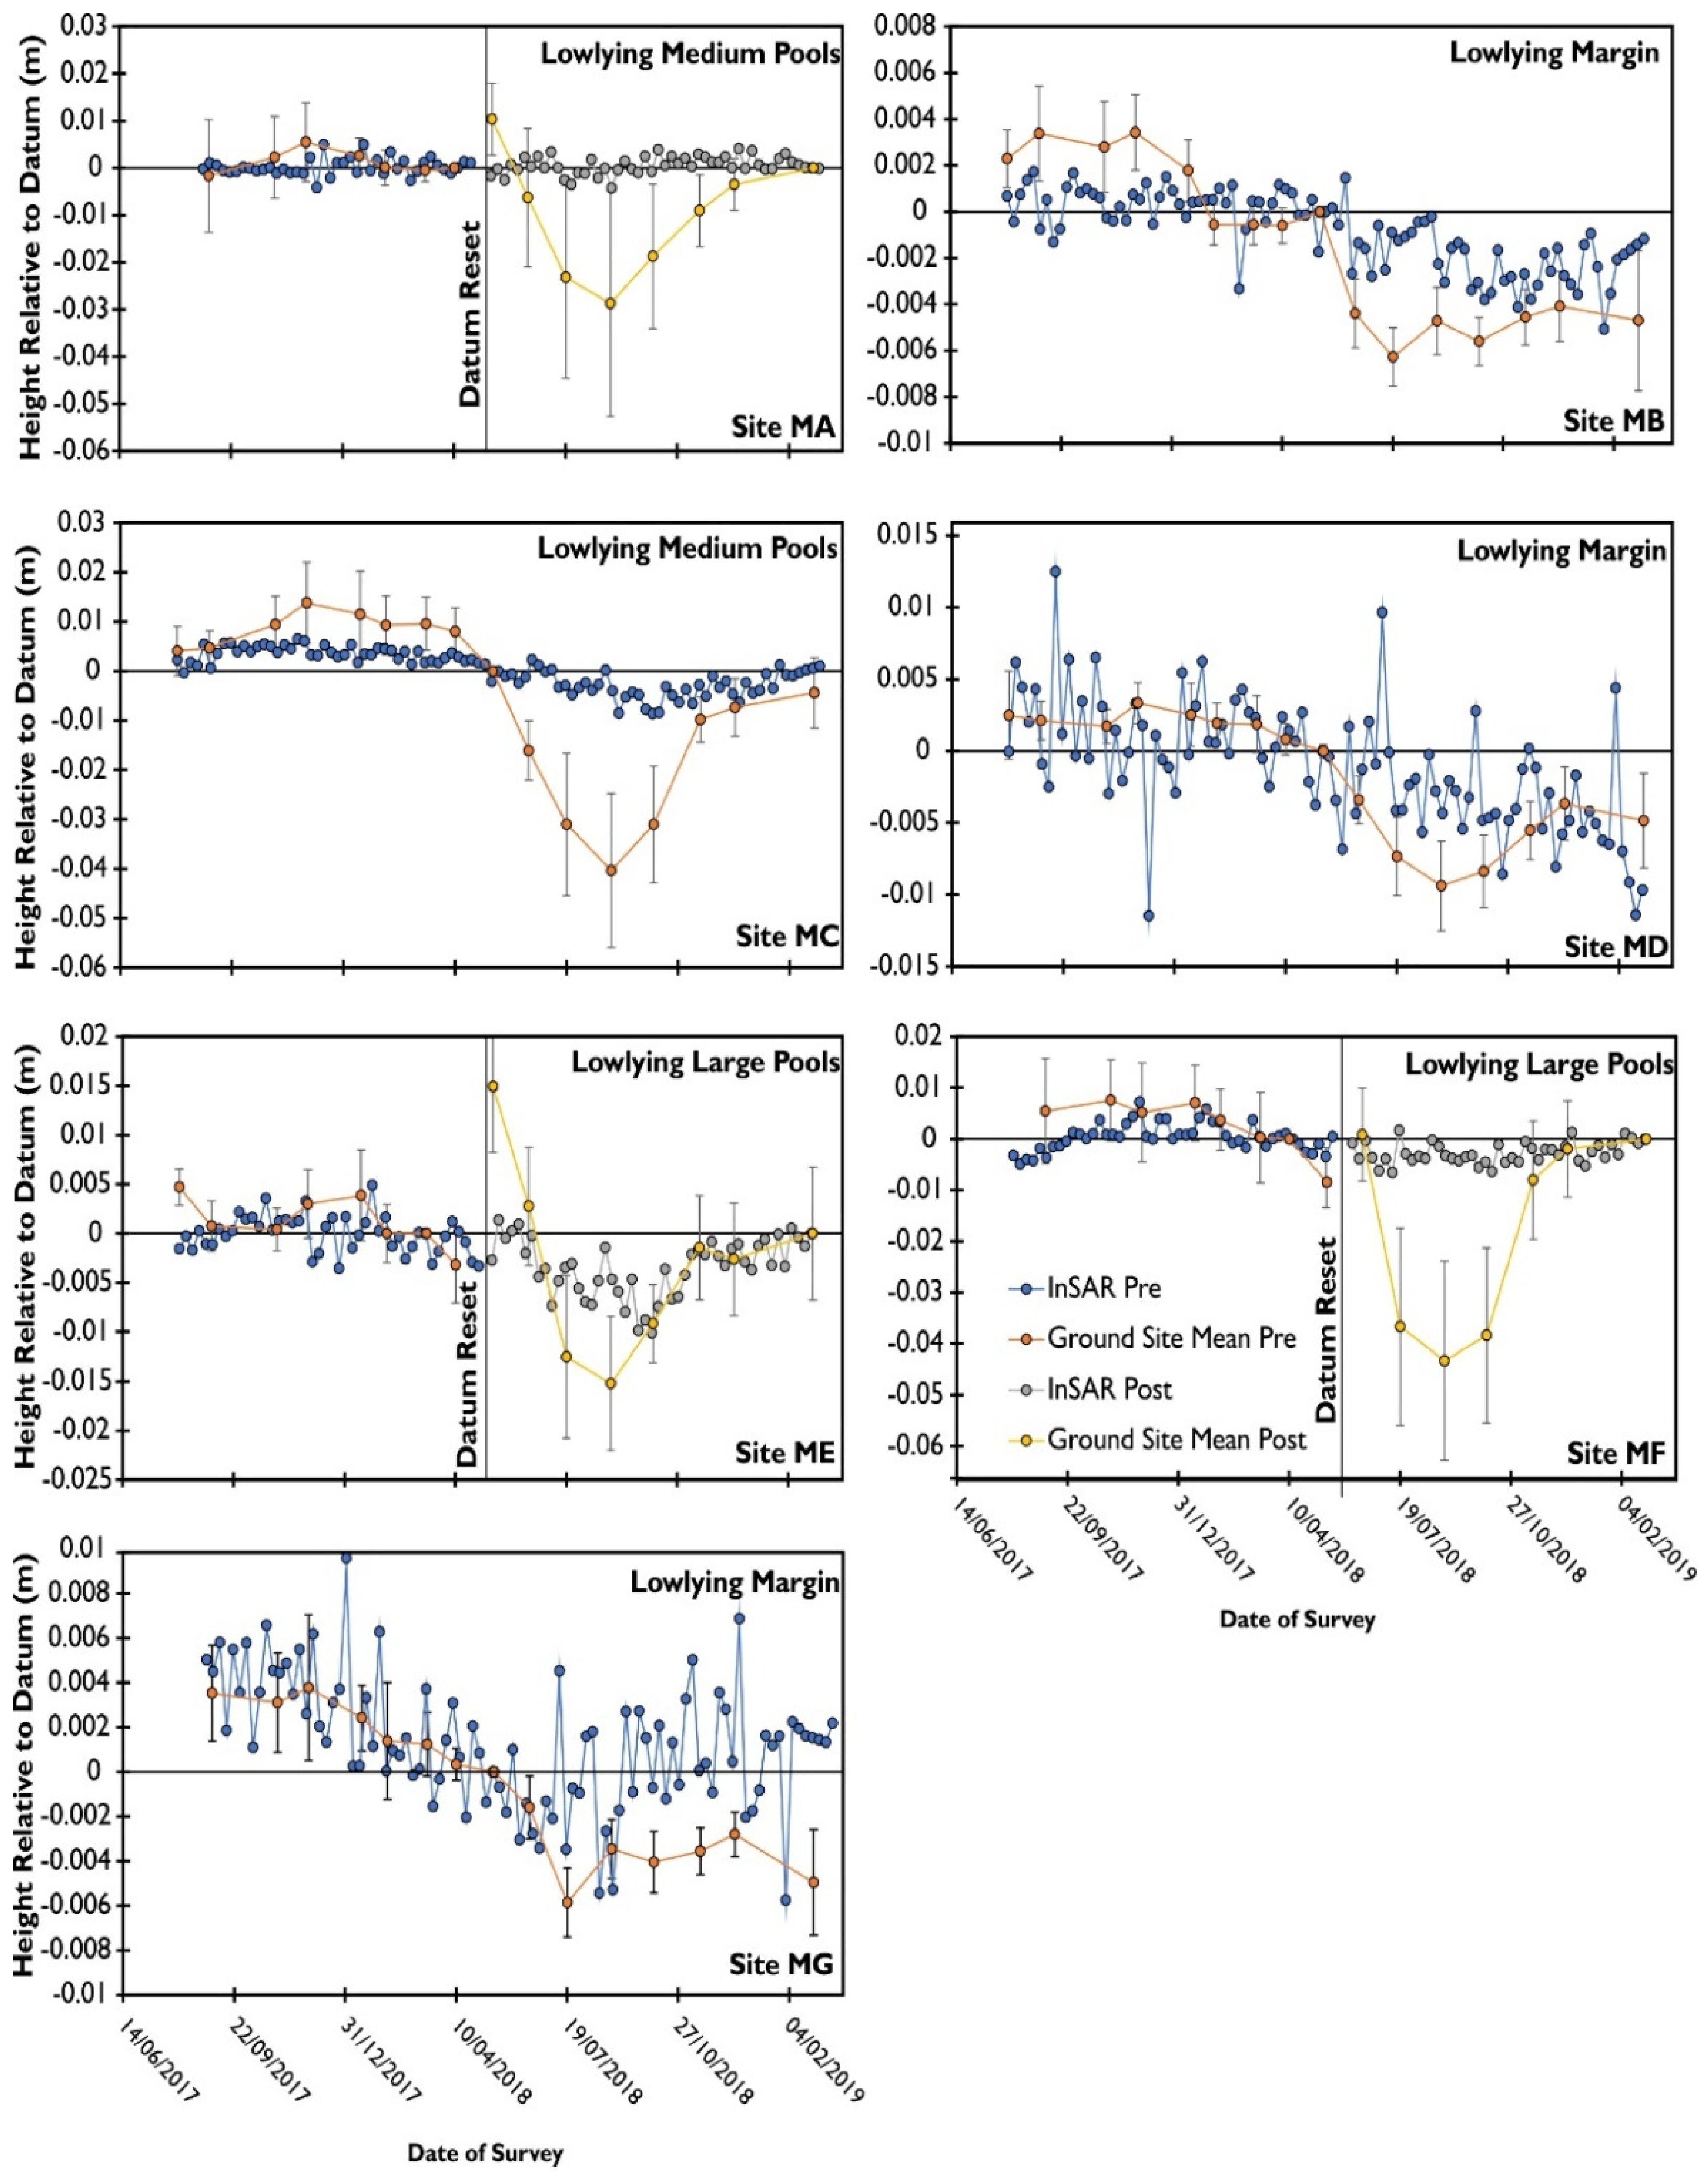
3.2. Comparison with InSAR

At the Munsary Low lying Site the high rate of subsidence exceeded the ambiguity threshold leading to phase unwrapping error and underestimation of motion in the InSAR timeseries during the drought period. Consequently, the comparison between ground and InSAR measures of peat surface motion was split between pre and post drought measures at sites (M-A, E, F). Pre drought 79% of InSAR measures were within standard deviation of the ground measurements (Figure 4). Comparison of the long-term trends in peat surface motion over the survey period (Table 2) shows that InSAR measures consistently underpredicts surface motion, with the effect most pronounced over the large pool and medium pool areas with a mean difference between ground measures and InSAR for the Low lying site of 0.018 m/yr. When the effects of the drought were removed (i.e., pre-drought conditions) agreement was much closer with a mean site difference of 0.0013 m/yr between ground and surface measures. As with the whole survey period measures, difference was most pronounced in the large pool and medium pool sites but improved markedly (e.g., Subsite M-E; 0.028 m/yr vs. 0.006 m/yr) over the survey period including drought vs. predrought, respectively.
Post drought only 48% of InSAR measurements lay within standard deviation of the ground survey measurements. Deviation between the InSAR and ground measures during the post drought period was caused by underestimation of the drought response within the InSAR timeseries. In other words, InSAR measurements during the peak drought period showed a more muted response compared to ground measurements.
Comparability between the two datasets was restored during the recovery period when peat surface motion reduced. The length of the period of non-agreement due to the drought depended on subsite position and was greatest on subsites which showed the most dynamic behavior (c. 3 months for the large pool systems) and was reduced or absent within more marginal peat settings with less dynamic characteristics.
Comparison of InSAR derived timeseries of surface motion with precise leveling derived measures of peat surface motion at Knockfin Heights shows that 73.7% of InSAR measurements lie within standard deviation of measurements from ground surveys (Figure 5). The two measures disagree during June and July 2018 corresponding with peak drought conditions at the site. During this period, the timeseries became noisier and largely underestimated ground motion as measured by precise leveling. However, post drought, agreement between InSAR and ground measures was largely restored.
Comparison of the long-term motion trends (Table 2) at the upland Knockfin Heights Site showed good agreement at all sites with a mean difference of 0.002 m/yr. As with the Munsary subsites there is a tendency for InSAR measures of PSM to underpredict motion.
Similarly peak timing is replicated between InSAR and ground measures, although where phase unwrapping errors were introduced during peak drought conditions, this is largely underestimated. It appears that InSAR techniques struggle to measure outside an interseasonal range of 1–2 cm and therefore underestimate long term motion. However, the relative difference and direction of motion is preserved between subsites, meaning that the measure is still a meaningful one. This underestimation is apparent across all sites (Figure 4 and Figure 5) but is particularly pronounced at M-A, M-E and M-F. The underestimation of motion by InSAR is problematic and is particularly pronounced within the most dynamic parts of the peatland, e.g., pool systems and during periods of rapid motion such as associated with drought conditions.
However, the underlying trends in surface motion observed within ground measures can still be seen within the InSAR data. When normalized (Figure 6) the ground motion data and InSAR data for the four pool sites during the drought period (M-A, MC, M-E and M-F) match each other closely. This shows PSM parameters derived from the InSAR timeseries can be observed on the ground even within the most dynamic sites.

4. Discussion

4.1. Precise Leveling as a Peatland Surface Motion Measurement Technique

This study confirms that it is possible to monitor peat surface motion in blanket peatland precisely at the cm-sub-mm scale using advanced leveling techniques under most conditions. This precision importantly matches the scale of motion experienced on a monthly basis in blanket peatland. It also enables equipment error to be minimized and local variability to be more easily determined. By adopting a nested approach formed of clusters of sub-sites and microtopographic measurements, the multi scale variability of peat surface motion characteristics was captured by our study. A similar clustered approach has recently been successful in measuring intra-class variability in peat surface motion between different land use practices within upland blanket peatland in England [27] demonstrating the wider applicability of such a technique.
As with most ground-based peat surface motion techniques, precise leveling is resource intensive and is dependent on accessibility and weather conditions. For example, surveying during the period December 2017–March 2018 was not possible at Knockfin Heights due to persistent snow cover, and survey flexibility was often required due to the frequent high winds (>30 km/h) experienced within the Flow Country in order to maintain data precision. These would also confound other ground-based measures such as TLS and Lidar UAV surveys. Satellite remote sensing therefore represents the most cost-effective and reliable means of obtaining landscape scale coverage of PSM, although with some compromise with respect to accuracy.

4.2. Comparison between Ground-Based and APSIS InSAR Techniques

This study demonstrates that understanding of intra-pixel scale variation of peat surface motion is essential if comparison is to be made between ground and satellite derived measures of deformation. Intra-pixel variability between different benchmarks within blanket peatland in most cases greatly exceeded that of equipment error which is generally <0.5 mm/measurement. While this variability is incorporated into the InSAR measures of PSM, the relative contribution of different peatland microtopographic features within each pixel are still unknown. However, our results strongly imply that upscaling PSM from a single point to areal satellite radar-based techniques is unlikely to work in these landscapes as this approach would fail to incorporate any local variability. This leaves the quality of the validation subject to both the intrinsic variability of the site chosen, the error of the ground validation technique used, and the representativeness of the benchmark. As ground-based peat surface motion monitoring sites are not generally designed specifically for remote sensing validation [9,12,13], it is likely that this would introduce bias towards specific parts of the peatland system further reducing comparability with areal techniques such as InSAR. The effect of such sampling biases on peatland has also been observed when single cores per site are used for the reporting of basal radiocarbon dates from UK peatlands [44] and in palaeoecological studies using crypto-tephra as chronological markers [45] and has been shown to have a profound effect upon interpretation. By defining the range of motion within a pixel a fairer comparison can therefore be made.
The approach used reveals that during non-drought periods long term PSM from InSAR measurements from a single pixel underpredict by approximately 1–2 mm/yr. This replicates observations by [31] at a site near the Munsary low lying study site. We show that when drought data are included, mean InSAR motion greatly underpredicts ground motion in pool areas (15–42 mm/yr). This is partially a result of the relatively short survey duration in this study and would likely lessen over a longer survey period as the impact of the 2018 drought becomes diluted over time. The underprediction is not uniformly distributed. The effect is greatest in sites which showed the greatest dynamism, such as sub-sites with large (M-E, M-F) and medium pools (M-A, M-C) and least pronounced in marginal (M-B, M-D, M-G) and upland sites (KH-A to G). This is likely to make condition estimates based solely on long term motion difficult to interpret. A possible solution to this issue would be to use L band radar, which can measure larger scale motion, but this is currently costly and comes at the expense of reduced sensitivity at lower rates of ground motion [4]. However, parameters such as peak timing and relative amplitude appear to be captured as shown by the normalized data (Figure 6).

Peat Surface Motion Timeseries

Outside of drought conditions, >80% of InSAR timeseries measurements are within the standard deviation of ground measurements. When compared with different plant communities within each site, the InSAR time series tend to be most comparable with the least dynamic parts of the system, namely the low ridge/high ridge communities dominated by shrubs. This might reflect the tendency of InSAR to underestimate peat surface motion [31], the actual dominance of such communities within each pixel or that these communities disproportionately dominate the reflected radar signal from the peatland. However, to derive this would require high resolution analysis of the backscattering response of the various components of the peatlands system to produce a weighted average from each microtopography, potentially using a similar approach to [46] which was beyond the scope of this study.
InSAR motion during drought events can be highly unreliable with high subsidence rates leading to phase unwrapping errors and most sub-sites underestimating the rapid subsidence measured by precise leveling. This effect is most pronounced over the most dynamic sites such as site M-F which showed unrealistic fluctuations in PSM. The unwrapping issue corresponded with a drop in peat surface height of approx. 50–100 mm within the first weeks of June 2018 at the pool sites M-A, M-E and M-F. This effect lasted for the duration of the drought before recovering in the Autumn of 2018. Within upland and marginal sites, the drought effect was less noticeable, which is attributable to the denser, more eroded, nature of the peats in these areas as indicated by the higher bulk densities observed at these sites [33] which appears to dampen motion. In the case of upland sites, climatic factors such as increased occult precipitation and altitude related temperature gradients may have also buffered the impact of the drought.
At the landscape unit scale, ground-based leveling data support the bimodal distribution in peak timing observed and derived from InSAR data [7]. It also supports the broad ecohydrological relationships with peatland motion identified by [1,7,32], namely that in wetter and lower gradient, Sphagnum dominated parts of the ecosystems surface height peaks during winter. On the other hand, steeper and shrub dominated sites surface height peaks earlier during both pre and post drought conditions. Ground measurements show considerable variability in the amplitude of these seasonal oscillations which also replicates observations made from satellite radar [7]. The timing of and recovery time following extreme climate events such as observed during the 2018 European Drought event was also reproducible between ground and satellite radar measures in this study. Overall, InSAR measures reflect key peat surface motion parameters identified previously [1,5,7] and measured on the ground as part of this study and should enable differentiation and classification of different peatland conditions.

5. Conclusions

This study demonstrates for the first time that ground measurements of peatland surface motion can be upscaled with satellite radar, and supports the idea that InSAR PSM could be used as a proxy for peatland condition at the landscape scale [7]. To further validate InSAR measures with continuous point based PSM data on the ground would require a limited number of long-term monitoring sites representing the range of existing conditions. This could be achieved more cost-effectively by the use of automated systems. For example, the camera-based approach used by [9,10] allows simultaneous measurement of peat surface motion and water level. An important finding from this study is that accounting for local and regional variability in peat surface motion should be an important consideration in survey design for InSAR validation, with a series of clustered measurements capturing micro-topographic features and meso-scale parts of the peatland system, would be preferable to more dispersed or transect based designs. The evidence from the Flow Country indicates that this is particularly important within the most dynamic parts of the peatland where the range of motion between different microtopographies is most pronounced. Such systems, in turn, would help inform interpretation and gap filling, which are particularly important during extreme events such as the 2018 European Drought Event, where motion temporarily exceeded the capacity of Sentinel-1 to measure it.
By adopting such an approach, comparability and interoperability between ground based and satellite-based measures would be maximized. This will become increasingly important as a consequence of growth in the usage of satellite radar-based techniques in peatland monitoring [1,2,3,4,5,7,32,47,48]. Overcoming the lack of suitable ground validation is critical, as it is often cited as a barrier to the further development of the technique for example in the linking of carbon flux data with InSAR derived ground motion data [1,48].

Author Contributions

The authors acknowledge the following contributions for the manuscript Conceptualization, C.M., P.J.G., R.A., S.M. and D.J.L.; methodology, R.A., D.J.L., C.M., P.J.G., H.P.S., A.V.B. and A.S.; formal analysis, C.M., A.V.B. and H.P.S.; investigation, C.M., H.P.S. and P.J.G.; writing—original draft preparation, C.M.; writing—review and editing, All authors; visualization, C.M. and H.P.S.; supervision, D.J.L. and R.A.; project administration, D.J.L. and R.A.; funding acquisition, D.J.L., R.A. and S.M. All authors have read and agreed to the published version of the manuscript.

Funding

This work was supported by the Natural Environment Research Council [grant number NE/P014100/1], Leverhulme Leadership Award [grant number 1466NS] and the European Social Fund and Scottish Funding Council as part of Developing Scotland’s Workforce in the Scotland 2014–2020 European Structural and Investment Fund Programme.

Institutional Review Board Statement

Not applicable.

Informed Consent Statement

Not applicable.

Data Availability Statement

Data within this Manuscript is held within the EIDC data repository (1) Avercamp, J.; Marshall, C.; Sterk, H.P.; Gilbert, P.; Andersen, R.; Marsh, S.; Large, D.J. Peat characteristic data from Blanket Peatland in the Flow Country, Caithness and Sutherland, 2018. 2021. Available online: https://catalogue.ceh.ac.uk/documents/3458e0b9-5002-4ddb-bcb3-1c7fb08fb70b (accessed on 1 October 2021). (2) Marshall, C.; Large, D.J.; Andersen, R.; Gilbert, P.; Sterk, H.P. Monthly precise levelling data of peat surface motion from upland and lowland blanket peatland in the Flow Country, Scotland, 2017–2019. 2021. Available online: https://catalogue.ceh.ac.uk/documents/f4f79d46-dac7-4628-a0b3-7427761737a6 (accessed on 1 October 2021). (3) Marshall, C.; Large, D.J.; Andersen, R.; Bradley, A.W.; Sowter, A.; Gilbert, P.; Sterk, H.P.; Marsh, S. Interferometric Syn-thetic Aperture Radar ground motion and timeseries data over the Flow Country, Caithness and Sutherland, March 2015–July 2019. 2021. Available online: https://catalogue.ceh.ac.uk/documents/7c2778bf-b498-4ba2-b8cb-60a2081e5ba7 (accessed on 1 October 2021).

Acknowledgments

The authors would like to thank members of the following organizations who provided access to sites for surveys or insight and local knowledge about past and present management over the study area: NatureScot, Royal Society for the Protection of Birds and Plantlife with particular thanks to Daniela Klein (RSPB), Mark Hancock (RSPB), Neil Cowie (RSPB) and Alistair Whyte (Plantlife). We also are grateful to David Gee and Ahmed Athab for their assistance with the APSIS InSAR data output and Leica, Lukasz Bonenberg and Sean Ince for levelling training at the start of the project. We would also like to thank Anika, Eliot, Jasmijn, Jeroen, Julia, Martin, Pája and Wouter for assistance with the field campaign.

Conflicts of Interest

Andrew Sowter is affiliated with Terra Motion Limited. The APSIS (Advanced Pixel System using Intermittent SBAS) method is owned by the University of Nottingham and is the subject of a UK Patent Application (No. 1709525.8) with the inventor named as Andrew Sowter; it is currently Patent Pending.

Appendix A

Figure A1. Precise Leveling Timeseries of individual benchmarks at subsites (Sites M AG) at the Low-lying Munsary Site.
Remotesensing 14 00336 g0a1
Figure A2. Precise Leveling Timeseries of individual benchmarks at subsites (Sites KH AG) at the Upland Knockfin Heights Site.
Remotesensing 14 00336 g0a2

References

  1. Alshammari, L.; Boyd, D.S.; Sowter, A.; Marshall, C.; Andersen, R.; Gilbert, P.; Marsh, S.; Large, D.J. Use of Surface Motion Characteristics Determined by InSAR to Assess Peatland Condition. J. Geophys. Res. Biogeosci. 2020, 125, e2018JG004953. [Google Scholar] [CrossRef]
  2. Fiaschi, S.; Holohan, E.P.; Sheehy, M.; Floris, M. PS-InSAR Analysis of Sentinel-1 Data for Detecting Ground Motion in Temperate Oceanic Climate Zones: A Case Study in the Republic of Ireland. Remote Sens. 2019, 11, 348. [Google Scholar] [CrossRef] [Green Version]
  3. Tampuu, T.; Praks, J.; Uiboupin, R.; Kull, A. Long Term Interferometric Temporal Coherence and DInSAR Phase in Northern Peatlands. Remote Sens. 2020, 12, 1566. [Google Scholar] [CrossRef]
  4. Hoyt, A.M.; Chaussard, E.; Seppalainen, S.S.; Harvey, C.F. Widespread subsidence and carbon emissions across Southeast Asian peatlands. Nat. Geosci. 2020, 13, 435–440. [Google Scholar] [CrossRef]
  5. Marshall, C.; Bradley, A.V.; Andersen, R.; Large, D.J. Using Peatland Surface Motion (Bog Breathing) to Monitor Peatland Action Sites; 2021; Available online: https://www.nature.scot/doc/naturescot-research-report-1269-using-peatland-surface-motion-bog-breathing-monitor-peatland-action (accessed on 11 November 2021).
  6. Andersen, R.; Felgate, S.; Fernandez-Garcia, P.; Gaffney, P.; Gilbert, P.; Hancock, M.; Large, D.; Leith, F.; Marshall, C.; Mayor, D.; et al. Impact of land management on fire resilience and carbon fate in blanket bogs: The FireBlanket project. In Proceedings of the EGU General Assembly 2021, Online, 19–30 April 2021. [Google Scholar]
  7. Bradley, A.V.; Andersen, R.; Marshall, C.; Sowter, A.; Large, D.J. Identification of typical eco-hydrological behaviours using InSAR allows landscape-scale mapping of peatland condition. Earth Surf. Dynam. Discuss. 2021. [Google Scholar] [CrossRef]
  8. Zanello, F.; Teatini, P.; Putti, M.; Gambolati, G. Long term peatland subsidence: Experimental study and modeling scenarios in the Venice coastland. J. Geophys. Res. Earth Surf. 2011, 116. [Google Scholar] [CrossRef]
  9. Evans, C.D.; Callaghan, N.; Jaya, A.; Grinham, A.; Sjogersten, S.; Page, S.E.; Harrison, M.E.; Kusin, K.; Kho, L.K.; Ledger, M.; et al. A Novel Low-Cost, High-Resolution Camera System for Measuring Peat Subsidence and Water Table Dynamics. Front. Environ. Sci. 2021, 9. [Google Scholar] [CrossRef]
  10. Ledger, M.; Sjögersten, S.; Sowter, A.; Large, D.; Evans, C.; Morrison, K. Determining regional scale carbon losses from tropical peatlands using ISBAS-InSAR. In Proceedings of the EGU General Assembly 2020, Online, 4–8 May 2020. [Google Scholar]
  11. Wösten, J.H.M.; Ismail, A.B.; van Wijk, A.L.M. Peat subsidence and its practical implications: A case study in Malaysia. Geoderma 1997, 78, 25–36. [Google Scholar] [CrossRef]
  12. Hooijer, A.; Page, S.; Jauhiainen, J.; Lee, W.A.; Lu, X.X.; Idris, A.; Anshari, G. Subsidence and carbon loss in drained tropical peatlands. Biogeosciences 2012, 9, 1053–1071. [Google Scholar] [CrossRef] [Green Version]
  13. Evans, C.D.; Williamson, J.M.; Kacaribu, F.; Irawan, D.; Suardiwerianto, Y.; Hidayat, M.F.; Laurén, A.; Page, S.E. Rates and spatial variability of peat subsidence in Acacia plantation and forest landscapes in Sumatra, Indonesia. Geoderma 2019, 338, 410–421. [Google Scholar] [CrossRef]
  14. Podgrajsek, E.; Sahlée, E.; Bastviken, D.; Holst, J.; Lindroth, A.; Tranvik, L.; Rutgersson, A. Comparison of floating chamber and eddy covariance measurements of lake greenhouse gas fluxes. Biogeosciences 2014, 11, 4225–4233. [Google Scholar] [CrossRef] [Green Version]
  15. Rochette, P.; Ellert, B.; Gregorich, E.G.; Desjardins, R.L.; Pattey, E.; Lessard, R.; Johnson, B.G. Description of a dynamic closed chamber for measuring soil respiration and its comparison with other techniques. Can. J. Soil Sci. 1997, 77, 195–203. [Google Scholar] [CrossRef]
  16. Glaser, P.H.; Rhoades, J.; Reeve, A.S. The hydraulic conductivity of peat with respect to scaling, botanical composition, and greenhouse gas transport: Mini-aquifer tests from the Red Lake Peatland, Minnesota. J. Hydrol. 2021, 596, 125686. [Google Scholar] [CrossRef]
  17. Sterk, H.P. Assessing the Condition of the Flow Country Peatlands to Support Their Future Protection; University of the Highlands and Islands: Inverness, UK, 2021. [Google Scholar]
  18. Howie, S.A.; Hebda, R.J. Bog surface oscillation (mire breathing): A useful measure in raised bog restoration. Hydrol. Processes 2018, 32, 1518–1530. [Google Scholar] [CrossRef]
  19. Glaser, P.H.; Chanton, J.P.; Morin, P.; Rosenberry, D.O.; Siegel, D.I.; Ruud, O.; Chasar, L.I.; Reeve, A.S. Surface deformations as indicators of deep ebullition fluxes in a large northern peatland. Glob. Biogeochem. Cycles 2004, 18. [Google Scholar] [CrossRef] [Green Version]
  20. Kennedy, G.W.; Price, J.S. A conceptual model of volume-change controls on the hydrology of cutover peats. J. Hydrol. 2005, 302, 13–27. [Google Scholar] [CrossRef]
  21. Fritz, C.; Campbell, D.I.; Schipper, L.A. Oscillating peat surface levels in a restiad peatland, New Zealand—Magnitude and spatiotemporal variability. Hydrol. Processes 2008, 22, 3264–3274. [Google Scholar] [CrossRef]
  22. Price, J.S. Role and character of seasonal peat soil deformation on the hydrology of undisturbed and cutover peatlands. Water Resour. Res. 2003, 39, 1241. [Google Scholar] [CrossRef]
  23. Waddington, J.M.; Kellner, E.; Strack, M.; Price, J.S. Differential peat deformation, compressibility, and water storage between peatland microforms: Implications for ecosystem function and development. Water Resour. Res. 2010, 46. [Google Scholar] [CrossRef]
  24. Waddington, J.M.; Morris, P.J.; Kettridge, N.; Granath, G.; Thompson, D.K.; Moore, P.A. Hydrological feedbacks in northern peatlands. Ecohydrology 2015, 8, 113–127. [Google Scholar] [CrossRef]
  25. NatureScot. Guidance-Peatland Condition Assessment. 2017. Available online: https://www.nature.scot/sites/default/files/2017-10/Guidance-Peatland-Action-Peatland-Condition-Assessment-Guide-A1916874.pdf (accessed on 6 June 2021).
  26. Ikkala, L.; Ronkanen, A.-K.; Utriainen, O.; Kløve, B.; Marttila, H. Peatland subsidence enhances cultivated lowland flood risk. Soil Tillage Res. 2021, 212, 105078. [Google Scholar] [CrossRef]
  27. Morton, P.A.; Heinemeyer, A. Bog breathing: The extent of peat shrinkage and expansion on blanket bogs in relation to water table, heather management and dominant vegetation and its implications for carbon stock assessments. Wetl. Ecol. Manag. 2019, 27, 467–482. [Google Scholar] [CrossRef] [Green Version]
  28. Lindsay, R.; Clough, J.; Clutterbuck, B.; Bain, C.G.; Goodyer, E. Eyes on the Bog-Long Term Monitoring Network for UK Peatlands; 2019; Available online: https://www.iucn-uk-peatlandprogramme.org/sites/default/files/2019-08/Eyes%20on%20the%20Bog%20leaflet.pdf (accessed on 13 October 2021).
  29. Reeve, A.S.; Glaser, P.H.; Rosenberry, D.O. Seasonal changes in peatland surface elevation recorded at GPS stations in the Red Lake Peatlands, northern Minnesota, USA. J. Geophys. Res. Biogeosci. 2013, 118, 1616–1626. [Google Scholar] [CrossRef]
  30. Sloan, T.J.; Payne, R.J.; Anderson, A.R.; Gilbert, P.; Mauquoy, D.; Newton, A.J.; Andersen, R. Ground surface subsidence in an afforested peatland fifty years after drainage and planting. Mires Peat 2019, 23, 1–12. [Google Scholar] [CrossRef]
  31. Alshammari, L.; Large, D.; Boyd, D.; Sowter, A.; Anderson, R.; Andersen, R.; Marsh, S. Long-Term Peatland Condition Assessment via Surface Motion Monitoring Using the ISBAS DInSAR Technique over the Flow Country, Scotland. Remote Sens. 2018, 10, 1103. [Google Scholar] [CrossRef] [Green Version]
  32. Lindsay, R.; Charman, D.J.; Everingham, F.; O’Reilly, R.M.; Palmer, M.A.; Rowell, T.A.; Stroud, D.A. The Flow Country: The Peatlands of Caithness and Sutherland; Joint Nature Conservation Committee: Peterborough, UK, 1988.
  33. Avercamp, J.; Marshall, C.; Sterk, H.P.; Gilbert, P.; Andersen, R.; Marsh, S.; Large, D.J. Peat Characteristic Data from Blanket Peatland in the Flow Country, Caithness and Sutherland, 2018; (Dataset); NERC EDS Environmental Information Data Centre: Lancaster, UK, 2021. [Google Scholar] [CrossRef]
  34. Hancock, M.H.; England, B.; Cowie, N.R. Knockfin Heights: A High-Altitude Flow Country Peatland. Showing extensive erosion of uncertain origin. Mires Peat 2018, 23, 1–20. [Google Scholar] [CrossRef]
  35. Marshall, C.; Large, D.J.; Andersen, R.; Gilbert, P.; Sterk, H.P. Monthly Precise Levelling Data of Peat Surface Motion from Upland and Lowland Blanket Peatland in the Flow Country, Scotland, UK, 2017–2019; (Dataset); NERC Environmental Information Data Centre: Lancaster, UK, 2021. [Google Scholar] [CrossRef]
  36. Schuldt, B.; Buras, A.; Arend, M.; Vitasse, Y.; Beierkuhnlein, C.; Damm, A.; Gharun, M.; Grams, T.E.E.; Hauck, M.; Hajek, P.; et al. A first assessment of the impact of the extreme 2018 summer drought on Central European forests. Basic Appl. Ecol. 2020, 45, 86–103. [Google Scholar] [CrossRef]
  37. Marshall, C.; Large, D.J.; Andersen, R.; Bradley, A.W.; Sowter, A.; Gilbert, P.; Sterk, H.P.; Marsh, S. Interferometric Synthetic Aperture Radar Ground Motion and Timeseries Data over the Flow Country, Caithness and Sutherland, UK, March 2015–July 2019; (Dataset); NERC EDS Environmental Information Data Centre: Lancaster, UK, 2021. [Google Scholar] [CrossRef]
  38. Bateson, L.; Cigna, F.; Boon, D.; Sowter, A. The application of the Intermittent SBAS (ISBAS) InSAR method to the South Wales Coalfield, UK. Int. J. Appl. Earth Obs. Geoinf. 2015, 34, 249–257. [Google Scholar] [CrossRef] [Green Version]
  39. Cigna, F.; Sowter, A. The relationship between intermittent coherence and precision of ISBAS InSAR ground motion velocities: ERS-1/2 case studies in the UK. Remote Sens. Environ. 2017, 202, 177–198. [Google Scholar] [CrossRef]
  40. Gong, W.; Thiele, A.; Hinz, S.; Meyer, F.J.; Hooper, A.; Agram, P.S. Comparison of Small Baseline Interferometric SAR Processors for Estimating Ground Deformation. Remote Sens. 2016, 8, 330. [Google Scholar] [CrossRef] [Green Version]
  41. Osmanoğlu, B.; Sunar, F.; Wdowinski, S.; Cabral-Cano, E. Time series analysis of InSAR data: Methods and trends. ISPRS J. Photogramm. Remote Sens. 2016, 115, 90–102. [Google Scholar] [CrossRef]
  42. Sowter, A.; Bin Che Amat, M.; Cigna, F.; Marsh, S.; Athab, A.; Alshammari, L. Mexico City land subsidence in 2014–2015 with Sentinel-1 IW TOPS: Results using the Intermittent SBAS (ISBAS) technique. Int. J. Appl. Earth Obs. Geoinf. 2016, 52, 230–242. [Google Scholar] [CrossRef]
  43. Chen, C.W.; Zebker, H.A. Two-dimensional phase unwrapping with use of statistical models for cost functions in nonlinear optimization. J. Opt. Soc. Am. A 2001, 18, 338–351. [Google Scholar] [CrossRef] [PubMed] [Green Version]
  44. Payne, R.J.; Ratcliffe, J.; Andersen, R.; Flitcroft, C.E. A meta-database of peatland palaeoecology in Great Britain. Palaeogeogr. Palaeoclimatol. Palaeoecol. 2016, 457, 389–395. [Google Scholar] [CrossRef] [Green Version]
  45. Sloan, T.J. Quantifying Carbon Accumulation and Loss in Afforested Peatlands; University of York: York, UK, 2019. [Google Scholar]
  46. Morrison, K. Mapping Subsurface Archaeology with SAR. Archaeol. Prospect. 2013, 20, 149–160. [Google Scholar] [CrossRef]
  47. Zhou, Z.; Li, Z.; Waldron, S.; Tanaka, A. Monitoring peat subsidence and carbon emission in Indonesia peatlands using InSAR time series. In Proceedings of the 2016 IEEE International Geoscience and Remote Sensing Symposium (IGARSS), Beijing, China, 10–15 July 2016; pp. 6797–6798. [Google Scholar]
  48. Marshall, C.; Large, D.J.; Athab, A.; Evers, S.L.; Sowter, A.; Marsh, S.; Sjögersten, S. Monitoring tropical peat related settlement using ISBAS InSAR, Kuala Lumpur International Airport (KLIA). Eng. Geol. 2018, 244, 57–65. [Google Scholar] [CrossRef]
Figure 1. Detailed map of focus areas at Knockfin Heights and Munsary including benchmark locations. (Bottom Left and Right) Overview map of the Flow Country (Top Right) Site Layout (Top Left) Schematic Diagram of the microtopographic classification used after Lindsay 1988.
Remotesensing 14 00336 g001
Figure 2. Precise Leveling Measurements of mean motion of benchmarks at each subsite at the (A) Low-lying Munsary Site (B) upland Knockfin Heights Site and (C) a comparison of the mean motion of different meso-scale units within the upland and low-lying sites including whole site mean. Details of individual benchmark motion can be seen in Figure A1 and Figure A2 (Data available at [35]).
Remotesensing 14 00336 g002
Figure 3. Precise Leveling Measurements of mean motion of benchmarks within different microtopographies at (A) upland (B) Low-lying margin (C) Low-lying medium pool (D) and low-lying large pool sites.
Remotesensing 14 00336 g003
Figure 4. Comparison of APSIS InSAR derived and ground precise leveling (subsite mean) peatland surface motion data at the Low-lying Munsary Site. Graphs with dashed vertical line indicate a reset of datum in the InSAR data due to issues with ambiguity affecting phase unwrapping during the peak drought period. Details of datum dates for each site can be seen in Section 2 (Table 1).
Remotesensing 14 00336 g004
Figure 5. Comparison of APSIS InSAR derived and ground precise leveling (subsite mean) peatland surface motion data at the Upland Knockfin Heights Site. Details of datum dates for each site can be seen in Section 2.
Remotesensing 14 00336 g005
Figure 6. Min/Max Normalized comparison of APSIS InSAR and mean subsite ground precise leveling data at subsites M-A, M-C, M-E and M-F which underestimated motion during the 2018 drought event showing good agreement post normalization. Site M-A required a reset of datum to allow comparison as indicated by the dashed vertical line.
Remotesensing 14 00336 g006
Table 1. Ground Datums used for comparison of InSAR and Ground measurements at each subsite (APSIS InSAR dates ±3 days of datum).
SiteDatum Date
M-A Pre14 May 2018
M-A Post26 February 2018
M-B14 May 2018
M-C14 May 2018
M-D14 May 2018
M-E Pre15 March 2018
M-E Post26 February 2018
M-F Pre10 April 2018
M-F Post26 February 2018
M-G14 May 2018
KH-A15 May 2018
KH-B3 September 2017
KH-C3 September 2017
KH-D3 September 2017
KH-E3 September 2017
KH-F3 September 2017
KH-G3 September 2017
Table 2. Mean peatland surface motion pre and post drought from APSIS InSAR and Ground measurements derived from linear regression of timeseries (Pre Drought Period = 4 August 2017 to 15 May 2018; Post Drought Period (10 June 2018–20 February 2019).
Low-Lying
Munsary Site
M-AM-BM-CM-DM-EM-FM-GMean
InSAR
(m/yr)
−0.001−0.0026−0.0062−0.0058−0.0044−0.0058−0.0026−0.004
Ground
(m/yr)
−0.030−0.0066−0.0219−0.0077−0.0329−0.0475−0.0066−0.022
Diff.
(m/yr)
0.02890.00400.01570.00180.02850.04160.00400.018
Pre drought InSAR
(m/yr)
0.002−0.0004−0.0007−0.0026−0.0011−0.0022−0.007−0.002
Pre-drought Ground
(m/yr)
0.002−0.00580.007−0.0015−0.0066−0.0110−0.005−0.003
Pre-drought Diff
(m/yr)
−0.0000.0055−0.0073−0.00110.00550.0088−0.00180.0013
Upland Knockfin
Heights Site
KH-AKH-BKH-CKH-DKH-EKH-FKH-GMean
InSAR
(m/yr)
−0.003−0.0012−0.0001−0.0017−0.0012−0.0024−0.0031−0.002
Ground
(m/yr)
−0.006−0.0024−0.0034−0.0018−0.0037−0.0054−0.0033−0.004
Diff.
(m/yr)
0.00250.00120.00320.00000.00250.00300.00020.002
Publisher’s Note: MDPI stays neutral with regard to jurisdictional claims in published maps and institutional affiliations.

