Article

Object-Based High-Rise Building Detection Using Morphological Building Index and Digital Map

1
Department of Convergence and Fusion System Engineering, Kyungpook National University, Sangju 37224, Korea
2
Department of Spatial Information, Kyungpook National University, Daegu 41566, Korea
*
Author to whom correspondence should be addressed.
Remote Sens. 2022, 14(2), 330; https://doi.org/10.3390/rs14020330
Submission received: 25 November 2021 / Revised: 5 January 2022 / Accepted: 6 January 2022 / Published: 11 January 2022
(This article belongs to the Special Issue Optical Remote Sensing Applications in Urban Areas II)

Abstract

:
High-rise buildings (HRBs) as modern and visually unique land use continue to increase due to urbanization. Therefore, large-scale monitoring of HRB is very important for urban planning and environmental protection. This paper performed object-based HRB detection using high-resolution satellite image and digital map. Three study areas were acquired from KOMPSAT-3A, KOMPSAT-3, and WorldView-3, and object-based HRB detection was performed using the direction according to relief displacement by satellite image. Object-based multiresolution segmentation images were generated, focusing on HRB in each satellite image, and then combined with pixel-based building detection results obtained from MBI through majority voting to derive object-based building detection results. After that, to remove objects misdetected by HRB, the direction between HRB in the polygon layer of the digital map HRB and the HRB in the object-based building detection result was calculated. It was confirmed that the direction between the two calculated using the centroid coordinates of each building object converged with the azimuth angle of the satellite image, and results outside the error range were removed from the object-based HRB results. The HRBs in satellite images were defined as reference data, and the performance of the results obtained through the proposed method was analyzed. In addition, to evaluate the efficiency of the proposed technique, it was confirmed that the proposed method provides relatively good performance compared to the results of object-based HRB detection using shadows.

1. Introduction

Due to urbanization, approximately 55% of the world’s total population currently lives in cities, and this proportion is estimated to reach 66% by 2050 [1]. The increase in population due to urbanization naturally resulted in an increase in buildings in cities, which leads to a decrease in vegetation areas in cities and an increase in impervious surfaces [2]. In particular, high-rise buildings (HRBs), which primarily serve as luxury commercial centers and residential apartments, continue to increase, as they have clear advantages in improving resource and energy efficiency [3]. Because these rapid land changes change major ecological ramifications that have not yet been studied, timely and accurate analysis of urban development status and trends through the detection of HRB in urban areas is very important when developing sustainable development strategies and improving urban residential environments and quality of life [4,5].
Various previous studies have proven that remote sensing is an efficient method of monitoring urban dynamics on various temporal and spatial scales [6,7]. Building and urban analysis through remote sensing have traditionally focused on simple land covers, such as classifications between impervious surfaces (artificial structures) and vegetation areas [8]. Alternatively, analyses have been performed using a pixel and object-based method that includes both spectral and spatial information from high-resolution images [9,10]. However, buildings in urban areas have always faced challenges in terms of accuracy and efficiency due to building diversity and complexity. Various types of buildings on the ground surface may result in inaccurate detection results due to their irregular shapes. For example, due to high building density, different buildings may be detected as one building, or detection errors may occur due to shadows or roads near the buildings [11,12,13]. All of these problems are due to the heterogeneity of the spectral information present within objects of the same class, as well as the complexity of spatial information [12]. Although the recent development of low-orbit satellites has made it easier to acquire high-resolution images with hyperspectral characteristics, this improvement does not necessarily mean that high-resolution images produce high-quality analysis results [14].
In this context, it is necessary to continue to develop a method for automatically or semi-automatically detecting buildings in high-resolution images. Building detection in high-resolution image that has been conducted over the past decades can be largely divided into different methods based on whether auxiliary data are used or not. The first category detects buildings using only remote sensing images acquired from drones or satellites. Reference [15] detected buildings using various knowledge-based object extraction methods, and [16] discussed building reconstruction from a data perspective. Alternatively, methods such as morphological profiles [17,18,19], gray-level simultaneous occurrence matrixes [20], and wavelet textures [21] use a building’s spatial characteristics. In the second category, data sources, such as LiDAR, the digital surface model (DSM), and synthetic aperture radar (SAR), are used as auxiliary data when detecting buildings. To classify land and buildings, the morphological analysis of terrain was studied using optical images and LiDAR data [22], or buildings were automatically extracted using LiDAR data fusion of dot and grid-based features [23]. Furthermore, DSM was generated using multitemporal LiDAR data [24] and building detection and change detection were performed using SAR images [25,26].
Despite the preceding studies of various methods of building detection, additional studies on HRBs are far behind those of other urban characteristics, and detection is more difficult because building positions vary due to relief displacement [27]. This geometric difference between relief displacement and nadir angle is sensitive and difficult to apply when applying not only building detection but also many unsupervised change detection techniques, because even the same building recognizes the building as different buildings [28]. In this way, buildings with relief displacement in urban monitoring, such as change detection, act as an obstacle to accurate analysis. For accurate urban analysis, HRBs with relief displacement should be classified through separate processes, and even though they are the same buildings, it is necessary to detect building objects detected as different objects due to different relief displacement directions. Recently, deep learning based on artificial neural networks has been implemented, and various studies have been conducted to extract buildings from satellite images, thermal infrared images, and LiDAR data and recognize 3D building models [29]. Deep learning may be effective in detecting and restoring buildings using LiDAR data or thermal infrared images, but most of the analysis of images containing buildings with relief displacement uses fusion images or cross-sharpening [30,31]. Furthermore, HRB detection is a key study area, as studies show that small and complex HRB geometries can lead to increased spread of infectious diseases [32,33]. Therefore, this study attempted to propose a method of preferentially detecting HRBs with severe relief displacement.
Therefore, in this study, object-based HRB detection was performed in high-resolution image using morphological building index (MBI) that can automatically represent the existence of buildings without training data or supervision in high-resolution images and digital map. In the context of large-scale HRB monitoring, there is no international definition of an HRB, so in this study, HRB were defined in accordance with Article 2 (1) 19 of the Building Act of the Republic of Korea. In the “Section 2”, the order of the proposed method, the explanation of the digital maps used as auxiliary data for detecting HRBs, and the choice of study area are described. In the “Section 3”, the results from previous studies are compared to evaluate the accuracy of the proposed method. In addition, significance and implications of this study are described, and the thesis is completed with the last chapter, “Section 4”.

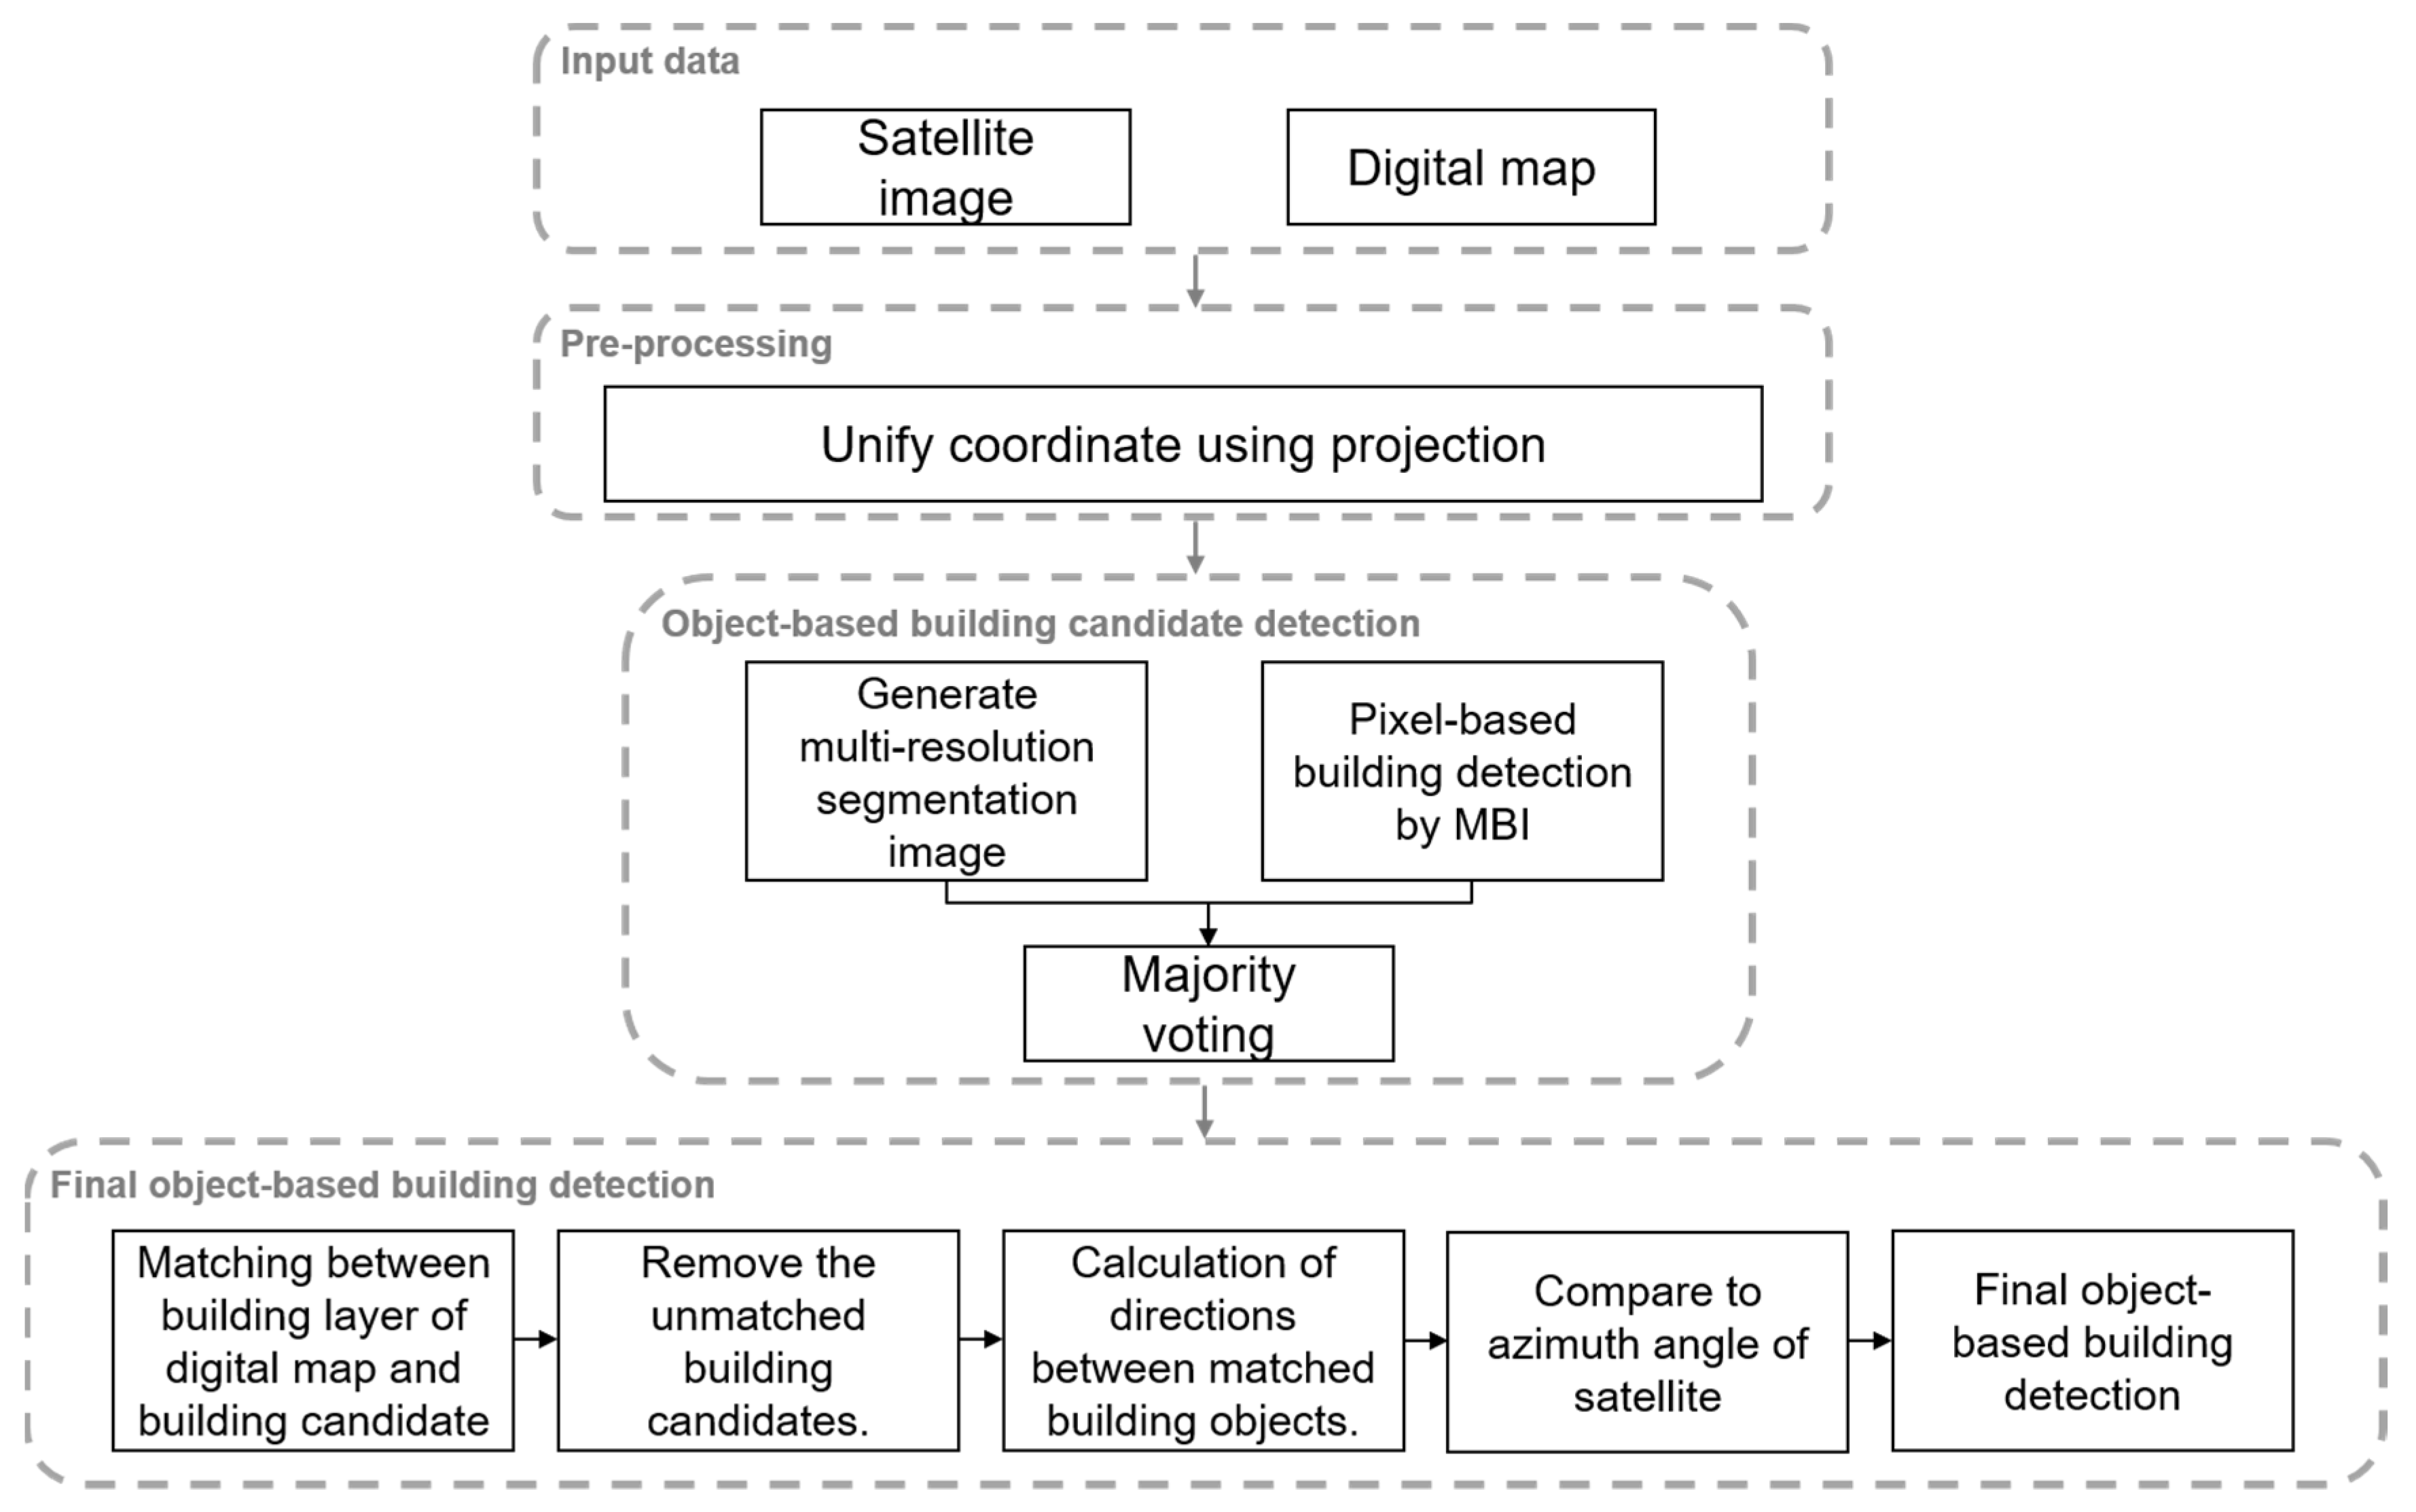
2. Methods and Materials

In this study, object-based HRB detection was performed. For the study, satellite imagery was acquired using high-resolution satellite imagery and digital maps depicting the study area. Prior to conducting the study, the coordinates between the satellite images and digital maps were unified using a preprocessing process. The satellite imagery used in the study were acquired through KOMPSAT-3A, KOMPSAT-3, and WorldView-3, respectively, all of which follow the WGS84 coordinate system. On the other hand, the digital maps used a GRS80 coordinate system. To unify the coordinates between the two, the satellite images were coordinated and projected onto the coordinates of the digital map. After that, for the primary building detection, the MBI, which can automatically represent buildings in high-resolution satellite images, was calculated and divided into building pixels and non-building pixels using the Otsu threshold [34]. At the same time, to detect object-based HRBs, an object-based segmentation image was created using a multiresolution segmentation technique on the high-resolution satellite imagery. Thereafter, majority voting was used to expand the pixel-based building detection result from MBI to an object-based building detection result. For the object-based building detection result generated in this way, a digital map was used to remove misdetected objects (e.g., road, shadow etc.) and low-rise building (LRB) objects. During this process, the centroid coordinates of detected HRBs in the satellite image and digital map were extracted and the direction between the two was calculated; then, the final object-based HRB detection result was derived by comparing it to the satellite’s azimuth angle when the satellite image was taken. After detecting the same HRB in the digital map and satellite images, if the two buildings were the same building, the direction between the two converged with the direction of undulating displacement by the satellite’s azimuth angle, otherwise removed from the detection results (Figure 1).

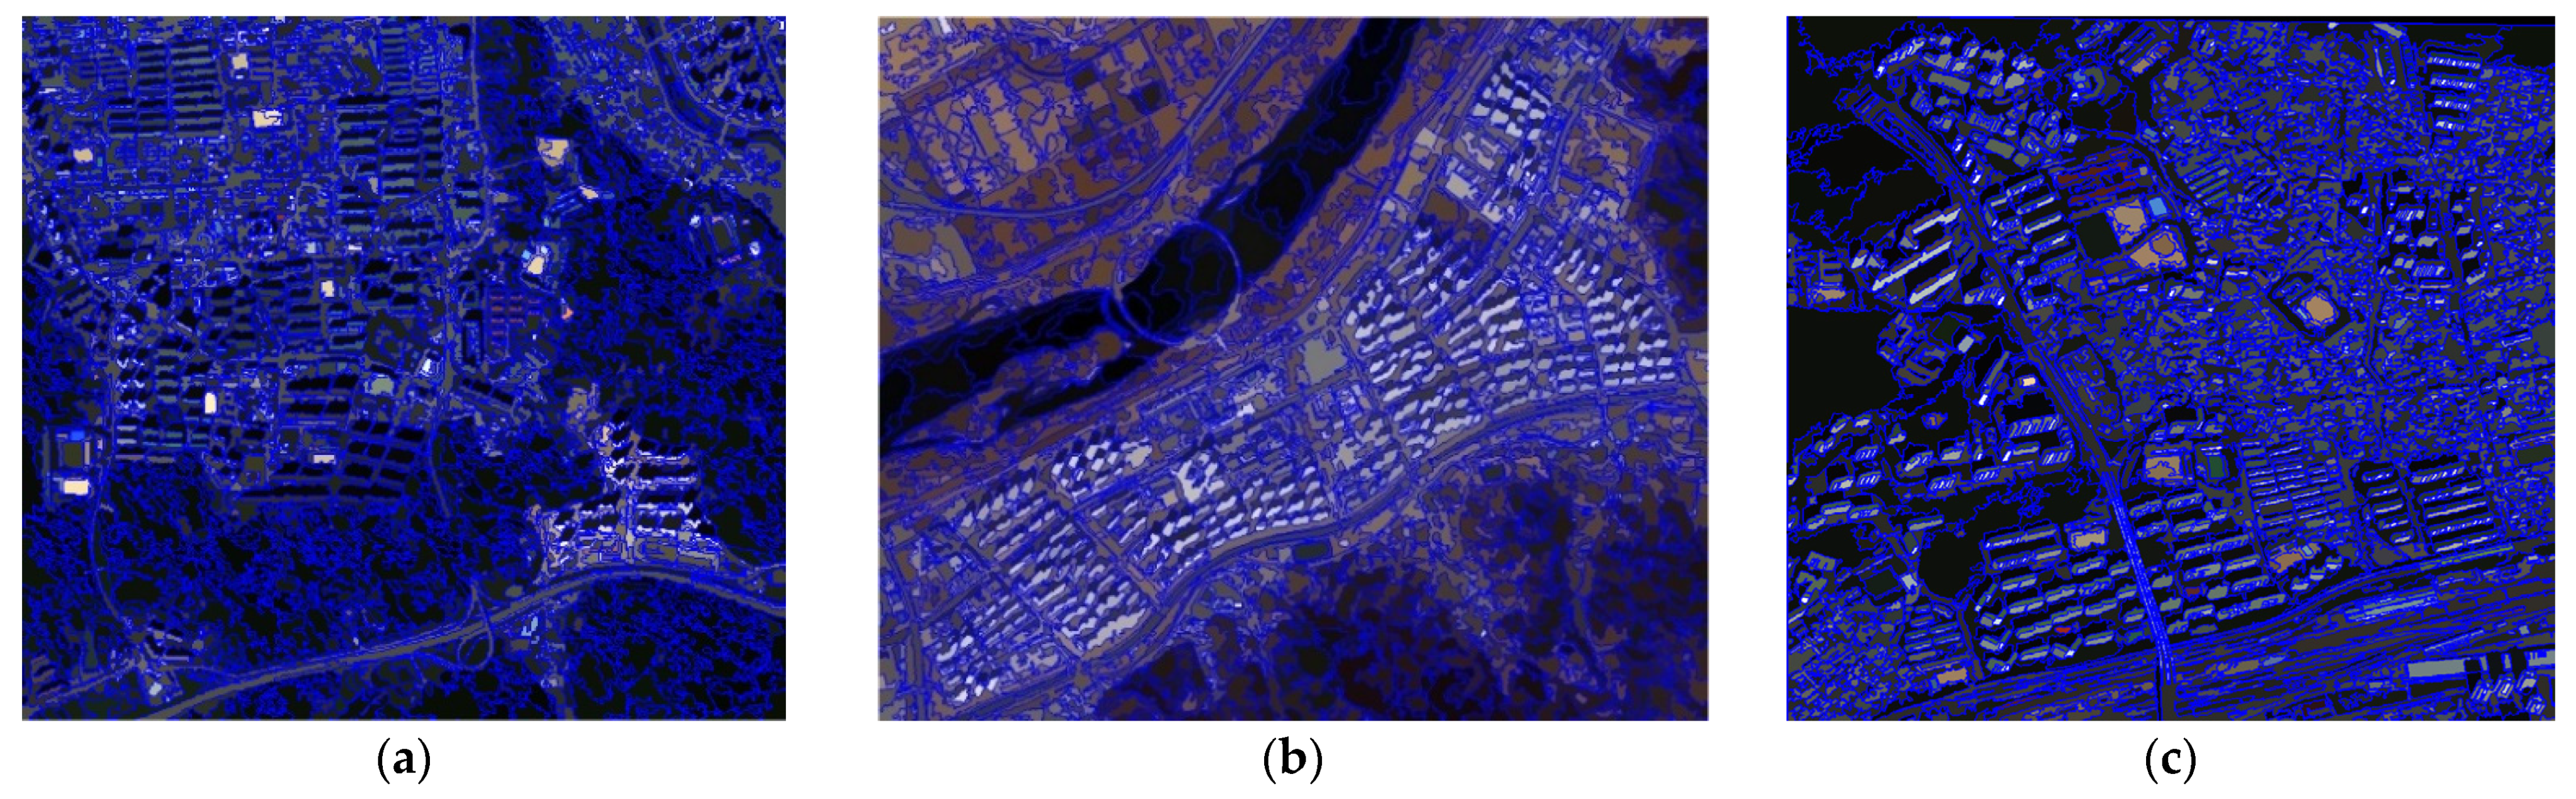
2.1. Multiresolution Segmentation

When analyzing high-resolution imagery, pixel-based analysis causes salt and pepper noise and has the disadvantage of not being able to utilize feature information, which is an advantage of object-based analysis [35,36]. Therefore, in this study, multiresolution segmentation was used to effectively detect object-based HRBs using high-resolution imagery. This process generates a divided image by considering not only the spatial resolution but also the spectral resolution when creating an object. The most fundamental process of multiresolution segmentation grows pixel-sized small image objects into highly correlated adjacent pixels and uses a bottom-up strategy that selects arbitrary pixels that are best suited for potential mergers; this process is then repeated until all of the pixels in an image are grouped into highly related objects. During this process, three parameters are used, the first of which is the scale parameter. Scale parameters are parameters that affect an object’s size when performing multiresolution segmentation; the object is divided into larger objects as the scale parameter increases. The second parameter includes both shape and color, which are inversely proportional to each other, and their sum is 1. The larger the shape parameter, the greater the influence of the object’s shape on the generation of the segmentation image, and the larger the color parameter, the greater the influence of the spectral characteristics on the generation of the segmentation image. Finally, the compactness/smoothness parameter is a parameter that describes the object’s shape, and it is inversely proportional to the shape/color parameter. The compactness/smoothness parameter is affected by the shape parameter, and if both the shape and compactness parameters are high, the shape parameter greatly affects the division result and forms a dense object. The optimal parameter for generating a segmentation image depends on the characteristics of the sensor, the purpose of data analysis, and the characteristics of the object of interest [37].

2.2. Object-Based High-Rise Building Candidate Detection Using the Morphological Building Index

2.2.1. Morphological Building Index

The basic idea of MBI is to establish a relationship between a building’s spectral structural characteristics (brightness, size, and contrast) and the top-hat transformation (THT), granularity, and directivity [38]. The primary advantage of MBI is that it can be implemented without a training sample for buildings on the ground surface because it is an unsupervised building index [39,40]. In this study, the MBI introduced in [39] was used. The first step for generating an MBI is calculating the brightness value. The maximum value of the multispectral band for pixel x is calculated as a brightness value, which is calculated by Equation (1) using only visible bands to omit the multispectral band used in the MBI calculations.
b ( x ) = max 1 k K ( M k ( x ) )
where M k ( x ) represents the spectral value of pixel x in the k th spectral band and K represents the number of multispectral bands.
The second step is MBI construction. The spectral structural characteristics of the building are expressed using the differential morphological profiles (DMP) of the top-hat, which are reconstructed using a series of linear structural elements. The morphological operators used in the MBI configuration are as follows:
White top-hat (W − TH) by reconstruction (Equation (2)):
W TH ( d ,   s ) = b γ b re ( d ,   s )
where γ b re is the opening-by-reconstruction of the brightness image ( b ), and   s and d represent the length and direction of the linear structural elements. A difficult task when constructing a building index is to automatically filter out roads with spectral reflectance values that are very similar to buildings. While buildings are more isotropic, roads are always elongated in one or two directions. Therefore, the MBI is implemented using a series of linear structural elements that can measure a structure’s size and direction [41].
Morphological profiles (MP): The MP of the W − TH is defined by Equation (3):
{ MP W TH ( d ,   s ) = W TH ( d ,   s ) MP W TH ( d ,   0 ) = b .
DMP: The relatively high reflectance of roofs and their spatially adjacent shadows result in high local building terrain. The DMP [17] of a white top-hat is used to indicate the local contrast of a bright structure. The DMP of the W-TH is defined by Equation (4):
DMP W TH ( d ,   s ) = | MP W TH ( d , ( s + s ) ) MP W TH ( d , s ) |
where s is the interval between the profiles and s min s s max . The sizes of the structural elements ( s ,   s min   and   s max ) should be determined according to the spatial resolution of the image and the building’s spatial characteristics.
As a final step, the MBI is defined as the DMP average of the W-TH (Equation (5)).
MBI = d ,   s DMP W TH ( d ,   s ) D × S
It is calculated by dividing the sum of DMP W TH ( d ,   s ) by the product of direction ( D ) and scale ( S ). In this study, four directions ( D = 4 ) were considered to increase the accuracy of building detection with undulating displacement [39].
The number of scales is calculated as follows (Equation (6)):
S = ( ( s max   s min ) / s ) + 1 .
The construction of the MBI is based on the fact that building structures have larger values in most directions of the DMP W TH histogram because they exhibit high local contrast in these directions. As a result, buildings often exhibit large MBI values.
Afterwards, the threshold is calculated using the Otsu threshold. Based on this threshold, when the MBI value of each pixel is above the threshold value, it is detected as a building, and the pixel-based building detection result is derived.

2.2.2. Majority Voting

Majority voting was used to expand the pixel-based building detection result obtained by the previously generated MBI to the object-based building detection result using the segmentation image. The leftmost figure in Figure 2 is a building detection image generated based on the Otsu threshold in the MBI, where 1 is a pixel classified as a building, and 0 is a non-building pixel. This binary image is overlaid with the multiresolution segmentation image, which is the middle in Figure 2. The multiresolution segmentation image has a value based on an object (blue line), not a pixel value (black line). As shown in the rightmost figure of Figure 2, which is the result of majority voting, if the building pixel of an object in the segment image is more than half of the object area, the object is judged as a building object. Otherwise, the object is judged as a non-building object.

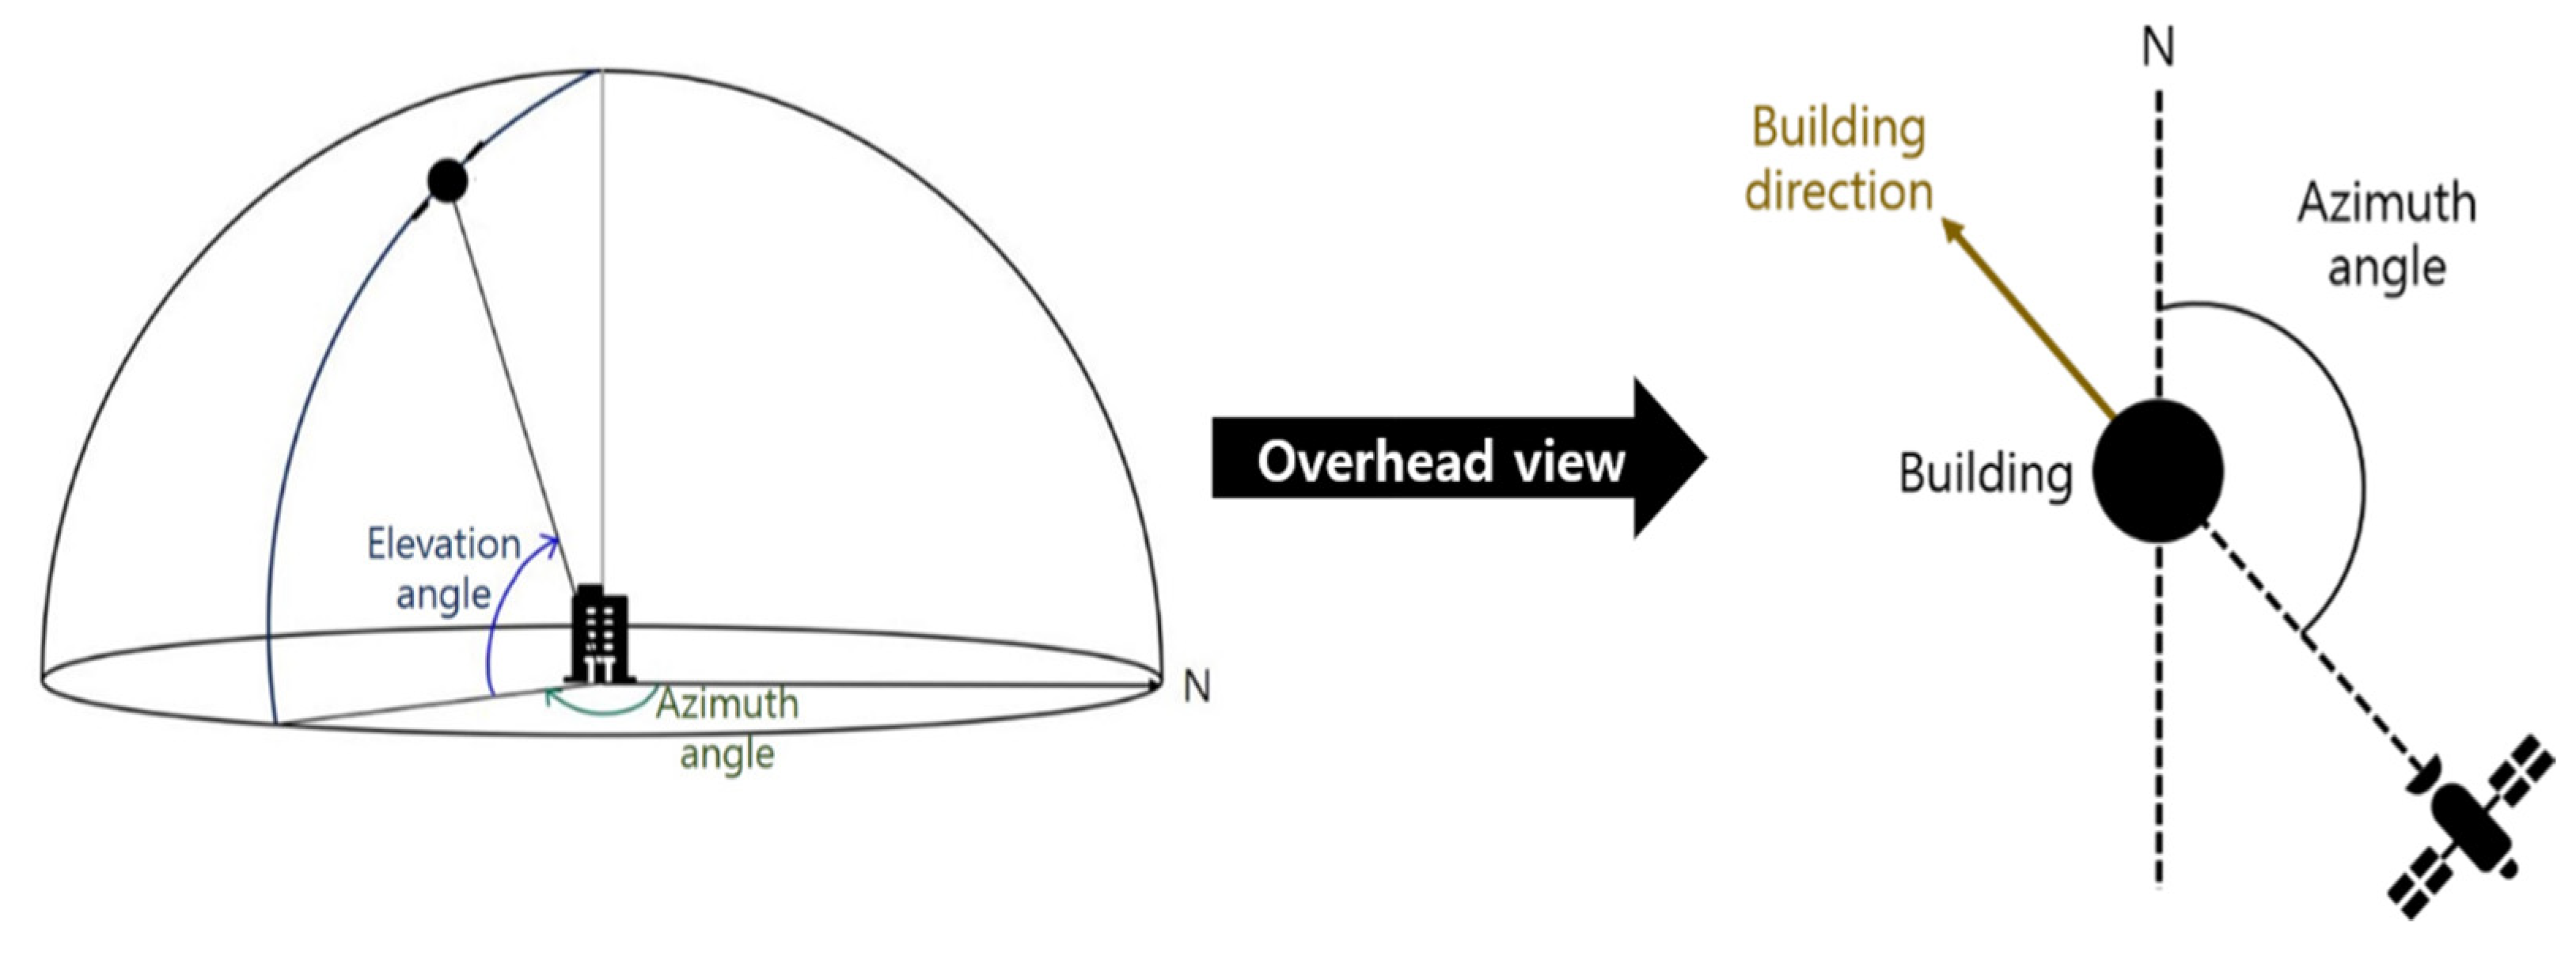
2.3. Final Object-Based High-Rise Building Detection Using Digital Maps

This section describes the process used to detect only HRBs in the MBI-based object-based building detection results. Today’s satellites provide metadata regarding the sun’s azimuth and elevation angles as well as the azimuth and elevation angles of the sensor when images are taken. In this study, this data was used to detect HRBs. As shown in Figure 3, the direction of a building’s relief displacement occurs on the opposite side of the sensor azimuth angle of the satellite image depicting the study area (Equation (7)).
Relief   displacement   direction = { a z i m u t h   a n g l e   o f   s e n s o r + 180 ° ,   i f   a z i m u t h   a n g l e 180 ° a z i m u t h   a n g l e   o f   s e n s o r 180 ° ,   i f   a n z i m u t h   a n g l e > 180 °
HRBs form an inclined shape in the direction calculated in Equation (7). On the other hand, HRBs in digital maps are depicted as overhead views as in orthophoto images. Using this information, if a building exists in the relief displacement direction of an HRB object in a satellite image from the HRB object on a digital map, the two were considered to depict the same building.
Then, for two building objects, the centroid coordinate value of the building in the satellite images ( X b 1 ,   Y b 1 ) and the centroid coordinate value of the building in the digital maps ( X b 2 ,   Y b 2 ) were calculated, and the direction ( θ ) between the two coordinates was calculated as shown in Equation (8).
θ = tan 1 ( | Y b 2 Y b 1 | | X b 2 X b 1 | )
In the digital map and satellite images, the relationship between the same buildings forms is as shown in Figure 4, and the directions between the two converge on the direction of the buildings’ relief displacement are as calculated using Equation (7) [42]. Using these properties, only HRBs were detected in the study area.

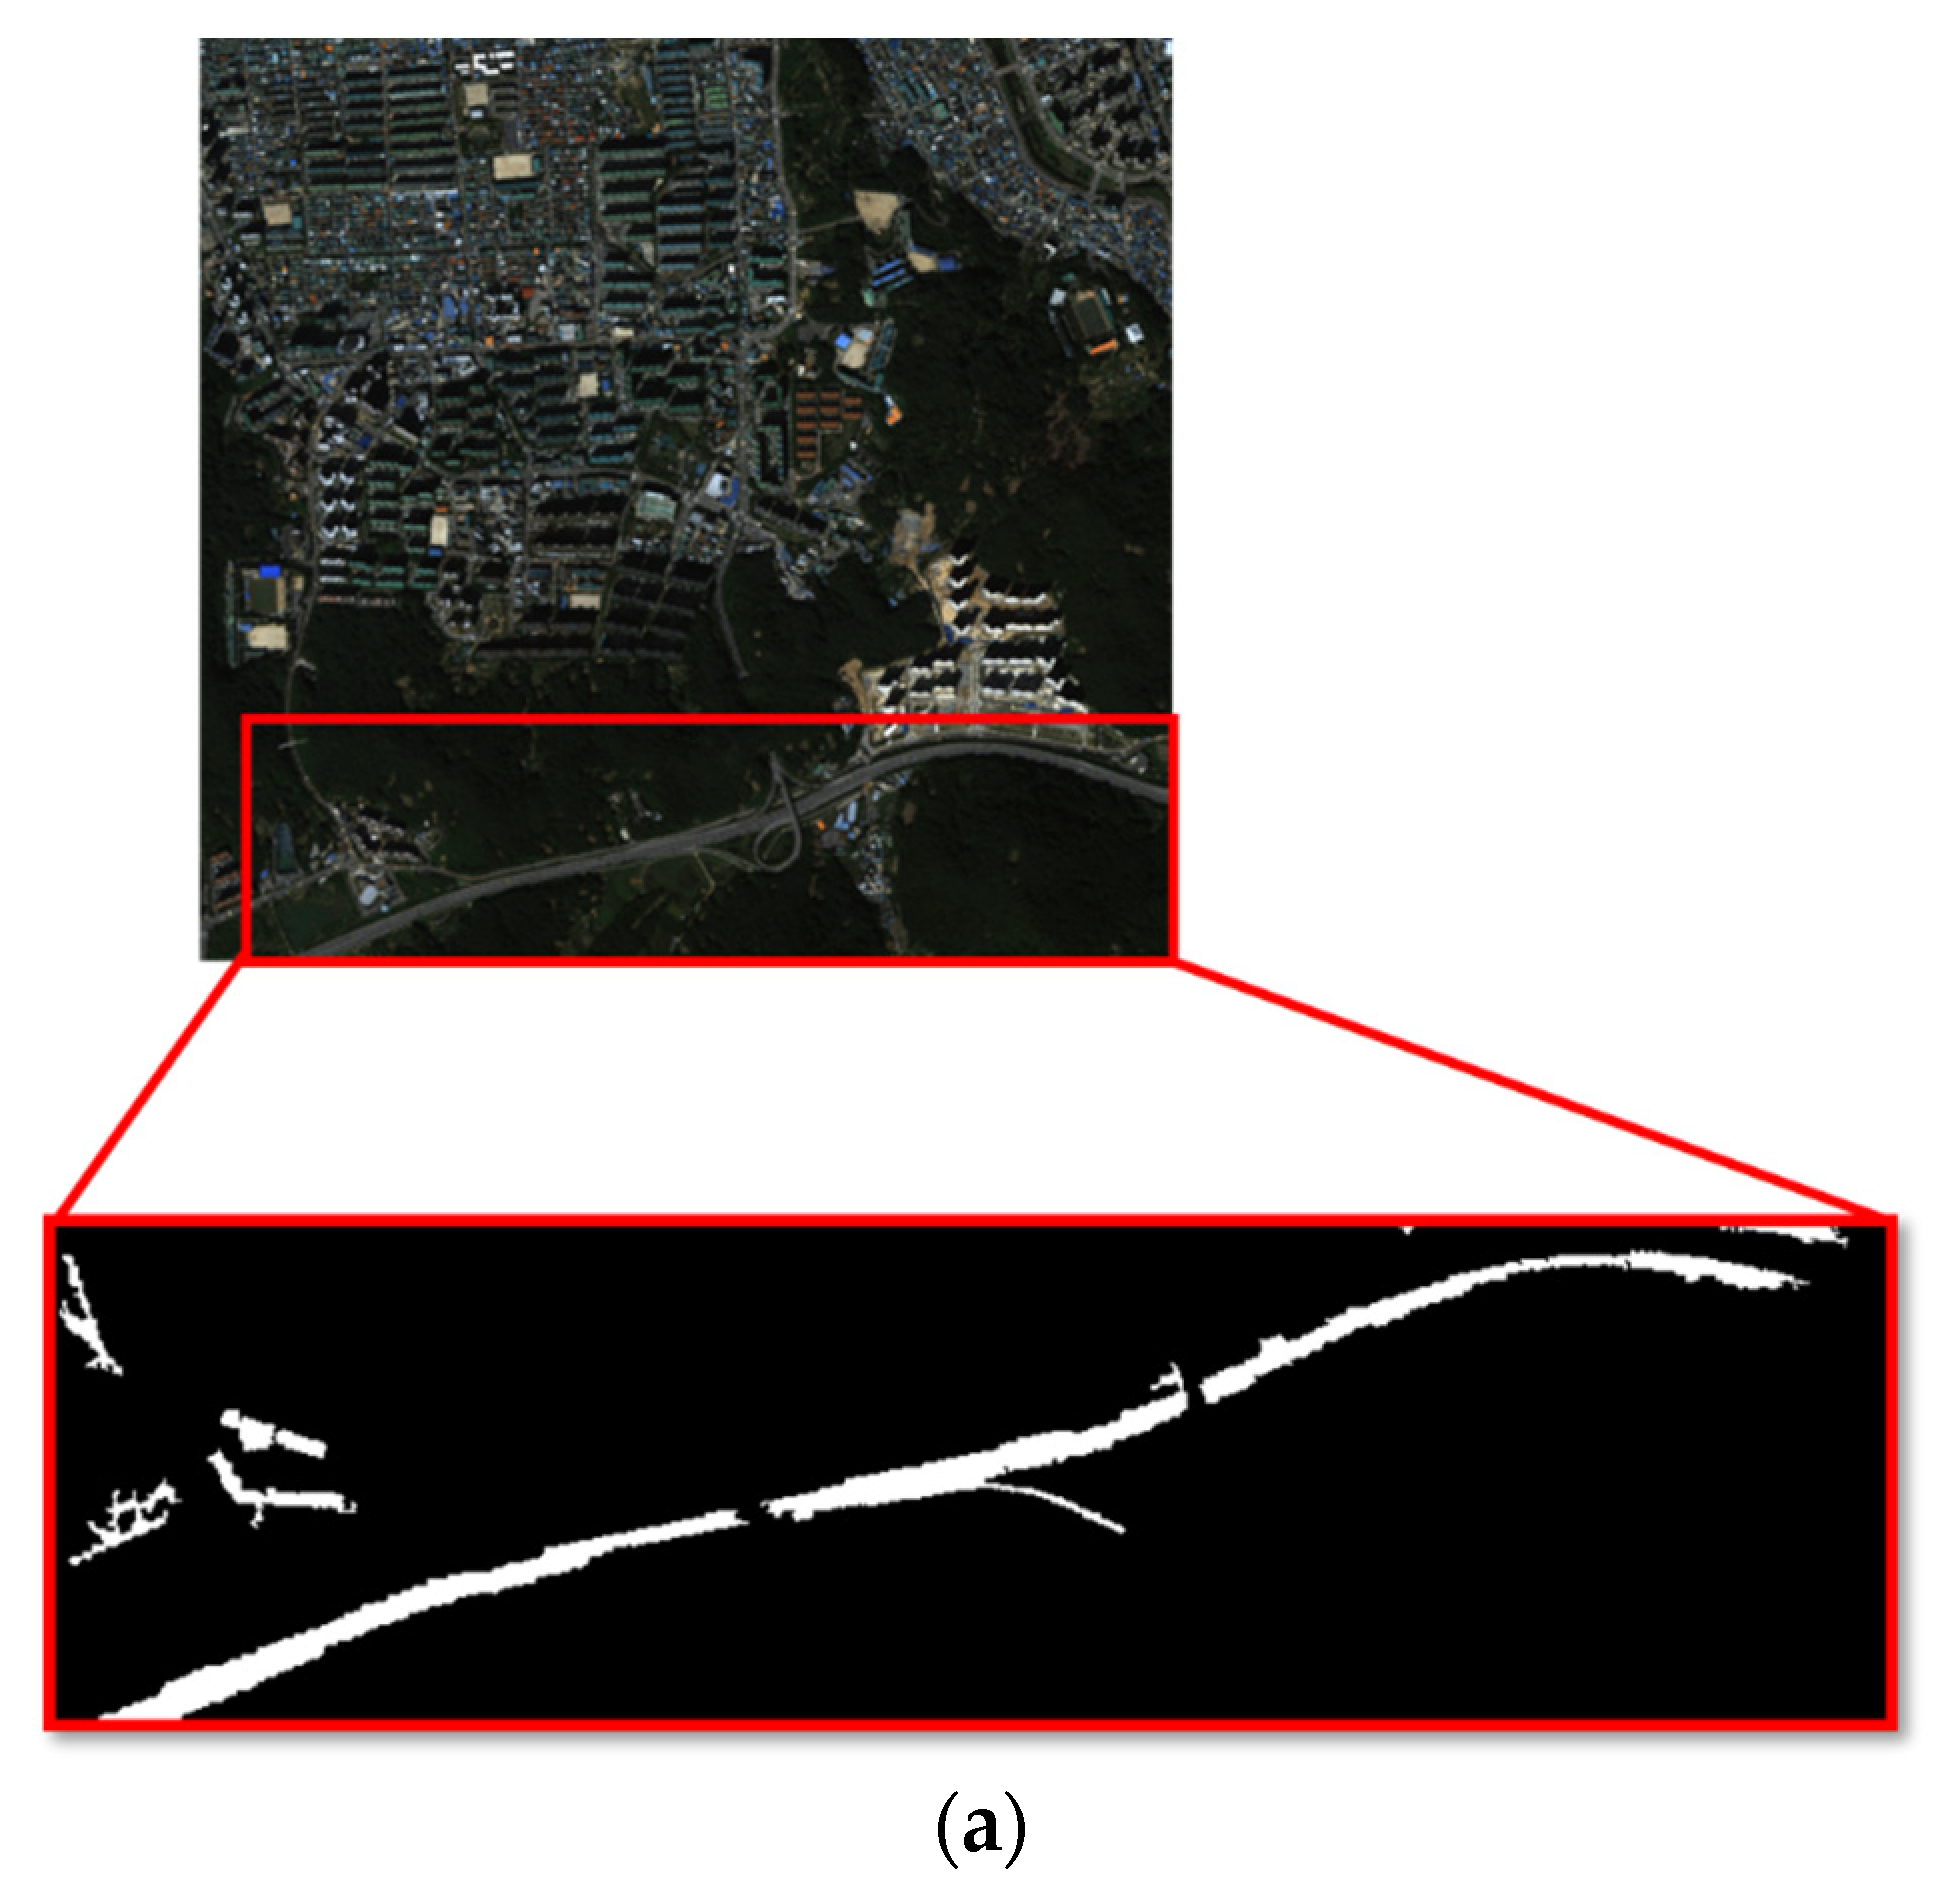
2.4. Research Area and Data

In this study, an object-based HRB detection method for high-resolution satellite images using digital maps is proposed. Areas with different coverage characteristics were selected as the study areas to confirm the effectiveness of the proposed method when addressing various building positions and environments around the building. All of the regions were different and were acquired from different satellites.
Site 1, the first study area, was acquired using the KOMPSAT-3A satellite and is in Gwangju, Korea, where LRBs and HRBs are concentrated. This satellite image is characterized by a mixture of small alleys, roads, and shadows, as well as buildings of various sizes and shapes, making it somewhat difficult to visually identify HRBs (Figure 5a).
The second study area is in Sejong, Korea and was acquired using KOMPSAT-3 (Site 2). Unlike Site 1, most artificial structures located on the ground are HRBs, and they contrast clearly with objects such as rivers, rice paddies, and mountains.
Site 3, the last study area, was acquired using the WorldView-3 satellite and is in Busan, South Korea. Similar to Site 1, HRBs and LRBs are located together, but due to the resolution of the satellite sensor and the area’s topographical characteristics, it is easier to visually identify LRBs and HRBs in the images compared to Site 1.
In the study, blue, green, red, and near-infrared bands from the satellite images and metadata (e.g., the azimuth angle of the satellite and the sun) were used (Table 1). In addition, a digital map was used as auxiliary data when detecting HRBs. This digital map uses a computer system to construct a digital representation of various geospatial information such as the location of the surface, underground, underwater, and space, as well as the topography, geographical features, and geographical names. The digital map of Korea was produced and managed by the National Geographic Information Service under the Ministry of Land, Infrastructure and Transport. The 1:5000 scale digital map used in this study is renewed every two years, and in the case of large buildings or roads, it is modified every two weeks. In the building polygon layer provided by the digital map, only HRBs according to the Korean Building Act (i.e., the architecture with more than 30 floors or more than 120 m high) were classified and used in this study. The HRBs defined in the digital map were overlaid with red polygons on the satellite images and expressed visually (Figure 5).

3. Results and Discussion

3.1. Evaluation Criteria
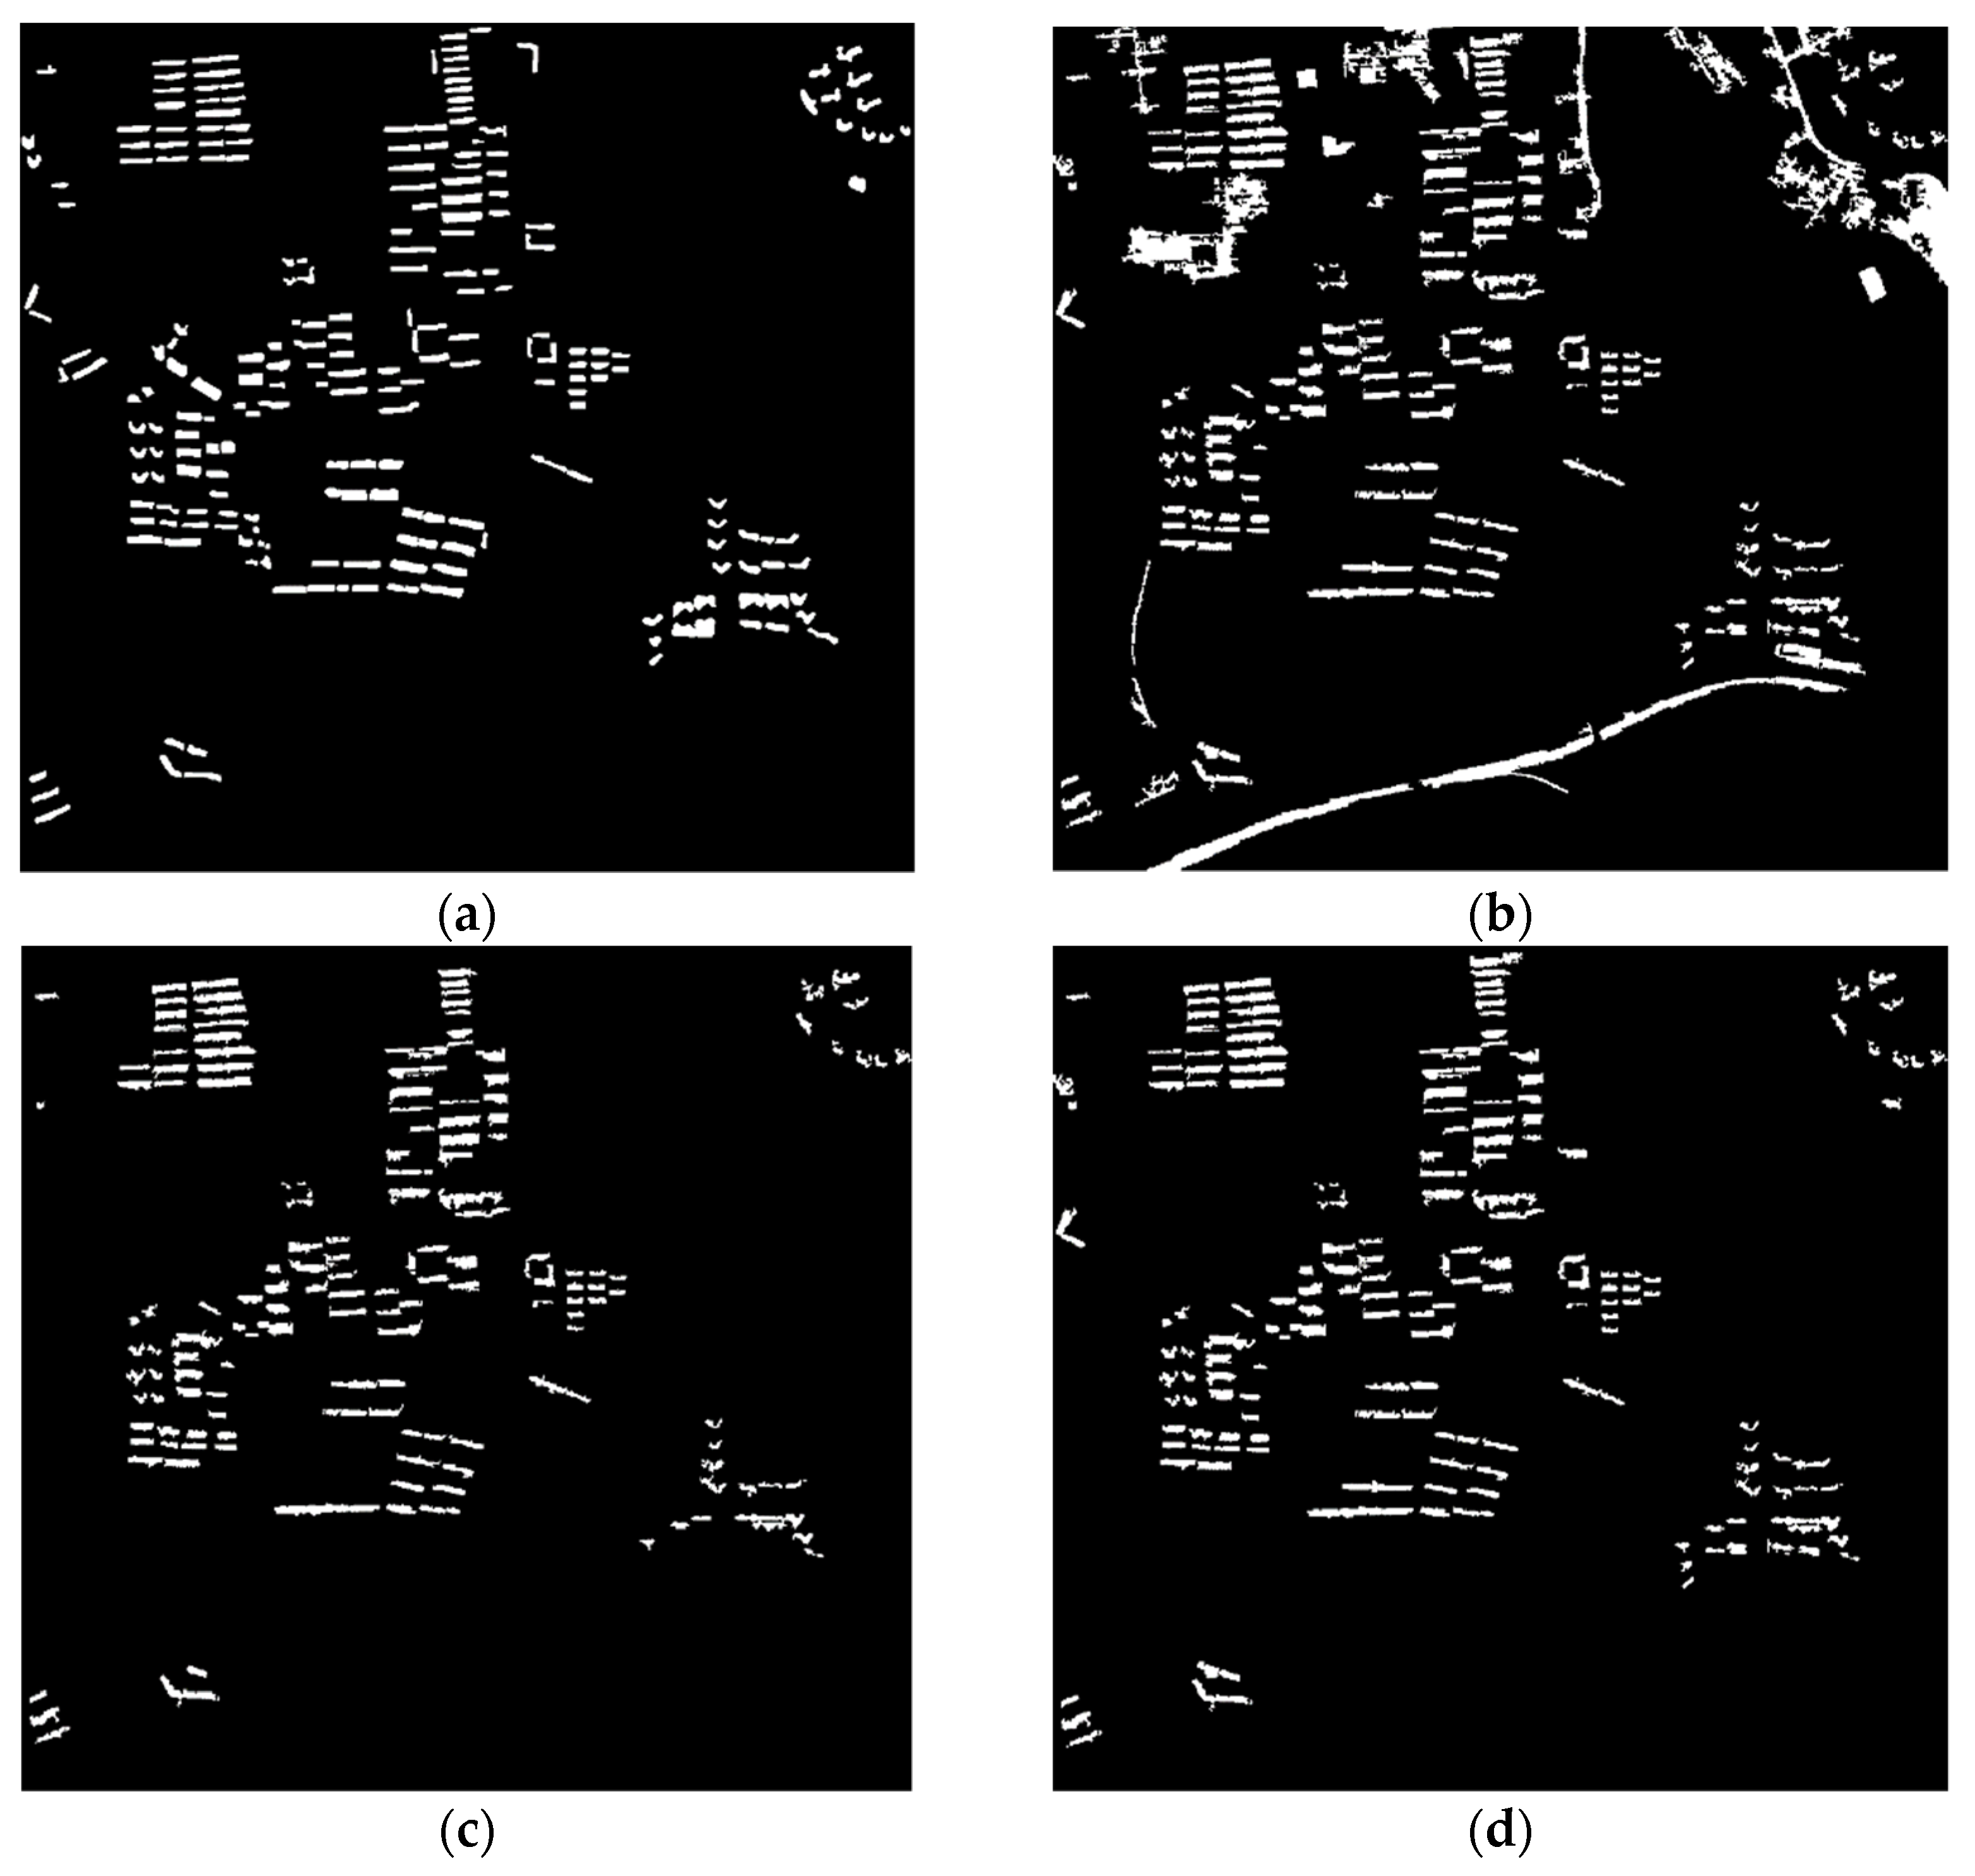
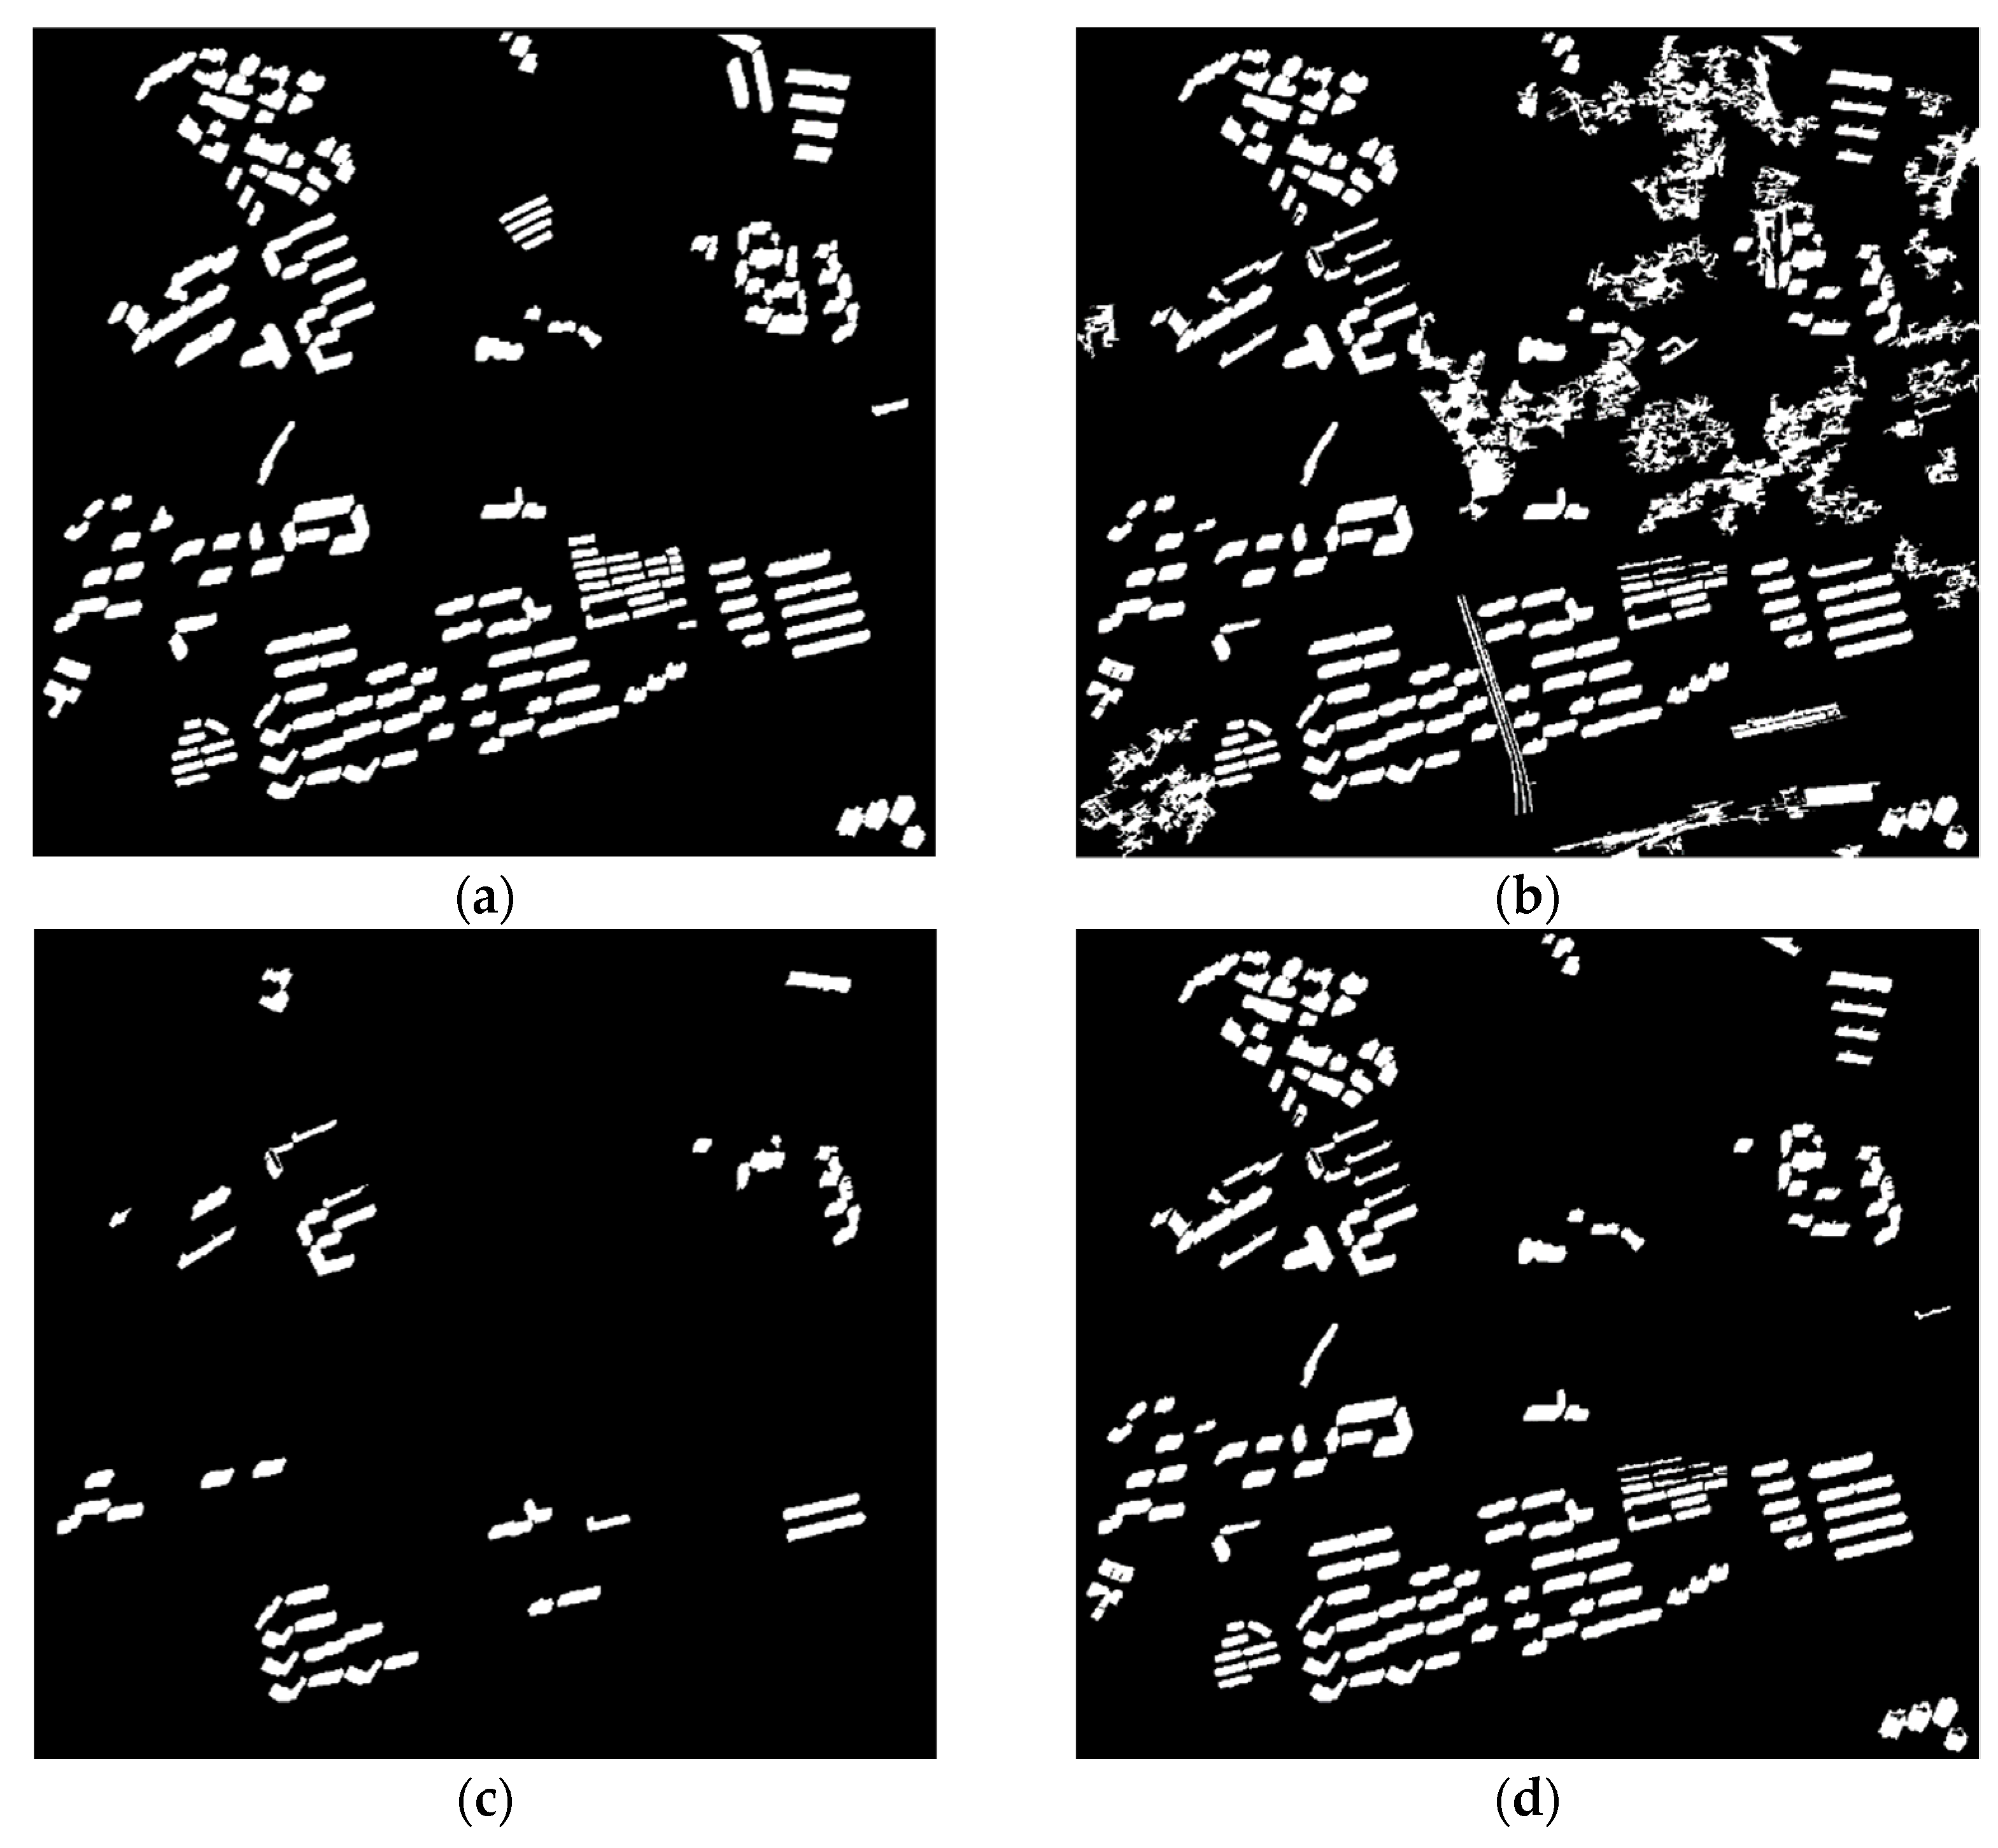
The amount of data between building objects and non-building objects in the study area used in this study is imbalanced. Therefore, the accuracy assessment of the building extraction results was performed using a confusion matrix, a model performance evaluation indicator, and the Kappa coefficient, which identified the consistency between the binary images. In the confusion matrix, building objects and non-building objects in the reference data were defined as condition positive (CP) and condition negative (CN), respectively. Similarly, building and non-building objects in the detection results were defined as prediction positive (PP) and prediction negative (PN), respectively. Furthermore, buildings in both the reference data and results are labeled as true positives (TPs). Buildings in the reference data that were classified as non-buildings in the results are labeled as false negatives (FNs). In the reference data, non-building classes that were not classified as buildings in the results are labeled as true negatives (TNs). Non-building objects in the reference data that were categorized as building objects by the method are labeled as false positives (FPs) (Table 2).
From the confusion matrix, we identified the false alarm, miss rate, and F1-score. The false alarm calculates the proportion of non-buildings that were misdetected as buildings (Equation (9)), and the miss rate calculates the rate at which buildings were detected as non-buildings (Equation (10)). Precision refers to the percentage of buildings in the classification results that were also classified as buildings in the reference data (Equation (11)). Recall refers to the percentage of buildings in the reference data that were also classified as buildings in the classification results (Equation (12)). The F1-score was calculated as the harmonic mean of the precision and the recall (Equation (13)). Additionally, the Kappa coefficient, which determines how similar the findings are to the reference data (Equation (12)), was calculated to assess the accuracy.
False   alarm = FP CN
Miss   rate = FN CP
Precision = TP PP
Recall = TP CP
F 1 - score = 2 × Precision × Recall Precision + Recall
P 0 = TP + TN TP + FN + TN + FP
P e = PP × CP + CN × PN TP + FN + TN + FP
Kappa = P 0 P e 1 P e
To evaluate the accuracy of the proposed method, after classifying the HRBs polygon layer in the digital map, reference data for HRBs were generated based on this data. The reference data were generated for objects, which are HRBs, in satellite images, not in the form of footprint as in digital maps, which includes both sides and roofs of the building.

3.2. Results

In this study, object-based HRB detection was performed on three research areas with different topographic characteristics and land cover using the same proposed method. As a result, the study results differed depending on the characteristics of the topography, and through these differences, it was possible to compare and analyze the advantages and disadvantages of using the proposed method.
Multiresolution segmentation was applied to the satellite images to detect object-based HRBs (Figure 6). The focus was on HRB objects in generating segmentation images. When applying multiresolution segmentation, the scale parameters were selected by considering the size of the building objects located in the study area, and shape and compactness parameters, were set to 0.1 and 0.5, respectively, which are the default values when dividing multiresolution segmentation (Table 3). Setting all the same default values could lead to better results in segmenting HRB objects than setting different shape and compactness parameters for each study area.
At the same time, the MBI was calculated to detect buildings in the study areas, and the results are shown in Figure 7. Thereafter, the Otsu threshold value in the MBI of each image was calculated, and the Otsu thresholds of each site were 0.1961, 0.4431, and 0.4549, in order. When pixels with values greater than or equal to the threshold value were classified as building pixels, to expand the pixel-based building detection result to objects, the majority voting process was performed, and the results are shown in Figure 8, Figure 9 and Figure 10b.
In this study, a confusion matrix was used to calculate the accuracy of building detection. The reference data used for accuracy evaluation identified only HRB objects on the digital map and expressed them as binary images. To evaluate the performance of the proposed method, a comparison with a previous research method used for building detection, which uses shadows, was also conducted [42]. In previous studies, shadow objects were extracted by calculating the shadow intensity [43] using the blue band ( B ) and green band ( G ), as shown in Equation (17), after detecting object-based building candidate groups. After that, the final building object was detected by calculating the direction between the building object and the shadow. In this chapter, only the rough status of the study results is discussed, and a detailed analysis is provided in the next chapter, “Section 3”.
φ = 4 π tan 1 ( B G B + G )
Figure 8d, Figure 10, and Figure 11d show the detection of HRBs using a digital map based on the results of object-based building detection; the results were produced based on the MBI calculated for all the study areas. During this process, after matching the same buildings with each other on the digital maps and satellite images, the misdetected building objects were removed by calculating the direction between the two. In the case of Site 1, the azimuth of the KOMPSAT-3A sensor was 285.6° when the study area was imaged. Using Equation (7), it was determined that the approximate direction of the buildings’ relief resulting from displacement was 105.6°. In fact, the average value of the direction between the HRB detected by the MBI on the digital map was 105.2°, and when the outlier value was removed, the maximum value was 106.4 and the minimum value was 104.8°. The HRB detection results from Site 1 are shown in Figure 8, and the accuracy evaluation results are summarized in Table 4. Overall, the HRB detection accuracy is high when using the proposed digital map, but it has a value of approximately 0.7 in terms of F1-score or Kappa coefficient, which represents the overall detection accuracy. Of course, this accuracy is higher than when only MBI was used for HRB detection or when shadows were used, but overall, it cannot be said to be a good result [44].
Site 1 is an area where HRBs and LRBs are mixed. As a result, it was difficult to distinguish between adjacent roads and buildings, and visual identification between HRBs and LRBs was also difficult. In this area, due to shadows or adjacent roads with similar spectral characteristics, roads and shadows were included in the building objects, or buildings were included in the road or shadow objects, when generating segmentation images through multiresolution segmentation. As a result, even if a digital map was used, the derived result included distorted building objects (Figure 9). As a result, the accuracy of the final HRB detection result was lower compared to other study areas.
The azimuth angle of the KOMPSAT-3 sensor used when acquiring Site 2 is 207.6°. Likewise, the direction of the buildings’ relief displacement on Site 2, according to Equation (7), is 27.6°. As a result of calculating the direction between the building object on the digital map and satellite image, it was confirmed that the average value was 207.8°, the maximum value was 209°, and the minimum value was 205.8°; these values converge in the direction of the building relief displacement by the satellite sensor. Figure 10 and Table 5 are the results of building detection on Site 2. When the proposed method was used, the false alarm and miss rate of the building detection results were 0.0028 and 0.1328, respectively, which were the lowest false detection rates. Compared to previous studies using shadows, it can be seen that both the F1-score and Kappa coefficients increased by approximately 12%.
For Site 2, most of the buildings are HRBs, and the surrounding area is bare land or vegetation areas, which makes it easy to identify buildings. As the buildings located on the ground are nearly white in color, it is very easy to distinguish them from the buildings’ shadows. As a result, there were fewer difficulties during the segmentation process when compared to Site 1, and there was no difficulty in applying the proposed method. In the case of high-rise building detection using shadows, there were undetected building objects due to some undetected shadows; however, the overall detection accuracy was high. Nevertheless, the HRB detection accuracy by the proposed method using digital maps was the highest.
The WorldView-3 sensor azimuth used in the study is 204.4°, and the direction of the Site 3 buildings’ relief displacement is 24.4°. It was confirmed that the average direction between the building object on the digital map and satellite image was 24.7°, the maximum value was 27.8°, and the minimum value was 21.5°; these values converge in the direction of the buildings’ relief displacement. Compared to other study areas, the deviation in the value from which outliers were removed is large and is considered to be the result of Site 3′s higher altitude above sea level when compared to Sites 1 and 2, which resulted in higher relief displacement. As can be seen in Figure 11 and Table 6, the accuracy of the building detection results according to the methods differ significantly from Sites 1 and 2. Among the three methods used in the study, the false detection rates of HRB detection when using MBI with the shadow intensity was the highest, and the F1-score and Kappa coefficients were 0.4037 and 0.3771, respectively. Detecting HBRs using MBI with a digital map resulted in a very low false alarm value, 0.0020, and the miss rate was also low, at 0.1283. The F1-score and Kappa coefficients rose 37% and 46%, respectively, compared to the use of MBI alone, demonstrating the highest detection accuracy among all study areas.
Finally, Site 3 is an area where HRBs and LRBs are mixed, similar to Site 1. However, the satellite’s spatial resolution was higher, and the satellite sensor’s elevation is lower than Site 1, which makes it easier to distinguish objects due to the larger size of the building objects. As a result, it was easy to distinguish between HRBs and other objects. Therefore, the HRB detection results using digital maps were excellent. On the other hand, unlike Site 1, which was overdetected due to the difficulty of distinguishing between adjacent roads and shadows, or Site 2, for which it was initially easy to distinguish shadows with the naked eye, the shadow detection was the lowest.
During the detection of HRBs using the proposed method, there is a common characteristic regardless of regional characteristics. As shown in Figure 12, some roads and railroads were misdetected as building objects, even though roads were not misdetected as buildings when calculating the MBI. As a result, detecting a building using only MBI reduces detection accuracy. In contrast, for Sites 1 and 3, some of the HRBs and LRBs were detected and some of them were not detected, so it is thought that utilization will decrease if object-based building detection is performed using only MBI.
As in previous studies, when shadows are used as auxiliary data for detecting HRBs, the experimental results vary depending on the detection accuracy of the shadow objects. In addition, the accuracy of the detected shadow cannot be trusted, so it is therefore unreliable when detecting HRBs.
On the other hand, if a digital map is used as auxiliary data when detecting HRBs, the reliability can be guaranteed as long as it is periodically renewed by a trusted related institution, and the HRB detection results will also have high reliability as a result. However, as in the proposed method, if a building is not found while detecting a group of building candidates before using the digital map, the building cannot be detected even if the digital map is used.

4. Conclusions

This study proposed an object-based HRB detection method for high-resolution images using digital maps. To evaluate the performance of the proposed method, three areas acquired using different satellites with different surface patterns were selected as study areas. The MBI was calculated to detect the building candidate group, and, at the same time, an object-based segmentation image was generated by applying multiresolution segmentation to the satellite imagery for object-based analysis. Through majority voting, the buildings detected in the MBI, which were based on pixels, were expanded to object-based results, and digital maps were used to detect the final HRBs. During this process, the buildings’ direction of relief displacement was used, and the final detected object-based HRB detection result was compared with the HRB detection results that used shadows to confirm the performance of the proposed method.
On Site 1, LRBs, HRBs, and roads are adjacent, and the characteristics between them are similar, so building objects were not properly generated while constructing the segmentation image. As a result, a portion of the building was detected while the rest was not properly detected, which adversely affected the final accuracy evaluation.
Site 2 is the area where the shapes of the building objects were more discernible, and it was the study area with the least obstacles. Similar to buildings, shadows were also easy to detect, so the difference between the proposed method and the results from previous studies was the smallest among the three areas.
Finally, Site 3 is an area with geographic characteristics similar to Site 1. However, it was acquired using WorldView-3, which has a higher spatial resolution than KOMPSAT-3A, which was used when acquiring Site 1. In addition, the satellite sensor’s elevation angle was low, so the objects in the photographs appeared larger. Therefore, it was relatively easy to detect HRBs using the proposed method.
As a result of selecting different regions with different characteristics as study areas and applying the proposed method, it was confirmed that object-based HRB detection using digital maps was highly accurate not only in areas composed of HRBs, but also in areas with HRBs and LRBs. Furthermore, when detecting HRBs in areas where HRBs and LRBs are mixed, the difference between the two was noticeable or the accuracy was higher in the images with high spatial resolutions. The use of digital maps was more accurate than when detecting HRBs by using shadows as auxiliary data, confirming the possibility of using the proposed method in a wide field. However, there is still the disadvantage that if a building object is omitted from the building polygon layer in the digital map during the final HRB detection process, it will affect the result, so it is necessary to solve this problem.
It is believed that the proposed method can be used not only for detecting HRBs but also for detecting changes in urban areas as well as monitoring HRB-based urban areas.

Author Contributions

Conceptualization, S.J. and W.H.L.; validation, S.J.; formal analysis, S.J. and W.H.L.; investigation, S.J.; resources, W.H.L.; data curation, S.J. and W.H.L.; writing—original draft preparation, S.J.; writing—review and editing, K.L. and W.H.L.; visualization, S.J.; funding acquisition, W.H.L. All authors have read and agreed to the published version of the manuscript.

Funding

This research was supported by the Basic Science Research Program through the National Research Foundation of Korea (NRF) funded by the Ministry of Education (NRF-2020R1I1A3061750), and this work was supported by the National Research Foundation of Korea (NRF) grant funded by the Korean government (MSIT) (No. NRF-2021R1A5A8033165).

Institutional Review Board Statement

Not applicable.

Informed Consent Statement

Not applicable.

Data Availability Statement

Data sharing not applicable.

Conflicts of Interest

The authors declare no conflict of interest.

References

  1. UN Organization. World Urbanization Prospects; United Nations Publications: New York, NY, USA, 2018; Volume 12, ISBN 9789211483192.
  2. Guo, Z.; Wang, S.D.; Cheng, M.M.; Shu, Y. Assess the effect of different degrees of urbanization on land surface temperature using remote sensing images. Procedia Environ. Sci. 2012, 13, 935–942. [Google Scholar] [CrossRef] [Green Version]
  3. Sheeba, A.A.; Jayaparvathy, R. Performance modeling of an intelligent emergency evacuation system in buildings on accidental fire occurrence. Saf. Sci. 2019, 112, 196–205. [Google Scholar] [CrossRef]
  4. Song, C. Spectral mixture analysis for subpixel vegetation fractions in the urban environment: How to incorporate endmember variability? Remote Sens. Environ. 2005, 95, 248–263. [Google Scholar] [CrossRef]
  5. Yang, L.; Xian, G.; Klaver, J.M.; Deal, B. Urban land-cover change detection through sub-pixel imperviousness mapping using remotely sensed data. Photogramm. Eng. Remote Sens. 2003, 69, 1003–1010. [Google Scholar] [CrossRef]
  6. Esch, T.; Heldens, W.; Hirner, A.; Keil, M.; Marconcini, M.; Roth, A.; Zeidler, J.; Dech, S.; Strano, E. Breaking new ground in mapping human settlements from space—The Global Urban Footprint. ISPRS J. Photogramm. Remote Sens. 2017, 134, 30–42. [Google Scholar] [CrossRef] [Green Version]
  7. Taubenböck, H.; Esch, T.; Felbier, A.; Wiesner, M.; Roth, A.; Dech, S. Monitoring urbanization in mega cities from space. Remote Sens. Environ. 2012, 117, 162–176. [Google Scholar] [CrossRef]
  8. Song, X.P.; Sexton, J.O.; Huang, C.; Channan, S.; Townshend, J.R. Characterizing the magnitude, timing and duration of urban growth from time series of Landsat-based estimates of impervious cover. Remote Sens. Environ. 2016, 175, 1–13. [Google Scholar] [CrossRef]
  9. Khosravi, I.; Momeni, M.; Rahnemoonfar, M. Performance evaluation of object-based and pixel-based building detection algorithms from very high spatial resolution imagery. Photogramm. Eng. Remote Sens. 2014, 80, 519–528. [Google Scholar] [CrossRef] [Green Version]
  10. Shackelford, A.K.; Davis, C.H. A combined fuzzy pixel-based and object-based approach for classification of high-resolution multispectral data over urban areas. IEEE Trans. Geosci. Remote Sens. 2003, 41, 2354–2363. [Google Scholar] [CrossRef] [Green Version]
  11. Hu, L.; Zheng, J.; Gao, F. A building extraction method using shadow in high resolution multispectral images. Int. Geosci. Remote Sens. Symp. 2011, 1862–1865. [Google Scholar] [CrossRef]
  12. Shi, W.; Mao, Z.; Liu, J. Building Extraction from High-Resolution Remotely Sensed Imagery Based on Multi-subgraph Matching. J. Indian Soc. Remote Sens. 2018, 46, 2003–2013. [Google Scholar] [CrossRef]
  13. Carlin, L.B.L. A multilevel context-based system for classification of very high spatial resolution images. IEEE Trans. Geosci. Remote Sens. 2006, 44, 2587–2600. [Google Scholar] [CrossRef] [Green Version]
  14. You, Y.; Wang, S.; Ma, Y.; Chen, G.; Wang, B.; Shen, M.; Liu, W. Building detection from VHR remote sensing imagery based on the morphological building index. Remote Sens. 2018, 10, 1287. [Google Scholar] [CrossRef] [Green Version]
  15. Baltsavias, E.P. Object extraction and revision by image analysis using existing geodata and knowledge: Current status and steps towards operational systems. ISPRS J. Photogramm. Remote Sens. 2004, 58, 129–151. [Google Scholar] [CrossRef]
  16. Haala, N.; Kada, M. An update on automatic 3D building reconstruction. ISPRS J. Photogramm. Remote Sens. 2010, 65, 570–580. [Google Scholar] [CrossRef]
  17. Pesaresi, M.; Benediktsson, J.A. A new approach for the morphological segmentation of high-resolution satellite imagery. IEEE Trans. Geosci. Remote Sens. 2001, 39, 309–320. [Google Scholar] [CrossRef] [Green Version]
  18. Benediktsson, J.A.; Pesaresi, M.; Amason, K. Classification and feature extraction for remote sensing images from urban areas based on morphological transformations. IEEE Trans. Geosci. Remote Sens. 2003, 41, 1940–1949. [Google Scholar] [CrossRef] [Green Version]
  19. Fauvel, M.; Benediktsson, J.A.; Chanussot, J.; Sveinsson, J.R. Spectral and spatial classification of hyperspectral data using SVMs and morphological profiles. IEEE Trans. Geosci. Remote Sens. 2008, 46, 3804–3814. [Google Scholar] [CrossRef] [Green Version]
  20. Shirowzhan, S.; Trinder, J. Building Classification from Lidar Data for Spatio-temporal Assessment of 3D Urban Developments. Procedia Eng. 2017, 180, 1453–1461. [Google Scholar] [CrossRef]
  21. Radhika, S.; Tamura, Y.; Matsui, M. Cyclone damage detection on building structures from pre- and post-satellite images using wavelet based pattern recognition. J. Wind Eng. Ind. Aerodyn. 2015, 136, 23–33. [Google Scholar] [CrossRef]
  22. Xi, Y.; Luo, Q. A morphology-based method for building change detection using multi-temporal airborne LiDAR data. Remote Sens. Lett. 2018, 9, 131–139. [Google Scholar] [CrossRef]
  23. Du, S.; Zhang, Y.; Zou, Z.; Xu, S.; He, X.; Chen, S. Automatic building extraction from LiDAR data fusion of point and grid-based features. ISPRS J. Photogramm. Remote Sens. 2017, 130, 294–307. [Google Scholar] [CrossRef]
  24. Yan, Y.; Tan, Z.; Su, N.; Zhao, C. Building extraction based on an optimized stacked sparse autoencoder of structure and training samples using LIDAR DSM and optical images. Sensors 2017, 17, 1957. [Google Scholar] [CrossRef] [Green Version]
  25. Saha, S.; Bovolo, F.; Bruzzone, L. Building Change Detection in VHR SAR Images via Unsupervised Deep Transcoding. IEEE Trans. Geosci. Remote Sens. 2021, 59, 1917–1929. [Google Scholar] [CrossRef]
  26. Zhao, L.; Zhou, X.; Kuang, G. Building detection from urban SAR image using building characteristics and contextual information. EURASIP J. Adv. Signal Process. 2013, 2013, 56. [Google Scholar] [CrossRef] [Green Version]
  27. Widyaningrum, E.; Peters, R.Y.; Lindenbergh, R.C. Building outline extraction from als point clouds using medial axis transform descriptors. Pattern Recognit. 2020, 106, 107447. [Google Scholar] [CrossRef]
  28. Wang, B.; Choi, S.; Byun, Y.; Lee, S.; Choi, J. Object-based change detection of very high resolution satellite imagery using the cross-sharpening of multitemporal data. IEEE Geosci. Remote Sens. Lett. 2015, 12, 1151–1155. [Google Scholar] [CrossRef]
  29. Voulodimos, A.; Doulamis, N.; Doulamis, A.; Protopapadakis, E. Deep Learning for Computer Vision: A Brief Review. Comput. Intell. Neurosci. 2018, 2018, 7068349. [Google Scholar] [CrossRef]
  30. Park, H.; Choi, J.; Park, W.; Park, H. Modified S2CVA algorithm using cross-sharpened images for unsupervised change detection. Sustainability 2018, 10, 3301. [Google Scholar] [CrossRef] [Green Version]
  31. Gharibbafghi, Z.; Tian, J.; Reinartz, P. Modified superpixel segmentation for digital surface model refinement and building extraction from satellite stereo imagery. Remote Sens. 2018, 10, 1824. [Google Scholar] [CrossRef] [Green Version]
  32. Mao, J.; Gao, N. The airborne transmission of infection between flats in high-rise residential buildings: A review. Build. Environ. 2015, 94, 516–531. [Google Scholar] [CrossRef] [PubMed]
  33. Lozinsky, C.H.; Touchie, M.F. Inter-zonal airflow in multi-unit residential buildings: A review of the magnitude and interaction of driving forces, measurement techniques and magnitudes, and its impact on building performance. Indoor Air 2020, 30, 1083–1108. [Google Scholar] [CrossRef] [PubMed]
  34. Avudaiammal, R.; Elaveni, P.; Selvan, S.; Rajangam, V. Extraction of Buildings in Urban Area for Surface Area Assessment from Satellite Imagery based on Morphological Building Index using SVM Classifier. J. Indian Soc. Remote Sens. 2020, 48, 1325–1344. [Google Scholar] [CrossRef]
  35. Duro, D.C.; Franklin, S.E.; Dubé, M.G. A comparison of pixel-based and object-based image analysis with selected machine learning algorithms for the classification of agricultural landscapes using SPOT-5 HRG imagery. Remote Sens. Environ. 2012, 118, 259–272. [Google Scholar] [CrossRef]
  36. Hussain, M.; Chen, D.; Cheng, A.; Wei, H.; Stanley, D. Change detection from remotely sensed images: From pixel-based to object-based approaches. ISPRS J. Photogramm. Remote Sens. 2013, 80, 91–106. [Google Scholar] [CrossRef]
  37. Tong, H.; Maxwell, T.; Zhang, Y.; Dey, V. A supervised and fuzzy-based approach to determine optimal multi-resolution image segmentation parameters. Photogramm. Eng. Remote Sens. 2012, 78, 1029–1044. [Google Scholar] [CrossRef]
  38. Huang, X.; Zhang, L.; Zhu, T. Building change detection from multitemporal high-resolution remotely sensed images based on a morphological building index. IEEE J. Sel. Top. Appl. Earth Obs. Remote Sens. 2014, 7, 105–115. [Google Scholar] [CrossRef]
  39. Huang, X.; Zhang, L. A multidirectional and multiscale morphological index for automatic building extraction from multispectralgeoeye-1 imagery. Photogramm. Eng. Remote Sens. 2011, 77, 721–732. [Google Scholar] [CrossRef]
  40. Huang, X.; Zhang, L. Morphological building/shadow index for building extraction from high-resolution imagery over urban areas. IEEE J. Sel. Top. Appl. Earth Obs. Remote Sens. 2012, 5, 161–172. [Google Scholar] [CrossRef]
  41. Soille, P.; Talbot, H. Directional morphological filtering. IEEE Trans. Pattern Anal. Mach. Intell. 2001, 23, 1313–1329. [Google Scholar] [CrossRef]
  42. Jung, S.; Lee, W.H.; Han, Y. Change detection of building objects in high-resolution single-sensor and multi-sensor imagery considering the sun and sensor’s elevation and azimuth angles. Remote Sens. 2021, 13, 3660. [Google Scholar] [CrossRef]
  43. Benarchid, O.; Raissouni, N.; EL Adib, S.; Abbous, A.; Azyat, A.; Achhab, B.; Lahraoua, M.; Chahboun, A. Building extraction using object-based classification and shadow information in very high resolution multispectral images, a case study: Tetuan, Morocco. Can. J. Image Process. Comput. Vis. 2013, 4, 1–8. [Google Scholar]
  44. Landis, J.R.; Koch, G.G. The Measurement of Observer Agreement for Categorical Data. Biometrics 1977, 33, 159. [Google Scholar] [CrossRef] [PubMed] [Green Version]
Figure 1. Flowchart of the proposed method.
Remotesensing 14 00330 g001
Figure 2. Basic concept of majority voting.
Remotesensing 14 00330 g002
Figure 3. Direction of a building’s relief displacement according to the azimuth angle of the sensor [42].
Remotesensing 14 00330 g003
Figure 4. Calculation of the direction between a building and the digital map using its centroid coordinates.
Remotesensing 14 00330 g004
Figure 5. Satellite images and digital maps of the study areas: (a) KOMPSAT-3A image (Site 1); (b) KOMPSAT-3 image (Site 2); and (c) WorldView-3 image (Site 3).
Remotesensing 14 00330 g005
Figure 6. Multiresolution segmentation images: (a) Site 1; (b) Site 2; and (c) Site 3 imagery.
Remotesensing 14 00330 g006
Figure 7. Morphological building index images: (a) Site 1; (b) Site 2; and (c) Site 3 imagery.
Remotesensing 14 00330 g007
Figure 8. HRB detection results from Site 1. (a) Reference data; (b) HRB detection result by MBI; (c) HRB detection result by MBI with shadow intensity [42]; and (d) HRB detection result by MBI with digital maps.
Remotesensing 14 00330 g008
Figure 9. Example of high-rise building detection result due to incorrect segmentation. (a) Location in satellite image; (b) reference data; and (c) high-rise building detection result by MBI with digital maps.
Remotesensing 14 00330 g009
Figure 10. HRB detection results from Site 2. (a) Reference data; (b) HRB detection result by MBI; (c) HRB detection result by MBI with shadow intensity [42]; and (d) HRB detection result by MBI with digital maps.
Remotesensing 14 00330 g010
Figure 11. HRB detection results from Site 3. (a) Reference data; (b) HRB detection result by MBI; (c) HRB detection result by MBI with shadow intensity [42]; and (d) HRB detection result by MBI with digital maps.
Remotesensing 14 00330 g011
Figure 12. The roads that were misdetected by the morphological building index as buildings: (a) Site 1; (b) Site 2; (c) Site 3 imagery.
Remotesensing 14 00330 g012aRemotesensing 14 00330 g012b
Table 1. Specification information of the sensors.
SensorKOMPSAT-3AKOMPSAT-3WorldView-3
Acquisition date25 September 201826 February 20192 November 2016
Resolution2.2 m2.8 m1.24 m
Spectral bandsBlue: 450–520 nm
Green: 520–600 nm
Red: 630–690 nm
NIR: 760–900 nm
Blue: 450–900 nm
Green: 520–600 nm
Red: 630–690 nm
NIR: 760–900 nm
Blue: 450–510 nm
Green: 510–580 nm
Red: 630–690 nm
NIR: 770–890 nm
Image size1090 × 1050 pixels1154 × 995 pixels1682 × 1547 pixels
Sensor
angle
Azimuth285.6°207.6°204.4°
Elevation89.6°62.3°63.7°
Sun
angle
Azimuth208.1°198.5°170.6°
Elevation50.0°47.5°39.7°
Table 2. Confusion matrix.
Reference Data
Condition Positive (CP)Condition Negative (CN)
ResultsPrediction Positive (PP)True Positive (TP)False Positive (FP)
Prediction Negative (PN)False Negative (FN)True Negative (TN)
Table 3. Multiresolution segmentation parameter values by site.
Site No.ScaleShapeCompactnessNumber of
Objects
Site 11800.10.52468
Site 21800.10.51774
Site 31500.10.52171
Table 4. Accuracy of HRB detection for Site 1.
MethodsHRB Detection
Result by MBI
HRB Detection
Results by MBI with Shadow Intensity [42]
HRB Detection
Results by MBI with Digital Map
False alarm0.05250.02110.0102
Miss rate0.34450.38740.2416
F1-score0.47440.62170.7741
Kappa0.44220.61800.7601
Table 5. Accuracy of HRB detection for Site 2.
MethodsHRB Detection
Result by MBI
HRB Detection
Results by MBI with Shadow
Intensity [42]
HRB Detection
Results by MBI with Digital Map
False alarm0.03060.00400.0028
Miss rate0.13440.24600.1328
F1-score0.72840.81840.9138
Kappa0.70940.80920.9084
Table 6. Accuracy of HRB detection for Site 3.
MethodsHRB Detection
Result by MBI
HRB Detection
Results by MBI with Shadow Intensity [42]
HRB Detection
Results by MBI with Digital Map
False alarm0.08150.10280.0020
Miss rate0.13280.74710.1283
F1-score0.67860.40370.9314
Kappa0.63100.37710.9239
Publisher’s Note: MDPI stays neutral with regard to jurisdictional claims in published maps and institutional affiliations.

