Article

Climate, CO2, and Anthropogenic Drivers of Accelerated Vegetation Greening in the Haihe River Basin

1
Department of Hydraulic Engineering, Tsinghua University, Beijing 100082, China
2
State Key Laboratory of Simulation and Regulation of Water Cycle in River Basin, China Institute of Water Resources and Hydropower Research (IWHR), Beijing 100038, China
*
Author to whom correspondence should be addressed.
Remote Sens. 2022, 14(2), 268; https://doi.org/10.3390/rs14020268
Submission received: 12 December 2021 / Revised: 29 December 2021 / Accepted: 4 January 2022 / Published: 7 January 2022
(This article belongs to the Topic Climate Change and Environmental Sustainability)

Abstract

:
Vegetation regulates the exchange of terrestrial carbon and water fluxes and connects the biosphere, hydrosphere, and atmosphere. Over the last four decades, vegetation greening has been observed worldwide using satellite technology. China has also experienced a notably widespread greening trend. However, the responsiveness of vegetation dynamics to elevated CO2 concentration, climate change, and human activities remains unclear. In this study, we attempted to explore the impact of natural (precipitation, air temperature), biogeochemical (CO2), and anthropogenic drivers (nighttime light, afforestation area) on changes in vegetation greenness in the Haihe River Basin (HRB) during 2002–2018 at the county-level. We further determined the major factors affecting the variation in satellite-derived normalized difference vegetation index (NDVI) from moderate resolution imaging spectroradiometer (MODIS) for each county. The results indicated that over 85% of the counties had a significantly increased NDVI trend, and the average linear trend of annual NDVI across the study region was 0.0037 per year. The largest contributor to the NDVI trend was CO2 (mean contribution 45%), followed by human activities (mean contribution of 27%). Additionally, afforestation was a pronounced driving force for NDVI changes in mountainous areas, resulting from ecosystem restoration efforts. Our findings emphasize the crucial role of CO2 fertilization in vegetation cover change, while considering CO2 concentration, climate change, and human activities, and shed light on the significant influences of afforestation programs on water resources, especially in mountainous areas.

Graphical Abstract

1. Introduction

Vegetation controls the exchange of terrestrial carbon and water cycles between the ground surface and the atmosphere through photosynthesis. It also alters the momentum and energy absorption via its physiological properties [1,2]. Carbon uptake by vegetation is a major CO2 sink on the land. Because vegetation greening and browning are associated with variations in carbon storage, water availability, surface energy, soil nutrients, terrestrial hydrometeorology, and eco-hydrological processes, quantifying the reason for vegetation change has attracted considerable attention from scientists and policymakers [3,4,5,6].
Over the last four decades, global greening of vegetated lands has been revealed by satellite technology [7,8]. China has also undergone a noticeably broad greening trend due to efficient land-use management [9]. The satellite-based normalized difference vegetation index (NDVI), which is a reliable indicator of terrestrial vegetation growth, has been widely applied in diverse studies to reflect vegetation greening across the globe [10,11,12]. Notably, long-term changes in vegetation greenness are subjected to multiple factors that interact with biogeochemistry, climate, and human-induced land-use change [13]. Biogeochemical drivers are expressed by CO2 fertilization and nitrogen deposition [14].Temperature, precipitation, and radiation are the factors representing regional climate change. Land cover change and land management practices, such as irrigation, fertilization, afforestation, and grazing are important land-use-related drivers [15]. However, because the causes of vegetation greenness change are extremely intricate and involve numerous interacting environmental variables and irregular human land-use patterns, taking all these driving variables into account is still challenging.
The Intergovernmental Panel on Climate Change sixth assessment report (IPCC AR6) stated that increases in CO2 concentration due to anthropological reasons have been unequivocal since around 1750, and this concentration in the atmosphere is rising continuously [16]. As a substrate for photosynthesis, elevating atmospheric CO2 concentration can accelerate photosynthesis by enhancing the rate of carboxylation [7,17]. However, the debate about the relative roles of CO2 fertilization, warming, and land-use management on greening is still ongoing, due to the limited number of models that involve the entire process and consider all the parameters [9,15,16].
Moreover, it is difficult to choose indicators that can accurately characterize human activities, due to high variations in anthropological activities. Previous studies often selected gross domestic product (GDP) and population, although they have strong collinearity. A recent study claimed that the best indicator of human activities was nighttime light (NTL) [18]. Generally, NTL is regarded as the indicator that reflected the effects of urban expansion and electricity consumption [19], facilitating a variety of studies related to monitoring long-term dynamics of human and anthropogenic activities. It is insightful and practical to include NTL into the investigation of vegetation greening. In addition, afforestation data have been adopted in several studies to emphasize the great contribution of ecological restoration projects to vegetation greening in China’s wooded lands [20,21,22]. However, these studies only used forestry investment or afforestation areas to conduct statistical analyses and did not estimate the vegetation change in the future. As a result, in this study, we used the NTL dataset and afforestation areas to capture inconspicuous human activities and vegetation management programs, respectively.
The contribution analysis of vegetation dynamics that divide the entire impact into climate change and human activities has been a major concern for hydrologists and ecologists [7,23,24]. Some studies have taken human activities as a residue part after deducting climate impacts from the whole impacts [25]. Jiang et al. [11] used a multiple correlation regression method to determine the response of NDVI to climatic factors, and discrepancies between the observed and predicted NDVI values were considered as residuals. If the residuals were significant, fluctuations in the NDVI values were caused by anthropogenic activities, rather than climate. Wen et al. [26] utilized multiple linear regression to evaluate the impact of climate factors on the variations in NDVI changes in the Three Gorges Reservoir Region of China; in this method, the remaining fraction (one minus R2) was treated as human-induced NDVI variations. However, these methods consider human activities and their effects indirectly, and some uncertainty errors are incorrectly included in the contribution of the human part, which could lead to an overestimation in this part. Recently, it was recognized that socioeconomic/fundamental natural environmental indicators should be introduced in attribution analysis frameworks [18,21,23]. Yang et al. [18] built a structural equation model (SEM) to detect the connection between the NDVI fluctuations and natural and anthropogenic factors in Jiangsu Province, China. The individual and combined effects of the elements on the target were quantified using SEM. However, the variables in the study were calculated by subtracting two years’ data, which may not be representative of the long-term situation. Meanwhile, the prediction of the target variable through SEM with latent variables was difficult, and the authors did not consider the influence of CO2 on the variations in NDVI. Therefore, prediction and attribution analysis will be more complicated when comprehensively integrating climate change, human activities, and CO2.
The Haihe River Basin (HRB), covering Beijing–Tianjin–Hebei (Jing–Jin–Ji) provinces, is a major economic center in China. However, water resources in most sub-basins are attenuated [27,28,29]. Water shortage, in particular, has hindered the social and economic development of this region. To address this issue, the South-to-North Water Diversion (SNWD) Project was developed to satisfy human water demand by transferring water from the Yangtze River to the HRB. Simultaneously, the accompanying ecological restoration projects, such as the Beijing–Tianjin Sand Source Control Program [30], has exacerbated the water resource conflict between nature and humans [31]. The purpose of vegetation restoration is to mitigate soil erosion and combat climate change by increasing carbon storage through afforestation. Nevertheless, it has reduced surface runoff [32], and will affect the planning and implementation of the East Route of the SNWD. Therefore, distinguishing vegetation restoration caused by natural climate, elevated CO2 concentration, anthropogenic ecological restoration, and social and economic development is vital. More importantly, this can help determine the intensity of ecological restoration projects, along with the extent of water diversion projects, particularly in developed areas that have a large population.
In conclusion, understanding the mechanisms underlying NDVI trends is a critical step towards better understanding the dynamics of terrestrial vegetation [33]. In this study, we attempted to quantify the impact of natural, biogeochemical, and anthropogenic drivers on greenness trends indicated by the NDVI in HRB (the most developed areas in China). Except for climatic factors (air temperature, precipitation, and solar radiation) and the fertilization effects of elevated atmospheric CO2 concentration, two anthropological variables (afforestation area and NTL) were assumed to represent the human footprint conceptually. As a result, our aims were to (1) assess the contributions of natural, biogeochemical, and anthropogenic drivers to NDVI changes from 2002 to 2018 using the partial derivative equation method, (2) determine the major factors affecting the variations in NDVI in each county, and (3) predict the future NDVI for the study area over the 21st century.

2. Materials and Methods
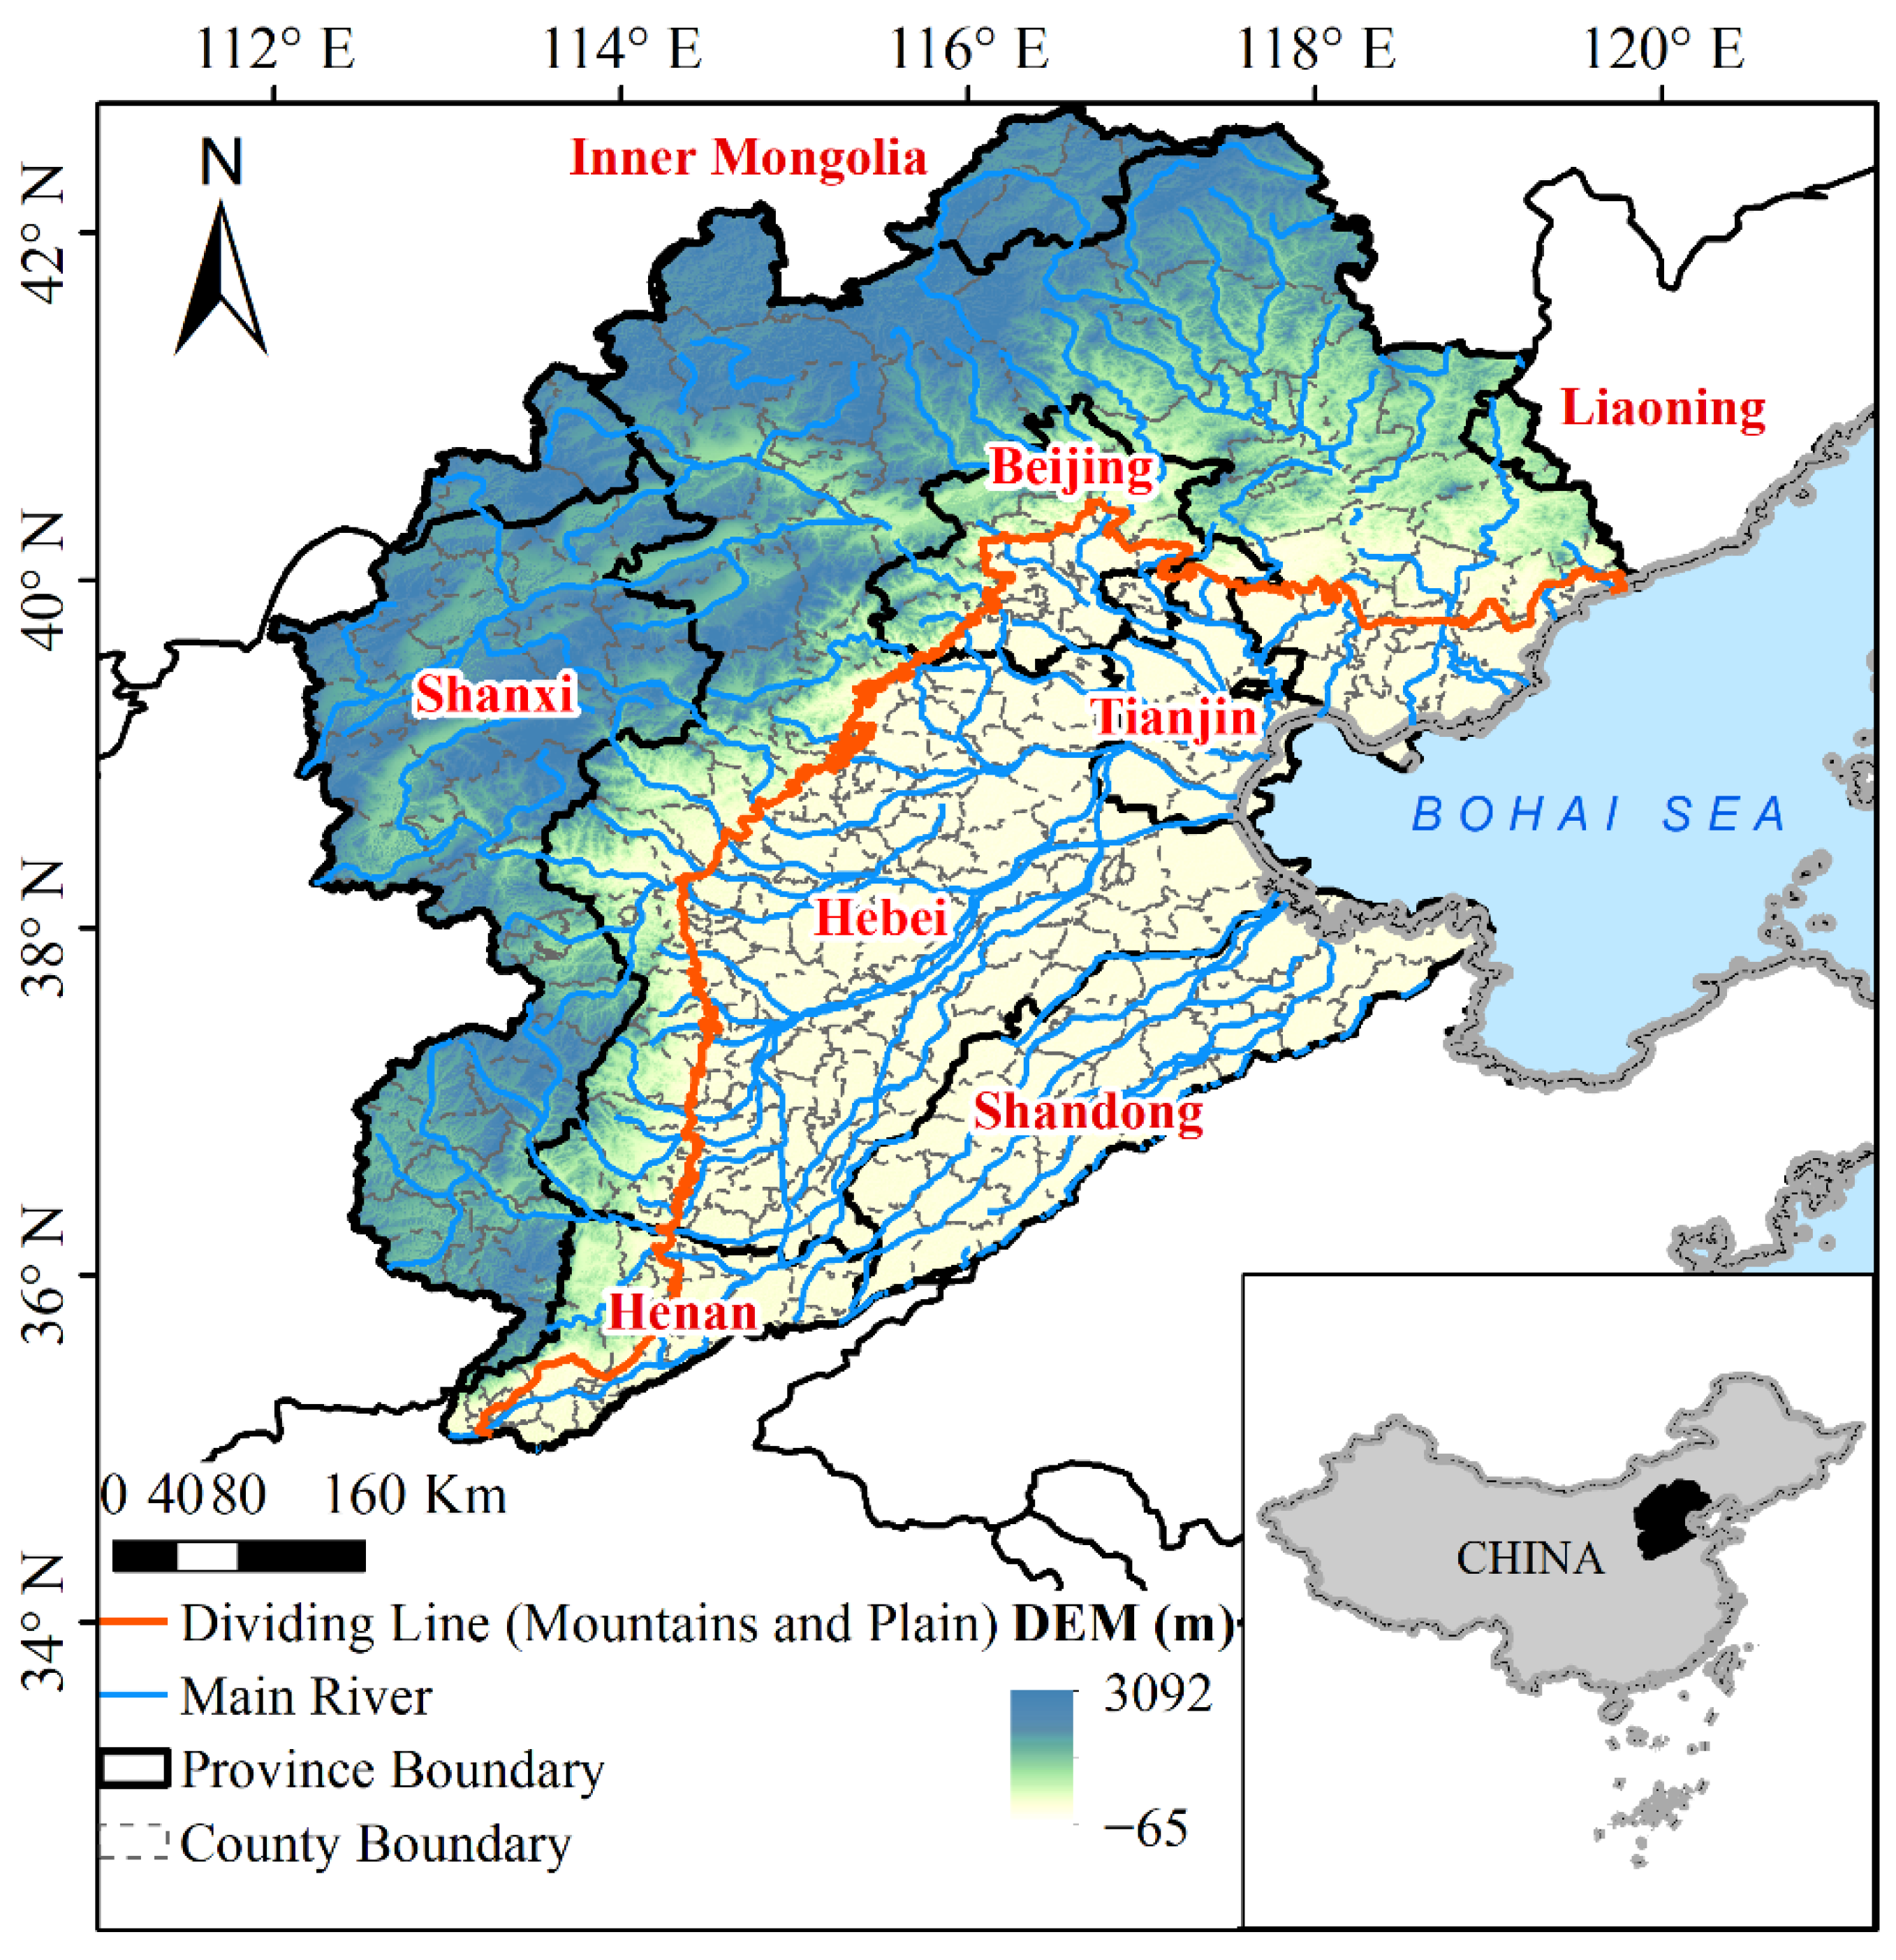
2.1. Study Area

The Haihe River Basin is the largest river basin in the North China Plain, located at 112–120°E and 35–44°N (Figure 1). It covers Beijing, Tianjin, Shijiazhuang, and 23 other large and medium-sized cities, encompassing the mountainous regions in the north and west as well as the plain areas in the south and east [29]. The multi-year average precipitation of the area was 532 mm, with most of the precipitation received from June to September (accounting for 75–85% of the total annual precipitation). The multi-year average air temperature was 10.0 °C, which belongs to the continental monsoon climate zone. The primary land-use types in the basin are grassland, cropland, and deciduous broadleaf forest (DBF). Grassland is mainly distributed in the mountainous areas, cropland is located in the plain areas, and woodland covers the low mountainous areas. In China’s political economy, HRB occupies an important position [22], carrying the development of the Beijing-Tianjin-Hebei urban agglomeration. Given the high degree of overlap between HRB and the Beijing-Tianjin-Hebei provinces, the study area comprised a union set of the two regions. The total area of the study region was 342,697.7 km2.

2.2. Data

2.2.1. Past Scenario

In this study, the annual vegetation cover map of the classification scheme based on the International Geosphere-Biosphere Programme (IGBP) was derived from the land cover product (MCD12Q1) of the moderate resolution imaging spectroradiometer (MODIS). The IGBP scheme includes five types of forestlands: evergreen needleleaf forest (ENF), evergreen broadleaf forest (EBF), deciduous needleleaf forest (DNF), DBF, and mixed forest (MF); seven types of grassland: closed shrublands (CSH), open shrublands (OSH), woody savannas (WSA), savannas (SAV), grasslands (GRA), barren (BRN), and permanent wetlands (PMW); and two types of croplands: croplands (CRO) and cropland/natural vegetation mosaic (CRV). Then, we combined this IGBP product into three major vegetation sets (Table 1): mixed forestland (MF: ENF, EBF, DNF, DBF, and MF), mixed grassland (MG: CSH, OSH, WSA, SAV, GRA, BRN, PMW), and mixed cropland (MC: CRO, CRV), for statistical analysis, according to Naeem et al. [34].
The MODIS-NDVI product (MOD13A1) at 16-day intervals, which was taken as a proxy for vegetation greening, was extracted from the Google Earth Engine (GEE) platform (https://code.earthengine.google.com/, accessed on 04 December 2021). Then, the 16-day NDVI values smaller than zero were excluded, and the annual average NDVI value was aggregated from the corresponding year’s data.
The meteorological forcing data needed were obtained from the China meteorological forcing dataset (CMFD) at the National Tibetan Plateau/Third Pole Environment Data Center (TPDC) [35]. This data included 2-m air temperature (Tem), downward shortwave radiation (Rad), and precipitation rate (Pre) with a spatial resolution of 0.1° (http://data.tpdc.ac.cn/en/data/8028b944-daaa-4511-8769-965612652c49/, accessed on 04 December 2021). The CMFD dataset was developed by integrating data from multiple sources, such as remote sensing, reanalysis datasets, and in situ observations at weather stations. This is the first high-resolution meteorological forcing data created in China [36,37] and is widely used in studies on land surface processes [38], evaporation [39,40], machine learning [41], vegetation, and phenology [42].
Afforestation statistical data were collected from the China Forestry Statistical Yearbooks/China Forestry and Grassland Statistical Yearbook (https://data.cnki.net/Yearbook/Single/N2021060073, accessed on 04 December 2021). The yearbook provided the annual area of afforestation (AFF) in each county. Human-induced vegetation restoration projects shaped by afforestation are the main positive anthropogenic effects that have accelerated the rate of vegetation greenness in many areas. Previous studies have proved that revegetation activities enhanced vegetation coverage and had profound hydrological implications [3,5,9]. According to MCD12Q1 (IGBP), not all counties have forests. Therefore, the counties with MFs in 2018 were judged to have engaged in afforestation strategies. Subsequently, we collected the data on the annual afforestation areas in these counties. Given that most afforested species were perennial trees, the accumulative area of afforestation (AAF) was treated as an indicator to explore the impact of vegetation management/human land-use management policies (implemented by the government) on the increasing NDVI of the study area.
NTL is an effective variable for detecting low-level anthropogenic activities [43]. The NTL data for the study area were integrated by harmonizing the inter-calibrated NTL observations from the Defense Meteorological Satellite Program (DMSP) data and the estimated DMSP-like NTL observations from the visible infrared imaging radiometer suite (VIIRS) data [19,44]. The produced DMSP NTL time-series data (1992–2018) resolved severe inconsistencies that existed between DMSP (1992–2013) and VIIRS (2012–2018) data and extended the span of historical DMSP NTL data. The sensors of DMSP and VIIRS can capture the gleam emission sources on the Earth’s surface at night, thus seizing the brightness of cities, towns, industrial sites, and expansion of urban traffic, and residences. In our study, to account for the difference between climate change and human activities, Tem, Rad, and Pre were considered to evaluate the impact of climate change on vegetation dynamics. Additionally, AAF and NTL were treated as anthropogenic drivers.
The atmospheric CO2 concentration was from CarbonTracker (CT2019B, https://gml.noaa.gov/ccgg/carbontracker/, accessed on 04 December 2021), developed by NOAA to track the carbon dioxide globally [45]. CarbonTracker estimated the monthly surface CO2 fluxes at 3° × 2° from 2000 to 2018, and it was well validated by Kulawik et al. [46]. A description of the datasets applied in our study is shown in Table 2.
Due to the availability of the above-mentioned data, the time resolution of each dataset was uniformly based on an annual scale from 2002 to 2018, and the spatial scale was aggregated at the county level to match the scope of afforestation data from the yearbooks.

2.2.2. Future Climate Data

The future climatic forcing (precipitation, surface air temperature, and surface downwelling shortwave radiation) from five global climate models (BCC-CSM2-MR, CAS-ESM2-0, FGOALS-f3-L, GFDL-ESM4, and MRI-ESM2-0– all r1i1p1f1 ensemble members) were selected to predict the NDVI of the study area under three shared socioeconomic pathways (SSPs), namely SSP126, SSP245, and SSP585 [47]. These models belong to the scenario model intercomparison (ScenarioMIP), which is part of the Coupled Model Intercomparison Project Phase 6 (CMIP6, https://esgf-node.llnl.gov/search/cmip6/, accessed on 04 December 2021). Notably, SSPs work in harmony with representative concentration pathways (RCPs) through shared policy assumptions, implying that future scenarios are more reasonable [48]. Bias correction was conducted through the relationship between observed values and historical values by linear regression for precipitation, surface air temperature, and shortwave radiation, respectively, from 1979 to 2014. The slope of the regression was used to rescale the future data from 2020 to 2100. Whether NDVI will continue to increase in the future without artificial afforestation was evaluated using future scenarios from 2020 to 2100. Information regarding the models is shown in Table 3.

2.3. Methods

To estimate the effects of CO2 concentration, climate change, and human activities on NDVI variation, an analytical framework of attribution analysis [49,50] was adopted. The multivariate function describing the relationship between NDVI and driven factors can be expressed as follows:
N D V I = f ( T e m , P r e , R a d , A A F , N T L , C O 2 )
where Tem is the air temperature (°C), Pre is the precipitation (mm/yr), Rad is the solar radiation (W/m2), AAF is the accumulative area of afforestation (hm2), NTL is nighttime light (dimensionless), and CO2 is atmospheric CO2 concentration (ppm). We assumed that there is a linear formulation between NDVI and the driving variables, and the first-order partial derivative equation is deduced as follows:
d N D V I = ( N D V I T e m d T e m + N D V I P r e d P r e + N D V I R a d d R a d ) + ( N D V I A A F d A A F + N D V I N T L d N T L ) + ( N D V I C O 2 d C O 2 ) + ε
d N D V I d t = ( N D V I T e m d T e m d t + N D V I P r e d P r e d t + N D V I R a d d R a d d t ) + ( N D V I A A F d A A F d t + N D V I N T L d N T L d t ) + ( N D V I C O 2 d C O 2 d t ) + ε
where d N D V I d t , d T e m d t , d P r e d t , d R a d d t ,   d A A F d t , d N T L d t , and d C O 2 d t are the slopes of the annual Tem, Pre, Rad, AAF, NTL, and CO2 from 2000 to 2018. N D V I T e m ,   N D V I P r e , N D V I R a d , N D V I A A F , N D V I N T L , and N D V I C O 2 are the ridge regression coefficients of the annual Tem, Pre, Rad, AAF, NTL, and CO2 with NDVI, respectively [1]. The parameter value of ridge regression with the lowest GCV (cross validation criteria) was chosen as the optimal value. It was set to 2 in this study. As given in Equation (3), the absolute change in NDVI is a linear sum of the absolute changes in Tem, Pre, Rad, AAF, NTL, and CO2.
We used Tem, Pre, and Rad to describe the elements of climate change, whereas AAF and NTL were employed to convey the composition of human or social activities. Thus, the contribution of climate change (CLI), human activities (HUM), and CO2 to the variation in NDVI can be expressed as follows:
S l o p e   o f   N D V I = C L I + H U M + C O 2
R C = 100 * C L I | C L I | + | H U M | + | C O 2 |
R H = 100 * H U M | C L I | + | H U M | + | C O 2 |
R C O 2 = 100 * C O 2 | C L I | + | H U M | + | C O 2 |
where RC, RH, and RCO2 (%) represent the relative contribution rates of climate change, human activities, and elevated atmospheric CO2 concentration to NDVI variation, respectively.

3. Results

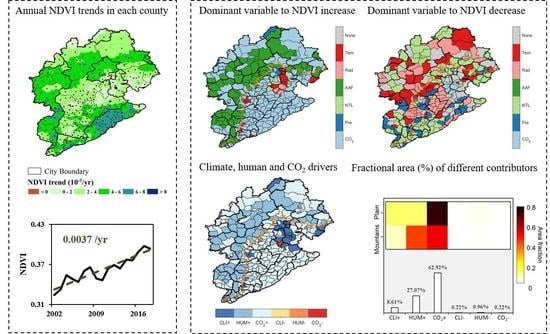
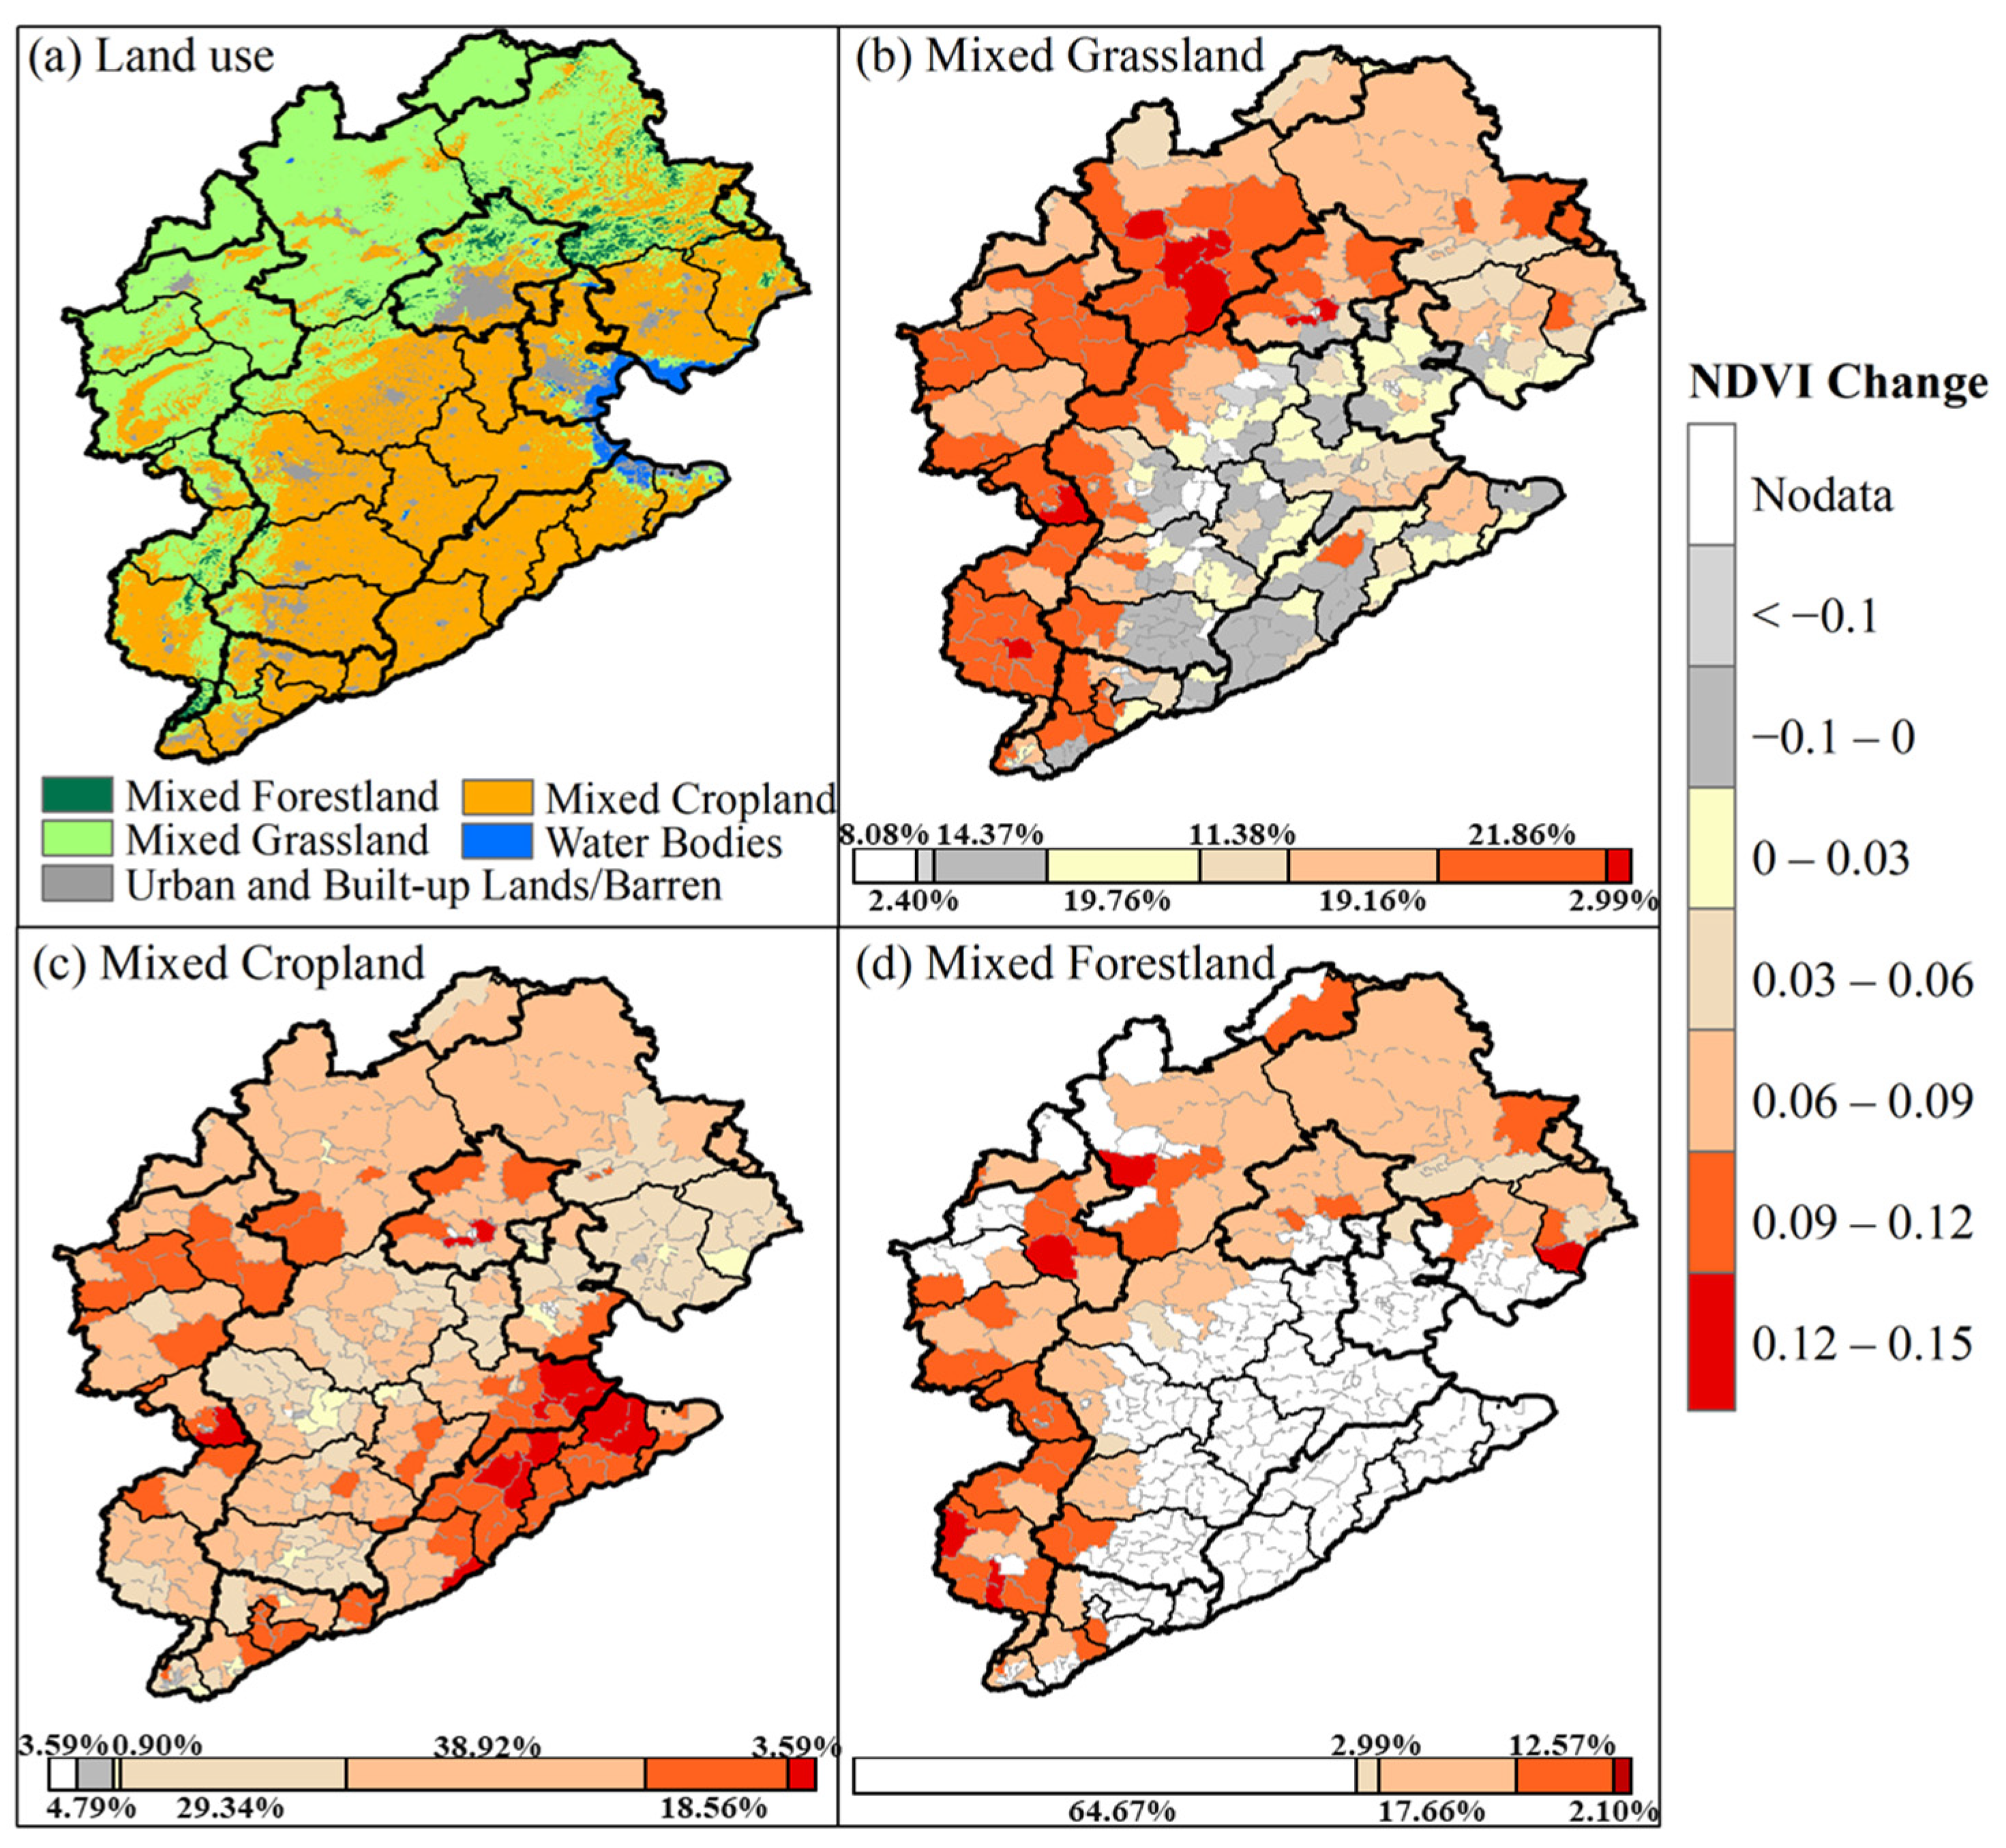
3.1. Changes in NDVI and Its Factors

At the city level, the NDVI values in 2018 were higher than in 2002 across all counties (Figure 2a). The linear trends of the annual NDVI in each district during 2018 and 2002 are plotted in Figure 2b. Across the study region, the average linear slope of the annual NDVI was 0.0037/yr. More than 85% of counties experienced a significant upward trend, and the trend was over 0.004 per year among 45% of the counties. The land cover map of the study area in 2002 based on MCD12Q1 (IGBP) is shown in Figure 3a. The study area was reclassified as MG, MC, MF, along with other types (urban/barren/water bodies). We calculated the difference between the NDVI in 2002 and 2018 for different land-use types (Figure 3b–d). In general, there was an increase in MG, MC, MF. Between 2002 and 2018, 44.01% of grassland area, 61.07% of cropland area, and 32.33% of forestland area had an increment of over 0.06.
From 2002 to 2018, climate change exhibited a warming-wetting trend in the study area. The upward slopes of Pre and Tem are 2.16 mm/yr (p > 0.05) and 0.03 °C/yr (p > 0.05), respectively (Figure 4a–b). Spatially, Pre increased in 70.06% of the area, but only 5.35% of the area increased significantly (p < 0.05). Pre showed significantly ascending trends in Beijing and Shanxi province, and the largest trend occurred in Wutai county, reaching 12 mm/yr. Areas with increasing Tem accounted for 80.24% of the total. The trend of significantly increasing Tem mainly appeared in the south, in 28.44% of the total area, whereas the significantly decreasing trend occurred in only 0.9% of the area. Shanhaiguan district portrayed the largest significantly increasing Tem trend (0.13 °C/yr). Areas with a declining Tem mainly existed in the northern and central regions of the study area. For Rad, an average downward trend (−0.12 W/m2) was noticed (p > 0.05). Spatially, Rad showed a positive trend in the north and a negative trend in the central and southern regions (Figure 4c). Rad significantly increased in 8.28% of the total area, whereas it significantly declined in 16.47% of the total area. Generally, the study area experienced apparent climate change across the entire region, with a warming-wetting-dimming trend.
Furthermore, a downward trend was found in AFF (−32.77 hm2/yr, p < 0.05) and an upward trend was detected in the NTL (0.31 per year, p < 0.05) from 2002 to 2018 (Figure 4d–e). The majority of artificial afforestation was concentrated in the mountainous areas. In 20.69% of the area, there was a significant negative trend in afforestation areas. Despite the fact that the afforestation area is reducing, the accumulative growth of perennial trees cannot be overlooked. Therefore, we used AAF in the attribution analysis. Overall, significantly upward trends in NTL occupied over 82% of the regions, which were widely dispersed in plain and hilly areas, whereas significantly downward trends were observed in only 0.6% of the areas. As a representative of social development and population density, enhanced NTL indicated that social economic activities were intense during the study period.
Figure 4f reveals sharp rises in CO2 concentration across the study area. Vegetation responds to CO2 by controlling the opening and closing of stomata. Elevated CO2 can accelerate photosynthetic rates, thereby improving vegetation productivity. As a result, the change in CO2 concentration, which is treated as a crucial factor, was considered in the attribution analysis conducted in our study.

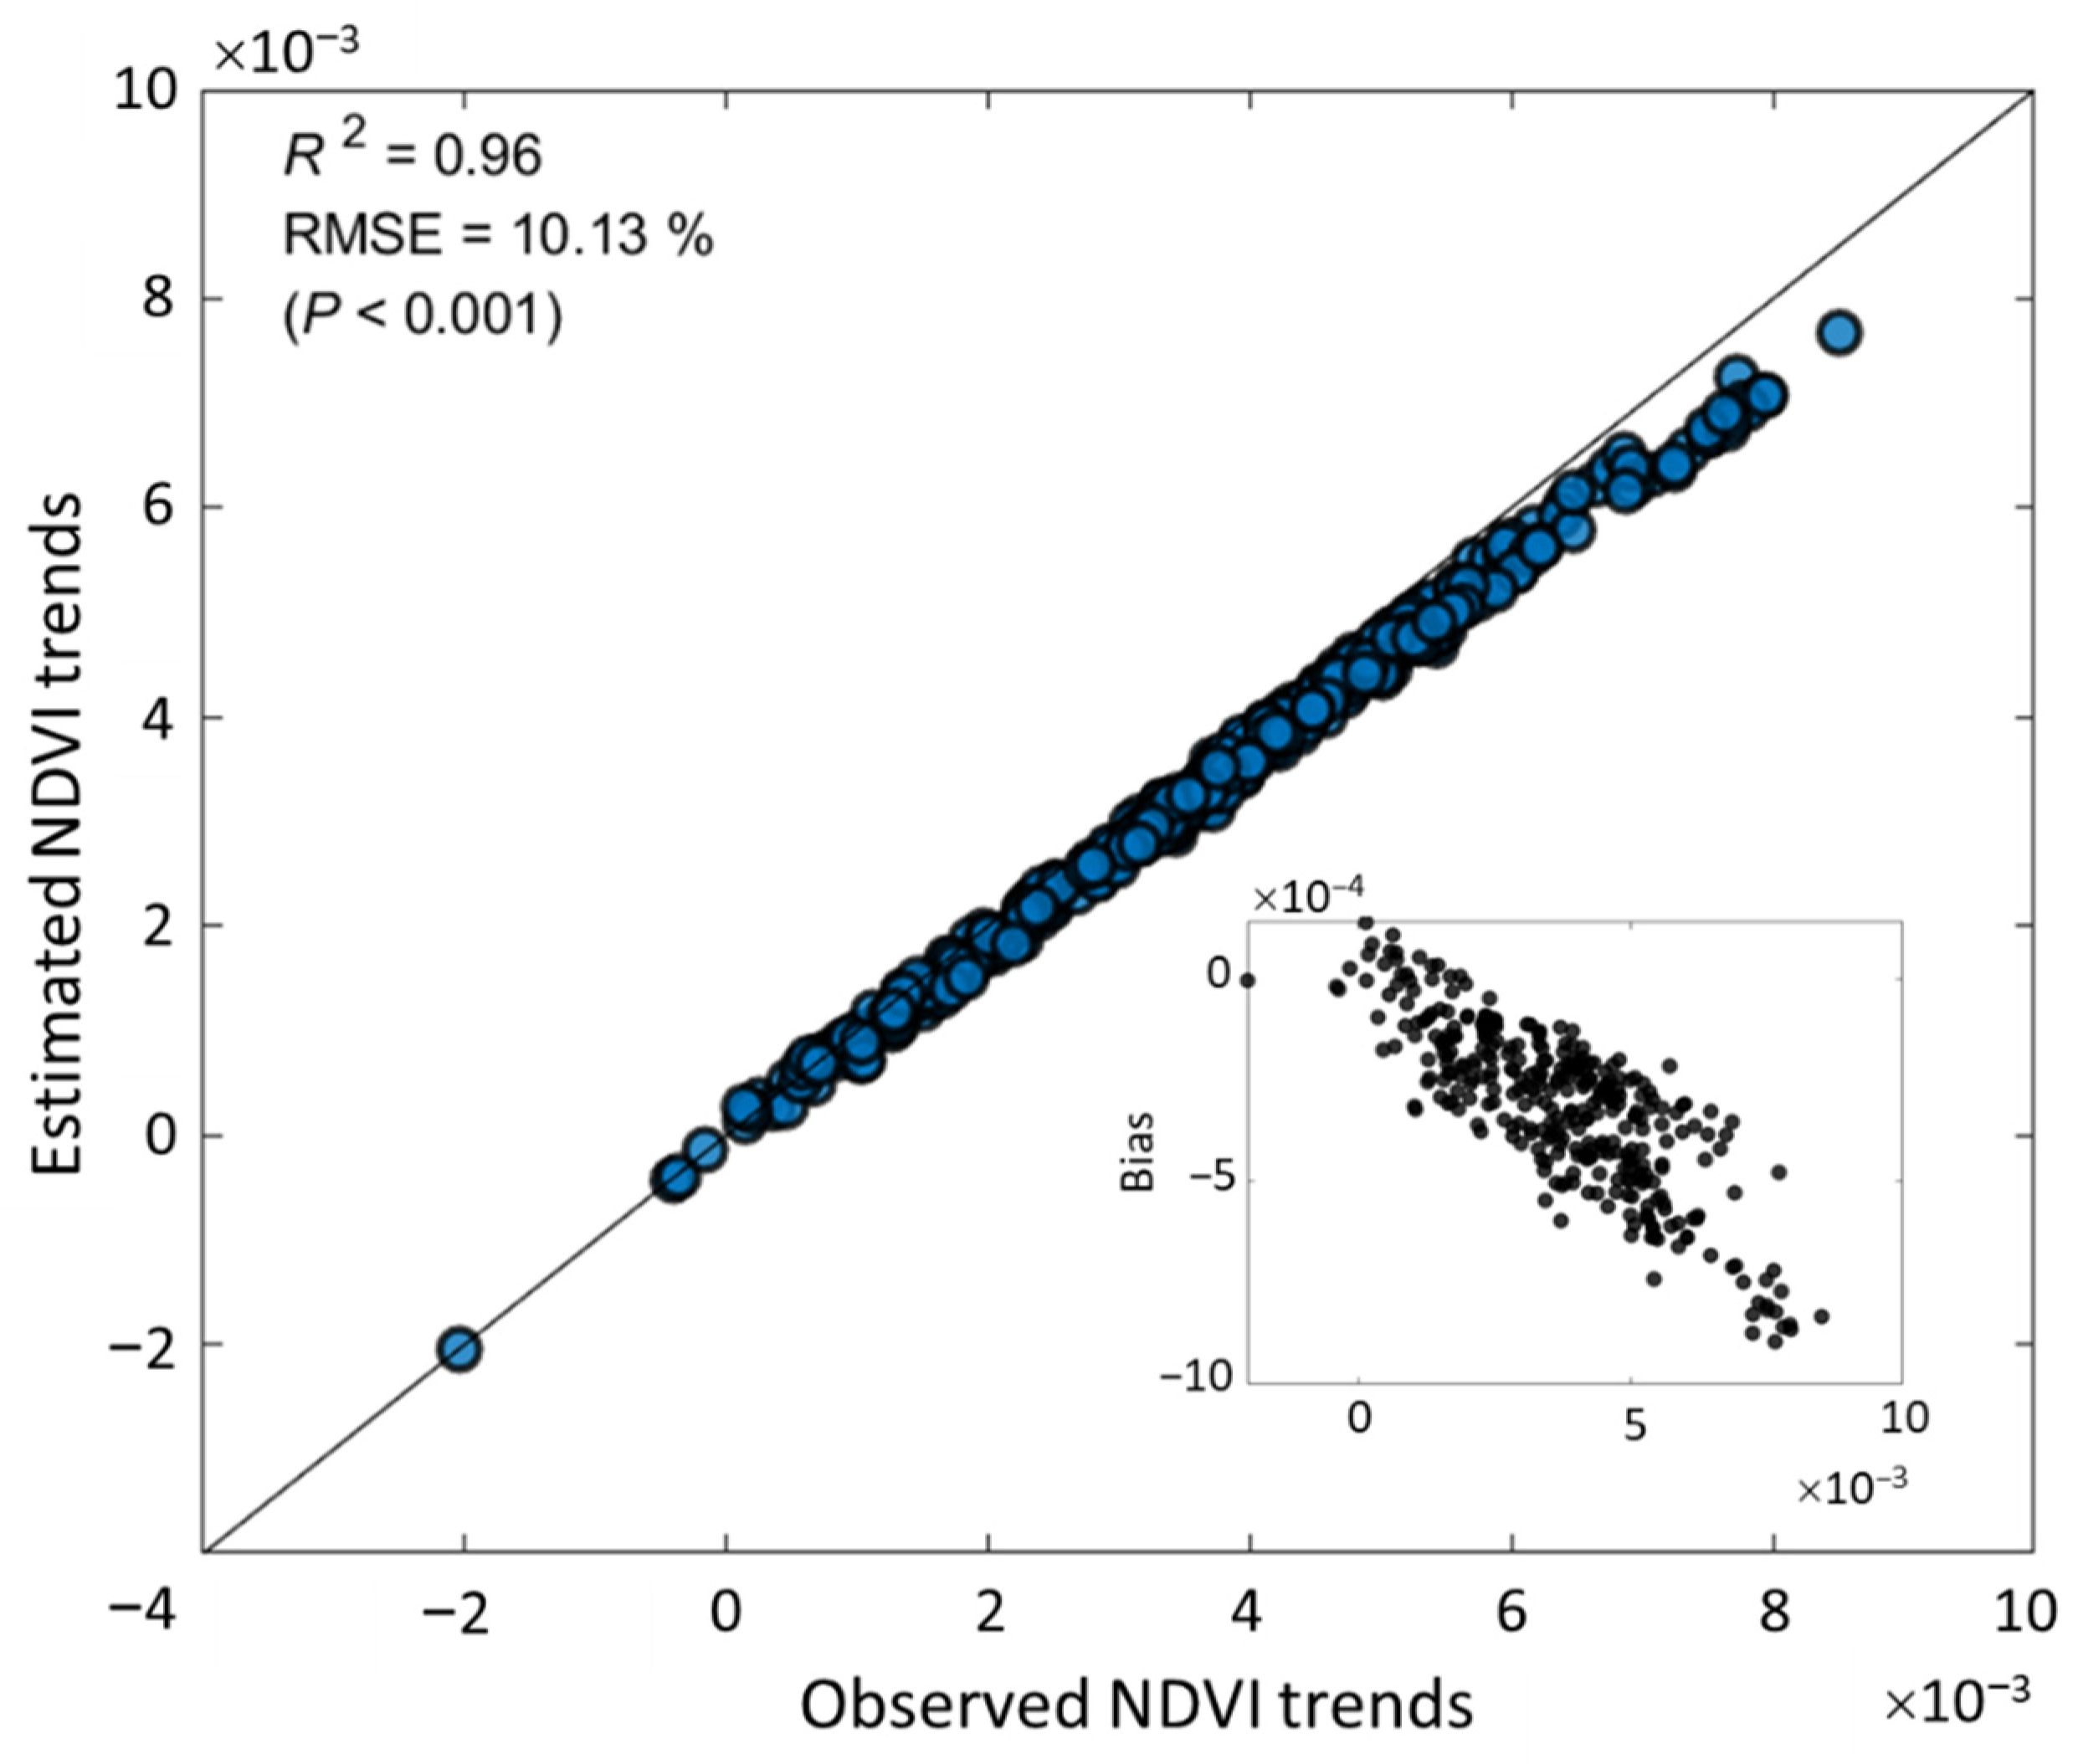
3.2. Estimation of NDVI

Before the attribution analysis, we tested the efficiency of Equation (3) in predicting annual NDVI value trends. As shown in Figure 5, the simulated slopes driven by six factors were consistent with the MODIS-derived slopes across 334 counties over the study period. The R2 value between the estimated trends and observed trends was 0.96, and the root mean square error was 10% per year, illustrating that the established model performed well. Therefore, we believe that this analytical framework was appropriate for confirming the changes in NDVI.

3.3. Contribution of CLI, HUM, and CO2

The contributions of the six driving variables to the changes in the annual NDVI were estimated by equation using Equation (4). The actual contributions of CLI, HUM, and CO2 to variations in NDVI exhibited remarkable spatial heterogeneity (Figure 6A–C).
The contribution of CLI ranged from −20% to 85% and was larger in the surrounding areas of Tianjin. The positive effects of Pre on NDVI trends were displayed in Beijing, the western part of Hebei Province, northern part of Shanxi Province, and the Inner Mongolian province (Figure 6a). The positive contribution of Pre to NDVI trends was largest in the Inner Mongolian province, with a value of >25%, and the negative contributions were relatively minor, with a value around −10% in the south-eastern area. Croplands cover a substantial portion of the south-eastern region, which had a negative influence. Because of irrigation activities, the natural response of precipitation-soil moisture is disturbed, and the water stress is mitigated, thus creating a low negative contribution of precipitation to the NDVI. Generally, the contribution of Tem to NDVI trends ranged from −40% to 65%, with a mean of 9.26% (Figure 6b). Approximately three-quarters (76.12%) of the study area located in the south-eastern area, exhibited a positive contribution, especially in Tianjin, Shijiazhuang in Hebei Province, and Anyang city in Henan Province (>50%). The negative effects of Tem on NDVI trends appeared in most areas of the north-western region, particularly in Baoding and Tangshan in Hebei Province (<−10%). Additionally, the mean contribution of Rad to the NDVI trends was 3.17% (Figure 6c). Over 60% of the areas showed a positive contribution, with a maximum value of 45.24%. Relatively large negative contributions (<−5%) were observed in the southern and central parts of the entire region.
The contribution of HUM showed a large variability, ranging from −55% to 86%. Due to the greater impact of afforestation, HUM was larger in mountainous areas than in plain areas, and it presented a negative effect in plain areas that were primarily controlled by NTL. Afforestation was regarded as a factor, which exerted a greater influence on NDVI in the form of land-use management. In the forested area, the impact of AAF on NDVI presents a positive contribution, with a range of 0–72% (Figure 6d). More than 20% of the counties located in the mountains area had contributions above 40%. The relatively high contributions mainly follow the direction of the mountains, indicating the essential role of vegetation restoration in NDVI changes in the mountainous regions. Moreover, a part of the effect of human activities on NDVI reflected by NTL showed obvious spatial diversity, resulting from the different levels of urbanization and industrialization (Figure 6e). Cangzhou, Hengshui, and Shijiazhuang of Hebei Province as well as Wulan and Chifeng in the Inner Mongolian province had a positive effect that exceeded 50%. Likewise, nearly 40% of the places concentrated on the plain showed negative individual contribution. The largest effect could reach −55% in the Shijiazhuang’s Yuhua district.
The impact of elevated CO2 concentration on the NDVI was almost positive across the whole region, with an average contribution of 46% (Figure 6C). In mountainous areas, located in the northeast region, the majority of contributions were less than 35%. In most of the south-eastern regions of the study area covered by croplands, the contributions were more than 50%, indicating that the carbon sequestration capacity of croplands was stronger than of other land-use types.
Figure 6D summarizes the contribution of each indicator at the provincial level. Elevated CO2 concentration showed the highest proportional contribution to NDVI change (mean contribution: 45.60 ± 16.68%), and human activities that enhanced vegetation status through afforestation projects ranked second only to CO2 concentration (mean contribution: 27.74 ± 14.57%). In mountainous areas, the contributions to NDVI were as follows: CO2 (mean contribution: 38.18 ± 23.00%) > AAF (mean contribution: 23.60 ± 19.84%) > NTL (mean contribution: 14.93 ± 17.86%) > Pre (mean contribution: 5.05 ± 7.03%) > Tem (mean contribution: 5.45 ± 11.98%) > Rad (mean contribution: 2.34 ± 6.67%). Consistent with mountainous areas, the contribution of CO2 to NDVI was still the greatest value in the plain area (mean contribution: 51.48% ± 32.23%), followed by Tem (mean contribution: 12.05% ± 16.39%), NTL (mean contribution: 6.68% ± 17.37%), Rad (mean contribution: 3.61% ± 9.19%), AAF (mean contribution: 6.11% ± 15.21%), and Pre (mean contribution: 2.27% ± 5.36%). It is noteworthy that the contribution of afforestation in mountainous areas is highlighted as a result of vegetation greening efforts.

3.4. Dominating Factor of NDVI Variance

The element with the largest absolute contribution rate was identified as the dominant factor that contributed to the changes in NDVI. As shown in Figure 7a,b, CO2 and AAF controlled the increase in NDVI across most areas of the study region. In mountainous areas, the growth in NDVI was dependent on CO2 and AAF. At the same time, CO2 was also the principal driving force for enhanced NDVI in plain areas. The dominant driving elements of decreased NDVI were Tem and Rad, especially in the mountainous areas. Rapid urban expansion reduced the NDVI in the plain, and the detrimental influence of urban expansion on NDVI change was revealed via NTL. Subsequently, we integrated the driving contributors into CLI, HUM, and CO2, as shown in Figure 7c. Overall, CO2 was the dominant contributor to the greening trend in more than 54% of counties, and HUM was the driving contributor in over 33% of the 334 counties (Figure 7c,d). The positive effects of HUM in the northern and western mountainous areas were attributed to vegetation restoration programs, which conserved and expanded forests to mitigate land degradation. However, the greening of the plain areas was primarily driven by elevated CO2 concentration.

3.5. Future NDVI

We used the mean value in the whole region from CMIP6 data to predict the future regional NDVI (2020–2100). Notably, we assumed that afforested projects and urban explosions would not be experienced in the future, due to the limitation of future data. That is, we held that the AAF and NTL values measured in 2018 would remain unchanged during the future period, and then, the NDVI values were simulated under different scenarios. The results are presented in Figure 8. SSP126 describes a future pathway combined SSP1 (low challenges for adaptation and mitigation) with RCP2.6 (low emission scenarios). Blending SSP2 (a medium challenge of both) with RCP4.5 (medium emission scenarios) is described by SSP245. SSP585 comprises SSP5 (high challenges to mitigation and low challenges to adaptation) and RCP8.5 (high emission scenarios). Future CO2 concentration was from O’Neill et al. [47]. By 2060, the mean value of NDVI under the scenario of SSP126 shows an increase trend, before decreasing by 2100. The predicted value from the SSP245 scenario rises steeply before 2080, and then remains the same. Furthermore, the estimated NDVI from the SSP585 scenario grows dramatically throughout the entire period.

4. Discussion

4.1. Causes of NDVI Change

Climate is generally identified as an important natural factor that influences vegetation growth [51]. Sun et al. [22] used the SPOT NDVI dataset to investigate the characteristics of variations in vegetation and assess the impacts of climate change (air temperature and precipitation) and human activities (afforestation area and urbanization) on vegetation cover change in the Haihe River Basin from 2000 to 2013. However, they did not quantify the contribution of human activities and conjectured that the change in NDVI was primarily attributed to the increase in precipitation. Similarly, Yu et al. [31] applied multiple regression models to predict the NDVI of Beijing–Tianjin–Hebei provinces in China, based on climatic factors, during the growing season from 2000 to 2017, and admitted the dominant position of precipitation and temperature for vegetation growth. However, because climate factors and human activities are highly blended, precipitation and air temperature do not always provide a decisive explanation on NDVI change. In our study, the positive effects of precipitation on NDVI trends were displayed in the north-western area (Figure 6a). The negative contributions in the south-western area covered by croplands were relatively minor. It may be caused by irrigation activities that disturb natural response of precipitation-soil moisture, creating a low negative contribution of precipitation to the NDVI. Therefore, the causes of NDVI changes are complicated [52].
Some studies have shown that socioeconomic activities were important for vegetation greenness. Zheng et al. [20] investigated the impacts of climate (temperature and precipitation) and human activities (population, GDP, and forestry investments) on vegetation variations using the geodetector method. They discovered that socioeconomic factors were the dominant driving forces of vegetation change for the typical areas in China. Lü et al. [53] analyzed vegetation change in China during 2000–2010 under the driving forces of climate and socioeconomic factors using linear regression. The results showed that the most significant elements for vegetation change were socioeconomic factors (human population and economic production). In this study, we found that anthropogenic drivers reflected by NTL have the spatial variation. There was a negative contribution to NDVI in the south-eastern area and a positive contribution in the north-western area. The negative impact was attributed to urban expansion and industrialization, which is consistent with the general understanding. However, the positive impact on rural areas located in the north-western area indicated that some human activities boosted ecosystem functions for those areas. Wang et al. [54] pointed out that urbanization development would be favorable to vegetation growth when the NTL value was lower than 15, which coincided with Figure S1f in our study. We also found that the effect of urbanization on vegetation coverage was positive when the NTL value was higher than 55, such as in the north-west of Beijing and the surroundings of Tianjin in our study. This phenomenon can be explained by Wang et al. [55]: when a city attained a certain development level, people were willing to devote more resources and efforts to improving vegetation coverage and climate for a better living environment [56]. Therefore, we present three reasons for the positive impact of NTL on NDVI in HRB: (1) the development of modern agriculture was enhanced; (2) people and governments were willing to devote more resources to improve the environment for better living conditions, and more vegetation and a favorable climate would attract more human settlement; (3) urbanization development would be in favor of vegetation growth when the NTL value was lower than 15 or higher than 55.
Nevertheless, numerous studies did not focus on the role of CO2 [57]. As a primary substrate for photosynthesis, the increase in atmospheric CO2 concentration is expected to enhance photosynthesis and improve productivity through CO2 fertilization [14]. In semi-arid areas, plants strategically close their stomata to preserve water and increase water use efficiency to improve photosynthesis [58]. Therefore, the effects of CO2 on plants are complex and cannot be overlooked. Recently, the importance of CO2 in vegetation change has been a central concern, although the dominant effect of CO2 fertilization on vegetation growth has been debatable [59,60,61]. Factorial simulations with multiple ecosystem models implied that CO2 fertilization effects explained 70% of the satellite-observed leaf area index (LAI) trend globally [7,15]. Changes in the vegetation structure and CO2 fertilization offset the decrease in gross primary productivity (GPP) caused by reduced solar radiation [62]. Rising air temperature and CO2 promoted the GPP, but the contribution of CO2 was greater, more than 50% over the Tibetan Plateau [63]. Pang et al. [64] used model experiments based on a machine learning method suggested that the CO2 was the most important factor to the increasing trend of NDVI across the temperate semi-arid grassland of China from 1982–2015. The relative contribution can be up to 87.2%. Compared with these studies, we especially focused on the influence of CO2 and afforestation on NDVI, which has not been done in the HRB before. CO2 increases have a strong positive impact on the whole region. Very few negative impacts exist. The reason for the larger positive impact in the south-eastern area is that the carbon sequestration capacity of croplands located in the south-east was stronger than that of other land-use types. The results of our work were reasonable and indicated that CO2 dominated the NDVI trend in more than 50% of counties, and HUM drove over 30% of the 334 counties (Figure 7d). Therefore, our study provides new insights into the attribution of vegetation greening in the HRB.

4.2. Impact of NDVI Change

Vegetation projects have been proven to ameliorate land degradation [65,66], and lower surface temperatures [67], but they also induce a strain on hydrology [32,68,69] and water resources [5]. Vegetation changes alter the surface thermal properties, namely surface albedo and emissivity, and the subsequent radiation budget [70]. Feng et al. [71] identified that a 1% increase in NDVI decreased the albedo by −0.003 ± 0.001%, and NDVI change contributed to 53.36% additional increase in net radiation globally. Vegetation greening inevitably modulates the water cycle [32]. Water losses from the land surface to the atmosphere through evapotranspiration, including transpiration from leaves and evaporation from bare ground. Greening increases vegetation transpiration and reduces soil evaporation [72]. To a certain extent, planting trees will enhance the water retention capacity of the surface, but greening-induced ecological water consumption has been found to be the primary cause of streamflow reduction and soil drying [66,73]. HRB, as an economic center, accounts for nearly 10% of the total population in China. Generally, human withdrawals are subtracted from the surface and groundwater. Water scarcity as a consequence of runoff reduction has emerged as an urgent and critical challenge for social and economic development.
In this study, we simulated that if vegetation restoration is not continued in the future (2020–2100), NDVI will continue to rise under SSP245 and SSP585 scenarios. It indicated that if we have no afforestation activities in the future, the vegetation will be greener than the current level. Although afforestation can help slow climate warming by sequestrating carbon, the program and management of ecological conservation and restoration require more thought and trade-offs in terms of water resources and hydrology.

4.3. Limitations

The study presented here has several limitations. First, we did not consider the impact of vapor pressure deficit (VPD) on NDVI and suggest that VPD characteristics can be reflected by precipitation and air temperature. In addition, because the survival rate of the planted trees is difficult to confirm, we simply added up the AAF year by year.
Second, we assumed that there was a linear relationship between NDVI and driving factors to simplify the model. The possible non-linear relationship and non-linear pattern of NDVI (saturation effect) were ignored. However, due to small biases shown in Figure 5, we hypothesized that the non-linear relationship would not have a significant impact on the conclusions. The bias increased under conditions of increasing NDVI trends, which indicated that the reason for the larger NDVI change was relatively complicated. These biases may be caused by the non-linear relationship and other factors, including constructions of rubber dams and terraces, nitrogen fertilization, changes in crops planted, soil/seed improvement [52], and changes in clouds and aerosols, but elevations about these factors were not incorporated in the study. For example, in mountainous areas, cropland areas have expanded, and water-soil conservation projects (rubber dams and terraces) have reduced water runoff and preserved soil moisture and soil organic carbon, which is also the reason for the increase in greening. In addition, it should be noted that the NDVI trends attributed to CO2 concentration in the model may also be true for these environmental parameters that are increasingly linear [74]. For these terms, more work will be conducted in the future.

5. Conclusions

In this study, we quantified the impact of natural, biogeochemical, and anthropogenic drivers on greenness trends indicated by the NDVI in the HRB region (the most developed areas in China), determined the major factors influencing the variations in NDVIs for each county, and predicted the future NDVI for the 21st century. As expected, more than 85% of the 334 counties considered in our study showed a significant increasing trend, and the trend in 45% of counties was greater than 0.004 per year. In mountainous areas, the growth of NDVI was dependent on CO2 and AAF. CO2 was also the principal driving force for enhancing NDVI in plain areas. Overall, CO2 was the dominant contributor to the greening trend in more than 54% of the counties, and HUM was the driving contributor in over 33% of the counties. Notably, afforestation projects played a crucial role in vegetation greening in mountainous areas, resulting from vegetation restoration activities. We further examined the future NDVI (2020–2100) by applying CMIP6 data under the SSP126, SSP245, and SSP585 scenarios and found that the NDVI will continue to rise due to the elevated CO2 concentration if vegetation restoration is not continued. Vegetation projects have induced a strain on hydrology and water resources, and may exacerbate the water conflict between nature and humans, particularly in developed areas. Therefore, the program and management of ecological conservation and restoration require more thought and trade-offs, even though these strategies can boost carbon sequestration.
Our study provides essential insights into the present vegetation restoration and land-use management programs implemented by the HRB’s local government, and it serves to fulfill the natural sustainability of the region under conditions of elevated CO2 concentrations.

Supplementary Materials

The following supporting information can be downloaded at: https://www.mdpi.com/article/10.3390/rs14020268/s1. Figure S1: Scatter of correlation coefficient (CC) between mean NDVI and (a) Pre: precipitation; (b) Tem: air temperature; (c) Rad: solar radiation; (d) CO2; (e) AAF: afforestation area; (f) NTL: nighttime light at each county. Asterisks indicate p-value < 0.05.

Author Contributions

Conceptualization, W.Y.; methodology, W.Y.; software, W.Y.; validation, W.Y.; formal analysis, W.Y.; investigation, W.Y.; resources, W.Y.; data curation, B.G.; writing—original draft preparation, W.Y.; writing—review and editing, Q.W.; visualization, W.Y.; supervision, Y.Z.; project administration, Y.Z.; funding acquisition, Y.Z. All authors have read and agreed to the published version of the manuscript.

Funding

This research was funded by National Key Research and Development Program of China (2021YFC3200204) and National Science Foundation for Young Scientists of China (52025093).

Data Availability Statement

All data for this paper are properly cited and referred to in the reference list.

Conflicts of Interest

The authors declare no conflict of interest.

References

  1. Xie, S.; Mo, X.; Hu, S.; Liu, S. Contributions of climate change, elevated atmospheric CO2 and human activities to ET and GPP trends in the Three-North Region of China. Agric. For. Meteorol. 2020, 295, 108183. [Google Scholar] [CrossRef]
  2. Ehbrecht, M.; Seidel, D.; Annighofer, P.; Kreft, H.; Kohler, M.; Zemp, D.C.; Puettmann, K.; Nilus, R.; Babweteera, F.; Willim, K.; et al. Global patterns and climatic controls of forest structural complexity. Nat. Commun. 2021, 12, 519. [Google Scholar] [CrossRef] [PubMed]
  3. Luo, Y.; Yang, Y.; Yang, D.; Zhang, S. Quantifying the impact of vegetation changes on global terrestrial runoff using the Budyko framework. J. Hydrol. 2020, 590, 125389. [Google Scholar] [CrossRef]
  4. Lei, H.; Yang, D.; Huang, M. Impacts of climate change and vegetation dynamics on runoff in the mountainous region of the Haihe River basin in the past five decades. J. Hydrol. 2014, 511, 786–799. [Google Scholar] [CrossRef]
  5. Feng, X.; Fu, B.; Piao, S.; Wang, S.; Ciais, P.; Zeng, Z.; Lü, Y.; Zeng, Y.; Li, Y.; Jiang, X.; et al. Revegetation in China’s Loess Plateau is approaching sustainable water resource limits. Nat. Clim. Chang. 2016, 6, 1019–1022. [Google Scholar] [CrossRef]
  6. Zeng, Z.; Piao, S.; Li, L.Z.X.; Zhou, L.; Ciais, P.; Wang, T.; Li, Y.; Lian, X.; Wood, E.F.; Friedlingstein, P.; et al. Climate mitigation from vegetation biophysical feedbacks during the past three decades. Nat. Clim. Chang. 2017, 7, 432–436. [Google Scholar] [CrossRef]
  7. Piao, S.; Wang, X.; Park, T.; Chen, C.; Lian, X.; He, Y.; Bjerke, J.W.; Chen, A.; Ciais, P.; Tømmervik, H.; et al. Characteristics, drivers and feedbacks of global greening. Nat. Rev. Earth Environ. 2019, 1, 14–27. [Google Scholar] [CrossRef]
  8. Zhang, Y.; Song, C.; Band, L.E.; Sun, G.; Li, J. Reanalysis of global terrestrial vegetation trends from MODIS products: Browning or greening? Remote Sens. Environ. 2017, 191, 145–155. [Google Scholar] [CrossRef] [Green Version]
  9. Chen, C.; Park, T.; Wang, X.; Piao, S.; Xu, B.; Chaturvedi, R.K.; Fuchs, R.; Brovkin, V.; Ciais, P.; Fensholt, R.; et al. China and India lead in greening of the world through land-use management. Nat. Sustain. 2019, 2, 122–129. [Google Scholar] [CrossRef]
  10. Li, W.; Tan, M. Influences of vertical differences in population emigration on mountainous vegetation greenness: A case study in the Taihang Mountains. Sci. Rep. 2018, 8, 16954. [Google Scholar] [CrossRef]
  11. Jiang, L.; Guli, J.; Bao, A.; Guo, H.; Ndayisaba, F. Vegetation dynamics and responses to climate change and human activities in Central Asia. Sci. Total Environ. 2017, 599–600, 967–980. [Google Scholar] [CrossRef] [PubMed]
  12. Álvarez-Martínez, J.M.; Suárez-Seoane, S.; Stoorvogel, J.J.; de Luis Calabuig, E. Influence of land use and climate on recent forest expansion: A case study in the Eurosiberian–Mediterranean limit of north-west Spain. J. Ecol. 2014, 102, 905–919. [Google Scholar] [CrossRef] [Green Version]
  13. Li, P.; Wang, J.; Liu, M.; Xue, Z.; Bagherzadeh, A.; Liu, M. Spatio-temporal variation characteristics of NDVI and its response to climate on the Loess Plateau from 1985 to 2015. Catena 2021, 203, 105331. [Google Scholar] [CrossRef]
  14. Donohue, R.J.; Roderick, M.L.; McVicar, T.R.; Farquhar, G.D. Impact of CO2 fertilization on maximum foliage cover across the globe’s warm, arid environments. Geophys Res. Lett. 2013, 40, 3031–3035. [Google Scholar] [CrossRef] [Green Version]
  15. Zhu, Z.; Piao, S.; Myneni, R.B.; Huang, M.; Zeng, Z.; Canadell, J.G.; Ciais, P.; Sitch, S.; Friedlingstein, P.; Arneth, A.; et al. Greening of the Earth and its drivers. Nat. Clim. Chang. 2016, 6, 791–795. [Google Scholar] [CrossRef]
  16. IPCC. Climate Change 2021: The Physical Science Basis; Cambridge University Press: Cambridge, UK, 2021. [Google Scholar]
  17. Swann, A.L.S.; Fung, I.Y.; Chiang, J.C.H. Mid-latitude afforestation shifts general circulation and tropical precipitation. Proc. Natl. Acad. Sci. USA 2011, 109, 712–716. [Google Scholar] [CrossRef] [PubMed] [Green Version]
  18. Yang, L.; Shen, F.; Zhang, L.; Cai, Y.; Yi, F.; Zhou, C. Quantifying influences of natural and anthropogenic factors on vegetation changes using structural equation modeling: A case study in Jiangsu Province, China. J. Clean. Prod. 2021, 280, 124330. [Google Scholar] [CrossRef]
  19. Li, X.; Zhou, Y.; Zhao, M.; Zhao, X. A harmonized global nighttime light dataset 1992–2018. Sci. Data 2020, 7, 168. [Google Scholar] [CrossRef]
  20. Zheng, K.; Tan, L.; Sun, Y.; Wu, Y.; Duan, Z.; Xu, Y.; Gao, C. Impacts of climate change and anthropogenic activities on vegetation change: Evidence from typical areas in China. Ecol. Indic. 2021, 126, 107648. [Google Scholar] [CrossRef]
  21. Tian, F.; Liu, L.-Z.; Yang, J.-H.; Wu, J.-J. Vegetation greening in more than 94% of the Yellow River Basin (YRB) region in China during the 21st century caused jointly by warming and anthropogenic activities. Ecol. Indic. 2021, 125, 107479. [Google Scholar] [CrossRef]
  22. Sun, Y.-L.; Shan, M.; Pei, X.-R.; Zhang, X.-K.; Yang, Y.-L. Assessment of the impacts of climate change and human activities on vegetation cover change in the Haihe River basin, China. Phys. Chem. Earth Parts A/B/C 2020, 115, 102834. [Google Scholar] [CrossRef]
  23. Naeem, S.; Zhang, Y.; Zhang, X.; Tian, J.; Abbas, S.; Luo, L.; Kidane Meresa, H. Both Climate and Socioeconomic Drivers Contribute in Vegetation Greening of the Loess Plateau. Sci. Bull. 2021, 66, 1160–1163. [Google Scholar] [CrossRef]
  24. Liu, Y.; Tian, J.; Liu, R.; Ding, L. Influences of Climate Change and Human Activities on NDVI Changes in China. Remote Sens. 2021, 13, 4326. [Google Scholar] [CrossRef]
  25. Zheng, K.; Wei, J.Z.; Pei, J.Y.; Cheng, H.; Zhang, X.L.; Huang, F.Q.; Li, F.M.; Ye, J.S. Impacts of climate change and human activities on grassland vegetation variation in the Chinese Loess Plateau. Sci. Total Environ. 2019, 660, 236–244. [Google Scholar] [CrossRef] [PubMed]
  26. Wen, Z.; Wu, S.; Chen, J.; Lu, M. NDVI indicated long-term interannual changes in vegetation activities and their responses to climatic and anthropogenic factors in the Three Gorges Reservoir Region, China. Sci. Total Environ. 2017, 574, 947–959. [Google Scholar] [CrossRef] [PubMed]
  27. Xu, X.; Yang, D.; Yang, H.; Lei, H. Attribution analysis based on the Budyko hypothesis for detecting the dominant cause of runoff decline in Haihe basin. J. Hydrol. 2014, 510, 530–540. [Google Scholar] [CrossRef]
  28. Wang, S.; Li, Q.; Wang, J. Quantifying the Contributions of Climate Change and Human Activities to the Dramatic Reduction in Runoff in the Taihang Mountain Region, China. Appl. Ecol. Environ. Res. 2021, 19, 119–131. [Google Scholar] [CrossRef]
  29. Bao, Z.; Zhang, J.; Wang, G.; Fu, G.; He, R.; Yan, X.; Jin, J.; Liu, Y.; Zhang, A. Attribution for decreasing streamflow of the Haihe River basin, northern China: Climate variability or human activities? J. Hydrol. 2012, 460–461, 117–129. [Google Scholar] [CrossRef]
  30. Wu, Z.; Wu, J.; Liu, J.; He, B.; Lei, T.; Wang, Q. Increasing terrestrial vegetation activity of ecological restoration program in the Beijing–Tianjin Sand Source Region of China. Ecol. Eng. 2013, 52, 37–50. [Google Scholar] [CrossRef]
  31. Yu, X.; Xie, J.; Jiang, R.; Zhao, Y.; Li, F.; Liang, J.; Wang, Y. Spatiotemporal variation and predictability of vegetation coverage in the Beijing–Tianjin–Hebei metropolitan region, China. Appl. Climatol. 2021, 145, 47–62. [Google Scholar] [CrossRef]
  32. Bai, P.; Liu, X.; Zhang, Y.; Liu, C. Assessing the Impacts of Vegetation Greenness Change on Evapotranspiration and Water Yield in China. Water Resour Res. 2020, 56, 1–20. [Google Scholar] [CrossRef]
  33. Zhou, F.; Bo, Y.; Ciais, P.; Dumas, P.; Tang, Q.; Wang, X.; Liu, J.; Zheng, C.; Polcher, J.; Yin, Z.; et al. Deceleration of China’s human water use and its key drivers. Proc. Natl. Acad. Sci. USA 2020, 117, 7702–7711. [Google Scholar] [CrossRef] [PubMed]
  34. Naeem, S.; Zhang, Y.; Tian, J.; Qamer, F.M.; Latif, A.; Paul, P.K. Quantifying the Impacts of Anthropogenic Activities and Climate Variations on Vegetation Productivity Changes in China from 1985 to 2015. Remote Sens. 2020, 12, 1113. [Google Scholar] [CrossRef] [Green Version]
  35. Kun, Y.; Jie, H. China Meteorological Forcing Dataset (1979–2018). 2019. Available online: https://doi.org/10.11888/AtmosphericPhysics.tpe.249369.file (accessed on 4 December 2021).
  36. He, J.; Yang, K.; Tang, W.; Lu, H.; Qin, J.; Chen, Y.; Li, X. The first high-resolution meteorological forcing dataset for land process studies over China. Sci. Data 2020, 7, 25. [Google Scholar] [CrossRef] [PubMed] [Green Version]
  37. Yang, K.; He, J.; Tang, W.; Qin, J.; Cheng, C.C.K. On downward shortwave and longwave radiations over high altitude regions: Observation and modeling in the Tibetan Plateau. Agric. For. Meteorol. 2010, 150, 38–46. [Google Scholar] [CrossRef]
  38. Li, M.; Liu, X.; Shu, L.; Yin, S.; Wang, L.; Fu, W.; Ma, Y.; Yang, Y.; Sun, F. Variations in surface roughness of heterogeneous surfaces in the Nagqu area of the Tibetan Plateau. Hydrol. Earth Syst. Sci. 2021, 25, 2915–2930. [Google Scholar] [CrossRef]
  39. Yang, W.; Wang, Y.; Liu, X.; Zhao, H.; Shao, R.; Wang, G. Evaluation of the rescaled complementary principle in the estimation of evaporation on the Tibetan Plateau. Sci. Total Environ. 2020, 699, 134367. [Google Scholar] [CrossRef]
  40. Cui, Y.; Jia, L.; Fan, W. Estimation of actual evapotranspiration and its components in an irrigated area by integrating the Shuttleworth-Wallace and surface temperature-vegetation index schemes using the particle swarm optimization algorithm. Agric. For. Meteorol. 2021, 307, 108488. [Google Scholar] [CrossRef]
  41. Hou, J.; Huang, C.; Chen, W.; Zhang, Y. Improving Snow Estimates Through Assimilation of MODIS Fractional Snow Cover Data Using Machine Learning Algorithms and the Common Land Model. Water Resour. Res. 2021, 57, 1–25. [Google Scholar] [CrossRef]
  42. Meng, F.; Huang, L.; Chen, A.; Zhang, Y.; Piao, S. Spring and autumn phenology across the Tibetan Plateau inferred from normalized difference vegetation index and solar-induced chlorophyll fluorescence. Big Earth Data 2021, 5, 182–200. [Google Scholar] [CrossRef]
  43. Elvidge, C.; Baugh, K.E.; Kihn, E.; Kroehl, H.W.; Davis, E.R. Mapping city lights with nighttime data from the DMSP Operational Linescan System. Photogramm. Eng. Rem. S 1997, 63, 727–734. [Google Scholar]
  44. Li, X.; Zhou, Y. A Stepwise Calibration of Global DMSP/OLS Stable Nighttime Light Data (1992–2013). Remote Sens. 2017, 9, 637. [Google Scholar] [CrossRef] [Green Version]
  45. Jacobson, A.R.; Schuldt, K.N.; Miller, J.B.; Oda, T.; Tans, P.; Arlyn, A.; Mund, J.; Ott, L.; Collatz, G.J.; Aalto, T.; et al. CarbonTracker CT2019B. 2020. Available online: https://gml.noaa.gov/ccgg/carbontracker/CT2019B/ (accessed on 4 December 2021).
  46. Kulawik, S.; Wunch, D.; O’Dell, C.; Frankenberg, C.; Reuter, M.; Oda, T.; Chevallier, F.; Sherlock, V.; Buchwitz, M.; Osterman, G.; et al. Consistent evaluation of GOSAT, SCIAMACHY, CarbonTracker, and MACC through comparisons to TCCON. Atmos. Meas. Tech. Discuss. 2015, 8, 6217–6277. [Google Scholar] [CrossRef]
  47. O’Neill, B.C.; Tebaldi, C.; van Vuuren, D.P.; Eyring, V.; Friedlingstein, P.; Hurtt, G.; Knutti, R.; Kriegler, E.; Lamarque, J.-F.; Lowe, J.; et al. The Scenario Model Intercomparison Project (ScenarioMIP) for CMIP6. Geosci. Model. Dev. 2016, 9, 3461–3482. [Google Scholar] [CrossRef] [Green Version]
  48. Change, N.C. The CMIP6 landscape. Nat. Clim. Chang. 2019, 9, 727. [Google Scholar] [CrossRef] [Green Version]
  49. Wang, L.; Li, M.; Wang, J.; Li, X.; Wang, L. An analytical reductionist framework to separate the effects of climate change and human activities on variation in water use efficiency. Sci. Total Environ. 2020, 727, 138306. [Google Scholar] [CrossRef]
  50. Roderick, M.L.; Rotstayn, L.D.; Farquhar, G.D.; Hobbins, M.T. On the attribution of changing pan evaporation. Geophys Res. Lett. 2007, 34, L17403. [Google Scholar] [CrossRef] [Green Version]
  51. Li, J.; Su, Z.; Jiang, J.; Chen, W.; Yu, N.; Li, X.; Xie, J.; Wei, J. Spatial-Temporal Change in Vegetation Cover and Climate Factor Drivers of Variation in the Haihe River Basin 2003–2016. IOP Conf. Ser. Earth Environ. Sci. 2021, 697, 012005. [Google Scholar] [CrossRef]
  52. Zhao, Y.; Sun, R.; Ni, Z. Identification of Natural and Anthropogenic Drivers of Vegetation Change in the Beijing-Tianjin-Hebei Megacity Region. Remote Sens. 2019, 11, 1224. [Google Scholar] [CrossRef] [Green Version]
  53. Lü, Y.; Zhang, L.; Feng, X.; Zeng, Y.; Fu, B.; Yao, X.; Li, J.; Wu, B. Recent ecological transitions in China: Greening, browning and influential factors. Sci. Rep. 2015, 5, 8732. [Google Scholar] [CrossRef]
  54. Wang, M.; Peng, J.; Hu, Y.n.; Du, Y.; Qiu, S.; Zhao, M. Scale consistency for investigating urbanization level, vegetation coverage, and their correlation. Urban. For. Urban. Green. 2021, 59, 126998. [Google Scholar] [CrossRef]
  55. Wang, N.; Du, Y.; Liang, F.; Wang, H.; Yi, J. The spatiotemporal response of China’s vegetation greenness to human socio-economic activities. J. Environ. Manag. 2021, 305, 114304. [Google Scholar] [CrossRef] [PubMed]
  56. Jenerette, G.D.; Harlan, S.L.; Brazel, A.; Jones, N.; Larsen, L.; Stefanov, W.L. Regional relationships between surface temperature, vegetation, and human settlement in a rapidly urbanizing ecosystem. Landsc. Ecol. 2006, 22, 353–365. [Google Scholar] [CrossRef]
  57. Zhang, D.; Sun, S.; Measho, S. Vegetation dynamics and their drivers in the Haihe river basin, Northern China, 1982–2012. Geocarto Int. 2020, 37, 35–51. [Google Scholar] [CrossRef]
  58. Keenan, T.F.; Hollinger, D.Y.; Bohrer, G.; Dragoni, D.; Munger, J.W.; Schmid, H.P.; Richardson, A.D. Increase in forest water-use efficiency as atmospheric carbon dioxide concentrations rise. Nature 2013, 499, 324–327. [Google Scholar] [CrossRef]
  59. Winkler, A.; Myneni, R.; Hannart, A.; Sitch, S.; Haverd, V.; Lombardozzi, D.; Arora, V.; Pongratz, J.; Nabel, J.; Goll, D.; et al. Slow-down of the greening trend in natural vegetation with further rise in atmospheric CO2. Biogeosci. Discuss. 2021, 1–35. [Google Scholar] [CrossRef]
  60. Wang, S.; Zhang, Y.; Ju, W.; Chen Jing, M.; Ciais, P.; Cescatti, A.; Sardans, J.; Janssens Ivan, A.; Wu, M.; Berry Joseph, A.; et al. Recent global decline of CO2 fertilization effects on vegetation photosynthesis. Science 2020, 370, 1295–1300. [Google Scholar] [CrossRef] [PubMed]
  61. Sang, Y.; Huang, L.; Wang, X.; Keenan Trevor, F.; Wang, C.; He, Y. Comment on “Recent global decline of CO2 fertilization effects on vegetation photosynthesis”. Science 2021, 373, eabg4420. [Google Scholar] [CrossRef]
  62. Chen, S.; Zhang, Y.; Wu, Q.; Liu, S.; Song, C.; Xiao, J.; Band, L.E.; Vose, J.M. Vegetation structural change and CO2 fertilization more than offset gross primary production decline caused by reduced solar radiation in China. Agric. For. Meteorol. 2021, 296, 108207. [Google Scholar] [CrossRef]
  63. Liu, W.; Mo, X.; Liu, S.; Lin, Z.; Lv, C. Attributing the changes of grass growth, water consumed and water use efficiency over the Tibetan Plateau. J. Hydrol. 2021, 598, 126464. [Google Scholar] [CrossRef]
  64. Pang, X.; Lei, H.; Cong, Z.; Yang, H.; Duan, L.; Yang, D. Long term variation of evapotranspiration and water balance based on upscaling eddy covariance observations over the temperate semi-arid grassland of China. Agric. For. Meteorol. 2021, 308–309, 108566. [Google Scholar] [CrossRef]
  65. Tong, X.; Brandt, M.; Yue, Y.; Horion, S.; Wang, K.; Keersmaecker, W.D.; Tian, F.; Schurgers, G.; Xiao, X.; Luo, Y.; et al. Increased vegetation growth and carbon stock in China karst via ecological engineering. Nat. Sustain. 2018, 1, 44–50. [Google Scholar] [CrossRef]
  66. Wang, S.; Fu, B.; Piao, S.; Lü, Y.; Ciais, P.; Feng, X.; Wang, Y. Reduced sediment transport in the Yellow River due to anthropogenic changes. Nat. Geosci. 2016, 9, 38–41. [Google Scholar] [CrossRef]
  67. Peng, S.-S.; Piao, S.; Zeng, Z.; Ciais, P.; Zhou, L.; Li, L.Z.X.; Myneni, R.B.; Yin, Y.; Zeng, H. Afforestation in China cools local land surface temperature. Proc. Natl. Acad. Sci. USA 2014, 111, 2915. [Google Scholar] [CrossRef] [Green Version]
  68. Feng, H.; Zou, B.; Luo, J. Coverage-dependent amplifiers of vegetation change on global water cycle dynamics. J. Hydrol. 2017, 550, 220–229. [Google Scholar] [CrossRef]
  69. Zhang, S.; Yang, D.; Yang, Y.; Piao, S.; Yang, H.; Lei, H.; Fu, B. Excessive Afforestation and Soil Drying on China’s Loess Plateau. J. Geophys. Res. Biogeosci. 2018, 123, 923–935. [Google Scholar] [CrossRef]
  70. Foley, J.; Defries, R.; Asner, G.; Barford, C.; Bonan, G.; Carpenter, S.; Chapin Iii, F.S.; Coe, M.; Daily, G.; Gibbs, H.; et al. Global Consequences of Land Use. Science 2005, 309, 570–574. [Google Scholar] [CrossRef] [Green Version]
  71. Feng, H.; Ye, S.; Zou, B. Contribution of vegetation change to the surface radiation budget: A satellite perspective. Glob. Planet Chang. 2020, 192, 103225. [Google Scholar] [CrossRef]
  72. Zeng, Z.; Peng, L.; Piao, S. Response of terrestrial evapotranspiration to Earth’s greening. Curr. Opin. Environ. Sustain. 2018, 33, 9–25. [Google Scholar] [CrossRef]
  73. Bosch, J.M.; Hewlett, J.D. A review of catchment experiments to determine the effect of vegetation changes on water yield and evapotranspiration. J. Hydrol. 1982, 55, 3–23. [Google Scholar] [CrossRef]
  74. Krakauer, N.; Lakhankar, T.; Anadón, J. Mapping and Attributing Normalized Difference Vegetation Index Trends for Nepal. Remote Sens. 2017, 9, 986. [Google Scholar] [CrossRef] [Green Version]
Figure 1. Location of the study area, along with 334 county boundaries.
Remotesensing 14 00268 g001
Figure 2. (a) Increased normalized difference vegetation index (NDVI) in each county and (b) annual NDVI trends in each county, from 2002 to 2018. The black dots in (b) imply that the trends are statistically significant (p-value < 0.05).
Remotesensing 14 00268 g002
Figure 3. (a) Land cover categorization map of the study area in 2002; (bd) depict the difference in normalized difference vegetation index (NDVI) between 2018 and 2002 for mixed grassland, cropland, and forestland, respectively. The horizontal bar in each panel shows the frequency of each change level. Nodata means there is no corresponding vegetation type in this county.
Remotesensing 14 00268 g003
Figure 4. Interannual linear trends of (a) precipitation rate, Pre; (b) 2-m air temperature, Tem; (c) downward shortwave radiation, Rad; (d) area of afforestation (AAF); (e) nighttime light (NTL); and (f) CO2 from 2002 to 2018. Significant trends indicate p-value < 0.05. The histogram in each panel shows the frequency of various trends, and the negative/positive values represent the decreased/increased trends. White color means no data in this county.
Remotesensing 14 00268 g004
Figure 5. Relationship between observed and estimated slopes of annual normalized difference vegetation index (NDVI) in 334 counties. Inset: changes in bias against observed NDVI trends.
Remotesensing 14 00268 g005
Figure 6. Relative contribution of (A) climate, (B) human activities and (C) CO2 change to NDVI variance. (A) is the sum of (a), (b), and (c), and (B) is the sum of (d) and (e). (D) is a cumulative histogram of each component’s mean values for all counties in each province.
Remotesensing 14 00268 g006
Figure 7. Dominant variable to (a) normalized difference vegetation index (NDVI) increase and (b) NDVI decrease. (c) Spatial distribution of driving contributors (CO2: rising CO2, CLI: climate change, and HUM: human activities) to NDVI trends. (d) Fractional area (%) of counties ascribed to different contributors over mountainous and plain areas. The label at the top of the bar is the fraction of counties dominantly driven by each contributor. A postfix ‘+’ indicates a positive effect on NDVI trends, whereas ‘−’ indicates a negative effect.
Remotesensing 14 00268 g007
Figure 8. Future normalized difference vegetation index (NDVI) simulations from CMIP6 scenarios (SSP126, SSP245 and SSP585). Black solid line after 2020 indicates the mean value of NDVI in different models. The gray shaded area indicates the range of NDVI in the scenario.
Remotesensing 14 00268 g008
Table 1. Three major vegetation sets based on MCD12Q1 (IGBP) product.
SetsValueName
Mixed forestland (MF)1–5Evergreen needleleaf forest (ENF), evergreen broadleaf forest (EBF), deciduous needleleaf forest (DNF), deciduous broadleaf forest (DBF) and mixed forest (MF);
Mixed grassland (MG)6–11, 16closed shrublands (CSH), open shrublands (OSH), woody savannas (WSA), savannas (SAV), grasslands (GRA), barren (BRN) and permanent wetlands (PMW);
Mixed cropland (MC)12, 14croplands (CRO) and cropland/natural vegetation mosaic (CRV)
Table 2. Datasets used in this study.
TypeVariablesDatasetOriginal Spatial ResolutionOriginal Temporal ResolutionSource
Land-use/coverMF, MG, MCMCD12Q1 (IGBP)500 myearlyNASA LPDAAC
Vegetation indexNDVIMOD13A1500 m16-dayNASA LPDAAC
Meteorological factorsTem, Pre, RadCMFD0.1°hourlyTPDC
Anthropogenic factorsAFFStatistical yearbooksCountyyearlyNational Bureau of Statistics
NTLDMSP NTL1 kmyearly[19]
Atmospheric CO2 concentrationCO2CarbonTracker3° × 2°monthlyNOAA
Table 3. List of global climate models of CMIP6 used in this study.
Model NameProducerNationGrid Number
BCC-CSM2-MRBeijing climate centerChina160 × 320
CAS-ESM2-0Chinese academy sciencesChina128 × 256
FGOALS-f3-LChinese academy of sciencesChina180 × 288
GFDL-ESM4Geophysical fluid dynamics laboratoryUSA180 × 288
MRI-ESM2-0MRI (meteorological research institute)Japan160 × 320
Publisher’s Note: MDPI stays neutral with regard to jurisdictional claims in published maps and institutional affiliations.

