Article

The Seasonal and Diurnal Variation Characteristics of Soil Moisture at Different Depths from Observational Sites over the Tibetan Plateau

1
China Meteorological Administration Training Centre, Beijing 100081, China
2
State Key Laboratory of Numerical Modeling for Atmospheric Sciences and Geophysical Fluid Dynamics, Institute of Atmospheric Physics, Chinese Academy of Sciences, Beijing 100029, China
3
School of Atmospheric Sciences, Sun Yat-sen University, Zhuhai 519082, China
4
Guangdong Province Key Laboratory for Climate Change and Natural Disaster Studies, Sun Yat-sen University, Zhuhai 519082, China
5
Southern Marine Science and Engineering Guangdong Laboratory (Zhuhai), Zhuhai 519082, China
6
Institute of Plateau Meteorology, China Meteorological Administration, Chengdu 610072, China
*
Author to whom correspondence should be addressed.
Remote Sens. 2022, 14(19), 5010; https://doi.org/10.3390/rs14195010
Submission received: 8 August 2022 / Revised: 17 September 2022 / Accepted: 27 September 2022 / Published: 8 October 2022

Abstract

:
Using observational data of soil moisture from the third Tibetan Plateau Experiment for atmospheric science (TIPEX III), the seasonal and diurnal variations characteristics of soil moisture at different depths of 5–160 cm from seven stations were analyzed, with emphasis on the comparative analysis of the differences of soil moisture between different sites and the differences of the synergistic relationship between soil moisture and temperature. The soil moisture was wet in the southeast and dry in the northwest. The studied sites were Lhari, Biru, Nyainrong, Amdo, Nagqu, Baingoin and Seng-ge Kambab in descending order, according to the soil moisture. The seasonal variation of soil moisture at the different sites showed a significant three-peak structure, which was more obvious in the shallow layer than in the deep layer. The first peak occurred from March to May, which was mainly due to the soil thawing in spring. The other two peaks corresponded to the two rainy seasons in the plateau. Soil moisture was the greatest during this rainy period. The diurnal variations of soil moisture and temperature in Amdo, Nagqu, Nyainrong and Baingoin showed a significant positive correlation in the four seasons. The soil moisture and temperature in Lhari and Biru were significantly positively correlated in winter and spring but negatively correlated in summer and autumn. The profiles of the soil moisture with depth varied greatly at different stations in different seasons. The distribution of soil water content at each observational site did not increase or decrease with depth but showed a certain high aquifer, which might be related to the types of the underlying surface and physical properties of soil. During the summer monsoon period, soil moisture in the shallow layer of 5–10 cm was higher at all observational sites. The spatial distribution of soil moisture in the plateau was more heterogeneous than that in the plain area, and only in the central part of the Tibetan Plateau, the soil moisture varied greatly from site to site. This also indicated that it was unreasonable to only use the soil moisture of several stations to represent the overall soil moisture of the region. The results provided a multi-angle observational basis for the validation of satellite data and parameterization of the numerical model of soil moisture over the Tibetan Plateau.

1. Introduction

The Tibetan Plateau is known as the “roof of the world” and the “third pole of the Earth” and covers about one-quarter of China’s land area, with an average altitude of 4500 m. It is the largest plateau in China and the highest in the world, and the origin of many major rivers in Asia. The Tibetan Plateau has an important impact on the weather and climate of China, Asia and the world. It restricts the basic pattern of atmospheric circulation and its system in East Asia and causes abnormal weather and climate disasters [1,2,3,4,5,6,7,8,9]. The terrain of the Tibetan Plateau is complex, including high mountains (the altitude is above 7000 m) and deep ravines (the altitude is below 3000 m); the surface conditions are diverse, including beaches, meadows, forests, ice and snow. The process of land–air exchange over the heterogeneous underlying surface of the Tibetan Plateau is extremely complex, which brings great difficulties to the correct understanding of atmospheric processes and the accurate prediction of weather and climate processes over the Tibetan Plateau. From May to August 1978, China conducted the first Tibetan Plateau atmospheric scientific experiment. The second Tibetan Plateau atmospheric scientific experiment was conducted to deeply study the process of land–air exchange during the period from May to August 1998. In these experiments, soil temperature and moisture were targeted as important basic observational items, which are essential for the process of land–atmosphere exchange.
Soil moisture is a physical quantity that indicates the degree of soil wetness. It is an important variable in the parameterization scheme of the land surface process. Its variation changes the physical properties of the surface and then affects the energy and water exchange between the earth and the atmosphere. It gradually affects the troposphere through the near-surface and boundary layers and is an important influencing factor on atmospheric circulation and climate change [10,11,12,13,14]. The importance of the role of soil moisture in the climate system is second only to sea surface temperature. For the climate system over land, it even exceeds the role of sea surface temperature [15]. Previous studies have shown that 65% of land precipitation comes from land–surface evaporation, which largely depends on soil moisture [16,17]. Numaguti [18] pointed out through numerical simulations that about 71% of precipitation from June to August near Nagqu came from land evaporation, and the soil water supply for evaporation mainly came from atmospheric precipitation recharge.
The soil in the Qinghai-Tibet Plateau mainly consists of clay loam and loam, and the soil sandiness is enhanced with depth. Due to unique soil characteristics and geographical environment, the variation of soil temperature and humidity in this region is very large [19]. The temporal and spatial variation of soil moisture plays an important role in the water cycle of the Tibetan Plateau, so it is of great significance to study the distribution characteristics of soil temperature and moisture in the Tibetan Plateau. The seasonal variation of soil moisture is mainly affected by soil physical properties and soil water budget. In the seasonal frozen soil environment of the Tibetan Plateau, soil temperature and precipitation have significant effects on soil moisture. In general, in the wet season, soil moisture is significantly affected by local precipitation. If water income is higher than consumption, soil moisture will increase, and vice versa. In the dry season, soil moisture is greatly affected by the intensity of water evaporation caused by soil temperature. Yang et al. [20,21,22,23,24] studied the characteristics of diurnal, annual and spatial changes in soil temperature and moisture in the northern Tibet Plateau by using the data obtained from GAME-Tibet and analyzed the role of the freezing and thawing processes in the dry-wet season transition and the changes in heat distribution. Gao et al. [25] used a SiB2 (Simple Biosphere Mode2) model to simulate surface energy distribution, soil temperature and moisture conditions on the underlying surface of low grassland in northern Tibet and obtained reasonable results. Wang et al. [26], based on the observation results of Tuotuohe station on the northern Tibetan Plateau, showed that changes in soil moisture associated with the freezing and thawing processes were closely related to the transformation of dry and wet seasons and the amount of precipitation in wet seasons on the Tibetan Plateau. Wan et al. [27] analyzed in detail the changes in soil moisture at different time scales at BJ station near Nagqu in the central Qinghai-Tibet Plateau, and the results showed that the changes in soil temperature and moisture were closely related at different time scales. Limited by the lack of observation data, the above studies mainly focused on the analysis of a single site or typical underlying surface, while the comparative study of soil temperature and humidity observation data in different regions of the plateau is very scarce.
Due to the difficult conditions and the scarcity of observation stations in the plateau area, the difficulty of soil temperature and moisture observation and research under the complex terrain of the plateau is much greater than that in other areas. The observation time, space and physical quantities are very limited, and the data are very scarce. Due to the complex topography and underlying surface characteristics of the plateau, the representativeness of the observation stations is limited, as well as the uncertainties of satellite inversion products on the plateau, which restrict our correct understanding of the various characteristics of soil moisture at different time scales on the Tibetan Plateau. In order to compensate for the lack of observational data on the Tibetan Plateau, in 2014, the China Meteorological Administration (CMA), in collaboration with many domestic institutions, launched the third Tibetan Plateau atmospheric scientific experiment. The experimental sites were more widely distributed, and the data were the latest and most comprehensive, which provides us with an important database for the study of land–air energy exchange over the Qinghai-Tibet Plateau. Many significant results have been obtained in the study of land–air energy transport by using this boundary layer observation data [28,29,30,31,32]. Li et al. [33] analyzed the seasonal and diurnal variation characteristics of soil moisture at different depths using 28 stations in Nagqu. However, their analysis was mainly based on the regional average in the Nagqu region, while there was a lack of comparative studies on the differences among stations in different regions of the plateau. Based on the observational data for soil temperature and moisture at different depths from 5–160 cm from the third Tibetan Plateau atmospheric scientific experiment from December 2014 to December 2015, this study analyzed the seasonal variation characteristics of soil moisture at different depths at seven stations on the plateau, focusing on the comparative analysis of the differences in soil moisture at different stations and the differences between the synergistic changes in soil temperature and moisture.

2. Materials and Methods

The data used in this study were soil temperature and moisture data from TIPEX III obtained from December 2014 to December 2015. The boundary layer observatories were obtained in Amdo, Seng-ge Kambab, Baingoin, Biru, Lhari, Nyingchi, Namco, Nagqu and Nyainrong over the Tibetan Plateau. It should be noted that the Nyingchi and Namco stations were excluded from our study after the data quality control steps were completed. Therefore, Amdo, Nagqu, Nyainrong, Baingoin, Biru, Lhari and Seng-ge Kambab were finally selected for analysis in this study. These seven observational sites are mainly distributed in the western and central part of the Tibetan Plateau, with the latest data and relatively complete observations of meteorological elements, which provides an important database for studying the characteristics of soil temperature and moisture in the Tibetan Plateau. The vertical depths of soil temperature and moisture in Amdo and Nagqu stations were 5, 10, 20, 40, 80 and 160 cm. The available vertical depths of Biru, Lhari and Baingoin stations were 5, 10, 20, 40 and 100 cm. Those of Nyainrong station were 5, 10, 20, 50 and 100 cm, with those of Seng-ge Kambab station at 5, 10, 20, 40 and 80 cm. The soil moisture sensors were CAMPBELL CS616 (Campbell Scientific, Inc., Logan, UT, USA), and the soil temperature sensors were CAMPBELL 109 (Campbell Scientific, Inc., Logan, UT, USA). Soil temperature and moisture detectors were placed at 5 or 6 different depths at each observation site. The probes were horizontally inserted at different depths to obtain soil moisture and temperature data. Data were collected every 10 min. For analysis, data were processed as 30 min averages. Soil moisture is the volumetric water content, with the unit cm3/cm3, and the unit of soil temperature is °C. The distribution of observation stations is shown in Figure 1, and the detailed geographic information of observation stations is shown in Table 1.

3. Results

3.1. Seasonal Variation of Soil Moisture

3.1.1. Seasonal Variation of Soil Moisture at Different Observational Sites

Figure 2 shows the time series of daily accumulated precipitation at different stations over the Tibetan Plateau from December 2014 to December 2015. Amdo, Nagqu, Nyainrong, Baingoin, Biru, and Lhari are all located in the central region of the Tibetan Plateau, influenced by the South Asian summer monsoon; summer and autumn are the main flood seasons on the Tibetan Plateau, and the annual precipitation is mostly concentrated from June to September. Seng-ge Kambab is located in the alpine desert area in the western part of the plateau, with very little rainfall, only a few days in the summer. In general, the variation of precipitation in the central plateau was relatively consistent, and there were two rainy seasons. Biru and Lhari are located in the southeast and had the most precipitation; Nyainrong station was the next, then followed by Amdo and Nagqu stations, and Baingoin station had less precipitation. The rainy season started in mid-May in Biru and Lhari and in mid-June in other central stations. The rainy season started one month earlier in Biru and Lhari than in other central stations.
The geographical location of the Biru and Lhari stations is very close, and the precipitation and its variation trends were relatively consistent. The precipitation in Biru and Lhari began to increase in early April, and there was a rainy period from early April to early May, but the rainfall was not large. Biru and Lhari officially entered the rainy season in mid-May. The first rainy season of Biru station lasted from mid-May to mid-July, and the second rainy season lasted from early August to mid-September with abundant rainfall. The rainy seasons in Nyainrong, Amdo, Nagqu and Baingoin were rather consistent, and they officially entered the rainy season in the middle of June. The first rainy season is from mid-June to mid-July, and the second rainy season is from early August to mid-September.
Figure 3 shows the variations in the daily mean soil moisture at different depths and from different observational sites on the plateau from December 2014 to December 2015. The spatial distribution of the soil moisture showed the characteristics of wet in the southeast and dry in the northwest. The soil moisture over the Tibetan Plateau had remarkable seasonal variation. In general, in winter and spring, the shallow soil moisture was small, while the deep soil moisture was large. In summer and autumn, due to the increase in precipitation, soil moisture was greater in the shallow layer and lesser in the deep layer.
In winter and early spring, the soil moisture at different depths was all in the low stage, with a value of less than 0.15 cm3/cm3 most of the time. In winter and early spring, there was mainly solid precipitation in the Qinghai-Tibet Plateau, which had little impact on soil moisture, and the soil moisture was relatively stable.
In April, the soil moisture in all layers increased for the first time, and it reached the first high-value period from early April to the end of May, which was mainly related to the rise of spring temperature and the beginning of melting. Since the soil retained a large amount of water in its frozen state in winter, the soil showed a high water content when it completed ablation. In May, with the rise in temperature, the ice in the soil completely melted, and the precipitation began to rapidly increase. At this time, the soil moisture in all layers rapidly increased. It is worth noting that before the rainy season on the plateau, the soil moisture at each site showed a certain decline in early June (Biru and Lhari in mid-May). This was because the rainy season had not yet begun, and the rainfall was still relatively low, while the incident radiation continued to strengthen and the soil heated faster. Therefore, evaporation in the shallow layer was larger, and the soil water consumption was greater than the water income, which led to the rapid decline of the soil moisture in the shallow layer. This result was consistent with Li et al. [33].
Except for the Seng-ge Kambab station, all the other stations are located in the central region of the Qinghai-Tibet Plateau. They are all affected by the South Asian summer monsoon; three-quarters of the annual average precipitation was concentrated from June to August. Summer and autumn are the main flood seasons on the Qinghai-Tibet Plateau, and with the arrival of the plateau’s rainy season, the soil moisture in the surface layer (5–10 cm) was affected by liquid precipitation, and the soil moisture content rapidly increased, resulting in high soil moisture. On average, there were two peaks of soil moisture in each layer in the flood season, corresponding to the two rainy seasons. Between the two rainy seasons, soil moisture in all layers significantly decreased from the end of July to the beginning of August. This was because, with the end of the first rainy season, all stations were in an intermittent period of precipitation. The precipitation decreased rapidly, and the daily precipitation of each station was less than 5 mm. At this time, the Tibetan Plateau was in the high-temperature period of the year, and the soil evaporation was large, resulting in the rapid decline of soil moisture during this period and the decrease of 5–10 cm depth was the most significant, which was almost equal to the soil moisture in winter and spring. After early October, with the retreat of the summer monsoons over the Tibetan Plateau, the precipitation over the Tibetan Plateau sharply decreased, and the soil moisture significantly decreased correspondingly, entering the attenuation period of soil moisture. By comparing Figure 2 and Figure 3, it can be seen that as the shallow soil melted and stabilized in early April, the plateau entered the wet season, and the seasonal increase of soil moisture caused by soil freezing and thawing in the plateau area was earlier than the start of the plateau rainy season, and the earlier time varied at different stations.
The seasonal variation of soil moisture at different sites showed a significant three-peak structure, which was more obvious in the shallow layer than in the deep layer, and the peak time at different sites was slightly different. The soil moisture at Amdo station began to increase in mid-April, and it reached the first peak period from mid-April to early June, which was mainly related to soil thawing in spring. After entering the rainy season in June, the shallow soil moisture (5–10 cm) showed two significant peak periods from mid-June to mid-July and from early August to mid-September, which was completely consistent with the two rainy seasons of Amdo station. The maximum soil moisture of 5 cm depth at Amdo station in the rainy season was about 0.3 cm3/cm3. The soil moisture at 160 cm depth was the lowest in the rainy season and changed little throughout the year, with a value of about 0.07 cm3/cm3.
The seasonal variation of soil moisture at the Nagqu station was basically the same as that at the Amdo station, but the first peak period of soil moisture occurred from early March to mid-May, which was earlier than that at the Amdo station. This meant that the seasonal increase of soil moisture caused by soil freezing and thawing was earlier than that of the Amdo station. The two high-value periods of soil moisture at Nagqu station in the flood season had good correspondence with the two rainy seasons. The soil moisture at Nagqu station was slightly lower than that at Amdo station, and the maximum soil moisture at 5 cm depth was about 0.25 cm3/cm3. The soil moisture at 80 cm depth fluctuated gently throughout the year, and the value was the smallest, which was about 0.08 cm3/cm3 in flood season.
The high-value period of soil moisture at Nyainrong station was due to soil thawing in spring and occurred from the end of March to the beginning of June. The two high-value periods corresponding to the two rainy seasons were from mid-June to the end of July and from mid-August to the end of September. The soil moisture of Nyainrong was higher than that of the Amdo and Nagqu stations, and the highest soil moisture at 10 cm depth at the Nyainrong station was about 0.34 cm3/cm3 in the rainy season.
The three high-value periods of soil moisture at Baingoin station were from mid-April to mid-May, from mid-June to early July, and from mid-August to mid-September, with little difference in the three peak values. The soil moisture of Baingoin station was lower than that of the Amdo, Nagqu and Nyainrong stations, with the highest value of 0.14 cm3/cm3 at 5 cm deep.
The soil moisture at Biru station was higher than that at Nyainrong, Amdo and Nagqu. The seasonal increase of soil moisture associated with soil freezing and thawing occurred from the end of March to the beginning of May. The two high-value periods associated with the rainy season were from mid-May to mid-July and from mid-August to the end of September, respectively. The maximum value of soil moisture of 5 cm depth can reach 0.4 cm3/cm3 in the rainy seasons.
The soil moisture at Lhari station was higher than that at Biru station, and the variation trend of soil moisture at each layer was consistent. The seasonal increase of soil moisture caused by soil freezing and thawing occurred from the end of March to the middle of May. From the middle of May to the end of June, the soil moisture was in a high-value period, the data from early July to early September were missing, and the soil moisture was still in the high-value period from early to mid-September. The soil moisture at 10 cm deep at the Lhari station was the highest, and the highest value could reach 0.55 cm3/cm3 in the rainy season.
The soil moisture at Seng-ge Kambab was very small, with few fluctuations throughout the year, and the maximum value in the rainy season was only about 0.1 cm3/cm3. The soil moisture increased slightly in mid-June, which was related to the melting of frozen soil. It increased again in mid-July and early August, which was related to a small amount of precipitation in Seng-ge Kambab during these days.
Through the comparative analysis of soil moisture changes at different depths at seven stations (Figure 4), the spatial distribution of soil moisture showed the characteristics of dry in the northwest and wet in the southeast. To be more specific, the stations with soil moisture at 5 and 10 cm deep from large to small were Lhari, Biru, Nyainrong, Amdo, Nagqu, Baingoin and Seng-ge Kambab. Lhari and Biru are located in the southeast, with abundant precipitation, so the soil moisture was the largest, followed by Nyainrong, Amdo and Nagqu; Baingoin is located in the west, with less rainfall and lower soil moisture. Seng-ge Kambab station is located in the alpine desert area in the northwest of the plateau, with very little precipitation, so the soil moisture was very low and stable throughout the year with little fluctuation. Soil moisture at 10 cm depth in Lhari and Nyainrong was higher than that at 5 cm depth but decreased at other sites.
The sites with soil moisture at 20 cm deep from large to small were Lhari, Biru, Amdo, Nagqu, Nyainrong, Seng-ge Kambab and Baingoin. Lhari and Biru were much higher than the other sites. The soil moisture in Nyainrong, Amdo and Nagqu decreased very fast. The soil moisture at Nyainrong dropped to less than that at Amdo and Nagqu, and the soil moisture at Baingoin dropped to less than that at Amdo station. The sequence of sites with soil moisture from large to small at 40 cm deep was the same as that at 20 cm deep; Seng-ge Kambab and Baingoin were the smallest and remained stable throughout the year with almost no change. Nyainrong station had no observation data at a depth of 40 cm.
In terms of spatial distribution, soil moisture decreased from the southeast to the northwest. More specifically, the sites with soil moisture of 5 and 10 cm deep from large to small were Lhari, Biru, Nyainrong, Amdo, Nagqu, Baingoin and Seng-ge Kambab. Except for the Seng-ge Kambab station, the seasonal variation of soil moisture at other sites showed the characteristics of three peaks, which were more obvious in the shallow layer than in the deep layer. The first high-value period occurred from March to May, which was mainly related to the seasonal thawing of soil caused by the rising temperatures in spring. Summer and autumn are the main rainy seasons on the plateau, and there were two obvious high-value periods of soil moisture which corresponded to the two rainy seasons. During this period, the soil moisture was the greatest, reaching the highest value of the whole year. It should be noted that due to the different geographical locations, the period of concentrated precipitation at different sites was slightly different, so the period of a high value of soil moisture was also different. In particular, the rainy season started in mid-May in Lhari and Biru and in mid-June in other central stations. The rainy season started one month earlier in Lhari and Biru than in other central stations. Therefore, the first peak period of soil moisture in flood season at Lhari and Biru stations was one month earlier than that at other central stations.
In addition, Lhari and Biru stations are located to the southeast and are the wettest, so the frozen soil held much more water in winter than the other stations, and the water content of the soil rose very high when the soil was completely melted. Therefore, the seasonal increase of soil moisture caused by soil freezing and thawing in the Lhari and Biru stations was much larger than that in other stations. The soil moisture in Biru station after soil ablation was almost the same as that in flood season, while that in Lhari station was slightly lower than that in flood season.
The seasonal increase of soil moisture caused by soil freezing and thawing was 1–2 months earlier than the beginning of summer precipitation over the plateau, indicating that in spring, with the increase in temperature, the soil melted, the soil water content increased, and the soil moisture was transmitted to the atmosphere through surface evapotranspiration. Therefore, the atmospheric humidity increased, providing favorable water vapor conditions for the occurrence of precipitation on the plateau, and the plateau entered the wet season. This also indicated that during the transition from the dry season to the wet season, the contribution of soil moisture to precipitation could not be ignored. From April to May, soil moisture transferred water to the atmosphere through evaporation, which provided important conditions for the outbreak of the summer monsoon, thus affecting the time of seasonal transition over the Qinghai-Tibet Plateau.

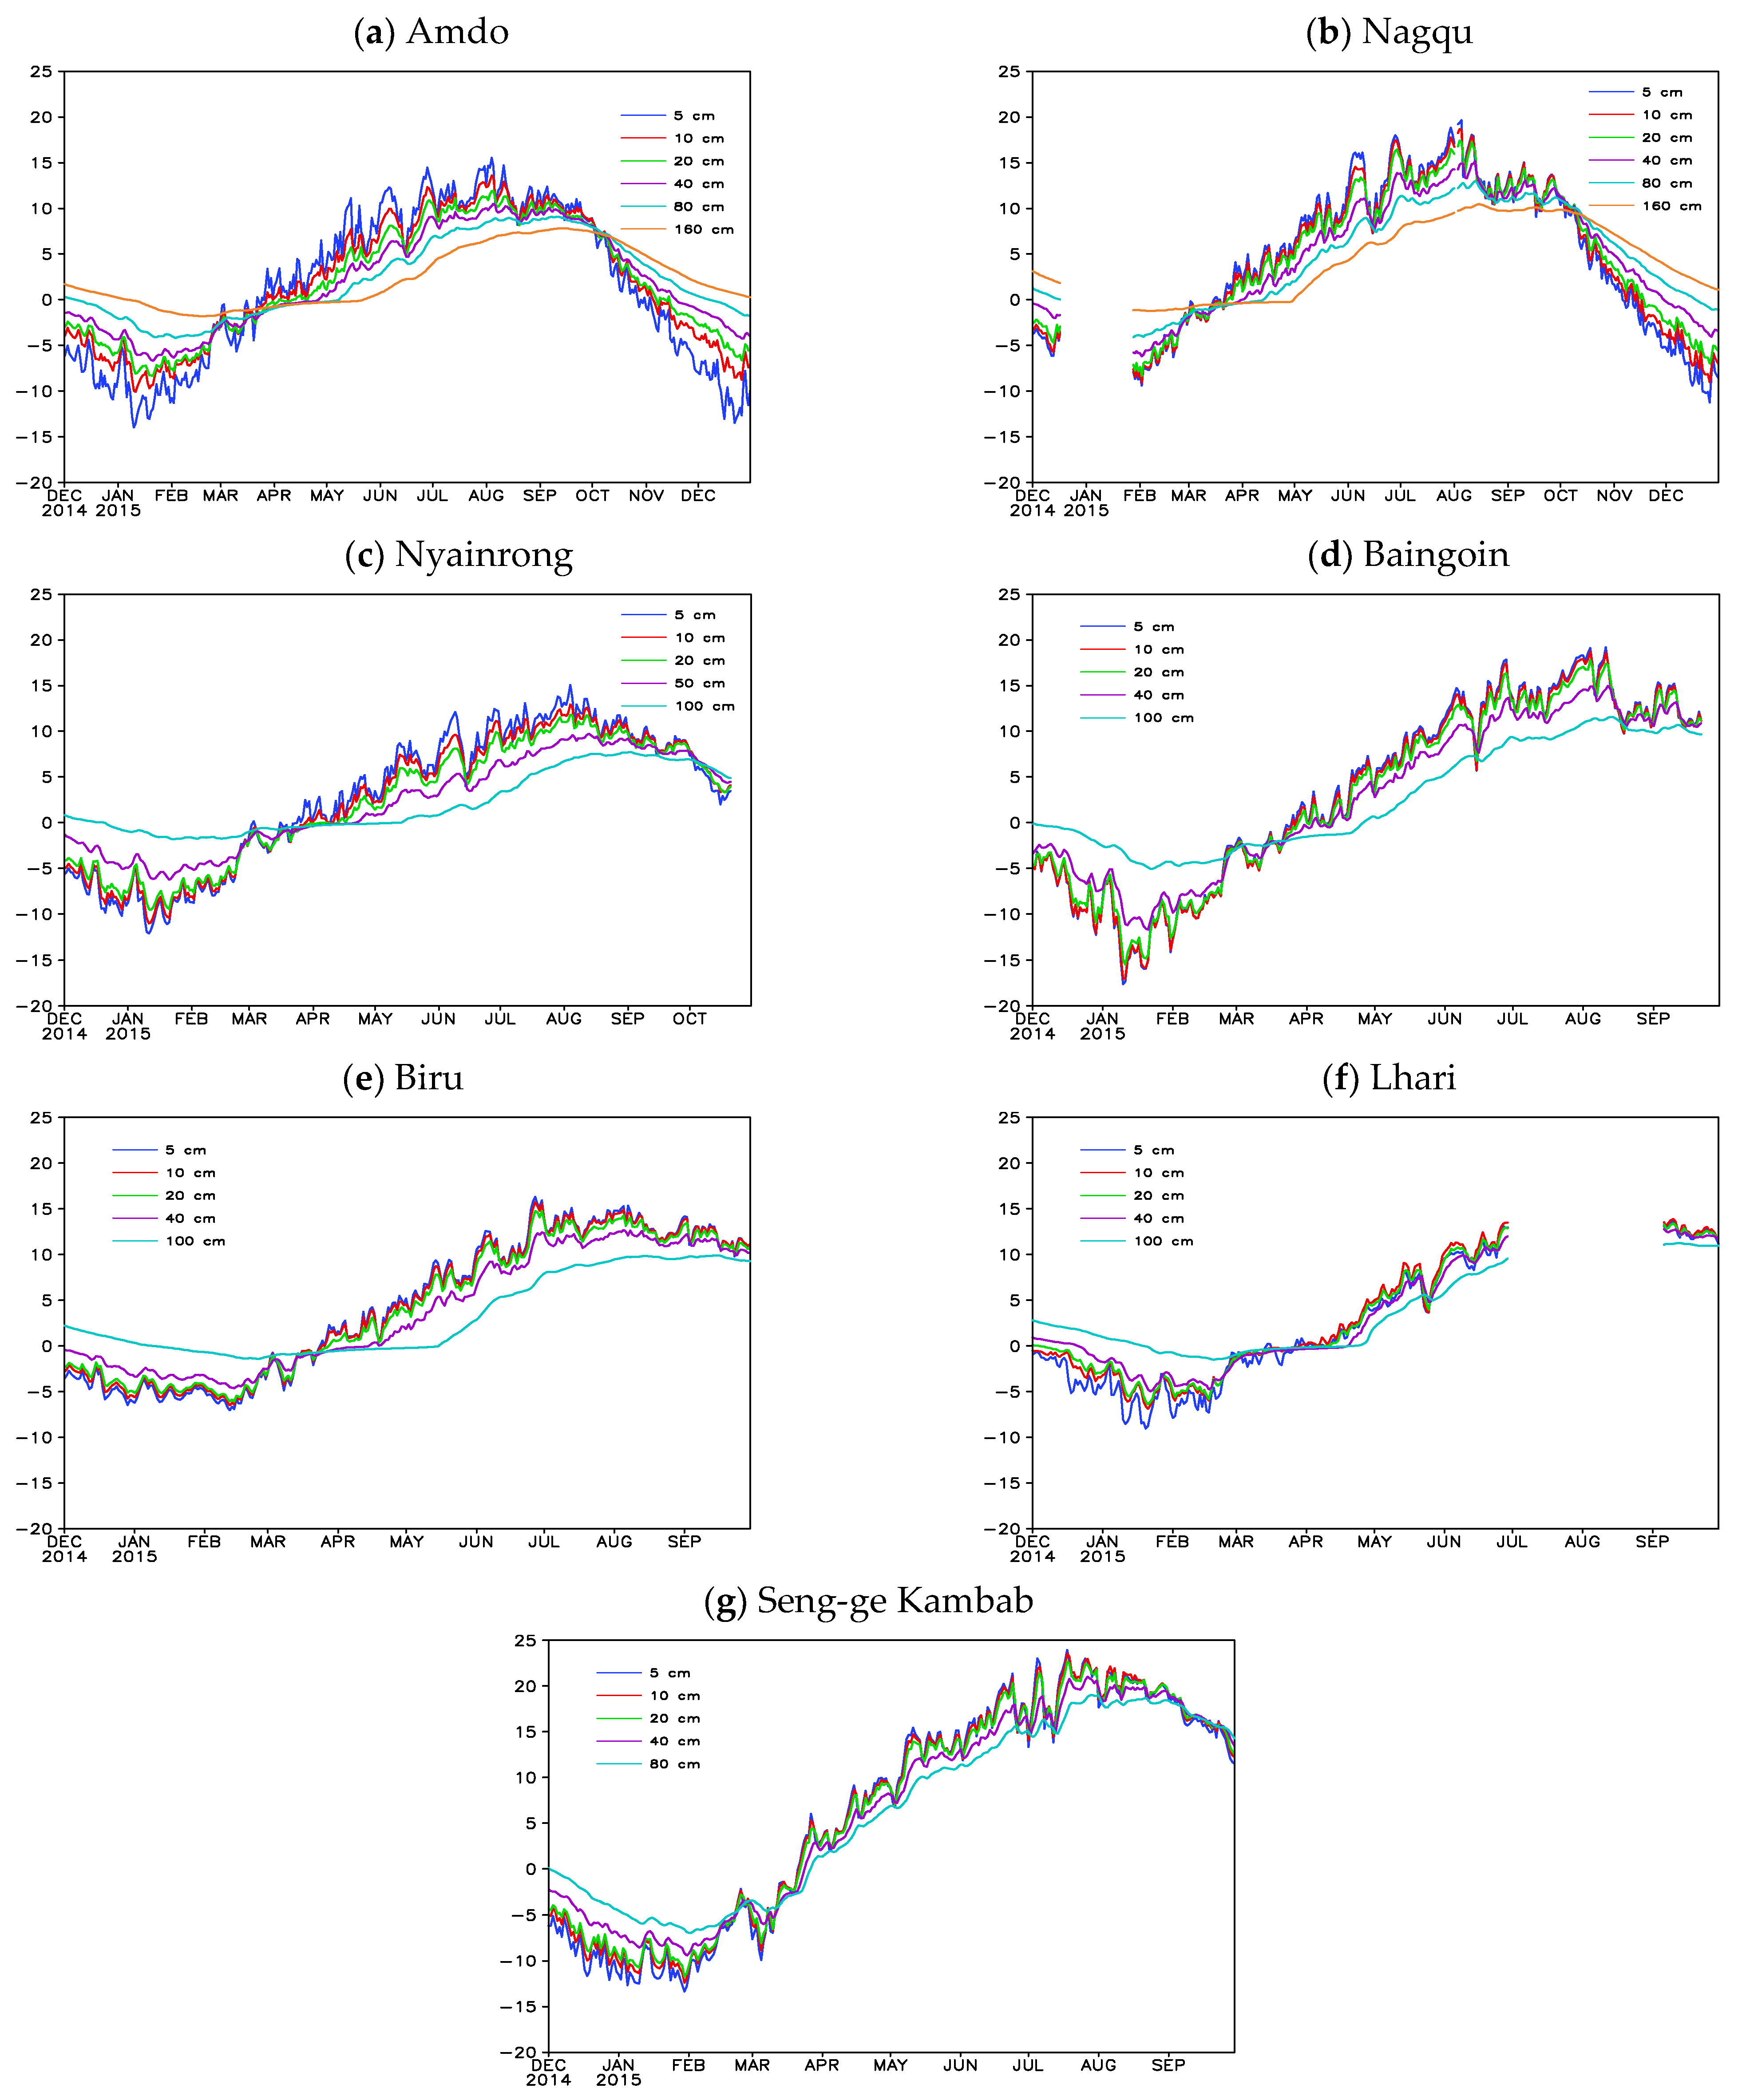
3.1.2. Seasonal Variation of Soil Temperature at Different Observational Sites

Since the soil on the Tibetan Plateau is frozen for a long time in a year, soil moisture has significant seasonal variation. Soil freezing is the response of soil moisture to soil temperature, and soil water will have phase transformation within a certain range of soil temperature, causing changes in soil moisture. In addition, the surface will evaporate under the heating of solar radiation, which will affect the change in soil temperature.
Figure 5 shows the variation of daily mean soil temperature of different sites at different depths on the plateau. The seasonal variation of soil temperature in each layer was significant. It was frozen from early November to the end of March of the next year, and the temperature was the lowest in mid-January. It is worth noting that the soil freezing time obtained in this study is about 5 months, which is 1 month less than the freezing time obtained in previous studies based on the northern Tibetan Plateau, which may be related to the significant warming of northern China in recent years [24,26]. Taking Amdo station as an example, the soil temperature at 5 cm deep reached the lowest value in January, which was −14 °C, and the temperature in the freezing period increased with depth. Thawing began at the end of March, and the soil temperature reached the maximum temperature from July to August, and the maximum temperature of the soil at 5 cm deep reached 15 °C. In the non-freezing period, the soil temperature decreased with depth. The changing trend of soil temperature above 40 cm deep was basically the same, and the fluctuation was obvious. The seasonal variation amplitude of soil temperature at 5 cm deep in the surface layer was the largest, and with the deepening of the depth, the seasonal variation amplitude of soil temperature gradually decreased. The seasonal fluctuation amplitude of soil temperature at 160 cm deep was the smallest, and the freezing time was shorter. The effects of solar radiation and water evaporation on soil temperature gradually decreased with the depth.
The seasonal variation trend of the soil temperature at different depths at the seven stations was quite consistent. Seng-ge Kambab station had the largest seasonal variation, and Biru station had the smallest. The soil temperature reached the lowest in mid-January, and the temperature from low to high was Baingoin, Amdo, Seng-ge Kambab, Nyainrong, Lhari and Biru. In summer, the soil temperature from high to low was Seng-ge Kambab, Nagqu, Baingoin, Biru, Lhari, Amdo and Nyainrong. During the freezing period, the soil temperature increased with depth, while the soil temperature in summer decreased with depth. As the soil temperature was affected by solar radiation and water evaporation, this effect gradually decreased with depth. Therefore, the fluctuation of soil temperature was the largest at 5 cm depth, and with the deepening of the depth, the fluctuation amplitude gradually decreased (Figure 6).

3.2. Relationship between the Diurnal Variation of Soil Moisture and Soil Temperature

Amdo, Nagqu, Nyainrong and Baingoin are located in the northern part of the central plateau, and their geographical positions are very close to each other. Therefore, the relationship between the diurnal variation of soil temperature and moisture at these four stations was quite consistent, and there was a significant positive correlation between the four seasons (see Figure 7, Amdo station). The maximum correlation coefficient between soil moisture and temperature in Amdo and Nagqu occurred in the summer but was relatively small in autumn. The correlation coefficient between soil moisture and temperature of Nyainrong station was the largest in winter and weaker in autumn. The correlation coefficient of the Nyainrong site was at the maximum in winter and weak in autumn. The soil temperature and moisture at Baingoin station were significantly positively correlated in four seasons (figure omitted).
Figure 7 shows the fitting relationship between the mean diurnal variation of soil temperature and moisture at 5 cm deep at the Amdo station in winter (December–February), spring (March–May), summer (June–August) and autumn (September). As can be seen from the figure, there was a significant positive correlation between soil moisture and temperature in the four seasons at Amdo station, with the highest correlation coefficient of 0.988 in summer, and a relatively small correlation coefficient of 0.699 in autumn, both of which have passed a 99% reliability test. In the winter and spring, there were frequent melting and freezing processes on the soil surface, which affected the diurnal variation of soil temperature and moisture, and the soil moisture w sensitive to the change in soil temperature. In winter, spring and autumn, it was mainly affected by incident radiation. During the day, the temperature of the soil surface was heated by radiation and began to rise in the morning and reached a peak in the afternoon. With the rise in soil temperature, the frozen water partially melted during the day, and the upper soil moisture gradually increased in the morning and reached the maximum in the afternoon. Then, as the incident radiation decreased, the soil temperature dropped, the surface layer cooled at night, and the melted water froze; the soil moisture also slowly decreased.
The correlation between the diurnal variation of soil temperature and moisture in the Lhari and Biru stations was basically the same. In winter and spring, soil moisture and soil temperature were positively correlated. However, there was a significant negative correlation between summer and autumn (autumn here is only in September) (see Figure 8 for Lhari station). The negative correlation of the Lhari station in winter and autumn was much more significant than that of the Biru station, and the correlation coefficients were as high as −0.943 and −0.967, respectively, both of which have passed a 99% reliability test. The relationship between the diurnal changes in soil temperature and moisture at the Lhari and Biru stations in summer and autumn was opposite to that at the above four stations. This was because Lhari and Biru stations are located in the south of the central plateau, and the precipitation in summer and autumn is more abundant than that in other stations. The surface soil water is liquid. The soil moisture is sensitive to precipitation and is relatively less affected by incident radiation. As the surface soil is relatively wet, evaporation increases with the increase of soil temperature, resulting in a significant decrease in surface soil moisture.
At the Seng-ge Kambab station, there was a significant positive correlation between soil moisture and soil temperature in winter and spring, a significant negative correlation in summer, and little correlation in autumn. Seng-ge Kambab is located in the western part of the plateau, with little precipitation. Therefore, in summer, the soil temperature was higher than that of the other stations. With the increase in soil temperature, evaporation was very great, and the surface soil moisture significantly decreased (figure omitted).

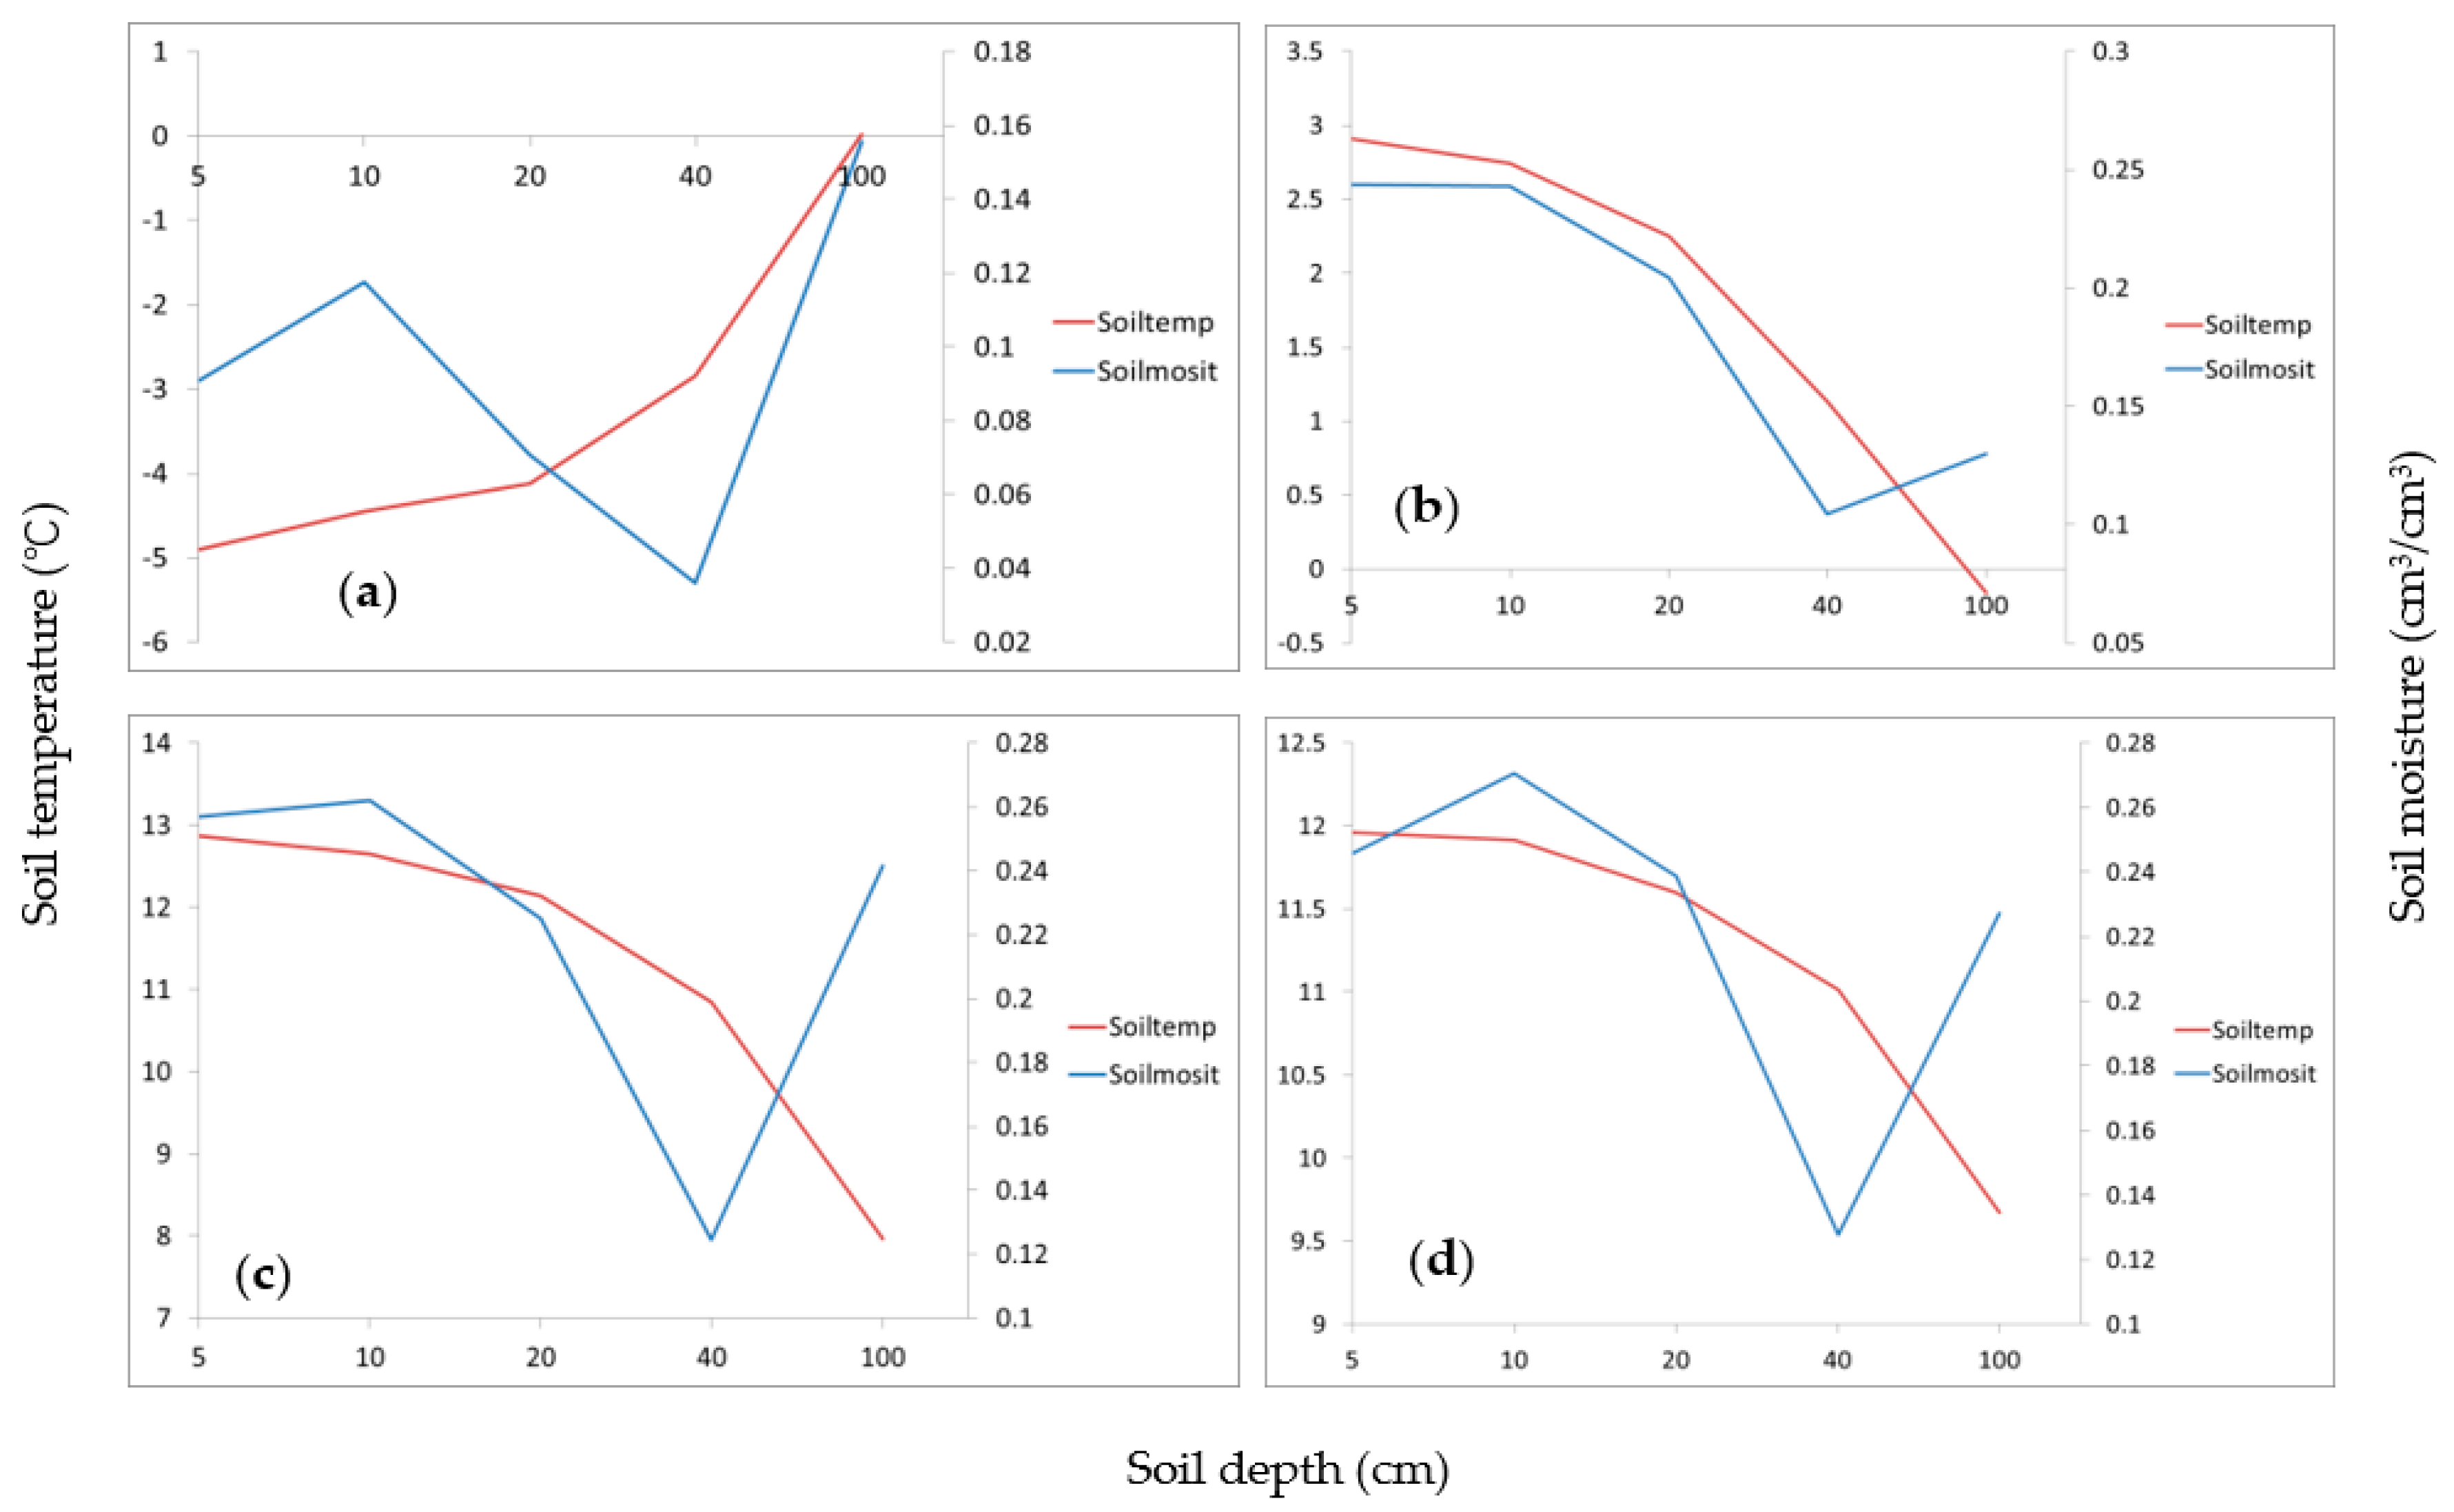
3.3. Vertical Distribution of Soil Moisture and Soil Temperature

Figure 9 shows the vertical profiles of averaged soil temperature and soil moisture in four seasons at Amdo station. In winter, the variation of soil moisture with depth at Amdo station presents a step-like change, with the largest soil moisture at a depth of 80 cm, and soil moisture is similar at a depth of 20 cm and 160 cm (Figure 9a). Soil moisture increased with depth from the surface to 80 cm and then began to decrease. At the same time, the soil temperature increased with depth in winter. In spring (Figure 9b), soil moisture also increased first and then decreased with depth, and soil moisture was the highest at 40 cm. While the soil temperature decreased with depth, above 40 cm, soil temperature and moisture inversely changed with depth, while below 40 cm, both had the same change trend with depth. The variation trend of soil moisture in summer and autumn was very consistent (Figure 9c,d), which showed a step-like decline with the deepening of the depth. The soil moisture was the highest at the shallow layer of 5 cm and the lowest at 160 cm. In summer and autumn, the changes in soil temperature and moisture with depth were quite consistent; with the deepening of the depth, the soil temperature and moisture both decreased.
The soil moisture at Nagqu station in the winter decreased first and then increased with the depth, and the soil moisture at 160 cm depth was the greatest (Figure 10). In spring, summer and autumn, the soil moisture showed a step-like change, with the soil moisture decreasing first and then increasing. The soil moisture was the greatest at 5 cm depth and the smallest at 80 cm depth. The variation of soil temperature with depth at Nagqu station was consistent with that at Amdo Station.
The vertical changes in soil moisture at the four sites of Nyainrong, Baingoin, Biru, and Lhari were generally consistent. In the four seasons, the soil moisture decreased first and then increased with soil depth. The soil moisture in the four seasons at Nyainrong station was the largest at 10 cm depth, followed by 5 cm, and the smallest at 50 cm (figure omitted). The soil moisture in the four seasons at Baingoin station had the maximum value at 5 cm deep and the minimum value at 40 cm deep (no observations at 50 cm) (figure omitted). In Biru and Lhari, the soil moisture was the greatest at 100 cm in the winter. In spring, summer and autumn, soil moisture was the greatest at 10 cm, followed by 5 cm, and the smallest at 40 cm (see Figure 11, no observations at 50 cm). Seng-ge Kambab station had very little precipitation, so the soil moisture gently changed with depth (figure omitted).
It was concluded that the profiles of soil moisture with depth greatly vary at different stations and in different seasons. Zhang et al. [34] found that the vertical distribution of soil moisture was very complex, and there were both regional and soil texture differences in the vertical distribution. Under the condition of clay loam and loam in the Tibetan Plateau region, the porosity of the soil in different regions greatly varies. Yang and Ma [35] showed that at a depth of 40 cm at the Namco station, 20 cm at the Everest station and 60 cm at the Southeast Tibet station, there was a relatively high aquifer, which was related to the type of underlying surface and physical properties of soil, such as vegetation coverage, soil texture and porosity. In the analysis of this observation data, the difference was also evident. The distribution of soil water content at each observation site did not increase or decrease with depth but showed a certain high aquifer. This distribution had a great influence on the freezing and thawing processes of the soil and the spatial and temporal distribution of soil temperature. During the influential period of the summer monsoon, the soil’s water content at each observation site was higher in the shallow layer of 5–10 cm. This was also consistent with the research results of Yang et al. [23,24].
The vertical changes in soil temperature at the seven stations were basically the same, and they all increased with depth in winter, which meant that the temperature in the deep layer was higher than that in the shallow layer, and the temperature difference between the deep and shallow layers was the largest in winter. In spring, summer and autumn, the soil temperature significantly decreased with soil depth, and the soil temperature of the shallow soil was higher than that of deep soil. The soil temperature in Seng-ge Kambab increased with depth in autumn.

4. Discussion

The heterogeneity of soil moisture on the plateau was greater than that in the plain area. In the center of the plateau, the soil moisture and temperature at different sites show different variation characteristics. Only in the central part of the Qinghai-Tibet Plateau, the soil moisture was wet in the southeast and dry in the northwest, and the spatial heterogeneity was very strong. To be more specific, Lhari and Biru are located in the southeast and had more rainfall, so the soil moisture was the highest. Among them, Lhari station is the most southeast, and the soil moisture was higher than that of Biru station. Then followed by Nyainrong, which is located in the northeast compared to the other stations, and the soil moisture in Amdo and Nagqu stations was relatively lower, and their locations are in the north. Baingoin is located in the west, with less rainfall, and the soil moisture was much smaller than that of other central stations and slightly greater than that of the Seng-ge Kambab station in the northwest. The sites in descending order of soil moisture were Lhari, Biru, Nyainrong, Amdo, Nagqu, Baingoin and Seng-ge Kambab. For the soil moisture of each layer, there were great differences between the different sites, which also showed that it was unreasonable to only use the soil moisture of several stations to represent the entire region. In the climate system model, the freezing and thawing processes related to soil moisture and the calculation of sensible heat play an important role in the simulation results. The differences in soil moisture among different stations also illustrated the necessity of a high-resolution grid for accurately simulating the climate of the Tibetan Plateau.
The vertical distribution of soil moisture in the Qinghai-Tibet Plateau is very complex. The vertical profile of soil moisture is affected not only by regional differences but also by soil properties. Also, the soil porosity greatly varies in different areas. In the analysis of this observation data, the variation profile of soil moisture with depth at different stations in different seasons also showed great differences. For example, the soil moisture at Amdo station reached a maximum of 80 cm deep in winter, 40 cm deep in spring, and 5 cm deep in summer and autumn. The soil moisture at Nagqu station was the highest at 160 cm deep in winter and 5 cm in spring, summer and autumn. The soil moisture at Biru station reached the maximum at 10 cm depth in spring, summer and autumn. The distribution of soil water content at each observation site did not increase nor decrease with depth but showed a certain high aquifer, which was related to the underlying surface and the physical properties of the soil, such as vegetation cover, soil texture and porosity. The differences among different stations are remarkable, which has great guiding significance for the construction and improvement of the parameterization process related to soil properties in the land-surface model. In this study, the seasonal changes and vertical distribution characteristics of soil moisture at different depths from seven stations on the plateau were analyzed and focused on a comparative analysis of the soil moisture differences at different stations, as well as the differences in the relationship between soil temperature and moisture, providing a multi-angle observational basis for satellite data verification and model parameterization.
Also, it was found that there was a significant positive correlation between soil temperature and moisture at 5 cm in the north of the central plateau (Amdo, Nagqu, Nyainrong, Baingoin) in summer, while there was a significant negative correlation between soil temperature and moisture at the southeast of the central plateau (Lhari, Biru). In other words, the relationship between soil temperature and moisture at 5 cm in the “south-north” sites of the central plateau was the opposite in summer. The reason was not clear, which may be related to the amount of precipitation caused by geographical location (less precipitation at the northern site, more precipitation at the southern site), and may also be related to the type of underlying surface and soil texture, which are issues that need further study.
The observational data used in this study were only one-year data, and the relevant conclusions must be verified with longer observation data in the future. Also, due to the limitation of observational data, only September was used to represent autumn in this paper. Due to the large spatio-temporal differences in soil moisture and temperature on the plateau, continuous and in-depth observation and data analysis on a larger spatial and temporal scale is needed in the future to comprehensively reveal the distribution and variation of soil moisture on the plateau.
In recent years, many studies have used the analysis method of coefficient of variation (CV) to describe some significant patterns of mean domain soil moisture content, and in terms of spatial variation, the relation between CV and soil moisture often shows a hysteresis pattern [36,37,38]. In the next step, we will use this method of CV to study whether hysteresis is also observed in this observational data and how that might differ between the different rainfall events. Also, the frequency distribution of CV and temporal mean soil moisture will be analyzed to display the seasonal variations for each soil depth at different observation sites over the Tibetan Plateau.

5. Conclusions

Using the observational data of soil moisture and temperature from the third Tibetan Plateau Experiment for atmospheric science (TIPEX III), the seasonal and diurnal variation characteristics of soil moisture at different depths of 5–160 cm at seven stations in the Qinghai-Tibet Plateau from December 2014 to December 2015 were analyzed. This study focused on the comparative analysis of the variations of soil moisture among different sites, as well as the differences in the synergistic changes between soil moisture and soil temperature at different sites. The conclusions are as follows:
(1)
The spatial distribution of soil moisture showed the characteristics of wet in the southeast and dry in the northwest. More specifically, according to the soil moisture at 5 and 10 cm deep, the studied sites were Lhari, Biru, Nyainrong, Amdo, Nagqu, Baingoin and Seng-ge Kambab in descending order. Lhari and Biru are located in the southeast, and the precipitation was relatively abundant, so the soil moisture was relatively high, followed by Nyainrong, Amdo and Nagqu. Baingoin is located to the west of other central stations and with less rainfall, so the soil moisture was lower. Seng-ge Kambab is located in the alpine desert area in the northwest of the plateau, which was very dry, so the soil moisture was very small with little fluctuation throughout the year.
(2)
The seasonal variation of soil moisture at 5–20 cm depths at all sites showed a significant three-peak structure, with the shallow layer more obvious than the deep layer. The first peak occurred from March to May, which was mainly caused by soil freezing in spring. The other two peaks were closely related to the two rainy seasons in the plateau, and the soil moisture was the highest during this period. Different stations had different rainfall periods, so the period of high soil moisture was slightly different. In particular, the first peak period of soil moisture in flood season at Lhari and Biru stations was one month earlier than that at other central stations. The seasonal increase of soil moisture caused by soil freezing and thawing in the plateau area was 1–2 months earlier than the start of the rainy season in the plateau. Soil moisture was transferred to the atmosphere through evaporation, and the atmospheric humidity increased, which provided favorable water vapor conditions for the beginning of the plateau rainy season.
(3)
The seasonal variation of the soil temperature at different depths was quite consistent. The soil temperature reached the lowest in mid-January, and the stations were Baingoin, Amdo, Seng-ge Kambab, Nyainrong, Lhari and Biru in ascending order, according to soil temperature. In midsummer, they were correspondingly Seng-ge Kambab, Nagqu, Baingoin, Biru, Lhari, Amdo and Nyainrong in descending order.
(4)
The diurnal variation of soil moisture and temperature at Amdo, Nagqu, Nyainrong and Baingoin had the same relationship, which showed a significant positive correlation in the four seasons. In Lhari and Biru stations, the relationship between soil moisture and temperature was basically the same. In winter and spring, soil moisture was positively correlated with soil temperature, while there was a significant negative correlation in summer and autumn, which was contrary to the above four sites. At Seng-ge Kambab station, soil moisture and temperature had a significant positive correlation in winter and spring and a significant negative correlation in summer.
(5)
The profiles of soil moisture with depth varied greatly at different stations in different seasons. The distribution of soil water content at each observational site did not increase or decrease with depth but showed a certain high aquifer, which was related to the underlying surface and physical properties of soil. Under the influence of the summer monsoon, the soil’s water content in the shallow layer of 5–10 cm was higher at all observation sites. The vertical profiles of soil temperature at the seven stations were basically the same, and they all increased with depth in winter. In spring, summer and autumn, soil temperature decreased with depth.

Author Contributions

Conceptualization, H.L. and Z.X.; methodology, H.L.; validation, G.W.; formal analysis, G.W.; data curation, H.L.; writing—original draft preparation, H.L.; writing—review and editing, J.W.; funding acquisition, G.W. All authors have read and agreed to the published version of the manuscript.

Funding

This research was funded by the National Natural Science Foundation of China (grant No. 42030611), the Second Tibetan Plateau Scientific Expedition and Research (STEP) program (grant No. 2019QZKK0103), the National Natural Science Foundation of China (grant No. 91937301), Guangdong Province Key Laboratory for Climate Change and Natural Disaster Studies (Grant 2020B1212060025) and the Innovation Group Project of Southern Marine Science and Engineering Guangdong Laboratory (Zhuhai) (Grant 311021001), the Heavy Rain and Drought-Flood Disasters in Plateau and Basin Key Laboratory of Sichuan Province (SCQXKJYJXMS202116), and the Opening Foundation of Plateau Atmosphere and Environment Key Laboratory of Sichuan Province (grant No. PAEKL-2020-C7).

Data Availability Statement

The data that support the findings of this study are available from the first author upon request (Hongyi Li, lihongyi@cma.gov.cn).

Acknowledgments

The authors appreciate all of the hard work done by researchers attending the third Tibetan Plateau Experiment for atmospheric science (TIPEX III).

Conflicts of Interest

The authors declare that they have no known competing financial interests or personal relationships that could have appeared to influence the work reported in this paper.

References

  1. Ye, D.; Zhang, J. A preliminary experimental simulation on the heating effect of the Tibetan Plateau on the general circulation over Eastern Asia in summer. Sci. Sin. 1974, 17, 397–420. [Google Scholar]
  2. Ye, D.; Gao, Y. Meteorology of the Qinghai-Xizang Plateau; Science Press: Beijing, China, 1979; 278p. [Google Scholar]
  3. Kuo, H.; Qian, Y. Influence of the Tibetan Plateau on cumulative and diurnal changes of weather and climate in summer. Mon. Weather Rev. 1981, 109, 2337–2356. [Google Scholar] [CrossRef]
  4. Zhang, J.; Zhu, B.; Zhu, F.; Weng, D.; Sun, G.; Lü, J.; Peng, Y.; Wang, Y. The Progress Introduction on the Study of Tibetan Plateau Meteorology; Science Press: Beijing, China, 1988; 268p. [Google Scholar]
  5. Qian, Y. Numerical simulation of the effects of underlying surfaces on the climate change. Chin. J. Atmos. Sci. 1993, 17, 283–293. [Google Scholar]
  6. Ji, G.; Gu, B.; Lü, L. Characteristics of atmospheric heating field over northern Qinghai-Xizang Plateau. Plateau Meteorol. 2002, 21, 238–242. [Google Scholar]
  7. Ji, G.; Shi, X.; Gao, W. The variation of surface heating field over Northern Qinghai-Tibet Plateau and its effect on climate. Plateau Meteorol. 2001, 20, 239–244. [Google Scholar]
  8. Wang, C.; Dong, W.; Wei, Z. Study on relationship between the frozen-thaw process in Qinghai-Xizang Plateau and circulation in East-Asia. Chin. J. Geophys. 2003, 46, 309–316. [Google Scholar] [CrossRef]
  9. Wu, G.; Sun, S.; Chen, W. The Impact of Qinghai-Tibet Plateau and Northwest Arid Areas on Climate Disasters; China Meteorological Press: Beijing, China, 2003; 207p. [Google Scholar]
  10. Yeh, T.; Wetherald, R.; Manabe, S. The effect of soil moisture on the short-term climate and hydrology change-a numerical experiment. Mon. Weather Rev. 1984, 112, 474–490. [Google Scholar] [CrossRef]
  11. Liu, Y.; Ye, D.; Ji, J. Effect of soil moisture and vegetation on climate (Ⅰ): Theoretic analysis on short-term climate anomaly persistence. Sci. China (Ser. B) 1992, 22, 441–448. [Google Scholar]
  12. Liu, Y.; Ye, D.; Ji, J. Effect of soil moisture and vegetation on climate (Ⅱ): Numerical experiment on short-term climatic anomaly persistence. Sci. China (Ser. B) 1992, 22, 554–560. [Google Scholar]
  13. Ma, Z.; Fu, C.; Xie, L.; Chen, W.; Tao, S. Some problems in the study on the relationship between soil moisture and climatic change. Adv. Earth Sci. 2001, 16, 563–566. [Google Scholar]
  14. Gao, Y.; Peng, W.; Wang, W. Influence of spring soil and condition on later regional precipitation simulation. J. Glaciol. Geocryol. 2011, 33, 1055–1063. [Google Scholar]
  15. Guo, W.; Ma, Z.; Wang, H. Soil moisture-An important factor of seasonal precipitation prediction and its application. Clim. Environ. Res. 2007, 12, 20–27. [Google Scholar]
  16. Chahine, M. The hydrological cycle and its influence on climate. Nature 1992, 359, 373–380. [Google Scholar] [CrossRef]
  17. Trenberth, K. Atmospheric Moisture Recycling: Role of Advection and Local Evaporation. J. Clim. 1999, 12, 1368–1381. [Google Scholar] [CrossRef]
  18. Numaguti, A. Origin and recycling processes of precipitating water over the Eurasian continent: Experiments using an atmospheric general circulation model. J. Geophys. Res. 1999, 104, 1957–1972. [Google Scholar] [CrossRef]
  19. Zhang, L.; Lü, H.; Wang, L.; Yang, B. Spatial-temporal characteristics of soil moisture in China. Acta Geogr. Sin. 2016, 71, 1494–1508. [Google Scholar]
  20. Yang, M.; Yao, T.; Ding, Y.; Wang, S.; Chen, X.; Toshio, K. The daily variation of the soil temperature in different seasons at site D110 in the Northern Part of Xizang Plateau. Sci. Geogr. Sin. 1999, 19, 570–574. [Google Scholar]
  21. Yang, M.; Yao, T.; Wang, S.; Ding, Y.; Chen, X.; Shen, Y.; Toshio, K. The features of soil temperature and moisture on Northern Tibetan Plateau. Geogr. Res. 1999, 18, 312–317. [Google Scholar]
  22. Yang, M.; Yao, T.; Toshio, K. Variation features of soil temperature in Northern Tibetan Plateau. J. Mt. Sci. 2000, 18, 13–17. [Google Scholar]
  23. Yang, M.; Yao, T.; Gou, X. Distribution features of soil moisture-energy and melting-freezing processes along the Qiinghai-Xizang Road. Prog. Nat. Sci. 2000, 10, 443–450. [Google Scholar]
  24. Yang, M.; Yao, T.; He, Y. The role of soil moisture-energy distribution and melting-freezing processes on seasonal shift in Tibetan Plateau. J. Mt. Sci. 2002, 20, 536–558. [Google Scholar]
  25. Gao, Z.; Chae, N.; Kim, J.; Hong, J.; Choi, T.; Lee, H. Modeling of surface energy partitioning, surface temperature, and soil wetness in the Tibetan prairie using the Simple Biosphere Model2 (SiB2). J. Geophys. Res. 2004, 109, D06102. [Google Scholar] [CrossRef]
  26. Wang, C.; Shang, D. Effect of the variation of the soil temperature and moisture in the transition from dry-season to wet-season over northern Tibet Plateau. Plateau Meteorol. 2007, 26, 677–685. [Google Scholar]
  27. Wan, G.; Yang, M.; Wang, X.; Chen, X. Variations in soil moisture at different time scales of BJ site on the central Tibetan Plateau. Chin. J. Soil Sci. 2012, 43, 286–293. [Google Scholar]
  28. Wang, Y.; Xu, X.; Liu, H.; Li, Y.; Li, Y.; Hu, Z.; Gao, X.; Ma, Y.; Sun, J.; Lenschow, D.H.; et al. Analysis of land surface parameters and turbulence characteristics over the Tibetan Plateau and surrounding region. J. Geophys. Res. Atmos. 2016, 121, 9540–9560. [Google Scholar] [CrossRef]
  29. Zhao, P.; Xu, X.; Chen, F.; Guo, X.; Zheng, X.; Liu, L.; Hong, Y.; Li, Y.; La, Z.; Peng, H.; et al. The third atmospheric scientific experiment for understanding the Earth-Atmosphere coupled system over the Tibetan Plateau and its effects. Bull. Am. Meteor. Soc. 2018. [Google Scholar] [CrossRef]
  30. Zhao, P.; Li, Y.; Guo, X.; Xu, X.; Liu, Y.; Tang, S.; Xiao, W.; Shi, C.; Ma, Y.; Yu, X.; et al. The Tibetan Plateau surface-atmosphere coupling system and its weather and climate effects: The Third Tibetan Plateau Atmospheric Scientific Experiment. Acta Meteorol. Sin. 2018, 76, 833–860. [Google Scholar] [CrossRef]
  31. Li, N.; Zhao, P.; Wang, J.; Deng, Y. Estimation of surface heat fluxes over the central Tibetan Plateau using the maximum entropy production model. J. Geophys. Res. Atmos. 2019, 124, 6827–6840. [Google Scholar] [CrossRef] [Green Version]
  32. Li, N.; Zhao, P.; Wang, J.; Deng, Y. The Long-Term Change of Latent Heat Flux over the Western Tibetan Plateau. Atmosphere 2020, 11, 262. [Google Scholar] [CrossRef] [Green Version]
  33. Li, B.; Zhang, M.; Tang, S.; Dong, L. Variations of Soil moisture over Nagqu at different time scales based on network observations. Acta Meteorol. Sin. Acta 2018, 76, 1040–1052. [Google Scholar]
  34. Zhang, X.; Wu, X. Vertical character of soil moisture in China. Acta Meteorol. Sin. 2004, 62, 51–61. [Google Scholar]
  35. Yang, J.; Ma, Y. Soil Temperature and Moisture Features of Typical Underlying Surface in the Tibetan Plateau. J. Glaciol. Geocryol. 2012, 34, 813–820. [Google Scholar]
  36. Ivanov, V.Y.; Fatichi, S.; Jenerette, G.D.; Espeleta, J.F.; Troch, P.A.; Huxman, T.E. Hysteresis of soil moisture spatial heterogeneity and the “homogenizing” effect of vegetation. Water Resour. Res. 2010, 46, W09521. [Google Scholar] [CrossRef]
  37. Srivastava, A.; Saco, P.M.; Rodriguez, J.F.; Kumari, N.; Chun, K.P.; Yetemen, O. The role of landscape morphology on soil moisture variability in semi-arid ecosystems. Hydrol. Process. 2021, 35, e13990. [Google Scholar] [CrossRef]
  38. Fatichi, S.; Katul, G.G.; Ivanov, V.Y.; Pappas, C.; Paschalis, A.; Consolo, A.; Kim, J.; Burlando, P. Abiotic and biotic controls of soil moisture spatiotemporal variability and the occurrence of hysteresis. Water Resour. Res. 2015, 51, 3505–3524. [Google Scholar] [CrossRef]
Figure 1. Topography of the Tibetan Plateau, with 9 plateau stations denoted by red dots. It should be noted that the Nyingchi and Namco stations were excluded from our study after the data quality control steps were completed.
Remotesensing 14 05010 g001
Figure 2. Daily accumulated precipitation of seven stations over Tibetan Plateau from December 2014 to December 2015 (unit: mm).
Remotesensing 14 05010 g002
Figure 3. Time series of daily mean soil moisture at different depths (unit: cm3/cm3). The lines break in the graphs represents the missing data, the same below.
Remotesensing 14 05010 g003aRemotesensing 14 05010 g003b
Figure 4. Time series of daily mean soil moisture at different depths for the seven observational sites (unit: cm3/cm3).
Remotesensing 14 05010 g004
Figure 5. Time series of daily mean soil temperature at different depths (unit: °C).
Remotesensing 14 05010 g005
Figure 6. Time series of daily mean soil temperature at different depths for the seven observational sites (unit: °C).
Remotesensing 14 05010 g006
Figure 7. Scatter diagrams and linear fitting lines of diurnal variation of soil temperature and moisture at 5 cm deep at Amdo station. (The solid blue lines are the linear fitting line and the numbers next to the black dots represent the time sequence, the data interval is 30 min, from 00:00 to 23:30; there are 48 numbers in total.) (a) Winter (December–February), (b) Spring (March–May), (c) Summer (June–August) and (d) Autumn (September).
Remotesensing 14 05010 g007
Figure 8. Same as Figure 7, but for the Lhari station: (a) winter, (b) spring, (c) summer and (d) autumn.
Remotesensing 14 05010 g008
Figure 9. Profiles of soil temperature (red line) and soil moisture (blue line) at Amdo Station, (a) winter (December–February), (b) spring (March–May), (c) summer (June–August) and (d) autumn (September).
Remotesensing 14 05010 g009
Figure 10. Same as Figure 9, but for the Nagqu station: (a) winter, (b) spring, (c) summer and (d) Autumn.
Remotesensing 14 05010 g010
Figure 11. Same as Figure 9, but for the Biru station. (a) Winter. (b) Spring. (c) Summer. (d) Autumn.
Remotesensing 14 05010 g011
Table 1. Geographical location information of the seven observation sites on the Qinghai-Tibet Plateau.
StationsLocationElevation (m)Plateau Regions
Amdo91.6°E, 32.2°N4695central plateau
Seng-ge Kambab80.1°E, 32.5°N4350northwest plateau
Nyainrong92.3°E, 32.1°N4730central plateau
Baingoin90.1°E, 31.4°N4700central plateau
Biru93.7°E, 31.5°N4408central plateau
Lhari93.2°E,30.7°N4500central plateau
Nagqu91.9°E, 32.4°N4509central plateau
Publisher’s Note: MDPI stays neutral with regard to jurisdictional claims in published maps and institutional affiliations.

