Article

Quantifying Plant Species α-Diversity Using Normalized Difference Vegetation Index and Climate Data in Alpine Grasslands

Lhasa Plateau Ecosystem Research Station, Key Laboratory of Ecosystem Network Observation and Modeling, Institute of Geographic Sciences and Natural Resources Research, Chinese Academy of Sciences, Beijing 100101, China
*
Author to whom correspondence should be addressed.
Remote Sens. 2022, 14(19), 5007; https://doi.org/10.3390/rs14195007
Submission received: 6 September 2022 / Revised: 5 October 2022 / Accepted: 7 October 2022 / Published: 8 October 2022

Abstract

:
Quantitative plant species α-diversity of grasslands at multiple spatial and temporal scales is important for investigating the responses of biodiversity to global change and protecting biodiversity under global change. Potential plant species α-diversity (i.e., SRp, Shannonp, Simpsonp and Pieloup: potential species richness, Shannon index, Simpson index and Pielou index, respectively) were quantified by climate data (i.e., annual temperature, precipitation and radiation) and actual plant species α-diversity (i.e., SRa, Shannona, Simpsona and Pieloua: actual species richness, Shannon index, Simpson index and Pielou index, respectively) were quantified by normalized difference vegetation index and climate data. Six methods (i.e., random forest, generalized boosted regression, artificial neural network, multiple linear regression, support vector machine and recursive regression trees) were used in this study. Overall, the constructed random forest models performed the best among the six algorithms. The simulated plant species α-diversity based on the constructed random forest models can explain no less than 96% variation of the observed plant species α-diversity. The RMSE and relative biases between simulated α-diversity based on the constructed random forest models and observed α-diversity were ≤1.58 and within ±4.49%, respectively. Accordingly, plant species α-diversity can be quantified from the normalized difference vegetation index and climate data using random forest models. The random forest models of plant α-diversity build by this study had enough predicting accuracies, at least for alpine grassland ecosystems, Tibet. The proposed random forest models of plant α-diversity by this current study can help researchers to save time by abandoning plant community field surveys, and facilitate researchers to conduct studies on plant α-diversity over a long-term temporal scale and larger spatial scale under global change.

1. Introduction

Plant species α-diversity, as key components of biodiversity and important characteristics of plant community, can always be represented by species richness (i.e., species numbers), Shannon, Simpson and Pielou [1,2,3,4]. Quantitative plant species α-diversity of grasslands at multiple spatial and temporal scales, as one key aspect of plant diversity-related studies, is important for assessing the responses of biodiversity to global change and protecting biodiversity under global change [5,6,7]. Although there are numerous studies which are related to plant diversity [8,9,10,11,12], some issues are still not resolved. Firstly, on the one hand, with the increasing number of responsibilities in the work of scientists, there are fewer experienced researchers with sufficient knowledge in diagnostics who can supplement the tests performed in the small area system. On the other hand, at present, plant diversity data are mainly collected from field plant community surveys at relatively smaller spatial scales, such as single point scale, vertical transect scale, and horizontal transect scale, but plant diversity data are lacking at the relatively larger spatial scales, such as the whole Tibet scale [1,13,14,15,16]. High-precision models of plant α-diversity are the basis for the plant diversity studies at relatively greater spatial scales. Secondly, compared with vegetation productivity models (e.g., gross/net primary production models of the Moderate Resolution Imaging Spectroradiometer) [17,18,19], plant species diversity models are relatively rare. Thirdly, along with the rapid development of various science and technology including computer science and 3S technology, data mining technology has gradually entered the human field of vision and has played key roles in all walks of life [20,21,22,23,24,25,26,27], which makes it possible for us to quantify massive primary plant α-diversity data from field plant community surveys. However, there are a variety of data mining technologies, such as the models of random forest, generalized boosted regression, artificial neural network, multiple linear regression, support vector machine and recursive regression trees [20,27]. It is still unclear which technology of data mining can be the best model to simulate α-diversity of plants. Accordingly, further studies are needed to find the optimal model of plant α-diversity, and this optimal model can be used to perform studies associated with plant α-diversity at various spatial and temporal scales (e.g., the spatial patterns of plant α-diversity and associated driving factors in alpine grassland ecosystems of the Qinghai-Tibet Plateau).
Actually, several earlier studies have been carried out on the plant α-diversity of alpine grassland ecosystems in Tibet [8,9,11,12,28,29]. These earlier studies can have important guiding significance for the conservation of biodiversity in alpine grassland ecosystems of Tibet and even the world. However, some issues are still not resolved. Firstly, when analyzing the relationships between climate variables and plant species α-diversity, earlier studies mainly discussed the relationships between temperature and precipitation and plant species α-diversity, but lacked the discussions on the relationships between radiation and plant species α-diversity [10,11]. However, some earlier studies have proved that radiation change had stronger influences on nutrition quality of plant community than temperature change and precipitation change in alpine grassland ecosystems of Tibet [20,27]. Meanwhile, plant species α-diversity can be closely correlated with nutrition quality and nutrition production of plant community in alpine grassland ecosystems of Tibet [8,30]. Moreover, plant growth is indeed influenced by radiation, although photoinhibition may occur under relatively higher magnitude radiation in alpine regions of the Qinghai-Tibet Plateau [31,32,33]. These earlier findings imply that radiation can affect plant species α-diversity. Secondly, the random forest model has been proved to be the optimal model in predicting some key plant parameters (e.g., plant nutrition quality and nutrition production) in alpine grassland ecosystems of Tibet by several earlier studies [20,27]. However, it is still unclear whether or not the performance of the random forest model in simulating plant α-diversity is better than other models of data mining in the alpine grassland ecosystems of Tibet. Accordingly, further studies are needed.
Here, plant species α-diversity was quantified from measured normalized difference vegetation index, temperature, precipitation and radiation using six methods of data mining (i.e., random forest, generalized boosted regression, artificial neural network, multiple linear regression, support vector machine and recursive regression trees) in alpine grassland ecosystems of Tibet. The main objective was to compare the performance of the six approaches in terms of plant α-diversity.

2. Materials and Methods
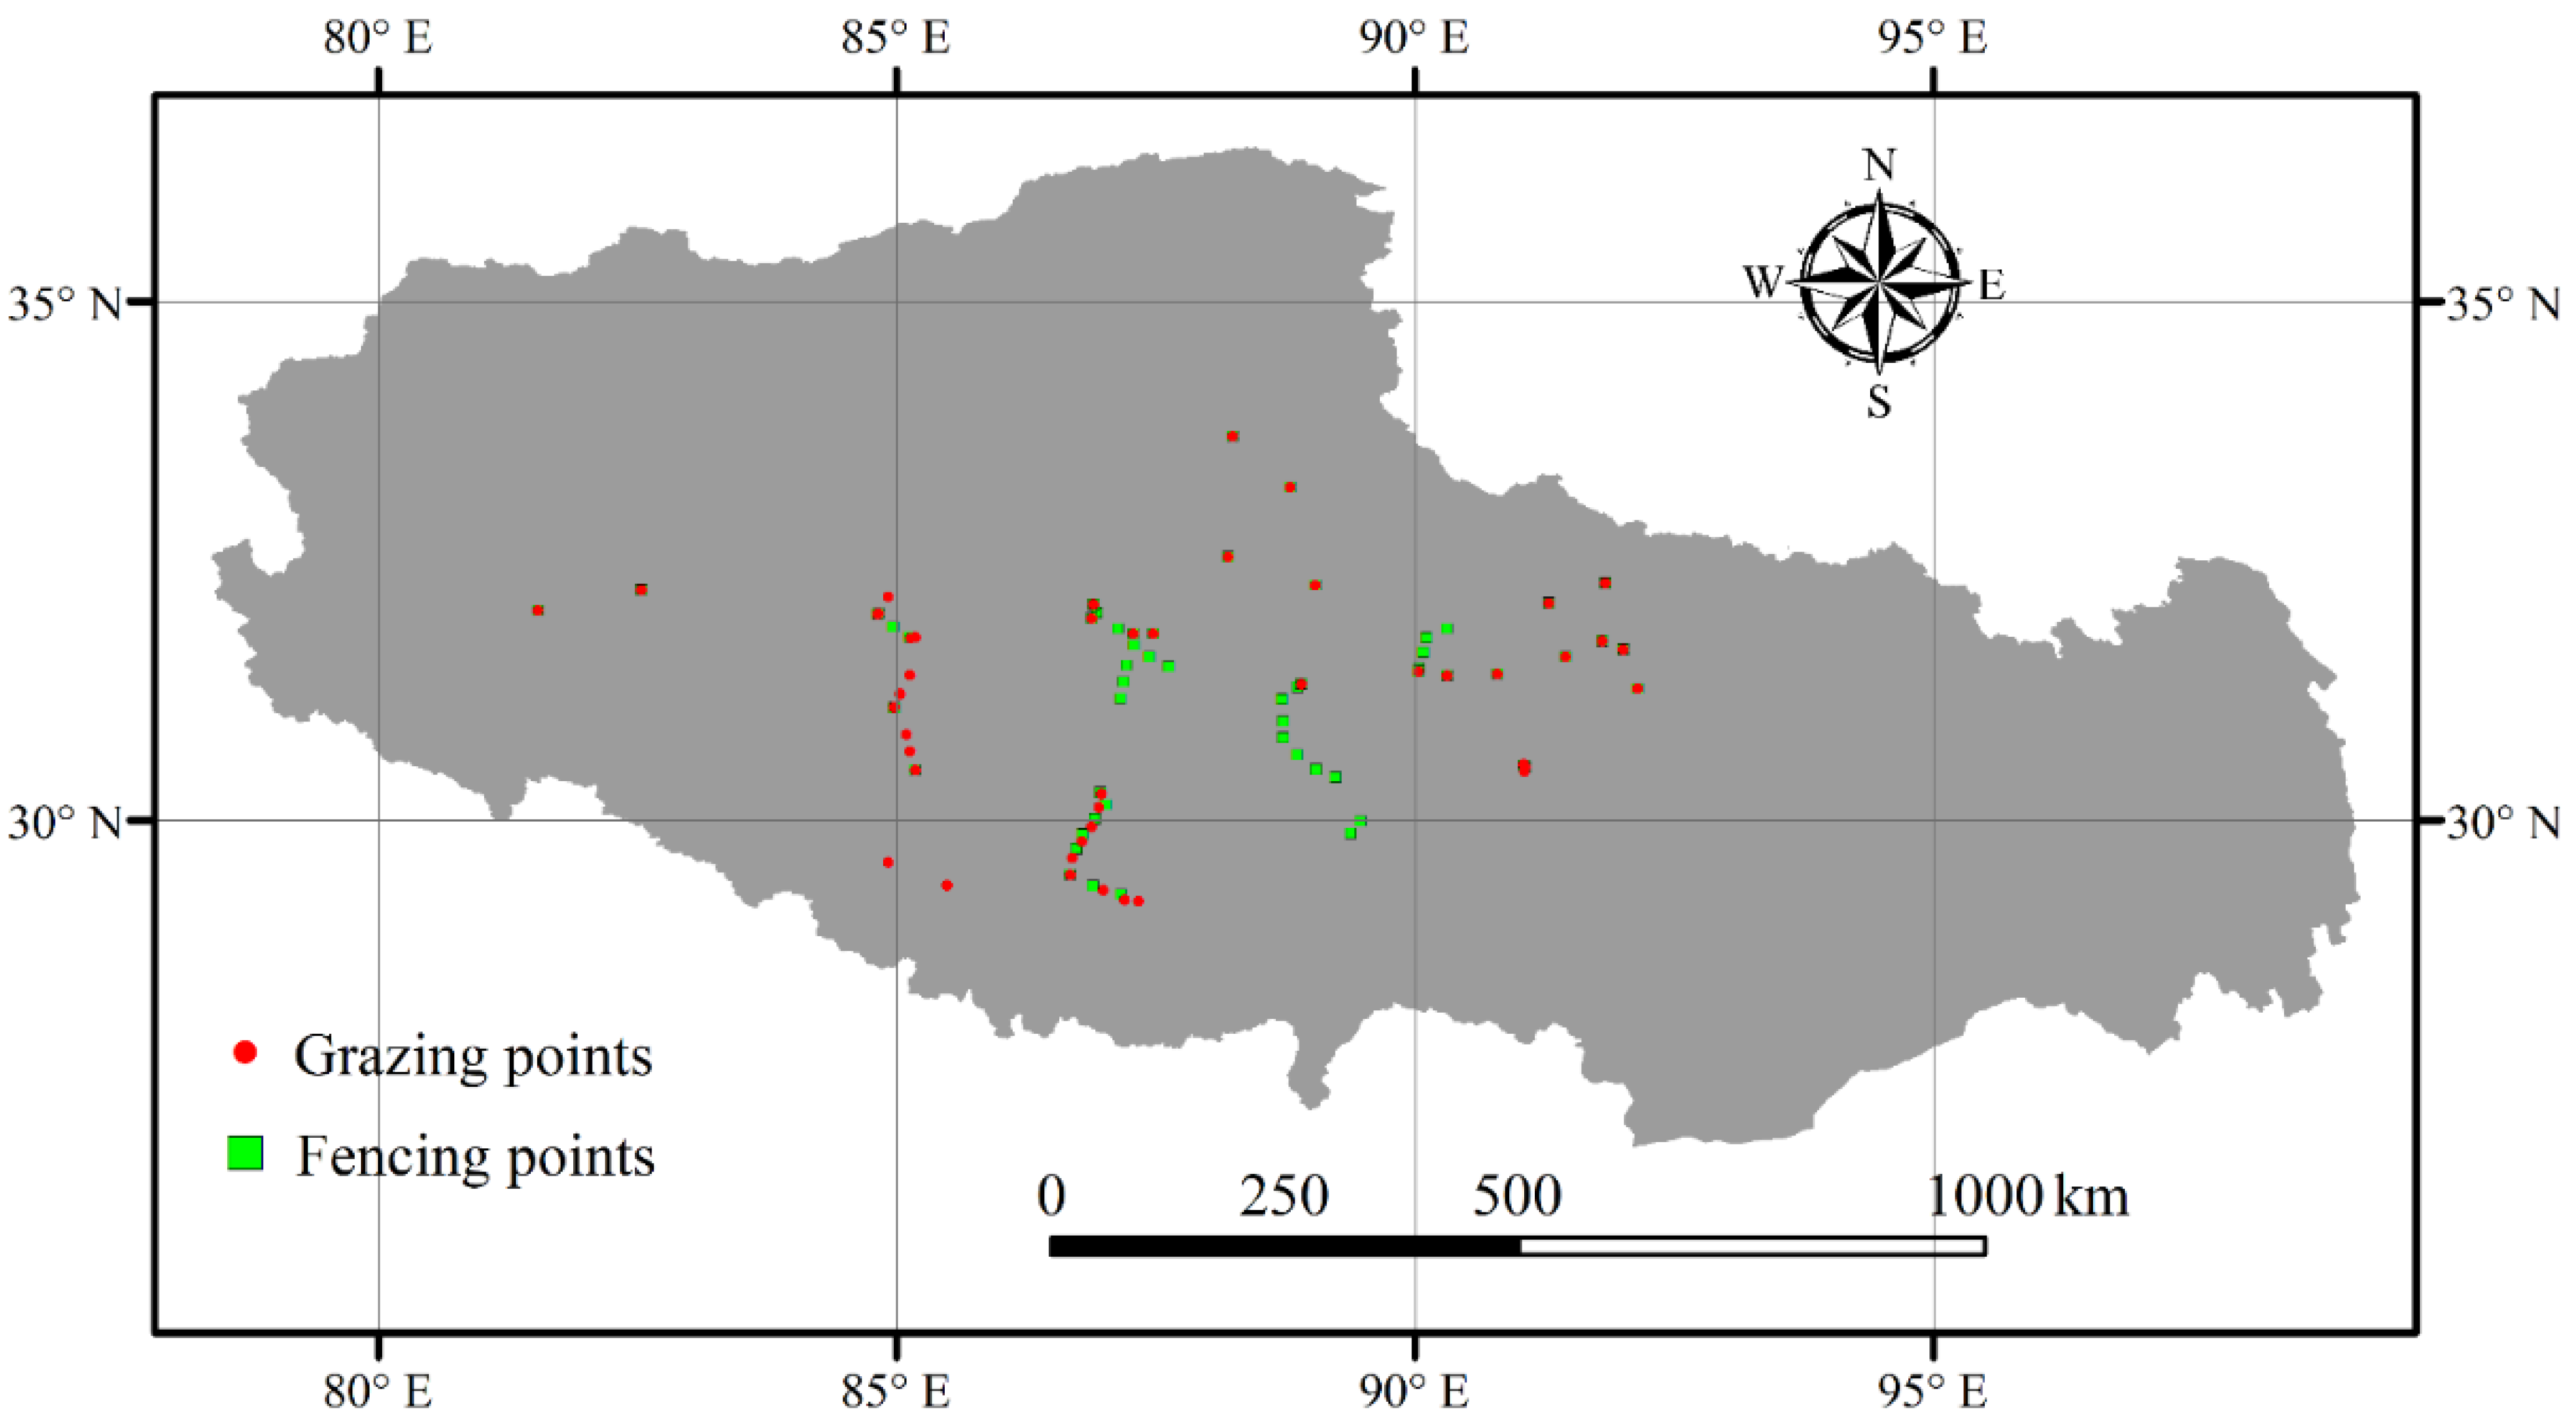
2.1. Data

There were 532 and 398 sampling quadrats with a size of 0.50 m × 0.50 m under the fencing and free-grazing scenes, respectively. The geographic positions of these sampling sites were illustrated in Figure 1. The 532 sampling quadrats under fencing scenes were investigated in 2011–2020, and the 398 sampling quadrats under grazing scenes were investigated in 2010, 2012 and 2017–2020. The investigated plant community data included numbers of species, species coverage and height. Based on the investigated plant community data, plant α-diversity was calculated for each sampling quadrat [9,10,11,12,34,35]. Considering the nonlinear relationships among different indices of plant α-diversity, four different indices of plant α-diversity (i.e., SR: species richness, Shannon, Simpson and Pielou indices) were adopted in this current study. The SR was actually referred to species number of plant community for each quadrat. The Shannon, Simpson and Pielou indices were calculated with Equations (1)–(3), respectively:
S h a n n o n = P i × l n P i
S i m p s o n = 1 P i 2
P i e l o u = P i × l n P i l n S R
where P i is the relative important value of each plant species within a quadrat. The other data used in this research included maximum normalized difference vegetation index during the period from May to September (NDVImax), annual temperature (AT), annual precipitation (AP) and annual radiation (ARad) in 2000–2020. The normalized difference vegetation index data were adopted from MODIS product (i.e., MOD13A3). The AT, AP and ARad data were based on interpolated monthly air temperature, precipitation and radiation, respectively. The accuracies of interpolated monthly climate data were performed and validated by earlier studies [36]. Based on previous studies [20,27], the plant α-diversity data under fencing and free-grazing scenes were treated as the potential and actual plant α-diversity, respectively. The potential plant α-diversity data were assumed to be only influenced by climatic change, while the actual plant α-diversity data were assumed to be simultaneously influenced by anthropogenic activities and climatic change [20,27]. The potential SR, Shannon, Simpson and Pielou data were labeled as SRp, Shannonp, Simpsonp and Pieloup, respectively. In contrast, the actual SR, Shannon, Simpson and Pielou data were labeled as SRa, Shannona, Simpsona and Pieloua, respectively. The SRp, Shannonp, Simpsonp and Pieloup data were calculated from the AT, AP and ARad based on six diverse methods (i.e., random forest, generalized boosted regression, artificial neural network, multiple linear regression, support vector machines and recursive regression trees) (Table 1). By contrast, the SRa, Shannona, Simpsona and Pieloua data were calculated from the AT, AP, ARad and NDVImax based on the six diverse methods mentioned above (Table 1). The reasons on why these six approaches were adopted in the current study were as follows. Firstly, random forest, generalized boosted regression, artificial neural network, support vector machines and recursive regression trees are common big data mining tools, while multiple linear regression is a common statistical regression tool. Secondly, earlier studies examined and compared the performances of the random forest, multiple linear regression, support vector machines and recursive regression trees in assessing plant nutrition quality and production of alpine grasslands in Tibet [20,27]. However, the performances of these six approaches in quantifying plant α-diversity of alpine grasslands in Tibet is unclear. Thirdly, optimal plant α-diversity model screening is necessary to predict the change of plant α-diversity and protection of biodiversity under global change. All the spatial resolutions of AT, AP, ARad, NDVImax, SRp, Shannonp, Simpsonp, Pieloup, SRa, Shannona, Simpsona and Pieloua were 1 km × 1 km.

2.2. Statistical Analysis

According to some earlier studies [20,37,38,39], 30 dataset of observed plant α-diversity, annual temperature, annual precipitation and annual radiation and/or growing season maximum normalized difference vegetation index were randomly selected from the 532 and 398 samples under fencing and free-grazing scenes, respectively. The 30 datasets were used to validate the predicting accuracies (i.e., linear slope, R2: determination coefficient, RMSE: root-mean-square error and relative bias) of all the models used in this study [20]. Random forest, generalized boosted regression, artificial neural network, multiple linear regression, support vector machines and recursive regression trees were performed by the randomForest, gbm, rminer, stats, e1071 and rpart packages of the R.4.1.2 software, respectively [40,41,42]. The R.4.1.2 was also used to perform all the other statistical analyses, including the linear regression between potential and actual plant α-diversity.

3. Results

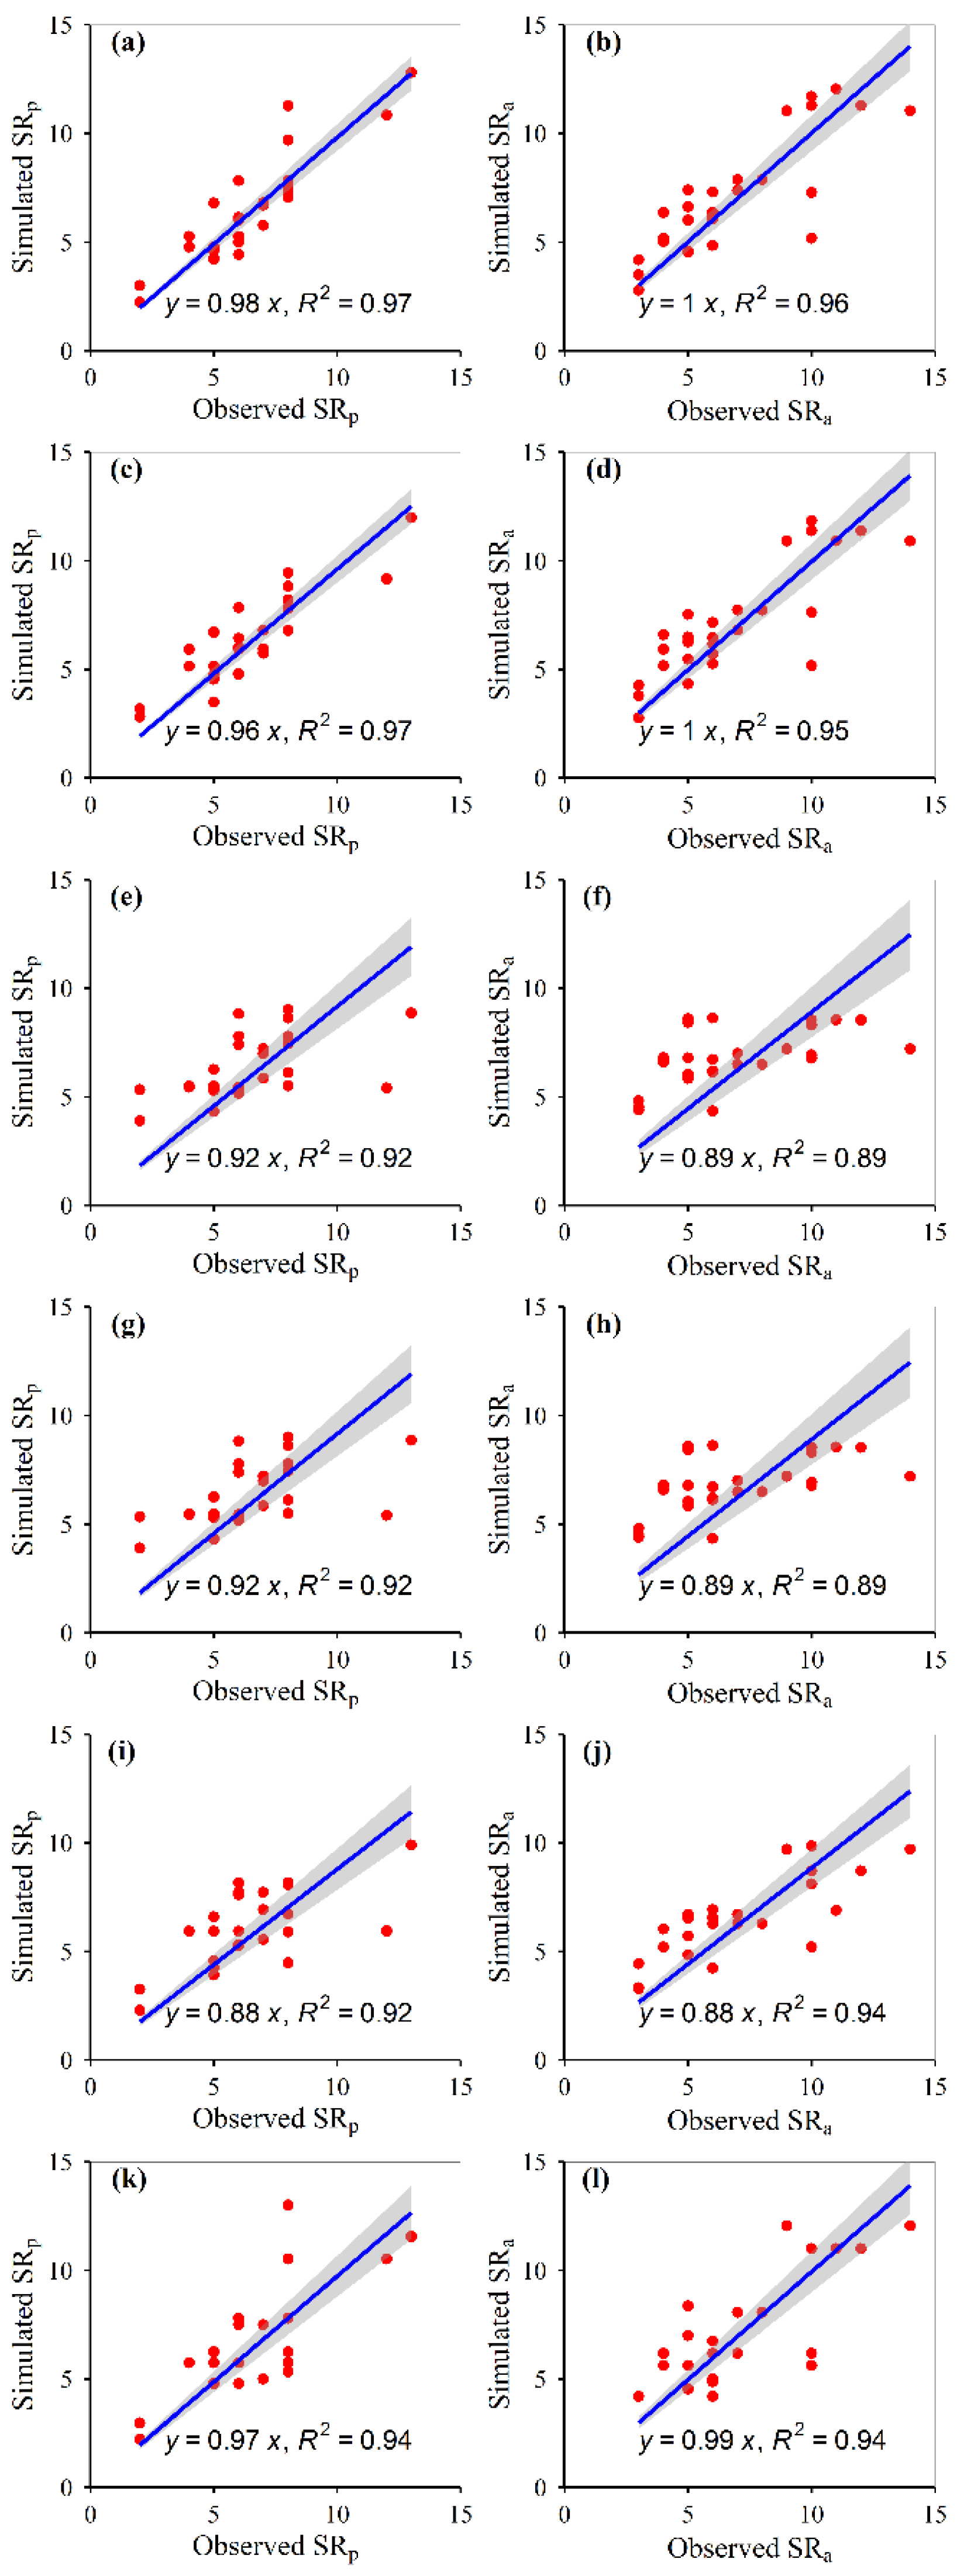
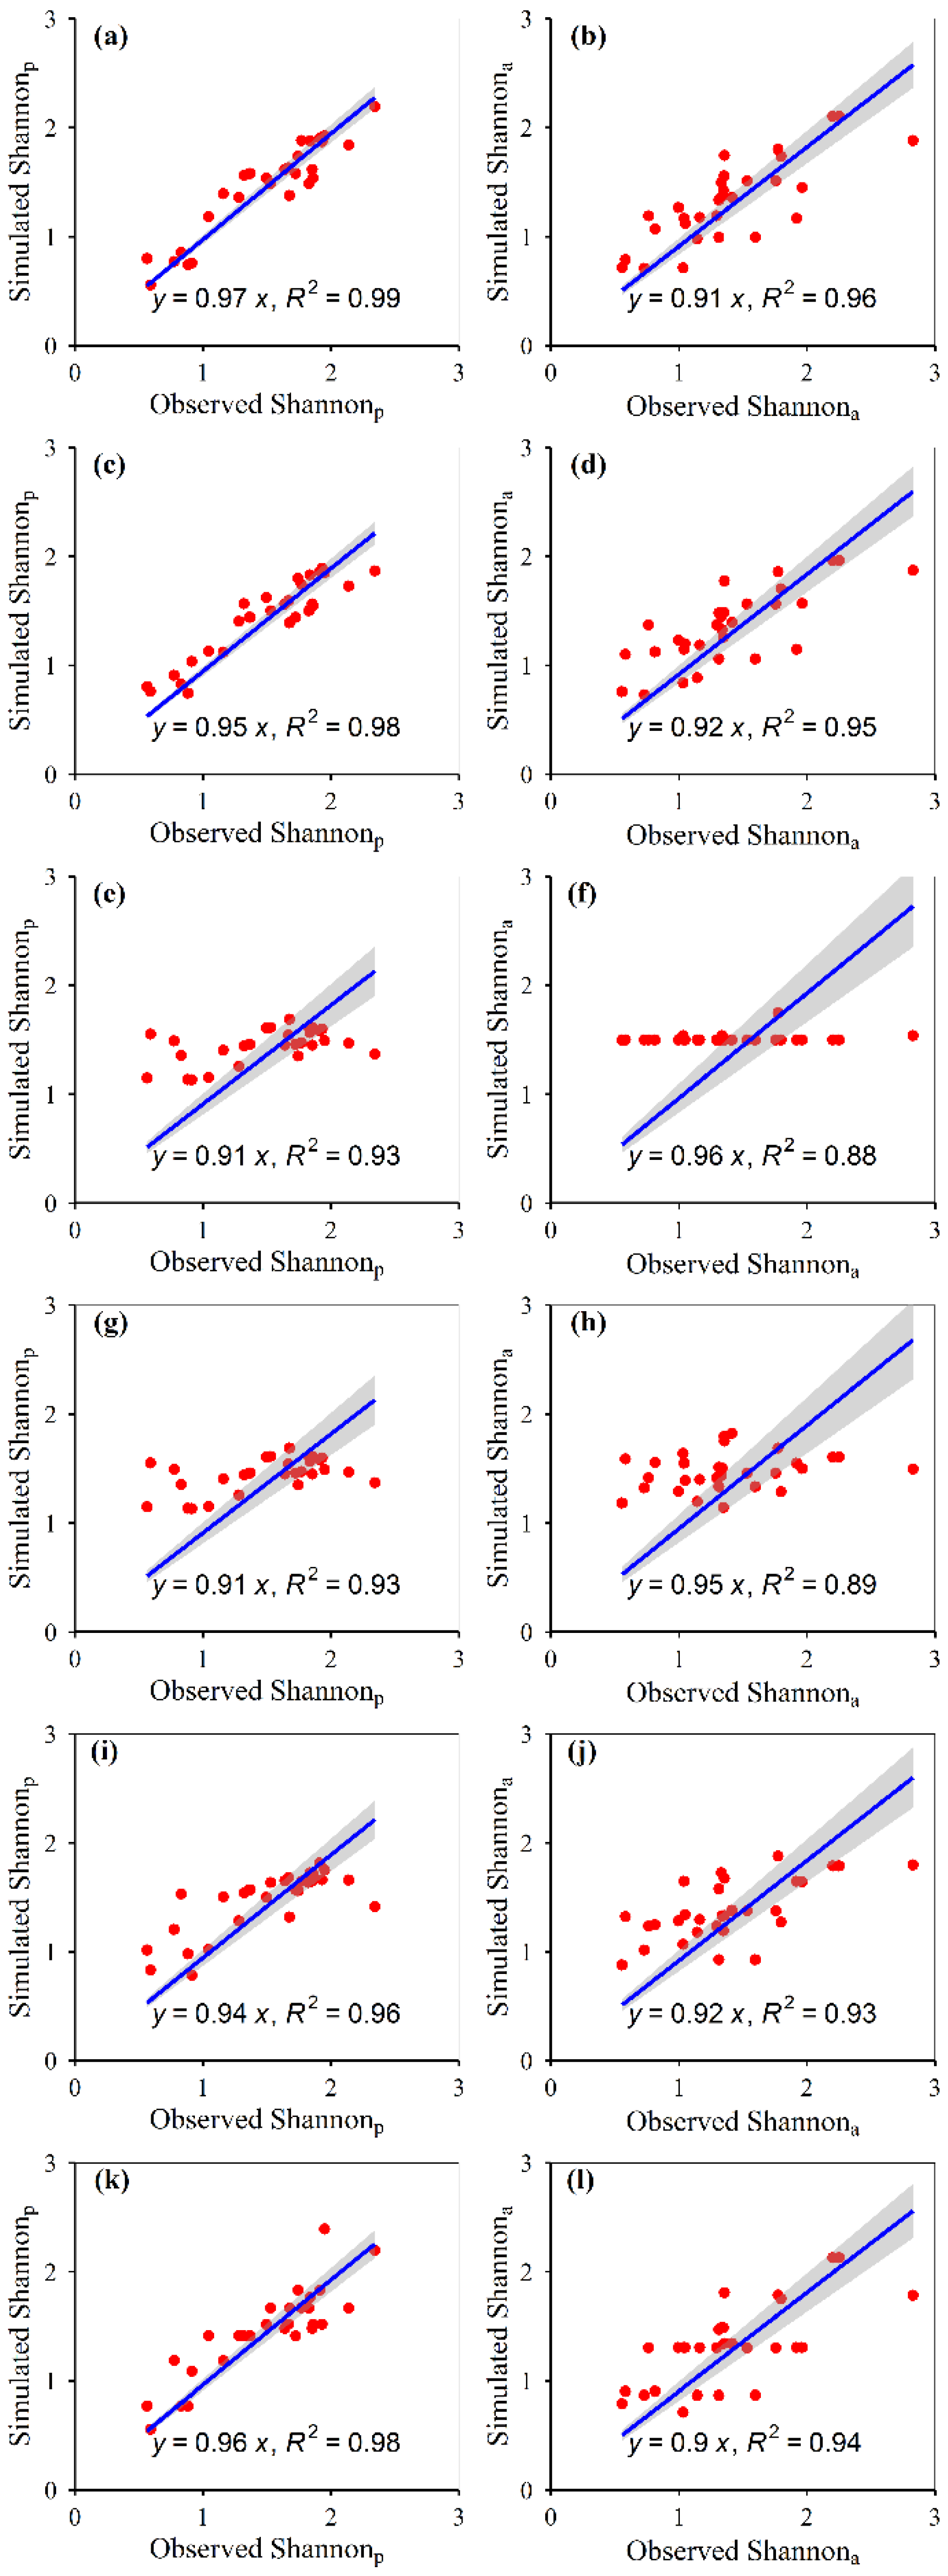
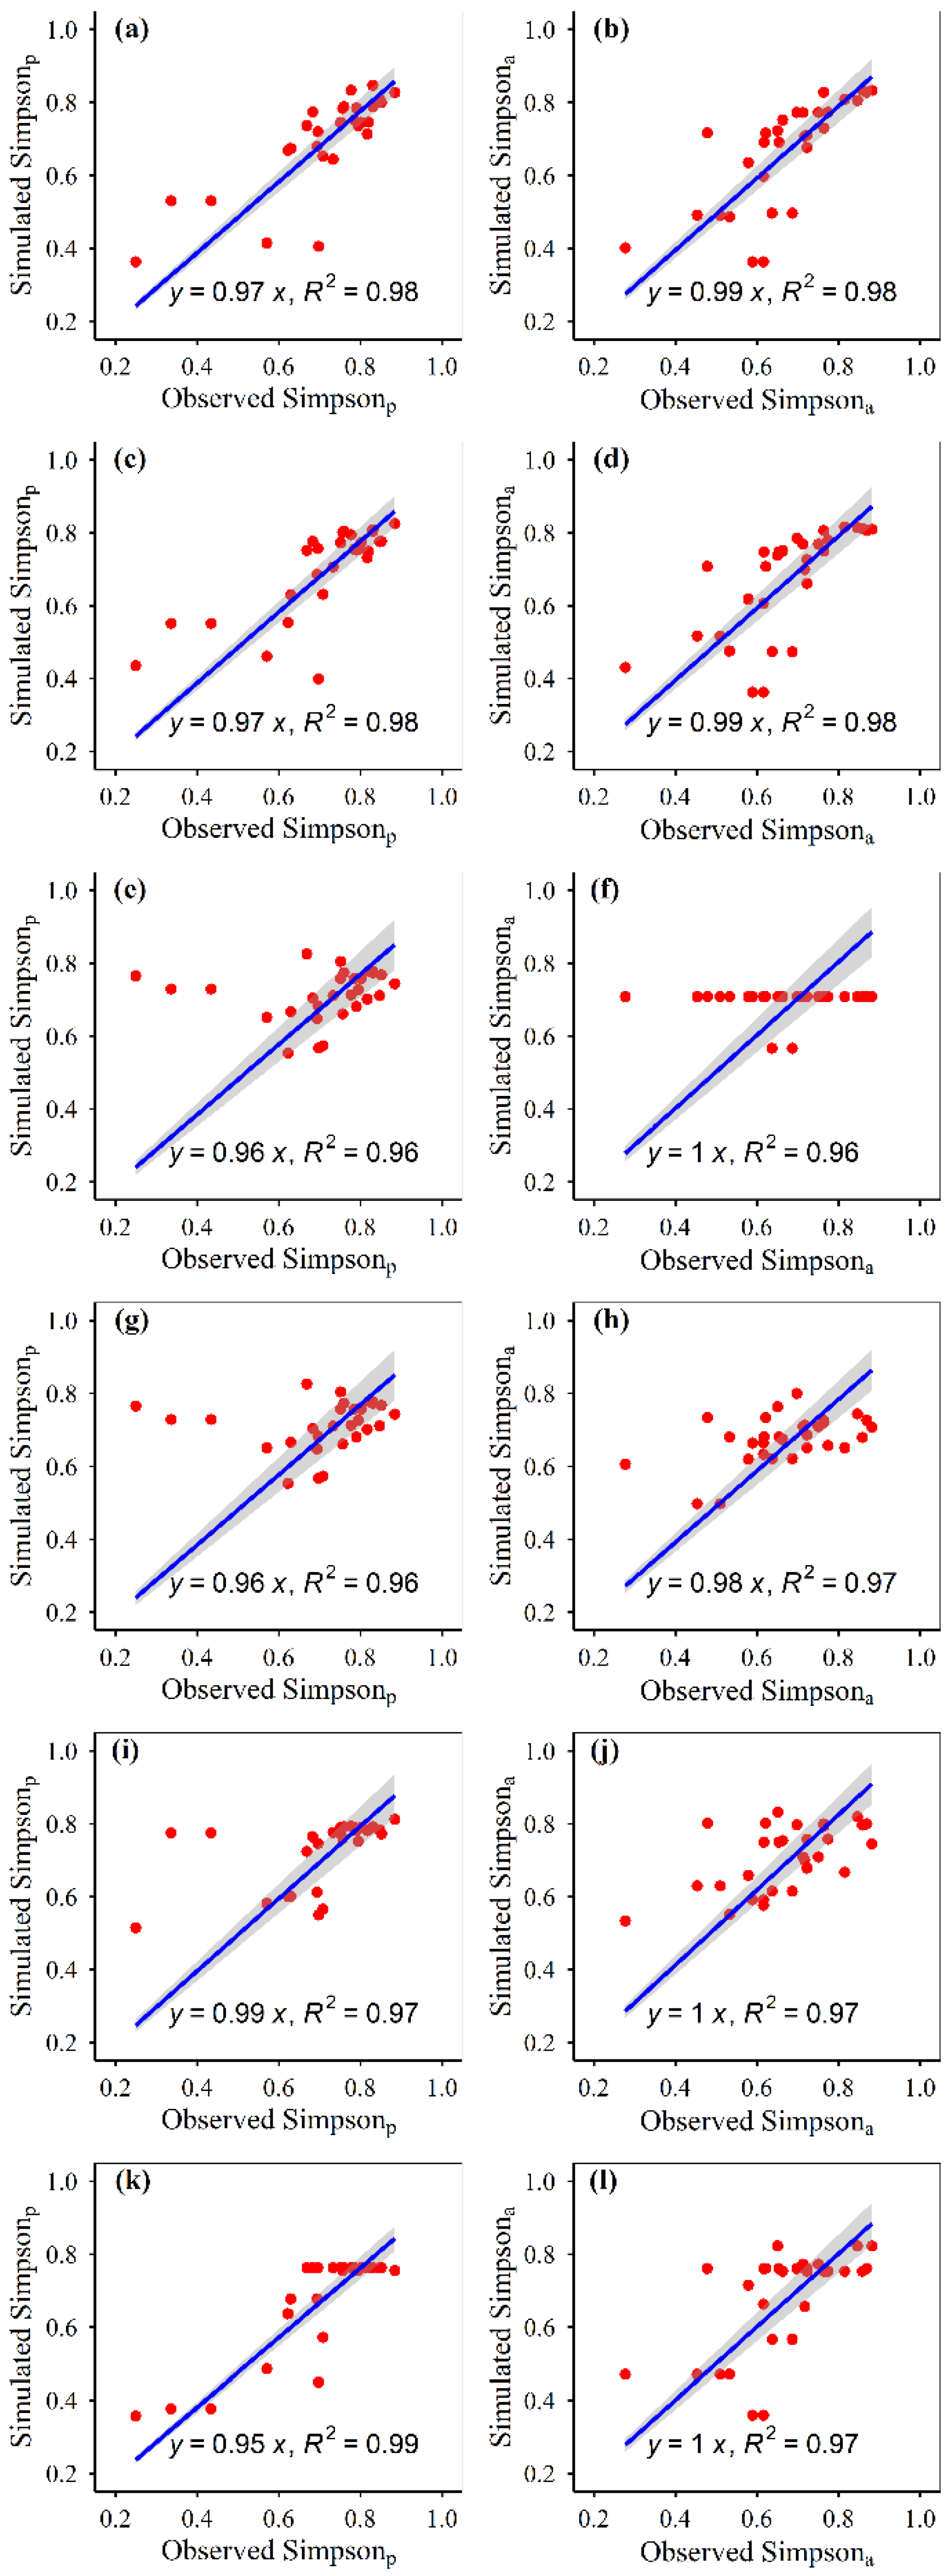
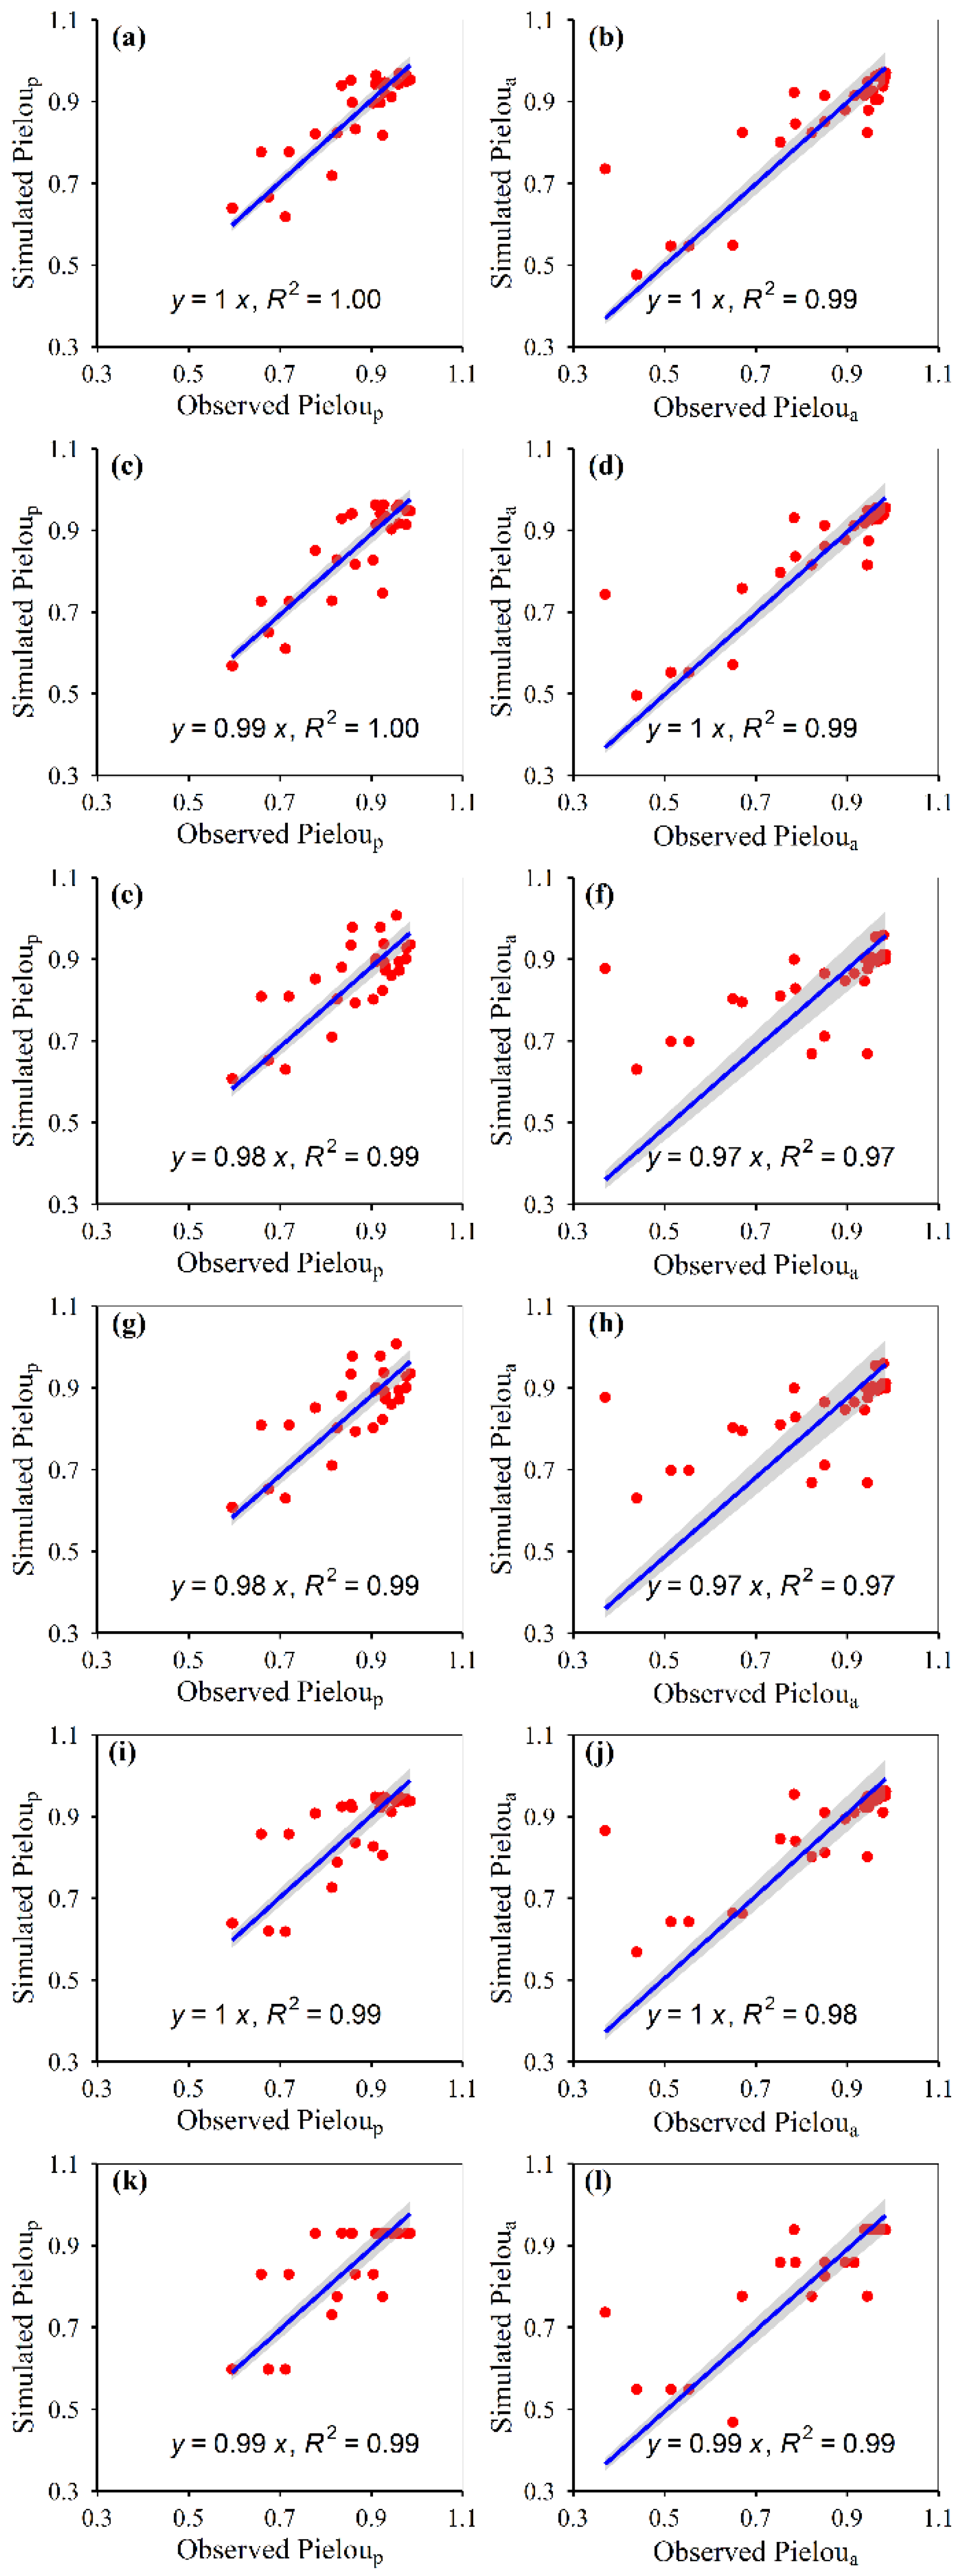
3.1. Model Construction

The model parameters for the random forest, generalized boosted regression, artificial neural network, multiple linear regression, support vector machines and recursive regression trees of plant α-diversity are shown in Table 1, respectively. The values and numbers of model parameters varied among the six approaches (Table 1). Random forest, multiple linear regression and recursive regression trees directly provided R2 values, and generalized boosted regression, artificial neural network and support vector machines did not directly provide R2 values (Table 1). Generally, the R2 values of constructed random forest models were the greatest, and the R2 values of constructed multiple linear regression models were the lowest (Table 1). Random forest, generalized boosted regression and support vector machine provided numbers of trees or vector machines, and the other three approaches did not provide numbers of trees or vector machines (Table 1). Different indices of plant α-diversity adopted different numbers of trees or vector machines (Table 1). Moreover, some approaches directly provided internal error evaluation parameters (Table 1). Random forest models directly provided mean square errors, as the internal error evaluation and generalized boosted regression directly provided mean train errors and mean cross-validation errors as the internal error evaluation, and vector machines models directly provided mean residuals as the internal error evaluation (Table 1).

3.2. Model Accuracies

The simulated plant α-diversity was significantly and linearly correlated with the observed plant α-diversity (Figure 2, Figure 3, Figure 4 and Figure 5). The relative bias and RMSE values between the simulated plant α-diversity and observed plant α-diversity are shown in Table 2. The linear slopes, R2 values, relative bias and RMSE values between the simulated plant α-diversity and observed plant α-diversity varied among the six approaches, respectively (Figure 2, Figure 3, Figure 4 and Figure 5, Table 2). The linear slopes and R2 values between simulated plant α-diversity and observed plant α-diversity were no less than 0.88 (Table 2). The relative bias and RMSE values between simulated plant α-diversity and observed plant α-diversity were within a range from −6.53% to 9.14% and from 0.05 to 2.37, respectively (Figure 2, Figure 3, Figure 4 and Figure 5).

4. Discussion

Similar with earlier studies, not all models can directly provide the R2 values [20,38]. In fact, only three (i.e., random forest, multiple linear regression and recursive regression trees) of the six methods can directly provide R2 values (Table 1). Among the three methods mentioned above, the AT, AP, ARad and/or NDVImax based on constructed random forest models can explain the highest variations of plant α-diversity, and the AT, AP, ARad and/or NDVImax based on constructed multiple linear regression models can explain the lowest variations of plant α-diversity. This consequence was similar to an earlier paper, which showed that the AT, AP, ARad and/or NDVImax based on constructed random forest models can explain the greater variations of plant nutritional quality and production than the constructed recursive regression trees and multiple linear regression models in alpine grassland ecosystems of Tibet [20]. Accordingly, the R2 values of the constructed models can preliminarily evaluate the quality of the models, at least for plant nutrition production and α-diversity in the alpine grassland ecosystem of Tibet.
Different models/methods can generally have different calculation thought and parameters, and only three (i.e., random forest, generalized boosted regression and support vector machine) of the six methods can provide the numbers of trees or vector machines (Table 1). Compared to the constructed generalized boosted regression and support vector machine models, the tree numbers of constructed random forest models were lower for most cases. Lower tree numbers implied that lower model complexity and higher computational speed. Accordingly, the constructed random forest models in this study had the highest computational speed and lowest model complexity, but the constructed generalized boosted regression models in this study had the lowest computational speed and highest model complexity, at least for plant α-diversity in alpine grassland ecosystems of Tibet. However, this consequence seemed to be completely opposite with an earlier paper, which demonstrated that the tree numbers of constructed random forest models were greater than the constructed vector machines numbers of support vector machines models [20]. Accordingly, relying only on the number of trees/vector-machines evaluation model may not be universal.
The accuracy and robustness of the constructed random forest models of plant α-diversity were greater than the other five approaches, which was supported by the facts mentioned above and succeeding facts. Firstly, from the scatter plots between simulated plant α-diversity and observed plant α-diversity, there were too many points where multiple observed values correspond to only one simulated value, especially for the constructed artificial neural network and recursive regression trees models (Figure 2, Figure 3, Figure 4 and Figure 5). Secondly, the reasonable range of Simpson and Pielou values are generally within a range from zero to one. However, the simulated potential plant Pielou values (e.g., 1.01) were not all within the reasonable range for the constructed models of multiple linear regression and artificial neural network (Figure 2, Figure 3, Figure 4 and Figure 5). Thirdly, there were some situations where the absolute values of the relative bias between the simulated plant α-diversity and observed plant α-diversity were greater than 4.80% for four of the six methods (i.e., artificial neural network, multiple linear regression, support vector machines and recursive regression trees) (Table 2). The largest value for the absolute value of the relative bias between the simulated plant α-diversity based on random forest and observed plant α-diversity was about 4.49%, but that between the simulated plant α-diversity based on generalized boosted regression and observed plant α-diversity was about 4.61% (Table 2). Fourthly, the linear slopes between simulated plant α-diversity from the constructed random forest models and observed plant α-diversity were the closest to 1 among the six methods for more than half cases, but the linear slopes between simulated plant α-diversity from the constructed generalized boosted regression and observed plant α-diversity were the closest to 1 among the six methods for only a quarter situation (Figure 2, Figure 3, Figure 4 and Figure 5). Fifthly, for most cases, the constructed random forest models had the lowest RMSE values and the largest R2 values between simulated plant α-diversity and observed plant α-diversity among the six methods (Table 2, Figure 2, Figure 3, Figure 4 and Figure 5). Moreover, AT, AP, ARad and/or NDVImax explained about 71–73% and 61–73% variations of plant potential and actual α-diversity based on the constructed random forest, respectively (Table 1). The linear slopes, R2 values, relative bias and RMSE values between simulated potential and actual plant α-diversity from random forest and observed potential and actual plant α-diversity were 0.97–1.00 and 0.91–1.00, 0.97–1.00 and 0.96–0.99, −1.81–0.70 and −4.49–4.39 and 0.05–1.10 and 0.09–1.58, respectively (Table 2, Figure 2, Figure 3, Figure 4 and Figure 5). Accordingly, plant species potential α-diversity can be quantified from the AT, AP and ARad using the constructed random forest models, and plant species actual α-diversity can be quantified from the AT, AP, ARad and NDVImax using the constructed random forest models, at least for the alpine grassland ecosystems of Tibet. However, on the basis of data only from Tibet, which is a hotspot of unique vegetation, it is difficult to generalize the presented results to other areas. Thus, future studies should focus on areas outside Tibet, and their findings can be compared with the results of this current study.

5. Conclusions

Here, to our best knowledge, this research was the first study to quantify the potential (i.e., only affected by climate change) and actual (i.e., simultaneously affected by climate change and human activities) plant α-diversity (i.e., species richness, Shannon, Simpson and Pielou) based on six models (i.e., random forest, generalized boosted regression, artificial neural network, multiple linear regression, support vector machines and recursive regression trees) using climate data (i.e., AT: annual temperature; AP: annual precipitation; ARad: annual radiation) and growing-season maximum normalized difference vegetation index (NDVImax) in the alpine grassland ecosystem of the Tibetan Plateau under the background of the rapid development of global big data mining technologies. The predicting accuracies of the six approaches in plant α-diversity were compared in the current research by analyzing the linear slopes, R2, bias and RMSE values between simulated and observed plant α-diversity. The constructed random forest models of plant α-diversity had the better performance than the other five methods. Accordingly, the proposed tool by this current study will help in proposing solutions to urgent environmental problems. For example, the constructed random forest models of plant α-diversity can be used to quantify the spatial and temporal patterns of the potential and actual plant α-diversity, and predict the changes of potential and actual plant α-diversity, at least for alpine grassland ecosystems of Tibet under future global change.

Author Contributions

Conceptualization, G.F. and Y.T.; methodology, G.F.; software, Y.T.; validation, G.F.; formal analysis, G.F. and Y.T.; investigation, G.F.; resources, Y.T.; data curation, G.F.; writing—original draft preparation, G.F. and Y.T.; writing—review and editing, G.F. and Y.T.; visualization, Y.T.; supervision, Y.T.; project administration, Y.T.; funding acquisition, G.F. and Y.T. All authors have read and agreed to the published version of the manuscript.

Funding

This research was funded by the Youth Innovation Promotion Association of Chinese Academy of Sciences [2020054], National Natural Science Foundation of China [31600432], Bingwei Outstanding Young Talents Program of Institute of Geographic Sciences and Natural Resources Research, Chinese Academy of Sciences [2018RC202], Science and Technology Project of Tibet Autonomous Region [XZ202101ZD0003N, XZ202101ZD0007G, XZ202201ZY0003N], STS Project of Chinese Academy of Sciences [KFJ-STS-QYZD-2021-22-003], Construction of Fixed Observation and Experimental Station of First and Try Support System for Agricultural Green Development in Zhongba County and Central Government Guides Local Science and Technology Development Program [XZ202202YD0009C].

Data Availability Statement

The datasets generated for this study are available on request from the corresponding author.

Acknowledgments

We really appreciate the editor and reviewers for their profound and professional comments which greatly improved the current research.

Conflicts of Interest

The authors declare no conflict of interest.

References

  1. Berendse, F.; Van Ruijven, J.; Jongejans, E.; Keesstra, S. Loss of Plant Species Diversity Reduces Soil Erosion Resistance. Ecosystems 2015, 18, 881–888. [Google Scholar] [CrossRef] [Green Version]
  2. Brummitt, N.; Araujo, A.C.; Harris, T. Areas of plant diversity-What do we know? Plants People Planet 2021, 3, 33–44. [Google Scholar] [CrossRef]
  3. Waldrop, M.P.; Zak, D.R.; Blackwood, C.B.; Curtis, C.D.; Tilman, D. Resource availability controls fungal diversity across a plant diversity gradient. Ecol. Lett. 2006, 9, 1127–1135. [Google Scholar] [CrossRef] [PubMed] [Green Version]
  4. Welti, E.; Helzer, C.; Joern, A. Impacts of plant diversity on arthropod communities and plant-herbivore network architecture. Ecosphere 2017, 8, e01983. [Google Scholar] [CrossRef] [Green Version]
  5. Klein, J.A.; Harte, J.; Zhao, X.Q. Experimental warming causes large and rapid species loss, dampened by simulated grazing, on the Tibetan Plateau. Ecol. Lett. 2004, 7, 1170–1179. [Google Scholar] [CrossRef]
  6. De Boeck, H.J.; Lemmens, C.; Gielen, B.; Bossuyt, H.; Malchair, S.; Carnol, M.; Merckx, R.; Nijs, I. Combined effects of climate warming and plant diversity loss on above- and below-ground grassland productivity. Environ. Exp. Bot. 2007, 60, 95–104. [Google Scholar] [CrossRef]
  7. Scheiner, S.M.; Reybenayas, J.M. Global patterns of plant diversity. Evol. Ecol. 1994, 8, 331–347. [Google Scholar] [CrossRef]
  8. Zha, X.J.; Tian, Y.; Ou, Z.; Fu, G. Response of forage nutrient storages to grazing in alpine grasslands. Front. Plant Sci. 2022, 3505. [Google Scholar] [CrossRef]
  9. Zhang, H.; Fu, G. Responses of plant, soil bacterial and fungal communities to grazing vary with pasture seasons and grassland types, northern Tibet. Land Degrad. Dev. 2021, 32, 1821–1832. [Google Scholar] [CrossRef]
  10. Wang, J.W.; Yu, C.Q.; Fu, G. Asymmetrical warming between elevations may result in similar plant community composition between elevations in alpine grasslands. Front. Ecol. Evol. 2021, 702. [Google Scholar] [CrossRef]
  11. Wang, J.W.; Yu, C.Q.; Fu, G. Warming reconstructs the elevation distributions of aboveground net primary production, plant species and phylogenetic diversity in alpine grasslands. Ecol. Indic. 2021, 133, 108355. [Google Scholar] [CrossRef]
  12. Sun, W.; Li, S.W.; Wang, J.H.; Fu, G. Effects of grazing on plant species and phylogenetic diversity in alpine grasslands, Northern Tibet. Ecol. Eng. 2021, 170, 106331. [Google Scholar] [CrossRef]
  13. Bastazini, V.A.G.; Galiana, N.; Hillebrand, H.; Estiarte, M.; Ogaya, R.; Peñuelas, J.; Sommer, U.; Montoya, J.M. The impact of climate warming on species diversity across scales: Lessons from experimental meta-ecosystems. Glob. Ecol. Biogeogr. 2021, 30, 1545–1554. [Google Scholar] [CrossRef]
  14. Bongaarts, J. Summary for policymakers of the global assessment report on biodiversity and ecosystem services of the Intergovernmental Science-Policy Platform on Biodiversity and Ecosystem Services. Popul. Dev. Rev. 2019, 45, 680–681. [Google Scholar] [CrossRef] [Green Version]
  15. Elgersma, A.; Søegaard, K. Effects of species diversity on seasonal variation in herbage yield and nutritive value of seven binary grass-legume mixtures and pure grass under cutting. Eur. J. Agron. 2016, 78, 73–83. [Google Scholar] [CrossRef]
  16. Prieto, P.; Penuelas, J.; Lloret, F.; Llorens, L.; Estiarte, M. Experimental drought and warming decrease diversity and slow down post-fire succession in a Mediterranean shrubland. Ecography 2009, 32, 623–636. [Google Scholar] [CrossRef]
  17. Fu, G.; Sun, W. Temperature sensitivities of vegetation indices and aboveground biomass are primarily linked with warming magnitude in high-cold grasslands. Sci. Total Environ. 2022, 843, 157002. [Google Scholar] [CrossRef]
  18. Fu, G.; Shen, Z.X. Asymmetrical warming of growing/non-growing season increases soil respiration during growing season in an alpine meadow. Sci. Total Environ. 2022, 812, 152591. [Google Scholar] [CrossRef]
  19. Fu, G.; Shen, Z.X.; Zhang, X.Z. Increased precipitation has stronger effects on plant production of an alpine meadow than does experimental warming in the Northern Tibetan Plateau. Agricult. For. Meteorol. 2018, 249, 11–21. [Google Scholar] [CrossRef]
  20. Han, F.S.; Fu, G.; Yu, C.Q.; Wang, S.H. Modeling nutrition quality and storage of forage using climate data and normalized-difference vegetation index in alpine grasslands. Remote Sens. 2022, 14, 3410. [Google Scholar] [CrossRef]
  21. Mantas, C.J.; Castellano, J.G.; Moral-García, S.; Abellán, J. A comparison of random forest based algorithms: Random credal random forest versus oblique random forest. Soft Comput. 2019, 23, 10739–10754. [Google Scholar] [CrossRef]
  22. Mishina, Y.; Murata, R.; Yamauchi, Y.; Yamashita, T.; Fujiyoshi, H. Boosted Random Forest. IEICE Trans. Inf. Syst. 2015, 98, 1630–1636. [Google Scholar] [CrossRef] [Green Version]
  23. Mishina, Y.; Tsuchiya, M.; Fujiyoshi, H. Boosted Random Forest. In Proceedings of the 9th International Conference on Computer Vision Theory and Applications (VISAPP), Lisbon, Portugal, 5–8 January 2014. [Google Scholar]
  24. Paul, A.; Mukherjee, D.P. Reinforced Random Forest. In Proceedings of the 10th Indian Conference on Computer Vision, Graphics and Image Processing (ICVGIP), Guwahati, India, 18–22 December 2016; Indian Institute of Technology: Delhi, India, 2016. [Google Scholar]
  25. Sun, J.Y.; Zhong, G.Q.; Huang, K.Z.; Dong, J. Banzhaf random forests: Cooperative game theory based random forests with consistency. Neural Netw. 2018, 106, 20–29. [Google Scholar] [CrossRef] [PubMed]
  26. Zhao, Z.M.; Li, C.H.; Shi, H.; Zou, Q. Material Classification Using Random Forest. In Proceedings of the 2nd International Conference on Advanced Measurement and Test (AMT 2011), Nanchang, China, 24–26 June 2011; Peoples Republic of China: Beijing, China, 2011. [Google Scholar]
  27. Fu, G.; Wang, J.H.; Li, S.W. Response of forage nutritional quality to climate change and human activities in alpine grasslands. Sci. Total Environ. 2022, 845, 157552. [Google Scholar] [CrossRef] [PubMed]
  28. Wu, J.S.; Shen, Z.X.; Shi, P.L.; Zhou, Y.T.; Zhang, Z.X. Effects of grazing exclusion on plant functional group diversity alpine grasslands along a precipitation gradient on the Northern Tibetan Plateau. Arct. Antarct. Alp. Res. 2014, 46, 419–429. [Google Scholar] [CrossRef] [Green Version]
  29. Wu, J.S.; Zhang, X.Z.; Shen, Z.X.; Shi, P.L.; Yu, C.Q.; Song, M.H.; Li, X.J. Species richness and diversity of alpine grasslands on the Northern Tibetan Plateau:effects of grazing exclusion and growing season precipitation. J. Resour. Ecol. 2012, 3, 236–242. [Google Scholar]
  30. Fu, G.; Wang, J.H.; Li, S.W.; He, P. Responses of forage nutrient quality to grazing in the alpine grassland of Northern Tibet. Acta Pratacult. Sin. 2021, 30, 38–50. [Google Scholar]
  31. Fu, G.; Shen, Z.X.; Sun, W.; Zhong, Z.M.; Zhang, X.Z.; Zhou, Y.T. A meta-analysis of the effects of experimental warming on plant physiology and growth on the Tibetan Plateau. J. Plant Growth Regul. 2015, 34, 57–65. [Google Scholar] [CrossRef]
  32. Fu, G.; Shen, Z.X. Effects of enhanced UV-B radiation on plant physiology and growth on the Tibetan Plateau: A meta-analysis. Acta Physiol. Plant. 2017, 39, 85. [Google Scholar] [CrossRef]
  33. Fu, G.; Shen, Z.X. Response of alpine plants to nitrogen addition on the Tibetan Plateau: A meta-analysis. J. Plant Growth Regul. 2016, 35, 974–979. [Google Scholar] [CrossRef]
  34. Zhong, Z.M.; Fu, G. Response of soil fungal species, phylogenetic and functional diversity to diurnal asymmetric warming in an alpine agricultural ecosystem. Agric. Ecosyst. Environ. 2022, 335, 107993. [Google Scholar] [CrossRef]
  35. Yu, C.Q.; Han, F.S.; Fu, G. Effects of 7 years experimental warming on soil bacterial and fungal community structure in the Northern Tibet alpine meadow at three elevations. Sci. Total Environ. 2019, 655, 814–822. [Google Scholar] [CrossRef] [PubMed]
  36. Fu, G.; Sun, W.; Li, S.W.; Zhang, J.; Yu, C.Q.; Shen, Z.X. Modeling aboveground biomass using MODIS images and climatic data in grasslands on the Tibetan Plateau. J. Resour. Ecol. 2017, 8, 42–49. [Google Scholar]
  37. Fu, G.; Shen, Z.X.; Zhang, X.Z.; Shi, P.L.; Zhang, Y.J.; Wu, J.S. Estimating air temperature of an alpine meadow on the Northern Tibetan Plateau using MODIS land surface temperature. Acta Ecol. Sin. 2011, 31, 8–13. [Google Scholar] [CrossRef]
  38. Wu, J.S.; Fu, G. Modelling aboveground biomass using MODIS FPAR/LAI data in alpine grasslands of the Northern Tibetan Plateau. Remote Sens. Lett. 2018, 9, 150–159. [Google Scholar] [CrossRef]
  39. Fu, G.; Wu, J.S. Validation of MODIS Collection 6 FPAR/LAI in the alpine grassland of the Northern Tibetan Plateau. Remote Sens. Lett. 2017, 8, 831–838. [Google Scholar] [CrossRef]
  40. Cortez, P. Data Mining with Neural Networks and Support Vector Machines Using the R/rminer Tool. In Proceedings of the 10th Industrial Conference on Data Mining, Berlin, Germany, 12–14 July 2010. [Google Scholar]
  41. Breiman, L. Random forests. Mach. Learn. 2001, 45, 5–32. [Google Scholar] [CrossRef] [Green Version]
  42. Freund, Y.; Schapire, R.E. A decision-theoretic generalization of on-line learning and an application to boosting. J. Comput. Syst. Sci. 1997, 55, 119–139. [Google Scholar] [CrossRef]
Figure 1. Sampling points.
Remotesensing 14 05007 g001
Figure 2. Correlations between the simulated and observed species richness of the plant community under fencing (a,c,e,g,i,k) and grazing (b,d,f,h,j,l) scenes, for random forest (a,b), generalized boosted regression (c,d), artificial neural network (e,f), multiple linear regression (g,h), support vector machines (i,j) and recursive regression trees (k,l). The solid lines indicate the linear fitted lines between the simulated and observed species richness. SRp: potential species richness; SRa: actual species richness. All the regressions were significant at p < 0.001.
Remotesensing 14 05007 g002
Figure 3. Correlations between the simulated and observed Shannon of the plant community under fencing (a,c,e,g,i,k) and grazing (b,d,f,h,j,l) scenes, for random forest (a,b), generalized boosted regression (c,d), artificial neural network (e,f), multiple linear regression (g,h), support vector machines (i,j) and recursive regression trees (k,l). The solid lines indicate the linear fitted lines between the simulated and observed Shannon. Shannonp: potential Shannon; Shannona: actual Shannon. All the regressions were significant at p < 0.001.
Remotesensing 14 05007 g003
Figure 4. Correlations between the simulated and observed Simpson of the plant community under fencing (a,c,e,g,i,k) and grazing (b,d,f,h,j,l) scenes, for random forest (a,b), generalized boosted regression (c,d), artificial neural network (e,f), multiple linear regression (g,h), support vector machines (i,j) and recursive regression trees (k,l). The solid lines indicate the linear fitted lines between the simulated and observed Simpson. Simpsonp: potential Simpson; Simpsona: actual Simpson. All the regressions were significant at p < 0.001.
Remotesensing 14 05007 g004
Figure 5. Correlations between the simulated and observed Pielou of the plant community under fencing (a,c,e,g,i,k) and grazing (b,d,f,h,j,l) scenes, for random forest (a,b), generalized boosted regression (c,d), artificial neural network (e,f), multiple linear regression (g,h), support vector machines (i,j) and recursive regression trees (k,l). The solid lines indicate the linear fitted lines between the simulated and observed Pielou. Pieloup: potential Pielou; Pieloua: actual Pielou. All the regressions were significant at p < 0.001.
Remotesensing 14 05007 g005
Table 1. The parameters for random forest, generalized boosted regression, artificial neural network, multiple linear regression, support vector machines and recursive regression trees of potential and actual species richness, Shannon, Simpson and Pielou, respectively.
DiversityScenesRandom ForestGeneralized Boosted RegressionArtificial Neural NetworkMultiple Linear RegressionSupport Vector MachinesRecursive Regression Trees
R2Mean Square ErrorsntreemtryTreesMean train ErrorMean cv ErrorErrorSizeInterceptTemperaturePrecipitationRadiationNDVIR2Mean residualsMean Decision ValuesgammarhoSupport Vector NosR2
SRPotential0.731.9413439872.703.49286.7405.260.000.010.00 0.25 0.10−0.040.3304410.57
Actual0.623.0312449533.214.57263.340−2.960.23 0.010.000.000.190.23−0.080.2503350.43
ShannonPotential 0.720.0611729930.090.1150.370−1.450.040.000.00 0.09−0.030.070.3314320.45
Actual 0.610.0911819690.100.1243.308−0.990.06 0.000.000.000.10−0.010.030.2513230.53
SimpsonPotential0.720.0119619910.010.0217.960−0.820.020.000.00 0.17−0.030.180.3314200.45
Actual0.620.0116339420.010.0113.588−0.410.020.000.000.000.13−0.020.140.2503110.52
PielouPotential0.710.0144819690.010.0113.100−0.820.020.000.00 0.37−0.020.130.3313780.67
Actual 0.730.0121039120.010.0112.350−0.380.02 0.000.000.000.39 −0.020.100.2502870.70
Table 2. The relative bias (%) and RMSE values between observed and simulated potential and actual α-diversity of the plant community (n = 30).
ModelsPotential α-DiversityActual α-Diversity
Species RichnessShannonSimpsonPielouSpecies RichnessShannonSimpsonPielou
Relative biasRandom forest−1.00−1.09−1.810.704.39−4.49−0.591.17
Generalized boosted regression−1.40−2.80−1.40−0.904.61−2.54−0.150.94
Artificial neural network−1.23−1.07−0.03−1.710.499.144.370.09
Multiple linear regression−1.23−1.07−0.03−1.710.496.530.880.09
Support vector machines−6.53−0.192.010.79−3.92−0.285.692.88
Recursive regression trees0.01−1.32−4.02−0.474.85−4.131.550.30
RMSERandom forest1.100.170.090.051.580.320.100.09
Generalized boosted regression1.140.200.090.061.600.340.110.09
Artificial neural network1.930.410.150.072.370.520.140.14
Multiple linear regression1.930.410.150.072.370.500.120.14
Support vector machines1.890.310.130.071.880.400.120.11
Recursive regression trees1.700.230.080.071.800.370.120.10
Publisher’s Note: MDPI stays neutral with regard to jurisdictional claims in published maps and institutional affiliations.

