
Characterization of Extremely Fresh Biomass Burning Aerosol by Means of Lidar Observations
 , , , , , , , ,
Abstract
:1. Introduction
2. Experimental Set-Up
2.1. Multiwavelength Raman Lidar
2.2. AERONET Sun Photometer
3. Results: Forest Fire Event on 14 August 2021
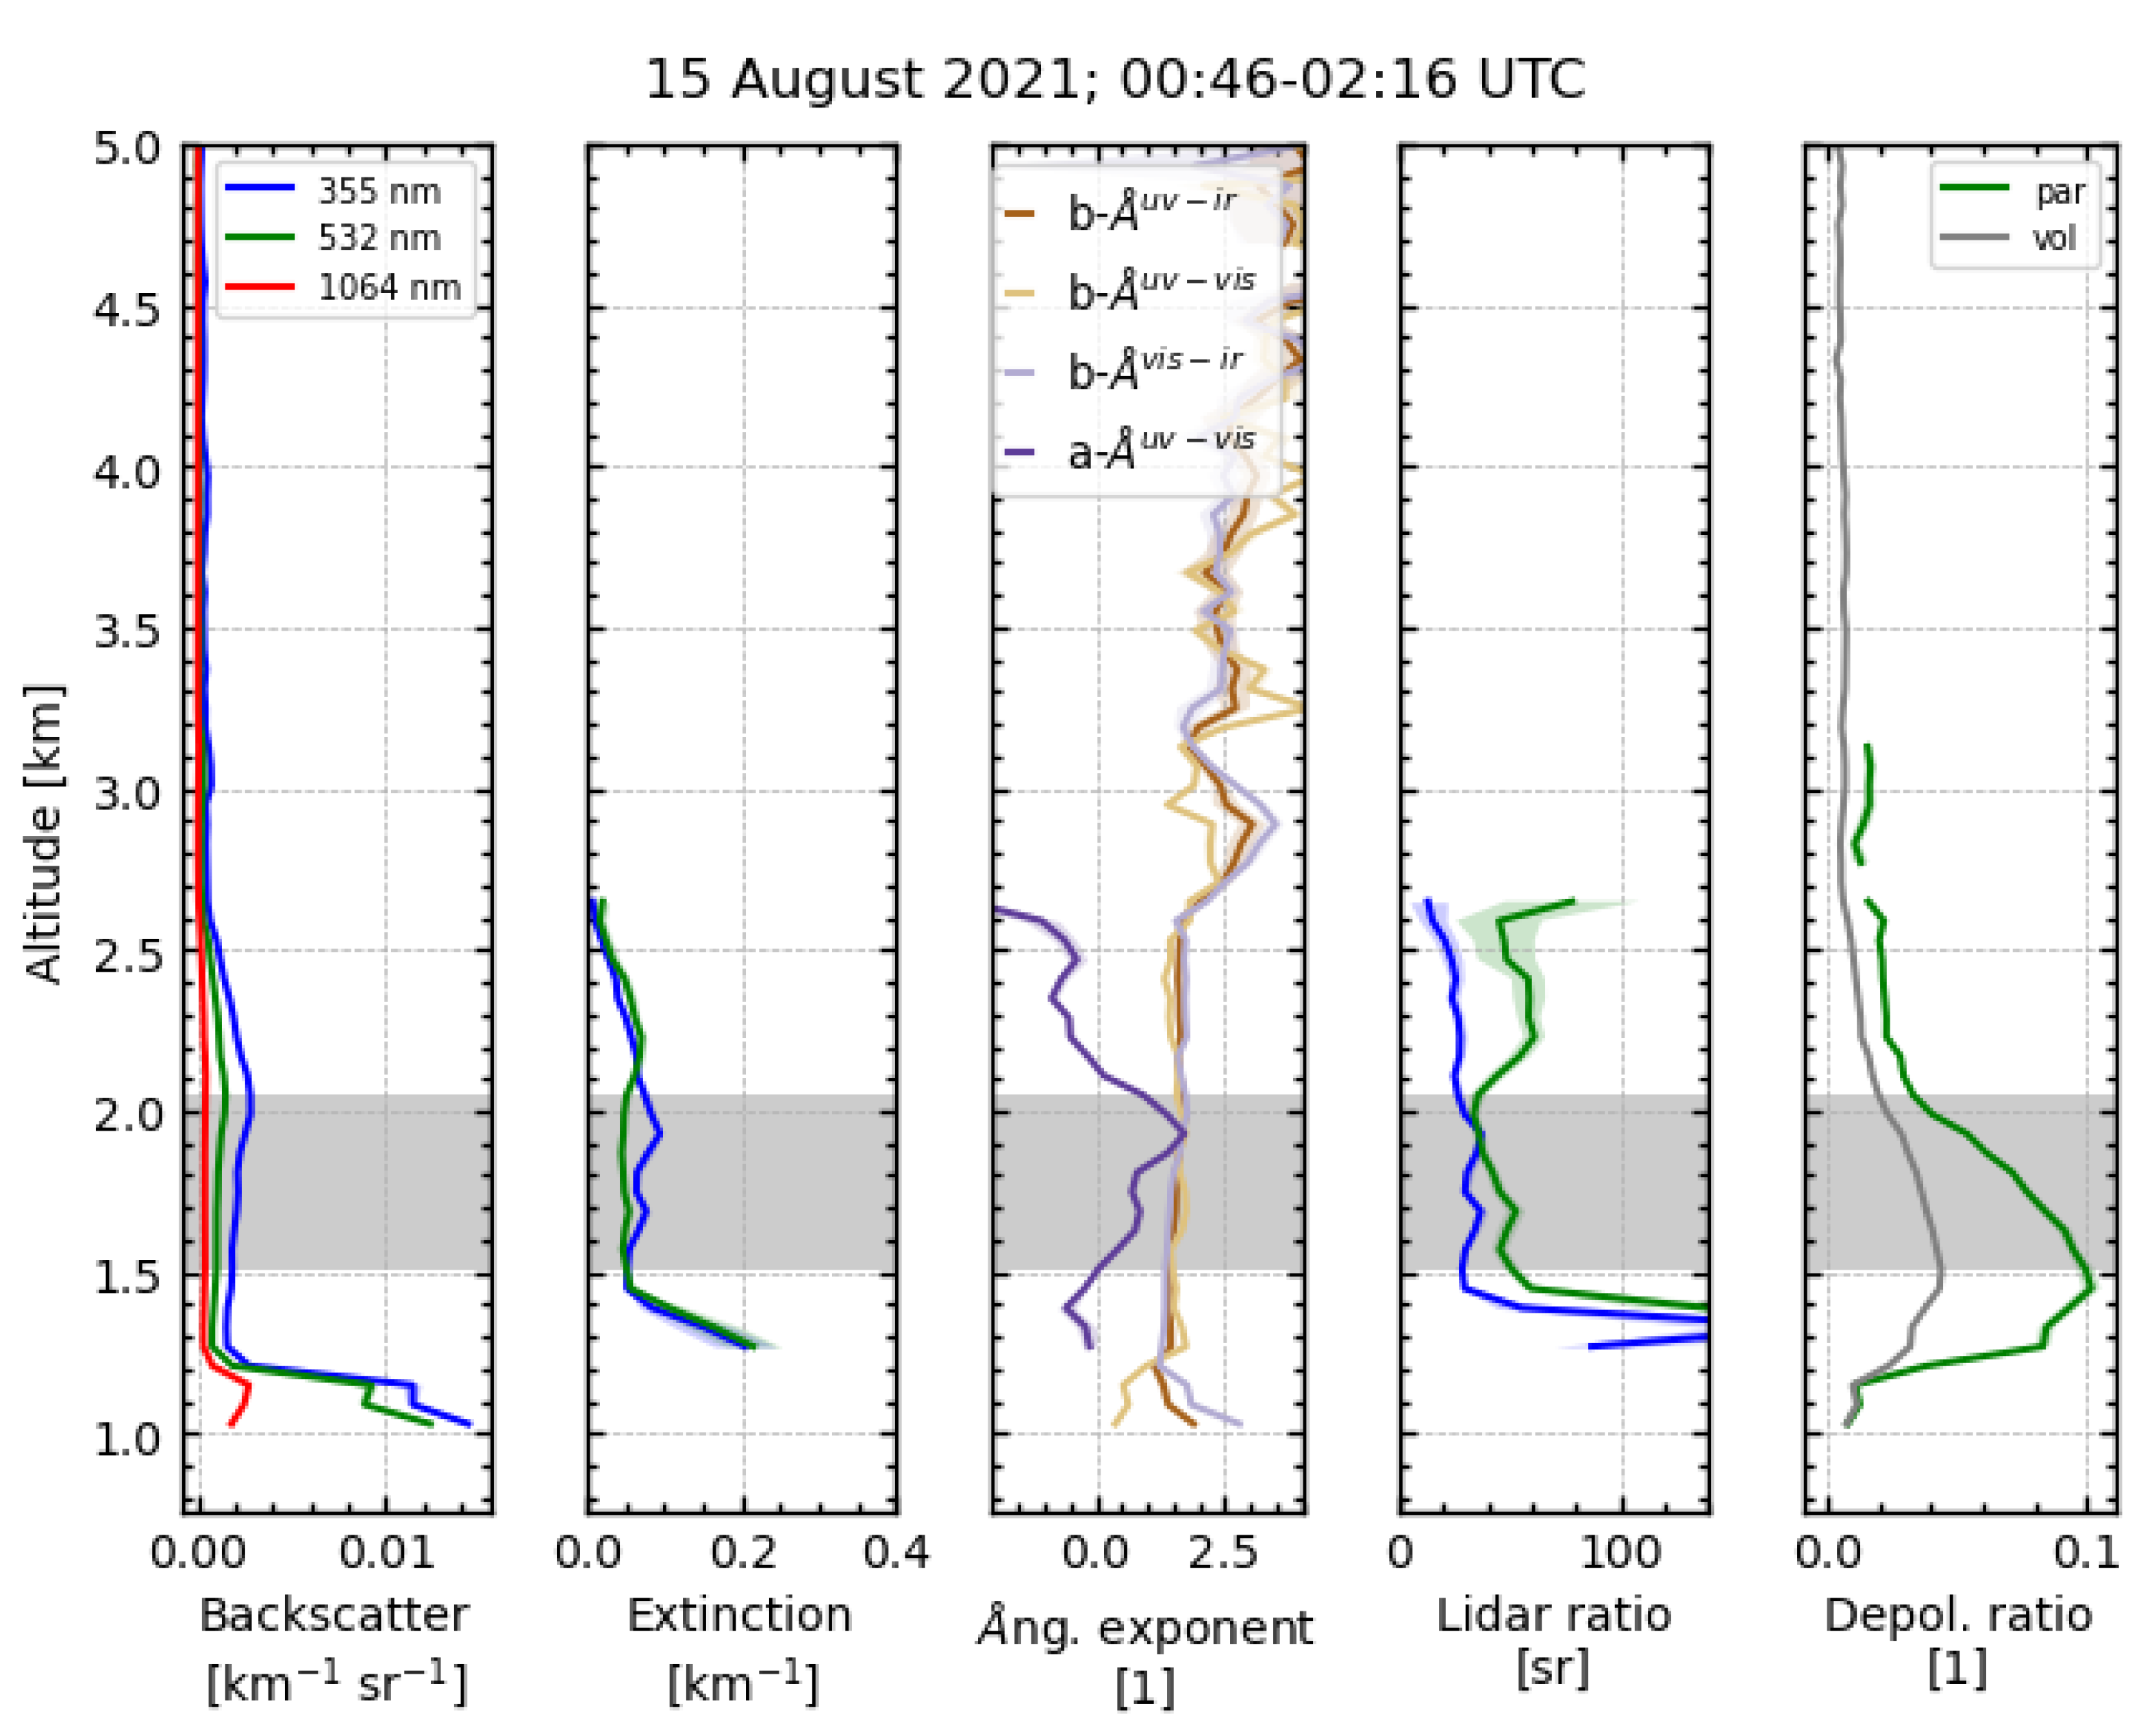
3.1. Lidar Measurements
3.2. Sun Photometer Measurements
4. Conclusions
Author Contributions
Funding
Data Availability Statement
Acknowledgments
Conflicts of Interest
References
- San-Miguel-Ayanz, J.; Durrant, T.; Boca, R.; Maianti, P.; Libertà, G.; Vivancos, T.A.; Oom, D.; Branco, A.; De Rigo, D.; Ferrari, D.; et al. Advance Report on Wildfires in Europe, Middle East and North Africa 2021; EUR 31028 EN; Publications Office of the European Union: Luxembourg, 2022; ISBN 978-92-76-49633-5. [Google Scholar]
- Formenti, P.; Reiner, T.; Sprung, D.; Andreae, M.; Wendisch, M.; Wex, H.; Kindred, D.; Dewey, K.; Kent, J.; Tzortziou, M.; et al. STAAARTE-MED 1998 summer airborne measurements over the Aegean Sea 1. Aerosol particles and trace gases. J. Geophys. Res. 2002, 107, 4451–4464. [Google Scholar]
- Myers, N.; Mittermeier, R.A.; Mittermeier, C.G.; Da Fonseca, G.A.B.; Kent, J. Biodiversity hotspots for conservation priorities. Nature 2000, 403, 853–858. [Google Scholar] [PubMed]
- Somot, S.; Sevault, F.; Déqué, M.; Crépon, M. 21st century climate change scenario for the Mediterranean using a coupled atmosphere–ocean regional climate model. Glob. Planet. Chang. 2008, 63, 112–126. [Google Scholar]
- Adam, M.; Stachlewska, I.S.; Mona, L.; Papagiannopoulos, N.; Bravo-Aranda, J.A.; Sicard, M.; Nicolae, D.N.; Belegante, L.; Janicka, L.; Szczepanik, D.; et al. Biomass burning events measured by lidars in EARLINET—Part 2: Optical properties investigation. Atmos. Chem. Phys. Discuss. 2021, preprint. [Google Scholar]
- Turpin, B.J.; Lim, H.J. Species Contributions to PM2.5 Mass Concentrations: Revisiting Common Assumptions for Estimating Organic Mass. Aerosol Sci. Technol. 2001, 35, 602–610. [Google Scholar] [CrossRef]
- Reid, J.S.; Hobbs, P.V. Physical and optical properties of smoke from individual biomass fires in Brazil. J. Geophys. Res. 1998, 103, 32013–32031. [Google Scholar]
- Kaufman, Y.J.; Koren, I.; Remer, L.A.; Rosenfeld, D.; Rudich, Y. The effect of smoke, dust, and pollution aerosol on shallow cloud development over the Atlantic Ocean. PNAS 2005, 102, 11207–11212. [Google Scholar] [PubMed] [Green Version]
- Amiridis, V.; Balis, D.S.; Giannakaki, E.; Stohl, A.; Kazadzis, S.; Koukouli, M.E.; Zanis, P. Optical characteristics of biomass burning aerosols over Southeastern Europe determined from UV-Raman lidar measurements. Atmos. Chem. Phys. 2009, 9, 2431–2440. [Google Scholar]
- Veselovskii, I.; Whiteman, D.N.; Korenskiy, M.; Suvorina, A.; Kolgotin, A.; Lyapustin, A.; Wang, Y.; Chin, M.; Bian, H.; Kucsera, T.L.; et al. Characterization of forest fire smoke event near Washington, DC in summer 2013 with multi-wavelength lidar. Atmos. Chem. Phys. 2015, 15, 1647–1660. [Google Scholar]
- Matthias, V.; Balis, D.; Bösenberg, J.; Eixmann, R.; Iarlori, M.; Komguem, L.; Mattis, I.; Papayannis, A.; Pappalardo, G.; Perrone, M.R.; et al. Vertical aerosol distribution over Europe: Statistical analysis of Raman lidar data from 10 European Aerosol Research Lidar Network (EARLINET) stations. J. Geophys. Res. 2004, 109, D18201. [Google Scholar]
- Nicolae, D.; Nemuc, A.; Müller, D.; Talianu, C.; Vasilescu, J.; Belegante, L.; Kolgotin, A. Characterization of fresh and aged biomass burning events using multiwavelength Raman lidar and mass spectrometry. J. Geophys. Res. 2013, 118, 2956–2965. [Google Scholar]
- Giannakaki, E.; Van Zyl, P.G.; Müller, D.; Balis, D.; Komppula, M. Optical and microphysical characterization of aerosol layers over South Africa by means of multi-wavelength depolarization and Raman lidar measurements. Atmos. Chem. Phys. 2016, 16, 8109–8123. [Google Scholar]
- Papagiannopoulos, N.; Mona, L.; Amodeo, A.; D’Amico, G.; GumàClaramunt, P.; Pappalardo, G.; Alados-Arboledas, L.; Guerrero-Rascado, J.L.; Amiridis, V.; Kokkalis, P.; et al. An automatic observation-based aerosol typing method for EARLINET. Atmos. Chem. Phys. 2018, 18, 15879–15901. [Google Scholar]
- Veselovskii, I.; Kolgotin, A.; Griaznov, V.; Müller, D.; Wandinger, U.; Whiteman, D.N. Inversion with regularization for the retrieval of tropospheric aerosol parameters from multiwavelength lidar sounding. Appl. Optics 2002, 41, 3685–3699. [Google Scholar]
- Lopatin, A.; Dubovik, O.; Chaikovsky, A.; Goloub, P.; Lapyonok, T.; Tanré, D.; Litvinov, P. Enhancement of aerosol characterization using synergy of lidar and sun-photometer coincident observations: The GARRLiC algorithm. Atmos. Meas. Tech. 2013, 6, 2065–2088. [Google Scholar]
- Binietoglou, I.; Basart, S.; Alados-Arboledas, L.; Amiridis, V.; Argyrouli, A.; Baars, H.; Baldasano, J.M.; Balis, D.; Belegante, L.; Bravo-Aranda, J.A.; et al. A methodology for investigating dust model performance using synergistic EARLINET/AERONET dust concentration retrievals. Atmos. Meas. Tech. 2015, 8, 3577–3600. [Google Scholar]
- Madonna, F.; Amodeo, A.; Boselli, A.; Cornacchia, C.; Cuomo, V.; D’Amico, G.; Giunta, A.; Mona, L.; Pappalardo, G. CIAO: The CNR-IMAA advanced observatory for atmospheric research. Atmos. Meas. Tech. 2011, 4, 1191–1208. [Google Scholar]
- Mona, L.; D’Amico, G.; Gagliardi, S.; Amato, F.; Amodeo, A.; Ciamprone, S.; De Rosa, B.; Ripepi, E.; Summa, D.; Alados-Arboledas, L.; et al. Pilot Provision of EARLINET/ACTRIS Lidar profiles to CAMS. In Proceedings of the EGU General Assembly Conference Abstracts, Virtual, 19–30 April 2021; p. EGU21-14943. [Google Scholar]
- Freudenthaler, V.; Esselborn, M.; Wiegner, M.; Heese, B.; Tesche, M.; Ansmann, A.; Müller, D.; Althausen, D.; Wirth, M.; Fix, A.; et al. Depolarization ratio profiling at several wavelengths in pure Saharan dust during SAMUM 2006. Tellus B Chem. Phys. Meteorol. 2009, 61, 165–179. [Google Scholar]
- Pappalardo, G.; Amodeo, A.; Apituley, A.; Comeron, A.; Freudenthaler, V.; Linné, H.; Ansmann, A.; Bösenberg, J.; D’Amico, G.; Mattis, I.; et al. EARLINET: Towards an advanced sustainable European aerosol lidar network. Atmos. Meas. Tech. 2014, 7, 2389–2409. [Google Scholar]
- Baars, H.; Ansmann, A.; Althausen, D.; Engelmann, R.; Heese, B.; Müller, D.; Artaxo, P.; Paixao, M.; Pauliquevis, T.; Souza, R. Aerosol profiling with lidar in the Amazon Basin during the wet and dry season. J. Geophys. Res. Atmos. 2012, 117, D21. [Google Scholar]
- Müller, D.; Ansmann, A.; Mattis, I.; Tesche, M.; Wandinger, U.; Althausen, D.; Pisani, G. Aerosol-type-dependent lidar ratios observed with Raman lidar. J. Geophys. Res.-Atmos. 2007, 112, 2156–2202. [Google Scholar]
- Müller, D.; Wandinger, U.; Ansmann, A. Microphysical particle parameters from extinction and backscatter lidar data by inversion with regularization. Theory, Appl. Opt. 1999, 38, 2346–2357. [Google Scholar] [PubMed]
- Ansmann, A.; Müller, D. Lidar and Atmospheric Aerosol Particles. In Lidar—Range-Resolved Optical Remote Sensing of the Atmosphere; Weitkamp, C., Ed.; Springer: New York, NY, USA; pp. 105–141.
- Tikhonov, A.N.; Arsenin, V.Y. Solution of Ill-Posed Problems; Wiley: New York, NY, USA, 1977. [Google Scholar]
- Veselovskii, I.; Whiteman, D.N.; Kolgotin, A.; Andrews, E.; Korenskii, M. Demonstration of aerosol property profiling by multiwavelength lidar under varying relative humidity conditions. J. Atmos. Oceanic Technol. 2009, 26, 1543–1557. [Google Scholar]
- Veselovskii, I.; Dubovik, O.; Kolgotin, A.; Korenskiy, M.; Whiteman, D.N.; Allakhverdiev, K.; Huseyinoglu, F. Linear estimation of particle bulk parameters from multi-wavelength lidar measurements. Atmos. Meas. Tech. 2012, 5, 1135–1145. [Google Scholar]
- Volkova, K.A.; Poberovsky, A.V.; Timofeev, Y.M.; Ionov, D.V.; Holben, B.N.; Smirnov, A.; Slutsker, I. Aerosol optical characteristics retrieved from CIMEL sun photometer measurements (AERONET) near St. Petersburg. Atmos. Ocean. Opt. 2018, 31, 635–641. [Google Scholar]
- Keeley, J.E. Fire intensity, fire severity and burn severity: A brief review and suggested usage. Int. J. Wildland Fire 2009, 18, 116–126. [Google Scholar]
- Brioude, J.; Arnold, D.; Stohl, A.; Cassiani, M.; Morton, D.; Seibert, P.; Angevine, W.; Evan, S.; Dingwell, A.; Fast, J.D.; et al. The Lagrangian particle dispersion model FLEXPART-WRF version 3.1. Geosci. Model Dev. 2013, 6, 1889–1904. [Google Scholar]
- Pisso, I.; Sollum, E.; Grythe, H.; Kristiansen, N.I.; Cassiani, M.; Eckhardt, S.; Arnold, D.; Don Morton, D.; Thompson, R.L.; Zwaaftink, C.D.G.; et al. The Lagrangian particle dispersion model FLEXPART version 10.4. Geosci. Model Dev. 2019, 12, 4955–4997. [Google Scholar]
- Skamarock, W.C.; Klemp, J.B.; Dudhia, J.; Gill, D.O.; Liu, Z.; Berner, J.; Wang, W.; Powers, J.G.; Duda, M.G.; Barker, D.M.; et al. A Description of the Advanced Research WRF Model Version 4; National Center for Atmospheric Research: Boulder, CO, USA, 2019; p. 145. [Google Scholar]
- Val Martin, M.; Logan, J.A.; Kahn, R.A.; Leung, F.Y.; Nelson, D.L.; Diner, D.J. Smoke injection heights from fires in North America: Analysis of 5 years of satellite observations. Atmos. Chem. Phys. 2010, 10, 1491–1510. [Google Scholar]
- D’Amico, G.; Amodeo, A.; Mattis, I.; Freudenthaler, V.; Pappalardo, G. EARLINET Single Calculus Chain–technical–Part 1: Pre-processing of raw lidar data. Atmos. Meas. Tech. 2016, 9, 491–507. [Google Scholar]
- Bravo-Aranda, J.A.; Titos, G.; Granados-Muñoz, M.J.; GuerreroRascado, J.L.; Navas-Guzmán, F.; Valenzuela, A.; Lyamani, H.; Olmo, F.J.; Andrey, J.; Alados-Arboledas, L. Study of mineral dust entrainment in the planetary boundary layer by lidar depolarization technique. Tellus B 2015, 67, 26180. [Google Scholar]
- Granados-Muñoz, M.J.; Guerrero-Rascado, J.L.; Bravo-Aranda, J.A.; Navas-Guzmán, F.; Valenzuela, A.; Lyamani, H.; Chaikovsky, A.; Wandinger, U.; Ansmann, A.; Dubovik, O.; et al. Retrieving aerosol microphysical properties by Lidar-Radiometer Inversion Code (LIRIC) for different aerosol types. J. Geophys. Res.-Atmos. 2014, 119, 4836–4858. [Google Scholar]
- Müller, D.; Böckmann, C.; Kolgotin, A.; Schneidenbach, L.; Chemyakin, E.; Rosemann, J.; Znak, P.; Romanov, A. Microphysical particle properties derived from inversion algorithms developed in the framework of EARLINET. Atmos. Meas. Tech. 2016, 9, 5007–5035. [Google Scholar]
- Reid, J.S.; Koppmann, R.; Eck, T.F.; Eleuterio, D.P. A review of biomass burning emissions part II: Intensive physical properties of biomass burning particles. Atmos. Chem. Phys. 2005, 5, 799–825. [Google Scholar]
- Reid, J.S.; Eck, T.F.; Christopher, S.A.; Koppmann, R.O.; Dubovik, O.; Eleuterio, D.P.; Holben, B.N.; Reid, E.A.; Zhang, J. A review of biomass burning emissions: Part III. Intensive optical properties of biomass burning particles. Atmos. Chem. Phys. 2005, 5, 827–849. [Google Scholar]
- Müller, D.; Mattis, I.; Wandinger, U.; Ansmann, A.; Althausen, D. Raman lidar observations of aged Siberian and Canadian forest fire smoke in the free troposphere over Germany in 2003: Microphysical particle characterization. J. Geophys. Res. 2005, 110, D17201. [Google Scholar]
- Alados-Arboledas, L.; Müller, D.; Guerrero-Rascado, J.L.; Navas Guzmán, F.; Pérez-Ramírez, D.; Olmo, F.J. Optical and microphysical properties of fresh biomass burning aerosol retrieved by Raman lidar, and star-and sun-photometry. Geophys. Res. Lett. 2011, 38, L01807. [Google Scholar]
- Veselovskii, I.; Kolgotin, A.; Griaznov, V.; Müller, D.; Franke, K.; Whiteman, D.N. Inversion of multiwavelength Raman lidar data for retrieval of bimodal aerosol size distribution. Appl. Optics 2004, 43, 1180–1195. [Google Scholar]
- Eck, T.F.; Holban, B.N.; Reid, J.S.; Sinyuk, A.; Hyer, E.J.; O’Neill, N.T.; Shaw, G.E.; Vande Castle, J.R.; Chapin, F.S.; Dubovik, O.; et al. Optical properties of boreal region biomass burning aerosols in central Alaska and seasonal variation of aerosol optical depth at an Arctic coastal site. J. Geophys. Res. 2009, 114, D11201. [Google Scholar]
- Samaras, S.; Nicolae, D.; Böckmann, C.; Vasilescu, C.; Binietoglou, I.; Labzovskii, L.; Toanca, F.; Papayannis, A. Using Raman-lidar-based regularized microphysical retrievals and Aerosol Mass Spectrometer measurements for the characterization of biomass burning aerosols. J. Comput. Phys. 2015, 299, 156–174. [Google Scholar]
- Wandinger, U.; Müller, D.; Böckmann, C.; Althausen, D.; Matthias, V.; Bösenberg, J.; Weiß, V.; Fiebig, M.; Wendisch, M.; Stohl, A.; et al. Optical and microphysical characterization of biomass-burning and industrial-pollution aerosols from multiwavelength lidar and aircraft measurements. J. Geophys. Res. -Atmos. 2002, 107, LAC 7-1. [Google Scholar]
- Martins, J.V.; Artaxo, P.; Hobbs, P.V.; Liousse, C.; Cachier, H.; Kaufman, Y.; Plana-Fattori, A. Particle size distributions, elemental compositions, carbon measurements, and optical properties of smoke from biomass burning in the Pacific North west of the United States. In Global Biomass Burning and Global Change; Levine, J.S., Ed.; MIT Press: Cambridge, MA, USA, 1996; pp. 716–732. [Google Scholar]
- Nepomuceno Pereira, S.; Preißler, J.; Guerrero-Rascado, J.L.; Silva, A.M.; Wagner, F. Forest fire smoke layers observed in the free troposphere over Portugal with a multiwavelength Raman lidar: Optical and microphysical properties. Sci. World J. 2014, 2014, 421838. [Google Scholar]


| Date and time | LR355 | LR532 | Reff (µm) | mR | mI | Age |
|---|---|---|---|---|---|---|
| 15 August 2021, Potenza | 40 | 50 | 0.2 | 1.59 | 0.01 | <10 min |
| 14 August 2021, Potenza | 40 | 38 | 0.15 | 1.58 | 0.006 | <10 min |
| 17 October 2011, Evora [48] | 64 | 51 | 0.19 | 1.61 | 0.01 | 1 day |
| 9 August 2010, Bucharest [12] | 41 | 56 | 0.34 | 1.65 | 0.01 | 2 days |
| 29 July 2010, Bucharest [12] | 73 | 45 | 0.27 | 1.66 | 0.01 | 1 day |
| 22 July 2010, Bucharest [12] | 48 | 54 | 0.35 | 1.41 | 0.03 | 2 days |
| 15 August 2008, Silvicultura research site (Amazonia) [38] | 43 | 41 | 0.13 | missing | missing | 5 h |
| 26 September 2007, Granada [43] | 60 | 65 | 0.15 | 1.53 | 0.02 | 1 day |
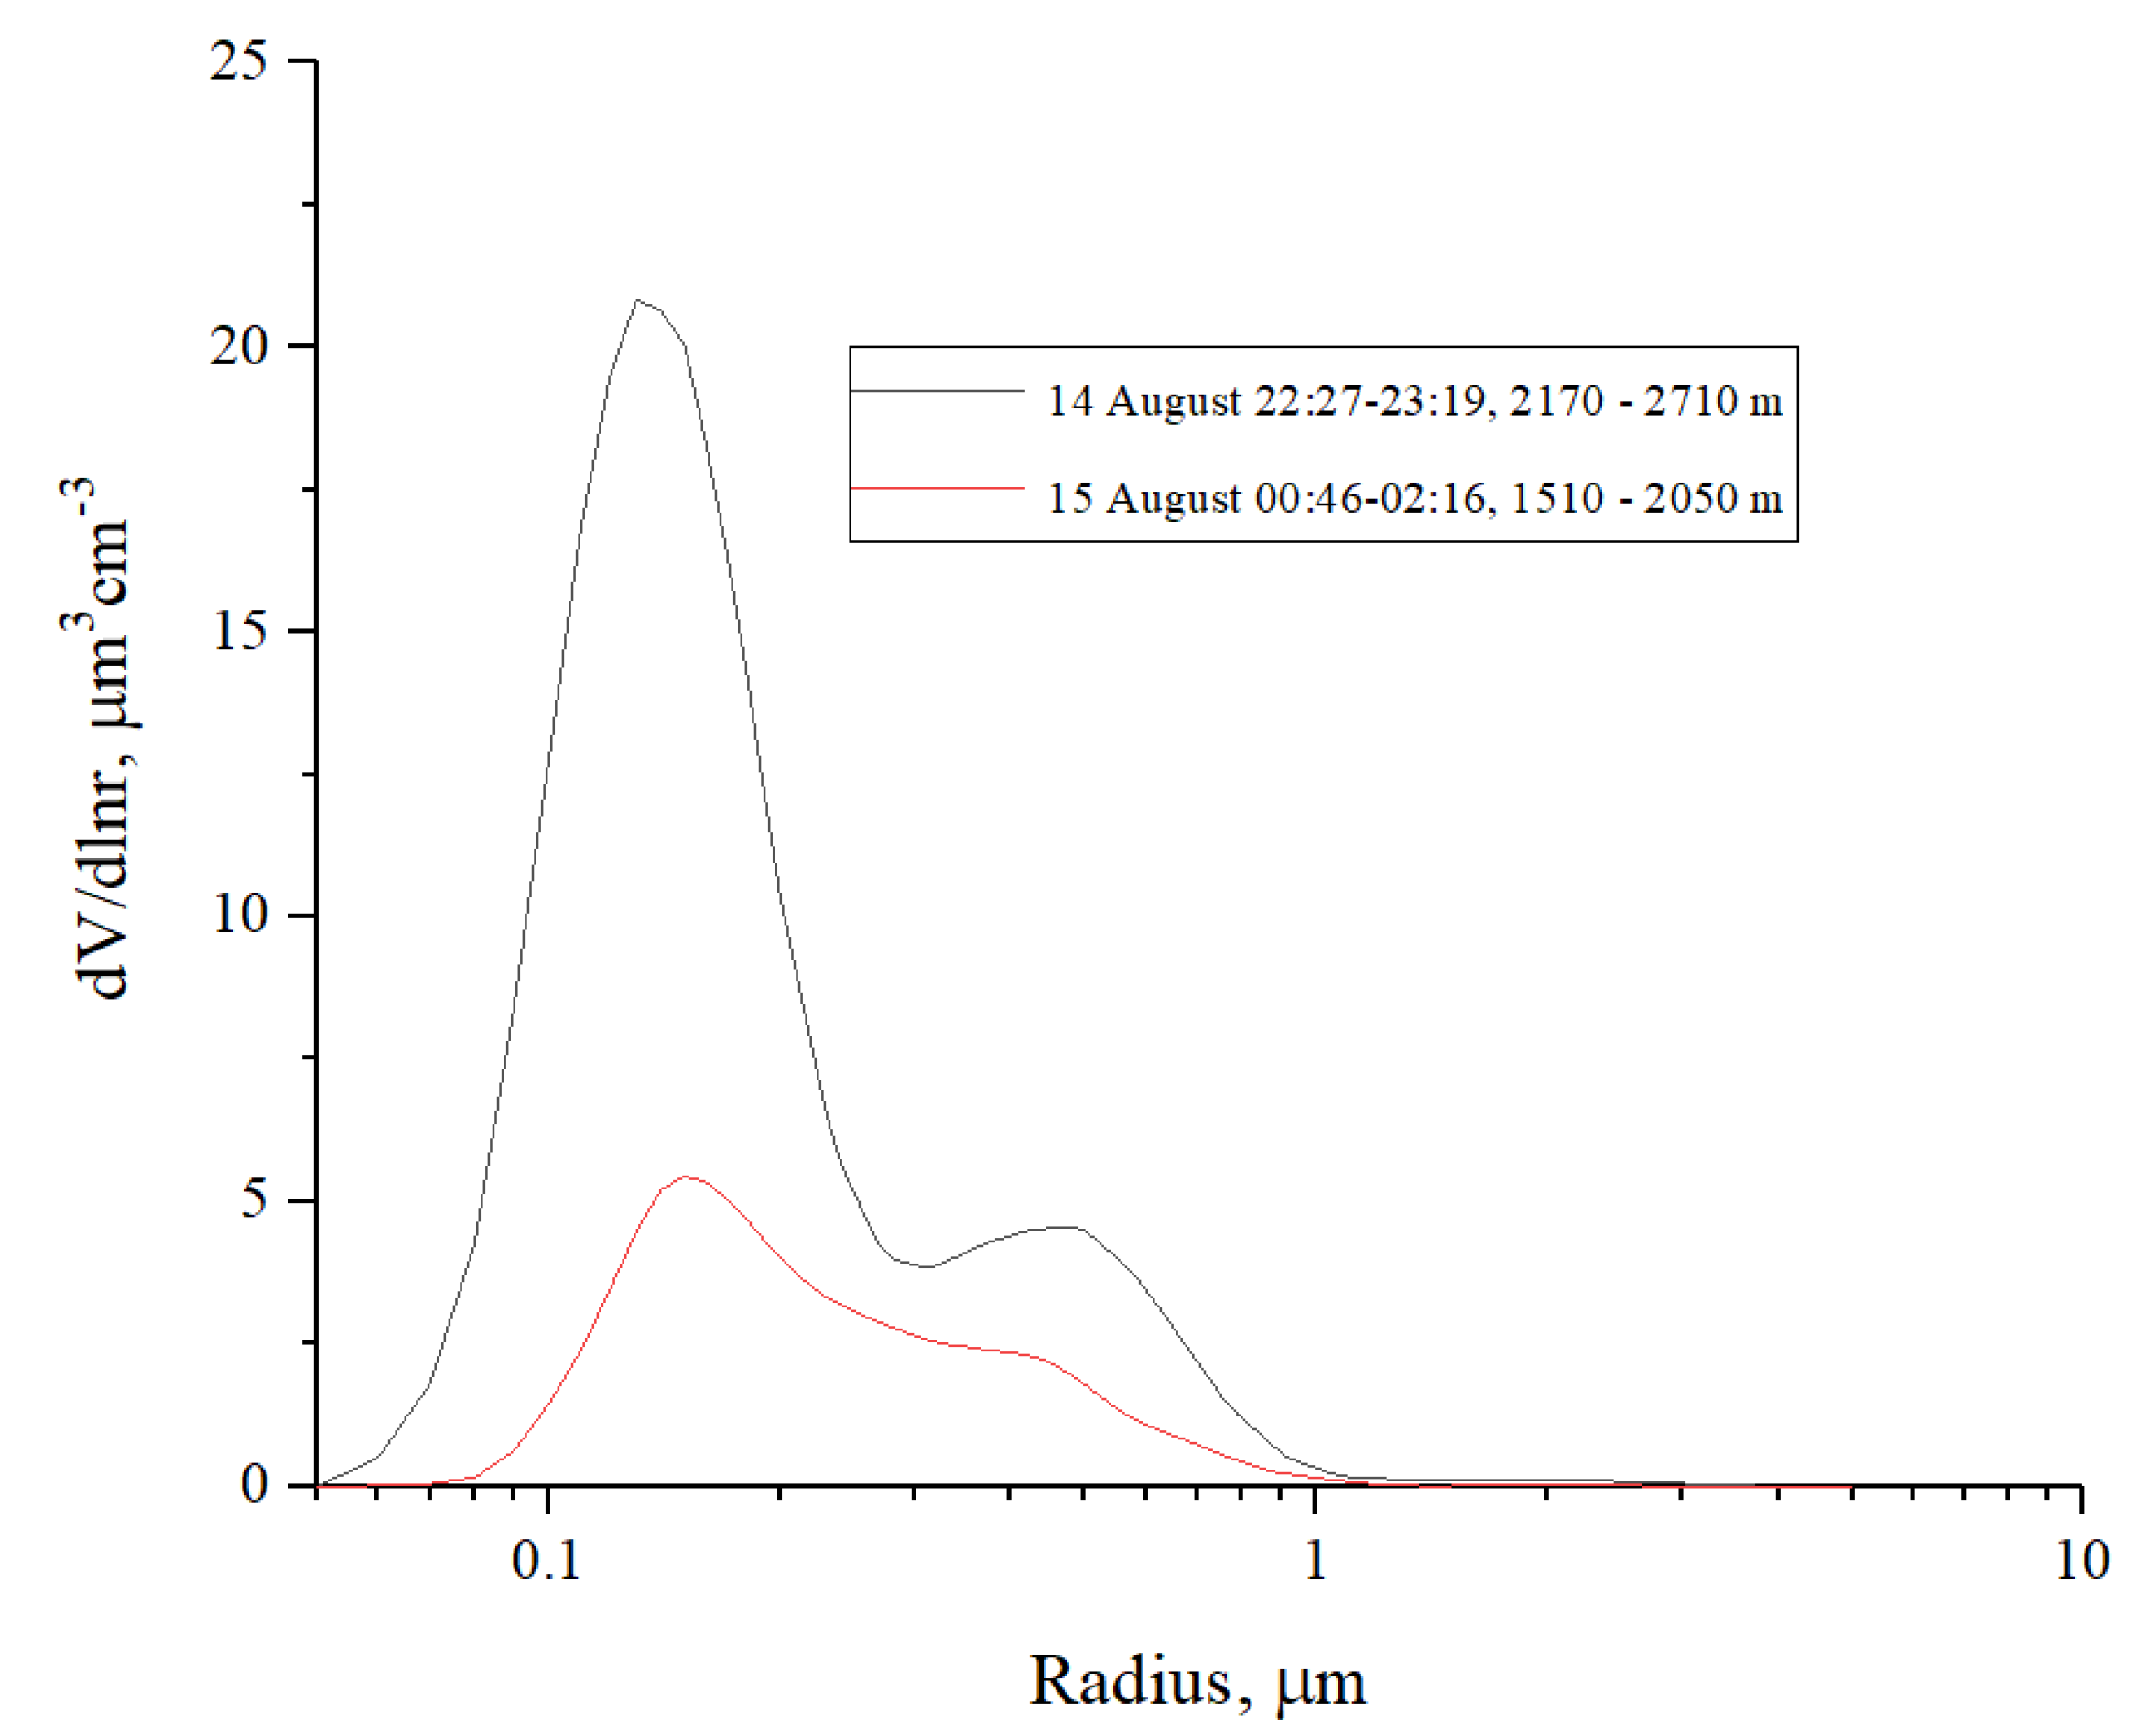
| Date and Time | Reff (µm) | N (cm−3) | S (µm2 cm−3) | V (µm3 cm−3) | mR | mR | SSA at 355, 532, 1064 nm |
|---|---|---|---|---|---|---|---|
| 15 August 2021, Potenza | 0.2 | 340 | 94 | 6.1 | 1.59 | 0.01 | 0.946, 0.949, 0.942 |
| 14 August 2021, Potenza | 0.15 | 2300 | 410 | 21 | 1.58 | 0.006 | 0.964, 0.967, 0.953 |
Publisher’s Note: MDPI stays neutral with regard to jurisdictional claims in published maps and institutional affiliations. |
© 2022 by the authors. Licensee MDPI, Basel, Switzerland. This article is an open access article distributed under the terms and conditions of the Creative Commons Attribution (CC BY) license (https://creativecommons.org/licenses/by/4.0/).
Share and Cite
De Rosa, B.; Amato, F.; Amodeo, A.; D’Amico, G.; Dema, C.; Falconieri, A.; Giunta, A.; Gumà-Claramunt, P.; Kampouri, A.; Solomos, S.; et al. Characterization of Extremely Fresh Biomass Burning Aerosol by Means of Lidar Observations. Remote Sens. 2022, 14, 4984. https://doi.org/10.3390/rs14194984
De Rosa B, Amato F, Amodeo A, D’Amico G, Dema C, Falconieri A, Giunta A, Gumà-Claramunt P, Kampouri A, Solomos S, et al. Characterization of Extremely Fresh Biomass Burning Aerosol by Means of Lidar Observations. Remote Sensing. 2022; 14(19):4984. https://doi.org/10.3390/rs14194984
Chicago/Turabian StyleDe Rosa, Benedetto, Francesco Amato, Aldo Amodeo, Giuseppe D’Amico, Claudio Dema, Alfredo Falconieri, Aldo Giunta, Pilar Gumà-Claramunt, Anna Kampouri, Stavros Solomos, and et al. 2022. "Characterization of Extremely Fresh Biomass Burning Aerosol by Means of Lidar Observations" Remote Sensing 14, no. 19: 4984. https://doi.org/10.3390/rs14194984