Article

Vegetation Growth Status and Topographic Effects in Frozen Soil Regions on the Qinghai–Tibet Plateau

1
School of Resources and Materials, Northeastern University at Qinhuangdao Branch, Qinhuangdao 066004, China
2
National Climate Center, China Meteorological Administration, Beijing 100081, China
3
Institute of Ecological Conservation and Restoration, Chinese Academy of Forestry, Beijing 100091, China
4
Institute of Desertification Studies, Chinese Academy of Forestry, Beijing 100091, China
*
Author to whom correspondence should be addressed.
Remote Sens. 2022, 14(19), 4830; https://doi.org/10.3390/rs14194830
Submission received: 4 August 2022 / Revised: 7 September 2022 / Accepted: 23 September 2022 / Published: 27 September 2022

Abstract

:
The Qinghai–Tibet Plateau (QTP), which is known as Earth’s “Third Pole”, is a driver of global climate change, and long-term monitoring of QTP vegetation can reveal changes attributable to climatic and human influences. Previous research monitoring vegetation on the QTP focused primarily on spatiotemporal variations of vegetation indices, while few studies have considered fractional vegetation cover (FVC) in relation to topographic and frozen soil factors. We used MODIS-EVI, digital elevation models, and frozen soil data to investigate topographic effects on vegetation growth status in different soil types on the QTP during 2000–2020. (1) FVC showed a trend of increase during 2000–2020, and the FVC on the QTP decreased from the southeast to the northwest in spatial distribution. FVC in permafrost regions was the lowest, followed by seasonal frozen soil areas; FVC in unfrozen areas was the highest. (2) With increasing elevation, FVC of permafrost, seasonal frozen, and unfrozen soil areas showed downward trends for each aspect. In seasonal frozen soil areas, at elevation ≤4000 m (>4000 m), FVC of sunny (shady) slopes was greater than that of shady (sunny) slopes. In permafrost regions, except at elevations of 3000–4000 m, FVC of shady slopes was greater than that of sunny slopes. In unfrozen soil areas, at elevation >4000 m, FVC of sunny slopes was obviously greater than that of shady slopes. (3) With increasing slope, FVC in seasonal frozen and permafrost soil (unfrozen soil) regions showed a trend of increase (decrease). In seasonal frozen soil areas, FVC of sunny (shady) slopes was greater than that of shady (sunny) slopes on slopes ≤6° (>6°). In permafrost regions, FVC of sunny slopes was less than that of shady slopes. With increasing slope, the influence of aspect became more obvious. In unfrozen soil areas, FVC of sunny slopes was slightly greater than that of shady slopes. Topographic effects especially the elevation and slope effects might significantly affect the spatiotemporal variations of vegetation growth status in frozen soil regions on the QTP.

Graphical Abstract

1. Introduction

The Qinghai–Tibet Plateau (QTP) is the highest plateau in the world and an ecological security barrier in China. It plays an important role in biodiversity protection [1], soil and water conservation [2], and climate change [3]. Frozen soil, which is distributed widely on the QTP and is very sensitive to climate change, can affect not only the local ecology and climatic system but also the global carbon cycle and climate change [4,5]. Thawing of the active layer of permafrost increases soil moisture that can trigger dramatic change from sensible heat flux to latent heat flux in areas of both alpine meadow and bare land [6]. The permafrost layer is considered an impermeable layer, and freezing and thawing processes can change the water phase and water cycle. Adaption or succession will occur in vegetation relying on shallow groundwater with change of the hydrological cycle [7]. Variation of the hydrothermal environment in permafrost regions is manifested by changes of vegetation [8,9]. Field experiments on permafrost presence, microtopography, and shrub canopy revealed that permafrost absence might enhance the survival rate of early tree seedlings [10]. Some studies on the relationship between frozen soil and vegetation concluded that codevelopment or symbiosis exists between frozen soil and vegetation [11]. Frozen soil degradation can promote or inhibit different vegetation communities in cold regions [12,13]. With permafrost degradation, plant species richness will increase [14]. Soil moisture exhibits a trend of decrease in the root layer of vegetation in some areas [15]. Climate change not only causes frozen soil degradation but also changes vegetation coverage in frozen soil regions. With frozen soil degradation on the QTP, vegetation coverage has gradually increased [16,17]. Frequent freeze–thaw cycles in frozen soil also have certain impact on the biomass distribution of vegetation, which is manifested by increase in the aboveground biomass and reduction in the underground root length in the subsequent growth season [18]. Vegetation indexes determined using satellite data in the infrared and red parts of the spectrum are commonly used to assess vegetation growth status [19,20]. Among the dozens of available vegetation indexes, the normalized difference vegetation index is the one used most widely. Chen et al. (2020) used MOD13A2-NDVI data in the growing season (May to September) during 2000–2019 to detect the vegetation spatiotemporal dynamic, analyze the relationship between the vegetation and main driving factors, and predict the future vegetation dynamic on the QTP [21]. However, the normalized difference vegetation index is limited by effects associated with atmospheric noise, soil background, red light saturation, and other problems [22,23]. The enhanced vegetation index (EVI) introduces the blue spectrum, which diminishes the problem of red saturation associated with the normalized difference vegetation index in high-biomass areas, and effectively reduces atmospheric and soil noise, thereby greatly improving vegetation monitoring [24,25]. The QTP is primarily a desert ecosystem, where glaciers, permafrost, and alpine deserts are distributed widely, and vegetation is relatively sparse in many areas. Therefore, EVI might be more accurate than NDVI for vegetation growth status monitoring on the QTP. The hydrothermal distribution attributable to topographic factors in frozen soil regions is also an important factor controlling vegetation growth. Topographic factors such as elevation, slope, and aspect affect the spatial variation of vegetation type, coverage, and biomass [26,27,28,29]. On the basis of previous research, it is evident that to better reflect spatial differences and driving mechanisms, the influence of topography must be considered comprehensively in any evaluation of vegetation growth in frozen soil areas.
The QTP, which is the highest plateau in the world, has complex topography, numerous glaciers, and extensive areas of frozen soil, and its vegetation and ecosystem are fragile. Since the beginning of the 21st century, in association with ongoing industrial development and rapid technological progress, the detrimental impact of human activities on Earth’s surface environment has reached a new level [30]. The problem of how to use natural resources rationally while achieving sustainable economic and ecological development has become widely recognized. In this regard, it is important to study vegetation growth on the QTP, with consideration of the effects of topography and frozen soil, within the context of climate change.
The objective of this research was to study the vegetation growth status and topographic effects in frozen soil regions on the QTP from 2000 to 2020, and to provide a scientific basis for comprehensive understanding of the vegetation growth status and sustainable development on the QTP. We therefore analyzed the trend of FVC change in different frozen soil types since the beginning of the 21st century. Then, variations of FVC and the relationships among FVC and topographic effects, especially the factors of elevation, slope and aspect in different frozen soil types on the QTP were analyzed. Finally, we thoroughly analyzed the causes of FVC variations from natural (e.g., air temperature, accumulate temperature and precipitation) and human factors (e.g., population and policies).

2. Study Area and Data
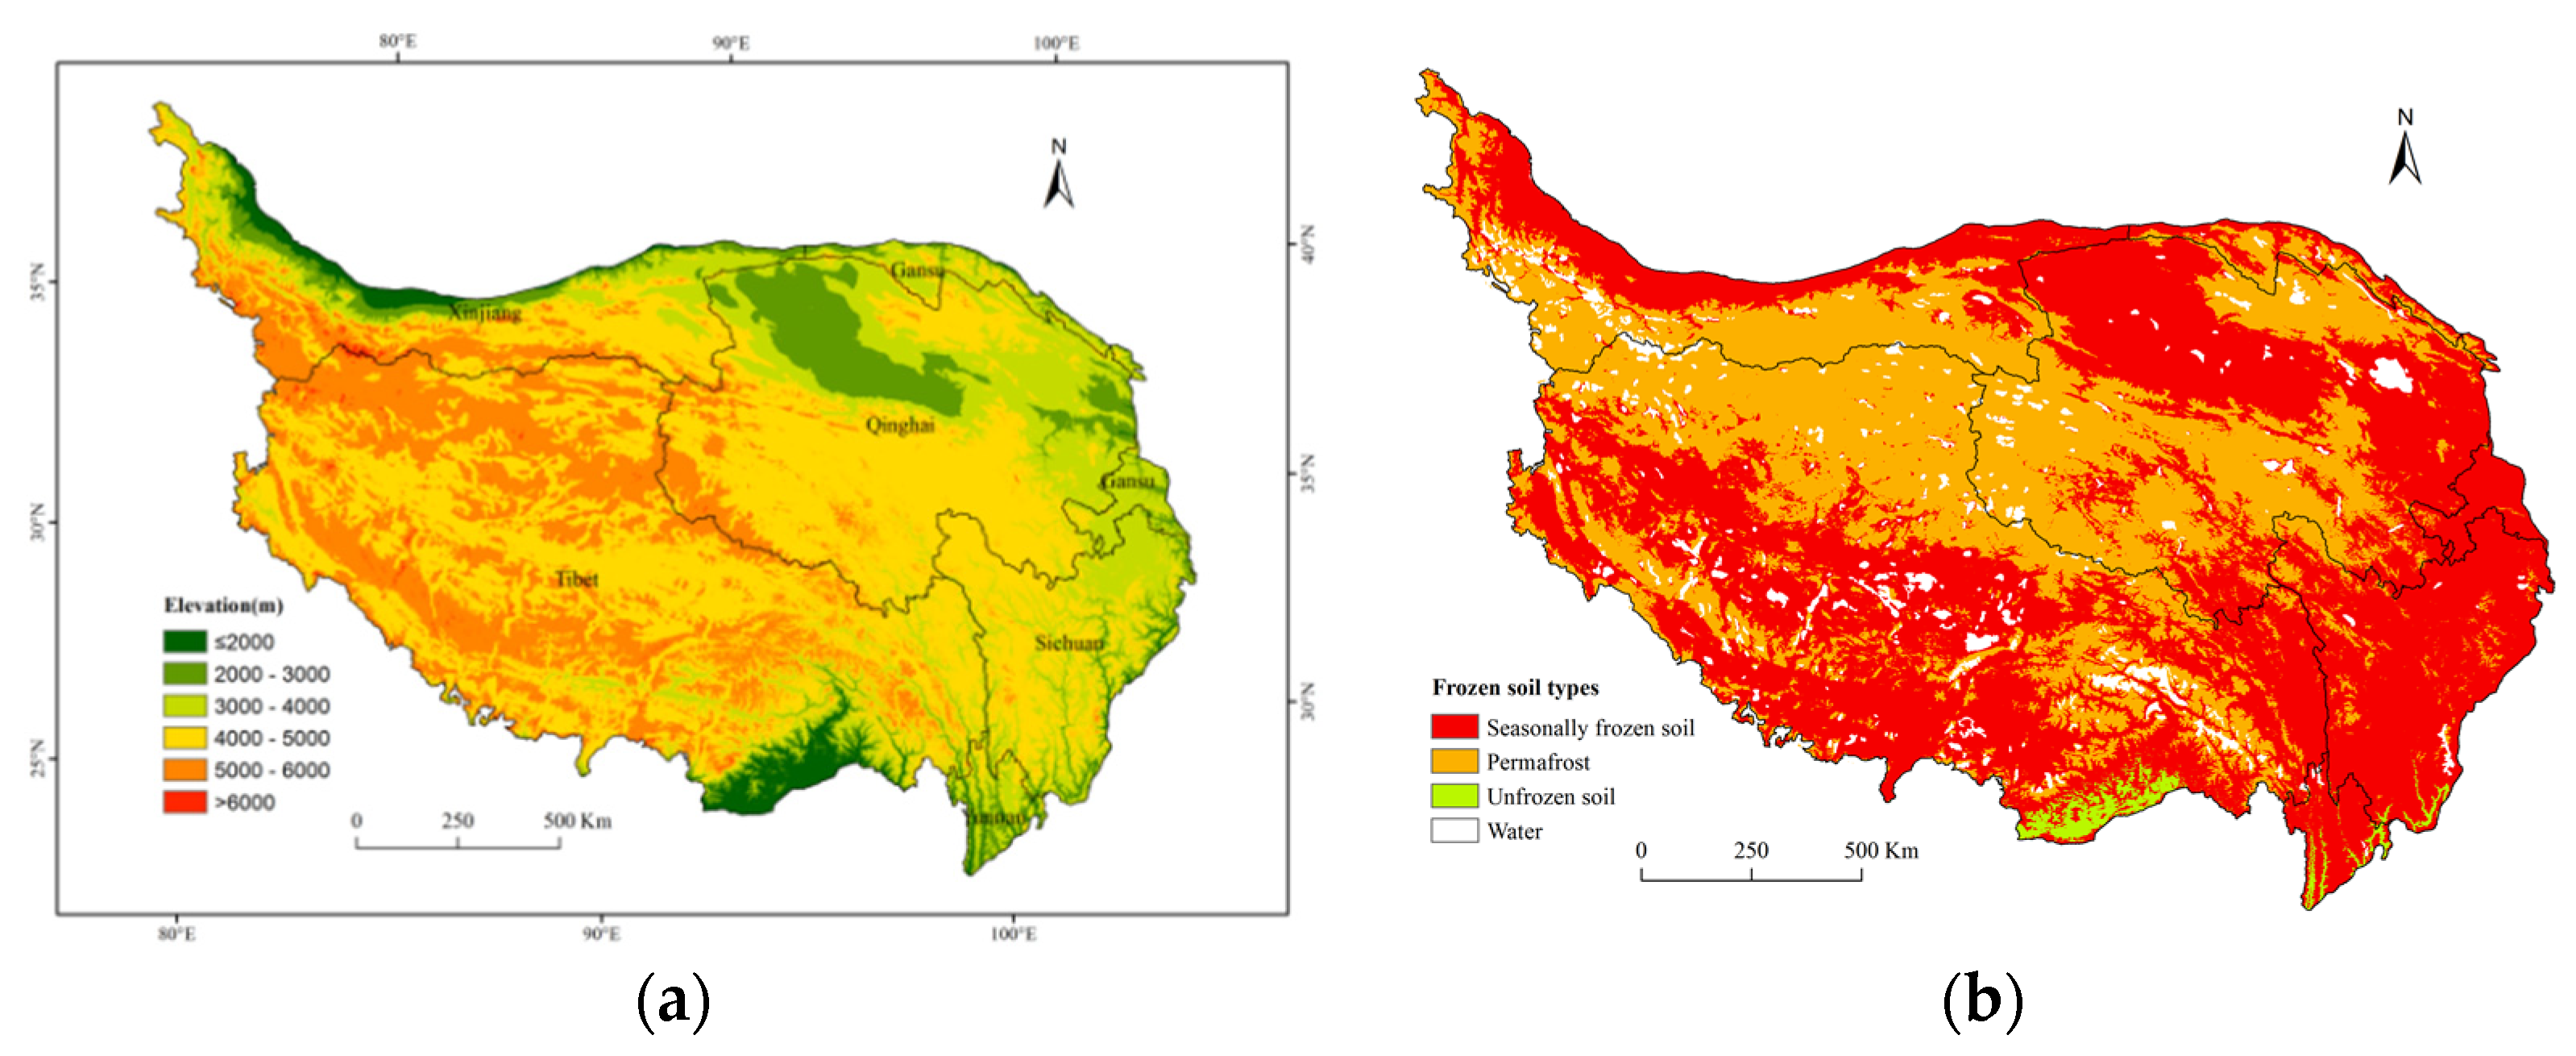
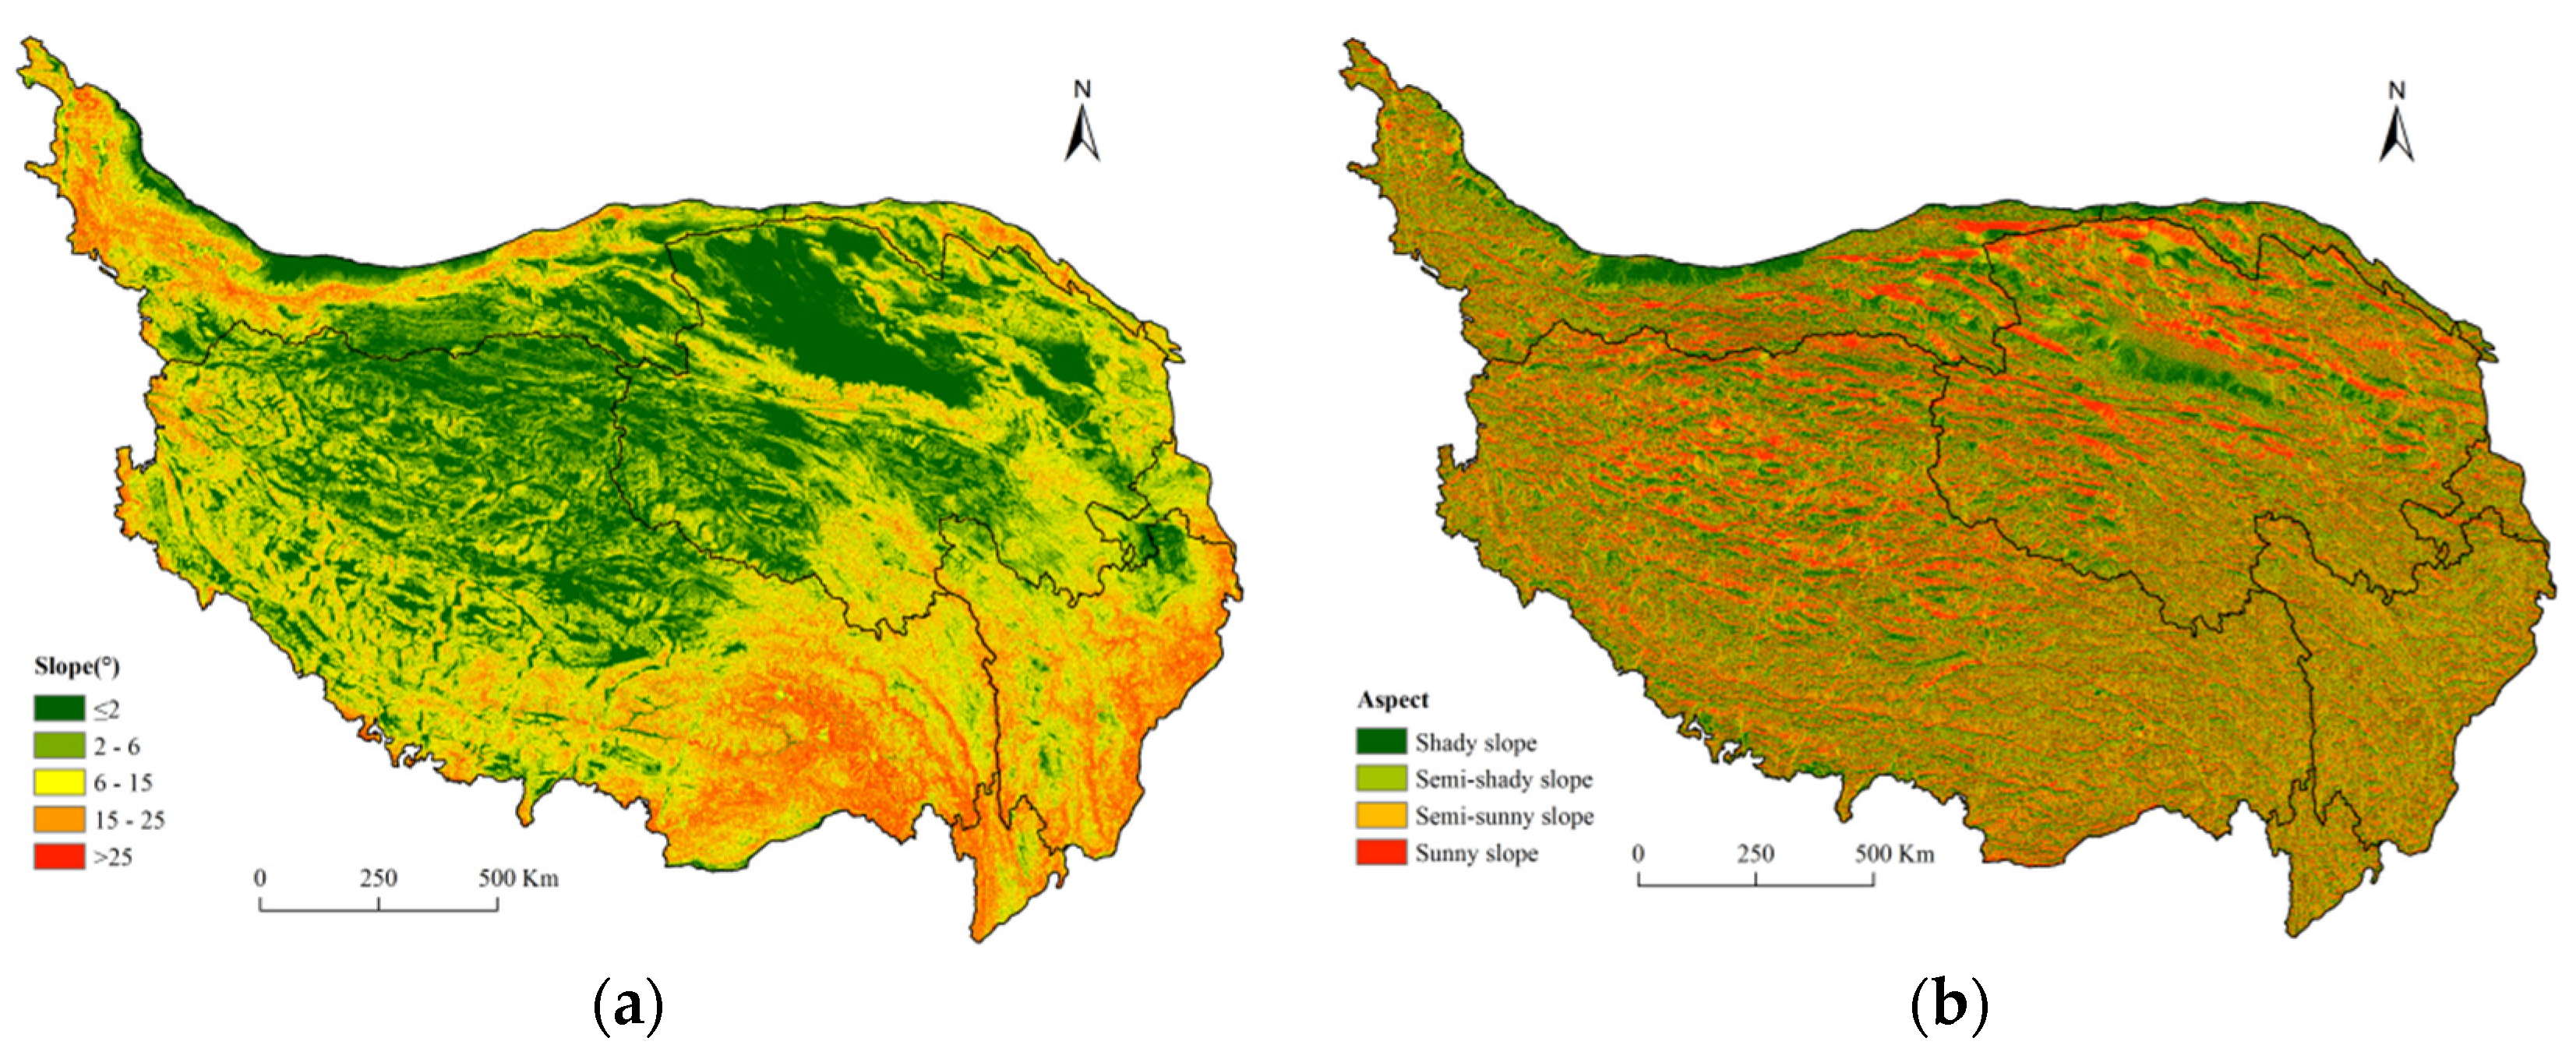
2.1. Study Area

The QTP is located in the southwest of China (27.5°–37.5°N, 75°–105°E). It ranges from the Kunlun Mountains in the north to the Himalayas in the south, and from the Karakoram Mountains in the west to the Hengduan Mountains in the east. The QTP, which includes Tibet, Qinghai Provinces, and parts of Xinjiang, Gansu, Sichuan, and Yunnan Provinces, covers an area of 2.57 × 10⁶ km2. The QTP is the highest plateau in the world, with average elevation of 4300 m. Influenced by the East Asian, Indian Southwest, and Westerly monsoon circulation systems, the distribution of both water and heat on the QTP has distinct variation [7]. Annual average temperature is −2.0 °C. Annual average precipitation is 340 mm, and its distribution is very uneven, with summer rainfall accounting for more than 70% of the total. Frozen soil is distributed widely on the QTP, covering approximately 96% of the total area, which makes the QTP the largest low-latitude permafrost region in the world [31]. The main types of soil on the QTP are seasonal frozen soil, permafrost soil, and unfrozen soil (Figure 1). The areas of permafrost soil and seasonal frozen soil account for 40% and 56% of the total area, respectively. There are various types of vegetation on the QTP, including coniferous forest, coniferous and broadleaved mixed forest, broadleaved forest, shrub, desert, grassland, grass, meadow, swamp, and cultivated vegetation. Among them, grassland covers the largest area (27.76%), followed by meadow (25.32%). The typical species of grass are Kobresia humilis, Festuca ovina, Elymus nutans, Poa pratensis, Carex scabrirostris, Scripus distigmaticus, and Gentiana straminea [32].

2.2. Data

To continuously and completely realize dynamic monitoring of vegetation growth on the QTP, MOD13Q1-EVI images acquired during 2000–2020 (March–October) were used in this study. The data were obtained from NASA’s Land Processes Distributed Active Archive Center (LP DAAC) located at the USGS Earth Resources Observation and Science (EROS) Center (https://e4ftl01.cr.usgs.gov/, accessed on 25 March 2021). The spatial resolution of MODI13Q1 data is 250 m and the temporal resolution is 16 d. The MODIS Reprojection Tool was used for mosaic and projection transformation of the images, and the projection type adopted was Albers Equal Area Conic projection (central longitude: 105°E, latitude: 25°N and 47°N). The international maximum value composites method was used to calculate the largest EVI image sequences during 2000–2020.
Digital elevation model (DEM) data were used to extract the topography of the QTP. The DEM data with the 30 m spatial resolution were obtained from the Geospatial Data Cloud site, Computer Network Information Center of the Chinese Academy of Sciences (http:www.gscloud.cn, accessed on 6 December 2021). Slope and aspect were calculated from the DEM data. The elevation of the QTP was divided into six levels: ≤2000, 2000–3000, 3000–4000, 4000–5000, 5000–6000, and >6000 m. In accordance with the Second National Land Survey Technical Regulation of China, slope was divided into five levels: ≤2°, 2°–6°, 6°–15°, 15°–25°, and >25° (Figure 2). Aspect was divided into north (315°–45°), east (45°–135°), south (135°–225°), and west (225°–315°) slopes, broadly representing shady, semi-shady, semi-sunny, and sunny slopes, respectively (Figure 2). Additionally, frozen soil and meteorological data such as temperature and precipitation were also considered. Frozen soil data were provided by the China National Tibetan Plateau Data Center (http://data.tpdc.ac.cn, accessed on 10 August 2019). Meteorological data were provided by the China Meteorological Data Service Center (http://data.cma.cn/, accessed on 31 December 2021). The 192 meteorological stations data were used including the annual temperature, precipitation and accumulated temperature from 2000 to 2020. All the meteorological data were processed by Kriging interpolation method and resampled with the same spatial resolution as the relevant data.

3. Methods

3.1. Fractional Vegetation Coverage

Fractional vegetation coverage (FVC) refers to the percent of the vertical projection area covered by vegetation as a fraction of the total area [33]. Generally, FVC is calculated using remote sensing techniques that include mixed-pixel decomposition models, regression models, machine learning methods, and vegetation canopy models [34]. Among those, mixed-pixel decomposition models are used most widely, and the pixel binary model is the most representative of that class. The pixel binary model is relatively simple and has obvious physical advantages in that it is better able to weaken the influence of the atmosphere, soil background, and vegetation type [25,35]. The pixel binary model assumes that each pixel can be decomposed into full vegetation cover and bare soil [36]. The Gutman model and the Carlson model are the pixel binary models used most widely, owing to their applicability to areas with high and low FVC, respectively [37,38]. Owing to the characteristics of sparse vegetation on the QTP, the Carlson model was used to estimate FVC in this study. As the basic principle of the Carlson model is to assume that each pixel can be decomposed into pure vegetation and pure soil, the information of pixel (S) can be expressed as the sum of the vegetation cover (Sv) and the soil cover (Ss):
S = Sv + Ss
For a pixel containing only soil and vegetation, the area occupied by the vegetation is the FVC, and the proportion of the area occupied by soil is 1 − FVC; therefore, FVC can be expressed as follows:
FVC = (EVIEVIsoil)/(EVIvegEVIsoil)
where EVIsoil and EVIveg represent the EVI of pure soil pixels and pure vegetation pixels, respectively. For bare soil pixels, EVIsoil should be close to 0, but because of the influence of atmospheric, surface wetland, and sunlight conditions, values range from −0.1 to 0.2 [37,39]. For pure vegetation pixels, EVIveg varies depending on vegetation type, composition, and seasonal change in growth. Therefore, we used a 0.5% confidence level, and we selected EVI accumulation values of 0.5% and 99.5% as EVIsoil and EVIveg, respectively. Both EVIsoil and EVIveg were used in Equation (2) to calculate FVC during 2000–2020. In accordance with the Standard for Classification and Gradation of Soil Erosion of China (SL190-2007), and with consideration of the actual situation on the QTP, we divided FVC into five levels: bare land (<10%), low FVC (10%–30%), medium FVC (30%–50%), high FVC (50%–70%), and extremely high FVC (≥70%).

3.2. Sen Trend Analysis and Mann–Kendall Test

Sen trend analysis and the Mann–Kendall test are important methods used widely for determining the trend of long time series data in vegetation analysis [40,41]. In comparison with the least squares method, the Sen trend can avoid interference from missing data, elimination of outliers, and form of data distribution on the analysis results. The Sen trend is expressed as follows:
S l o p e F V C = M e d i a n ( F V C j F V C i j i )   2000   <   i   <   j <   2020
where SlopeFVC is the trend of the time series variables; a positive (negative) value of SlopeFVC indicates a trend of increase (decrease) in FVC.
The Mann–Kendall test is a nonparametric statistical test recommended by the World Meteorological Organization, which is used widely to determine the statistical significance of a trend. The Mann–Kendall test does not require samples to obey a certain distribution and the result is not disturbed by a few outliers. The method has high quantification, wide detection range, and convenient calculation, making it suitable for objective assessment of the trend of time series of sequential variables and type variables [42,43]. The Mann–Kendall test is formulated as described in the following.
Let a stationary independent sequence be Xt (t = 1..., n, n is the sequence length), where S is defined as follows:
S = i = 1 n 1 j = i + 1 n sgn ( x j x i )
sgn ( θ ) = { 0 , θ = 0 1 , θ < 0 1 , θ > 0
where sgn is a symbolic function, when n ≥ 10, S approximately obeys the normal distribution, and the mean E(S) = 0 and variance V(S) = n (n − 1)(2n + 5)/18, respectively, without considering the equivalent data points in the sequence. The value of test statistic Z of a positive distribution can be calculated using Equation (6):
Z = { 0 , S = 0 ( S + 1 ) / V ( S ) , S < 0 ( S 1 ) / V ( S ) , S > 0
when Z > 0 (Z < 0), the sequence has an upward (downward) trend. Considering the symmetry of a normal distribution, the significance level is given as α; when |Z| > Z(1 − α/2), the trend passes the significance test and rejects the original hypothesis, i.e., there is obvious change in the trend. Specifically, |Z| passed the 95% significance test when it reached 1.960. The significance results of the 0.05 confidence level were divided into significant change (Z > 1.96 or Z < −1.96) and nonsignificant change (−1.96 ≤ Z ≤ 1.96). Moreover, on the basis of the Mann–Kendall test and Sen trend analysis result, the trend was divided into three levels: significant increase (slope > 0, Z > 1.96 or Z < −1.96), significant decrease (Slope < 0, Z > 1.96 or Z < −1.96), and no significant change (Slope > 0 or Slope < 0, −1.96 ≤ Z ≤ 1.96).

3.3. Coefficient of Variation

The coefficient of variation (CV) is a normalized measure of the dispersion degree of a probability distribution and is the ratio of the variation to the mean, which can better evaluate the variability of vegetation change associated with topographic effects [29,44].
CV = MD / Mean × 100 %
where MD represents the difference in mean FVC between sunny and shady slopes and Mean represents the mean FVC for each aspect. When CV is close to 0, the difference in FVC between shady and sunny slopes is smaller. A negative (positive) CV value indicates that the sunny (shady) slope FVC is smaller than the shady (sunny) slope FVC.

3.4. Correlation Analysis

Correlation analysis is a method for analyzing the degree of correlation between two or more variables. In this study, correlation analysis was used to analyze the relationship between FVC and temperature or precipitation:
r x y = i = 1 n ( x i x ¯ ) ( y i y ¯ ) i = 1 n ( x i x ¯ ) 2 i = 1 n ( y i y ¯ ) 2
where rxy is the correlation coefficient that has values in the range of −1 and 1 (an absolute value closer to 1 represents stronger correlation), and x ¯ and y ¯ represent the mean of variables x and y, respectively.

4. Results and Analysis

4.1. Temporal and Spatial Variations of FVC

4.1.1. Temporal Variation of FVC

On the basis of spatial data of frozen/unfrozen soil on the QTP, FVC of different soil types on the QTP during 2000–2020 was analyzed. The mean FVC of 0.494, showed a trend of increase of 0.004/a. Overall, variation of FVC during 2000–2020 was not obvious; the largest (smallest) value of FVC was 0.502 (0.485) in 2001 (2018). However, notable differences existed among the different frozen soil types. In permafrost regions, the annual mean value of FVC was relatively low, ranging from 0.375 in 2010 to 0.346 in 2015 (average: 0.359). In seasonal frozen soil regions, the annual mean value of FVC was larger than that of the permafrost regions, ranging from 0.571 in 2002 to 0.552 in 2018 (average: 0.564). The annual mean value of FVC in unfrozen soil regions was the largest, ranging from 0.915 in 2015 to 0.826 in 2010 (average: 0.889).

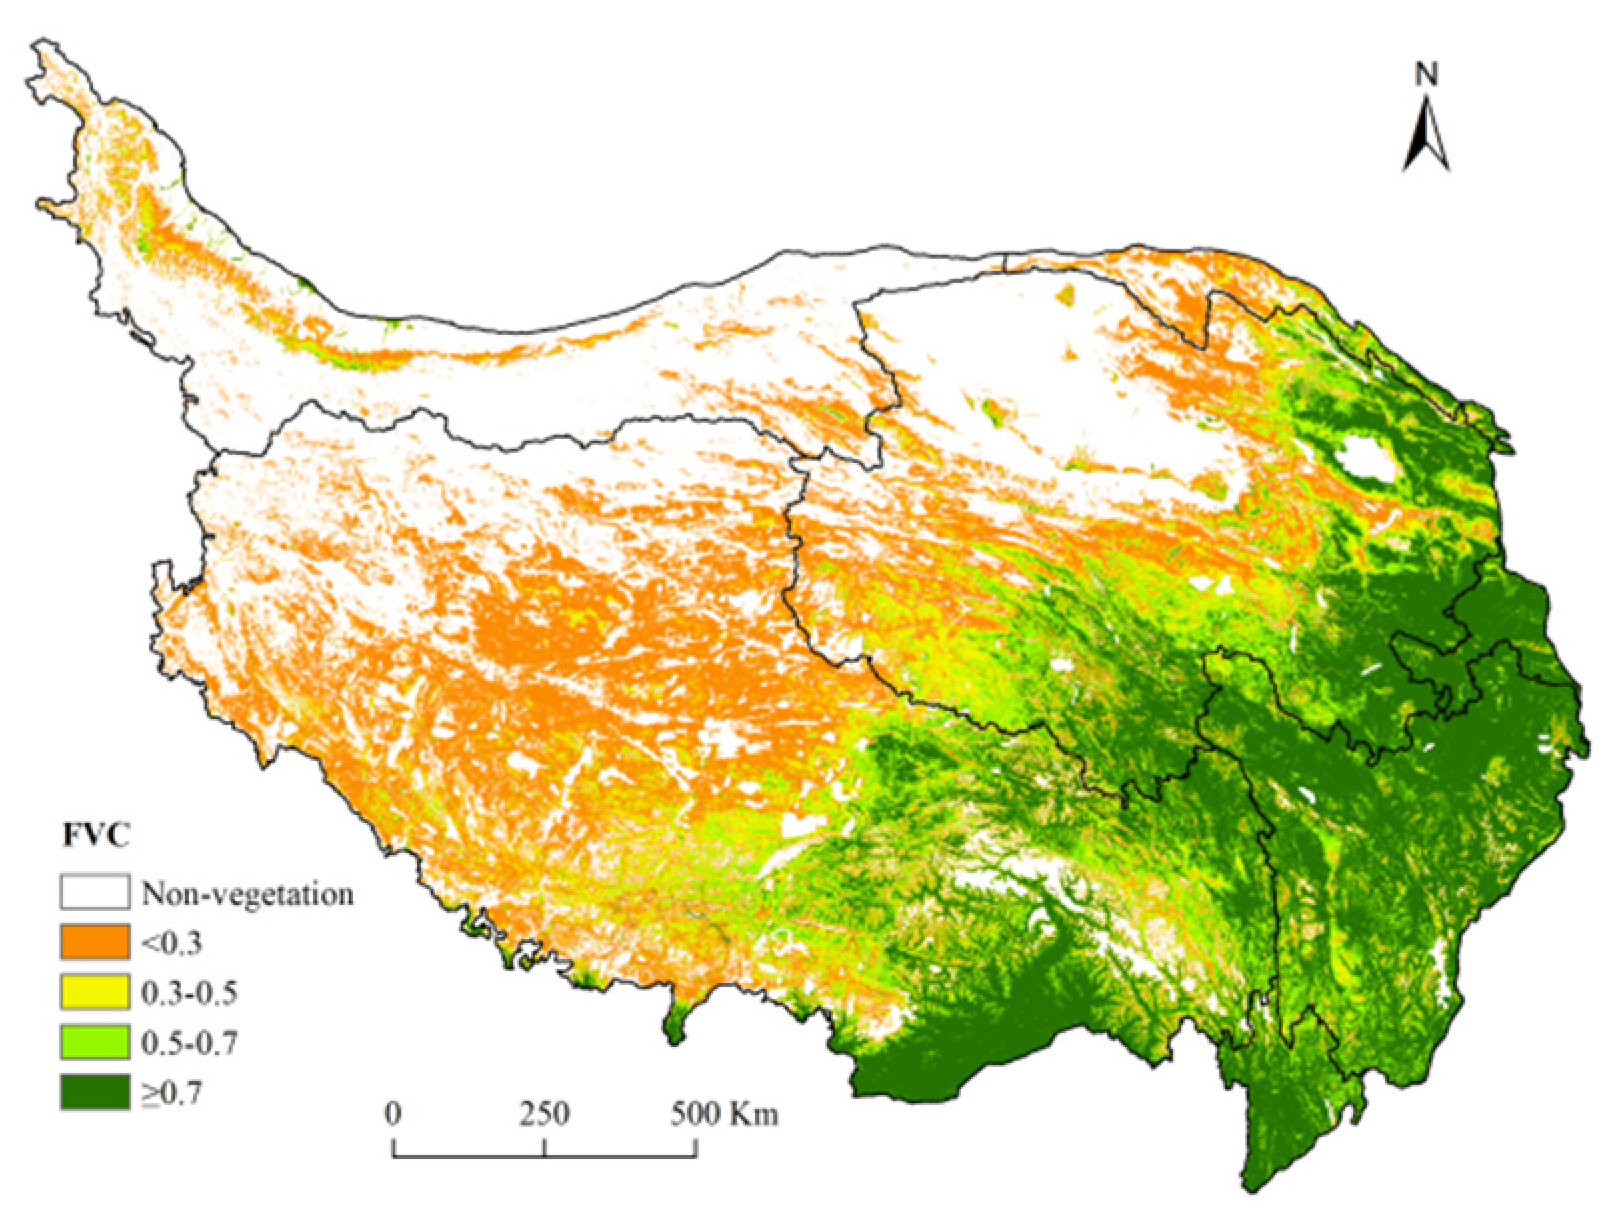
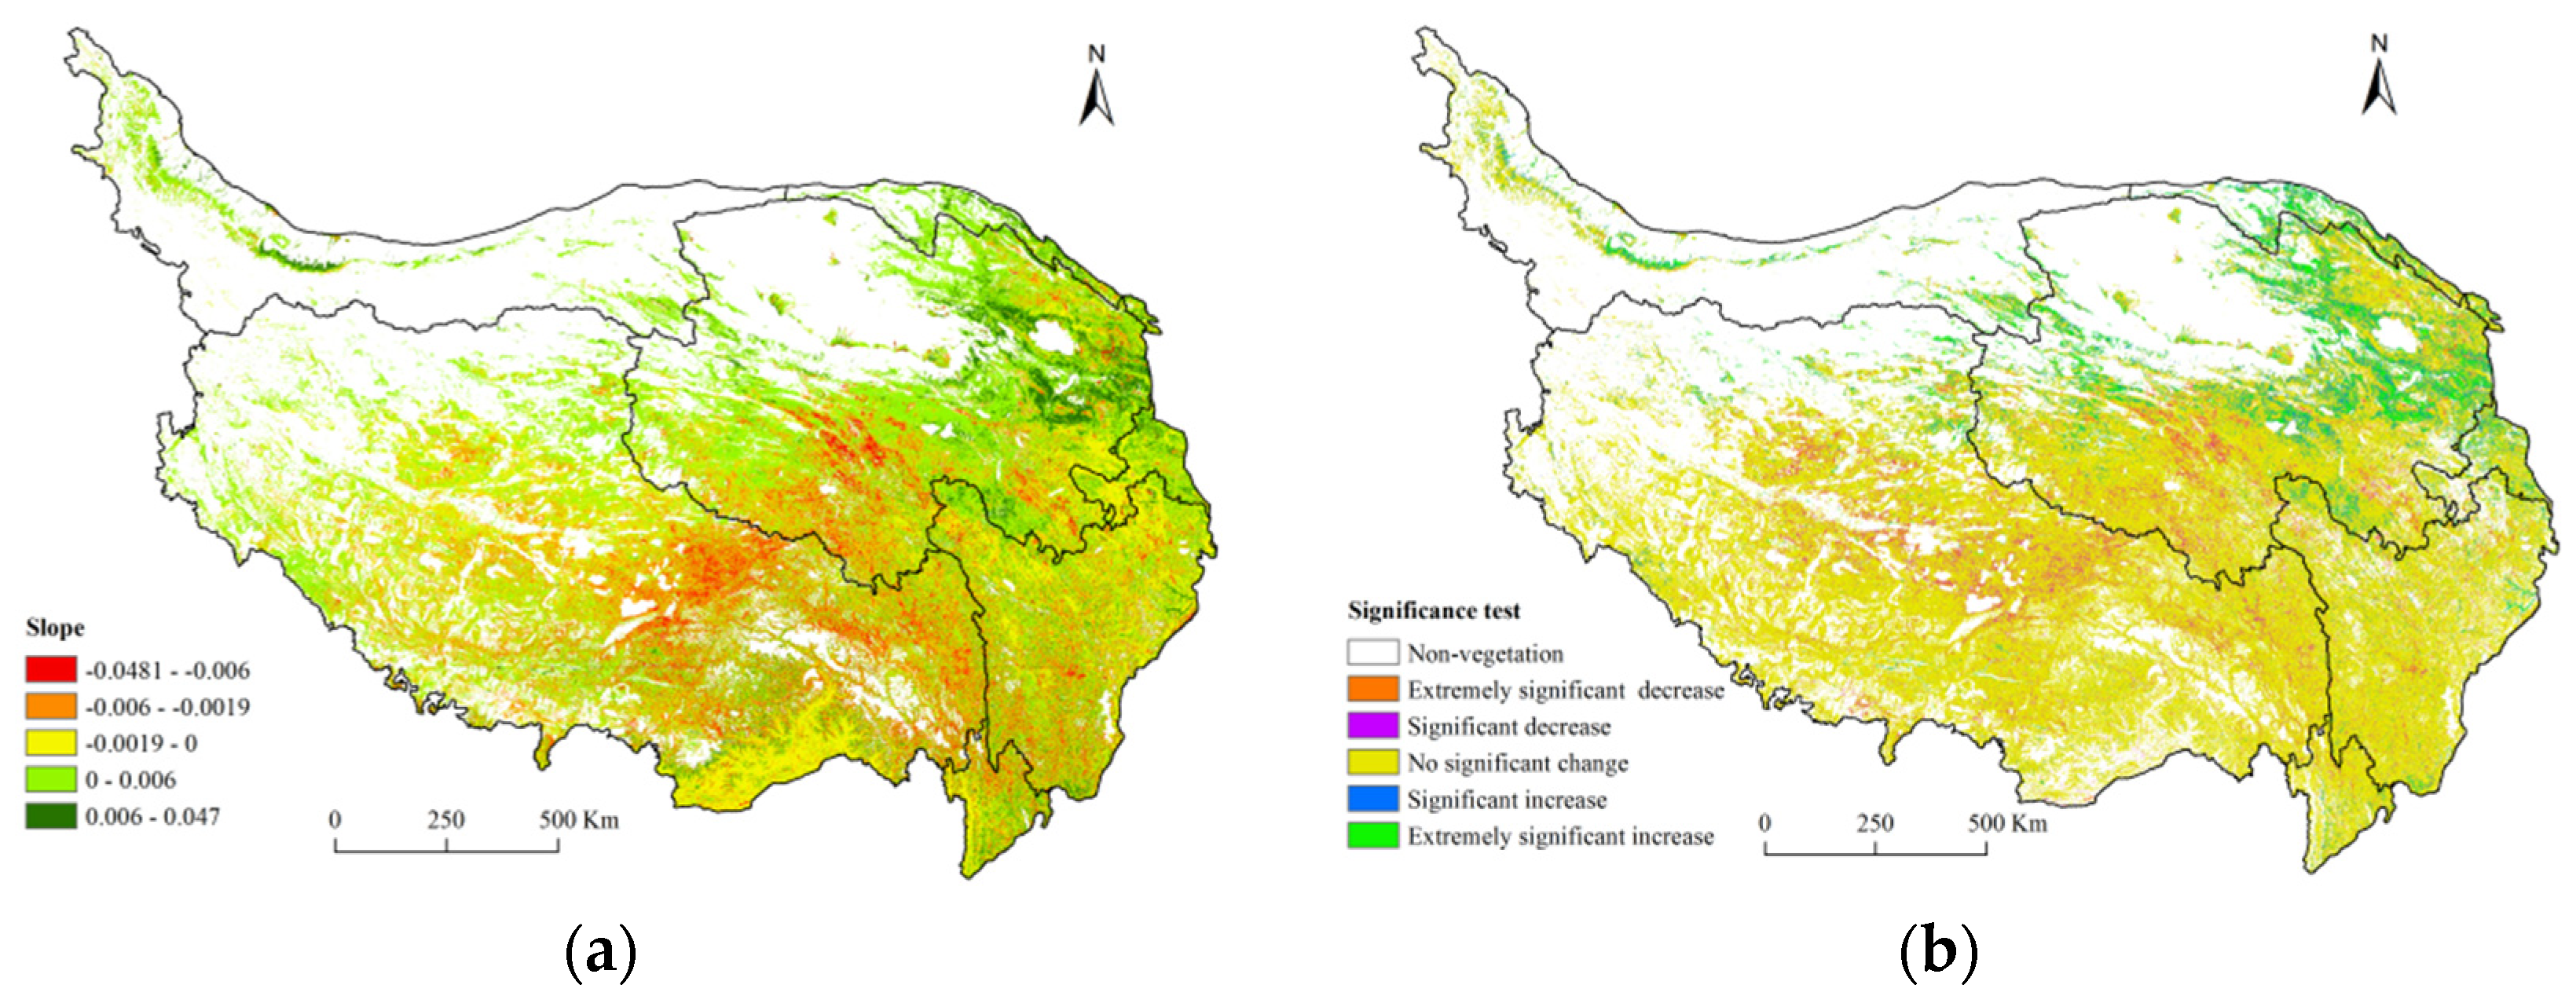
4.1.2. Spatial Variation of FVC

The annual mean FVC on the QTP during 2000–2020 was 0.494 (Figure 3), and it showed a trend of decrease from the southeast to the northwest. The area of low coverage (FVC < 0.3) was largest, accounting for 34.84% of the total area, and it was distributed mainly in southwestern, central, and northern parts of the QTP. The area with extremely high coverage (FVC > 0.7) accounted for 33.62% of the total area, and it was distributed mainly in southern and eastern parts of the QTP. The area of high coverage (0.5 ≤ FVC < 0.7) accounted for 15.94% of the total area, and it was distributed mainly in central and southern parts of the QTP. The area of medium coverage (0.3 ≤ FVC < 0.5) accounted for 15.60% of the total area, and it was distributed mainly in southwestern and central parts of the QTP.
The spatial change trend of mean annual FVC on the QTP during 2000–2020 (Figure 4a) showed that the trend value of FVC was −0.0481 to 0.047. The area with an increasing trend of FVC accounted for 54.32% of the total area, distributed mainly in central and eastern parts of the QTP, including southern Xinjiang Province, and northeastern, northwestern, and central parts of Gansu and Qinghai provinces. The area with a decreasing trend of FVC accounted for 45.68% of the total area, distributed mainly in southern parts of the QTP, including western Sichuan Province, northwestern Yunnan Province, central and southeastern Tibet, and southwestern and southeastern regions of Qinghai Province. The significance test (Figure 4b) of FVC on the QTP showed that the change in mean FVC was not significant in most areas (81.65% of the total area), exhibited significant and extremely significant increase in 6.62% and 5.54% of the area, respectively, and exhibited significant and extremely significant decrease in 4.43% and 2.21% of the area, respectively.
For different soil types, the mean trend values of spatial change rate (Figure 4a) for seasonal frozen soil, permafrost soil, and unfrozen soil regions were 0.0002, 0.0004, and 0.001, respectively, indicating that the FVC in different soil type regions showed gradual increasing trends and the mean trend of unfrozen soil was relatively higher than those of permafrost and seasonal frozen soil. In terms of vegetation growth trends, seasonal frozen soil exhibited a trend of gradual decline in 52.48% of the total area, distributed mainly in southeastern and southern Xinjiang Province, northern Tibet, and central and western Qinghai Province. The area with a trend of gradual rise accounted for 47.52% of the total seasonal frozen soil area, distributed mainly in northwestern Yunnan Province, western Sichuan Province, southwestern Gansu Province, eastern Qinghai Province, and southern Tibet. In permafrost regions, the area with a trend of gradual decrease accounted for 44.77% of the total area, distributed mainly in southwestern parts of Tibet. The area with a trend of gradual increase accounted for 55.23% of the total permafrost area, distributed mainly in eastern-central parts of the border between Qinghai Province and Gansu Province, southwestern parts of Qinghai Province, and northern parts of Tibet. The unfrozen soil area showed a trend of decrease (increase) that accounted for 45.28% (54.72%) of the total area.

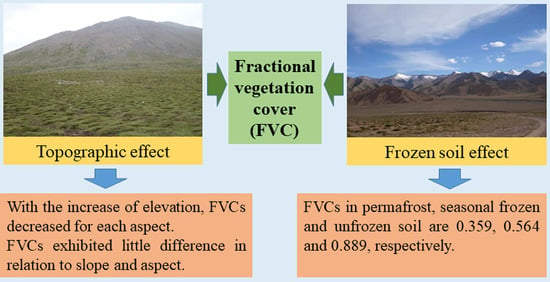
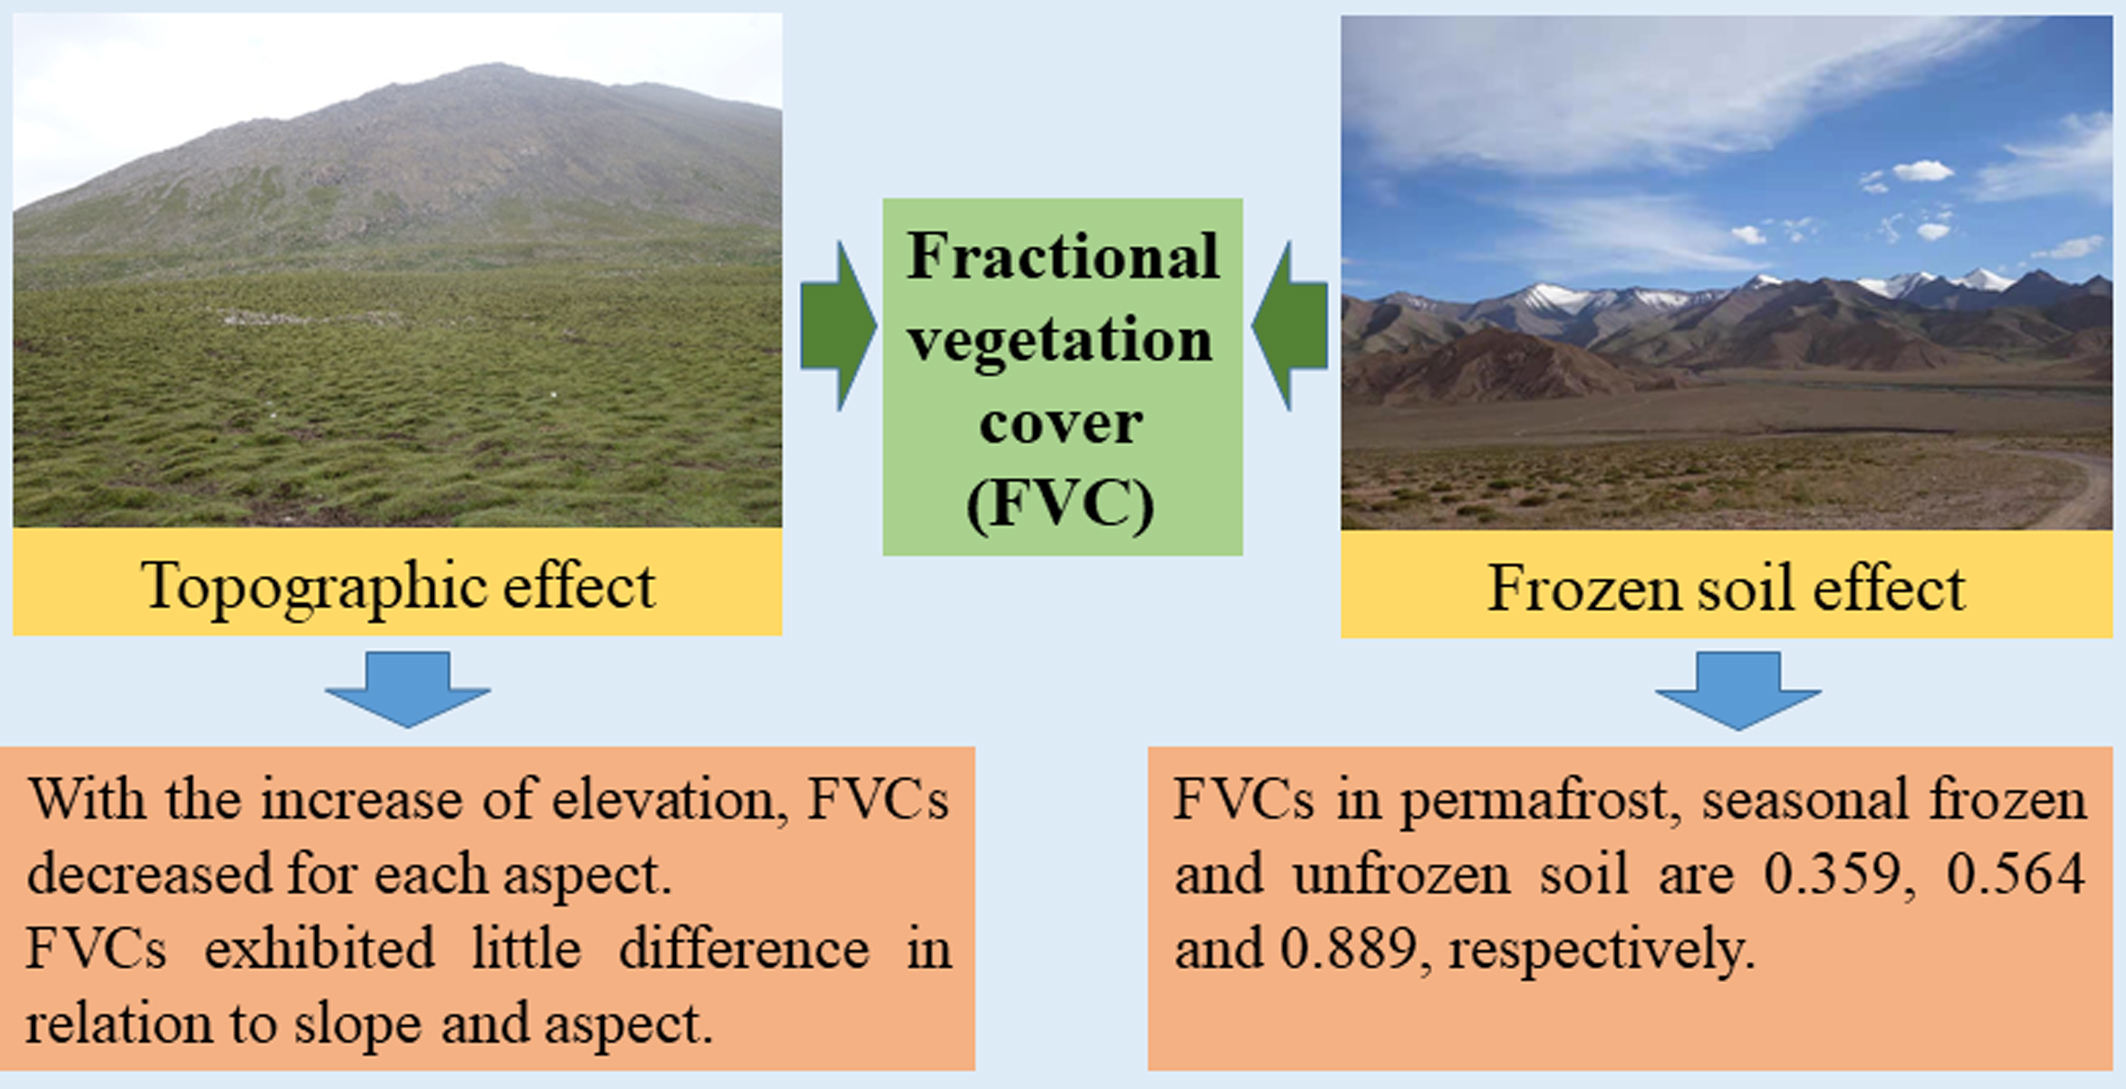
4.2. Effect of Topographic Variations

The topography of the QTP is complex, and the distribution and growth status of vegetation differ depending on terrain. Among various topographic factors, elevation, slope, and aspect are considered to best reflect the variation of vegetation conditions, and they are used widely in evaluations of vegetation change [27,45]. Thus, this study investigated the effects of elevation, slope, and aspect on vegetation growth on the QTP.

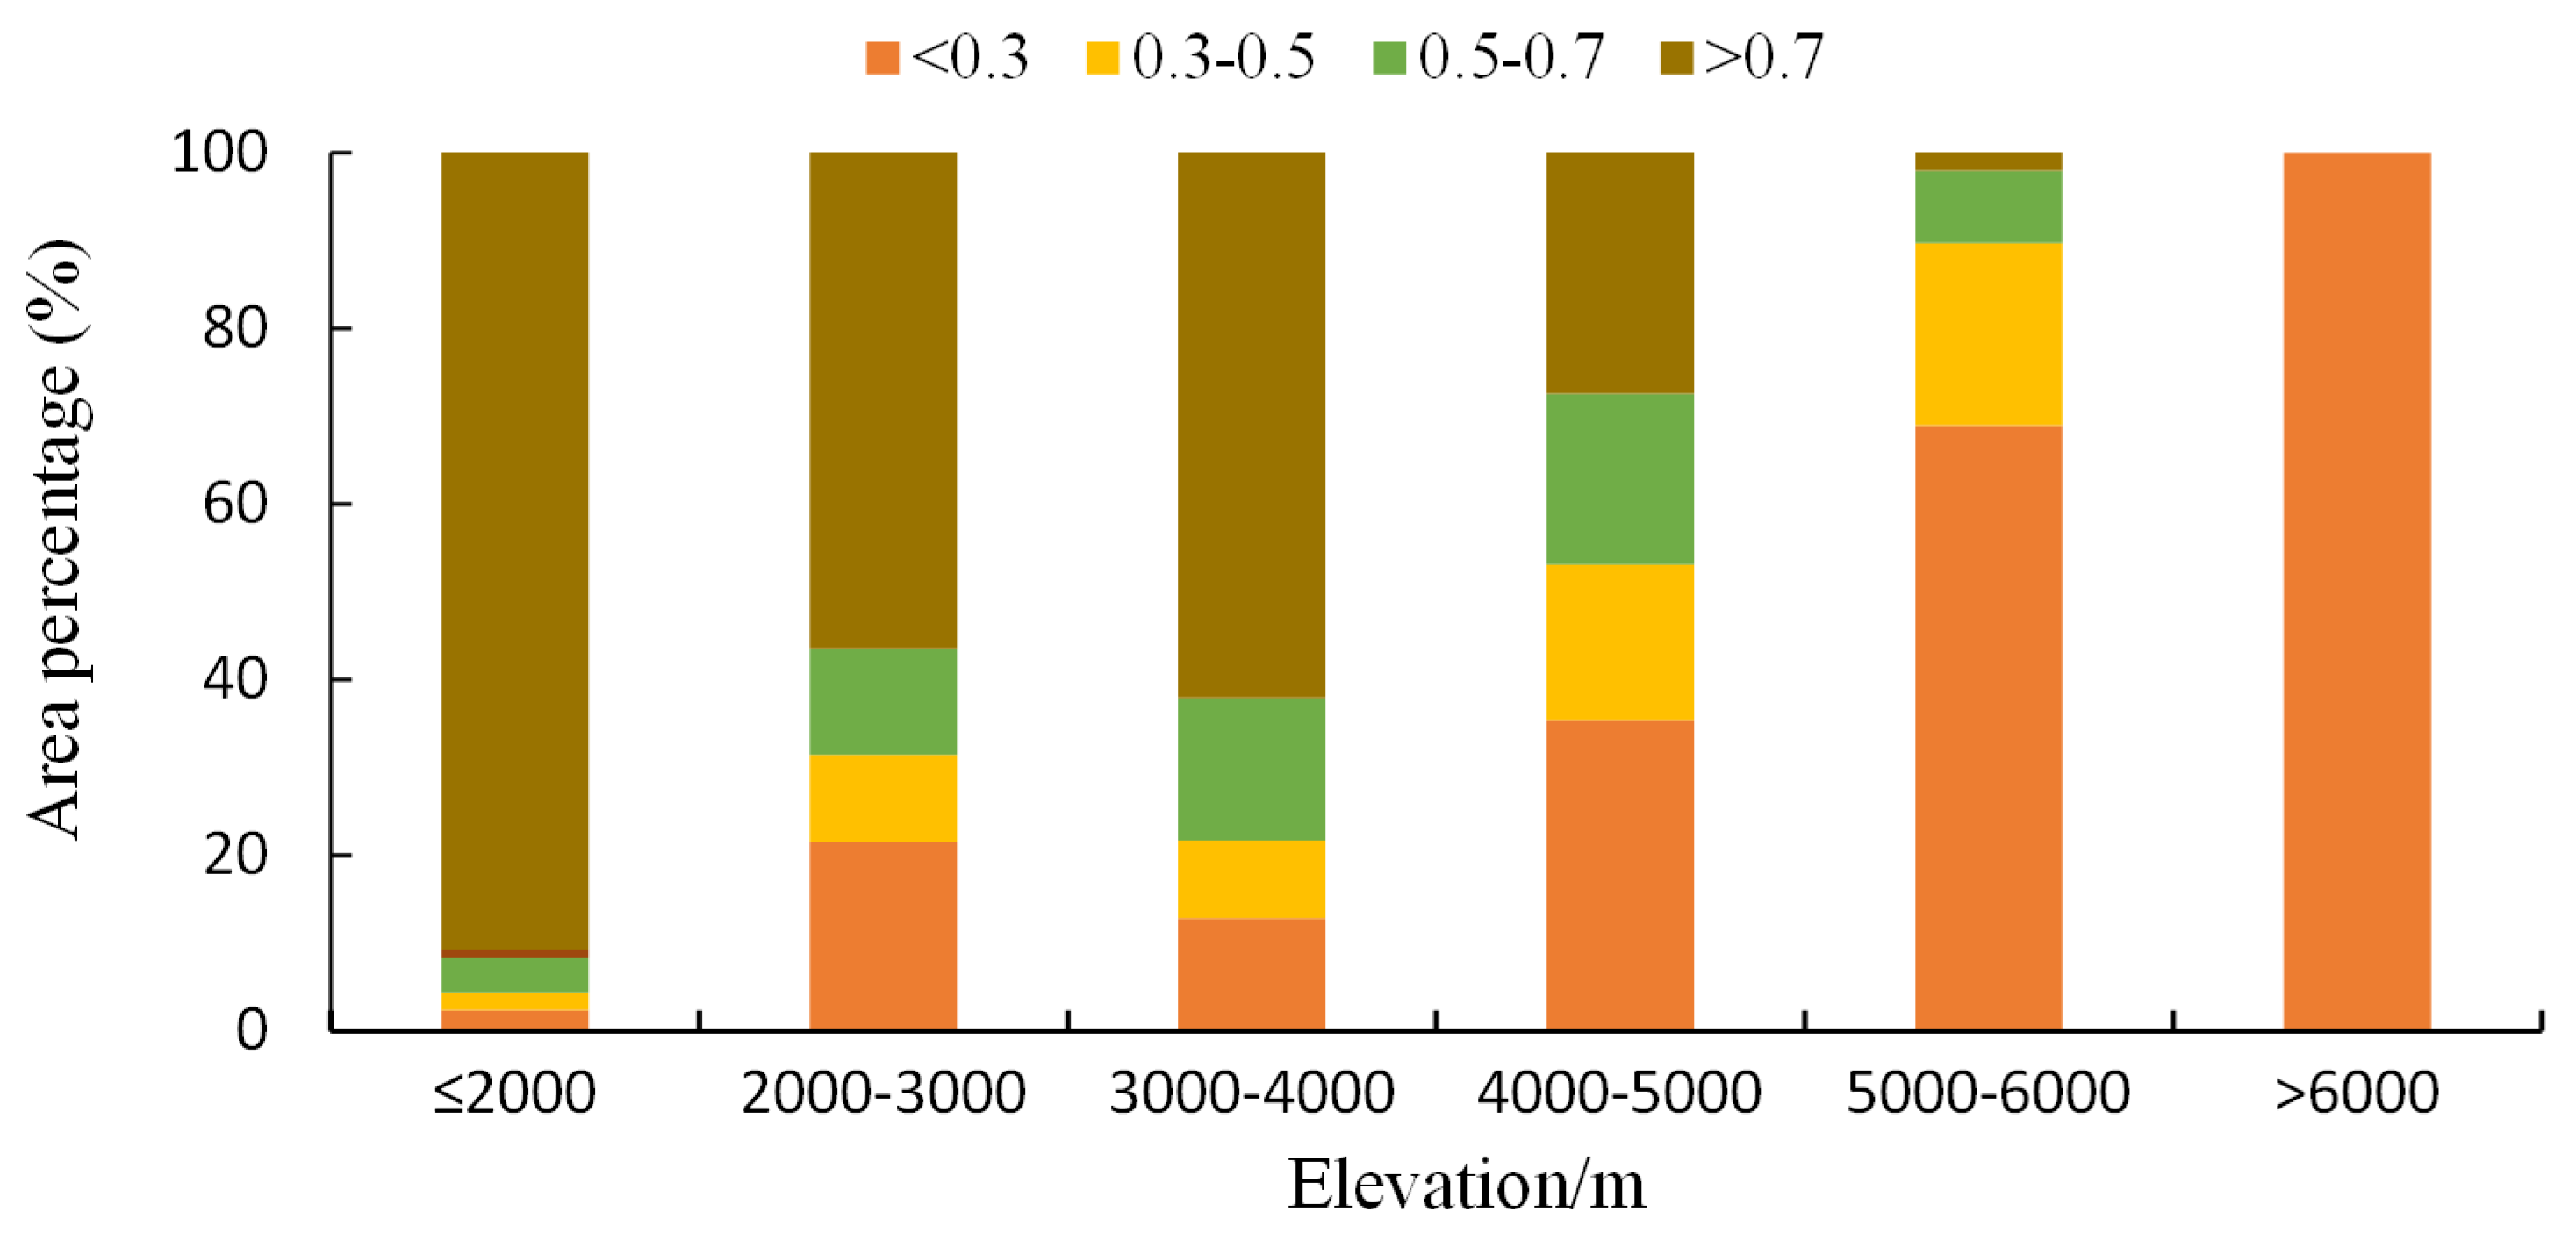
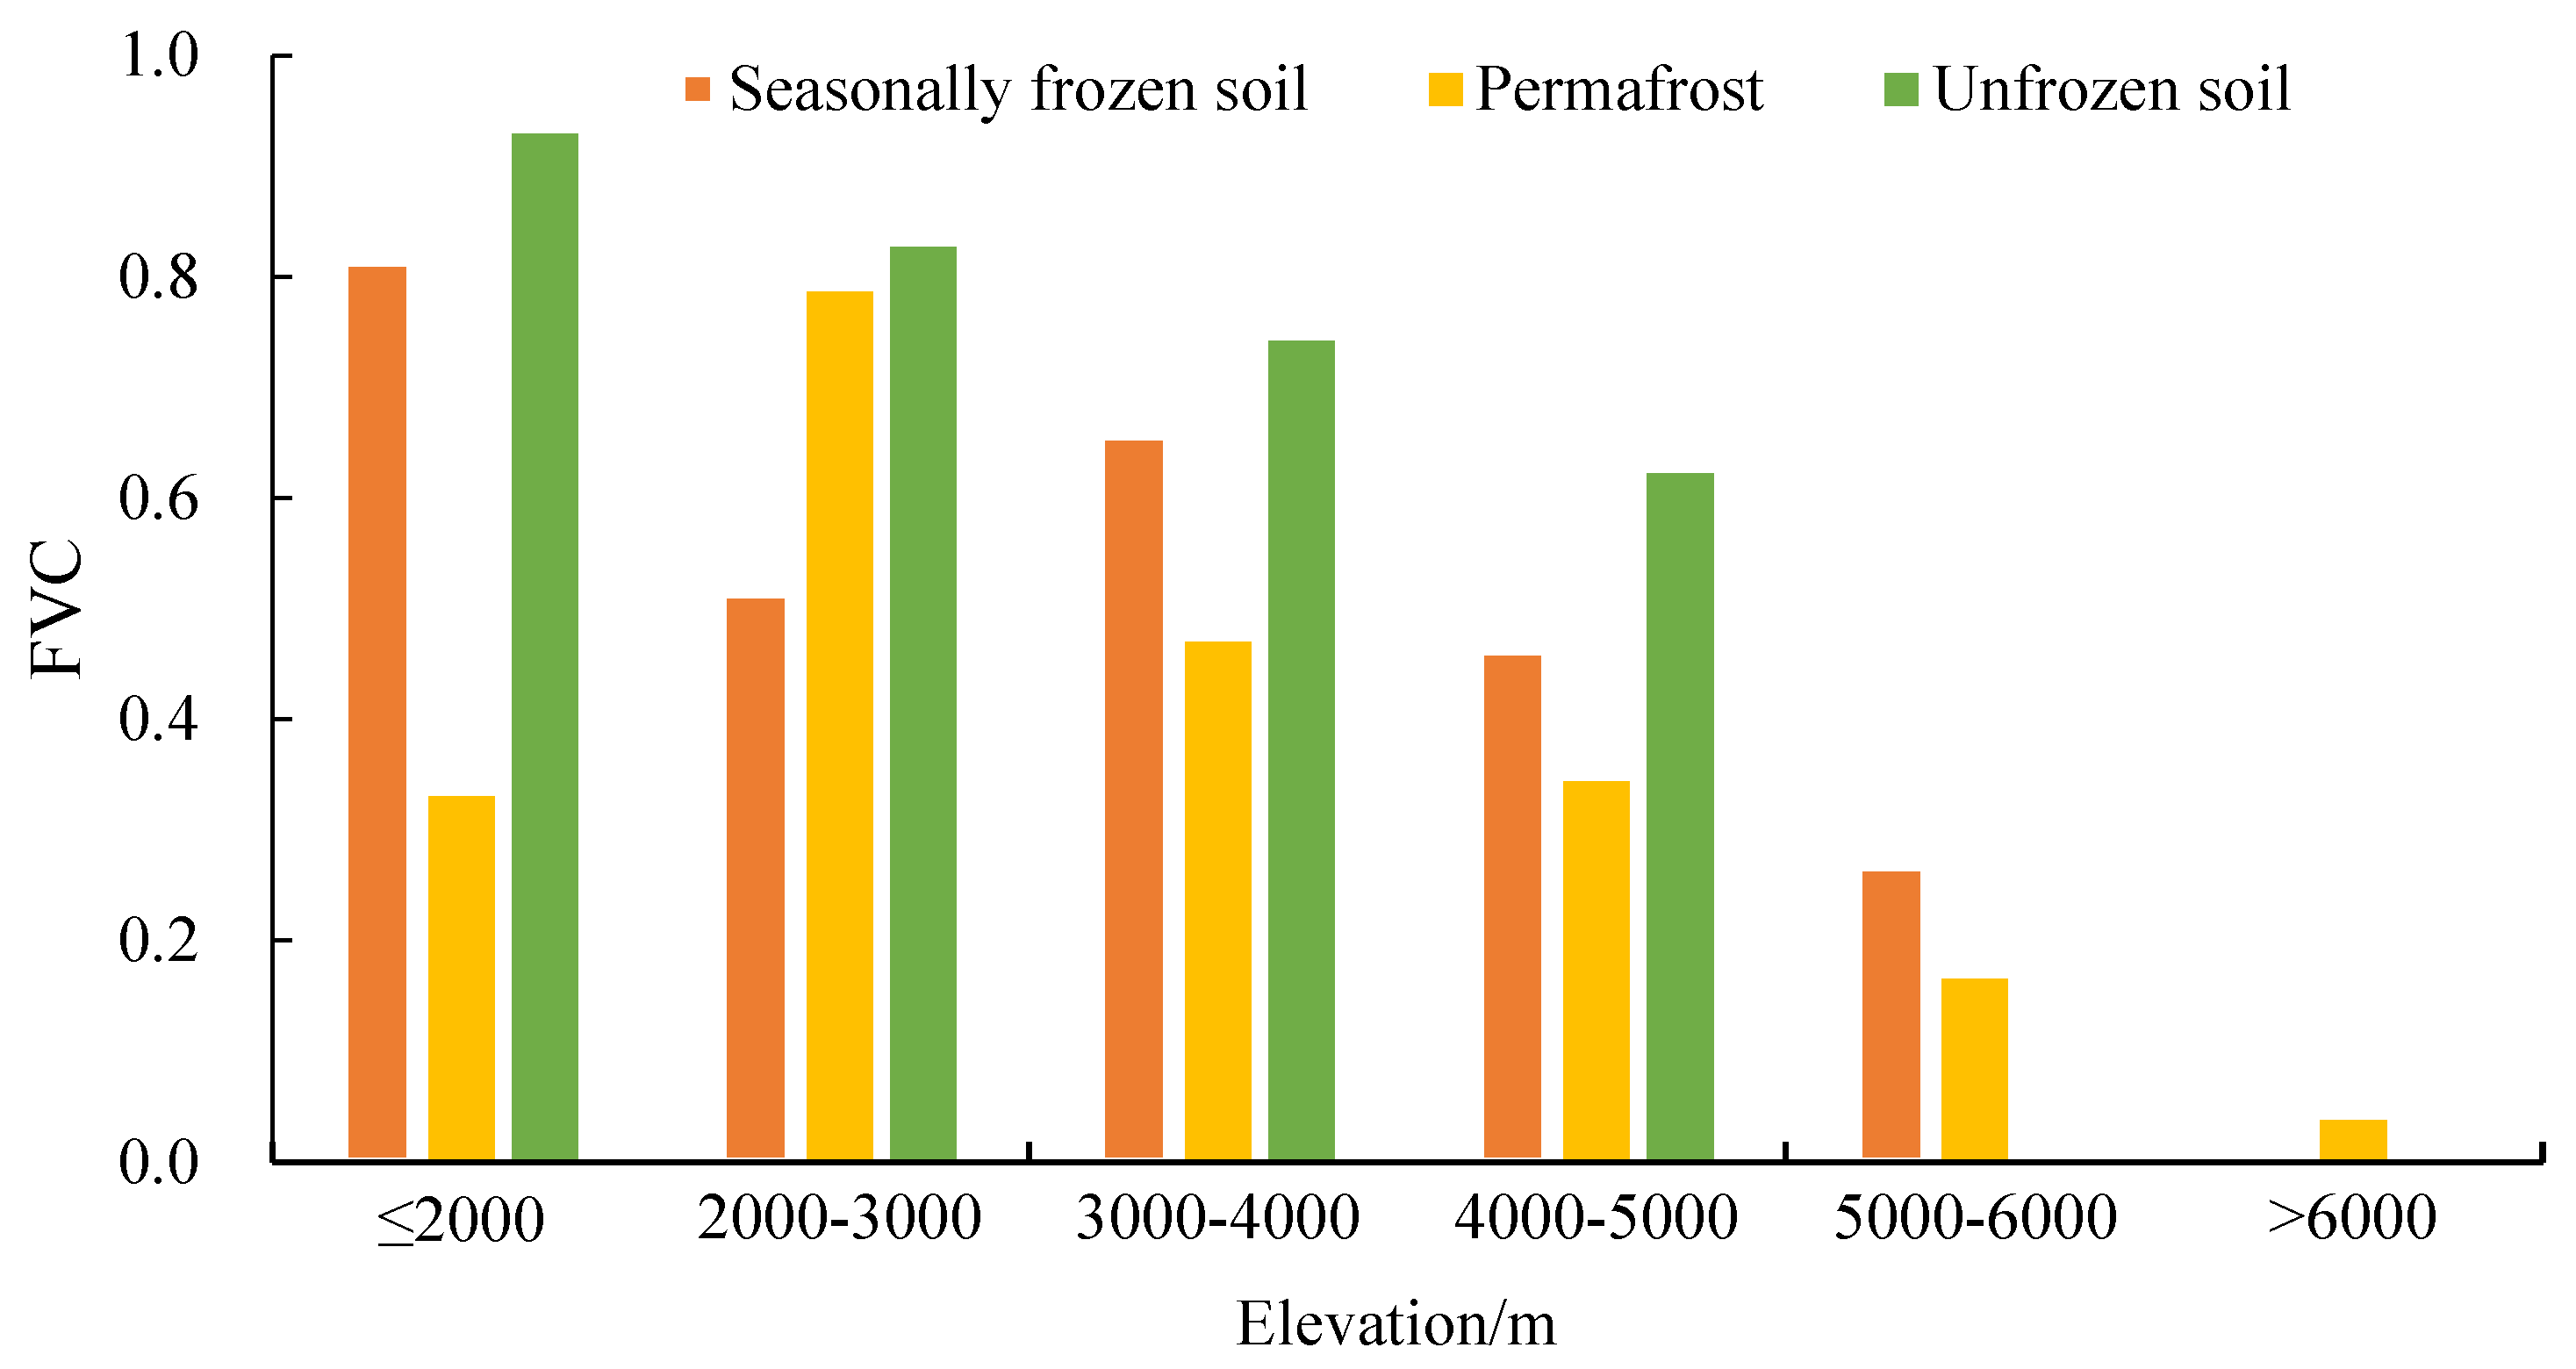
4.2.1. Effect of Elevation and Aspect

The areal proportions of FVC at different elevation levels on the QTP varied greatly (Figure 5). When elevation was <4000 m, the areal proportion of extremely high coverage was highest, i.e., the values at elevations of ≤2000 and 3000–4000 m were 91.7% and 62.1%, respectively. No area had extremely high coverage at elevation >6000 m. The area of extremely high coverage showed a trend of gradual decrease with increasing elevation. The areal proportion of high coverage at different elevation levels was relatively small; the highest proportion (19.42%) was distributed at elevations of 4000–5000 m, and the lowest proportion (3.99%) was distributed at elevations ≤2000 m. No area had high coverage at elevation >6000 m. The areal proportion of high coverage exhibited a trend of gradual increase and then decrease with increasing elevation. The areal proportion of middle coverage was relatively low at each elevation level; the maximum was 20.72% at elevations of 5000–6000 m and the minimum was 1.92% when elevation was 2000 m. No area had middle coverage at elevation >6000 m. The areal proportion of low coverage was maximum when elevation was >6000 m. With increasing elevation, the areal proportion of low coverage gradually increased. With increase of elevation, the areal proportion of extremely high and low coverage on the QTP decreased gradually and increased, respectively, which might be related to the decrease in temperature with increasing elevation. Thus, temperature might be an important limiting factor for plant growth on the QTP [21].
The unfrozen and seasonal frozen soil regions on the QTP are distributed mainly at elevations of ≤5000 and ≤6000 m, respectively, whereas the permafrost soil is distributed at all elevation levels. FVC varied obviously with elevation for the different types of soil (Figure 6). In unfrozen soil areas, FVC was largest at elevation ≤5000 m; the maximum value (0.929) was at elevation ≤2000 m. As elevation increased, FVC decreased gradually. In seasonal frozen soil areas, FVC was highest (0.812) at elevation ≤2000 m. With increasing elevation, the variation of FVC showed a trend of decline, followed by increase, and then decline. In permafrost regions, FVC mainly decreased with increasing elevation. At all elevations except 2000–3000 m, FVC values of permafrost regions were smaller than those of seasonal frozen soil regions. At elevation >6000 m, there was only permafrost and FVC was relatively low (0.038). The variation of FVC with different elevation and aspect is presented in Table 1. The FVC of both permafrost soil and unfrozen soil exhibited a downward trend with increasing elevation. The FVC of seasonal frozen soil generally decreased gradually with increasing elevation but with a slight increase at elevations of 3000–4000 m. In seasonal frozen soil, when elevation was ≤4000 m, FVC of sunny slopes was larger than that of shady slopes, and FVC of semi-sunny slopes was larger than that of semi-shady slopes. At elevation >4000 m, FVC of shady slopes was larger than that of sunny slopes, and FVC of semi-shady slopes was larger than that of semi-sunny slopes. In permafrost regions, FVC of semi-shady slopes was larger than that of semi-sunny slopes. Except at elevations of 3000–4000 m, FVC of shady slopes was larger than that of sunny slopes. In unfrozen soil areas, at elevations of 2000–4000 m, FVC of shady slopes was larger than that of sunny slopes, and at elevations ≤2000 or ≥4000 m, FVC of sunny slopes was larger than that of shady slopes.
Changes of CV with elevation on the QTP were analyzed (Table 2). In seasonal frozen soil areas, FVC of sunny slopes was larger than that of shady slopes at elevation ≤4000 m, and CV was largest (32.55%) at elevations of 2000–3000 m; thus, aspect had obvious impact on FVC. At elevation >4000 m, FVC of shady slopes was larger than that of sunny slopes, and CV was negative. At elevations of 5000–6000 m, CV was smallest (−29.32%), and it was obviously affected by aspect. In permafrost regions, except at elevations of 3000–4000 m, FVC of shady slopes was larger than that of sunny slopes, indicating that aspect had marked influence on FVC at elevation >4000 m. The influence of aspect on FVC in unfrozen soil areas was small when elevation was ≤4000 m; CV was maximum (27.17%) at elevations of 4000–5000 m. FVC of sunny slopes was greater than that of shady slopes at elevation ≤2000 m, and FVC of shady slopes was greater than that of sunny slopes at elevations of 2000–4000 m.

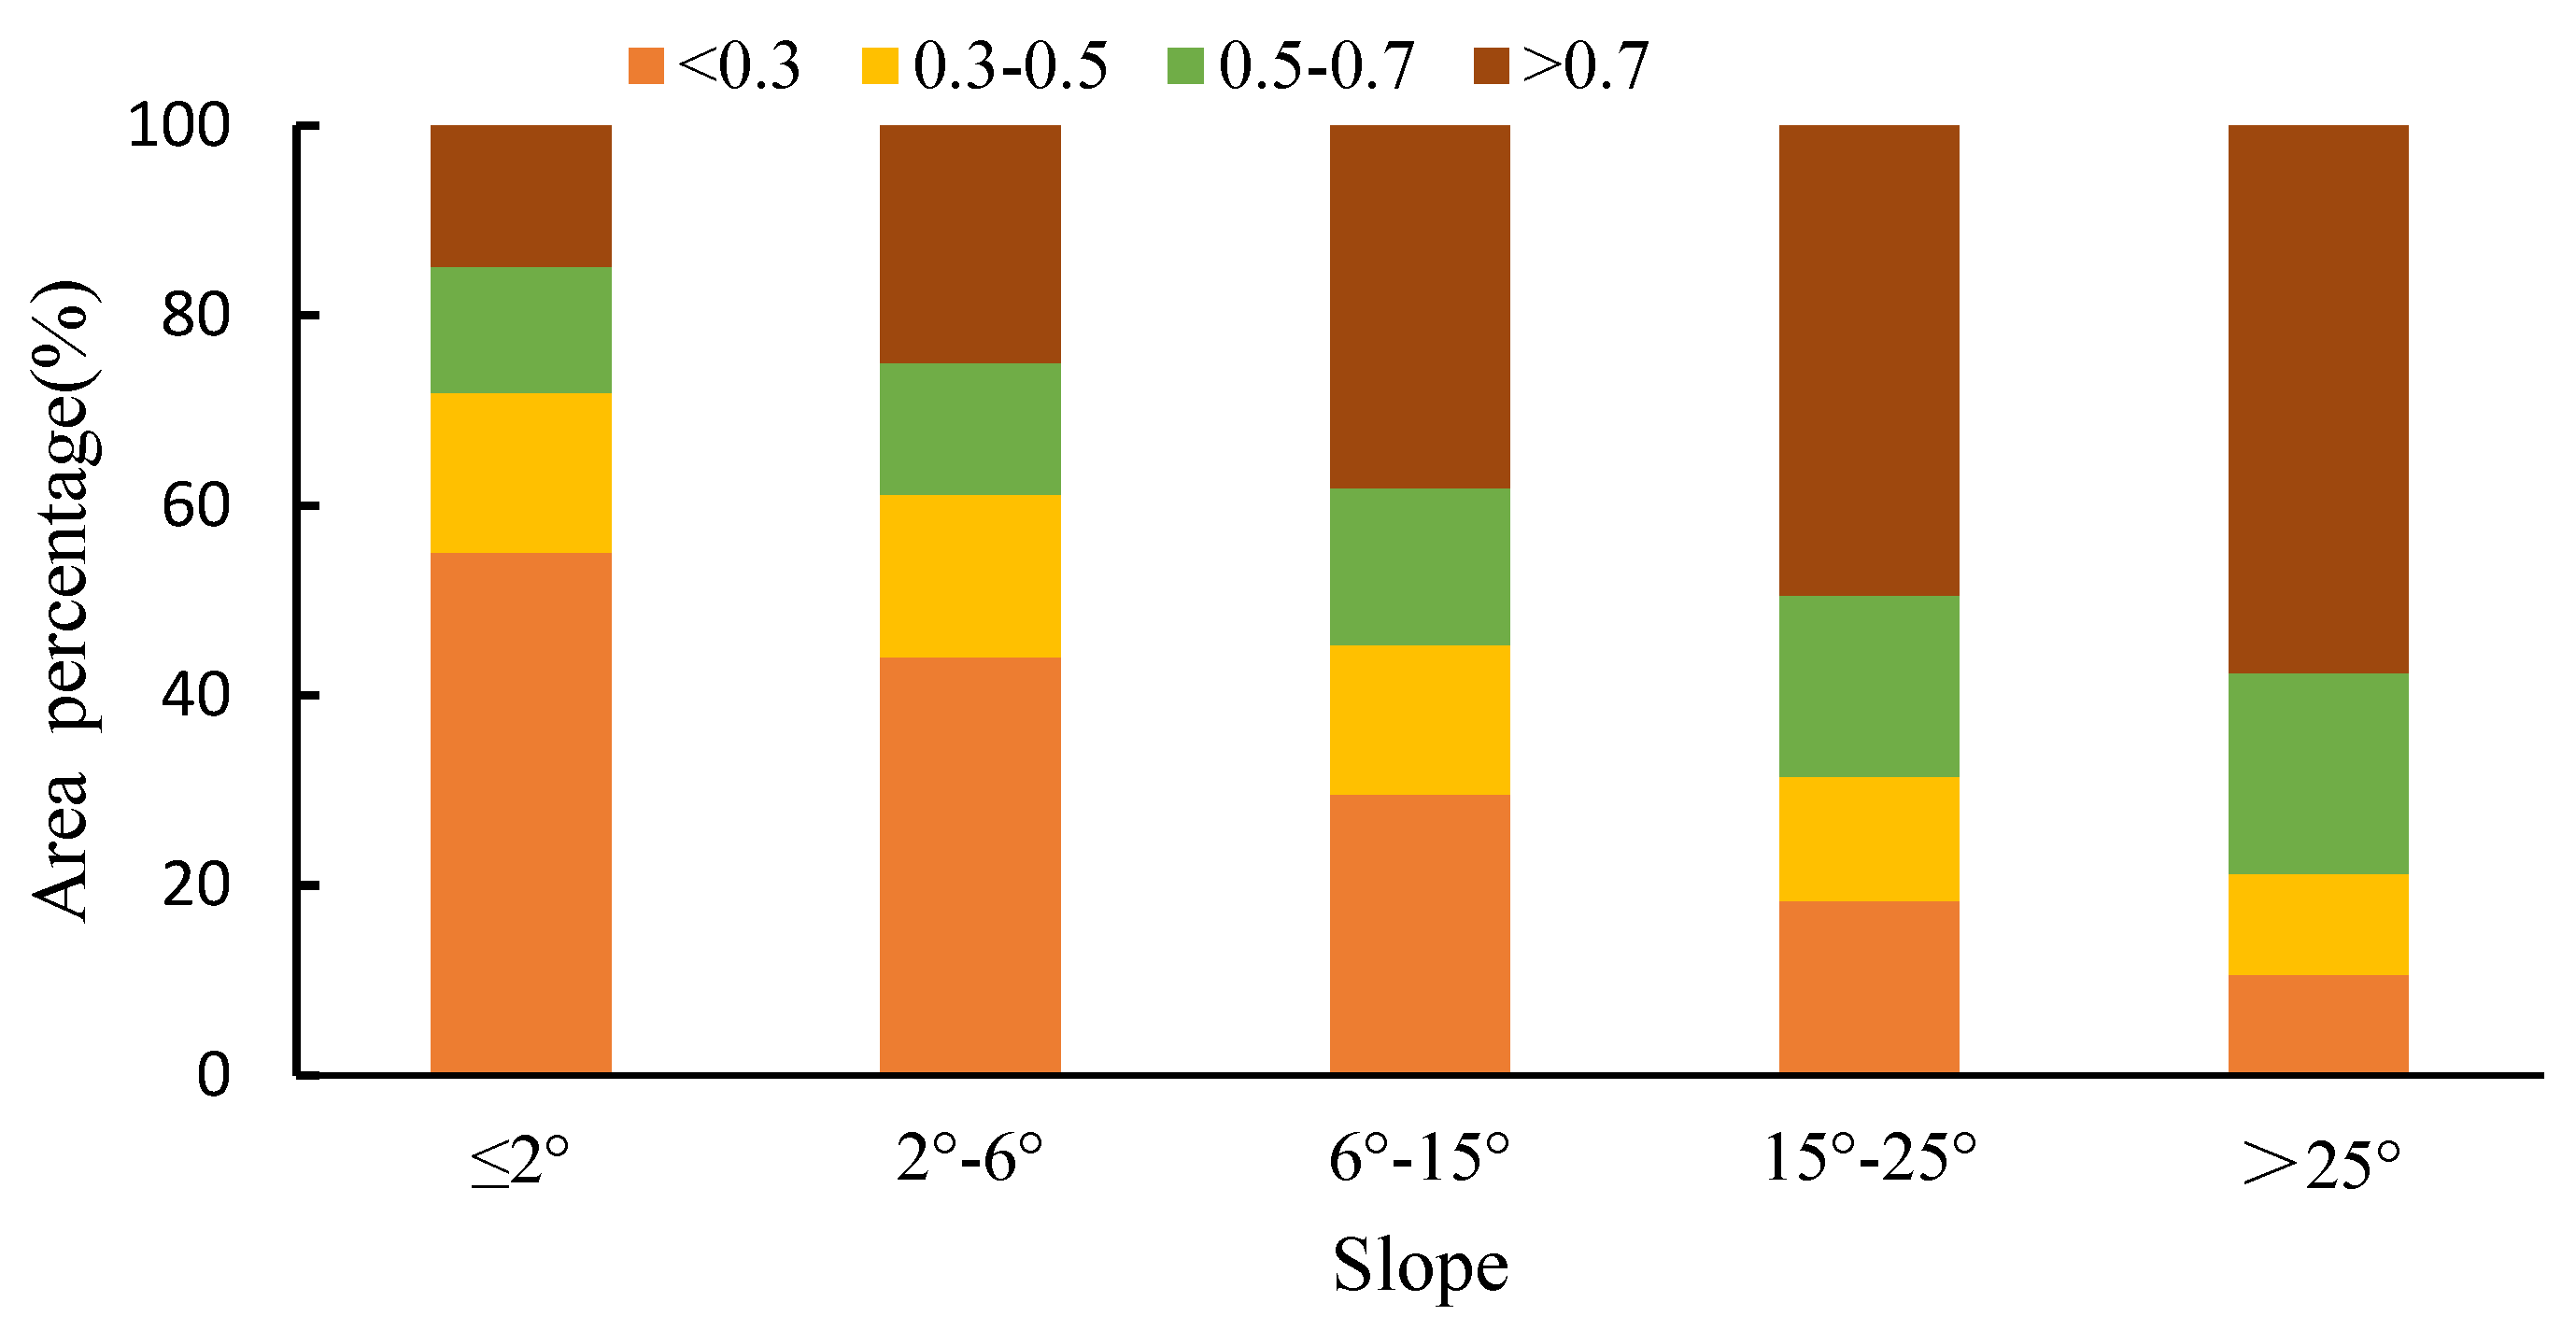
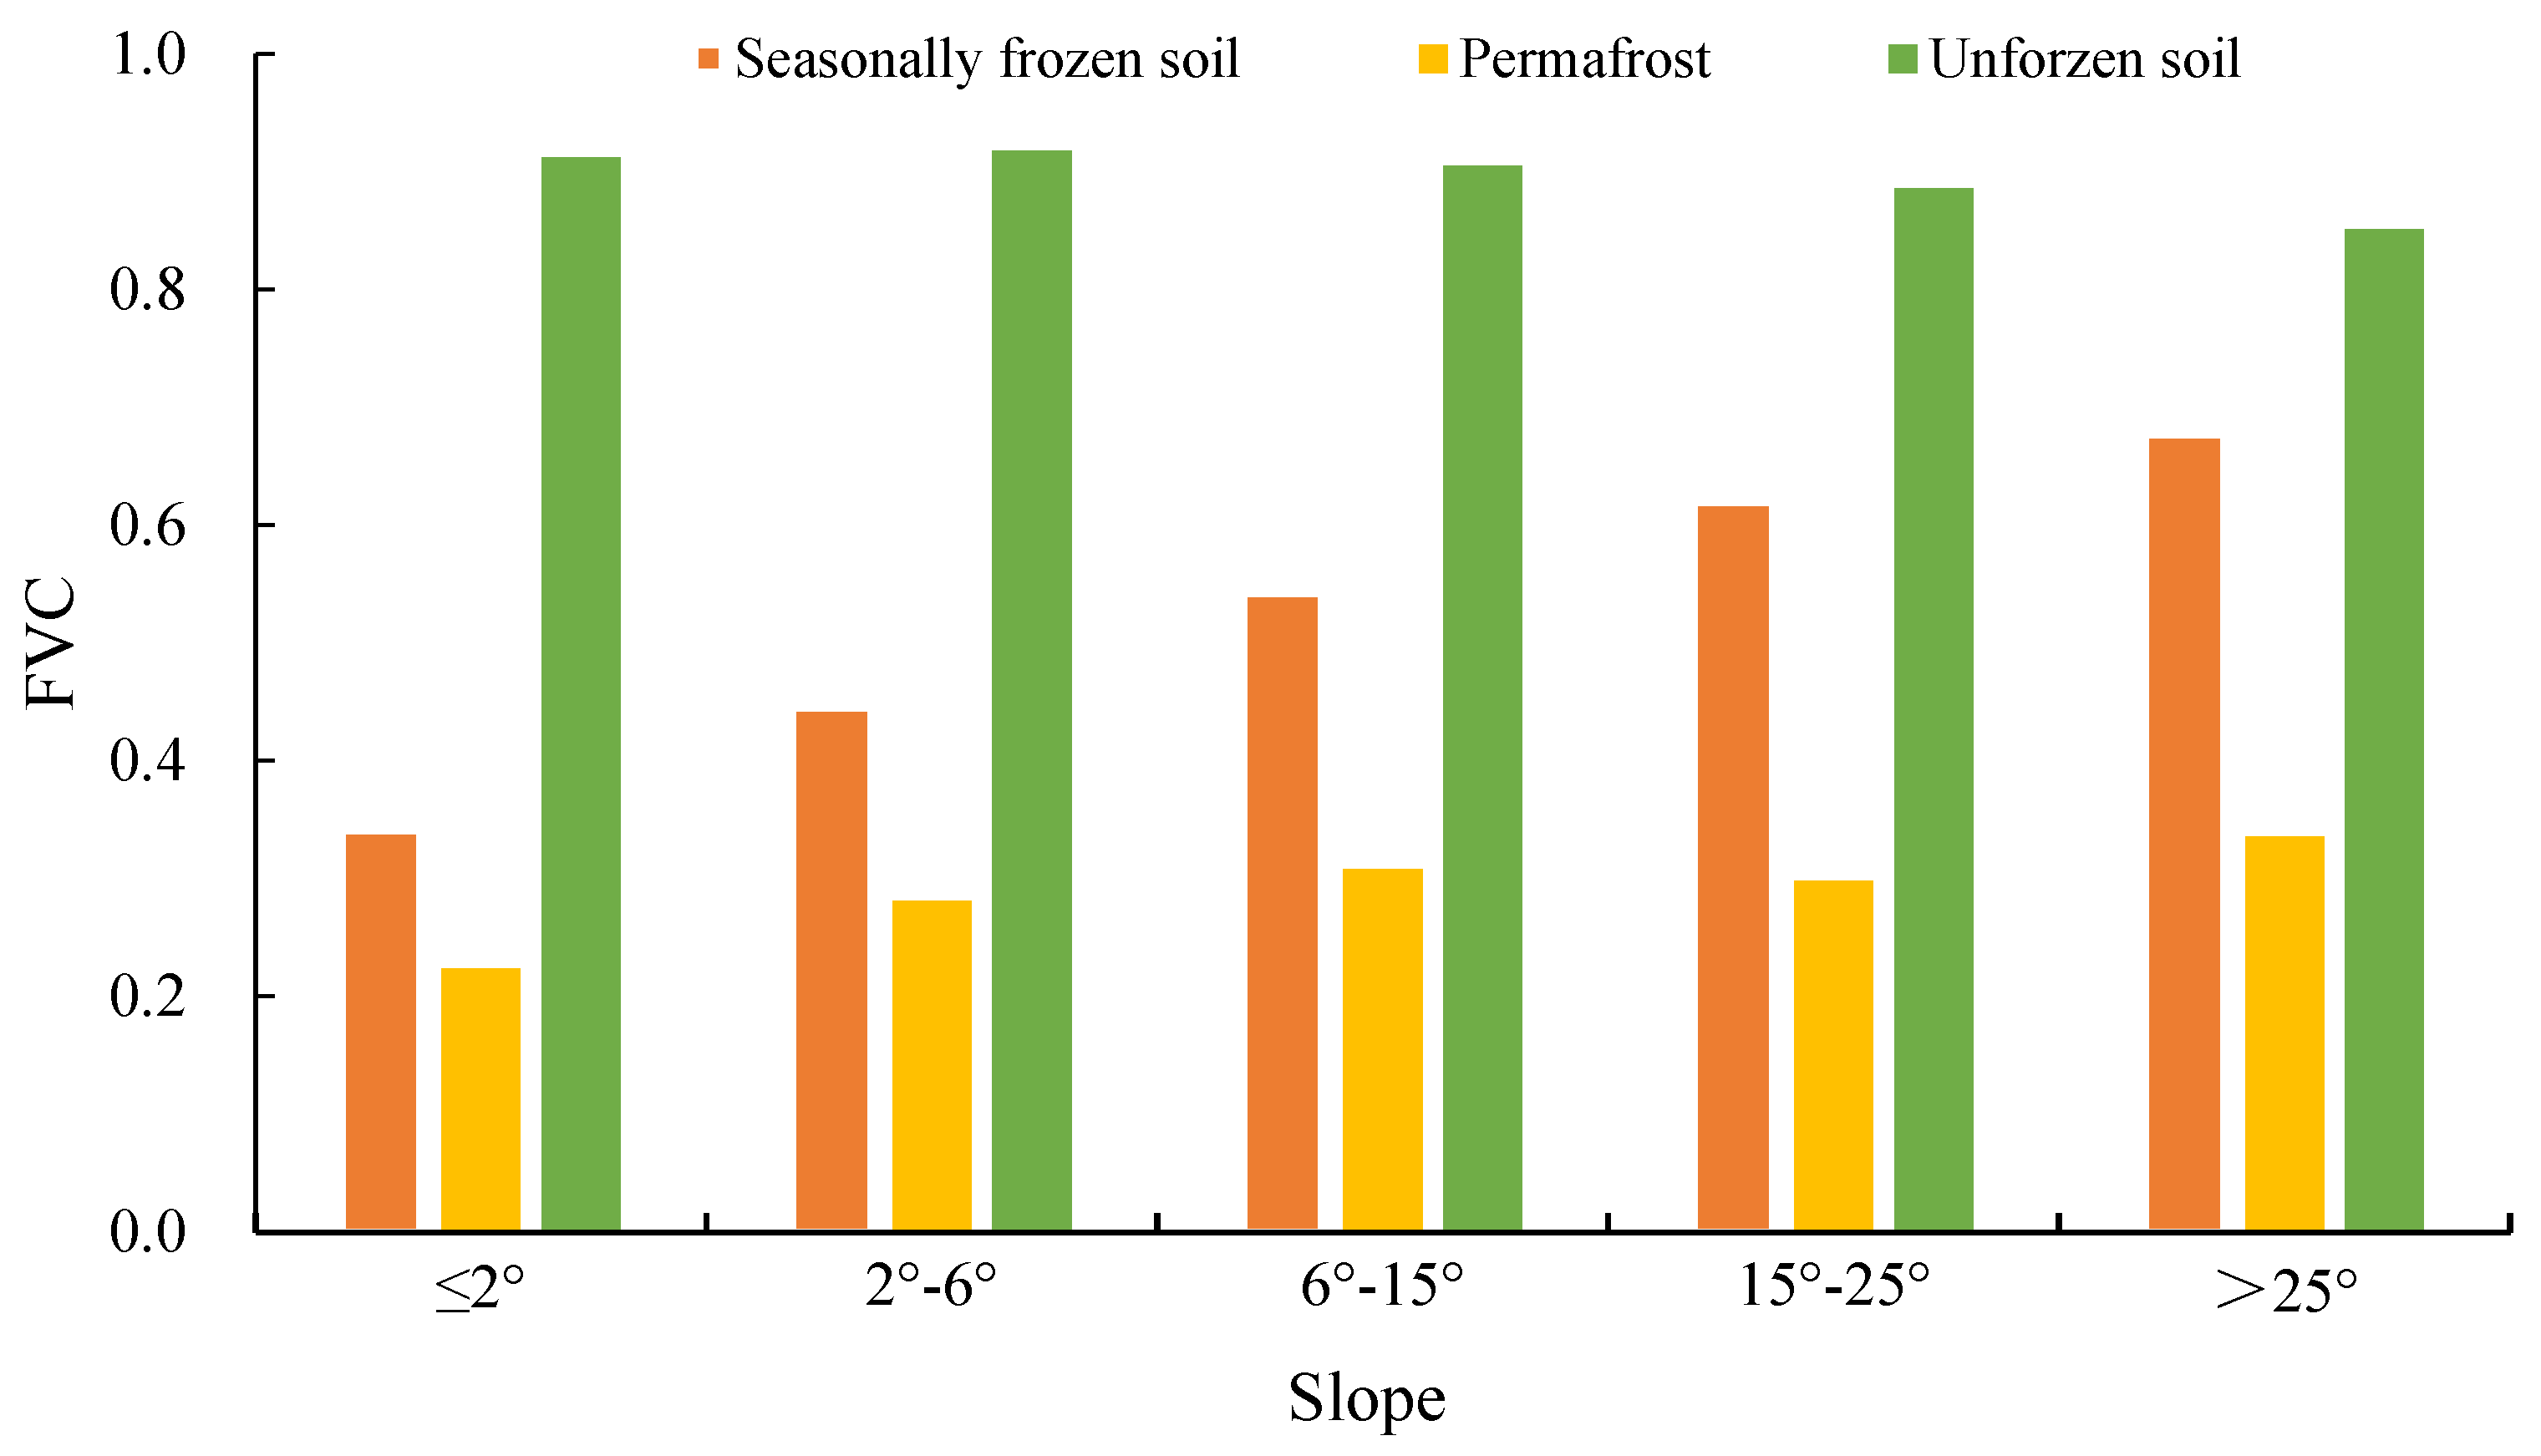
4.2.2. Effect of Slope and Aspect

On the QTP, FVC exhibited notable differences with slope (Figure 7). The areal proportion of low coverage decreased gradually with increasing slope. The areal proportion of medium coverage decreased gradually with increasing slope except for slopes of for 2°–6°. The areal proportions of high and extremely high coverage increased gradually with increasing slope.
The variations of FVC at different slopes for different soil types on the QTP are shown in Figure 8. For seasonal frozen soil, FVC had middle (high) coverage when slope was ≤6° (>6°); overall, FVC showed a gradual trend on increase with increasing slope. For permafrost soil, FVC had low (middle) coverage when slope was ≤6° (>6°). Except for slopes of 15°–25°, FVC showed a trend of increase with increasing slope. For unfrozen soil, FVC had extremely high coverage for all slope levels, although it decreased gradually with increasing slope.
Variations of FVC with different slopes and aspect were analyzed (Table 3). Results showed that FVC exhibited little difference in relation to slope and aspect for each soil type. For seasonal frozen soil, when slope was ≤15°, FVC exhibited little difference in relation to slope and aspect; however, when slope was >15°, the slope and aspect effect became more obvious with increasing slope. For slope >25°, FVC values of shady and semi-shady slopes were larger than those of sunny and semi-sunny slopes. For permafrost regions, when slope was ≤2°, the slope and aspect effect was not obvious. When slope was 2°–6°, the FVC value of semi-shady slopes was larger than middle coverage, whereas it was low coverage for other slopes and aspects. When slope was >6°, the FVC values of shady and semi-shady slopes were larger than those of sunny and semi-sunny slopes. For unfrozen soil, when slope was ≤2°, the FVC values of semi-shady and semi-sunny slopes were relatively large, while those of shady and sunny slopes were relatively small. When slope was 2°–6°, the FVC values of sunny and shady slopes were greater than those of semi-sunny and semi-shady slopes. When slope was 6°–15°, the effect of aspect was substantial and for sunny slopes, FVC was larger than that for other aspects; when slope was >15°, the effect of aspect was relatively weak.
Obvious differences were found in the variations of CV with different slopes for the different soil types (Table 4). For seasonal frozen soil, when slope was ≤6°, FVC of sunny slopes was larger than that of shady slopes, and when slope was >6°, FVC of shady slopes was larger than that of sunny slopes. For permafrost, CV was negative for all slopes; for sunny slopes, FVC was less than that for shady slopes, and CV increased gradually with increasing slope. For unfrozen soil, CV was positive for all slopes; for sunny slopes, FVC was larger than that for shady slopes.

5. Discussion

Within the context of global climate change, temperature and precipitation are considered the main climatic factors leading to vegetation change. Additionally, human population, agriculture, and animal husbandry production activities are also important factors driving vegetation change [46]. The interaction between these natural and human factors has had substantial impact on the surface processes of the QTP, which has been reflected in changes to regional vegetation growth.

5.1. Natural Factors

Temperature and precipitation are important indicators of climate change and represent the most important climatic factors affecting plant distribution and vegetation growth on the QTP. In this study, temperature and precipitation data were spatially interpolated onto grids, and correlation analysis was performed between FVC and the two climatic factors (p < 0.05) (Figure 9). Generally, FVC had positive correlation with temperature in the range of 0–0.868 (r = 0.009) over most of the QTP. Areas with positive correlation were distributed mainly in Qinghai Province, northwestern Gansu Province, and western Sichuan Province. The area with negative correlation in the range of −0.860 to 0 was relatively small and distributed mainly in central Qinghai Province, southern Xinjiang Province, and southwestern parts of Tibet with high elevation (>4000 m). In the alpine environment, the rise in temperature was conducive to vegetation growth. However, with increasing elevation, the marked decrease in temperature became an important limiting factor of plant growth.
When the temperature in the frozen soil area is higher than 0 °C, the ice in the frozen soil starts to melt, which can provide certain water for the soil and vegetation. Vegetation on the QTP might be sensitive to temperature, especially the accumulated temperature over 0 °C. Relationship between accumulated temperature over 0 °C and FVC was analyzed, and the result showed FVC had negative correlation with accumulated temperature in the range of −1–0 (r = −0.018) on the most of the QTP. Areas with negative correlation were distributed mainly in southwestern parts of Qinghai Province, southern Xinjiang Province, southern and southwestern parts of Tibet, Yunnan and Sichuan Provinces. The area with positive correlation in the range of 0 to 1 was relatively small and distributed mainly in the central and eastern parts of Qinghai Province, northern part of Tibet and Gansu Provinces.
Over most of the QTP, positive correlation in the range of 0–0.937 was found to exist between FVC and precipitation (r = 0.089). Areas of negative correlation (−0.894 to 0) were distributed in small parts of the QTP. The regions with high correlation were distributed mainly in southern and northwestern Gansu Province, northern and central Qinghai Province, southern Xinjiang Province, and southwestern Tibet. Ample amounts of precipitation encourage vigorous growth of local vegetation; thus, precipitation is an important factor affecting the growth status of local vegetation on the QTP. The areas with negative correlation were distributed mainly in southeastern parts of the QTP, where precipitation showed a trend of decrease, which inhibited plant growth. Owing to the influence of the monsoons and westerly winds, projections indicate that annual precipitation in northeastern, central, and southwestern parts of the QTP will increase in 2020, 2050 and 2080, whereas annual precipitation in southeastern parts will decrease [47]. The precipitation distribution will further affect vegetation growth on the QTP.
During 2000–2020, the climate of the QTP was mainly warm and humid (Figure 10). Temperature rise could meet the heat conditions required for plant growth in alpine areas. Additionally, it could increase the melting degree of frozen soil and thereby increase water availability for vegetation. The effects of temperature rise in areas with different topography and vegetation types would be notably different. The increase in temperature would stimulate the growth of alpine meadow, but temperature-induced drought would inhibit such growth [48]. Moreover, thawing lakes and thawing collapses attributable to thawing of frozen soil would also degrade or eradicate some vegetation. Overall, increased temperature and enhanced precipitation favor vegetation growth. However, on the QTP, their combined effects exhibited strong spatial heterogeneity. An increase in precipitation tended to enhance vegetation when the temperature tended to increase, but when precipitation decreased, temperature was the limiting factor [49]. The warm and wet areas of the QTP accounted for 32.78% of the total area; cold and wet areas accounted for 32.59%; warm and dry areas accounted for 19.07%, and cold and dry areas accounted for 15.56%. The tendency for warm and wet conditions was the main reason for the improvement of vegetation on the QTP. For different frozen soil types, the effects of temperature and precipitation change were very different. In seasonal frozen soil areas, the area with warm and wet conditions accounted for the largest proportion of the total area (36.40%), followed by areas with cold and wet conditions (29.98%), warm and dry conditions (17.82%), and cold and dry conditions (15.8%). In the permafrost region, the area with warm and wet conditions accounted for the largest proportion of the total area (36.93%), followed by areas with cold and wet conditions (27.73%), warm and dry conditions (20.6%), and cold and dry conditions (14.74%). The area with warm and wet conditions in both seasonal frozen soil areas and permafrost soil regions was largest, which played an important role in promoting the improvement of local vegetation growth. In unfrozen soil regions, the area with cold and dry conditions was largest (31.59%), followed by areas with warm and dry conditions (29.36%), areas with cold and wet conditions (20.62%), and areas with warm and wet conditions (18.43%). The area with warm and wet conditions in unfrozen soil regions accounted for the smallest proportion, whereas the areas with cold and dry conditions and warm and dry conditions accounted for 60.95% of the total. The drying trend of the environment showed a certain inhibitory effect on the local vegetation.

5.2. Human Factors

Human factors are also an important driving force affecting vegetation growth on the QTP. The surge in population and the large amount of greenhouse gas emissions have had obvious consequences regarding global warming [50]. According to the sixth report of the Intergovernmental Panel on Climate Change issued in 2021, global temperature rise has reached 1.1 °C (above the preindustrial benchmark temperature) and is in the process of reaching the proposed upper limit (1.5 °C) for sustainable human habitability [51]. Under this background of global warming, degradation of glaciers and frozen soil on the QTP has changed the surface water cycle process, and affected the distribution and growth of vegetation. Following recent rapid growth of the population on the QTP, the impact of human activities on the ecological environment has increased, which has also affected local vegetation growth. Human activities could lead to increase in local vegetation coverage through the Grain-to-Green Program, afforestation, and promoting agricultural technological progress. However, damage caused to the ecological environment by unsustainable farming practices, urban expansion, overgrazing, and mining could also lead to substantial deterioration in regional vegetation coverage. Taking Qinghai Province as an example, following implementation of China’s western development program in 2000, the population of Qinghai Province increased from 5.165 million in 2000, to 5.432 million in 2005, 5.735 million in 2010, 5.770 million in 2015, and 5.928 million in 2020, at an average growth rate of 3.63%. This rapid increase in population exerted considerable pressure on the local ecological environment. Moreover, Qinghai Province is an important area for animal husbandry in China, and it has the highest number of livestock of any province in China. According to the Qinghai Statistical Yearbook (http://tjj.qinghai.gov.cn/, accessed on 4 November 2021), the breeding stock of cattle and sheep in 2000, 2005, 2010, 2015, and 2020 was 20.834 million, 22.191 million, 19.768 million, 19.205 million, and 19.956 million, respectively. These huge numbers of grazing livestock have caused substantial pressure on local grassland and affected the growth of local vegetation. Additionally, desertification processes have also been very prominent. According to A Bulletin of Status Quo of Desertification and Sandification in Qinghai Province in 2015 (http://www.forestry.gov.cn/, accessed on 15 June 2020), the existing area of desertification at the end of 2014 was 19.04 million ha, accounting for 26.50% of the entire area of the province. The land areas with desertification and obvious desertification trend accounted for 12.46 million and 4.13 million ha, respectively. Desertification on the QTP remains a serious problem that has major impact on local vegetation coverage.
Although increases in the human population and livestock numbers might cause substantial pressure on regional vegetation, implementation of active policies could also provide favorable conditions for vegetation restoration. Programs for relocation of herdsmen and adjustment of the production structure in ecologically fragile areas have led to continuous reduction in the proportion of the population involved in agriculture and animal husbandry, and further reduced the grassland pressure in agricultural and pastoral areas of the QTP. Additionally, implementation of a series of ecological engineering policies such as the Construction of Ecological Security Barriers has curbed the trend of vegetation degradation or even led to local improvement [52]. In terms of reserve construction, Qinghai Province has established 11 nature reserves (http://www.mee.gov.cn/, accessed on 9 October 2021). All these nature reserves have played a very positive role in vegetation restoration in Qinghai Province. Moreover, Qinghai Province began to implement the Grain-to-Green Program in 2000, and it had completed afforestation of an area of 8.91 × 105 ha by 2011. By the end of 2016, the area of farmland returned to forests was 7.40 × 10⁵ ha, and the total forested area had reached 4.52 × 10⁷ ha. In terms of desertification control projects, Qinghai Province started the “Three-North Shelterbelt” Project in 1978. Since 2016, Qinghai Province has implemented the Qinghai Desertification Prevention and Control Plan (2011–2020), and it had completed desertification land control tasks over an area of 4.24 × 10⁵ ha by the end of 2019. According to the results of the Fifth Desertification Land Monitoring in Qinghai Province, the areas of desertification land and sand land were reduced by 5.1 × 10⁴ and 5.7 × 10⁴ ha, respectively, between 2009 and 2014. The ecological environment of the sand land area has improved substantially, and an initial green ecological barrier has been established. The active environmental protection policies outlined above have played a very important role in vegetation restoration and improved vegetation growth on the QTP.

6. Conclusions

Using MODIS-EVI and DEM data, this study investigated the spatiotemporal variation characteristics of vegetation growth status in areas of the QTP with different soil types during 2000–2020 and analyzed FVC variations attributable to different topographic conditions. The principal conclusion was that the variation trend of FVC showed a gradual trend of growth. The multiyear mean value of FVC was 0.421, and the vegetation index gradually decreased from the southeast to the northwest. The FVC value in the permafrost soil area was the smallest, followed by the seasonal frozen soil area, and the unfrozen soil area. Topographic effects varied for all soil types depending on elevation and slope. Correlation analysis between vegetation coverage and temperature or precipitation revealed positive correlation between FVC and precipitation or temperature. Analysis of temperature and humidity revealed that the QTP climate has tended to become warmer and wetter, which is the principal natural reason for the improvement of FVC on the QTP. Although increases in the human population and numbers of livestock might cause considerable pressure on local vegetation, implementation of active policies such as the Grain-to-Green Program, afforestation, closing mountains for afforestation, and promoting agricultural technological progress has increased vegetation coverage.

Author Contributions

Conceptualization, F.Y.; Methodology, F.Y. and R.W.; Software, R.W. and F.Y.; Validation, R.W., Y.W. and F.Y.; Formal Analysis, R.W., Y.W. and F.Y.; Investigation, R.W., Y.W. and F.Y.; Resources, Y.W., F.Y. and R.W.; Data Curation, Y.W. and R.W.; Writing—Original Draft Preparation, R.W., Y.W. and F.Y.; Writing—Review & Editing, F.Y. and R.W.; Visualization, R.W. and Y.W.; Supervision, F.Y.; Project Administration, F.Y.; Funding Acquisition, F.Y. All authors have read and agreed to the published version of the manuscript.

Funding

This research was funded by National Nonprofit Institute Research Grant of Chinese Academy of Forestry (grant number CAFYBB2019GB001 & CAFYBB2018ZA004), Fengyun Application Pioneering Project (grant number FY-APP-2021.0402) and National Science Foundation of China (grant number 41301458).

Acknowledgments

The authors would like to thank NASA, the Computer Network Information Center of the Chinese Academy of Sciences and China Meteorological Data Service Center for sharing MODIS data, DEM data and meteorological data, respectively.

Conflicts of Interest

The authors declare no conflict of interest.

References

  1. Sun, H.; He, D.; Sui, X.; Chen, Y. Predicting Impacts of Future Climate Change and Hydropower Development towards Habitats of Native and Non-Native Fishes. Sci. Total Environ. 2020, 707, 135419. [Google Scholar] [CrossRef] [PubMed]
  2. Zhang, J.; Liu, S.; Yang, S. The Classification and Assessment of Freeze-Thaw Erosion in Tibet. J. Geogr. Sci. 2007, 17, 165–174. [Google Scholar] [CrossRef]
  3. Kuang, X.; Jiao, J.J. Review on Climate Change on the Tibetan Plateau during the Last Half Century. J. Geophys. Res. Atmos. 2016, 121, 3979–4007. [Google Scholar] [CrossRef]
  4. Lin, Z.; Guodong, C.; Yongjian, D. Studies on Frozen Ground of China. J. Geogr. Sci. 2004, 14, 411–416. [Google Scholar] [CrossRef]
  5. Schuur, E.A.G.; Bockheim, J.; Canadell, J.G.; Euskirchen, E.; Field, C.B.; Goryachkin, S.V.; Hagemann, S.; Kuhry, P.; Lafleur, P.M.; Lee, H.; et al. Vulnerability of Permafrost Carbon to Climate Change: Implications for the Global Carbon Cycle. Bioscience 2008, 58, 701–714. [Google Scholar] [CrossRef]
  6. You, Q.; Xue, X.; Peng, F.; Dong, S.; Gao, Y. Surface Water and Heat Exchange Comparison between Alpine Meadow and Bare Land in a Permafrost Region of the Tibetan Plateau. Agric. Forest Meteorol. 2017, 232, 48–65. [Google Scholar] [CrossRef]
  7. Cheng, G.; Jin, H. Permafrost and Groundwater on the Qinghai-Tibet Plateau and in Northeast China. Hydrogeol. J. 2013, 21, 5–23. [Google Scholar] [CrossRef]
  8. Black, R.F. Features Indicative of Permafrost. Annu. Rev. Earth. Planet. Sci. 1976, 4, 75–94. [Google Scholar] [CrossRef]
  9. Tutubalina, O.V.; Rees, W.G. Vegetation Degradation in a Permafrost Region as Seen from Space: Noril’sk (1961–1999). Cold Reg. Sci. Technol. 2001, 32, 191–203. [Google Scholar] [CrossRef]
  10. Limpens, J.; Fijen, T.P.M.; Keizer, I.; Meijer, J.; Olsthoorn, F.; Pereira, A.; Postma, R.; Suyker, M.; Vasander, H.; Holmgren, M. Shrubs and Degraded Permafrost Pave the Way for Tree Establishment in Subarctic Peatlands. Ecosystems 2021, 24, 370–383. [Google Scholar] [CrossRef]
  11. Shur, Y.L.; Jorgenson, M.T. Patterns of Permafrost Formation and Degradation in Relation to Climate and Ecosystems. Permafrost. Periglac. 2007, 18, 7–19. [Google Scholar] [CrossRef]
  12. Jin, H.; He, R.; Cheng, G.; Wu, Q.; Wang, S.; Lü, L.; Chang, X. Changes in Frozen Ground in the Source Area of the Yellow River on the Qinghai–Tibet Plateau, China, and Their Eco-Environmental Impacts. Environ. Res. Lett. 2009, 4, 045206. [Google Scholar] [CrossRef]
  13. Qin, Y.; Lei, H.; Yang, D.; Gao, B.; Wang, Y.; Cong, Z.; Fan, W. Long-Term Change in the Depth of Seasonally Frozen Ground and Its Ecohydrological Impacts in the Qilian Mountains, Northeastern Tibetan Plateau. J. Hydrol. 2016, 542, 204–221. [Google Scholar] [CrossRef]
  14. Sun, J.; Li, X.; Wang, X.; Lü, J.; Li, Z. Plant Species Distribution in Permafrost Wetlands of the Great Hing’an Mountain Valleys and Its Response to Global Climate Change. J. Earth Sci-China. 2010, 21, 266–270. [Google Scholar] [CrossRef]
  15. Lunardini, V.J. Climatic Warming and the Degradation of Warm Permafrost. Permafrost. Periglac. 1996, 7, 311–320. [Google Scholar] [CrossRef]
  16. Yang, Z.; Gao, J.; Zhou, C.; Shi, P.; Zhao, L.; Shen, W.; Ouyang, H. Spatio-Temporal Changes of NDVI and Its Relation with Climatic Variables in the Source Regions of the Yangtze and Yellow Rivers. J. Geogr. Sci. 2011, 21, 979–993. [Google Scholar] [CrossRef]
  17. Chen, H.; Zhu, Q.; Peng, C.; Wu, N.; Wang, Y.; Fang, X.; Gao, Y.; Zhu, D.; Yang, G.; Tian, J.; et al. The Impacts of Climate Change and Human Activities on Biogeochemical Cycles on the Qinghai-Tibetan Plateau. Glob. Chang. Biol. 2013, 19, 2940–2955. [Google Scholar] [CrossRef]
  18. Kreyling, J.; Beierkuhnlein, C.; Pritsch, K.; Schloter, M.; Jentsch, A. Recurrent Soil Freeze–Thaw Cycles Enhance Grassland Productivity. New Phytol. 2008, 177, 938–945. [Google Scholar] [CrossRef]
  19. Al-Bakri, J.T.; Taylor, J.C. Application of NOAA AVHRR for Monitoring Vegetation Conditions and Biomass in Jordan. J. Arid Environ. 2003, 54, 579–593. [Google Scholar] [CrossRef]
  20. Weiss, J.L.; Gutzler, D.S.; Coonrod, J.E.A.; Dahm, C.N. Long-Term Vegetation Monitoring with NDVI in a Diverse Semi-Arid Setting, Central New Mexico, USA. J. Arid Environ. 2004, 58, 249–272. [Google Scholar] [CrossRef]
  21. Chen, J.; Yan, F.; Lu, Q. Spatiotemporal Variation of Vegetation on the Qinghai-Tibet Plateau and the Influence of Climatic Factors and Human Activities on Vegetation Trend (2000–2019). Remote Sens. 2020, 12, 3150. [Google Scholar] [CrossRef]
  22. Dutta, D.; Das, P.K.; Paul, S.; Sharma, J.R.; Dadhwal, V.K. Assessment of Ecological Disturbance in the Mangrove Forest of Sundarbans Caused by Cyclones Using MODIS Time-Series Data (2001–2011). Nat. Hazards 2015, 79, 775–790. [Google Scholar] [CrossRef]
  23. Otto, M.; Höpfner, C.; Curio, J.; Maussion, F.; Scherer, D. Assessing Vegetation Response to Precipitation in Northwest Morocco during the Last Decade: An Application of MODIS NDVI and High Resolution Reanalysis Data. Theor. Appl. Climatol. 2016, 123, 23–41. [Google Scholar] [CrossRef]
  24. Huete, A. A Comparison of Vegetation Indices over a Global Set of TM Images for EOS-MODIS. Remote Sens. Environ. 1997, 59, 440–451. [Google Scholar] [CrossRef]
  25. Huete, A.; Didan, K.; Miura, T.; Rodriguez, E.P.; Gao, X.; Ferreira, L.G. Overview of the Radiometric and Biophysical Performance of the MODIS Vegetation Indices. Remote Sens. Environ. 2002, 83, 195–213. [Google Scholar] [CrossRef]
  26. Bell, G.; Lechowicz, M.J.; Waterway, M.J. Environmental Heterogeneity and Species Diversity of Forest Sedges. J. Ecol. 2000, 88, 67–87. [Google Scholar] [CrossRef]
  27. Elmendorf, S.C.; Henry, G.H.R.; Hollister, R.D.; Björk, R.G.; Boulanger-Lapointe, N.; Cooper, E.J.; Cornelissen, J.H.C.; Day, T.A.; Dorrepaal, E.; Elumeeva, T.G.; et al. Plot-Scale Evidence of Tundra Vegetation Change and Links to Recent Summer Warming. Nat. Clim. Chang. 2012, 2, 453–457. [Google Scholar] [CrossRef]
  28. Eisenlohr, P.V.; Alves, L.F.; Bernacci, L.C.; Padgurschi, M.C.G.; Torres, R.B.; Prata, E.M.B.; dos Santos, F.A.M.; Assis, M.A.; Ramos, E.; Rochelle, A.L.C.; et al. Disturbances, Elevation, Topography and Spatial Proximity Drive Vegetation Patterns along an Altitudinal Gradient of a Top Biodiversity Hotspot. Biodivers. Conserv. 2013, 22, 2767–2783. [Google Scholar] [CrossRef]
  29. Wang, R.; Yan, F.; Wang, Y. Vegetation Growth Status and Topographic Effects in the Pisha Sandstone Area of China. Remote Sens. 2020, 12, 2759. [Google Scholar] [CrossRef]
  30. Yan, F.; Wu, B.; Wang, Y. Estimating Spatiotemporal Patterns of Aboveground Biomass Using Landsat TM and MODIS Images in the Mu Us Sandy Land, China. Agric. Forest Meteorol. 2015, 200, 119–128. [Google Scholar] [CrossRef]
  31. Zou, D.; Zhao, L.; Sheng, Y.; Chen, J.; Hu, G.; Wu, T.; Wu, J.; Xie, C.; Wu, X.; Pang, Q.; et al. A New Map of Permafrost Distribution on the Tibetan Plateau. Cryosphere 2017, 11, 2527–2542. [Google Scholar] [CrossRef]
  32. Wang, Y.H.; Liu, H.Y.; Chung, H.; Yu, L.; Mi, Z.; Geng, Y.; Jing, X.; Wang, S.; Zeng, H.; Cao, G.; et al. Non-growing Season Soil Respiration Is Controlled by Freezing and Thawing Processes in the Summer Monsoon-dominated Tibetan Alpine Grassland. Glob. Biogeochem. Cycles 2014, 28, 1081–1095. [Google Scholar] [CrossRef]
  33. Gitelson, A.A.; Kaufman, Y.J.; Stark, R.; Rundquist, D. Novel Algorithms for Remote Estimation of Vegetation Fraction. Remote Sens. Environ. 2002, 80, 76–87. [Google Scholar] [CrossRef]
  34. Busetto, L.; Meroni, M.; Colombo, R. Combining Medium and Coarse Spatial Resolution Satellite Data to Improve the Estimation of Sub-Pixel NDVI Time Series. Remote Sens. Environ. 2008, 112, 118–131. [Google Scholar] [CrossRef]
  35. Meusburger, K.; Bänninger, D.; Alewell, C. Estimating Vegetation Parameter for Soil Erosion Assessment in an Alpine Catchment by Means of QuickBird Imagery. Int. J. Appl. Earth Obs. 2010, 12, 201–207. [Google Scholar] [CrossRef]
  36. Leprieur, C.; Verstraete, M.M.; Pinty, B. Evaluation of the Performance of Various Vegetation Indices to Retrieve Vegetation Cover from AVHRR Data. Remote Sens. Rev. 1994, 10, 265–284. [Google Scholar] [CrossRef]
  37. Carlson, T.N.; Ripley, D.A. On the Relation between NDVI, Fractional Vegetation Cover, and Leaf Area Index. Remote Sens. Environ. 1997, 62, 241–252. [Google Scholar] [CrossRef]
  38. Gutman, G.; Ignatov, A. The Derivation of the Green Vegetation Fraction from NOAA/AVHRR Data for Use in Numerical Weather Prediction Models. Int. J. Remote Sens. 1998, 19, 1533–1543. [Google Scholar] [CrossRef]
  39. Rundquist, B.C. The Influence of Canopy Green Vegetation Fraction on Spectral Measurements over Native Tallgrass Prairie. Remote Sens. Environ. 2002, 81, 129–135. [Google Scholar] [CrossRef]
  40. Tucker, C.J.; Newcomb, W.W.; Los, S.O.; Prince, S.D. Mean and Inter-Year Variation of Growing-Season Normalized Difference Vegetation Index for the Sahel 1981–1989. Int. J. Remote Sens. 1991, 12, 1133–1135. [Google Scholar] [CrossRef]
  41. Cai, B.; Yu, R. Advance and Evaluation in the Long Time Series Vegetation Trends Research Based on Remote Sensing. J. Remote Sens. 2009, 12, 1170–1186. [Google Scholar]
  42. Mann, H.B. Nonparametric Tests Against Trend. Econometrica 1945, 13, 245. [Google Scholar] [CrossRef]
  43. Kendall, M.G. Rank Correlation Methods; Charles Griffin: London, UK, 1948. [Google Scholar]
  44. Zhu, G.; Liu, Y.; Ju, W.; Chen, J. Evaluation of Topographic Effects on Four Commonly Used Vegetation Indices. J. Remote Sens. 2013, 17, 210–234. [Google Scholar]
  45. Carmel, Y.; Kadmon, R. Effects of Grazing and Topography on Long-Term Vegetation Changes in a Mediterranean Ecosystem in Israel. Plant. Ecol. 1999, 145, 243–254. [Google Scholar] [CrossRef]
  46. Lu, X.; Kelsey, K.C.; Yan, Y.; Sun, J.; Wang, X.; Cheng, G.; Neff, J.C. Effects of Grazing on Ecosystem Structure and Function of Alpine Grasslands in Qinghai-Tibetan Plateau: A Synthesis. Ecosphere 2017, 8, e01656. [Google Scholar]
  47. Gao, Q.; Guo, Y.; Xu, H.; Ganjurjav, H.; Li, Y.; Wan, Y.; Qin, X.; Ma, X.; Liu, S. Climate Change and Its Impacts on Vegetation Distribution and Net Primary Productivity of the Alpine Ecosystem in the Qinghai-Tibetan Plateau. Sci. Total Environ. 2016, 554–555, 34–41. [Google Scholar] [CrossRef]
  48. Ganjurjav, H.; Gao, Q.; Gornish, E.S.; Schwartz, M.W.; Liang, Y.; Cao, X.; Zhang, W.; Zhang, Y.; Li, W.; Wan, Y.; et al. Differential Response of Alpine Steppe and Alpine Meadow to Climate Warming in the Central Qinghai–Tibetan Plateau. Agric. Forest Meteorol. 2016, 223, 233–240. [Google Scholar] [CrossRef]
  49. Huang, K.; Zhang, Y.; Zhu, J.; Liu, Y.; Zu, J.; Zhang, J. The Influences of Climate Change and Human Activities on Vegetation Dynamics in the Qinghai-Tibet Plateau. Remote Sens. 2016, 8, 876. [Google Scholar] [CrossRef]
  50. Klein, T.; Anderegg, W.R.L. A Vast Increase in Heat Exposure in the 21st Century Is Driven by Global Warming and Urban Population Growth. Sustain. Cities Soc. 2021, 73, 103098. [Google Scholar] [CrossRef]
  51. Eyring, V.; Gillett, N.P.; Rao, K.M.A.; Barimalala, R.; Parrillo, M.B.; Bellouin, N.; Cassou, C.; Durack, P.J.; Kosaka, Y.; McGregor, S.; et al. Human Influence on the Climate System. In Climate Change 2021: The Physical Science Basis. Contribution of Working Group I to the Sixth Assessment Report of the Intergovernmental Panel on Climate Change; Cambridge University Press: Cambridge, UK; New York, NY, USA, 2021; pp. 423–552. [Google Scholar]
  52. Cai, H.; Yang, X.; Xu, X. Human-Induced Grassland Degradation/Restoration in the Central Tibetan Plateau: The Effects of Ecological Protection and Restoration Projects. Ecol. Eng. 2015, 83, 112–119. [Google Scholar] [CrossRef]
Figure 1. Elevation (a) and spatial distribution of frozen soil (b) on the Qinghai-Tibet.
Remotesensing 14 04830 g001
Figure 2. Slope (a) and aspect (b) on the Qinghai–Tibet Plateau.
Remotesensing 14 04830 g002
Figure 3. Spatial distribution of FVC (2000–2020) on the Qinghai–Tibet Plateau.
Remotesensing 14 04830 g003
Figure 4. Spatial (a) change rate and (b) significance test of FVC on the Qinghai–Tibet Plateau.
Remotesensing 14 04830 g004
Figure 5. Area percentage of FVC at different elevation levels on the Qinghai–Tibet Plateau.
Remotesensing 14 04830 g005
Figure 6. Variation of FVC at different elevation levels for different types of soil on the Qinghai–Tibet Plateau.
Remotesensing 14 04830 g006
Figure 7. Variation of FVC with different slope on the Qinghai–Tibet Plateau.
Remotesensing 14 04830 g007
Figure 8. Variation of FVC at different slopes for different types of soil on the Qinghai–Tibet Plateau.
Remotesensing 14 04830 g008
Figure 9. Correlation analysis between FVC and (a) temperature and (b) precipitation on the Qinghai–Tibet Plateau.
Remotesensing 14 04830 g009
Figure 10. Temperature and precipitation trends on the Qinghai–Tibet Plateau.
Remotesensing 14 04830 g010
Table 1. Variation of FVC with different elevation and aspect.
TypeAspect≤2000 m2000–3000 m3000–4000 m4000–5000 m5000–6000 m>6000 m
FVCI *Sunny slope0.9080.5940.6510.4340.227-
Semi-sunny slope0.8650.5690.6740.4700.256-
Semi-shady slope0.8190.5110.6650.4870.285-
Shady slope0.7180.4270.6310.4570.305-
FVCIISunny slope0.8350.7350.4580.2940.1340.033
Semi-sunny slope0.7630.6280.4530.3350.1560.025
Semi-shady slope0.7720.7840.4840.3710.1800.050
Shady slope0.8460.7500.3680.3690.1850.040
FVCIIISunny slope0.9360.8290.7240.741--
Semi-sunny slope0.9330.8150.7410.585--
Semi-shady slope0.9190.8280.726---
Shady slope0.9240.8380.7730.572--
* I: Seasonal frozen soil, II: Permafrost, III: Unfrozen soil.
Table 2. Variation of CV with different elevation.
Type≤2000 m2000–3000 m3000–4000 m4000–5000 m5000–6000 m>6000 m
CVI *23.40%32.55%3.05%−4.99%−29.32%-
CVII−3.33%−1.91%19.15%−21.80%−30.91%−18.42%
CVIII1.29%−1.09%−6.60%27.17%--
* I: Seasonal frozen soil, II: Permafrost, III: Unfrozen soil.
Table 3. Variation of FVC with different slope and aspect.
TypeAspect≤2°2°–6°6°–15°15°–25°>25°
FVCI *Sunny slope0.3340.4260.5180.5880.639
Semi-sunny slope0.3560.4680.5610.6230.675
Semi-shady slope0.3510.4700.5620.6390.702
Shady slope0.3200.4140.5250.6290.704
FVCIISunny slope0.2050.2510.2500.2190.212
Semi-sunny slope0.2270.2790.2820.2550.301
Semi-shady slope0.2350.3010.3290.3140.374
Shady slope0.2230.2880.3470.3580.387
FVCIIISunny slope0.9020.9360.9270.8990.868
Semi-sunny slope0.9140.9130.8970.8850.845
Semi-shady slope0.9420.9080.8940.8680.829
Shady slope0.8930.9200.8960.8880.849
* I: Seasonal frozen soil, II: Permafrost, III: Unfrozen soil.
Table 4. Variation of CV with different slope.
Type≤2°2°–6°6°–15°15°–25°>25°
CVI *4.11%2.70%−1.29%−6.62%−9.60%
CVII−8.04%−13.17%−31.49%−46.64%−52.08%
CVIII0.99%1.74%3.43%1.24%2.23%
* I: Seasonal frozen soil, II: Permafrost, III: Unfrozen soil.
Publisher’s Note: MDPI stays neutral with regard to jurisdictional claims in published maps and institutional affiliations.

