Article

A New Approach for Nitrogen Status Monitoring in Potato Plants by Combining RGB Images and SPAD Measurements

1
College of Mechanical and Electronic Engineering, Northwest A&F University, Yangling 712100, China
2
College of Optical, Mechanical and Electrical Engineering, Zhejiang A&F University, Hangzhou 311300, China
*
Author to whom correspondence should be addressed.
Remote Sens. 2022, 14(19), 4814; https://doi.org/10.3390/rs14194814
Submission received: 2 September 2022 / Revised: 19 September 2022 / Accepted: 23 September 2022 / Published: 27 September 2022
(This article belongs to the Special Issue Crop Biophysical Parameters Retrieval Using Remote Sensing Data)

Abstract

:
Precise nitrogen (N) application ensures the best N status of potato plants to improve crop growth and food quality and to achieve the best N use efficiency. Four N fertilization levels (0, 2, 4 and 6 g N pot−1) were used to establish a critical N dilution curve (CNDC) of potato plants cultivated in substrates with a greenhouse environment. RGB images of potato plants were obtained, and a red–green fit index (RGFI) was calculated based on the linear relationship between R and G channels and the principle of the excess green index (EXG). The N in the substrate can meet the nutritional requirements of potato plants during the first 35 days after emergence. In order to solve the complex sampling problem of maintaining a sufficient N strip for aboveground dry biomass (DM) and crop nitrogen concentration, a reference curve method for detecting N status was proposed. RGFI and SPAD values from the economically optimum 4 g N pot−1 treatment were used to derive the reference curve. The RGFI and SPAD values from the 4 g N pot−1 treatment had high correlations and were fitted with a second-order polynomial function with an R2 value of 0.860 and an RMSE value of 2.10. The validation results show that the N concentration dilution curve constructed by RGFI and SPAD values can effectively distinguish N-limiting from non-N-limiting treatments, CNDCs constructed based on RGFI and SPAD values could be used as an effective N status monitoring tool for greenhouse potato production.

Graphical Abstract

1. Introduction

Potato is the fourth largest food crop in the world [1], and the potato planting area of China ranks first in the world, but its yield per unit area is lower than the world average [2]. With population growth and reduction in arable land, increasing crop yield per unit area has become an important issue for Chinese agriculture [3]. N is an essential nutrient element to promote crop growth and increase crop yield [4,5]. Increased N application is the most direct and effective way to enhance potato yield [6]; however, due to a lack of understanding of N nutrition, excessive N fertilization is generally adopted by farmers to increase crop yields [7]. Insufficient and excessive N will reduce the yield [8,9] or quality of potatoes [10], and excessive N fertilizer application can lead to additional production costs [6], reduced N use efficiency [11], and harmful environmental issues [12], such as increased greenhouse gas emissions and eutrophication of water bodies [13], leading to a requirement for informed fertilization management while maintaining or reduce production costs and environmental problems. The timely and precise assessment of crop N status could help us to achieve these goals.
The common critical N dilution curve (CNDC) constructed in view of the allometric relationship between biomass and N concentration is a potential tool for diagnosing plant N status [14]. In detail, crops are divided into N-limiting and non-N-limiting groups according to biomass and N concentration, and CNDC is constructed by a data fitting method [8]. When the actual measured value of N concentration is lower than CNDC, it means the crop is under N fertilizer stress, and N fertilizer is required [15]. The accuracy of CNDCs is limited by the differences in histological, morphological, and ecophysiological characteristics among species; hence, relevant studies have been conducted for potato [16], cotton [17], maize [18], rice [19], and winter wheat [20]. The Kjeldahl method is currently a common method used to measure N concentrations, but the procedure is tedious and time-consuming [21]. Additionally, an allometric relationship between dry matter and the leaf area index exists under non-N restriction conditions, and the CNDCs are established based on this relationship. However, this measurement made through field surveys also requires manual sampling and laboratory procedures, and the time required to obtain information is not practical. Thus, it is necessary to develop methods to diagnose N status with procedures that require less time and less damage to crops.
N is the most basic element of chlorophyll and protein, and when the supply of N fertilizer is sufficient, it can ensure the formation and accumulation of chloroplasts and increase the concentration of chlorophyll [22]. N is an important part of chlorophyll, and the chlorophyll content directly reflects the state of N concentration to a certain extent [23,24]. The quotient of the chlorophyll in a plot divided by the chlorophyll in a reference plot with sufficient N application is defined as the N sufficiency index (NSI), and NSI can be used to guide N management. However, NSI depends on the reference graph used, resulting in poor practicality [25,26]. SPAD 502 is an effective tool for measuring plant chlorophyll, and 502 readings are highly linearly correlated with chlorophyll values measured by chemical assays [27,28]. Numerous studies show that the results of chemical experiments used to measure chlorophyll content are almost the same as those measured by SPAD 502, indicating that SPAD can replace chlorophyll content [29]. Furthermore, a SPAD hand-held chlorophyll meter was confirmed to be a promising tool for assessing the N status of potato plants [30]. To construct a CNDC based on plant SPAD values, it is important to find suitable parameters for establishing the best-fit curve of SPAD values. Vegetation index (VI) is an effective method for estimating chlorophyll and N concentrations in crops [31]. The red edge-based VI (VIre) and near-infra-red based VI (VInir) are commonly used to estimate crop SPAD values [32]. However, sensors with the above two bands are often more expensive and complex in data processing. RGB cameras provide less band information, but they are affordable and have strong applicability [33]. RGB image information has been proven to be used for SPAD value prediction of potato plant leaves [27,34]. However, the law of the plant wave band ratio has not been comprehensively considered in common RGB image features, resulting in low accuracy of plant SPAD value fitting. There are few reports on the diagnosis of N concentration in potato plants cultivated by substrates in a greenhouse based on SPAD value and RGB image information.
The objectives of the present research program were to (1) explore the response of potato plants cultivated in substrates to N fertilizer in terms of SPAD value and tuber yield with a greenhouse environment and (2) establish a CNDC using characteristic parameters constructed based on the relationship between RGB band information and the SPAD value fitting model.

2. Materials and Methods

2.1. Site and Crop Management

A potato pot experiment was carried out in the greenhouse of the College of Horticulture, Northwest A&F University, Yangling, Shaanxi Province. The height and diameter of the flower pots were 33 cm and 27 cm, respectively. Two potato cultivars, Helan 15 and Longshu No. 7, were evaluated, which were grown from virus-free seed potatoes. The seedling substrate produced by Xinluyuan Seedling Substrate Co. Ltd. (Weifang, China) was used to grow potatoes, and the organic matter content of the substrate was more than 35%. To ensure the normal growth of potatoes, potatoes were planted in the middle of the flower pots with a planting depth of 10 cm, and the temperature in the greenhouse before and during the emergence of potato plants was set to 20 °C. After the potato seedling period, the greenhouse temperature was the same as that of the outside environment.

2.2. Experimental Design
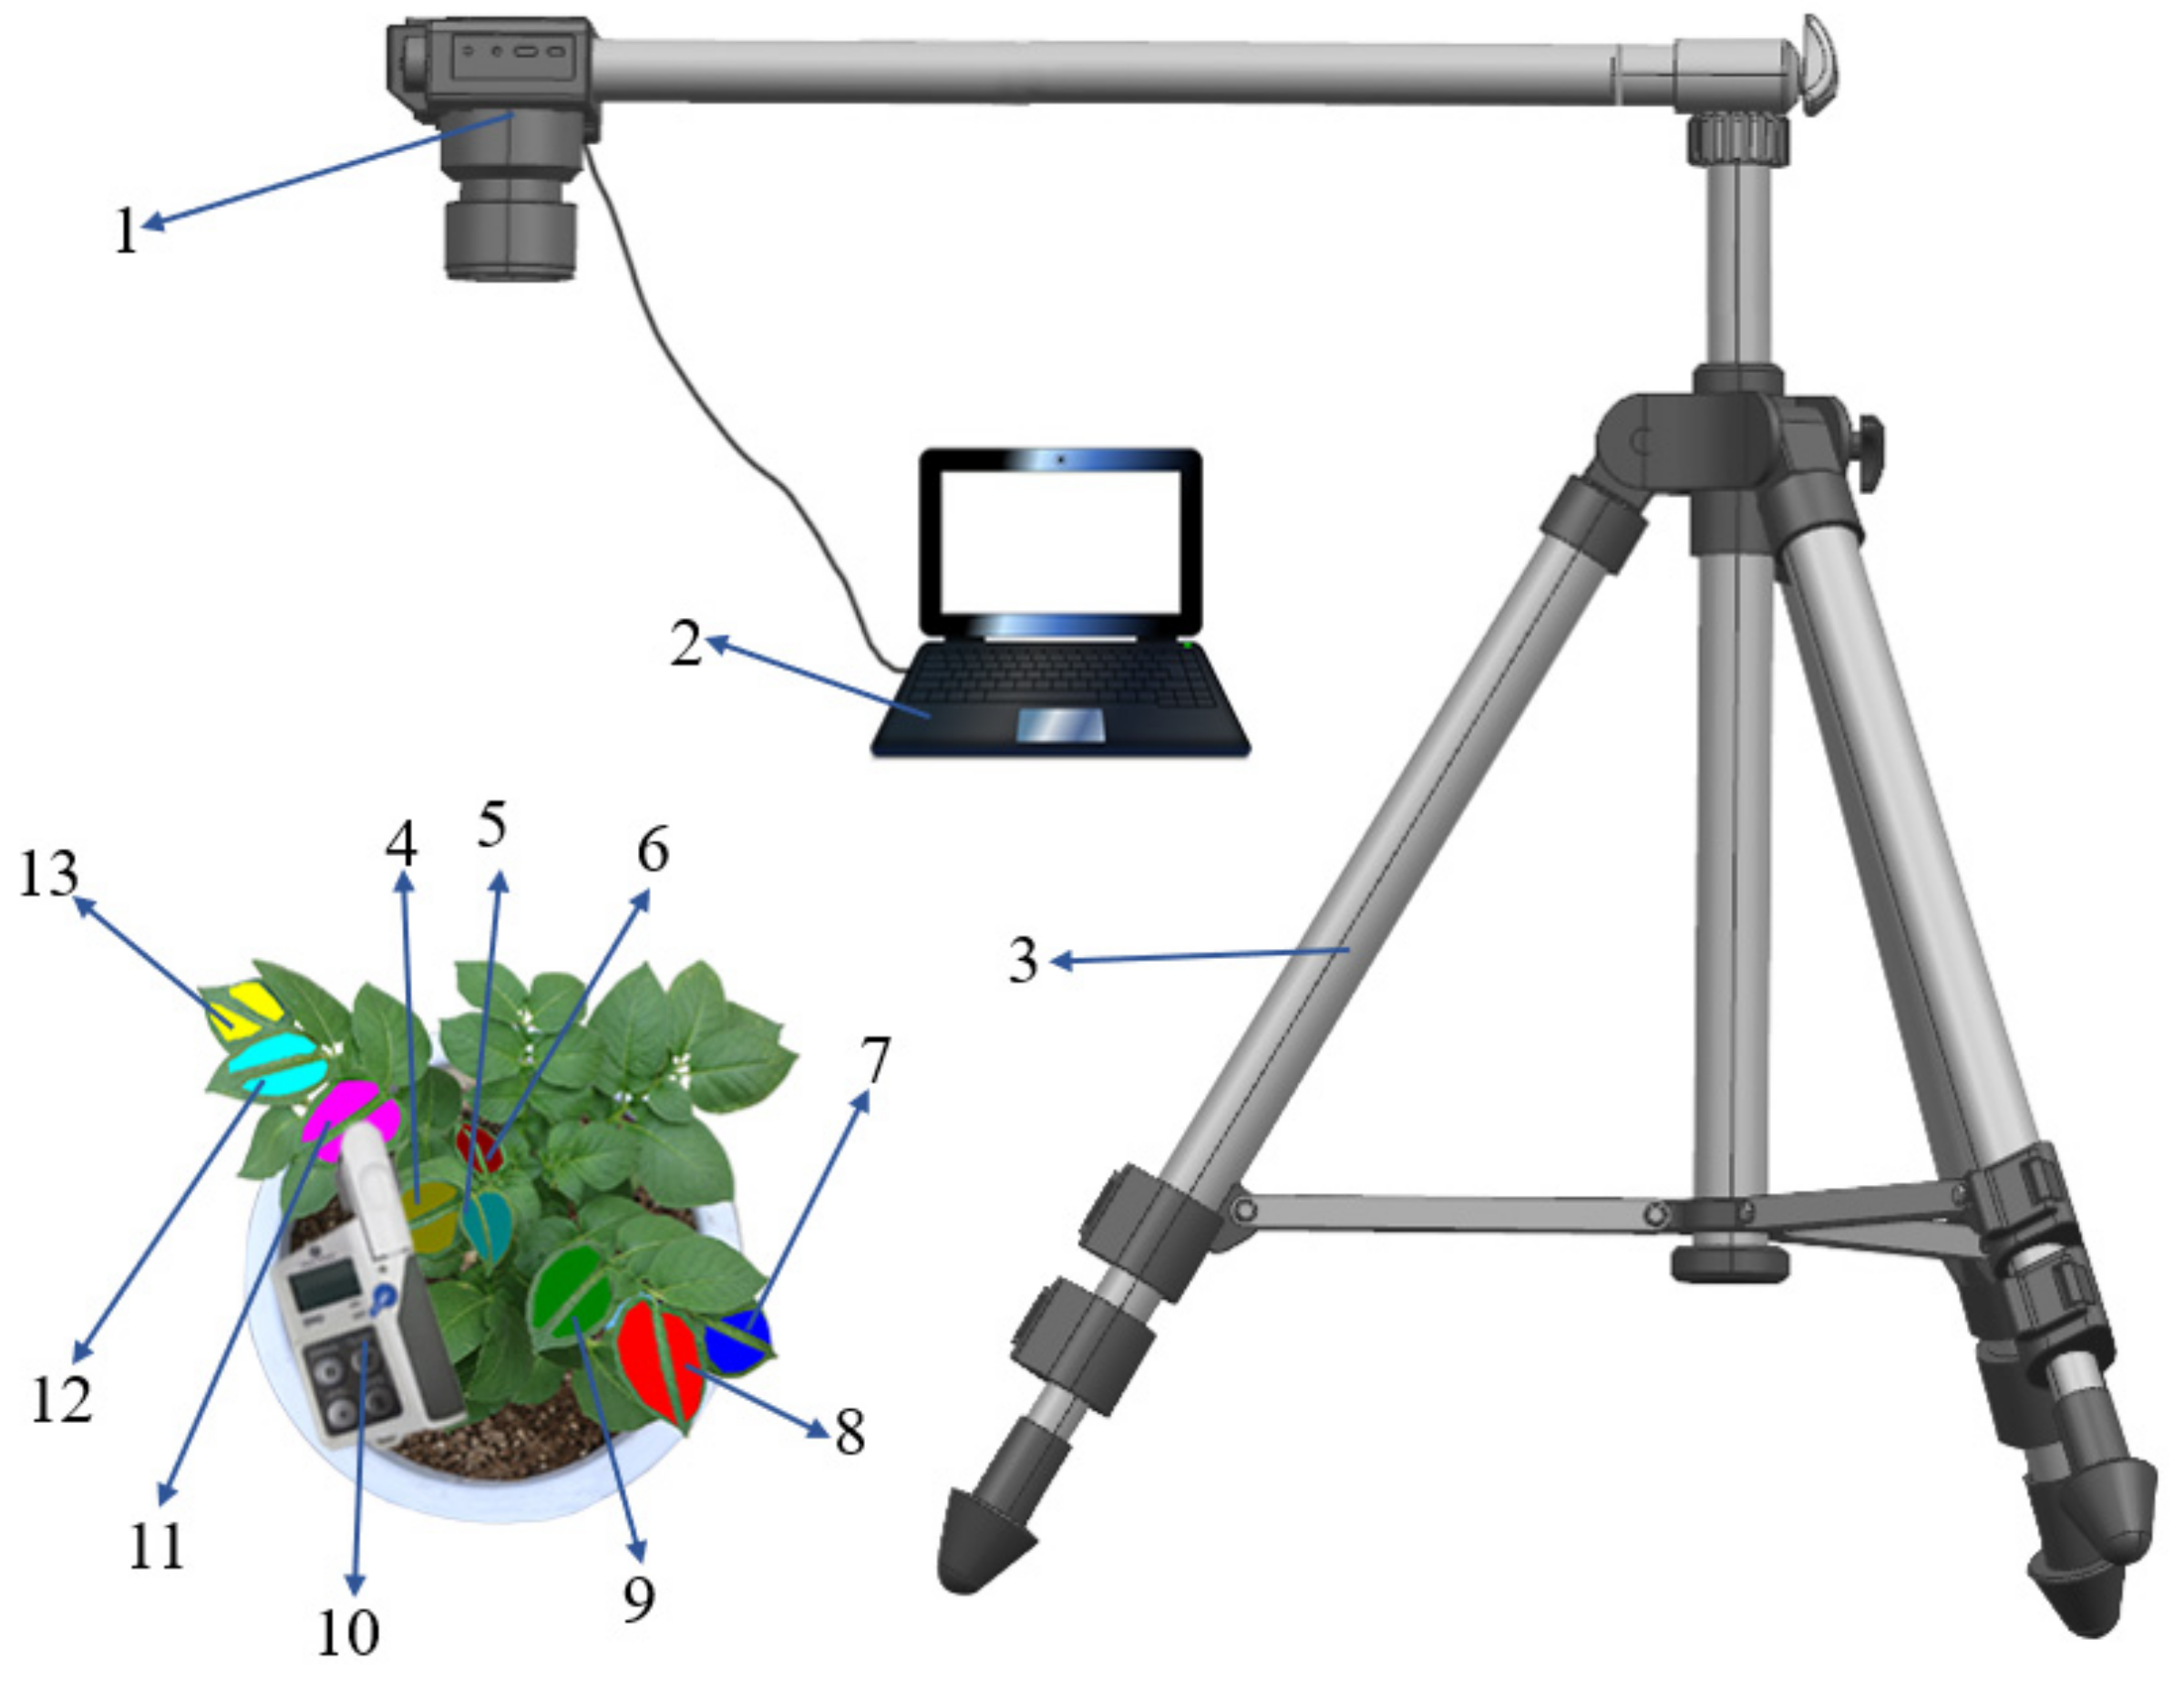
To prevent interactions between the leaves of the potato plants, maternal tubers were planted in rows 0.4 m apart and with a 0.4 m distance within rows on 17 December 2020. The N fertilizer rate as urea regimes was used as the control variable, the other management was the same. Before the potato emerged, it mainly absorbed the nutrients of its own tubers and required less fertilizer. Moreover, the organic matter content of the potato planting substrate exceeded 35%, which can meet the nutritional needs of potato seedlings. Therefore, fertilizer was applied during the potato tuber formation period (20 days after potato emergence). Potatoes were planted in 320 pots, which were evenly divided among 4 N fertilizer treatments. According to the fertilization habits of local farmers, potassium (K) and phosphate (P) were applied as P2O5 and K2O at 4 g pot−1 and 5 g pot−1, respectively. The N fertilizer gradient included treatments of 0 g pot−1, 2 g pot−1, 4 g pot−1, and 6 g pot−1.

2.3. Measurements

The hand-held soil plant analysis development (SPAD) chlorophyll meter has proven to be a promising tool in evaluating the N status of potatoes and guiding fertilization recommendations [35,36]. On the 35th and 50th days after potato emergence, a SPAD meter (SPAD-502Plus, Konica Minolta, Osaka, Japan) was used to measure the chlorophyll content of the upper, middle, and lower leaves of the potato plant (Figure 1); nine leaves were measured for each potato plant, and a total of 540 leaves were measured for each level. Each leaf was measured 5 times, and the average value was taken as the SPAD value of the corresponding leaf. Measurements were made in sunny conditions and following the instruction manual for measuring the crop (Konica Minolta, Inc.). The means of plant height were 34 cm and 51 cm on the 35th and 50th days after potato emergence, respectively.
To make the image correspond to the position of the leaves, corresponding markers were hung on the top, middle, and bottom of the potato plant. A digital single-lens reflex camera (EOS 760D, Canon (Tokyo, Japan) Co., Ltd.) mounted on a tripod was used to take photos at a distance of 60 cm from the potato canopy, with a 35 mm focal length and a resolution of 1984 × 2976 pixels. A laptop was used to control the camera and to view image quality. To reduce the impact of light intensity on the RGB image quality of potato plants, the camera was set to manual exposure. The image data acquisition process of the potatoes is shown in Figure 1.
The potato plants in each treatment were harvested, and all tubers were weighed. The tuber yield was calculated based on the fresh weight of each pot.

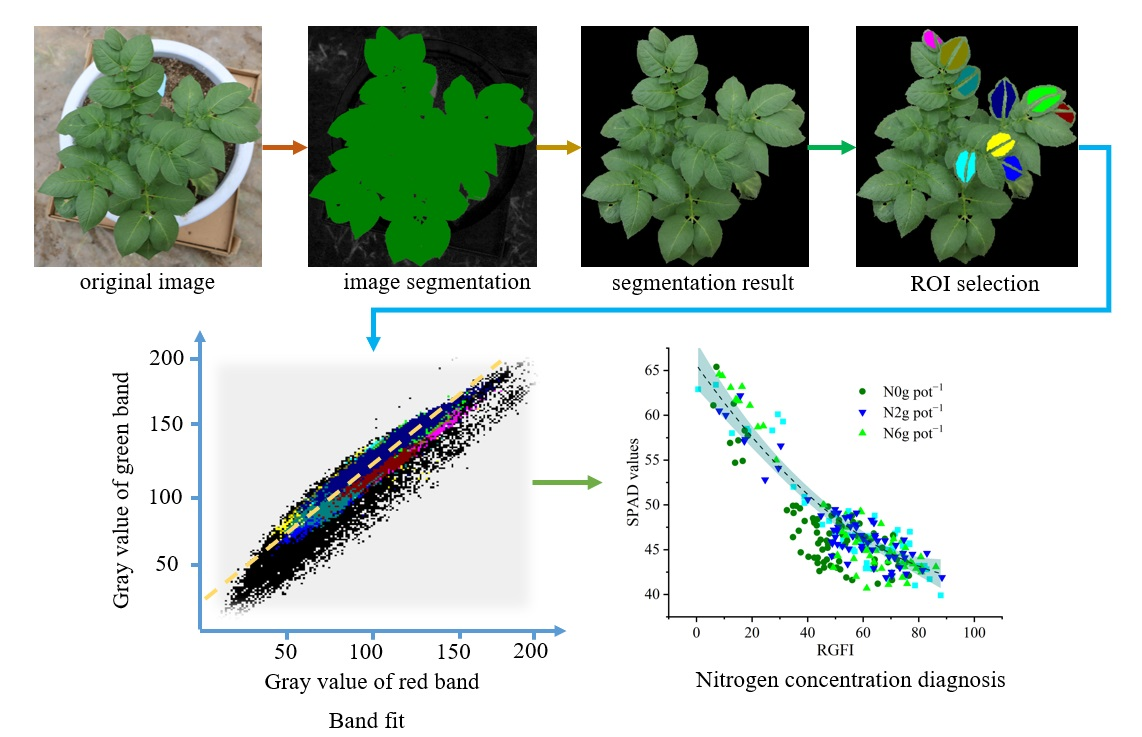
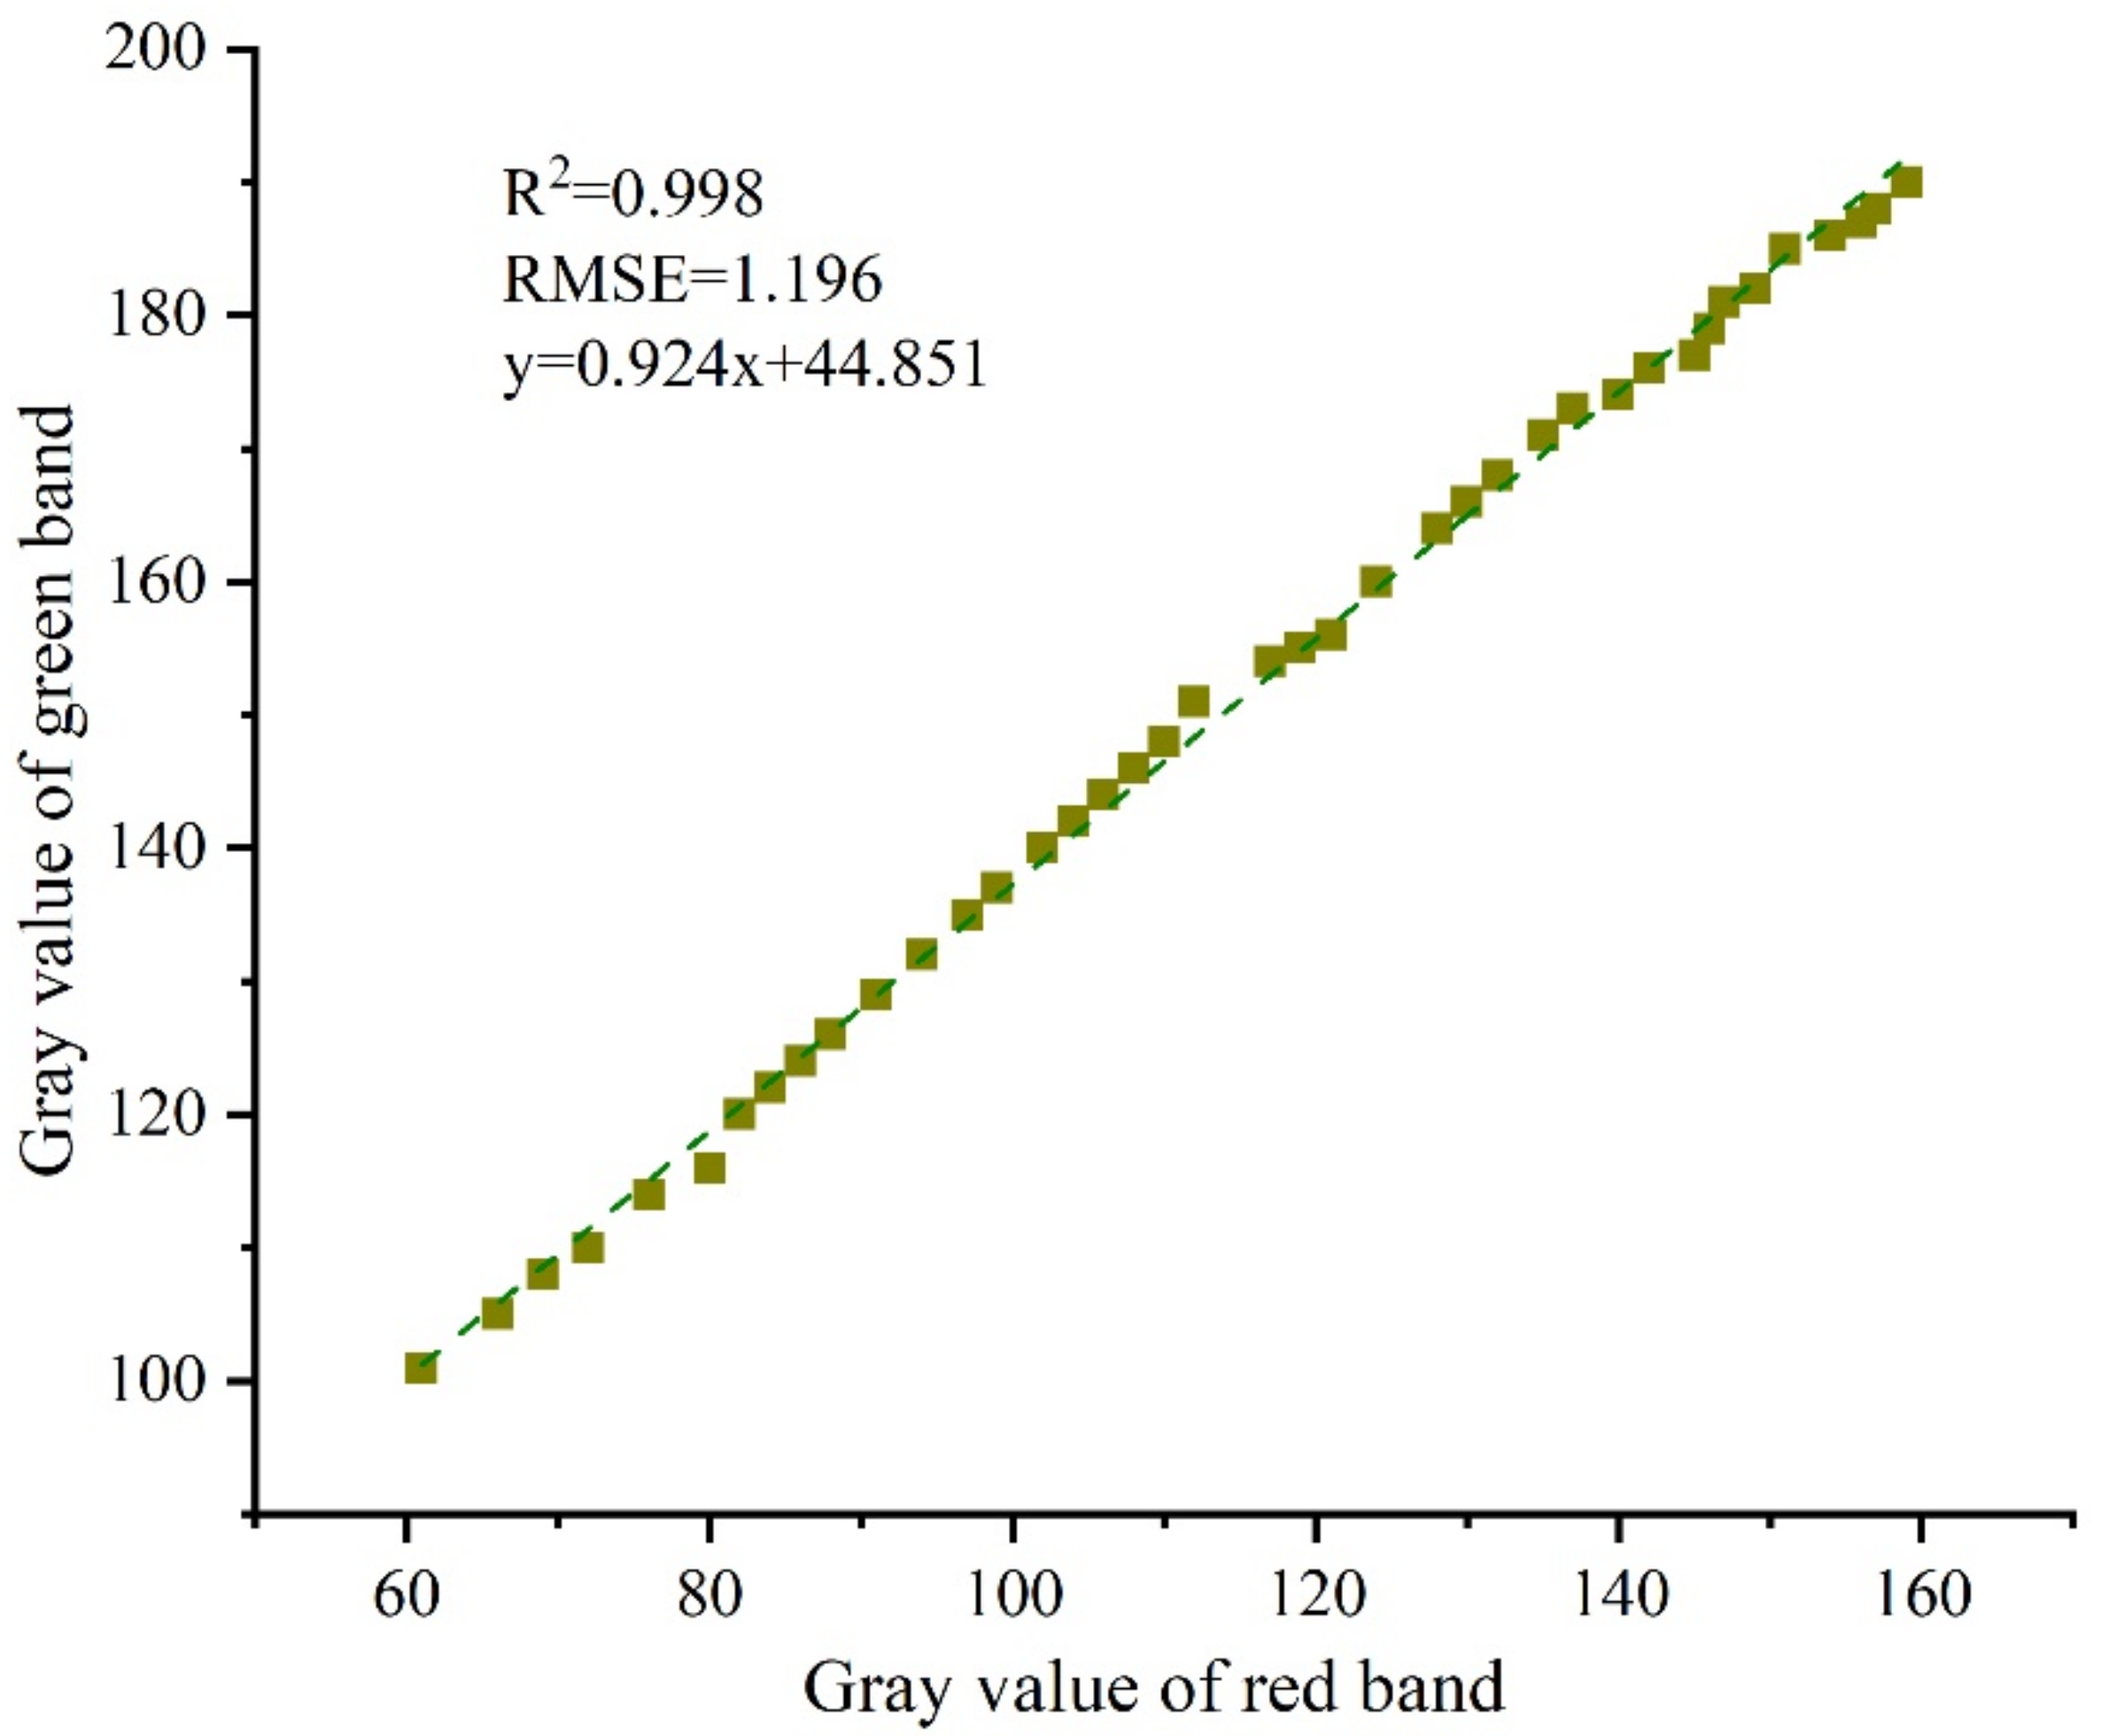
2.4. RGB Image Processing

2.4.1. The Extraction of Potato Plant Characteristics

Many previous studies have used different vegetation indices (VIs) and texture features derived from RGB images to estimate the SPAD values of crops. In this study, four VIs were calculated from RGB images with potato plant leaves, including the normalized green–red difference index (NGBDI) [37], excess green index (EXG) [38], green–red vegetation index (GRVI) [39], and green leaf index (GLI) [40]. The texture features of RGB images, including the commonly used mean, variance, homogeneity, contrast, dissimilarity, entropy, angular second moment, and correlation, were extracted by a gray-level co-occurrence matrix [41]. Their calculation formulas are as follows (Table 1):

2.4.2. Feature Construction

The common visible light band vegetation indices are constructed based on different reflection intensities of green leaves to red, green and blue channels. However, the relationships between the red band ( R R ), green band ( R G ), and blue band ( R B ) are not comprehensively considered for the construction of common visible light band vegetation indices. R B is positively correlated with chlorophyll, whereas R R and R G are negatively correlated, according to the findings of [42,43]. The red–green vegetation index (TRVI) was constructed based on the fitting results of R R and R G and found to better predict the fractional vegetation cover (FVC) of winter wheat in our previous research [44]. However, the TRVI does not consider blue band information, and the application process has low robustness. Therefore, introducing the blue band and combining the construction principle of TRVI can effectively improve the robustness of the parameters.
Figure 2 illustrates that potato plant leaves showed an obvious linear relationship between R R and R G , with an R2 value of 0.998 and an RMSE value of 1.196. Taking into account the abovementioned relationship and drawing on the construction principle of EXG, a red–green fit index (RGFI) based on the linear relationship of R R and R G is constructed, and its formula is as follows:
R G F I = 2 R G 0.924 R R 44.851 R B

2.4.3. Feature Selection

Random forest (RF) is an algorithm for measuring the importance of features by randomly replacing each feature [45,46]. When the importance of the feature is higher, the value of the prediction error rate of the RF model will be larger and then the change value of the error rate for the out-of-bag data before and after the feature replacement is applied to evaluate each feature to obtain the importance score of the features. Python 3.6 libraries (Scikit-Learn package) were used to implement this algorithm, and repeated tenfold cross-validation was selected to optimizing RF model accuracy [46]. The subset with less influence on the random forest model served as the subset of predictors.
The Pearson correlation coefficient is used to detect the degree of linear correlation between continuous variables, and the value range is [−1, 1]. Positive and negative values indicate positive and negative correlations, respectively. The larger the absolute value, the higher the degree of linear correlation. RF and Pearson correlation coefficients were used to evaluate the importance of the vegetation index and texture features, and then the features selected by the two algorithms were used to construct an SPAD value model of potato plants.

2.5. Establishment of CNDC for Potato Plants

According to the method of potato CNDC establishment proposed by [47], the steps of potato CNDC establishment in this paper mainly included determining whether there was a significant difference in the relative yield and SPAD values for each sample through analysis of variance and dividing the potato plants into two groups (N-limiting treatments and non-N-limiting treatments). The relationship between yield and SPAD values was analyzed to find the SPAD value interval corresponding to the highest relative yield. Then, features were selected by the above feature screening algorithm to fit SPAD values, and a CNDC was established.
Common model evaluation metrics root mean square error (RMSE) and coefficient of determination (R2) are used to evaluate the fit of the relationship between image features and SPAD values. R2 and RMSE were calculated as follows:
R 2 = 1 i = 1 n x i y i 2 i = 1 n x i x ¯ 2
R M S E = i = 1 n x i y i 2 n
where x i and y i are the measured and predicted SPAD values of potato plants, x ¯ is the mean of the measured SPAD values, and n is the total number of samples.

2.6. Statistical Analysis

Statistical analyses were carried out on the data acquired from potato pot experiments to establish a CNDC for potato plants. With each fertilization control, 60 pots of potato plants were selected for further analysis. Data preprocessing was executed using Microsoft Excel 2019 (Microsoft Corporation, Redmond, WA, USA) to analyze the relationship between the bands and to construct the RGFI. Potato tuber yield and SPAD values were subjected to ANOVA using GLM procedures in IBM SPSS Version 26.0 (IBM Corporation, Armonk, NY, USA). The data in this study are expressed as the mean ± standard deviation. p < 0.05 was considered to be statistically significant. The CNDC for potato plants was established by Origin 2018 (OriginLab Corporation, Northampton, MA, USA).

3. Results

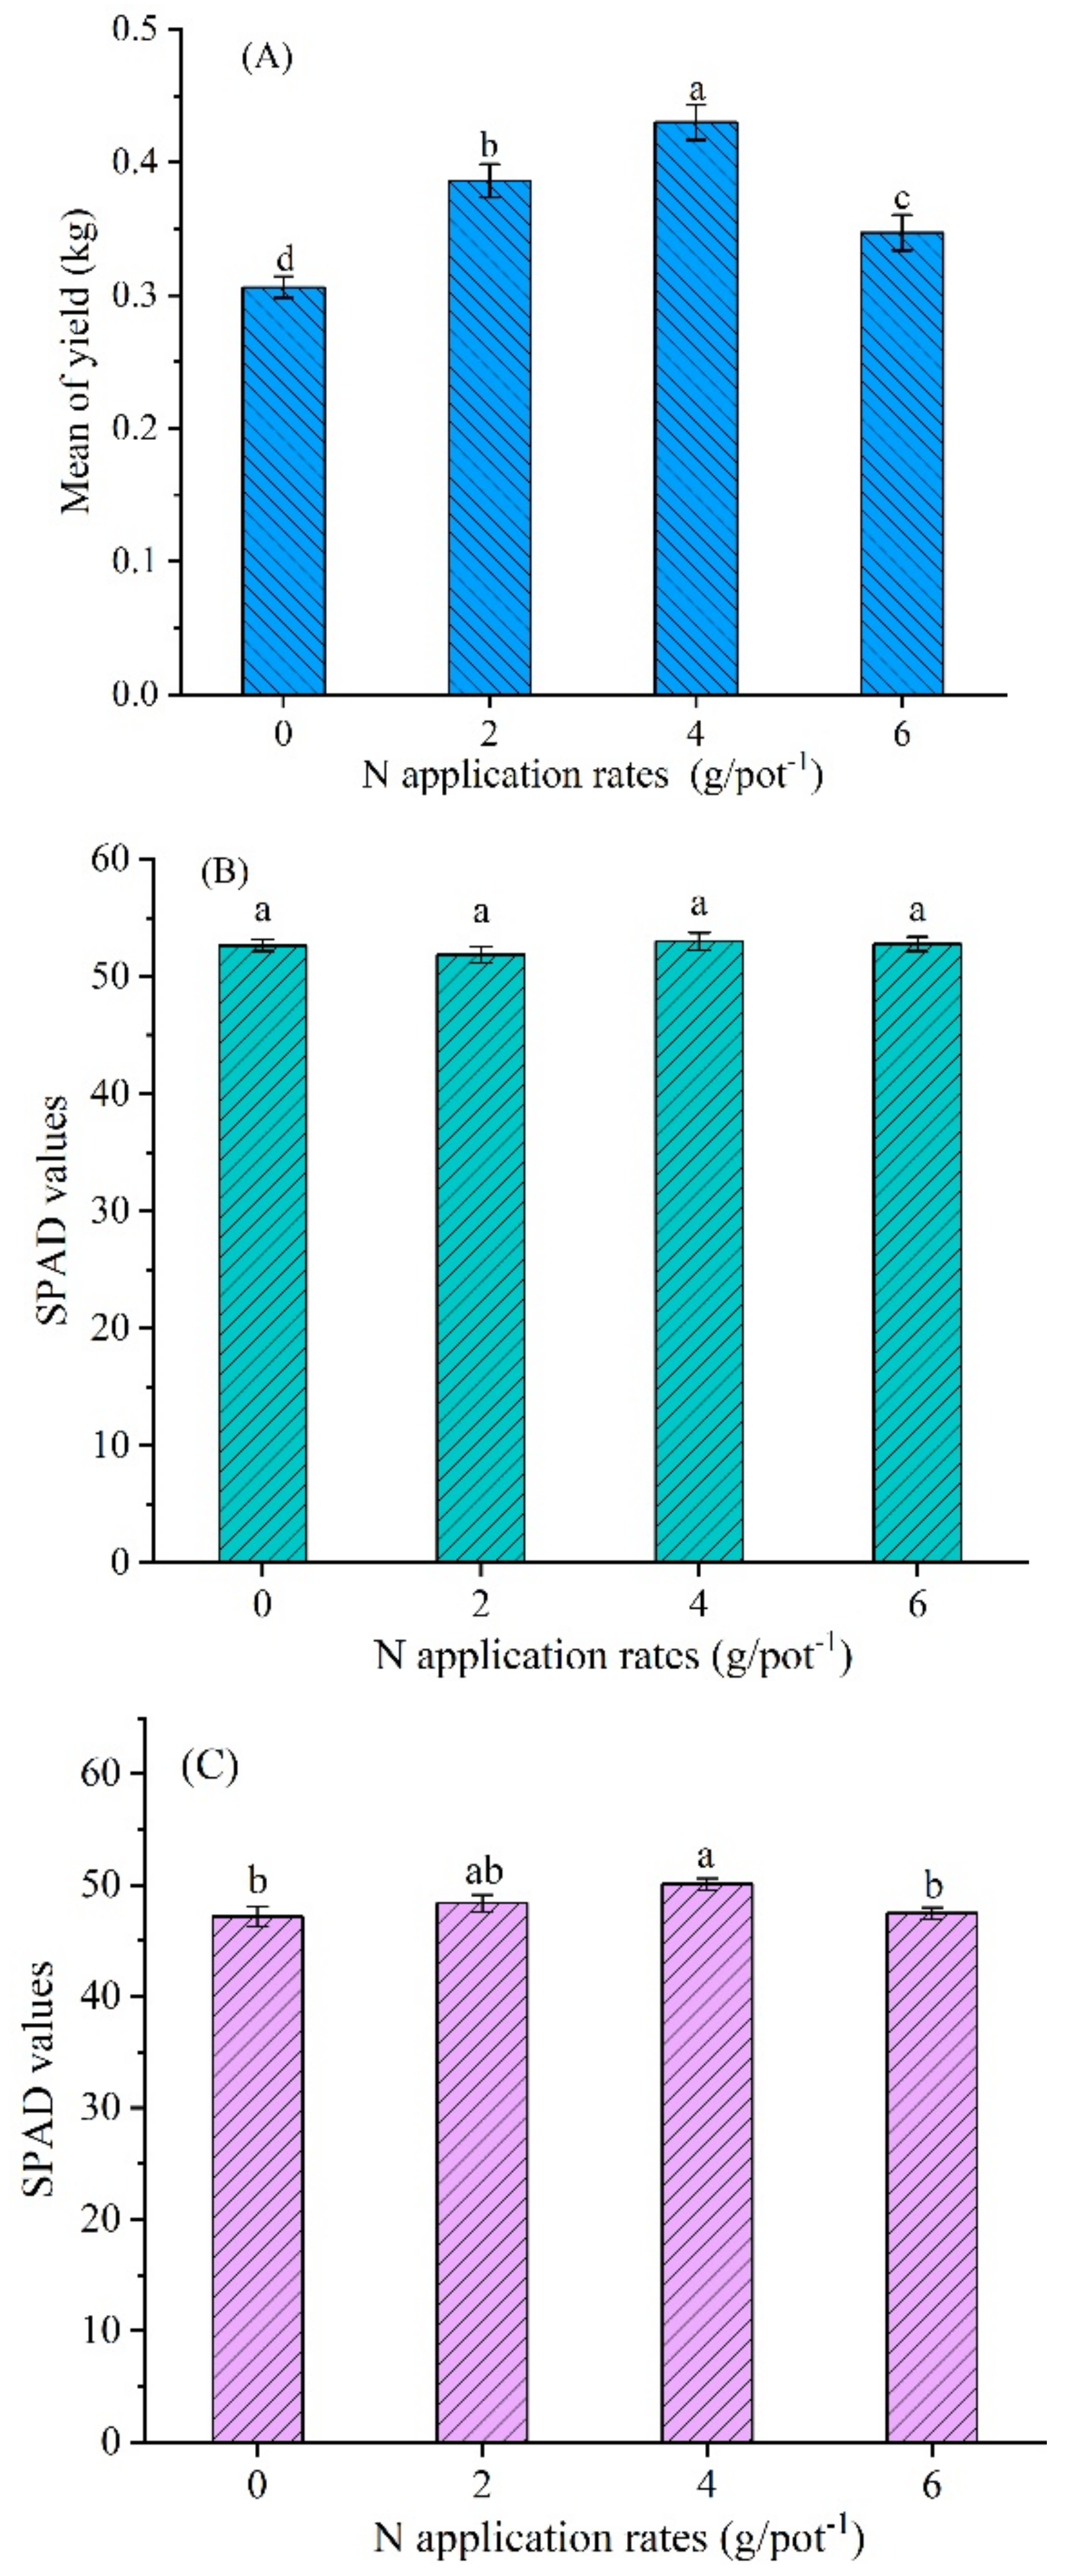
3.1. Tuber Yield and SPAD Value Response to N Rate

With the increase in N fertilizer application, the yield of potato tubers slightly increased at first and then rapidly decreased (Figure 3A). The highest yield of 0.45 kg pot−1 was obtained with 4 g N pot−1. The yield of potato was significantly different in the four N rate controls (p < 0.05) in which 2 g N pot−1 was higher than 6 g N pot−1, and the turning point of potato production appeared at 4 g N pot−1. N applications greater than 4 g N pot−1 resulted in a reduced number of stems in this study. This may be due to the negative impact of excessive N, as reported by [30] the balanced nutrition maximized the number of stems per plant. In addition, the high N application rate resulted in a reduction in plant stem length. N fertilizers promoted plant growth within certain limits, whereas excessive showed negative impact. Other researchers found similar trends existed in the influence of N on vegetative traits [48,49].
There was no significant difference in the SPAD values of potato leaves under different N application rates 35 days after the emergence of potatoes (Figure 3B). The main reason for this phenomenon was that the N concentration in the substrate can maintain the normal growth of potato plants. The SPAD values of potato plant leaves showed a trend of first increasing and then decreasing, and the turning point appeared at 4 g N pot−1 50 days after emergence. There was a significant difference in the SPAD values of potato plants in the 4 g N pot−1 treatment and those in the 0 g N pot−1 and the 2 g N pot−1 treatments (p < 0.05) and no significant difference in the SPAD values of potato plants under other N fertilizer treatments 50 days after emergence (Figure 3C).
According to the change trend of potato tuber yield and potato plant SPAD values, the yield of potato tubers increased with the growth of potato plant SPAD values, and tuber yield was well synchronized with potato plant SPAD values for the increasing N rate. The best N fertilizer application rate was 4 g N pot−1. Compared with the SPAD values of potato plants on the 35th day after emergence, SPAD values in potato plants decreased on the 50th day after potato emergence. The main reason for this phenomenon is that the potato plant leaves begin to senesce, and the nitrogen begins to decompose or transfer with continuous growth of the potato plant, resulting in the decreases of SPAD values for potato plants on 50th day after emergence, as the similar finding in previous studies [50,51].

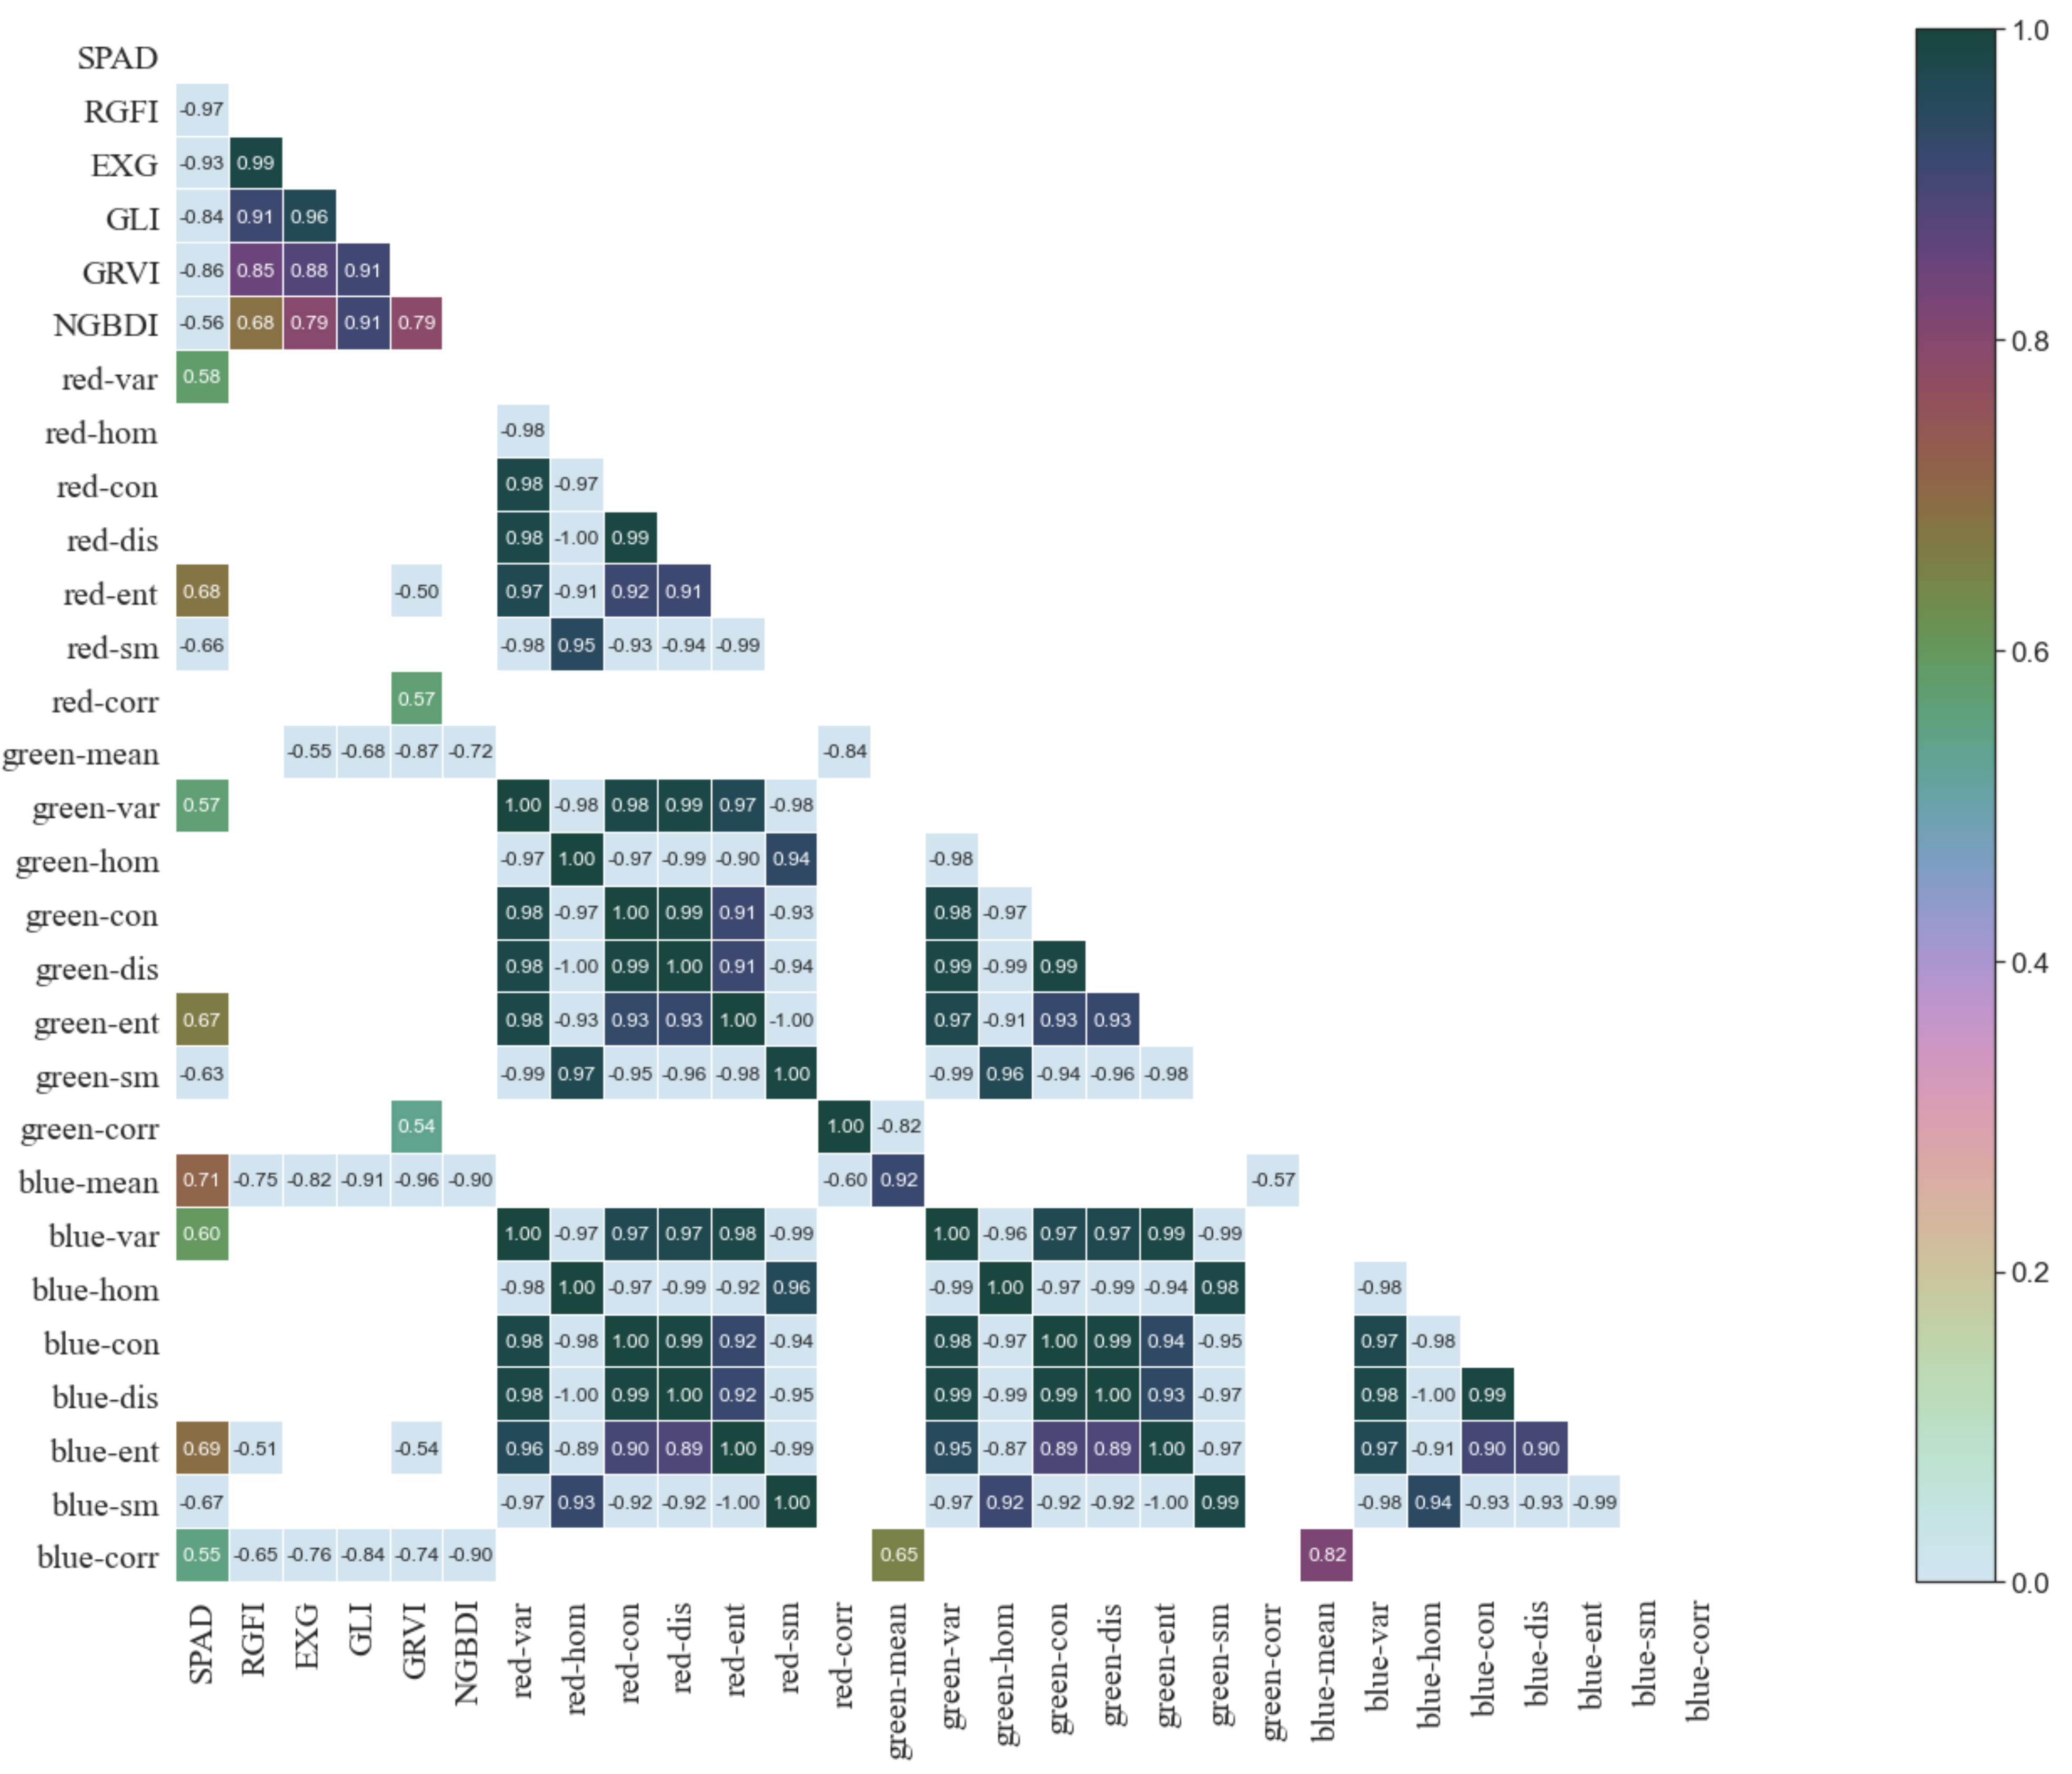
3.2. The Results of Feature Selection

Because there were too many variables, for the convenience of readers, the first five variables selected by random forest are displayed (Table 2), and those with an absolute Pearson correlation coefficient value greater than 0.5 are illustrated (Figure 4). The screening results of the RF algorithm showed that the RGFI constructed in the study had the highest contribution rate, followed by the EXG, GLI, and GRVI, while the NGBDI and texture feature contribution rates were low. When considering the Pearson correlation coefficient method, RGFI has the highest correlation with SPAD values, and RGFI had a negative correlation with potato plant SPAD values. With the increase of chlorophyll content, the reflection of the green band for potato plant leaves reduces, resulting in a decrease with RGFI; thus, RGFI is negatively correlated with SPAD value. The potato plants in each treatment were harvested, and all tubers were weighed. The tuber yield was calculated based on the fresh weight of each pot.
The RGFI comprehensively considers the weight ratio of the R G and R R of the potato plant; thus, it has a good effect on predicting the SPAD values of the potato plant. Combining the screening results of the above two methods, the RGFI was selected as the most important feature to construct an SPAD value fitting model.

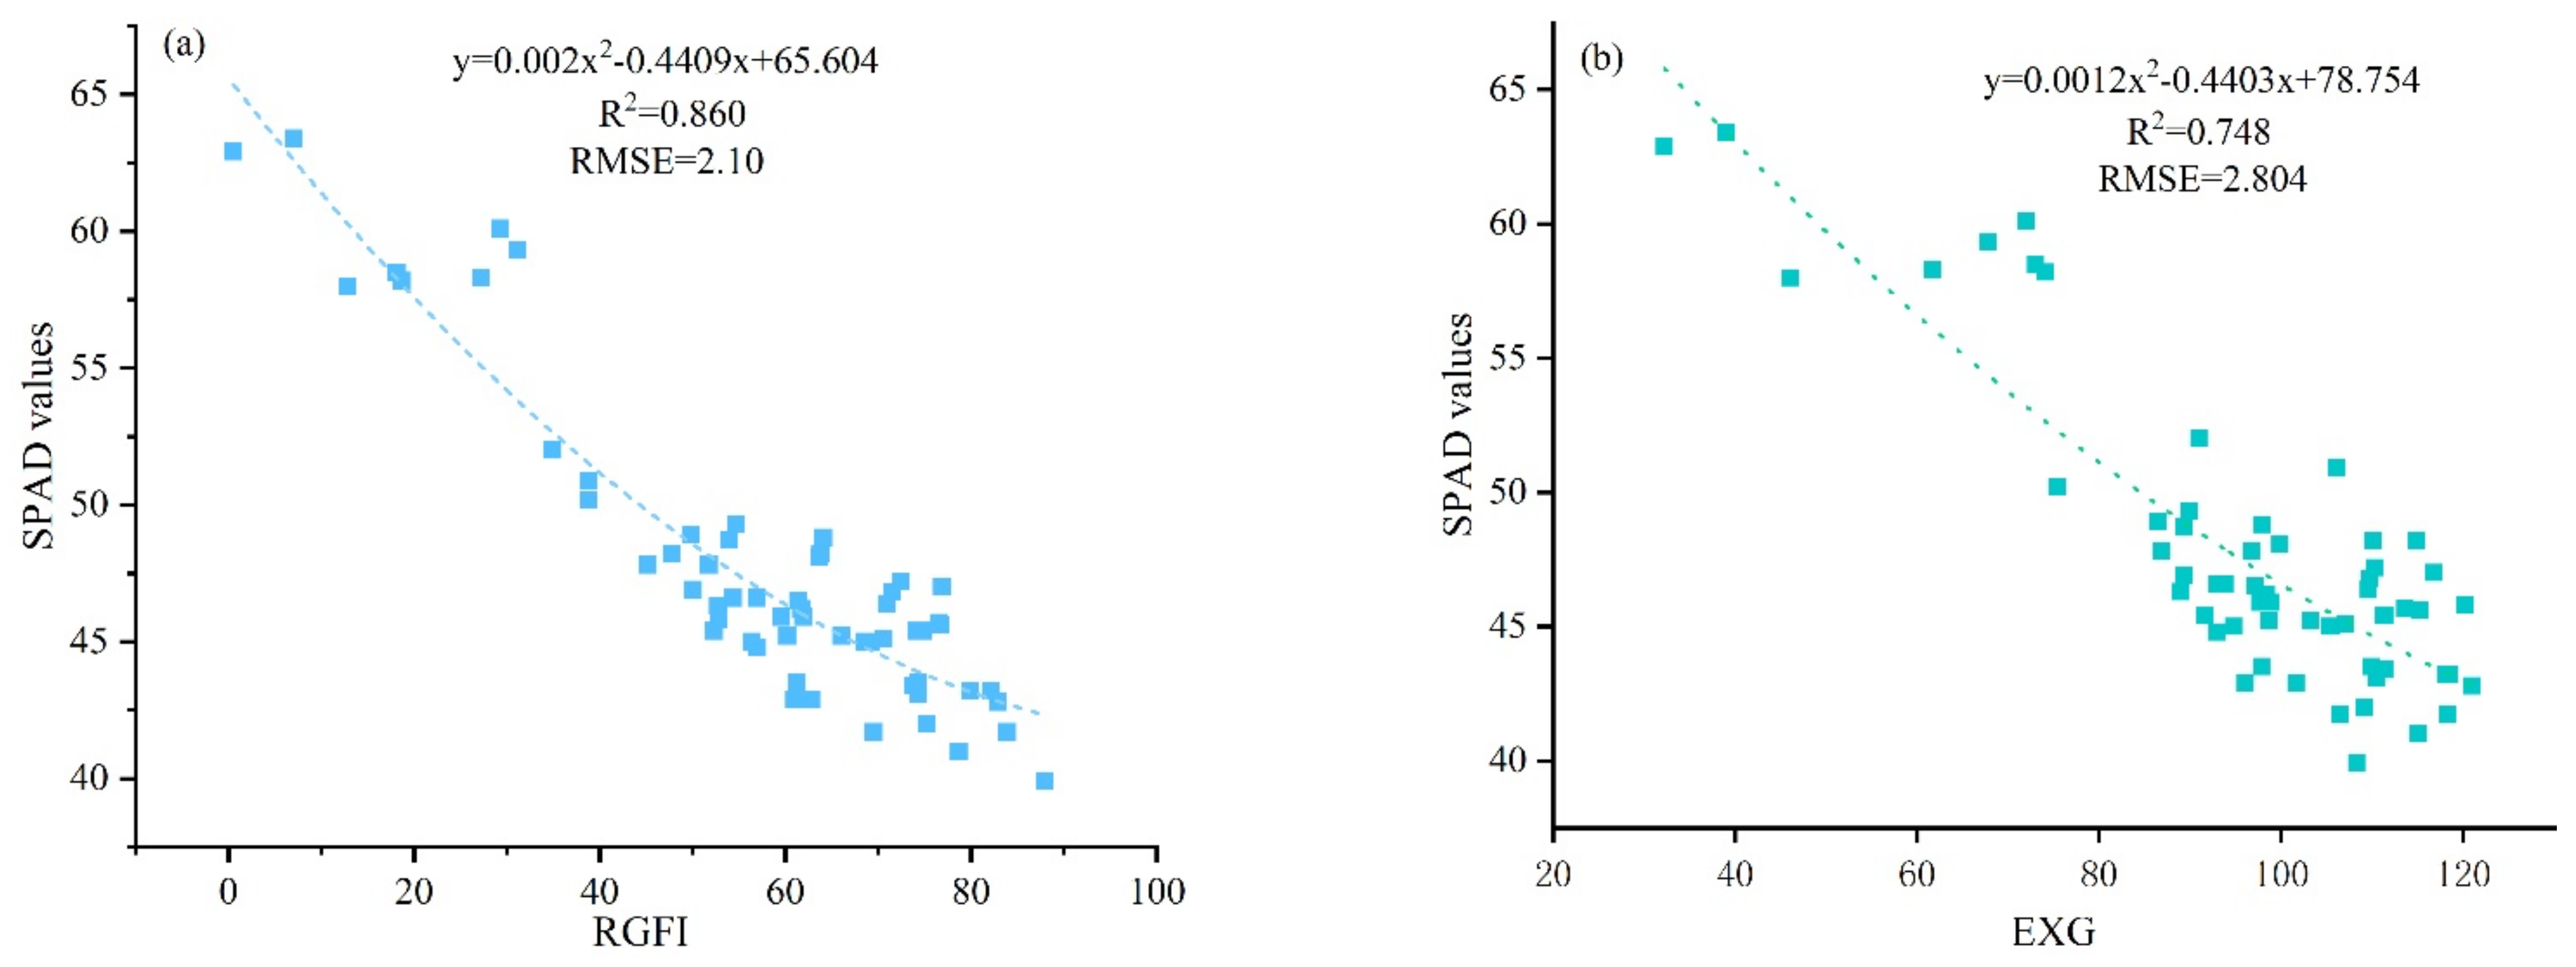
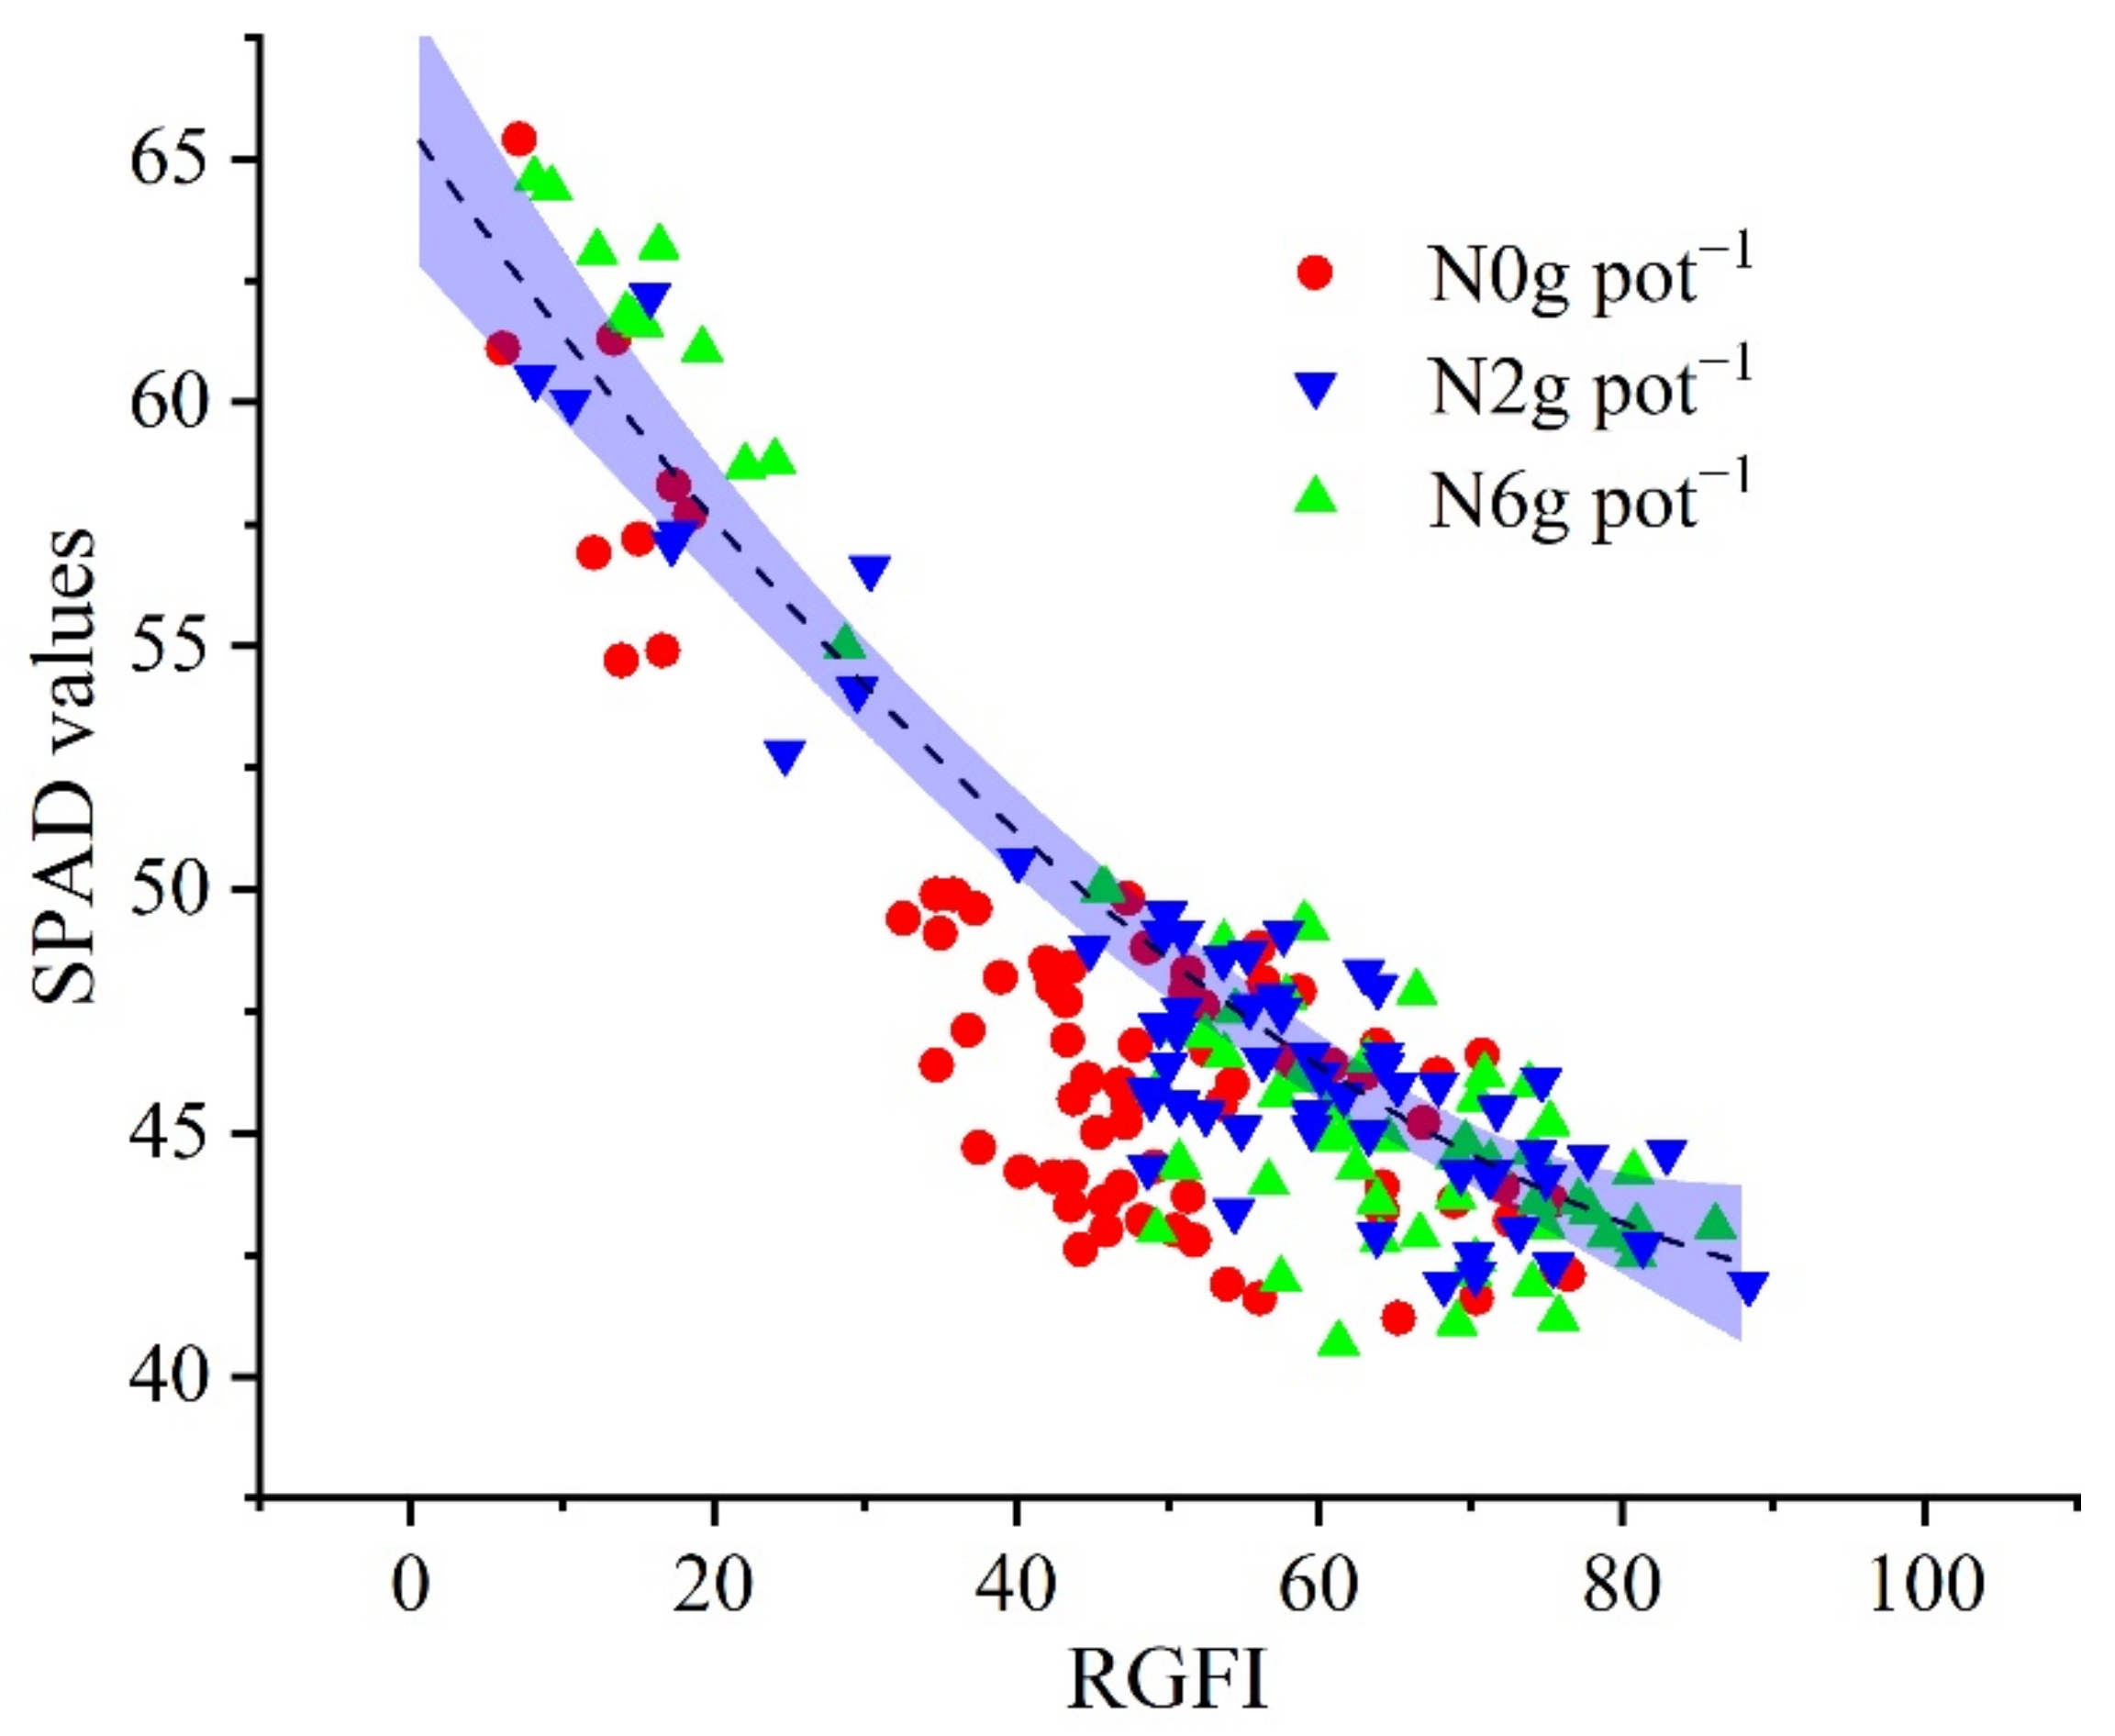
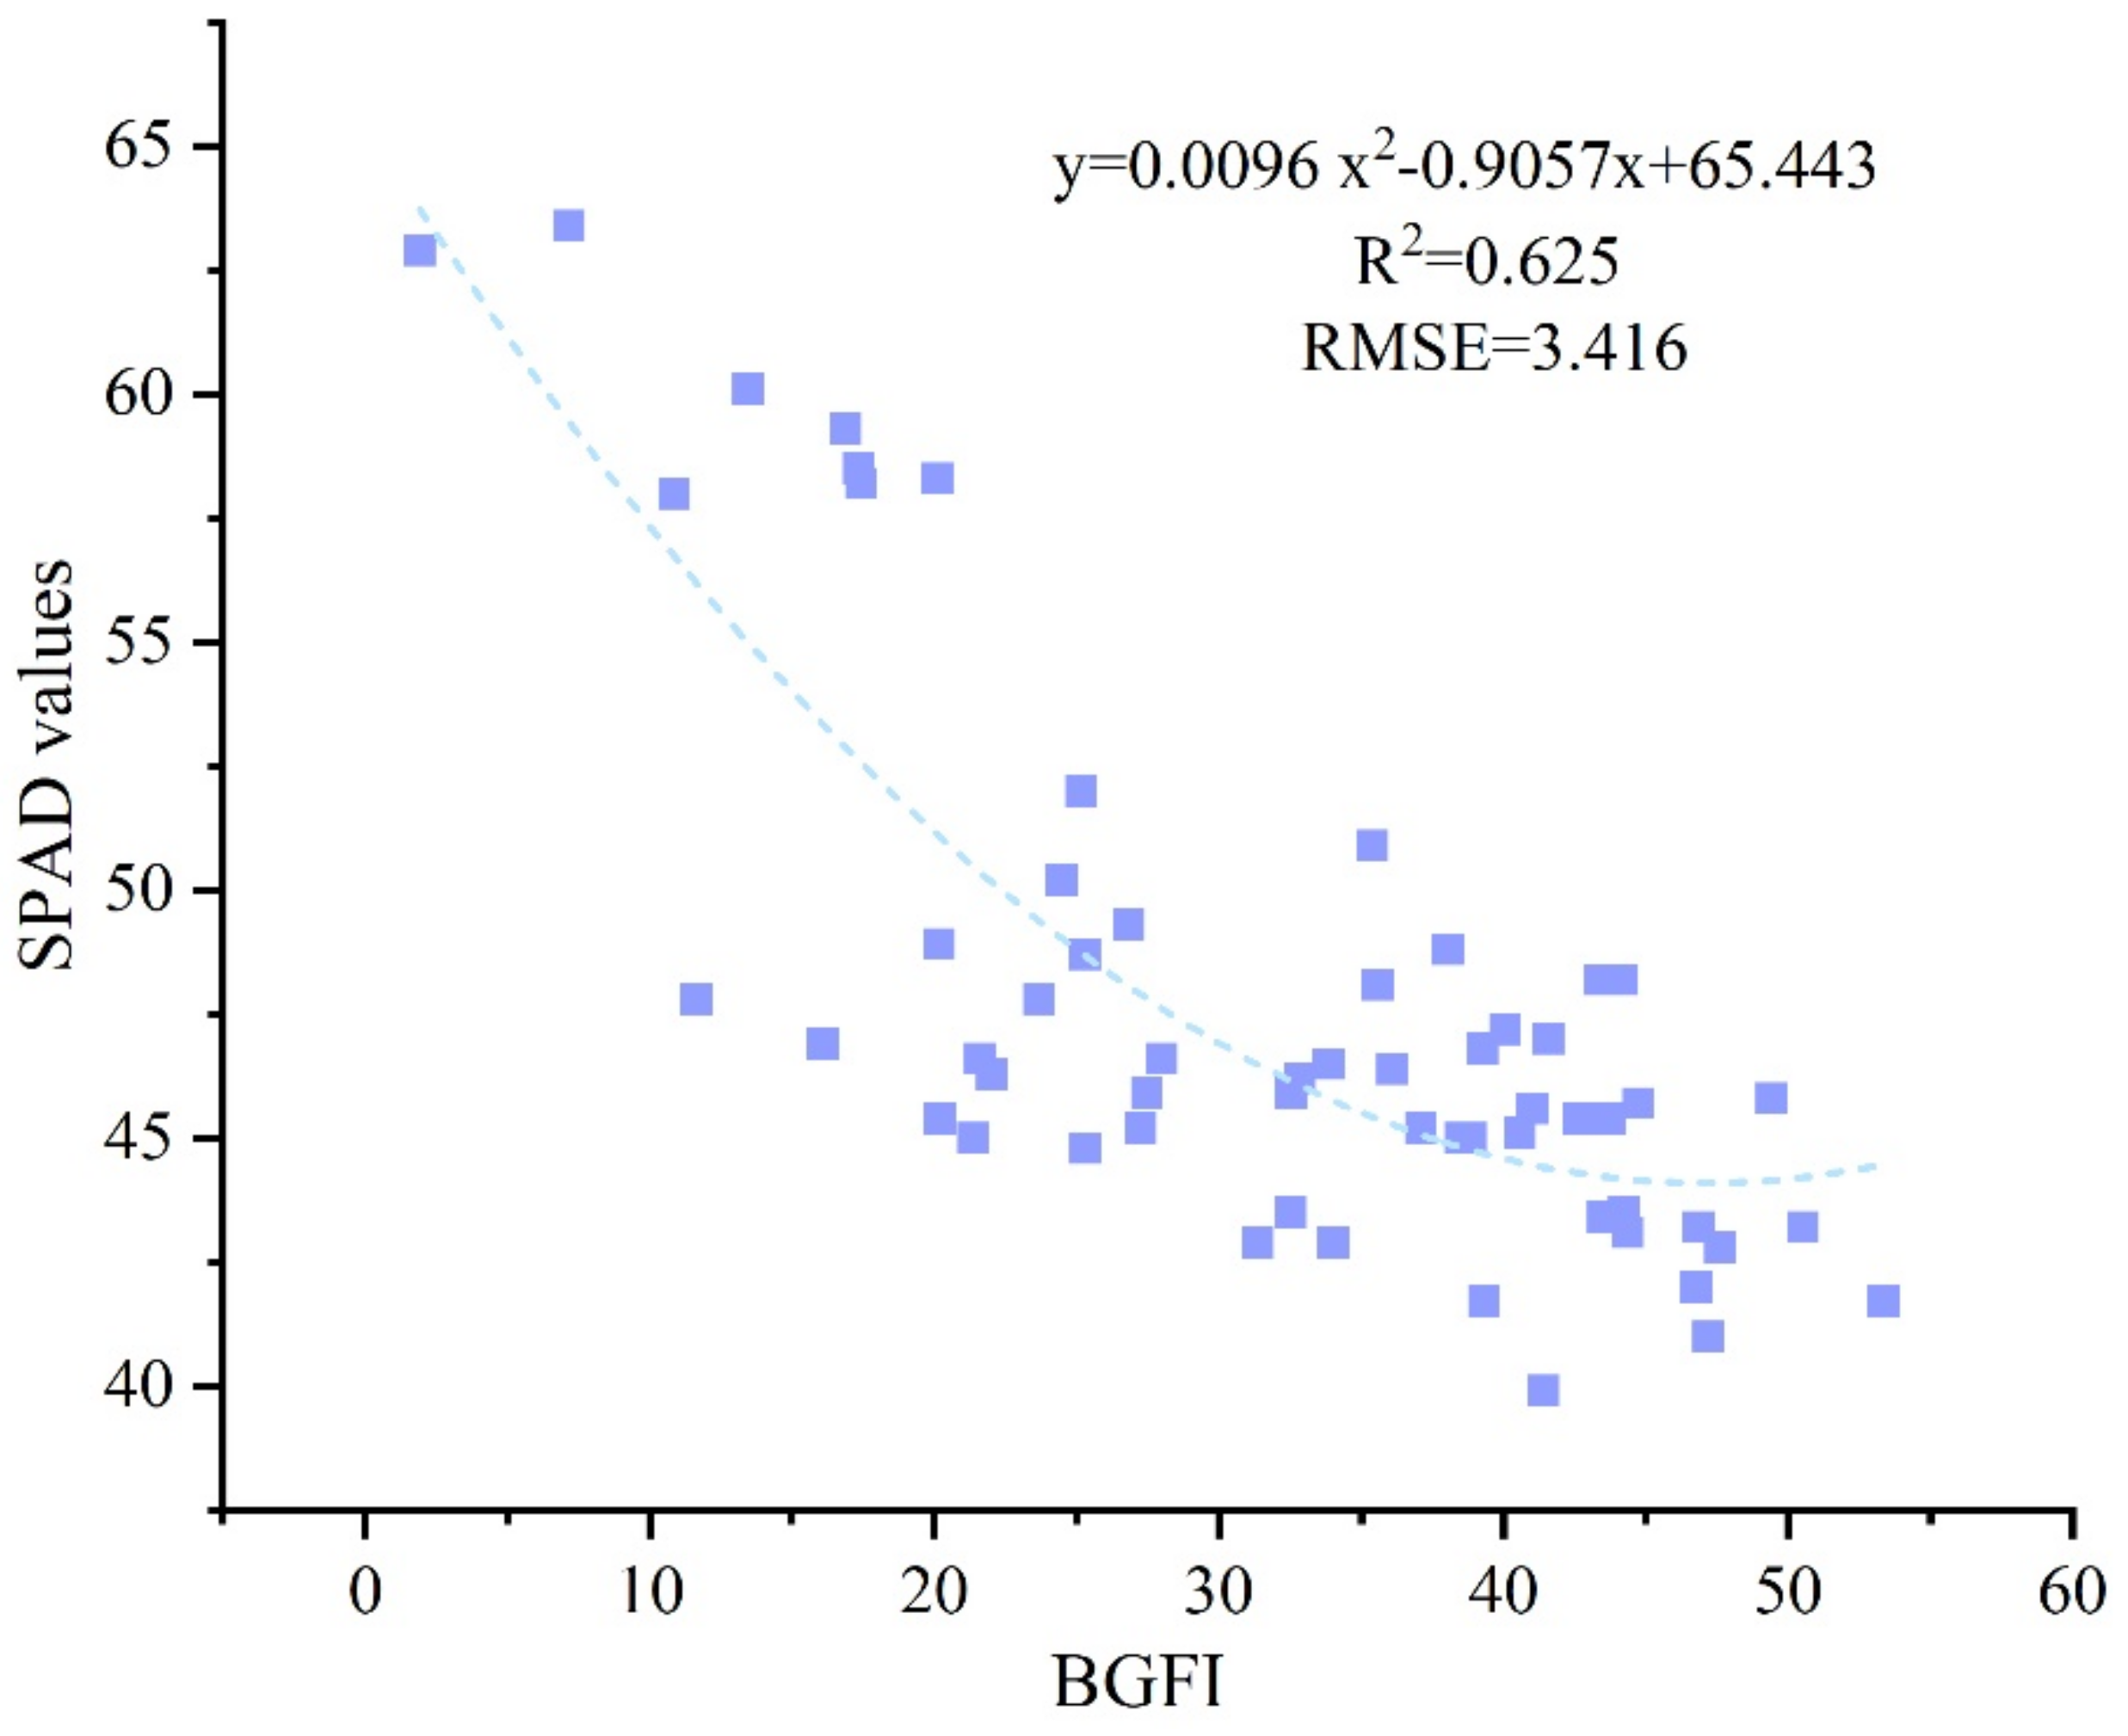
3.3. Construction and Validation of a CNCD for Ppotato Plants

When analyzing the data for 4 g N pot−1, it was found that the RGFI was closely related to SPAD values, independent of cultivar (Figure 5). The minimum N rate for the maximum SPAD values was 4 g N pot−1 according to the abovementioned significance analysis results; thus, the RGFI and SPAD values of potato plants grown at 4 g N pot−1 were selected for nonlinear fitting, and the fitting results are shown in Figure 5a. Using a 2nd-order polynomial function to fit the RGFI and SPAD values achieved good results with an R2 value of 0.860 and an RMSE value of 2.10, and the resulting CNDC is shown in Equation (5). To further analyze the fitting performance of the SPAD value of RGFI, EXG was also used to fit SPAD value with a 2nd-order polynomial function (Figure 5b). Clearly, RGFI achieves higher accuracy with an R2 increase of 0.112 and an RMSE decrease of 0.704 than EXG. It was assumed that the range within the 95% confidence interval (CI) of the reference curve may be regarded as an N fertigation condition as suitable as the N supply of 4 g N pot−1. In Figure 6, points below the curve show a low ratio of RGFI to SPAD values, indicating N stress exists. The SPAD value is closely related to the photosynthesis of plants, and the RGFI reflects the overall greenness of plant leaves. Thus, for a given SPAD value, a lower RGFI implies a lower plant N concentration. Therefore, a low point indicates N stress.
Y = 0.002 X 2 0.4409 X + 65.604
where Y and X represent chlorophyll and the RGFI, respectively.

4. Discussion

4.1. The Response of Yield and SPAD Values to the N ApplicationRate

Under the specific conditions in which the experiment was conducted, the organic matter content of the substrate met the growth nutrient requirements of potato in the first 35 days (Figure 3B). The SPAD value started to show a significant difference at 50 days after the emergence of potatoes; at this time, the N fertilizer of the substrate itself had been exhausted, and the applied N fertilizer promoted the growth of potato plants. Excessive N fertilization led to a decrease in potato tuber yield, with the highest potato yield appearing in the treatment with 4 g N pot−1, and the tuber yield of potatoes with 6 g N pot−1 was significantly reduced compared with that for 4 g N pot−1. Investigations performed in different regions for various crop species, such as maize in China [52], summer sanqi in China [53], and winter wheat in Poland [54], have indicated similar behavior. Therefore, excessive nitrogen application can not only improve crop yield, but also increase production cost. In addition, according to the N uptake capacity of crops, starting from a certain stage, excessive N accumulates in crop tissues, posing a serious threat to human health. The change in potato plant SPAD values with an increasing N rate was the same as that in the tuber yield, that is, when the N application rate was 6 g N pot−1, the SPAD value of potato plants decreased compared with that at 4 g N pot−1. Numerous studies have shown that the SPAD content of potato plants increases with increasing N application rates under field conditions [55,56,57]. These changes in SPAD values with the N application rate contradicted their results. The experiment carried out in this study was performed under greenhouse conditions, and substrates were used to cultivate potatoes. Supra-optimal N application rates may disrupt the uptake balance of N, P and K fertilizers by potato plants cultivated in substrate, resulting in a drop in the SPAD value of potato plants with 6 g N pot−1.

4.2. Application of the RGFI for CNDC Construction in Potato Plants

With the rapid development of sensing and computer vision technologies, RGB imaging, multispectral imaging [58,59], hyperspectral imaging [60,61], and other techniques are widely adopted to nondestructively assess plant chlorophyll, in combination with image-processing methods. The spectral reflectance data of light in certain bands [62,63] can be used to establish a chlorophyll estimation model. However, the performance of a chlorophyll estimation model that uses only a single spectral reflectance dataset is affected by many factors, such as the soil, atmosphere, and environmental conditions, as well as leaf structure. Therefore, VIs, which are typically established by linear and nonlinear integration of reflectance at different wavelengths, are often used to construct a chlorophyll estimation model. The vegetation indices can reduce the influence of external factors, and further improve the prediction performance and stability of the model [64]. VIs derived from multispectral and hyperspectral sensors have achieved good results in predicting chlorophyll, but the corresponding sensors are expensive and not suitable for use by individual farmers. Although RGB cameras contain less band information than multispectral and hyperspectral sensors, they are affordable, have high image resolution, and require simple image processing procedures. However, the existing research on chlorophyll prediction based on RGB images does not comprehensively consider the relationships between the R, G, and B bands of crop plants, resulting in lower fitting model accuracy of images and SPAD values [27,29]. The RGFI is determined based on the linear relationship of R R and R G by drawing on the construction principle of EXG. At the same time, the blue–green fit index (BGFI) is constructed with the linear relationship of R G and R B to construct the CNDC of potato plants. Potato plant leaves had an obvious linear relationship between R G and R B , with an R2 value of 0.998 and RMSE value of 1.131 (Figure 7). The BGFI and SPAD values were negatively correlated, and the 2nd-order polynomial function result of the BGFI and SPAD values was not ideal, with an R2 value of 0.625 and RMSE value of 3.416 (Figure 8). However, the RGFI achieved better fitting accuracy with an R2 value of 0.860 and an RMSE value of 2.10. Thus, the R R and R G linear relationship is confirmed to be an effective method for SPAD value fitting. The BGFI is calculated as follows:
B G F I = 2 R G 0.710 R B 73.645 R R

4.3. RGFI/SPAD Value-reference Curve Method

Plant critical N dilution curves were established in different crops, according to the differences in the N dilution process of crops and the accumulation of plant dry mass (W) under different N treatments [65]. However, the oven drying method and the Kjeldahl method are currently common methods used to measure W and N concentrations [8,66], respectively, and are inefficient not only in terms of data collection but also damage crops. Furthermore, the Kjeldahl method of N determination is harmful to the human body and the environment when obtaining crop N concentrations. An RGFI/SPAD value-reference curve method was derived from the RGB image and SPAD meter relation (2nd-order polynomial) in the N fertigation treatment with 4 g N pot−1. 4 g N pot−1 was suggested as the reference due to its best tuber yield and SPAD value. RGB images and SPAD values are two nondestructive, rapid, and effective methods to estimate crop chlorophyll. Therefore, the RGFI/SPAD value-reference curve method has wide applicability. Too much N fertilizer will cause N deficiency in potato plants, and the fitting model of the RGFI and SPAD values cannot further distinguish the status of N fertilizer; therefore, it is necessary to combine the phenotypic information of potato plants to further diagnose the status of nitrogen fertilizer in the future.

5. Conclusions

The combination of RGB images and SPAD values has great potential for accurate, rapid and economical diagnosis of nitrogen stress in the potato plant. In the greenhouse environment, the substrate could meet the nutritional requirements of potato plants in the first 35 days. The RGFI constructed by RGB images achieved good results in estimating the SPAD values of potato plants, with an R2 value of 0.86 and an RMSE value of 2.1. A reference curve is derived from the RGFI/SPAD value relationship, which could be used as a diagnostic tool to detect N stress in potato crops during the growing season.

Author Contributions

H.Y.: Methodology, Writing—original draft, Formal analysis, and Data processing. Y.H.: Writing—review and editing, Methodology, Investigation, and Funding acquisition. Z.Z.: Supervision, Conceptualization, and Visualization. Y.Q.: Methodology and Conceptualization. B.H.: Methodology and Conceptualization. J.C.: Investigation and Writing—review and editing. All authors have read and agreed to the published version of the manuscript.

Funding

This study was supported by the National Natural Science Foundation of China (C0043619, C0043628).

Data Availability Statement

Not applicable.

Acknowledgments

We are grateful to Xiaofeng Cao, Peng Zhang, Zhanghao Qu, and Shaoxiang Wang for data collection.

Conflicts of Interest

The authors declare that they have no conflict of interest.

References

  1. Boivin, M.; Bourdeau, N.; Barnabé, S.; Desgagné-Penix, I. Sprout Suppressive Molecules Effective on Potato (Solanum tuberosum) Tubers during Storage: A Review. Am. J. Potato Res. 2020, 97, 451–463. [Google Scholar] [CrossRef]
  2. Tawa, S.; Nedunchezhiyan, M. Global Status of Sweet Potato Cultivation. Fruit Veg. Cereal Sci. Biotechnol. 2012, 6, 143–147. [Google Scholar]
  3. Jia, L.; Qin, Y.; Chen, Y.; Fan, M. Fertigation improves potato production in Inner Mongolia (China). J. Crop Improv. 2018, 32, 648–656. [Google Scholar] [CrossRef]
  4. Wang, X.; Fan, J.; Xing, Y.; Xu, G.; Wang, H.; Jian, D.; Wang, Y.; Zhang, F.; Li, P.; Li, Z. The Effects of Mulch and Nitrogen Fertilizer on the Soil Environment of Crop Plants. Adv. Agron. 2019, 153, 121–173. [Google Scholar]
  5. Ata-Ul-Karim, S.T.; Liu, X.; Lu, Z.; Zheng, H.; Cao, W.; Zhu, Y. Estimation of nitrogen fertilizer requirement for rice crop using critical nitrogen dilution curve. Field Crops Res. 2017, 201, 32–40. [Google Scholar] [CrossRef]
  6. Ayyub, C.M.; Haidar, M.W.; Zulfiqar, F.; Abideen, Z.; Wright, S.R. Potato tuber yield and quality in response to different nitrogen fertilizer application rates under two split doses in an irrigated sandy loam soil. J. Plant Nutr. 2019, 42, 1850–1860. [Google Scholar] [CrossRef]
  7. Qiang, S.C.; Zhang, F.C.; Dyck, M.; Zhang, Y.; Xiang, Y.Z.; Fan, J.L. Determination of critical nitrogen dilution curve based on leaf area index for winter wheat in the Guanzhong Plain, Northwest China. J. Integr. Agric. 2019, 18, 2369–2380. [Google Scholar] [CrossRef]
  8. Zhou, L.; Feng, H.; Zhao, W. Plastic film mulching affects the critical nitrogen dilution curve of drip-irrigated maize. Field Crops Res. 2021, 263, 108055. [Google Scholar] [CrossRef]
  9. Scott, J.T.; Lambie, S.M.; Stevenson, B.A.; LSchipper, A.; Parfitt, R.L.; McGill, A.C. Carbon and nitrogen leaching under high and low phosphate fertility pasture with increasing nitrogen inputs. Agric. Ecosyst. Environ. 2015, 202, 139–147. [Google Scholar] [CrossRef]
  10. Muttucumaru, N.; Powers, S.J.; Elmore, J.S.; Mottram, D.S.; Halford, N.G. Effects of nitrogen and sulfur fertilization on free amino acids, sugars, and acrylamide-forming potential in potato. J. Agric. Food Chem. 2013, 61, 6734–6742. [Google Scholar] [CrossRef]
  11. Guo, J.H.; Liu, X.J.; Zhang, Y.; Shen, J.L.; Han, W.X.; Zhang, W.F.; Christie, P.; Goulding, K.; Vitousek, P.M.; Zhang, F.S. Significant Acidification in Major Chinese Croplands. Science 2010, 327, 1008–1010. [Google Scholar] [CrossRef] [PubMed]
  12. Shibata, H.; Branquinho, C.; Mcdowell, W.; Mitchell, M.; Monteith, D.; Tang, J.; Arvola, L.; Cruz, C.; Cusack, D.; Halada, L. Consequence of altered nitrogen cycles in the coupled human and ecological system under changing climate: The need for long-term and site-based research. Ambio 2015, 44, 178–193. [Google Scholar] [CrossRef] [PubMed] [Green Version]
  13. Hansen, B.; Thorling, L.; Kim, H.; Blicher-Mathiesen, G. Long-term nitrate response in shallow groundwater to agricultural N regulations in Denmark. J. Environ. Manag. 2019, 240, 66–74. [Google Scholar] [CrossRef] [PubMed]
  14. Wang, M.; Wang, H.; Hou, L.; Zhu, Y.; Zhang, Q.; Chen, L.; Mao, P. Development of a critical nitrogen dilution curve of Siberian wildrye for seed production. Field Crops Res. 2018, 219, 250–255. [Google Scholar] [CrossRef]
  15. He, Z.; Qiu, X.; Tahir, A.; Li, Y.; Liu, X.; Qiang, C.; Zhu, Y.; Cao, W.; Liang, T. Development of a Critical Nitrogen Dilution Curve of Double Cropping Rice in South China. Front. Plant Sci. 2017, 8, 638. [Google Scholar] [CrossRef] [PubMed]
  16. Giletto, C.M.; heverría, H.E. Critical Nitrogen Dilution Curve for Processing Potato in Argentinean Humid Pampas. Am. J. Potato Res. 2012, 89, 102–110. [Google Scholar] [CrossRef]
  17. Xue, X.P.; Zhou, Z.G.; Zhang, L.J.; Wang, Y.L.; Guo, W.Q.; Chen, B.L. Development and application of critical nitrogen concentration Dilution Model for cotton after flowering. Acta Ecol. Sin. 2006, 26, 1781–1791. [Google Scholar]
  18. Li, Z.; Song, M.; Feng, H. Development and validation of critical nitrogen content curve for maize in Guanzhong area. Nongye Gongcheng Xuebao/Trans. Chin. Soc. Agric. Eng. 2015, 31, 135–141. [Google Scholar]
  19. Ata-Ul-Karim, S.T.; Yao, X.; Liu, X.; Cao, W.; Zhu, Y. Development of critical nitrogen dilution curve of Japonica rice in Yangtze River Reaches. Field Crops Res. 2013, 149, 149–158. [Google Scholar] [CrossRef]
  20. Xia, Y.; Zhao, B.; Tian, Y.C.; Xiao, J.L.; Yan, Z. Using leaf dry matter to quantify the critical nitrogen dilution curve for winter wheat cultivated in eastern China. Field Crops Res. 2014, 159, 33–42. [Google Scholar]
  21. Zhou, Z.; Jabloun, M.; Plauborg, F.; Andersen, M.N. Using ground-based spectral reflectance sensors and photography to estimate shoot N concentration and dry matter of potato. Comput. Electron. Agric. 2018, 144, 154–163. [Google Scholar] [CrossRef]
  22. Dang, R.J.; Shi-Qing, L.I.; Xiao-Hui, M.U.; Sheng-Xiu, L.I. Effect of nitrogen on vertical distribution of canopy nitrogen and chlorophyll relative value (SPAD value) of summer maize in sub-humid areas. Chin. J. Eco-Agric. 2009, 17, 54–59. [Google Scholar] [CrossRef]
  23. Padilla, F.M.; Marisa, G.; Teresa, P.; Romina, D.S.; Thompson, R.B. Proximal Optical Sensors for Nitrogen Management of Vegetable Crops: A Review. Sensors 2018, 18, 2083. [Google Scholar] [CrossRef] [PubMed]
  24. Padilla, F.M.; Pea-Fleitas, M.T.; Gallardo, M.; Giménez, C.; Thompson, R.B. Derivation of sufficiency values of a chlorophyll meter to estimate cucumber nitrogen status and yield. Comput. Electron. Agric. 2017, 141, 54–64. [Google Scholar] [CrossRef]
  25. Fernandes, F.M.; Soratto, R.P.; Fernandes, A.M.; Souza, E. Chlorophyll meter-based leaf nitrogen status to manage nitrogen in tropical potato production. Agron. J. 2021, 113, 1733–1746. [Google Scholar] [CrossRef]
  26. Padilla, F.M.; De Souza, R.; Peña-Fleitas, M.; Grasso, R.; Gallardo, M.; Thompson, R.B. Influence of time of day on measurement with chlorophyll meters and canopy reflectance sensors of different crop N status. Precis. Agric. 2019, 20, 1087–1106. [Google Scholar] [CrossRef]
  27. Gupta, S.D.; Ibaraki, Y.; Pattanayak, A.K. Development of a digital image analysis method for real-time estimation of chlorophyll content in micropropagated potato plants. Plant Biotechnol. Rep. 2012, 7, 91–97. [Google Scholar] [CrossRef]
  28. Zheng, H.L.; Liu, Y.C.; Qin, Y.L.; Chen, Y.; Fan, M.S. Establishing dynamic thresholds for potato nitrogen status diagnosis with the SPAD chlorophyll meter. J. Integr. Agric. 2015, 14, 190–195. [Google Scholar] [CrossRef]
  29. Rigon, J.P.G.; Capuani, S.; Fernandes, D.M.; Guimarães, T.M. A novel method for the estimation of soybean chlorophyll content using a smartphone and image analysis. Photosynthetica 2016, 54, 559–566. [Google Scholar] [CrossRef]
  30. Giletto, C.M.; Echeverría, H. Chlorophyll Meter for the Evaluation of Potato N Status. Am. J. Potato Res. 2013, 90, 313–323. [Google Scholar] [CrossRef]
  31. Sun, G.; Wang, X.; Sun, Y.; Ding, Y.; Lu, W. Measurement Method Based on Multispectral Three-Dimensional Imaging for the Chlorophyll Contents of Greenhouse Tomato Plants. Sensors 2019, 19, 3345. [Google Scholar] [CrossRef] [PubMed]
  32. Zhang, S.; Zhao, G.; Lang, K.; Su, B.; Chen, X.; Xi, X.; Zhang, H. Integrated Satellite, Unmanned Aerial Vehicle (UAV) and Ground Inversion of the SPAD of Winter Wheat in the Reviving Stage. Sensors 2019, 19, 1485. [Google Scholar] [CrossRef] [PubMed]
  33. Lee, K.J.; Lee, B.W. Estimation of rice growth and nitrogen nutrition status using color digital camera image analysis. Eur. J. Agron. 2013, 48, 57–65. [Google Scholar] [CrossRef]
  34. Riccardi, M.; Mele, G.; Pulvento, C.; Lavini, A.; Jacobsen, S.E. Non-destructive evaluation of chlorophyll content in quinoa and amaranth leaves by simple and multiple regression analysis of RGB image components. Photosynth. Res. 2014, 120, 263–272. [Google Scholar] [CrossRef]
  35. Li, L.; Chen, J.; Fan, M. Determination of Plants Number for Evaluating Potato N Status Using Chlorophyll Meter SPAD-502. Crops 2015, 135–137. [Google Scholar] [CrossRef]
  36. Shibaeva, T.G.; Mamaev, A.V.; Sherudilo, E.G. Evaluation of a SPAD-502 Plus Chlorophyll Meter to Estimate Chlorophyll Content in Leaves with Interveinal Chlorosis. Russ. J. Plant Physiol. 2020, 67, 690–696. [Google Scholar] [CrossRef]
  37. Meyer, G.E.; Neto, J.O.C. Verification of color vegetation indices for automated crop imaging applications. Comput. Electron. Agric. 2008, 63, 282–293. [Google Scholar] [CrossRef]
  38. Zhang, L.; Zhang, H.; Han, W.; Niu, Y.; Ma, W. The mean value of gaussian distribution of excess green index: A new crop water stress indicator. Agric. Water Manag. 2021, 251, 106866. [Google Scholar] [CrossRef]
  39. Zhang, X.; Zhang, F.; Qi, Y.; Deng, L.; Wang, X.; Yang, S. New research methods for vegetation information extraction based on visible light remote sensing images from an unmanned aerial vehicle (UAV). Int. J. Appl. Earth Obs. Geoinf. 2019, 78, 215–226. [Google Scholar] [CrossRef]
  40. Wang, Z.; Zheng, Y.C.; Li, J.F.; Wang, Y.Z.; Qi, W.C. Study on GLI values of Polygonatum odoratum base on multi-temporal of unmanned aerial vehicle remote sensing. Zhongguo Zhong Yao Za Zhi Zhongguo Zhongyao Zazhi China J. Chin. Mater. Med. 2020, 45, 5663–5668. [Google Scholar]
  41. Haralick, R.M.; Shanmugam, K.; Dinstein, I. Textural Features for Image Classification. Stud. Media Commun. 1973, 610–621. [Google Scholar] [CrossRef]
  42. Yadav, S.P.; Ibaraki, Y.; Gupta, S.D. Estimation of the chlorophyll content of micropropagated potato plants using RGB based image analysis. Plant Cell Tissue Organ Cult. 2010, 100, 183–188. [Google Scholar] [CrossRef]
  43. Gong, A.; Yu, J.; He, Y.; Qiu, Z. Citrus yield estimation based on images processed by an Android mobile phone. Biosyst. Eng. 2013, 115, 162–170. [Google Scholar] [CrossRef]
  44. Yang, H.; Zhao, J.; Lan, Y.; Lu, L.; Li, Z. Fraction vegetation cover extraction of winter wheat based on RGB image obtained by UAV. Int. J. Precis. Agric. Aviat. 2018, 1, 54–61. [Google Scholar] [CrossRef]
  45. Liang, H.; Yang, G.; Dai, H.; Bo, X.; Yang, X. Modeling maize above-ground biomass based on machine learning approaches using UAV remote-sensing data. Plant Methods 2019, 15, 10. [Google Scholar]
  46. Ge, H.; Xiang, H.; Ma, F.; Li, Z.; Du, C. Estimating Plant Nitrogen Concentration of Rice through Fusing Vegetation Indices and Color Moments Derived from UAV-RGB Images. Remote Sens. 2021, 13, 1620. [Google Scholar] [CrossRef]
  47. Zhou, Z.; Plauborg, F.; Thomsen, A.G.; Andersen, M.N. A RVI/LAI-reference curve to detect N stress and guide N fertigation using combined information from spectral reflectance and leaf area measurements in potato. Eur. J. Agron. 2017, 87, 1–7. [Google Scholar] [CrossRef]
  48. Ata-Ul-Karim, S.T.; Zhu, Y.; Cao, Q.; Rehmani, M.; Cao, W.; Tang, L. In-season assessment of grain protein and amylose content in rice using critical nitrogen dilution curve. Eur. J. Agron. 2017, 90, 139–151. [Google Scholar] [CrossRef]
  49. Zamora-Re, M.I.; Dukes, M.; Hensley, D.; Rowland, D.; Graham, W. The effect of irrigation strategies and nitrogen fertilizer rates on maize growth and grain yield. Irrig. Sci. 2020, 38, 461–478. [Google Scholar] [CrossRef]
  50. Liu, N.; Qiao, L.; Xing, Z.; Li, M.; Sun, H.; Zhang, J.; Zhang, Y. Detection of chlorophyll content in growth potato based on spectral variable analysis. Spectrosc. Lett. 2020, 53, 476–488. [Google Scholar] [CrossRef]
  51. Liu, N.; Xing, Z.; Zhao, R.; Qiao, L.; Li, M.; Liu, G.; Sun, H. Analysis of chlorophyll concentration in potato crop by coupling continuous wavelet transform and spectral variable optimization. Remote Sens. 2020, 12, 2826. [Google Scholar] [CrossRef]
  52. Khan, F.; Khan, S.; Fahad, S.; Faisal, S.; Hussain, S.; Ali, S.; Ali, A. Effect of Different Levels of Nitrogen and Phosphorus on the Phenology and Yield of Maize Varieties. Am. J. Plant Sci. 2014, 5, 2582–2590. [Google Scholar] [CrossRef]
  53. Wei, W.; Yang, M.; Liu, Y.; Huang, H.; Ye, C.; Zheng, J.; Guo, C.; Hao, M.; He, X.; Zhu, S. Fertilizer N application rate impacts plant-soil feedback in a sanqi production system. Sci. Total Environ. 2018, 633, 796–807. [Google Scholar] [CrossRef]
  54. Correndo, A.A.; Rotundo, J.L.; Tremblay, N.; Archontoulis, S.; Ciampitti, I.A. Assessing the uncertainty of maize yield without nitrogen fertilization. Field Crops Res. 2021, 260, 107985. [Google Scholar] [CrossRef]
  55. Gáborčík, N. Relationship between Contents of Chlorophyll (a + b) (SPAD values) and Nitrogen of Some Temperate Grasses. Photosynthetica 2003, 41, 285–287. [Google Scholar] [CrossRef]
  56. Yang, H.; Li, J.; Yang, J.; Hua, W.; Zou, J.; He, J.; Hui, D. Effects of Nitrogen Application Rate and Leaf Age on the Distribution Pattern of Leaf SPAD Readings in the Rice Canopy. PLoS ONE 2014, 9, e88421. [Google Scholar] [CrossRef]
  57. Li, R.; Chen, J.; Qin, Y.; Fan, M. Possibility of using a SPAD chlorophyll meter to establish a normalized threshold index of nitrogen status in different potato cultivars. J. Plant Nutr. 2019, 42, 834–841. [Google Scholar] [CrossRef]
  58. Sonobe, R.; Sano, T.; Horie, H. Using spectral reflectance to estimate leaf chlorophyll content of tea with shading treatments. Biosyst. Eng. 2018, 175, 168–182. [Google Scholar] [CrossRef]
  59. Yu, K.Q.; Zhao, Y.R.; Zhu, F.L.; Li, X.L.; He, Y. Mapping of Chlorophyll and SPAD Distribution in Pepper Leaves During Leaf Senescence Using Visible and Near-Infrared Hyperspectral Imaging. Trans. Asabe 2016, 59, 13–24. [Google Scholar]
  60. Zhang, J.; Han, W.; Huang, L.; Zhang, Z.; Ma, Y.; Hu, Y. Leaf Chlorophyll Content Estimation of Winter Wheat Based on Visible and Near-Infrared Sensors. Sensors 2016, 16, 437. [Google Scholar] [CrossRef]
  61. Qin, C.; Huang, J.; Wang, H.; Sun, H.; Zhang, Y.; Yingying, L.I. Polarized hyperspectral characteristics of smooth leaves and its relationship with chlorophyll content. J. Meteorol. Sci. 2019, 39, 421–426. [Google Scholar]
  62. Yang, Z.; Hu, J.; Duan, T.; Wang, S.; Wu, J.; Su, W.; Zhang, Y.; University, H.A. Research Progress of Nondestructive Diagnostic Technique of Chlorophyll in Plants. Chin. Agric. Sci. Bull. 2019, 35, 139–144. [Google Scholar]
  63. He, Y.; Peng, J.; Liu, F.; Zhang, C.; Kong, W. Critical review of fast detection of crop nutrient and physiological information with spectral and imaging technology. Trans. Chin. Soc. Agric. Eng. 2015, 31, 174–189. [Google Scholar]
  64. Yong, H.E.; Zhao, C.J.; Di, W.U.; Nie, P.C. Fast detection technique and sensor instruments for crop-environment information: A review. Entia Sinica 2010, 40, 1–20. [Google Scholar]
  65. Zhao, B.; Niu, X.; Ata-Ul-Karim, S.T.; Wang, L.; Lemaire, G. Determination of the post-anthesis nitrogen status using ear critical nitrogen dilution curve and its implications for nitrogen management in maize and wheat. Eur. J. Agron. 2020, 113, 125967. [Google Scholar] [CrossRef]
  66. Rahimikhoob, H.; Sohrabi, T.; Delshad, M. Development of a Critical Nitrogen Dilution Curve for Basil (Ocimum basilicum L.) Under Greenhouse Conditions. J. Soil Sci. Plant Nutr. 2020, 20, 881–891. [Google Scholar] [CrossRef]
Figure 1. Schematic diagram of the image acquisition system. Note: 1, 2, 3, 4, 5, 6, 7, 8, 9, 10, 11, 12, and 13 represent the EOS 760D camera, laptop, tripod, the first leaf at the top of the canopy, the second leaf at the top of the canopy, the third leaf at the top of the canopy, the first leaf at the middle of canopy, the second leaf at the middle of canopy, the third leaf at the middle of canopy, SPAD 502, the first leaf at the bottom of canopy, the second leaf at the bottom of canopy, and the third leaf at the bottom of canopy, respectively.
Remotesensing 14 04814 g001
Figure 2. Fitting results of the green band and red band for potato plant leaves.
Remotesensing 14 04814 g002
Figure 3. (A) The effect of the N application rate on the relative yield of potato tubers. (B) The effect of the N application rate on SPAD values 35 days after the emergence of potatoes. (C) The effect of the N application rate on SPAD values 50 days after the emergence of potatoes. Different letters represent significant differences (p < 0.05).
Remotesensing 14 04814 g003
Figure 4. Feature screening results of the Pearson correlation coefficient method.
Remotesensing 14 04814 g004
Figure 5. Fitting results of SPAD value using 2nd-order polynomial function at 4 g N pot−1. (a) Fitting results of RGFI; (b) Fitting results of EXG.
Remotesensing 14 04814 g005
Figure 6. Validation of the critical N dilution curves established by RGFI and SPAD values.
Remotesensing 14 04814 g006
Figure 7. Fitting results of the green band and blue band for potato plant leaves.
Remotesensing 14 04814 g007
Figure 8. Critical N dilution curves derived from BGFI and SPAD values at 4 g N pot−1.
Remotesensing 14 04814 g008
Table 1. Vegetation index and texture feature calculation method.
TypeNameFormulas
Vegetation indicesExcess green index (EXG) E X G = 2 × R G R R R B
Normalized green–blue difference index (NGBDI) N G B D I = R G R B R G + R B
Green–red vegetation index (GRVI) G R V I = R G R R R G + R R
Green leaf index (GLI) G L I = 2 × R G R R R B 2 × R G + R R + R B
Texture featuresMean (mean) m e a n = i , j N 1 i P i , j
Variance (var) v a r = i , j = 0 N 1 i P i , j ( i m e a n ) 2
Homogeneity (hom) h o m = i , j = 0 N 1 i P i , j 1 + ( i j ) 2
Contrast (con) c o n = i , j = 0 N 1 i P i , j ( i j ) 2
Dissimilarity (dis) d i s = i , j = 0 N 1 i P i , j i j
Entropy (ent) e n t = i , j = 0 N 1 i P i , j ( ln P i , j )
Second moment (sm) s m = i , j = 0 N 1 i P i , j 2
Correlation (corr) c o r r = i , j = 0 N 1 i P i , j ( i m e a n ) ( j m e a n ) v a r i × v a r j
Table 2. Feature screening results of RF.
Feature NameImportance
RGFI0.3068
EXG0.2798
GLI0.1673
GRVI0.1261
NGBDI0.0204
Publisher’s Note: MDPI stays neutral with regard to jurisdictional claims in published maps and institutional affiliations.

