Communication

Using GNSS-IR Snow Depth Estimation to Monitor the 2022 Early February Snowstorm over Southern China

1
College of Oceanography and Space Informatics, China University of Petroleum (East China), Qingdao 266555, China
2
Center of Meteorological Observation, China Meteorological Administration, Beijing 100044, China
3
Institute of Remote Sensing and GIS, School of Earth and Space Sciences, Peking University, Beijing 100871, China
4
School of Soil and Water Conservation, Beijing Forestry University, Beijing 100083, China
*
Author to whom correspondence should be addressed.
Remote Sens. 2022, 14(18), 4530; https://doi.org/10.3390/rs14184530
Submission received: 12 July 2022 / Revised: 27 August 2022 / Accepted: 6 September 2022 / Published: 10 September 2022

Abstract

:
Snow depth is an essential meteorological indicator for monitoring snow disasters. The Global Navigation Satellite System Interferometric Reflectometry (GNSS-IR) technique has been proven to be a practical approach to retrieving snow depth. This study presents a case study to explore utilizing the GNSS-IR-derived snow depth to monitor the 2022 early February snowstorm over southern China. A snow depth retrieval framework considering data quality control and specific ground surface substances was developed using 8-day data from 13 operational GNSS/Meteorology stations. The daily snow depths retrieved from different ground surfaces, i.e., dry grass, wet grass, and concrete, agreed well with the measured snow depth, with Mean Absolute Error (MAE) of 2.79 cm, 3.36 cm, and 2.53 cm, respectively. The percentage MAE when snow depths > 5 cm for the three ground surface substances was 26.8%, 53.7%, and 35.0%, respectively. The 6 h snow depth results also showed a swift and significant response to the snowfall event. This study proves the potential of GNSS-IR, used as a new operational tool in the automatic meteorological system, to monitor snow disasters over southern China, particularly as an efficient and cost-effective framework for real-time and accurate monitoring.

1. Introduction

Snow disaster is one of the major natural disasters in China. In recent decades, high losses in regions caused by snow disasters have spread from the northern pastures to the central and eastern provinces as the population has increased and the economy has grown [1]. The length of the snow season is more than 90 days in stable snow regions across northern China, while it only has a short duration of 10 days in southern China [2]. As defined by the China Meteorological Administration (CMA), snowstorm warning standards are divided into four categories, i.e., blue, yellow, orange, and red alert, corresponding to snowfall reaching 4 millimeters (mm) in 12 h (h), 6 mm in 12 h, 10 mm in 6 h, and 15 mm in 6 h. Compared to the areas of the north, snow disasters in the south lack operational monitoring and any means of early warning for sudden snowstorms. Random and sudden extreme snowstorm events in the south will severely affect transportation, agriculture, and residents’ lives [1].
Snow depth is a crucial parameter for describing seasonal snow and snowstorms and an essential meteorological indicator to monitor potential snow disasters. In China’s operational meteorological observation system over the north, snow depth is usually measured by ground-based laser sensors, which is not the case in the south. The system has also started to consider the Global Navigation Satellite System Interferometric Reflectometry (GNSS-IR) as a new tool to measure snow depth in recent years [3].
The GNSS-IR technique generally belongs to the scope of GNSS-Reflectometry (GNSS-R). Unlike two-/multiple-antenna GNSS-R instruments [4], GNSS-IR uses interferometric metrics such as phase, amplitude, and frequency measured from single-antenna instruments to retrieve geophysical elements [5,6,7]. GNSS-IR has been shown to estimate snow depth since 2009 in the Colorado snowstorm in the United States [8]. Snow depth is determined by calculating the relative change of the effective reflector height from the snow surface to the snow-free surface. For typical sites, the footprint of GNSS-IR observation is ~1000 m2, which is between point-scale ground measurements and satellite remote sensing products (i.e., from tens of meters to tens of kilometers). In the last two decades, the scientific community has promoted the GNSS-IR technique of snow depth estimation from feasibility research [8] to forward/retrieval modeling [9,10,11,12,13,14] and operational applications [3,15], and also from the original Global Positioning System (GPS) to multiple GNSS systems including the GLONASS [16,17,18], BeiDou Navigation Satellite System (BDS) [19], and Galileo [20]. Previous studies show that GLONASS signals and modernized GPS signals are of comparable quality [17], and higher SNR and a smaller code chipping period (e.g., Galileo E5) lead to slightly better snow depth accuracy than other GNSS frequencies [14]. Benefiting from its high temporal resolution, spaceborne GNSS-R data have been used to monitor extreme weather events, e.g., typhoons [21] and flooding inundation [22,23,24]. The GNSS-IR has also been verified to have the ability to provide hourly snow depth [3,25] and water level [26] estimates if there are adequate available satellite tracks. To our knowledge, using GNSS-IR-derived snow depth to monitor snowstorms is rarely studied.
This study presents a case study to explore utilizing the GNSS-IR-derived snow depth to monitor extreme weather events, i.e., the snowstorm over southern China that occurred on 6~8 February 2022. We used the data from 13 GNSS sites operated by the CMA for 8 days (i.e., 1~8 February 2022) to show the performance of snow depth retrieval. We developed a snow depth retrieval framework considering data quality control and specific underlying surface conditions over the study area. The results show the effectiveness and high efficiency of GNSS-IR in monitoring snow depth dynamics during the event. This work provides supportive evidence for further using GNSS-IR as an operational tool in the operational meteorological observation system to monitor snow disasters.

2. Materials and Methods

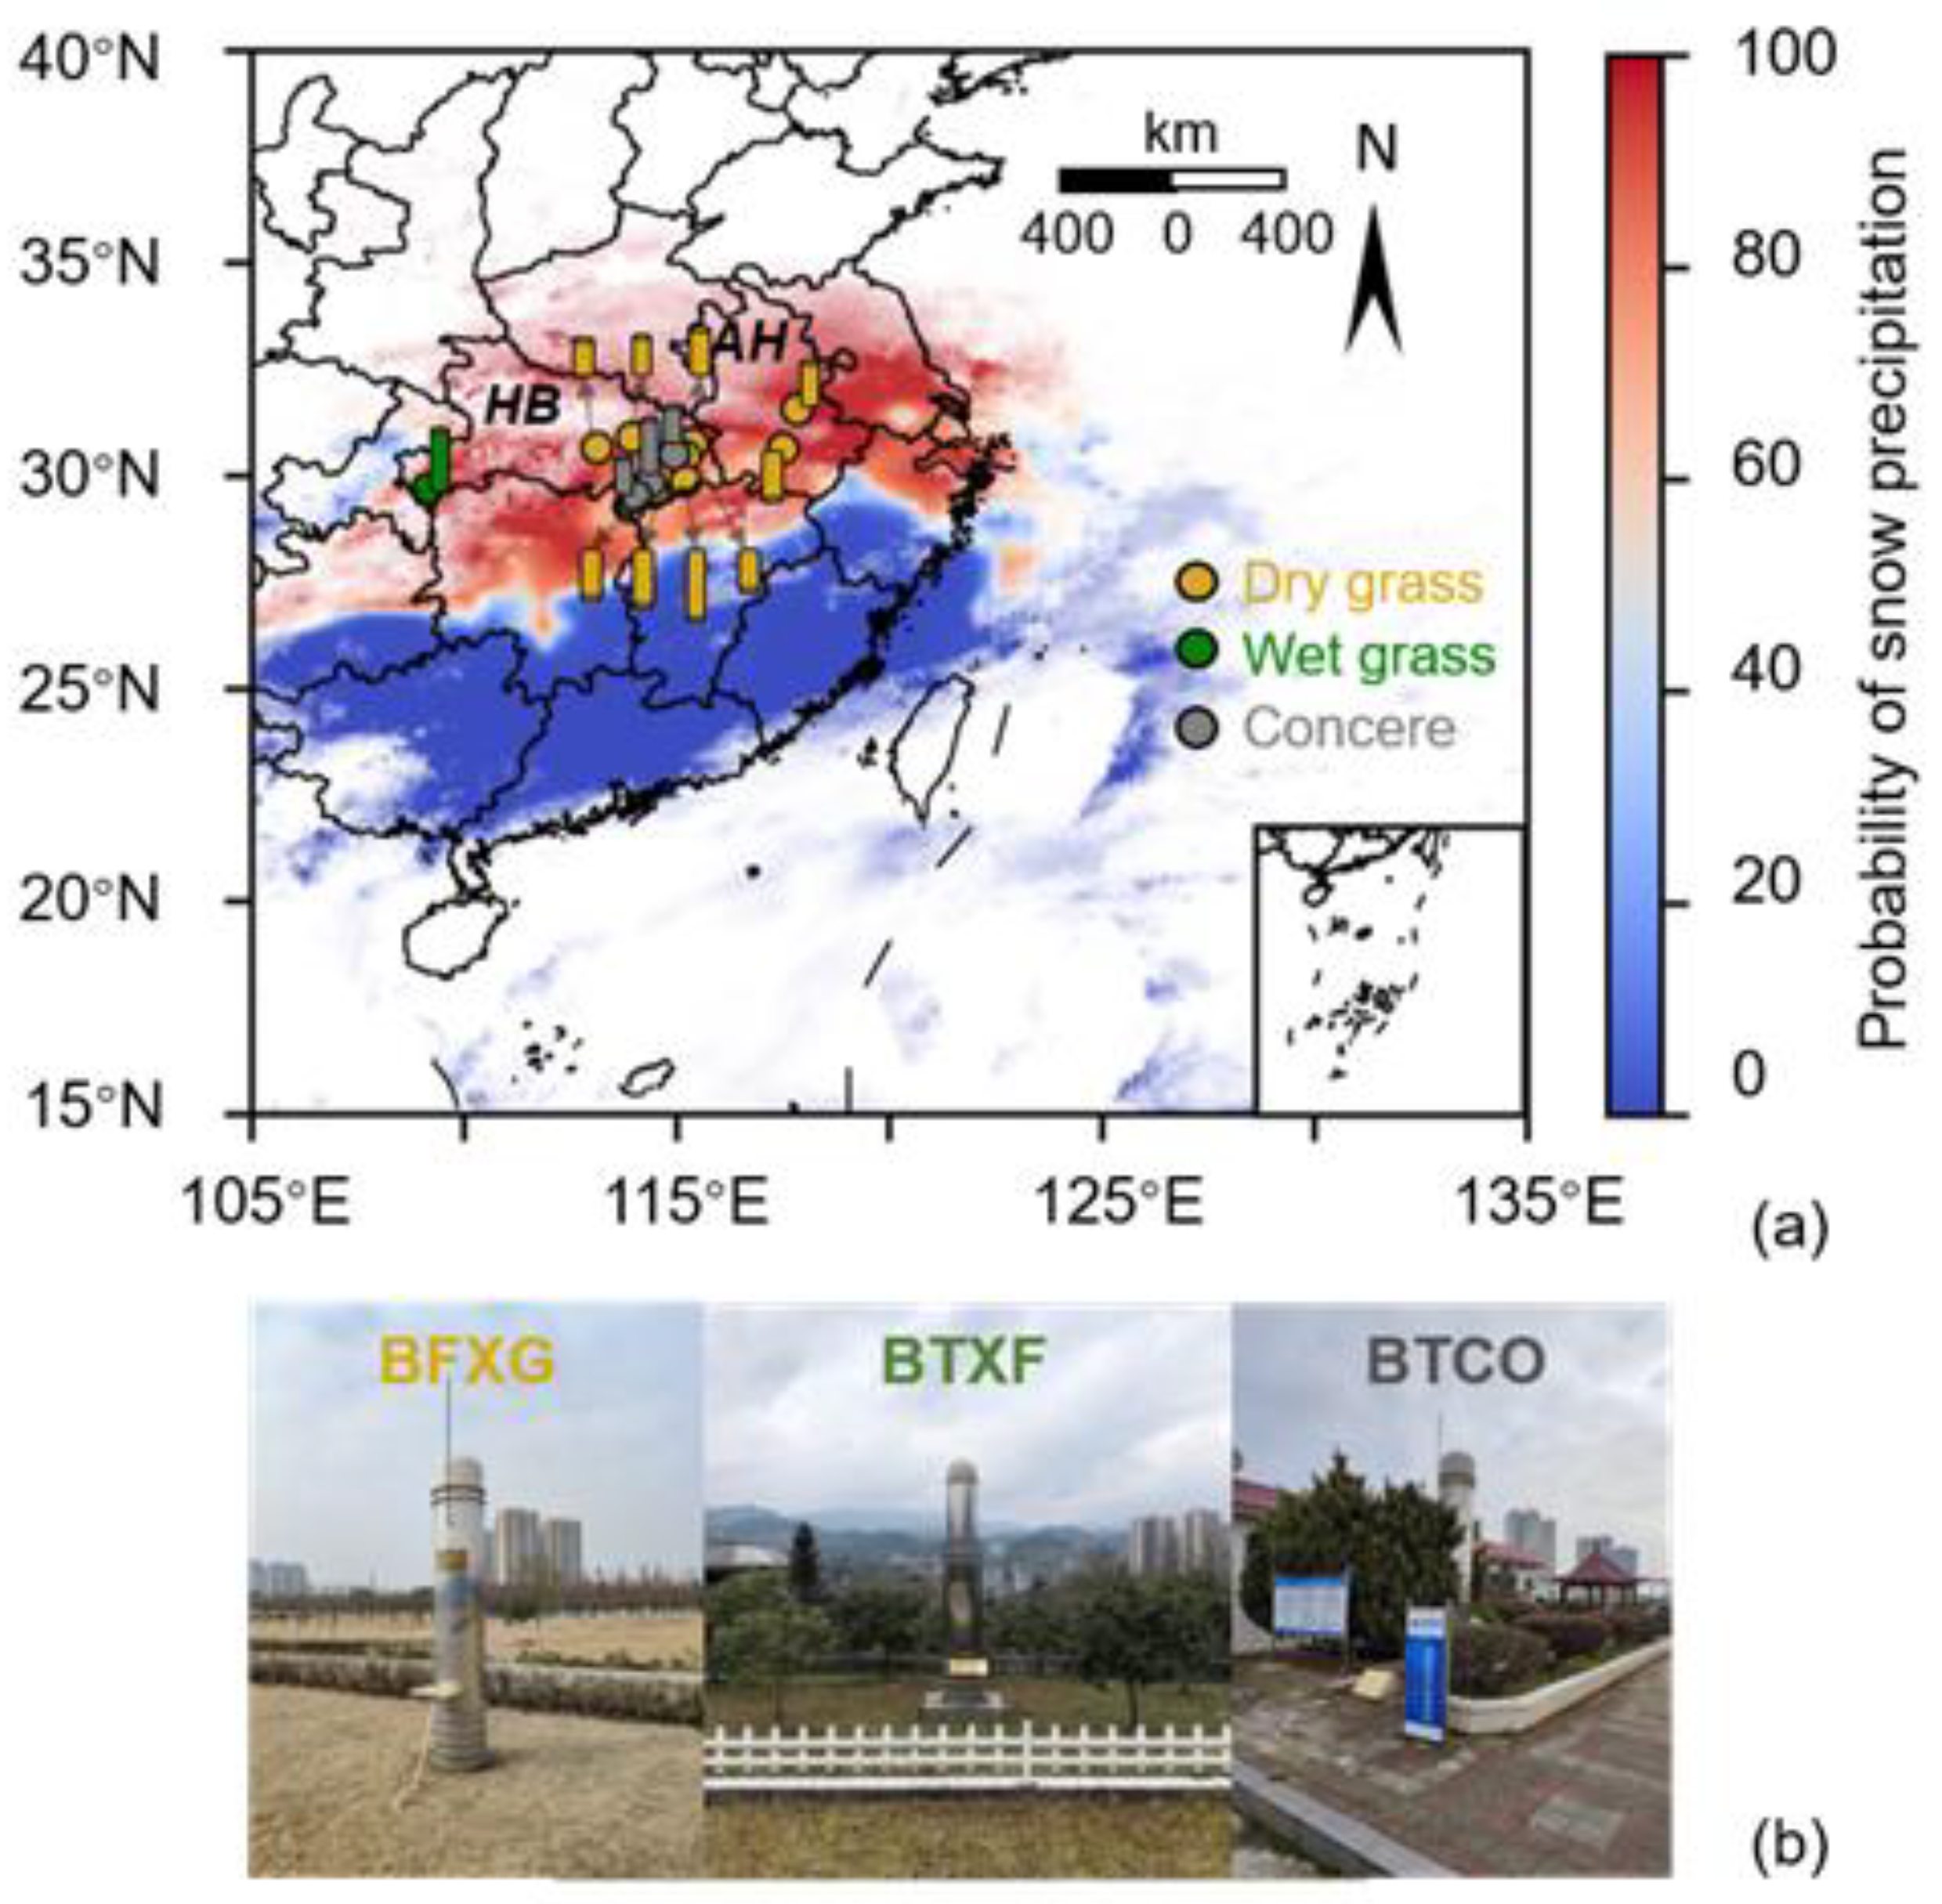
2.1. Study Area and Data

The areas affected by the southern China snowstorm that occurred on 6~8 February, 2022 are shown in Figure 1a. The influenced area was defined by the probability of snow precipitation derived from the Integrated Multi-satellite Retrievals for Global Precipitation Measurement (IMERG) late precipitation Level 3 half-hourly product (23:30~24:00) on 6 February during the storm. As shown in Figure 1a, two provinces, i.e., Hubei and Anhui (29°01′–34°38′N, 108°21′–119°37′E), were within the footprint of the disaster area. Manual measurements from the GNSS sites showed the snow depths ranged from 10 cm to 20 cm.
We derived the GNSS raw data from 37 sites from the operational GNSS/Meteorology (GNSS/MET) network immediately after the event. The GNSS/MET network was built to monitor tropospheric water vapor and was equipped with sensors to measure surface air pressure and temperature. The GNSS/MET receivers set the cut-off elevations to be 5 or 10 degrees to reduce the multipath (reflected signal) effects, which are not favorable for GNSS-IR applications. We analyzed the data quality using the rigorous rule defined in the previous study [3] to determine suitable sites for snow depth retrieval, and 13 sites were satisfactory for conducting the following experiments. Eleven sites were located in Hubei province, while the other two were in Anhui province. Detailed information about the sites is shown in Table 1. The daily mean temperatures of the sites were between 0 and 5 °C on 1~8 February, with the minimum (0 °C) and maximum (3 °C) occurring on 7 February.
As shown in Table 1, eleven sites had GPS L1 and L2 observations, while two sites, i.e., “CHCH” and “CZCZ”, had Galileo E1 observations besides GPS L1 and L2. The cut-off elevation angle set in the receivers of the Sites “CHCH” and “CZCZ” was 10°, while the others were set at 5°. The sites recorded data with a 30 s sampling interval. During the snowstorm event, the sites had three different ground surface substances (Figure 1b), i.e., nine sites were with dry grass, one with wet grass, and another three with a concrete surface. The different ground surface substances during the snowstorm can be verified from the photos of the sites.
Soil component and soil moisture data were also derived as auxiliary data to estimate the penetration depth of GNSS signals through the soil layer. The soil component data were downloaded from the China Soil Science Database (http://vdb3.soil.csdb.cn/, accessed on February 2022). The mean volumetric soil moisture (VSM) data in February were derived from the in situ observations of nearby soil sensors. There are no laser snow depth sensors over this region, and the in situ snow depths used for comparison were from manual measurements by steel rulers provided by the local meteorological offices. The measurements were executed three times a day near the GNSS sites.

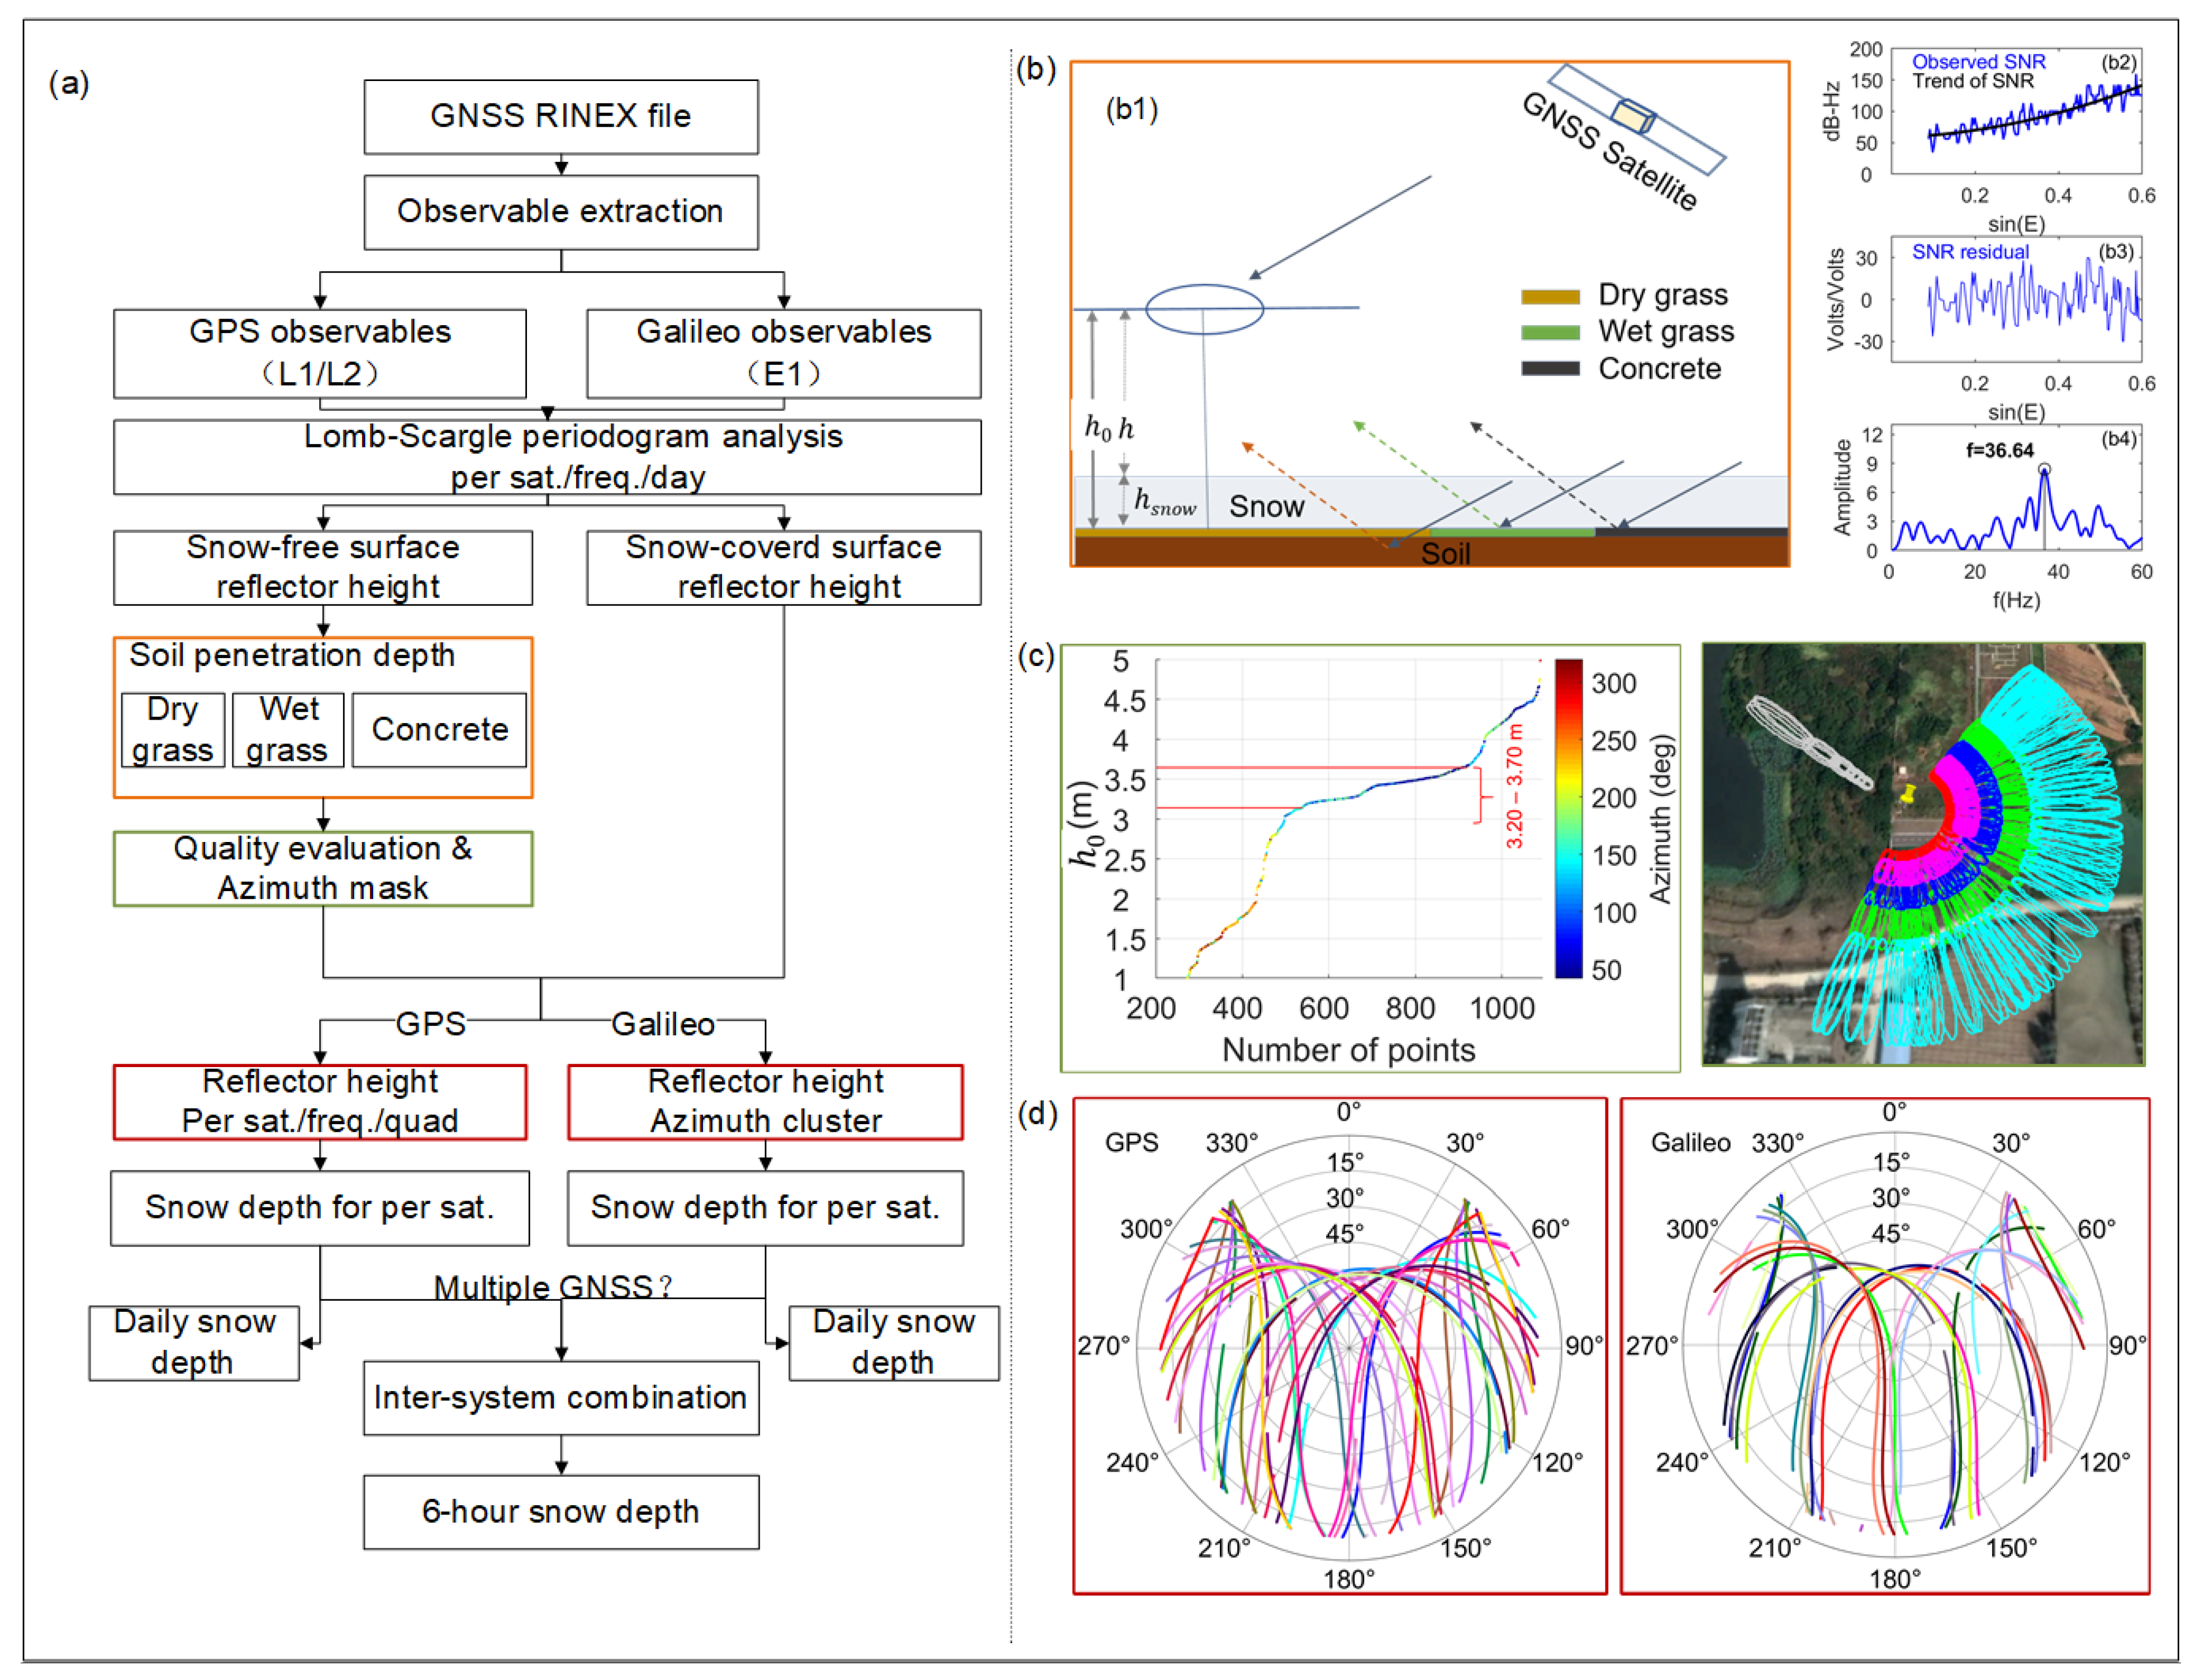
2.2. Methods of Snow Depth Retrieval

The signals transmitted by GNSS satellites arrived at the antenna from two paths, i.e., the direct path and the path from the reflector. The reflected signals had an excess time delay compared with the direct signals which was related to antenna height. This study used the Signal-to-Noise Ratio (SNR) model proposed by [8] to estimate snow depth. The SNR model was used to develop the snow depth products using the operational Plate Boundary Observatory (PBO) GNSS sites [15]. We used a second-order polynomial to remove the trend of SNR, as shown in Figure 2(b2). The remaining detrended SNR shows the interference pattern between the direct and reflected signal (Figure 2(b3)). The dominant frequency ( f ) was derived by the Lomb–Scargle periodogram of the SNR time series sampled by the sine of elevation angle, as shown in Figure 2(b4). The reflector height of a snow-free or snow-covered surface was calculated using the following equation:
h = λ f 2
The snow depth ( h s n o w ) was calculated by the height difference between the snow-free surface ( h 0 ) and snow-covered surface ( h ):
h s n o w = h 0 h
In this study, the SNR observations from all available GNSS bands (i.e., GPS L1, L2, and Galileo E1) during the event were used for snow depth calculation. The reflector heights of one month, i.e., November 2021, were used as the reference height.
The flow chart of data processing is shown in Figure 2a. Several specific issues should be considered during the procedure. First, the quality of the reference reflector height should be controlled to make it accurate. Second, the penetration depths of the ground surface substances should be removed while calculating the reference reflector heights for the snow-free surface. Third, the non-repeatable Galileo tracks should be processed separately to eliminate the terrain effects. Finally, the GPS and Galileo data are combined to derive the 6 h resolution snow depths. The following Section 2.2.1, Section 2.2.2, Section 2.2.3, and Section 2.2.4 give detailed descriptions of the above issues.

2.2.1. Quality Control of the Reference Reflector Height

A two-step process was executed to control the quality of the reference reflector height from the snow-free surfaces, i.e., h 0 . First, as shown in the left box of Figure 2c, the raw height values were sorted, and a relatively “flat” section of the h 0 was manually interpreted to be valid values. Taking the sequence of reflector heights of Site “BFCO” as an example, as shown in Figure 2c, the valid h 0 was recognized as 3.20~3.70 m out of the full range of 1~5 m. Those invalid values were due to the incorrect peaks of the Lomb-Scargle periodograms.
Second, azimuth masks were used to exclude satellite tracks located in directions that had complex natural conditions. For example, for Site “BFCO”, the valid h 0 values gathered in certain azimuths (0~225°), as shown in the colored azimuths and the Google map in Figure 2c. The gray azimuths represent the invalid h 0 values that were removed by the azimuth mask. Note that the valid azimuth range of a given site may contain discontinuity. Height calculations of the snow-free surface and snow-covered surface were all based on the results of the azimuth masking.

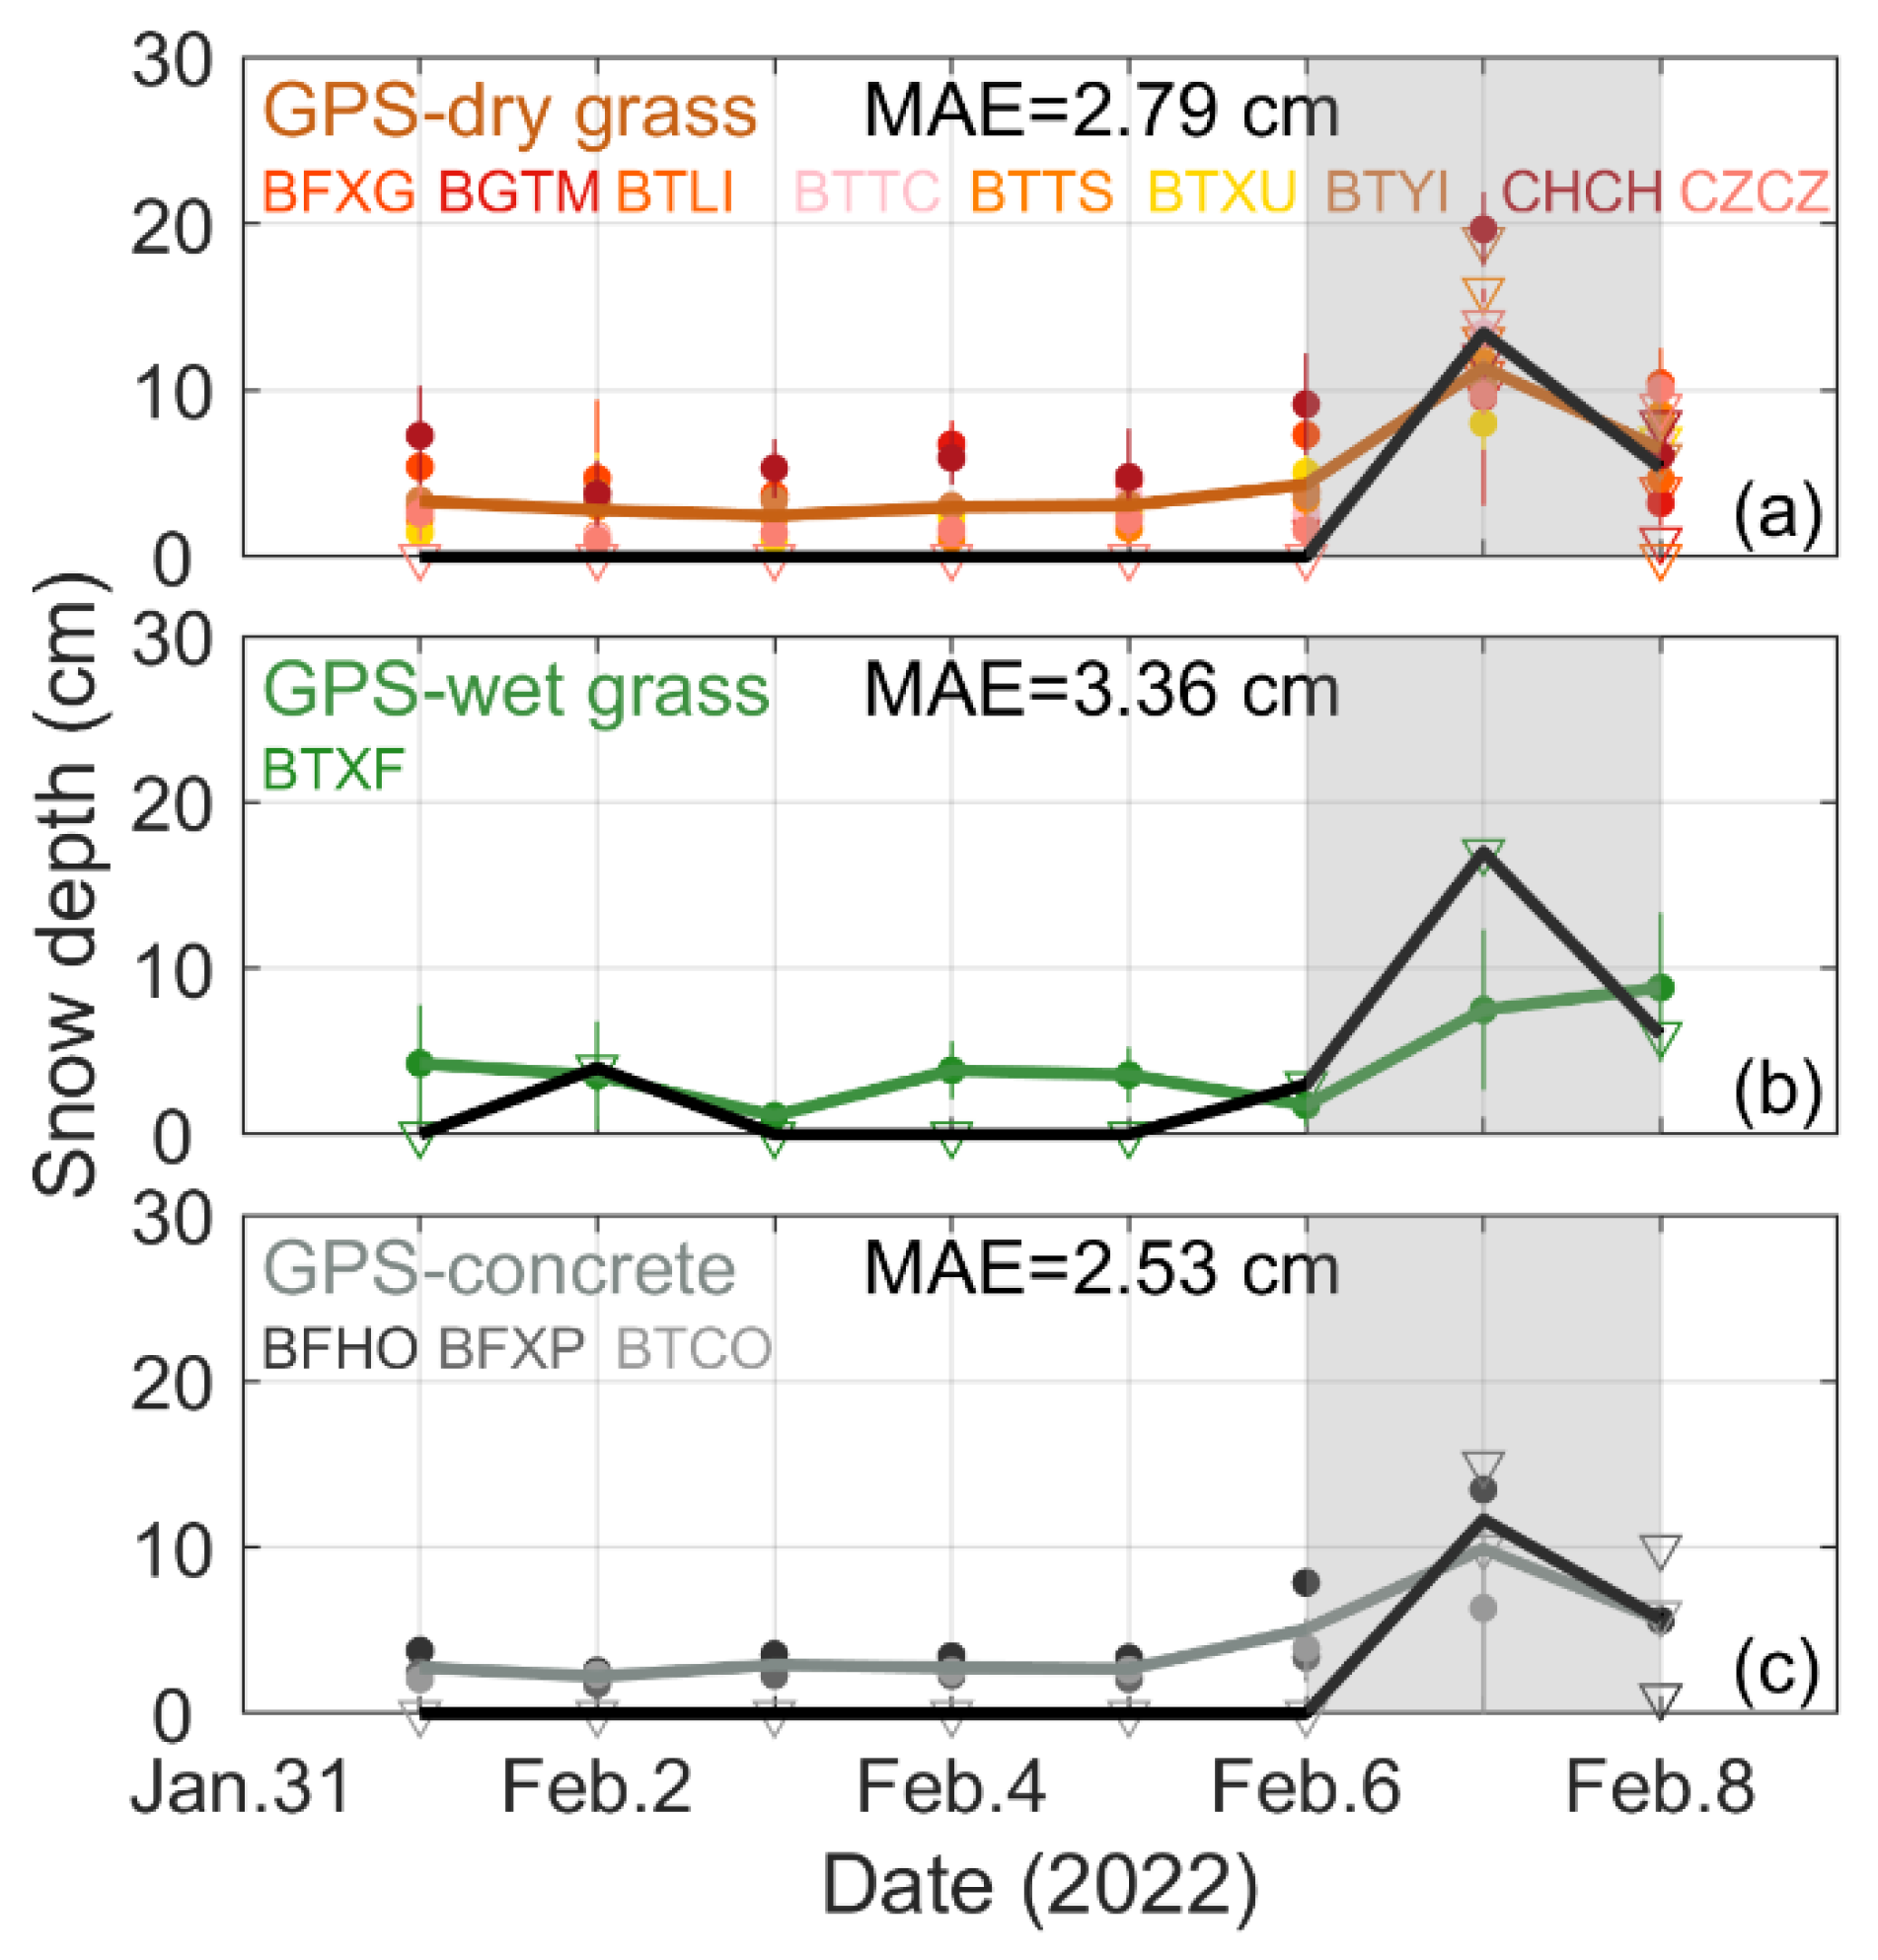
2.2.2. Determination of the Soil Penetration Depth of Different Surface Conditions

The soil penetration depth of the L-band GNSS signal influences the reflector height of the snow-free surface. Different surface conditions perform different penetration depths. In February, the warm climate in southern China made the ground surface environment complicated. In this study, unlike the solution presented in [27], which treated the soil penetration depth as a constant value of 2.5 cm, we used a more objective solution to address this issue. Interpreted using Google maps and the station photos, as shown in Table 1, the ground surface substances of the 13 GNSS sites during the snowstorm were divided into three categories: dry grass, wet grass, and concrete.
For the dry grass sites, we calculated the soil penetration depth using the method presented in [3]. The depth was dependent on the GNSS signal wavelength and the soil permittivity. The influence factors of the latter were soil components and soil moisture. In this study, the soil component data were obtained from the China Soil Science Database for the approximate values. The soil moisture of each site was from the in situ observations of nearby soil sensors. The results show that the majority of the dry grass sites had a shallow penetration of 2~3 cm because of the relatively high VSMs. For eliminating the known source of errors, the penetration depths should be removed while calculating the reference reflector heights for the snow-free surface, although this 2~3 cm compensation was similar to the error bars.
For the wet grass sites, since the vegetation water content weakens the penetration of the underlying soil [28], in this study, we defined the penetration depths as 0 cm. For the concrete sites, we also defined the penetration depths as 0 cm.

2.2.3. Considerations of the Non-Repeatable Galileo Tracks to Eliminate Terrain Effects

The satellite trajectories of GPS and Galileo are shown in Figure 2d. Unlike GPS, which has a repeatable period of about 12 h, Galileo satellites have non-repeatable ground tracks, i.e., 17 repeating times every ten days. For GPS, the snow depth for each satellite, each quadrant, and each frequency was obtained by the difference between snow-free and snow-covered days, while for Galileo, to minimize the error caused by terrain effects and to keep as many available satellite tracks as possible, the tracks of 10-degree azimuths were clustered, and the snow depths were derived cluster by cluster.

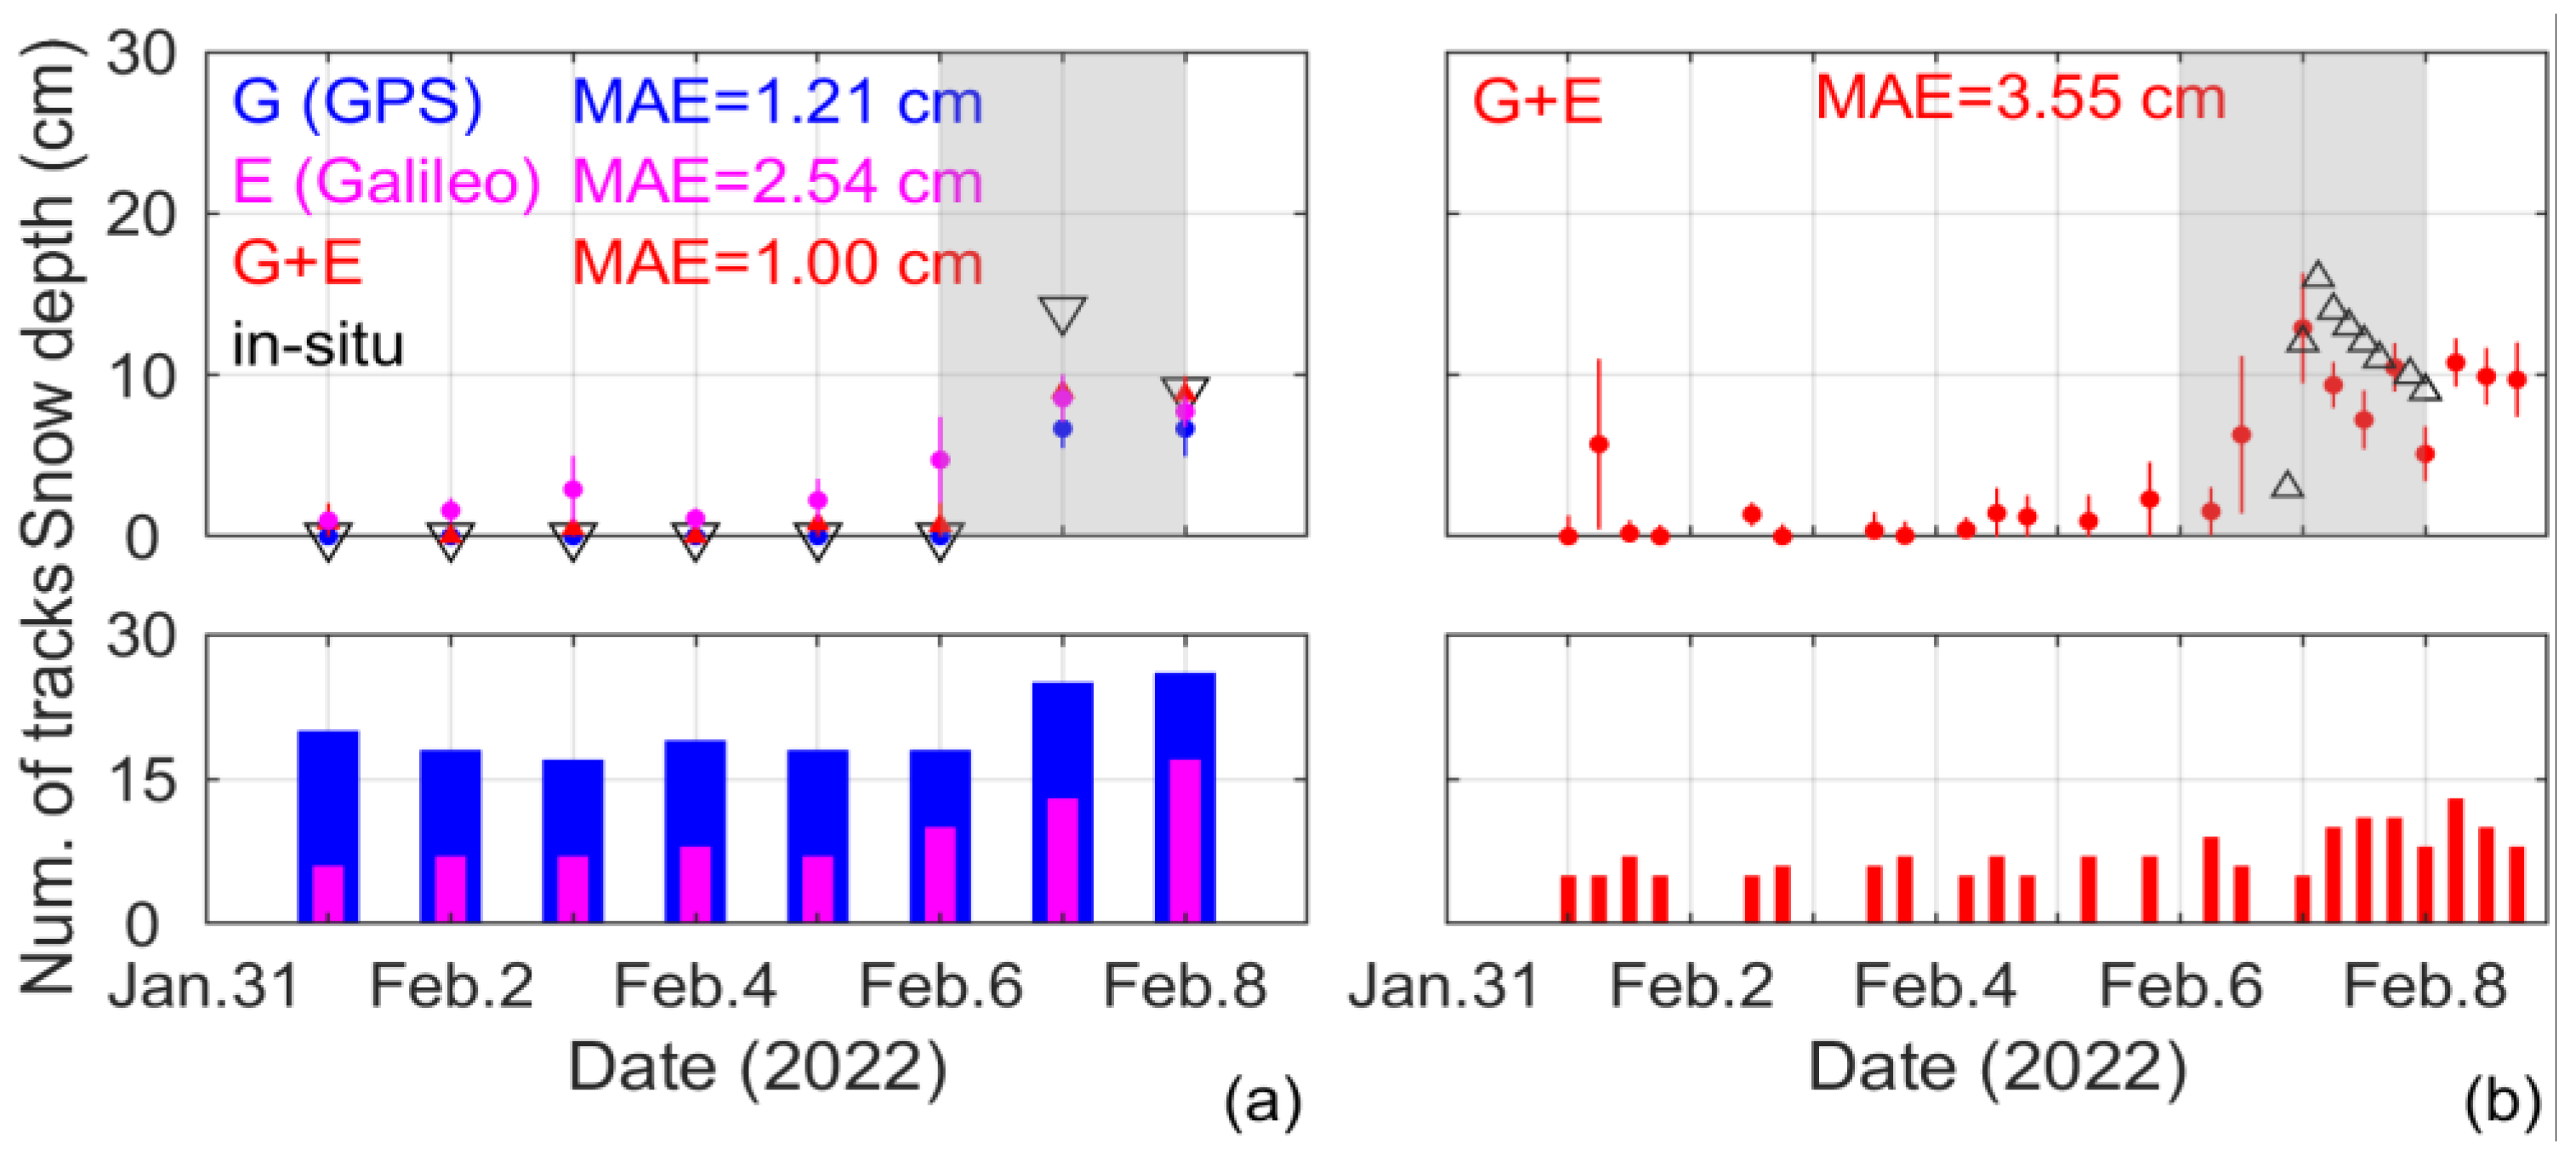
2.2.4. Estimation of 6-h Resolution Snow Depths

The GPS- and Galileo-compatible observations for Site “CZCZ” were used to further derive snow depth with a finer resolution of 6 h. First, intra-system clustering was executed according to the observation time of each snow depth item, as described in Section 2.2.3. Second, the average of all available GPS and Galileo tracks during the 6 h time window was calculated as the final GPS + Galileo snow depth.

3. Results and Discussion

3.1. General Responses to the Snowstorm Event

The daily snow depth results were divided into three groups according to the classification (i.e., dry grass, wet grass, and concrete), as shown in Figure 3. All three groups showed good agreement against the in situ measurements, with Mean Absolute Error (MAE) of 2.79 cm, 3.36 cm, and 2.53 cm, respectively. For the current GNSS-IR technology, because 5 cm was the acknowledged accuracy [3,20] and obtaining correct retrieval results for snow-free days was difficult [29], the MAE was also calculated by the percentage of the mean value for days with snow depths greater than 5 cm. The percentage MAE for the dry grass, wet grass, and concrete was 26.8%, 53.7%, and 35.0%, respectively. Compared to the dry grass and concrete groups, the wet grass site, i.e., BTXF, showed relatively poorer MAE because of the vegetation effect. During the snow-free period before the snowstorm, i.e., Feb. 1~5, the estimated snow depth values were not zeros, which measured the slight height variations of the ground. The model cannot achieve zero snow depths unless a threshold is used to define a snow-free period; this is not appropriate for a sudden snowstorm. During the snowstorm on Feb. 6~8, the GNSS-derived snow depths were generally lower than the measured snow depth. While using the steel ruler to measure the snow depth, they measured the height from the snow surface to the ground, regardless of the surface condition; this probably caused biases between the GNSS and the in situ measurements.

3.2. Detailed Responses to the Snowstorm Event Using the 6-Hour Data

Site “CZCZ” was chosen to test a 6 h time resolution snow depth calculation because it had GPS/Galileo-compatible observables and had adequate available satellite tracks. Figure 4a shows the daily mean snow depth results, respectively, for GPS, Galileo, and GPS + Galileo combinations, with MAE = 1.21 cm, 2.54 cm, and 1.00 cm. The percentage MAE when snow depths are >5 cm for GPS, Galileo, and GPS + Galileo combinations is 42.0%, 29.3%, and 25.0%, respectively. The GPS + Galileo combinations had the best performance mainly due to the largest number of tracks used for calculating the average. The accuracy of the Galileo estimates was relatively better than the GPS estimates due to its smaller code chipping period. Figure 4b shows the 6 h mean snow depth results using GPS and Galileo combinations. The number of tracks lower than 5 for a certain 6 h period is excluded from the calculation. In general, the GNSS result shows a consistent trend with the in situ measurements, with some points having large standard errors due to the low number of valid tracks.

3.3. Advantages and Limitations of the Data and Methods

This study shows that GNSS-IR helps to fill in the gaps of the snow depth products during snowstorms in high spatial–temporal resolution and high accuracy. However, several limitations of the data methods are described as follows:
(1) Due to data limitations, this study presents only one snowstorm event to validate the effectiveness of the proposed technological framework. With more similar events, one would get a better idea of the performance of the methods. Future research will continue to collect and test the methods on more events to give more comprehensive evaluations.
(2) The GNSS/MET network is not explicitly designed for GNSS-IR application, and the data quality was greatly affected by the environmental factors around the site. Only one-third (13 out of 37) of the GNSS/MET sites initially met the conditions for snow depth retrieval, which is a relatively small data source to show the performance of the proposed framework.
(3) The snow depth accuracy was highly affected by signal quality and the number of satellite tracks, especially for the 6 h results. Moreover, the method may accidentally discard those cross-day Galileo tracks. An automatic technological framework should be rigorously defined if the method in this study is used in the operational meteorological observation system in the future.

4. Conclusions

This study proposed a framework to estimate daily and 6 h snow depths during a snowstorm event using 8-day data from 13 operational GNSS/MET stations. A rigorous rule was defined to consider the effects of ground surface substances and the GNSS data quality while estimating the snow depths. The daily snow depths retrieved from different surfaces, i.e., dry grass, wet grass, and concrete, had good agreement with the measured snow depth, with MAE of 2.79 cm, 3.36 cm, and 2.53 cm, respectively. The percentage MAE with snow depths >5 cm for the three ground surface substances was 26.8%, 53.7%, and 35.0%, respectively. The finer resolution of 6 h snow depth results also showed swift and significant responses to the event.
Although the data analysis for only one snowstorm event was shown in this study, the results prove the potential of using GNSS-IR as a new tool in the operational meteorological observation system to monitor snow disasters. The proposed framework was remarkably efficient and cost-effective for real-time and accurate monitoring in regions with a complicated natural environment. With further development of the global GNSS systems, the GNSS signals will be more widely used in rapid responses to snow disasters.

Author Contributions

Conceptualization, H.L. and W.W.; methodology, J.Z. and W.W.; validation, J.Z. and S.L.; resources, H.L. and W.W.; writing—original draft preparation, J.Z.; writing—review and editing, W.W., S.L., H.L., Z.G. and B.L.; supervision, H.L. and W.W.; funding acquisition, W.W., and H.L. All authors have read and agreed to the published version of the manuscript.

Funding

This research is supported by the National Natural Science Foundation of China (NSFC) project (Grant No. 41971377), the observing experiment project of Meteorological Observation Center of China Meteorological Administration (No. SY2020005), and the open fund of the National Earth Observation Data Center (No. NODAOP2021002).

Acknowledgments

The authors are grateful to the CMA for providing the GNSS raw data and in situ data in this study. The authors are also grateful to the IMERG team for archiving and providing the data used in this study.

Conflicts of Interest

The authors declare no conflict of interest.

References

  1. Gao, J. Analysis and assessment of the risk of snow and freezing disaster in China. Int. J. Disaster Risk Reduct. 2016, 19, 334–340. [Google Scholar] [CrossRef]
  2. Zhang, X.; Wang, K.; Boehrer, B. Variability in observed snow depth over China from 1960 to 2014. Int. J. Climatol. 2021, 41, 374–392. [Google Scholar] [CrossRef]
  3. Wan, W.; Zhang, J.; Dai, L.; Liang, H.; Liu, B.; Guo, Z.; Hu, H.; Yang, T.; Zhao, L. A new snow depth data set over northern China derived using GNSS interferometric reflectometry from a continuously operating network (GSnow-CHINA v1.0, 2013-2022). Earth Syst. Sci. Data 2022, 14, 3549–3571. [Google Scholar] [CrossRef]
  4. Cardellach, E.; Fabra, F.; Rius, A.; Pettinato, S.; D’Addio, S. Characterization of dry-snow sub-structure using GNSS reflected signals. Remote Sens. Environ. 2012, 124, 122–134. [Google Scholar] [CrossRef]
  5. Rodriguez-Alvarez, N.; Camps, A.; Vall-Llossera, M.; Bosch-Lluis, X.; Monerris, A.; Ramos-Perez, I.; Valencia, E.; Marchan-Hernandez, J.F.; Martinez-Fernandez, J.; Baroncini-Turricchia, G. Land geophysical parameters retrieval using the interference pattern GNSS-R technique. IEEE Trans. Geosci. Remote Sens. 2010, 49, 71–84. [Google Scholar] [CrossRef]
  6. Rodriguez-Alvarez, N.; Aguasca, A.; Valencia, E.; Bosch-Lluis, X.; Camps, A.; Ramos-Perez, I.; Park, H.; Vall-Llossera, M. Snow thickness monitoring using GNSS measurements. IEEE Geosci. Remote Sens. Lett. 2012, 9, 1109–1113. [Google Scholar] [CrossRef]
  7. Larson, K.M.; Braun, J.J.; Small, E.E.; Zavorotny, V.U.; Gutmann, E.D.; Bilich, A.L. GPS multipath and its relation to near-surface soil moisture content. IEEE J. Sel. Top. Appl. Earth Obs. Remote Sens. 2009, 3, 91–99. [Google Scholar] [CrossRef]
  8. Larson, K.M.; Gutmann, E.D.; Zavorotny, V.U.; Braun, J.J.; Williams, M.W.; Nievinski, F.G. Can we measure snow depth with GPS receivers? Geophys. Res. Lett. 2009, 36. [Google Scholar] [CrossRef]
  9. Nievinski, F.G.; Larson, K.M. Inverse modeling of GPS multipath for snow depth estimation—Part I: Formulation and simulations. IEEE Trans. Geosci. Remote Sens. 2014, 52, 6555–6563. [Google Scholar] [CrossRef]
  10. Nievinski, F.G.; Larson, K.M. Inverse modeling of GPS multipath for snow depth estimation—Part II: Application and validation. IEEE Trans. Geosci. Remote Sens. 2014, 52, 6564–6573. [Google Scholar] [CrossRef]
  11. Yu, K.; Ban, W.; Zhang, X.; Yu, X. Snow depth estimation based on multipath phase combination of GPS triple-frequency signals. IEEE Trans. Geosci. Remote Sens. 2015, 53, 5100–5109. [Google Scholar] [CrossRef]
  12. Ozeki, M.; Heki, K. GPS snow depth meter with geometry-free linear combinations of carrier phases. J. Geod. 2012, 86, 209–219. [Google Scholar] [CrossRef]
  13. Zhou, W.; Liu, L.; Huang, L.; Yao, Y.; Chen, J.; Li, S. A new GPS SNR-based combination approach for land surface snow depth monitoring. Sci. Rep. 2019, 9, 3814. [Google Scholar] [CrossRef] [PubMed]
  14. Yu, K.; Li, Y.; Chang, X. Snow depth estimation based on combination of pseudorange and carrier phase of GNSS dual-frequency signals. IEEE Trans. Geosci. Remote Sens. 2018, 57, 1817–1828. [Google Scholar] [CrossRef]
  15. Larson, K.M.; Nievinski, F.G. GPS snow sensing: Results from the EarthScope Plate Boundary Observatory. GPS Solut. 2013, 17, 41–52. [Google Scholar] [CrossRef]
  16. Qian, X.; Jin, S. Estimation of snow depth from GLONASS SNR and phase-based multipath reflectometry. IEEE J. Sel. Top. Appl. Earth Obs. Remote Sens. 2016, 9, 4817–4823. [Google Scholar] [CrossRef]
  17. Tabibi, S.; Geremia-Nievinski, F.; van Dam, T. Statistical comparison and combination of GPS, GLONASS, and multi-GNSS multipath reflectometry applied to snow depth retrieval. IEEE Trans. Geosci. Remote Sens. 2017, 55, 3773–3785. [Google Scholar] [CrossRef]
  18. Zhou, W.; Liu, L.; Huang, L.; Li, J.; Chen, J.; Chen, F.; Xing, Y.; Liu, L. Monitoring snow depth based on the SNR signal of GLONASS satellites. J. Remote Sens 2018, 22, 889–899. [Google Scholar]
  19. Li, Y.; Chang, X.; Yu, K.; Wang, S.; Li, J. Estimation of snow depth using pseudorange and carrier phase observations of GNSS single-frequency signal. GPS Solut. 2019, 23, 118. [Google Scholar] [CrossRef]
  20. Zhang, Z.; Guo, F.; Zhang, X. Triple-frequency multi-GNSS reflectometry snow depth retrieval by using clustering and normalization algorithm to compensate terrain variation. GPS Solut. 2020, 24, 52. [Google Scholar] [CrossRef]
  21. Yang, G.; Bai, W.; Wang, J.; Hu, X.; Zhang, P.; Sun, Y.; Xu, N.; Zhai, X.; Xiao, X.; Xia, J.; et al. FY3E GNOS II GNSS Reflectometry: Mission Review and First Results. Remote Sens. 2022, 14, 988. [Google Scholar] [CrossRef]
  22. Wan, W.; Liu, B.; Zeng, Z.; Chen, X.; Wu, G.; Xu, L.; Chen, X.; Hong, Y. Using CYGNSS data to monitor China’s flood inundation during typhoon and extreme precipitation events in 2017. Remote Sens. 2019, 11, 854. [Google Scholar] [CrossRef]
  23. Chew, C.; Reager, J.T.; Small, E. CYGNSS data map flood inundation during the 2017 Atlantic hurricane season. Sci. Rep. 2018, 8, 9336. [Google Scholar] [CrossRef] [PubMed]
  24. Yang, W.; Gao, F.; Xu, T.; Wang, N.; Tu, J.; Jing, L.; Kong, Y. Daily Flood Monitoring Based on Spaceborne GNSS-R Data: A Case Study on Henan, China. Remote Sens. 2021, 13, 4561. [Google Scholar] [CrossRef]
  25. Wang, X.; Zhang, S.; Wang, L.; He, X.; Zhang, Q. Analysis and combination of multi-GNSS snow depth retrievals in multipath reflectometry. GPS Solut. 2020, 24, 77. [Google Scholar] [CrossRef]
  26. Wang, X.; He, X.; Xiao, R.; Song, M.; Jia, D. Millimeter to centimeter scale precision water-level monitoring using GNSS reflectometry: Application to the South-to-North Water Diversion Project, China. Remote Sens. Environ. 2021, 265, 112645. [Google Scholar] [CrossRef]
  27. Liu, S.; Zhang, J.; Wan, W.; Liang, H.; Liu, B.; Guo, Z. A comprehensive evaluation of utilizing BeiDou data to estimate snow depth from two ground-based stations. GPS Solut. 2022, 26, 118. [Google Scholar] [CrossRef]
  28. Wan, W.; Larson, K.M.; Small, E.E.; Chew, C.C.; Braun, J.J. Using geodetic GPS receivers to measure vegetation water content. GPS Solut. 2015, 19, 237–248. [Google Scholar] [CrossRef]
  29. Hu, Y.; Yuan, X.; Liu, W.; Hu, Q.; Wickert, J.; Jiang, Z. An SVM-based snow detection algorithm for GNSS-R snow depth retrievals. IEEE J. Sel. Top. Appl. Earth Obs. Remote Sens. 2022, 15, 6046–6052. [Google Scholar] [CrossRef]
Figure 1. The study area and the locations of the GNSS/MET sites. (a) Distribution of the GNSS sites and their ground surface substances; HB: Hubei; AH: Anhui. The areas affected by the snowstorm were defined by the probability of snow precipitation derived from the IMERG late precipitation L3 half-hourly product (23:30~24:00) on 6 February. The in situ snow depths for individual sites on 6 February are illustrated by bars. (b) Photos of typical GNSS sites with three ground surface substances. “BFXG”: dry grass, “BTXF”: wet grass, “BTCO”: concrete.
Remotesensing 14 04530 g001
Figure 2. Flowchart of the data processing. (a) Flowchart of snow depth estimation. (b) Observation geometry and the principle of the SNR model. (b1) Basic geometry. (b2) Observed SNR and the trend of SNR, taking DOY 32 of Site “BFHO” as an example. The trend was estimated by fitting observed SNR by a second-order polynomial. (b3) Interference pattern between direct and reflected GNSS signal. (b4) Lomb-Scargle periodogram with the dominant frequency. (c) Quality evaluation and azimuth mask, taking DOY 37 of Site “BFHO” as an example. Left: initial determination of h 0 . Right: the footprints (Fresnel zones) used after the azimuth mask. Different colors indicate the footprints for elevation angles of 10°, 15°, 20°, 25°, and 30°, respectively. The gray azimuths are invalid. (d) The satellite trajectory of GPS and Galileo, taking DOY32 of Site “CZCZ” as an example. The cut-off elevation angle in (d) is 10°.
Remotesensing 14 04530 g002
Figure 3. Comparisons of the GNSS-derived snow depths and the in situ measurements for the three groups with different surface conditions. (a) Dry grass. (b) Wet grass. (c) Concrete. The snow depth values for each site are the same color. GNSS-derived snow depth is marked with a solid circle, and the in situ snow depth is marked with a triangle. The colored line is the daily mean value of the GNSS results for multiple sites. The black line is the daily mean value of measured snow depth for the corresponding sites. The error bars are defined as the standard errors of all of the available tracks. Some small error bars are hidden behind the markers.
Remotesensing 14 04530 g003
Figure 4. The daily and 6 h snow depth results for Site “CZCZ”. (a) Daily results of GPS (G), Galileo (E), and GPS + Galileo combinations (G + E). (b) The 6 h G + E results. The error bars are defined as the standard errors of all of the available tracks.
Remotesensing 14 04530 g004
Table 1. Detailed information of the 13 GNSS sites used in this study.
IdSiteProvinceLat.Lon.Alt.GNSS BandCut-off Elev. AngleSurface Condition during the SnowstormMean VSM * in Feb., 2022Approx. Antenna Height
(Deg., N)(Deg., E)(m)(Deg.)(cm3.cm−3)(m)
1BFXGHubei30.9113.9527.23L1, L25dry grass0.423.3
2BGTMHubei30.67113.1335.74L1, L25dry grass0.393.6
3BTLIHubei30.75115.4128.17L1, L25dry grass0.453.8
4BTTSHubei29.61114.46104.64L1, L25dry grass0.343.8
5BTXUHubei30.47115.2271.17L1, L25dry grass0.403.7
6BTYIHubei29.9115.2262.2L1, L25dry grass0.383.5
7CHCHAnhui31.58117.8336.13L1, L2, E110dry grass0.435.2
8CZCZAnhui30.65117.5123.15L1, L2, E110dry grass0.483.8
9BTTCHubei29.27113.88150L1, L25dry grass0.383.4
10BFHOHubei30.51114.9429.7L1, L25concrete0.383.4
11BFXPHubei29.85114.37100.97L1, L25concrete0.293.7
12BTCOHubei29.54114.0483.12L1, L25concrete0.433.9
13BTXFHubei29.68109.14780.68L1, L25wet grass0.322.8
* VSM: volumetric soil moisture.
Publisher’s Note: MDPI stays neutral with regard to jurisdictional claims in published maps and institutional affiliations.

