Article

Analysis and Demonstration of First Cross-Support Interferometry Tracking in China Mars Mission

1
National Key Laboratory of Science and Technology on Aerospace Flight Dynamics, Beijing Aerospace Control Center, Beijing 100094, China
2
National Astronomical Observatories, Chinese Academy of Sciences, Beijing 100101, China
*
Author to whom correspondence should be addressed.
Remote Sens. 2022, 14(16), 4117; https://doi.org/10.3390/rs14164117
Submission received: 28 June 2022 / Revised: 12 August 2022 / Accepted: 18 August 2022 / Published: 22 August 2022
(This article belongs to the Special Issue Recent Progress and Applications on Multi-Dimensional SAR)

Abstract

:
Delta-Differential One-Way Ranging (DeltaDOR) is widely used in deep spacecraft navigation, and cross support could enhance navigation accuracy with more interferometry baselines and longer baseline. In China Mars mission Tianwen-1, formal joint cross-support interferometry tracking between China Satellite Launch and TT&C General (CLTC) and European Space Operations Center (ESOC) under commercial contract was conducted around the critical stages of the mission, such as Mars orbit insertion. Cross-support interferometry is a new challenge to CLTC, as the correlator for routine DeltaDOR measurements do not fit for cross support, because of observable definition, blind station clock searching, and so on. This paper discusses the new method and algorithm adopted in joint cross support, especially for spacecraft tone signal processing and clock estimation when correlating with the data of two stations from different agencies. Results of the cross-support interferometry tracking activities are also analyzed. Observables from CLTC and ESOC are consistent with each other, and the difference in observables is in the order of tens of ps. All the baselines are induced to evaluate the accuracy of the spacecraft orbit determined and predicted by CLTC, and the DeltaDOR residuals have a root-mean-square (RMS) better than 0.5 ns (the goal is 1 ns), which could enhance the confidence of the orbit accuracy and the effectiveness of control parameters during critical orbit operation.

Graphical Abstract

1. Introduction

Very-Long-Baseline Interferometry (VLBI) was firstly used in radio astronomy, and since the 1970s, it has been introduced in deep spacecraft navigation by differential measurement of angular nearly calibration quasar, which is known as Delta-Differential One-Way Ranging (DeltaDOR) [1,2]. The year 1977 is a keystone in DeltaDOR history, a proposed system that featured a custom signal generator onboard was published, the spacecraft could produce a series of tones for differential one-way ranging [3]. Conventional earth-based tracking technique, ranging and Doppler could precisely measure the distance and velocity along the line of sight between the spacecraft and station; however, they suffered from a poorer ability to take angular measurement. While DeltaDOR is a technique that is highly efficient in determining spacecraft angular position in the plane of sky, it could be used in conjunction with conventional Doppler and ranging data to improve spacecraft navigation [4,5,6]. Taking planet orbit insertion maneuver as a typical scenario, DeltaDOR measurements could ensure more reliability and accuracy in orbit determination than only relying on conventional ranging and Doppler data.
The Deep Space Network (DSN) developed the capability for VLBI measurement, and both the implementation performance and importance to flight projects have evolved over the past several decades [7,8]. Nowadays, the DeltaDOR measurement has matured into the most accurate system of DSN for precise planetary navigation, and DSN has been providing DeltaDOR measurements to a large number of deep space navigation missions with validated performance. The accuracy of routine DeltaDOR by DSN could be about one nanoradian, which represents the state-of-the-art performance of all of worldwide space agencies [9,10,11,12,13]. Other space agencies, including the European Space Agency (ESA) [14,15,16] and Japan Aerospace Exploration Agency (JAXA) [17,18], also developed their own DeltaDOR capabilities and systems. In particular, China Satellite Launch and TT&C General (CLTC) adopted the VLBI measurement in the China Lunar Exploration Project (CLEP) and other deep space exploration projects. Deep space navigation accuracy is obviously improved when combining Unified S/X Band and VLBI. The China VLBI Network (CVN), which was mainly developed for radio astronomy, was firstly induced to support ChangE-2 project, and CVN played an import role in China deep space exploration projects [19,20,21,22]. In order to support China deep space exploration missions, China developed deep space stations Jiamusi and Kashi in 2013, forming a baseline more than 4000 km. Another deep station at Argentina was put into application in 2017 for providing continuous telemetry, tracking, and command (TT&C) and precise navigation services. Since then, China has owned the third-largest worldwide distributed deep space network after NASA and ESA [23,24]. Both DOR and DeltaDOR measurements, with expected accuracy, were adopted in CLTC to support deep spacecraft tracking and navigation [25,26,27].
In principle, the angular position accuracy of DeltaDOR is proportional to baseline length. In addition, from the point of view of orbit determination, navigation accuracy is affected by baseline diversity. For example, in order to determine both components of angular position, a measurement by at least two baselines is required; in the case of orthogonal baselines, the best two-dimensional coverage is provided, so navigation accuracy could be improved [28]. Usually, a single space agency does not own enough tracking stations to provide orthogonal baselines by itself; moreover, multi-tracking and communication missions for different spacecrafts make this limitation worse. Performance of DeltaDOR could be enhanced by intra-agency cooperation, because stations from different agencies can be used as data collectors under the Council of the Consultative Committee for Space Data Systems (CCSDS) standards for deep space navigation purpose. More baselines and longer baselines could acquire a more accurate angular position of the spacecraft [29]. The benefit of combining tracking assets of multiple agencies to provide cross support has been generally recognized by the world community, not only by space agencies but also the astronomy and geodesy communities. Successful joint DeltaDOR interoperability has been tested and validated in several projects by NASA, ESA and other agencies, while excellent results are also obtained as expected in some cross-support operational scenarios [30,31,32]. For example, NASA and ESA conducted the first interoperability validation, in 2007, with Venus Express. Following the successful test, DeltaDOR cooperation has been undertaken for the operational support of Phoenix during cruise and prior to Mars Orbit Insertion. The first three-agency DeltaDOR cooperation was conducted in 2008 by JPL, JAXA and ESA. During the cooperation, spacecraft Hayabusa was observed with four ground antennas, one from ESA, one from JAXA, and the other two from DSN. These successful applications testified that DeltaDOR capabilities could be used for future operational cross support on all interplanetary missions.
China’s first Mars mission, Tianwen-1, is China’s first independent interplanetary mission, which is combined with a series of complex instruments to meet scientific expectations. The probe, a combination of orbiter, lander and rover named Zhurong, launched from Earth aboard a Long March 5 rocket on 23 July 2020. After its seven-month journey to Mars, with a few necessary Trajectory Correction Maneuvers (TCM), Tianwen-1 captured into orbit around Mars in February 2021 (see the flight orbit of Tianwen-1 in Figure 1), and Zhurong successfully landed on 14 May 2021 [33]. So, Tianwen-1 became the first Mars exploration mission in the world which has completed orbiting Mars planet, soft landing, and Mars surface measurement on the planet within one launch.
Before the Tianwen-1 mission, CLTC had no previous project experience on precision interplanetary navigation and orbit insertion in deep space at Mars distance. While arriving at Mars and capturing in orbit require a high degree of precision, it sets a challenge for the tracking and navigation system. Earth-based tracking stations within CLTC are adopted to support navigation and communication of Tianwen-1, mainly including JMS, KSH and ARG deep space stations and China VLBI network stations belonging to Chinese Academy of Sciences. Until now, restricted by the distribution of deep space stations, only the baseline of JMS-KSH has a longer common tracking arc of Tianwen-1, besides, since the tracking antenna must point away from the spacecraft during the time of the quasar observation in DeltaDOR measurements, which causes interruption of the transmission of telemetry data to the ground station. Therefore, in order to make sure the accuracy of orbit determination is good enough for navigation, especially during critical stages of the mission, such as the case on performing an insertion into Mars orbit, CLTC and European Space Operations Center (ESOC) entered into an agreement to conduct cross-support interferometric tracking under a commercial contract. Deep space station KSH of CLTC and deep space antennas CEB and NNO of ESA are involved in conducting the cross-support DeltaDOR measurements. As in this case, telemetry communication could still be supported by the JMS deep space station; furthermore, the baseline CEB-KSH (east–west direction) is approximately perpendicular to baseline NNO-KSH (south–north direction), which will increase confidence to the conventional orbit solutions.
This paper mainly focuses on the techniques developed and applied in CLTC during this first formal cross-support DeltaDOR campaign. In total, there are eight cross-support DeltaDOR measurements in the mission, and six of them are conducted successfully because of an unexpected problem that happened with the CEB station during two campaigns. The six successful measurements data sets are exchanged and transferred to CLTC and ESOC through the Internet for processing and analysis. The observable defined within CLTC is inconsistent with the standard adopted in the ESOC DeltaDOR center. This paper discusses the new method and algorithm adopted in joint cross-support interferometry tracking, especially for spacecraft tone signal processing and clock estimation when correlation with two stations data from different agencies. Based on the above work, observable comparison and navigation accuracy are also evaluated. In Section 1, the authors review the background of this work. Section 2 provides the theorems and methods adopted in data processing. Results of cross-support DeltaDOR measurements are analyzed in detail in Section 3 from the aspect of signal quality, accuracy comparison and navigation accuracy evaluation. In the following section, some discussions are made. Finally, the authors conclude with a summary of the results and suggestions for further work.

2. Theorem and Methods

This section describes the theorem of DeltaDOR in brief, and special data processing algorithms developed for cross support in CLTC are analyzed.

2.1. Basic Theorem of DeltaDOR

VLBI basics are discussed in many references and tutorials [34], wherein a brief theorem of DeltaDOR is described. The observing geometry of DeltaDOR is shown in Figure 2 [35].
VLBI system measures the geometric delay of the signal send from the target, extragalactic quasar or spacecraft, between the two long-distance separated stations. The line connecting the receiving stations is called baseline.
Observable time delay is a function of the known baseline vector and the direction to the target [36].
τ = B · S c = Bcos θ c
where B is baseline vector, and S is the unit vector the target.
Differential observable is related to determination of the relative angular position of a spacecraft with respect to a compact calibration radio source on the plane of the sky.
Δ τ = B · S S C S e g r s c
The accuracy of VLBI delay observable is affected by two main kinds of factors, the random error and systematic error. Random error is dependent on signal-to-noise ratio (SNR) and synthetic bandwidth; other main reasons for errors in accuracy are variation in propagation path length for the signals arriving at the VLBI antennas, mainly including instrument changes, troposphere and ionosphere media delay, station clock drift, and other constant errors, such as locations of the VLBI antennas and their axes of rotations, and Earth orientation. In order to minimize many sources of common systematic error, including media variations, instrumental changes, and errors associated with lack of knowledge of the exact observing geometry, observation of calibration quasar is induced, with signal recording channel and observing schedule specially designed, e.g., spacecraft tones signal locates the center of the quasar signal channels. Obviously, temporal and spatial angular separation between the measurements of the reference source and the target spacecraft play a key important role in the accuracy of DeltaDOR. Since most components contributing to observable errors are linearly proportional to the temporal and angular separation, it is expected that we will minimize the effects of error by reducing the temporal and angular separation between the spacecraft and the calibration quasar [37].
Usually, in a conventional DeltaDOR measurement, a typical spacecraft-quasar angular separation of 6 degrees and per scan alter period of 10 min is advised; in addition, compact radio sources having a flux density of typically at least 0.5 Jy at X band are advised for calibration, where a jansky (Jy) = 10−26 W·m−2·Hz−1.
Take observation sequence quasar–spacecraft–quasar as example for discussion. Time tag t 1 , t 3 correspond to calibration quasar, and t 2 is the spacecraft observation. After correlation, we obtain observable delay of each scan.
τ e g r s t 1 = τ e g r s g e o t 1 + τ e g r s i n s t t 1 + τ e g r s c l o c k t 1 + τ e g r s E O P t 1 + τ e g r s p o s t 1 + τ e g r s a t m o t 1 + τ e g r s i o n o t 1
τ S C t 2 = τ S C geo t 2 + τ S C i n s t t 2 + τ S C c l o c k t 2 + τ S C E O P t 2 + τ S C p o s t 2 + τ S C a t m o t 2 + τ S C i o n o t 2
τ e g r s t 3 = τ e g r s geo t 3 + τ e g r s i n s t t 3 + τ e g r s c l o c k t 3 + τ e g r s E O P t 3 + τ e g r s p o s t 3 + τ e g r s a t m o t 3 + τ e g r s i o n o t 3
Item τ e g r s g e o is the geometry delay of the calibration quasar; the quasar position is very accurately known, so the accuracy of τ e g r s g e o is in the order of pico seconds. While the subindex ‘egrs’ means calibration quasar, ‘SC’ means spacecraft, and ‘inst’, ‘clock’, ‘EOP’, ‘pos’, ‘atmo’, ‘iono’ corresponds to the errors caused by instrument delay, station clock, earth orientation, antenna location, atmosphere delay, and ionosphere delay, respectively.
A linear interpolation is induced to obtain the common systematic error at time t 2 based on systematic error at time t 1 and t 3 .
τ e g r s e r r o r t 2 = τ e g r s i n s t t 2 + τ e g r s c l o c k t 2 + τ e g r s E O P t 2 + τ e g r s p o s t 2 + τ e g r s a t m o t 2 + τ e g r s i o n o t 2
Under the condition of small angular separation and temporal intervals, the following assumption could be made.
τ S C e r r o r t 2 τ e g r s e r r o r t 2 = τ S C i n s t t 2 + τ S C c l o c k t 2 + τ S C E O P t 2 + τ S C p o s t 2 + τ S C a t m o t 2 + τ S C i o n o t 2
Then, the observable of spacecraft τ S C g e o t 2 could be obtained with Equations (4) and (7).
τ S C g e o t 2 = τ S C t 2 τ S C e r r o r t 2

2.2. Algorithm Devloping and Analysis

To take DeltaDOR measurements, spacecraft generally sends dedicated DOR tones signal produced by the transponder or high harmonics of the telemetry subcarrier, the spanned frequency of all the tones is usually several MHz. In contrast, signal from quasar looks like white noise distributed in the whole channel. For this reason, in general, different algorithms are used when extracting the delay in the signal arrival time at the two stations for different signal’s characteristics.
However, an inter-DeltaDOR interface, including observable definition, is adopted for routine DeltaDOR tracking within LCTC. While this interface does not fit to the cross-support interferometry tracking, as the definition of observables from spacecraft is the same as quasar observation, that is the time difference in the same wavefront arriving at the two stations. So, a new algorithm is developed and adopted to support the cross-support interferometry, especially for the comparison of data processing results between CLTC and ESOC. For spacecraft DOR tones signal processing, algorithm of local correlation is developed and discussed in this chapter [38,39].
Spacecraft could work under One-way mode or Three-way mode during DeltaDOR measurements. The following description focuses on One-way mode, which is used in China Mars mission cross-support interferometry.
The formulation of signal S A ( t ) , S B ( t ) received at the tracking stations are expressed as:
S A t ) = exp { j ( 2 π f L A D O R t + φ D O R } exp { j 2 π f D O R τ A t } S B t ) = exp { j ( 2 π f L B D O R t + φ D O R } exp { j 2 π f D O R τ B t }
where f D O R is the sky frequency of the tone signal sent by spacecraft, f L A D O R is the intermediate frequency after signal down-converting, φ D O R is original phase, and τ A t is the time delay between the spacecraft and the tracking station A, which is the same as f L B D O R , τ B t .
Firstly, a delay model expressed by a polynomial is reconstructed for each station receiving signal. The delay model is described with a polynomial expression, with the order of N. The delay τ A t and delay rate τ ˙ A t are listed as follows:
τ A t = τ A N t N + τ A N 1 t N 1 + + τ A 1 t + τ A 0 τ ˙ A t = N τ A N t N 1 + N 1 τ A N 1 t N 2 + + τ A 1
In order to reconstruct the polynomial coefficient, the fundamental relation between Doppler value and the delay rate is induced; in principle, the Doppler of signal f d _ e s t t is proportional to delay rate τ ˙ A t .
τ ˙ A t = f d _ e s t t f D O R
With delay rate τ ˙ A t obtained, then delay τ A t could be computed with the below formulation, where C A is a constant value.
τ A t = τ ˙ A t d t + C A
Iteration strategy is designed during model reconstruction. Algorithm is explained as follows:
1.
Coarse Doppler estimation using over lapped FFT, then delay-rate vector with respect to time could be obtained based on Equation (11).
2.
Delay rate and delay polynomial model could be obtained, with a constant offset coefficient.
3.
A local model signal is computed with Equation (9).
4.
Cross correlation with received signal S A ( t ) and local model signal S ( t ) .
S c o r r t = S ( t ) . * conj ( S A ( t ) )
5.
Compute the residual phase of S c o r r t which is used to update the delay polynomial model.
6.
Refresh delay polynomial model by iteration, until there is no phase blur in the residual phase.
The basic flow scheme is listed in Figure 3.
Secondly, after obtaining the delay model and residual phase of each station receiving signal, difference the two stations’ delay model and residual phase.
Finally, multi-tones are used to compute the group delay. With a apriority delay model used to resolve the constant value difference in the two stations’ delay model, a narrow spanned bandwidth is then induced for integer cycle ambiguity resolution, and ultimate delay observable with high measurement accuracy is obtained with the widest spanned bandwidth.

2.3. Station Clock Estimation

2.3.1. Station Clock Description

Station clock error is one of the main contributing sources in VLBI, while DeltaDOR could eliminate station clock drift by quasar–spacecraft–quasar sequence observation and linear interpolation, and highly stable hydrogen maser clocks in VLBI station keeps nonlinear error source small. However, a priority station clock value is part of apriority delay model, which is essential to correlator. Without apriority model with proper accuracy, fringe of quasar may not be obtained, and it becomes even worse in the case of low SNR, such as lower flux of quasar.
CLTC uses GPS common view technique measurement system (see Figure 4) to determine station clock information, which is expressed with two parameters to model the clock, an offset and a rate. It is noticed that this method can measure the approximate clock value of the VLBI system because of different signal propagation path, but it is enough for correlation. The clock model value could be used directly to refresh the apriority model for correlator within CLTC deep space stations. Meanwhile, when it comes to correlation raw data from different agencies, such as in cross support, clock information may not be provided or the accuracy of apriority clock information from different agencies may be limited, and sometimes it has to perform correlation without proper clock information.

2.3.2. Fast Clock Estimation for Correlation

This chapter describes a fast processing method for estimating clock information. The clock model is still be expressed as:
C l o c k t = rate · t + offset
Step 1. Performing correlation without clock information for one quasar scan, we then obtain complex cross spectrum of each sub integration time.
i m ,   m = 1 , 2 M ; i = 1 , 2 . N
where M is the FFT point during correlation, and N is the total number of sub integration.
Step 2. Both steps of rate and offset are set using Equation (16).
o f f s e t s t e p = 1 2 l F s r a t e s t e p = 1 N k T s f
where F s is the bandwidth of channel, T s is sub integration time, f is the down-converting frequency of the channel, and l and k are step factors.
Step 3. Iteration compensation and statistics
With each clock o f f s e t and r a t e , compensation i m using the following formular.
i c o r m = i m · exp j 2 π f + m 1 F s M i 1 T s r a t e + m 1 F s M o f f s e t
Compute the cross spectrum i n t m and evaluation vector δ i n t of integration time.
i n t m = 1 N i = 1 N i m ,   m = 1 , 2 M
δ i n t = F F T i n t
Search the maximum value of magnitude of δ i n t , and the location of the maximum magnitude exists.
Step 4. After all the iterations, count the maximum magnitude δ i n t , and the iteration clock o f f s e t and r a t e are the clock information estimation results.
The algorithm flow scheme with key steps is shown in Figure 5.

2.3.3. Analysis

The algorithm described above has lower computation burden compared to iteration correlation with refreshed delay model (named traditional method). The key computation burden of our algorithm and traditional method are listed in Table 1; N represents FFT point, F is the number of FFT contained in one sub integration time, and M is the number of sub integration time.
Computation burden is obviously decreased, since only once N-point FFT is applied in the flow chart of the algorithm in each iteration, and computation quantity of traditional method could be much larger than the fast clock estimation method, usually by a few orders.

3. Results

Six successful cross-support interferometry tracking sessions have been conducted by CLTC and ESOC in Tianwen-1 mission, especially before and after TCM and Mars orbit insertion during Earth-to-Mars transfer flying. A schedule of each session is suggested and validated by both agencies, and several principles are considered while making the schedule.
1.
Tianwen-1 is switched to one-way mode during the observation. In addition, DOR tone is frequency coherent with the downlink carrier, and frequency coherence ratios are 1/440 and 1/2200, respectively.
2.
Sequence of spacecraft–quasar–spacecraft–quasar is adopted, where a cycle time of 10 min per scan.
3.
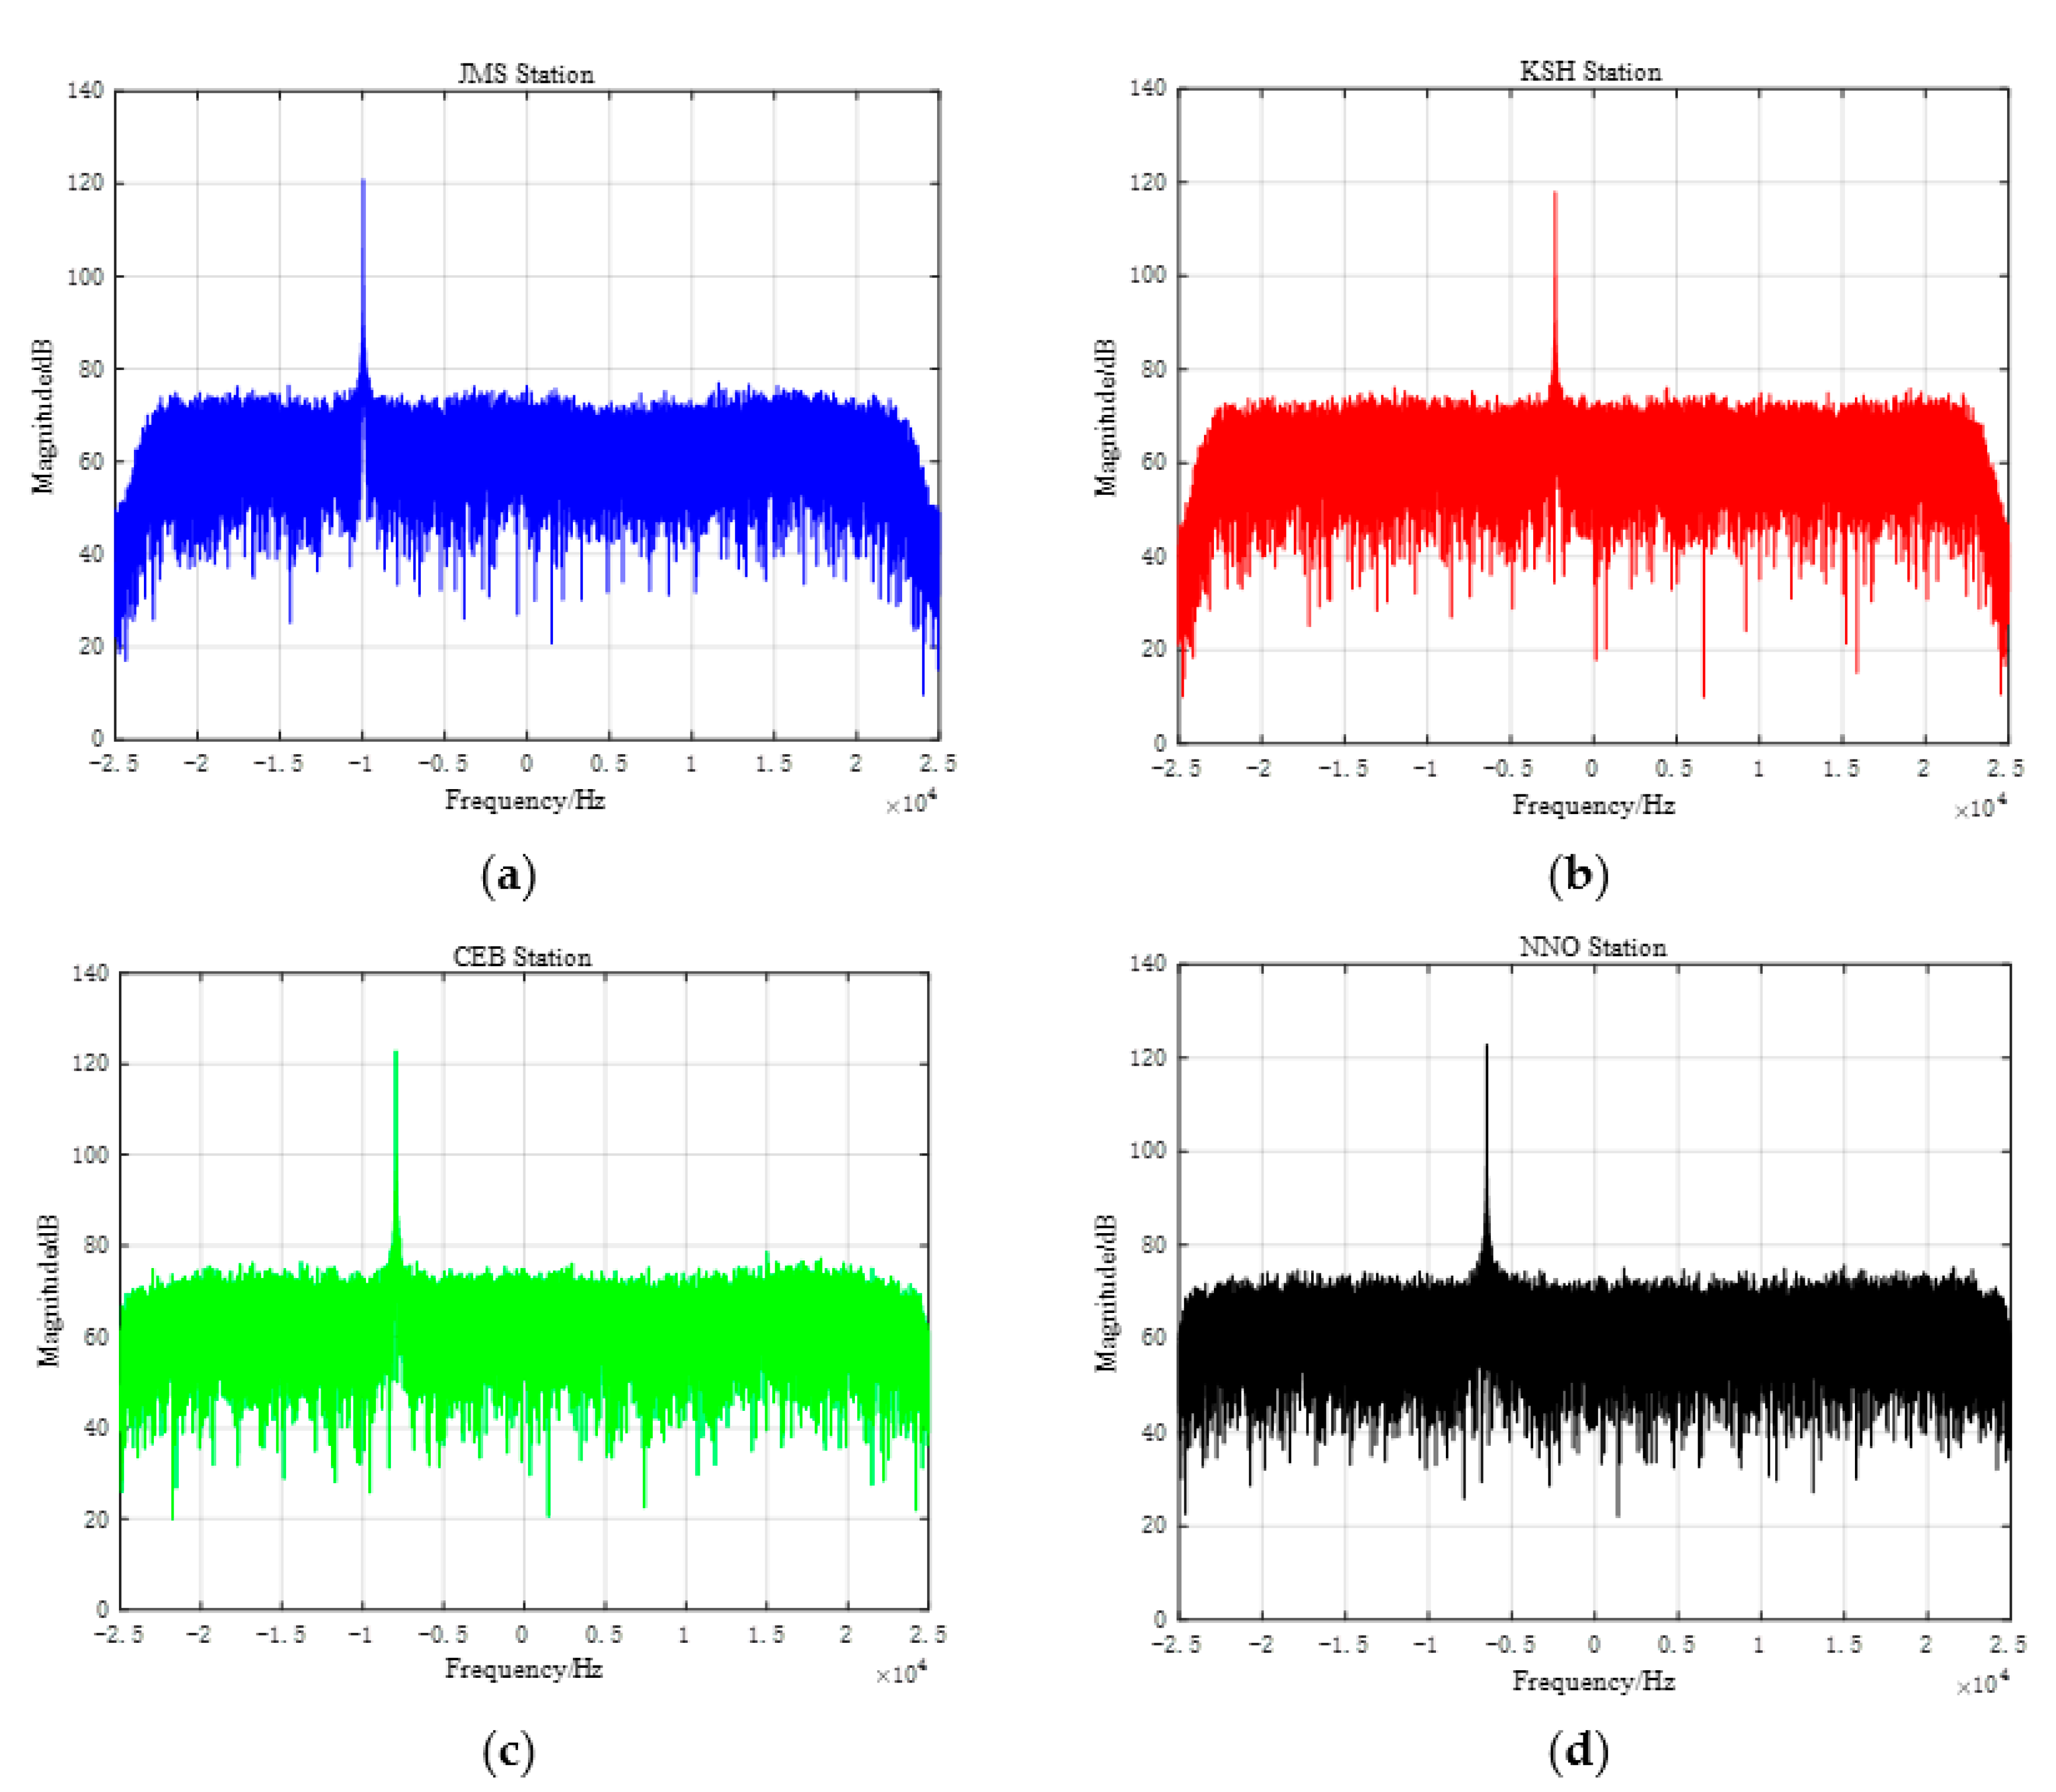
For the spacecraft scan, the Doppler frequency computed with prediction orbit is added to the standard frequency from Tianwen-1, and then channels are allocated to record tones while the tones exist in the channel center. In total, four channels are recorded, including the carrier, +1 DOR, +2DOR and −2DOR. Figure 6 shows the signal distribution and channel setting in DeltaDOR measurements.
4.
For the quasar scan, the same down-converting frequency of the channel is set, with a different sample rate.
5.
The TTCP recording system is used at ESOC tracking stations, data are recorded with a nominal 4 MHz bandwidth for the quasar scan and 50 KHz bandwidth for the spacecraft scan, and the quantization is 2 bits and 8 bits for each case, respectively. The same bandwidth and quantization parameters are adopted in CLTC stations.
A typical observation schedule is listed in the following table.
Figure 7 shows the distribution of tracking stations in the cross-support DeltaDOR measurements, the average baseline is longer than 8000 km.
CLTC develops a data converter, which complements the conversion parameters in order to satisfy generic and CCSDS standardized interfaces and provide consistency between that data acquired at the two agencies [40]. Besides raw data, other data such as tracking data message (TDM), meteo data, and orbit ephemeris message (OEM) are also exchanged among agencies.
For a typical session in Table 2, the data quantity at one station is substantial up to 50 GByte (mainly from the quasar observations), and data are exchanged through the Internet.

3.1. Correlation of Data Processing

3.1.1. Clock Estimation

Interferometric fringe of CEB and NNO could be obtained with apriority clock information supplied (if there is any), while when it comes to correlation raw data from different agencies, such as baseline CEB and KSH, NNO and KSH, a high-quality fringe could not be identified. Algorithm researched in Section 2.3.2 is adopted to perform the clock estimation, and the clock offset could be acquired effectively between the cross baseline. Figure 8 and Figure 9 show the iteration statistics and interferometric fringe for cross-baseline CEB-KSH when doing clock estimation.

3.1.2. Correlation of Spacecraft Scan

S/C scan raw data of each station is processed step by step following the flow scheme in Figure 3. The number points of FFT is 1024 with overlapped 128 points, and polynomial order is set as 6, which could fit Tianwen-1 trajectory within the scan. Taking one scan of the data sets as an example, the reconstructed delay polynomial with constant value of CEB is listed as:
τ C E B t = 1.41783 e 24 t 6 2.62806 e 21 t 5 + 1.80669 e 18 t 4 1.24437 e 15 t 3 + 3.73636 e 11 t 2 + 1.232370417 t + τ 0 CEB
A local signal model with a delay polynomial is reconstructed, after the correlation residual phase could be computed.
A priority ephemeris from orbit determination of CLTC is used to assist with resolving phase ambiguity. Since the narrowest spanned bandwidth of tones signal is about 3.83 MHz (the spanned frequency between the carrier and +1DOR, see Figure 8), the maximum tolerance of the priori knowledge of the differential group delay model is:
τ A p r i o r i t = ± π 2 π F s p a n ± 130 n s
In most cases, the priority model is good enough to rule out a false slope of the narrowest spanned bandwidth corresponding to a delay, and then it helps to resolve phase ambiguity of the largest possible spanned bandwidth. Finally, the desired measurement accuracy can be achieved with the unblurred phases of the widest spanned DOR tones, the results are shown in Figure 10.

3.2. Signal Quality Analysis

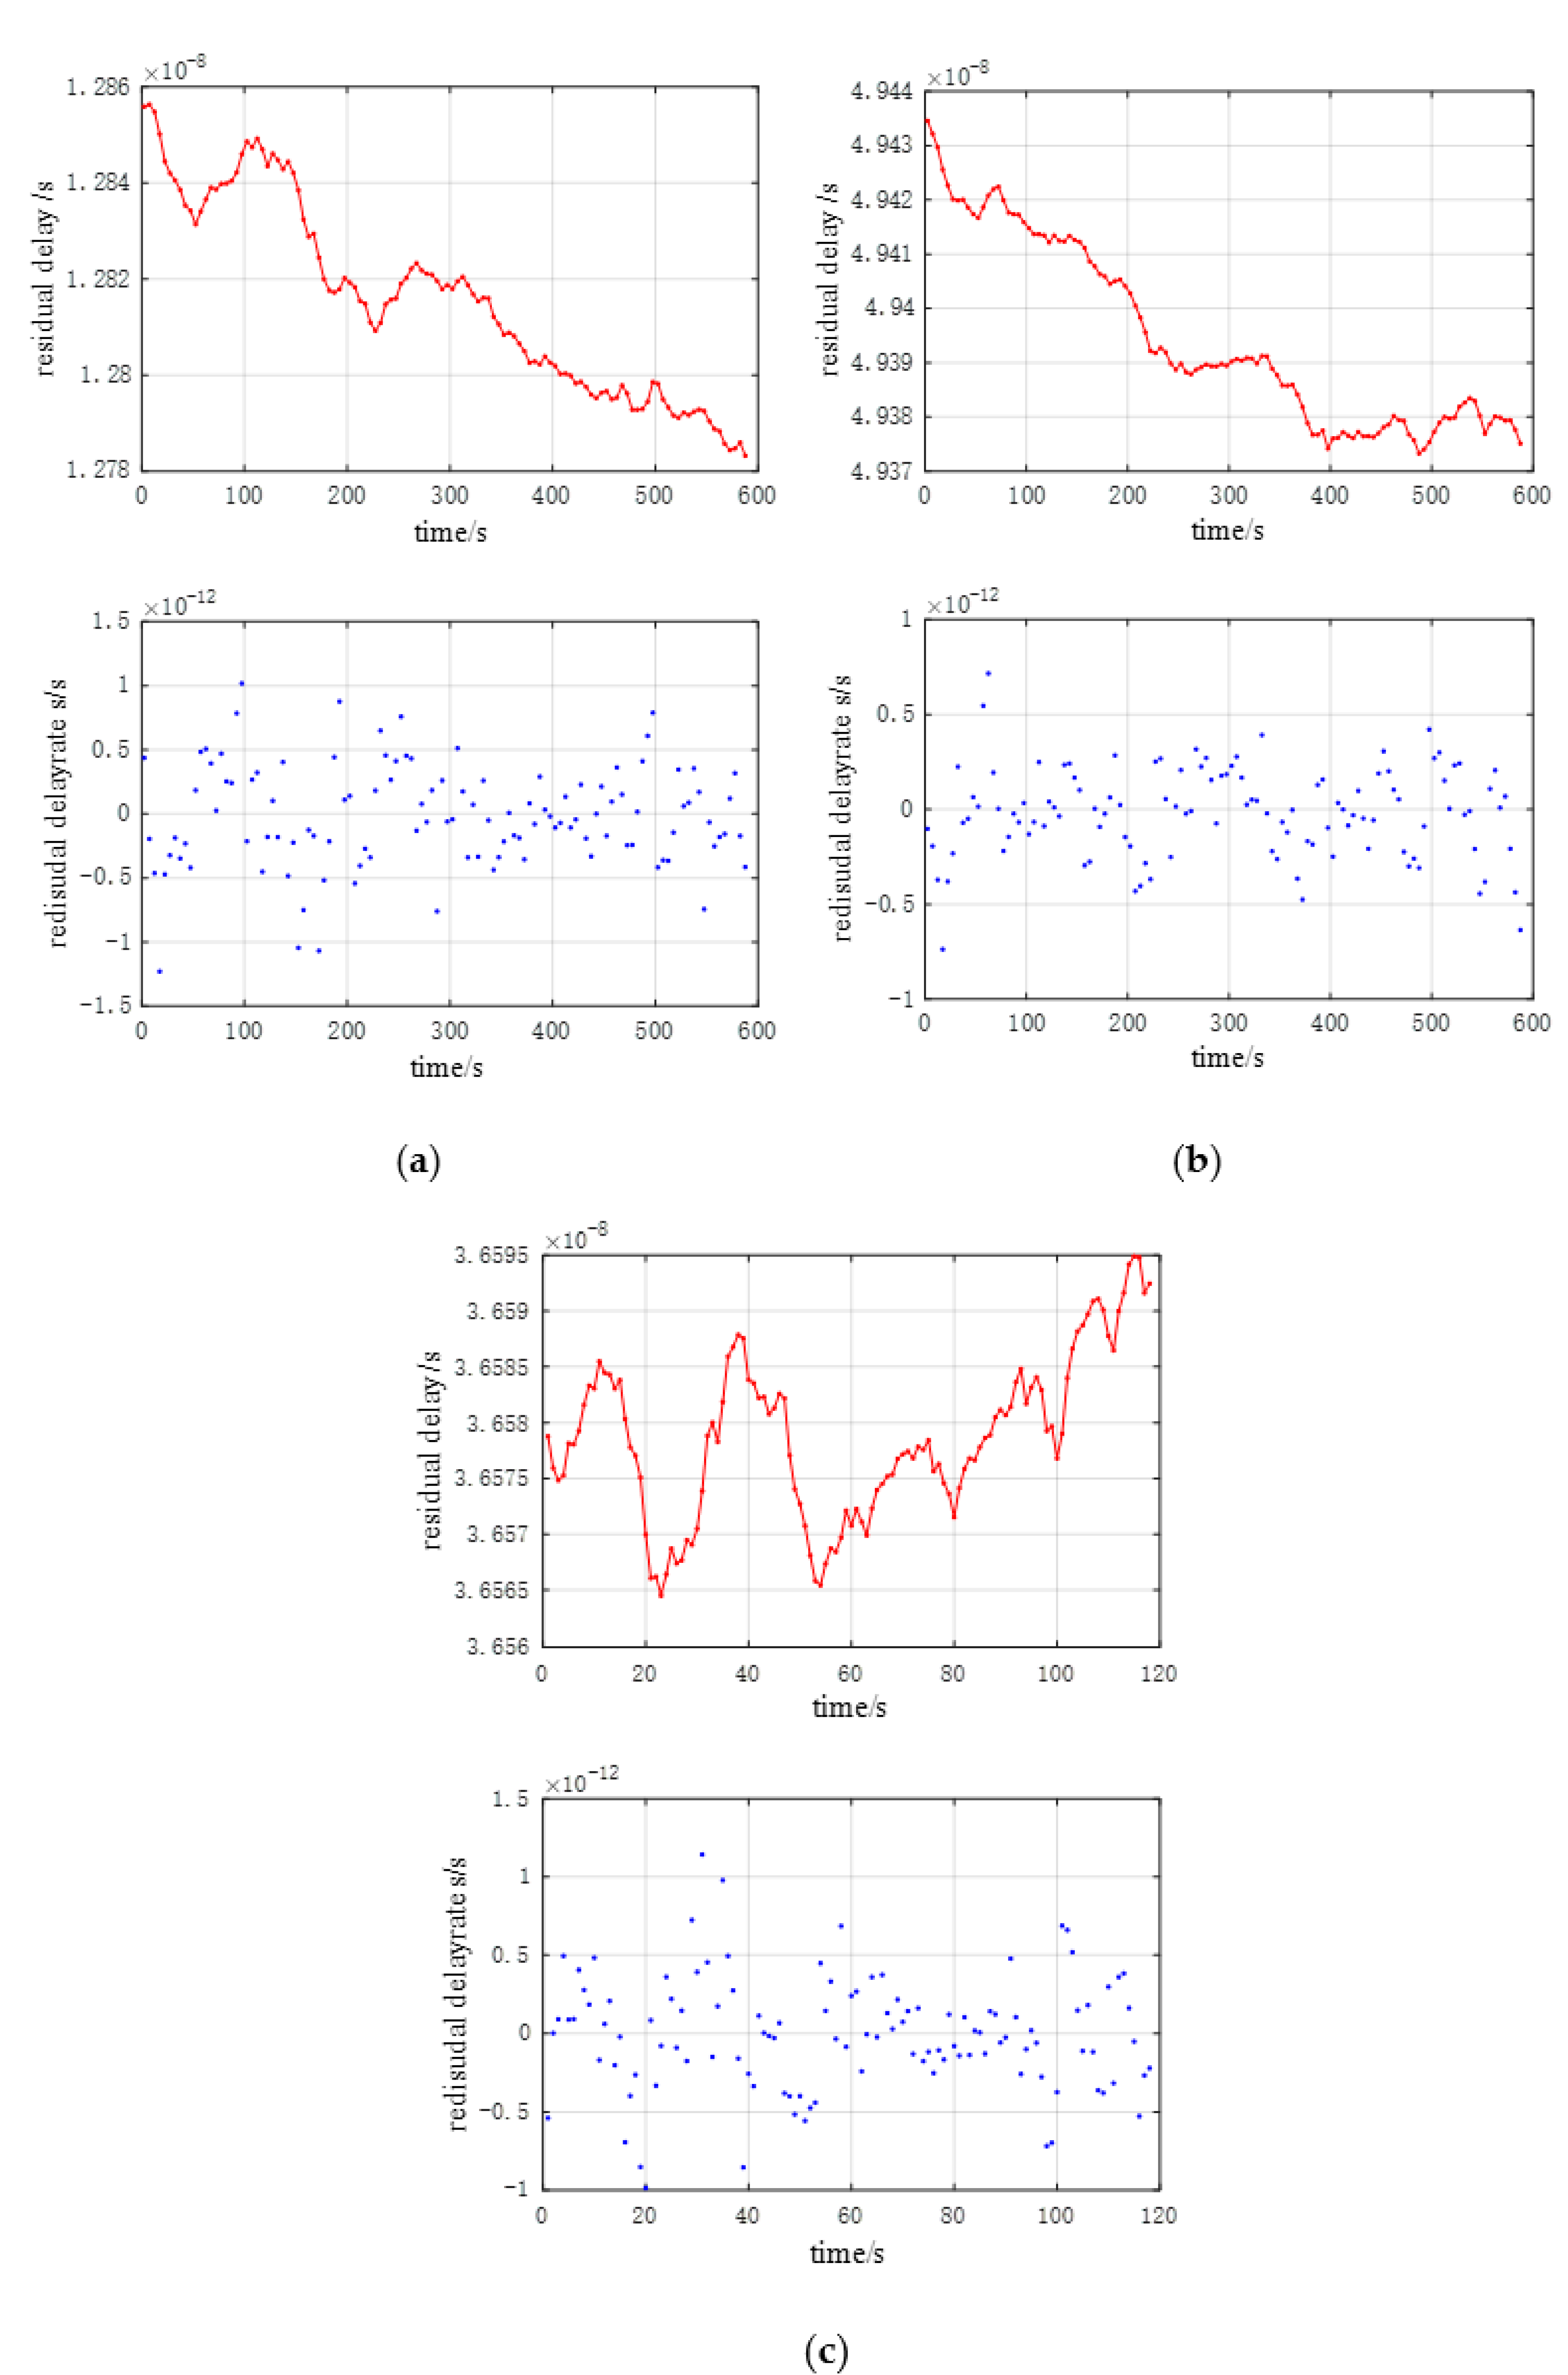
3.2.1. Spacecraft Scan

The carrier of deep spacecraft could be identified in the receiving channel of each station, and the Carrier Noise Ratio (C/N) is mainly depended on the Gain-to-noise–Temperature ratio (G/T) value. The following Figure 11 compares the receiving signal power spectrum at the same scan with the same integration time in one cross-support DeltaDOR session. Since the CLTC JMS station keeps tracking Tianwen-1 during the DeltaDOR session, the spacecraft signal received by the JMS station is also analyzed here.
The C/N of each station is listed in Table 3. It could be identified that the C/N value of JMS is 3~4 dB higher than KSH, which is approximate to the designed G/T difference value, as expected. While the C/N of KSH is about 5 dB lower than that of the ESA deep space antennas, they are basically the same.
Antenna pointing angles (see Figure 12) are analyzed in order to exclude whether pointing accuracy of big dish antennas in lower elevation angle causes the loss of C/N. Additionally, it could be testified that the elevation angle is normal for the three antennas with the same size dish.

3.2.2. Quasar Scan

Since the quasar signal is merged into the white noise of the receiving system, it is difficult to extract the quasar signal from raw data at one tracking station. However, the fringe of cross spectrum of different baseline (as shown in Figure 13) could reflect the relative quality of the signal at stations.
The SNR of the fringe could be evaluated with the equations:
ρ i n v = k · T i n t · F s
S N R = ρ m a x · ρ i n v
where T i n t is the integration time, F s is the bandwidth, k is constant value, and ρ m a x is the maximum value of the visibility function.
It could be identified that the SNR of CEB-NNO baseline is higher than the baselines CEB-KSH and NNO-KSH, which could reflect the signal quality at the stations, with a similar phenomenon when receiving the spacecraft signal.

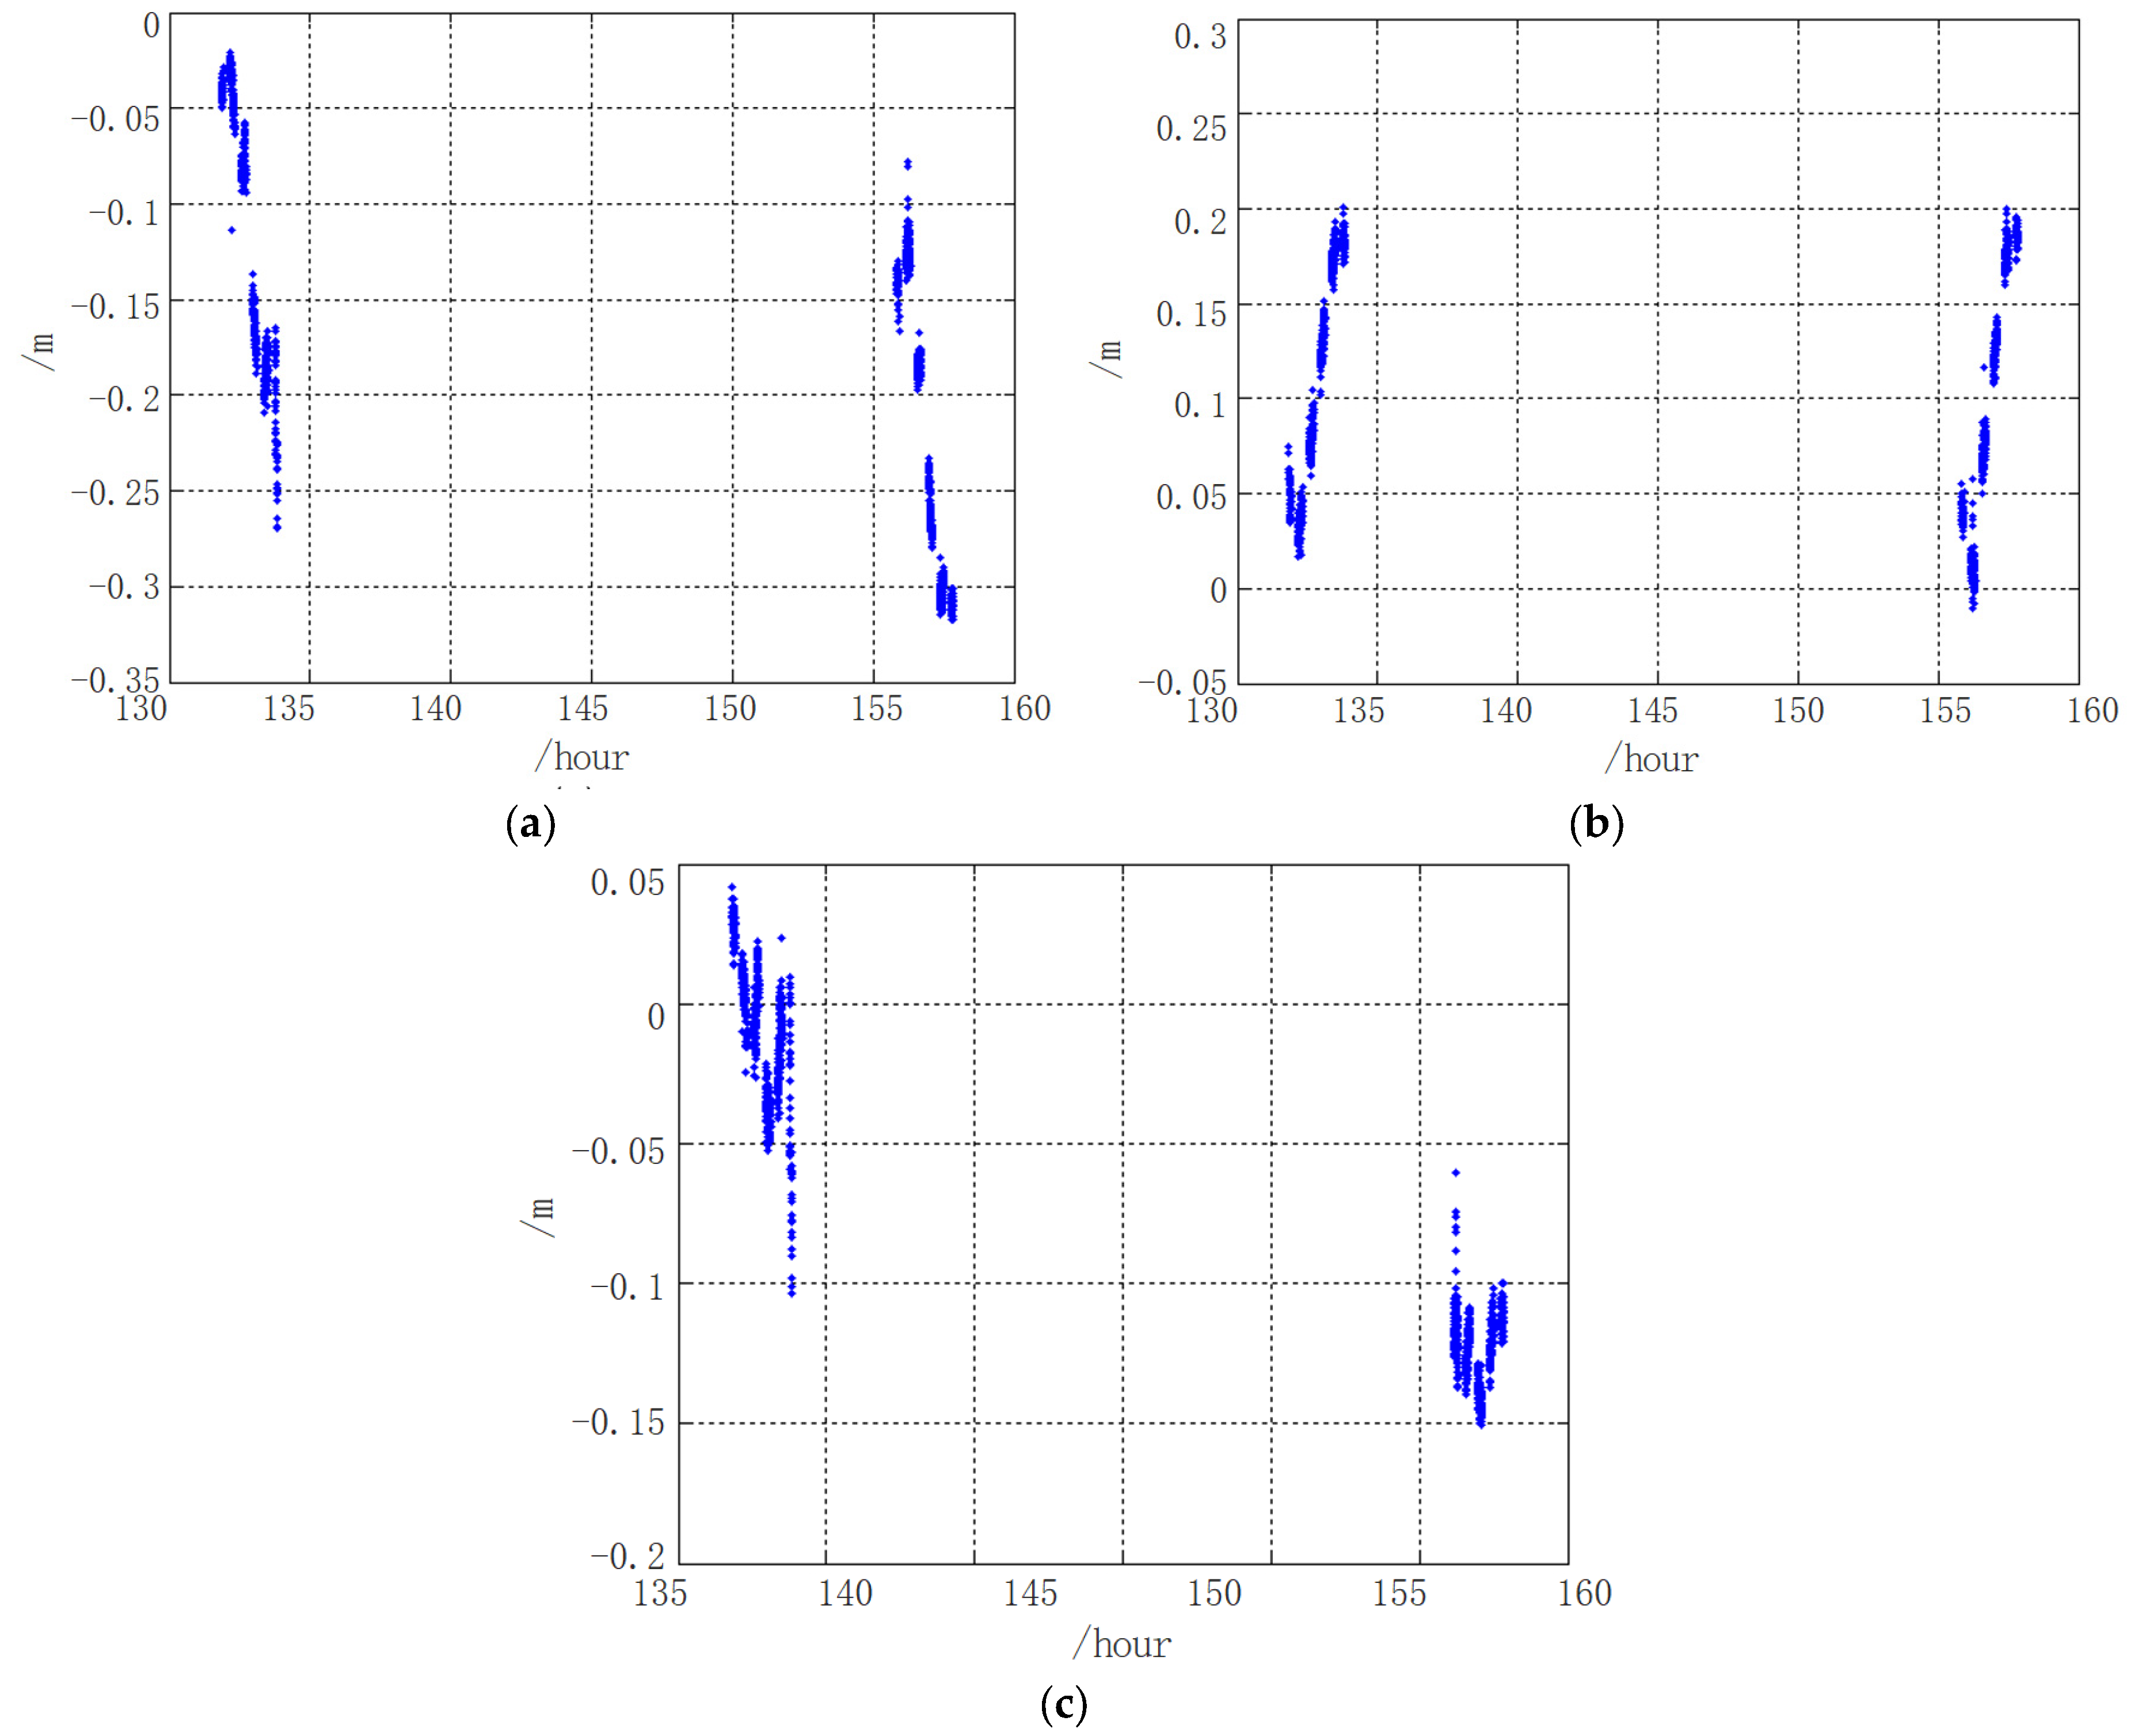
3.3. Accuracy Analysis and Comparison

3.3.1. Statistics Analysis

The residual phase of multi-DOR tones is shown in Figure 14, and the residual delay and delay rate are shown in Figure 15. Random error or noise level are also evaluated.
It is noticed that the random error of all the baselines has the same noise level, about 0.006 ns for residual delay and 0.3 ps/s for residual delay rate, and only effective number values of observables are reserved in Table 4. Because the C/N of signal tones at all the stations is much higher, 20~30 dB higher than the designed threshold in the observation, there is no obvious difference in the observable noise level.

3.3.2. Comparison

Observables from both agencies are listed in Table 5 and compared within a session.
Figure 16 shows the histogram of the comparison result.
The delay difference for the spacecraft scan has a Root Mean Square (RMS) of 0.0624 ns, while quasar scan has RMS of 0.1977 ns. One might hope for better agreement in the delay computations for the quasar scans, since the signal strength for the quasar is rather low, and the flux of 0054 + 161 is about 0.5 Jy, which causes a relatively larger formal error for this source than the spacecraft.

3.4. Orbit Determinaiton Review

Observables of all the baseline are used to evaluate the orbit accuracy during the critical operation, which aims to review the orbit accuracy and enhance the confidence to maneuver operation parameters. Figure 17 shows the residuals of DeltaDOR measurements before Mars orbit insertion, since Mars orbit insertion is one of the most important operations during the whole mission, and there would not be another chance if anything unexpected happened which was caused by inferior orbit accuracy in this case. The residuals are calculated with respect to an orbit determined by CLTC and are then predicted forward. The residuals of all baselines have an RMS of 0.135 m, which corresponds to 0.45 ns, which is much better than the expected accuracy of 1 ns.

4. Discussion

In order to support the joint cross-support DeltaDOR measurements conducted by CLTC and ESOC, this paper researches an algorithm and method which is different from the conventional processing within the CLTC, especially for the clock estimation and correlation for spacecraft scan. Results of the cross-support data sets are also analyzed in detail. Clock offset of stations between different agencies could be obtained effectively, and delay difference for spacecraft scan has RMS better than sub nanosecond, which could testify the effectiveness of the algorithm adopted in CLTC.
In particular, processing DeltaDOR measurements of all the baselines shows that DeltaDOR measurements before Mars orbit insertion are accurate to better than 0.5 ns (the expected goal is 1 ns). Residuals of CEB-NNO/CEB-KSH/NNO-KSH baselines have one sigma accuracy of 0.6, 0.4 and 0.3 ns, respectively.
Since the residuals provide a direct estimation of the predicted orbit accuracy, in order to make sure maneuver control parameters effective, such as Mars orbit insertion, the maximum orbit error must be limited to 40 km. Based on the basic DeltaDOR measurement geometry, DeltaDOR delay observables would be better than 1 ns. The results give confidence to the orbit determination and the maneuver planning. The DeltaDOR measurements jointly conducted by CLTC and ESOC successfully support the orbit accuracy review in China Mars mission.
In addition, the station clock offset in the order of microseconds could be identified when correlated with raw data from different agencies; however, the reason is not presently understood and needs more research. It has been noticed that the station clock offsets between different agencies are relatively stable in all the DeltaDOR measurement data sets, in the same order of microseconds, but not exactly the same.

5. Conclusions

China Mars Mission Tianwen-1 has been in operation more than a year since it reached Mars; until now, Tianwen-1 has made major achievements while also delivering a number of surprises. Both the orbiter and rover work well, as original planned.
Cross-support DeltaDOR measurements by intra-agency cooperation could benefit the measurement of the angular position of the spacecraft, as more baselines and a longer baseline could be arranged in the observation. In the Tianwen-1 mission, CLTC and ESOC successfully conducted cross-support interferometric tracking under commercial contract, which aims to make sure the accuracy of orbit determination of CLTC is good enough for the critical stages of the mission, such as insertion into Mars orbit and TCM. Cross-support data processing is a new challenge for CLTC; the correlation of raw data of cross baselines without proper clock information is inevitable, and DOR delay without ambiguity needs additional processing steps designed within the CLTC.
In this paper, we discuss and analyze the algorithm and method developed especially for cross-support interferometry tracking. Results analysis testifies the effectiveness of the cross support, through which the predicted orbit accuracy is good enough especially for the critical maneuver in the mission.
Through this work, the performance of cross-support DeltaDOR measurements by CLTC is tested and analyzed preliminary. In order to evaluate the measurement capability of CLTC for interoperability with other agencies, more research and experiments still need to be carried out in the future. However, cross-support measurement itself is undoubtedly a good way to track, and it is a very good idea which could be focused on in future studies.

Author Contributions

Conceptualization, S.H. and J.P.; methodology, S.H., M.W. and L.C.; software, H.M., Z.Z., and J.C.; validation, W.G.; formal analysis, H.M. and J.C.; investigation, Z.Z.; resources, M.W.; data curation, M.W.; writing—original draft preparation, S.H.; writing—review and editing, J.P.; visualization, M.W.; supervision, J.P.; project administration, W.G.; funding acquisition, S.H. All authors have read and agreed to the published version of the manuscript.

Funding

This research was funded by National Natural Science Foundation of China, grant number 61401014 and China Scholarship Council Fellowship, grant number 201503170203.

Data Availability Statement

The data presented in this study are available on request from the corresponding author.

Acknowledgments

We thank Marco Menapace of ESOC for data processing discussion during preparation cross support in China Mars mission. We also thank John Reynolds of ESOC for providing schedule file and suggestive discussion, and David Jesch for supplying TDM. We also thank Lei Huang and Hong Wang of Beijing Institute of Tracking and Telecommunications Technology for organizing cross support.

Conflicts of Interest

The authors declare no conflict of interest.

References

  1. Thornton, C.L.; Border, J.S. Radiometric Tracking Techniques for Deep Space Navigation; JPL Deep Space Communications and Navigation Series; John Wiley & Sons: Hoboken, NJ, USA, 2000; pp. 47–58. [Google Scholar]
  2. Acciarito, S.; Cardarilli, G.C.; Khanal, G.M.; Matta, M.; Re, M.; Silvestri, F.; Spanò, S.; Gelfusa, D.; Simone, L. Digital Architecture of Next Generation Spacecraft Tracker Based on Wideband ∆DOR. Lect. Notes Electr. Eng. 2019, 512, 17–24. [Google Scholar]
  3. Melbourne, W.G.; Curkendall, D.W. Radiometric Direction Finding: A New Approach to Deep Space Navigation. In Proceedings of the AAS/AIAA Astrodynamics Specialist Conference, Palo Alto, CA, USA, 1 September 1977. [Google Scholar]
  4. Fiori, F.; Tortora, P.; Zannoni, M.; Ardito, A.; Menapace, M.; Bellei, G.; Budnik, F.; Morley, T.; Mercolino, M.; Orosei, R. Deep Space Orbit Determination via Delta-DOR Using VLBI Antennas. CEAS Space J. 2022, 14, 421–430. [Google Scholar] [CrossRef]
  5. Li, T.; Liu, L.; Zheng, W.; Zhang, J. The Precision Analysis of the Chinese VLBI Network in Probe Delay Measurement. Res. Astron. Astrophys. 2022, 22, 035001. [Google Scholar] [CrossRef]
  6. Zheng, W.; Tong, F.; Zhang, J.; Liu, L.; Shu, F. Interferometry Imaging Technique for Accurate Deep Space Probe Positioning. Adv. Space Res. 2017, 60, 2847–2854. [Google Scholar] [CrossRef]
  7. Wood, J.S. NASA Technology Roadmaps Review. In Proceedings of the Robotics, Communications and Navigation Workshop; 2011. Available online: https://trs.jpl.nasa.gov/bitstream/handle/2014/42064/11-1196.pdf?sequence=1&isAllowed=y (accessed on 10 March 2017).
  8. Bagri, D.S.; Majid, W.A. Accurate Spacecraft Angular Position from DSN VLBI Phases Using X-band Telemetry or DOR Tones. In Proceedings of the IEEE Aerospace Conference, Big Sky, MT, USA, 7–14 March 2009. [Google Scholar]
  9. Wang, H.B.; Yao, X. Evaluation of NASA’s Next-Generation Deep Space Network Evolvement Strategy. J. Spacecr. TTC Technol. 2016, 35, 443–449. [Google Scholar]
  10. Kroger, P.M.; Border, J.S.; Nandi, S. The Mars Observer Differential One-Way Range Demonstration. In TDA Prog. Rep.; 1994; pp. 42–117. Available online: https://ntrs.nasa.gov/api/citations/19940031036/downloads/19940031036.pdf (accessed on 27 June 2022).
  11. McKay, M.; Denis, M.; Mounzer, Z. Mars Express Operational Challenges and First Results. In Proceedings of the 55th International Astronautical Congress, Vancouver, BC, Canada, 4–8 October 2004. [Google Scholar]
  12. Border, J.S. A Global Approach to Delta Differential One-Way Range. In Proceedings of the 19th International Symposium on Space Flight Dynamics, Kanazawa, Japan, 4–11 June 2006. [Google Scholar]
  13. Curkendall, D.W.; Border, J.S. Delta-DOR: The One-Nanoradian Navigation Measurement System of the Deep Space Network—History, Architecture, and Componentry. IPN Prog. Rep. 2013, 42–193, 1–46. [Google Scholar]
  14. Maddè, R.; Morley, T.; Abelló, R.; Lanucara, M.; Mercolino, M.; Sessler, G.; de Vicente, J. Delta-DOR A New Technique for ESA’s Deep Space Navigation. ESA Bull. 2006, 128, 69–74. [Google Scholar]
  15. Madde, R.; Morley, T.; Lanucara, M.; Abello, R.; Mercolino, M.; De Vicente, J.; Sessler, G.M. A Common Receiver Architecture for ESA Radio Science and Delta-DOR Support. IEEE Spec. Issue Tech. Adv. Deep Space Commun. Track. 2007, 95, 2215–2223. [Google Scholar] [CrossRef]
  16. James, N.; Abello, R.; Lanucara, M.; Mercolino, M.; Maddè, R. Implementation of an ESA delta-DOR Capability. Acta Astronaut. 2009, 64, 1041–1049. [Google Scholar] [CrossRef]
  17. Takeuchi, H.; Tomiki, A.; Kobayashi, Y. A Study of Accuracy Improvement Methods for Delta DOR Measurements. IEICE Tech. Rep. Space Aeronaut. Navig. Electron. 2014, 114, 49–50. [Google Scholar]
  18. Takeuchi, H.; Horiuchi, S.; Phillips, C.; Edwards, P.; McCallum, J.; Dickey, J.; Ellingsen, S.; Yamaguchi, T.; Ichikawa, R.; Takefuji, K.; et al. Delta-DOR Observations for the IKAROS Spacecraft. In Proceedings of the 28th International Symposium on Space Technology and Science, Ginowan, Japan, 5 June 2011. [Google Scholar]
  19. Liu, Q.H. VLBI Orbit Determination Technology for Mars Exploration. J. Deep. Space Explor. 2018, 5, 435–441. [Google Scholar]
  20. Huang, Y.; Li, P.; Fan, M.; Cao, J.; Hu, X.; Wang, G.; Zheng, W. Orbit Determination of CE-5T1 in Earth-Moon L2 Libration Point Orbit with Ground Tracking Data. Sci. SINICA Phys. Mech. Astron. 2018, 48, 079501. [Google Scholar] [CrossRef]
  21. Guangli, W.A.; Xiaoyu, H.O.; Qinghui, L.I.; Bin, L.I.; Jun, M.A.; Yan, S.U.; Longfei, H.A. High Precision VLBI Orbit Measurement Technology in the Chang’E-4 Mission. J. Deep Space Explor. 2020, 7, 332–339. [Google Scholar]
  22. Liu, Q.; Huang, Y.; Shu, F.; Wang, G.; Zhang, J.; Chen, Z.; Li, P.; Ma, M.; Hong, X. VLBI Technique for the orbit determination of Tianwen-1. Sci. SINICA Phys. Mech. Astron. 2022, 52, 239507. [Google Scholar] [CrossRef]
  23. He, G.; Liu, M.; Gao, X.; Du, X.; Zhou, H.; Zhu, H. Chinese Deep Space Stations: A brief review [Antenna Applications Corner]. IEEE Antennas Propag. Mag. 2022, 64, 102–111. [Google Scholar] [CrossRef]
  24. Dong, G.L.; Li, G.M.; Wang, X.Y. China Deep Space Network: System Design and Key Technologies(III) Deep Space Interferometric System; Tsinghua University Press: Beijing, China, 2016; pp. 265–275. [Google Scholar]
  25. Guangliang, D.O.; Haitao, L.I.; Wanhong, H.A.; Hong, W.A.; Zhiyong, Z.H.; Shanbin, S.H.; Min, F.A.; Huan, Z.H.; Dezhen, X.U. Development and Future of China’s Deep Space TT&C System. J. Deep Space Explor. 2018, 5, 99–114. [Google Scholar]
  26. Wu, W.; Li, Z.; Li, H.; Tang, Y.; Wang, G. Status and Prospect of China’s Deep Space TT&C Network. Sci. SINICA Inf. 2020, 50, 87–108. [Google Scholar]
  27. Kong, J.; Zhang, Y.; Ren, T.P.; Ou, Y.Q.; Li, C.L.; Duan, J.F.; Shen, Q.H.; Chen, M. Orbit Determination Ability of Chang’E-5 Based on CDSN Tracking Data. J. Astronaut. 2022, 43, 183–188. [Google Scholar]
  28. The Consultative Committee for Space Data Systems. Delta-Differential One Way Ranging Operations; CCSDS Press: Washington, DC, USA, 2018; pp. 2–3. [Google Scholar]
  29. Border, J.S. Status of Delta-DOR Cross-Support Activities at JPL. In Proceedings of the CCSDS Fall Meeting, Hague, The Netherlands, 6–9 November 2017. [Google Scholar]
  30. Mercolino, M.; Border, J.S.; Madde, R.; Takeuchi, H. Delta-DOR Interoperability and Cross Support Between ESA, JPL and JAXA. In Proceedings of the 5th ESA International Workshop on Tracking, Telemetry and Command Systems for Space Applications, European Space Technology Centre (ESTEC), Noordwijk, The Netherlands, 21 September 2010. [Google Scholar]
  31. Mercolino, M. ESA DDOR Cross Support. In Proceedings of the CCSDS Fall Meeting, Heppenheim, Germany, 1 October 2007. [Google Scholar]
  32. Mercolino, M. Status of Delta-DOR Interoperability. In Proceedings of the Mattia Mercolino ESA/ESOC, San Antonio, TX, USA, 11 May 2017. [Google Scholar]
  33. Stein, V. Tianwen-1: China’s First Mars Mission. 2021. Available online: https://www.space.com/tianwen-1.html (accessed on 9 February 2021).
  34. Mercolino, M.; Maddè, R.; Iess, L.; Lanucara, M.; Tortora, P.; Ardito, A.; Rapino, G. Results and Future Applications of the ESA Delta-DOR. In Proceedings of the 4th ESA International Workshop on Tracking, Telemetry and Command Systems for Space Applications, Vancouver, BC, Canada, 19 January 2007. [Google Scholar]
  35. The Consultative Committee for Space Data Systems. Delta-DOR Technical Characteristics and Performance; CCSDS Press: Washington, DC, USA, 2013; Available online: http://mtc-m16c.sid.inpe.br/col/sid.inpe.br/mtc-m18/2014/02.17.19.44/doc/CCSDS%20500.1-G-1.pdf (accessed on 15 May 2022).
  36. Zhang, F.; Zhao, C.; Han, S.; Ma, F.; Xiang, D. GPU-Based Parallel Implementation of VLBI Correlator for Deep Space Exploration System. Remote Sens. 2021, 13, 1226. [Google Scholar] [CrossRef]
  37. Majid, W.; Bagri, D. In-Beam Phase Referencing with the Deep Space Network Array. In IPN Prog. Rep.; 2007; pp. 42–169. Available online: https://tda.jpl.nasa.gov/progress_report/42-169/169F.pdf (accessed on 6 May 2022).
  38. Han, S.T.; Ping, J.S. Deep Space Radiometric Tracking; China Machine Press: Beijing, China, 2020; pp. 20–44. [Google Scholar]
  39. Han, S.; Chen, L.; Wang, M.; Zhou, Z.; Sun, J.; Lu, W.; Ren, T. Monitoring Maneuver of Deep Spacecraft with Radiometric Doppler Tracking. In Proceedings of the International Conference on Signal Processing and Communication Technology, Tianjan, China, 14 April 2022. [Google Scholar]
  40. The Consultative Committee for Space Data Systems. Delta-DOR Raw Data Exchange Format; CCSDS Press: Washington, DC, USA, 2013; pp. 3-1–5-7. Available online: https://public.ccsds.org/Pubs/506x0m2.pdf (accessed on 1 February 2021).
Figure 1. China Mars Mission Tianwen-1 orbit.
Remotesensing 14 04117 g001
Figure 2. DeltaDOR Observation Geometry.
Remotesensing 14 04117 g002
Figure 3. Flow scheme of the algorithm.
Remotesensing 14 04117 g003
Figure 4. Station clock information by GPS common view technique.
Remotesensing 14 04117 g004
Figure 5. Flow scheme of clock estimation method.
Remotesensing 14 04117 g005
Figure 6. Channel configuration of DeltDOR measurement in cross support: the red frame means spacecraft scan and the black frame corresponds to quasar scan.
Remotesensing 14 04117 g006
Figure 7. Tracking station distribution and intercontinental baseline: KSH and CEB forming a baseline of about 6400 km, KSH and NNO forming a baseline of about 8000 km, CEB and NNO forming a baseline of about 11,650 km.
Remotesensing 14 04117 g007
Figure 8. Iteration statistics of the test data: (a) location index of maximum magnitude of evaluation vector for each iteration; (b) maximum magnitude of evaluation vector for each iteration. The iteration which satisfies both the maximum magnitude and index limit corresponds to the clock information, where clock offset is about 2.7 microseconds and rate is about 0.16 picoseconds per second.
Remotesensing 14 04117 g008
Figure 9. Comparison of fringes: (a) original fringe of cross spectrum of integration time, without proper clock information contained in apriority delay model, and no fringe could be identified; (b) fringe of cross spectrum of integration time, with proper clock information estimated.
Remotesensing 14 04117 g009
Figure 10. Resolving phase ambiguity of DOR Tones, dot point means original phase, star point means ambiguity resolved phase, color blue represents carrier, red +1DOR, green −2DOR, yellow +2DOR: (a) Baseline CEB-NNO; (b) Baseline CEB-KSH. (c) Baseline NNO-KSH.
Remotesensing 14 04117 g010
Figure 11. Spacecraft signal received at each station: (a) JMS; (b) KSH; (c) CEB; (d) NNO.
Remotesensing 14 04117 g011
Figure 12. Analysis of antenna pointing angle during the observation: (a) elevation angle of CEB varies from 12 to 33 degree; (b) elevation angle of NNO varies from 33 to 13 degree; (c) elevation angle of KSH varies from 61 to 68 degree.
Remotesensing 14 04117 g012
Figure 13. Interferometric fringe of quasar of all the baselines: (a) fringe of baseline CEB-NNO—the SNR is about 22.1 dB; (b) fringe of Baseline CEB-KSH—the SNR is about 11.9 dB; (c) Fringe of Baseline NNO-KSH—the SNR is about 14.3 dB.
Remotesensing 14 04117 g013
Figure 14. Phase of DOR tones signal. Fluctuation of residual phase of all tones signal could be identified, mainly caused by ionosphere fluctuation: (a) baseline CEB-NNO; (b) baseline CEB-KSH; (c) Baseline NNO-KSH.
Remotesensing 14 04117 g014
Figure 15. Residual delay and delay rate: (a) Baseline CEB-NNO; (b) Baseline CEB-KSH. (c) Baseline NNO-KSH.
Remotesensing 14 04117 g015
Figure 16. Histogram of difference statistics.
Remotesensing 14 04117 g016
Figure 17. Orbit accuracy review with cross-support DeltaDOR measurement. (a) Baseline CEB-NNO; (b) baseline CEB-KSH; (c) baseline NNO-KSH.
Remotesensing 14 04117 g017
Table 1. Computation burden of the two methods in each iteration.
MethodKey StepsComplex PlusComplex Multiply
Traditional MethodFringe Rotation0F × N
FFTF × N × log2NF × N × log2(N/2)
Sub Bit Compensation0F × N
Integration Time SpectrumN × M0
This PaperSpectrum Compensation0N
FFTN × log2NN × log2(N/2)
Integration Time SpectrumN × M0
Table 2. Typical cross-support session schedule.
Time (Minute)TargetStation
T0-T0 + 5SpacecraftCEB/NNO/KSH
T0 + 7-T0 + 17QuasarCEB/NNO/KSH
T0 + 19-T0 + 29SpacecraftCEB/NNO/KSH
T0 + 31-T0 + 41QuasarCEB/NNO/KSH
T0 + 43-T0 + 53SpacecraftCEB/NNO/KSH
T0 + 55-T0 + 65QuasarCEB/NNO/KSH
T0 + 67-T0 + 77SpacecraftCEB/NNO/KSH
T0 + 79-T0 + 89QuasarCEB/NNO/KSH
T0 + 91-T0 + 101SpacecraftCEB/NNO/KSH
T0 + 103-T0 + 113QuasarCEB/NNO/KSH
T0 + 115-T0 + 120SpacecraftCEB/NNO/KSH
Table 3. C/N statistics of each station.
StationC/N(dB)Antenna Dish (m)
KSH45.935
JMS47.866
CEB47.935
NNO42.835
Table 4. Random error of observables of all the baselines.
BaselineDelay (ns)Delay Rate (ps/s)
CEB-NNO0.00570.3
CEB-KSH0.00590.3
NNO-KSH0.00640.3
Table 5. Comparison of observables from CLTC and ESOC.
SourceTime TagESOCCLTCDifference
Tianwen-122:52:24.000−0.007204728472941−0.007204728498263740.0253
0054 + 16123:02:25.900−0.006395117735975−0.006395117976787440.2408
Tianwen-123:11:28.000−0.005083056289743−0.00508305635491820.0652
Tianwen-123:16:08.000−0.004550230125038−0.00455023021959710.0946
0054 + 16123:26:25.900−0.003660915525043−0.0036609153456465−0.1794
Tianwen-123:35:28.000 −0.002293397934561−0.002293397922336−0.0122
Tianwen-123:40:08.000−0.001737918208119−0.001737918220625940.0125
0054 + 16123:51:29.900 −0.00068016381945−0.000680163704212356−0.1152
Tianwen-123:59:28.0000.0006001394240780.0006001393908813930.0332
Tianwen-1+1T 00:04:08.0000.0011721343233880.001172134272548970.0508
0054 + 161+1T 00:14:25.9000.0021287790413630.00212877927140748−0.2300
Tianwen-1+1T 00:23:28.0000.003565577243070.00356557734894783−0.1059
Tianwen-1+1T 00:28:08.0000.0041477651275160.0041477652051242−0.0776
Publisher’s Note: MDPI stays neutral with regard to jurisdictional claims in published maps and institutional affiliations.

