Article

Multi-Circular SAR Three-Dimensional Image Formation via Group Sparsity in Adjacent Sub-Apertures

Key Laboratory of Radar Imaging and Microwave Photonics, Ministry of Education, College of Electronic and Information Engineering, Nanjing University of Aeronautics and Astronautics, Nanjing 211106, China
*
Author to whom correspondence should be addressed.
Remote Sens. 2022, 14(16), 3945; https://doi.org/10.3390/rs14163945
Submission received: 22 June 2022 / Revised: 25 July 2022 / Accepted: 12 August 2022 / Published: 14 August 2022

Abstract

:
Multi-circular SAR(MCSAR) can obtain holographic three-dimensional (3D) images of interesting observation targets, which is a significant research field at present. For anisotropic scatterers, the multi-circular SAR incoherent 3D imaging strategy combines the principle of tomography SAR inversion to obtain better reconstruction results. However, in incoherent 3D imaging, the traditional L1-norm regularization method only considers sparse representation and reconstruction in the sub-aperture pixel unit along the elevation direction, and the target structural sparsity in the same pixel unit between adjacent sub-apertures is not considered. The hierarchical sparsity constraint method in multi-circular SAR 3D target reconstruction is proposed in this paper, the L1-norm regularization is used in sub-aperture elevation, and the L2,1-regularization-based group sparsity constraint is adopted in elevation of the adjacent sub-aperture. In this paper, the sparse group thresholding iterative method is proposed to reconstruct the 3D observed target image with MCSAR data. Compared with the traditional L1-norm regularization method and IAA-GLRT method for MCSAR target reconstruction in elevation, the proposed method in this paper could obtain clearer 3D observation target images, with fewer desultory points along the elevation direction. Detailed simulation data analysis and 3D imaging processing of real MCSAR data demonstrate the advantages of the proposed method.

1. Introduction

Multi-circular SAR could obtain 360° omni-directional, high-resolution and fine holographic 3D images of observed targets, which has important research significance [1,2,3]. The radar platform flies in a circular trajectory around the target of interest at different elevation angles, which could form the synthetic aperture along the elevation direction, so as to realize the 3D imaging in elevation. However, the complexity of circular track flight and the small number of baselines acquired in elevation bring new challenges to multi-circular SAR 3D imaging.
At present, in order to achieve 3D imaging of multi-circular SAR observation targets, incoherent 3D imaging strategy [4] is the better choice. The multi-circular SAR incoherent 3D imaging method divides the complete circular track into multiple sub-apertures. In the sub-aperture, the tomographic SAR inversion principle [5] could be used to obtain the sub-aperture 3D target image according to the target sparsity in elevation. The final holographic observation target 3D image is obtained by incoherent addition of all the individual sub-aperture 3D images. This method is suitable for 3D imaging of anisotropic scattering targets. In [6], the ESPRIT algorithm is proposed to reconstruct the target image in elevation with multi-circular SAR data, and 3D target imaging is achieved using an electromagnetic simulation vehicle data. In [7], the sub-aperture incoherent imaging method and sub-aperture generalized likelihood ratio test (GLRT) imaging strategy are used to reconstruct the target in sub-aperture elevation by combining the compressive sensing theory. The 3D reconstruction image of the forest area is realized by using L-band airborne multi-circular SAR data. In [8], the sub-aperture iterative adaptive approach (IAA)-GLRT reconstruction strategy is proposed, which could achieve more accurate 3D vehicle target reconstruction in parking lots. However, there are a large number of matrix inversions in the IAA algorithm, and there are some shortcomings in real data processing, such as matrix singularity, and large amount of calculation.
The traditional MCSAR sub-aperture 3D target reconstruction process, based on tomographic SAR inversion theory, only considers the sparsity of each pixel unit along the elevation direction, and does not consider the structural sparsity between sub-apertures. In fact, radar could continuously observe the same target at a certain azimuth angle. Several adjacent sub-apertures are observed for the same target, and the target scattering center on the same pixel unit could appear at the same elevation position. The structural sparsity constraint is a new research field in MCSAR 3D target reconstruction. In [9], for anisotropic scatterers, considering the structural sparsity between adjacent sub-apertures, the author uses the Group-regularized constraint and iterative proximal-gradient method to obtain 3D reconstruction images with simulated civilian vehicle data.
In wide-angle SAR imaging, the artificial target scattering characteristics, which are composed of strong scattering points, always exist in a limited azimuth angle [10,11,12]. This information could be used to reduce the difficulty of sparse reconstruction. In fact, in circular SAR observation, although the scattering characteristics of the same target scattering center change with the azimuth angle, they can appear at the same position in the adjacent sub-aperture images. The characteristic of target scattering center between sub-apertures could be described by structural sparsity. Structural sparsity is an extension of traditional signal sparsity, which allows the elements within groups to have extensive structural characteristics [13,14]. The L2,1 mixed norm constraint optimization strategy for multi-circular SAR incoherent 3D imaging is proposed in this paper, which takes into account group sparsity when the target reconstruction is in elevation between adjacent sub-apertures. In the incoherent 3D imaging of multi-circular SAR, we propose that the L1-norm regularization sparse constraint is used in the sub-aperture elevation, and the L2,1-norm regularization group sparsity constraint is used between adjacent sub-apertures. The same pixel unit in adjacent multiple sub-aperture images is used to construct the structural sparsity along the elevation direction to strengthen the 3D target’s spatial structure information, and better holographic target 3D images could be obtained. The main contributions in this paper are as follows: (1) In the multi-circular SAR sub-aperture 3D target reconstruction, the group sparsity between multiple adjacent sub-apertures is introduced and takes into account the target structural sparsity along the elevation direction between sub-apertures. (2) When solving the group sparsity constraint problem, the sparse group thresholding iterative method is adopted to quickly reconstruct the 3D target image. Compared with MCSAR 3D reconstruction results of the L1 norm regularization method and IAA-GLRT algorithm, the detailed experimental results show that the proposed method has great advantages in enhancing the 3D target vertical structure and improving the 3D target imaging quality.

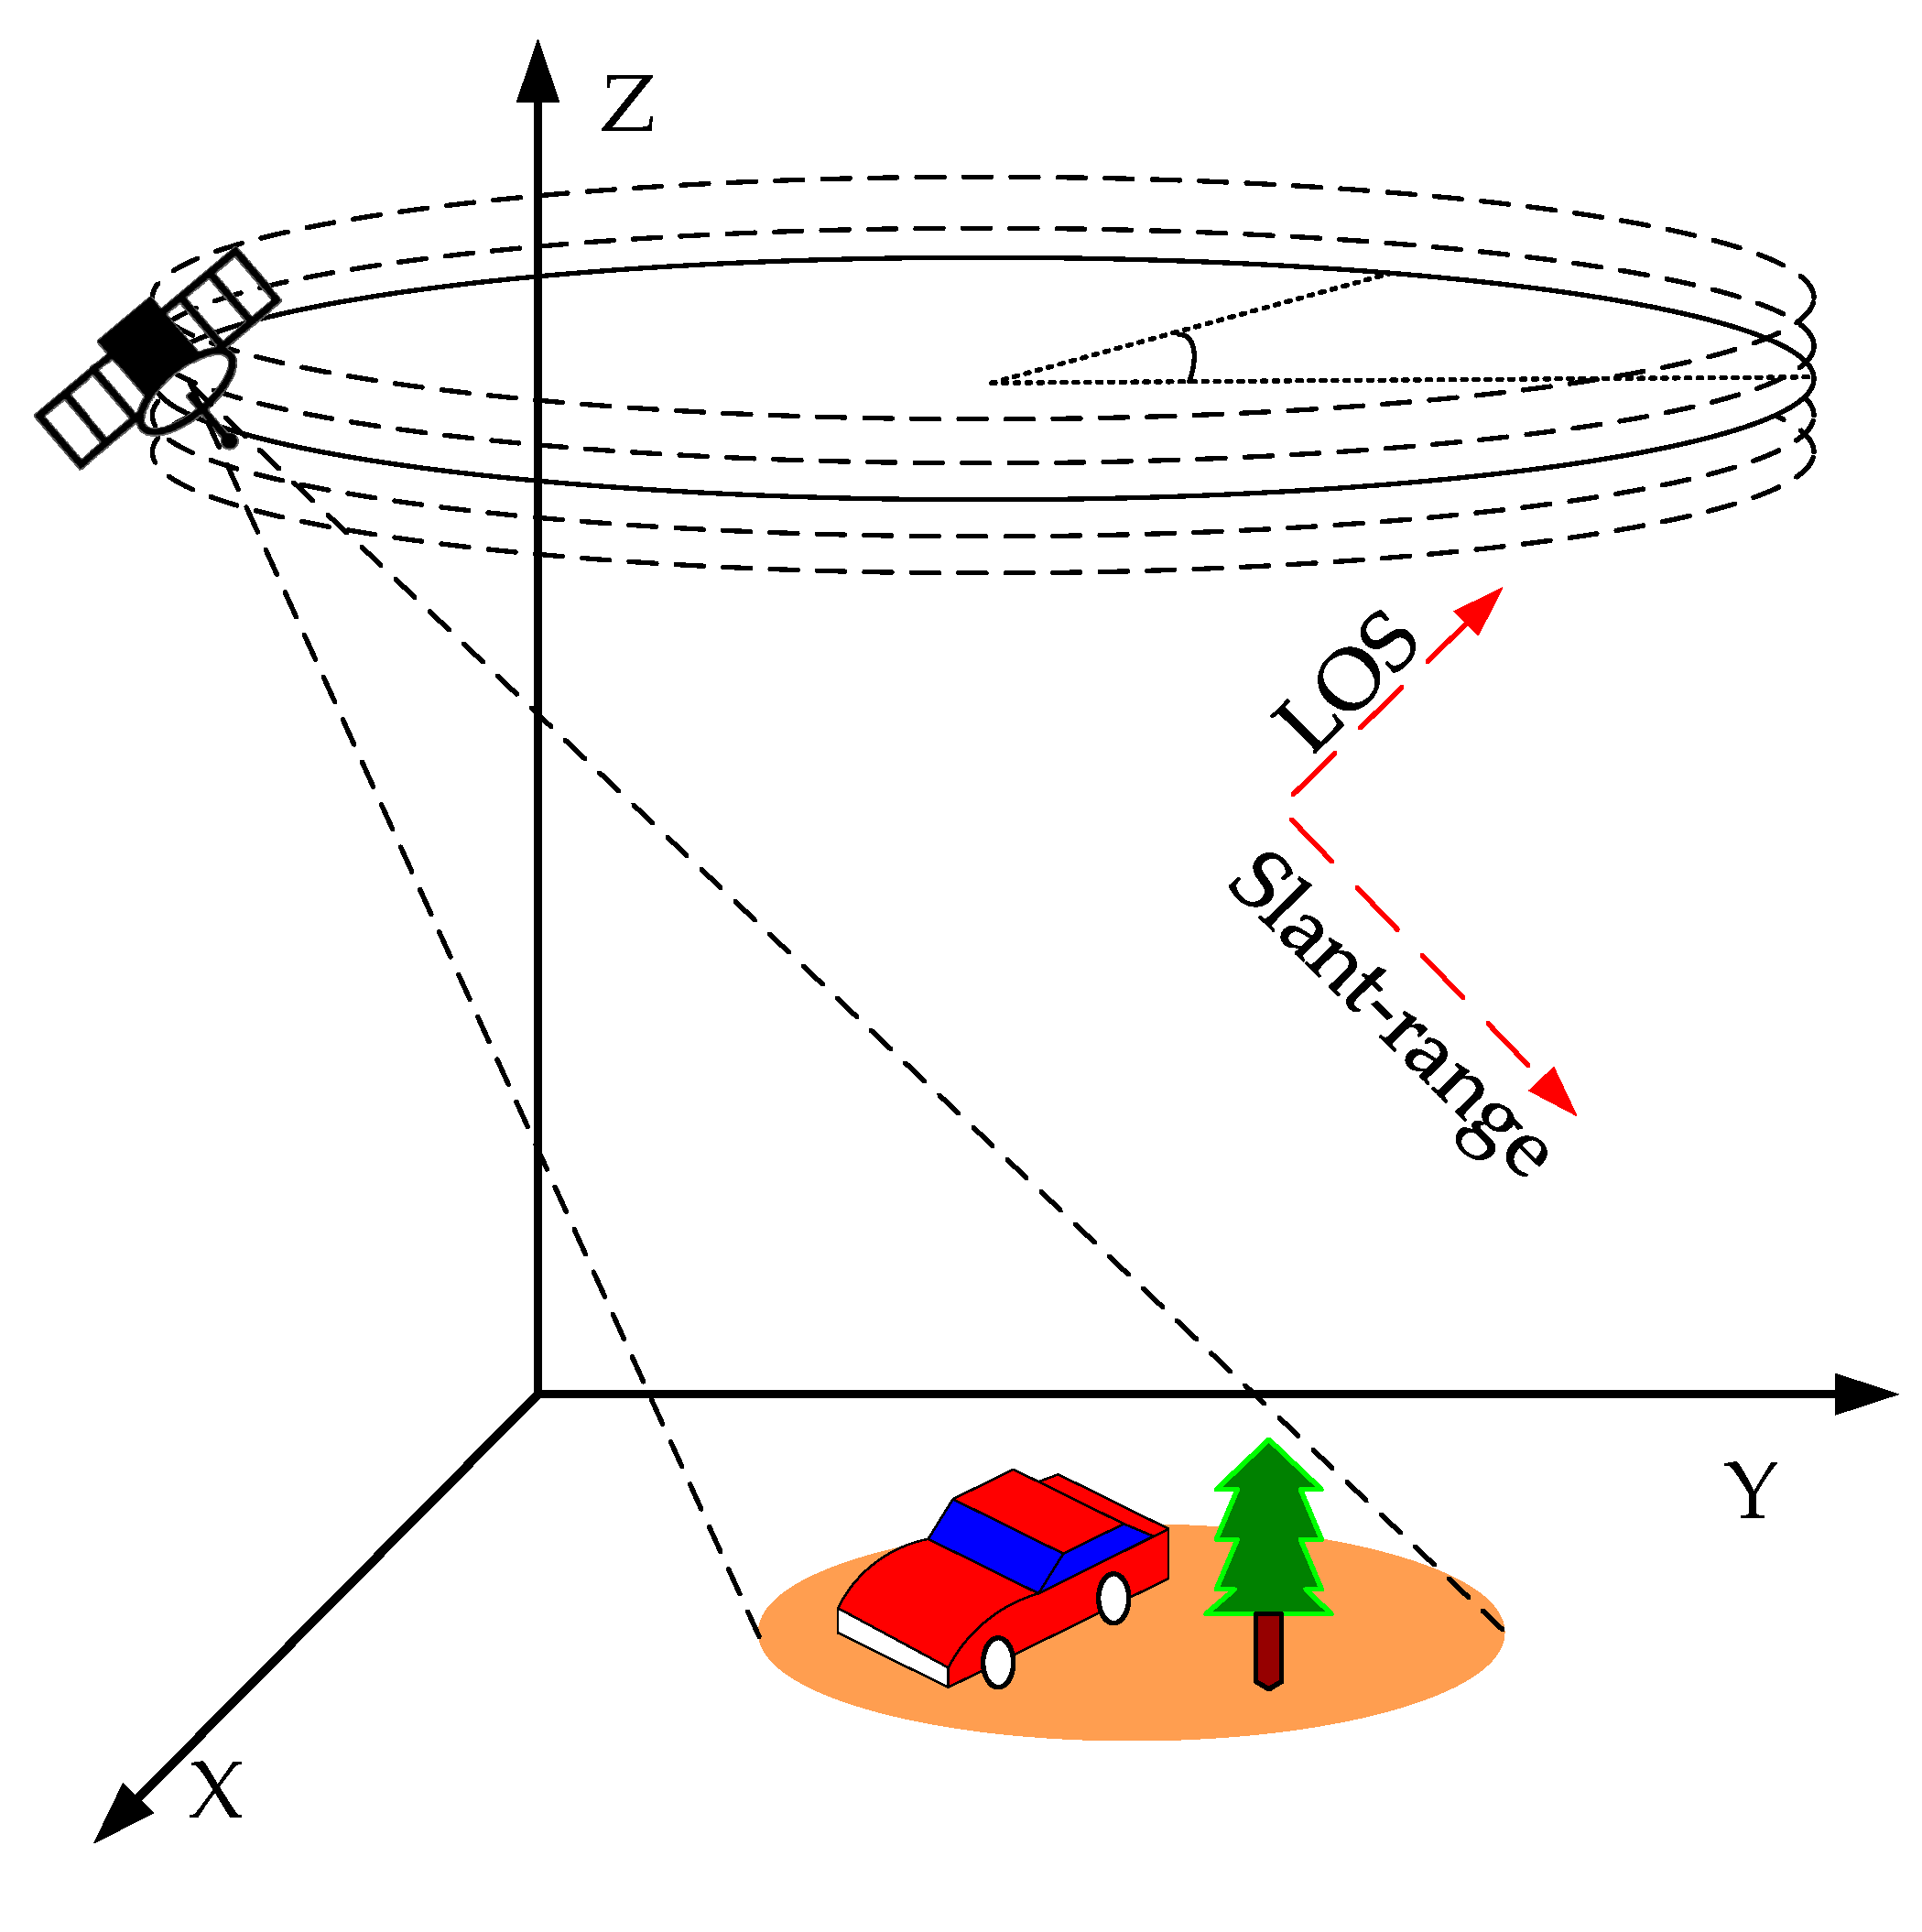
2. The Observation Model in Elevation of MCSAR Sub-Aperture Image Stack

For isotropic scattering point targets, the resolution of sub wavelength level in range azimuth plane could be obtained theoretically by single-pass CSAR, but the resolution in elevation is very low. Multi-circular SAR could realize synthetic aperture in elevation, so as to obtain high resolution in elevation. The MCSAR radar flight geometry is shown in Figure 1. However, the real observation targets are mostly anisotropic scatterers. For multi-circular SAR data, incoherent 3D imaging processing could obtain clearly textured target images.
The complete 360° circular track is divided into Q non-overlapped sub-apertures. The observation model is established by using a set of sub-aperture complex images stack. Let Ij(x, y) denote the complex image stack, gp(x, y) denotes the reflectivity function of the scattering point at the position (x, y, zp(x, y)). In general, the number of scattering points in each resolution unit is variable, and the number and amplitude of target scattering centers need to be estimated from the complex image stack.
According to the MCSAR geometric relationship, the scattering point spatial coordinate position (x, y, zp(x, y)) and the image pixel coordinate position (xl, yl) have the following relationship:
x l = x + z p x , y tan θ m cos ϕ q y l = y + z p x , y tan θ m sin ϕ q
where θm denotes the m-th elevation angle in MCSAR, ϕq denotes the sub-aperture central azimuth angle. When there is a small change in the track elevation, the scattering point falls in the same pixel unit in the imaging plane with different elevation angles observation. The ground 2D images from each track could be modeled as [15,16,17]:
I j x l , y l = p g p x l , y l exp j 4 π f c c cos θ ¯ tan θ m z p x l , y l
where gp denotes the reflectivity function for p-th target, fc denotes center frequency, c denotes light speed, and θ ¯ denotes the average elevation angle. The M two-dimensional complex images are obtained from M circular tracks with different elevation angles. The target scattering intensity and position information could be estimated by using M single-look complex images. The real 3D space position (xk, yk, zk) of the scattering point could be obtained by the corresponding coordinate transformation according to the geometric relationship. The specific coordinate transformation process is expressed as:
x k = x l z p tan θ ¯ cos ϕ q y k = y l z p tan θ ¯ sin ϕ q z k = z p
The observation model of q-th sub-aperture in elevation is established as follows: dispersing along the elevation direction as grids: z = [z1, z2,…, zN], N > Np. Then the observed values of M elevation angles for each pixel unit could be written in the following matrix vector form:
I = A g + ε
where, I is the measurement vector with M elements, I = [I(θ1), I(θ2),…, I(θM)]T, A is the observation matrix of M × N size, which could be expressed as: A = [α(z1), α(z2),…, α(zN)], α z n = exp j 4 π f c cos θ ¯ tan θ z n / c , θ = [θ1,θ2,…, θM]T. g = [g(z1), g(z2),…, g(zN)]T is discrete reflectivity function vector in elevation, and ε represents the noise and desultory point information. In general, the number of passes in the MCSAR acquisition system is very small, and M is less than N. The observation model shown in (4) is a typical underdetermined system. By solving the model (4), the target reconstruction results of each sub-aperture pixel unit along the elevation direction could be obtained.

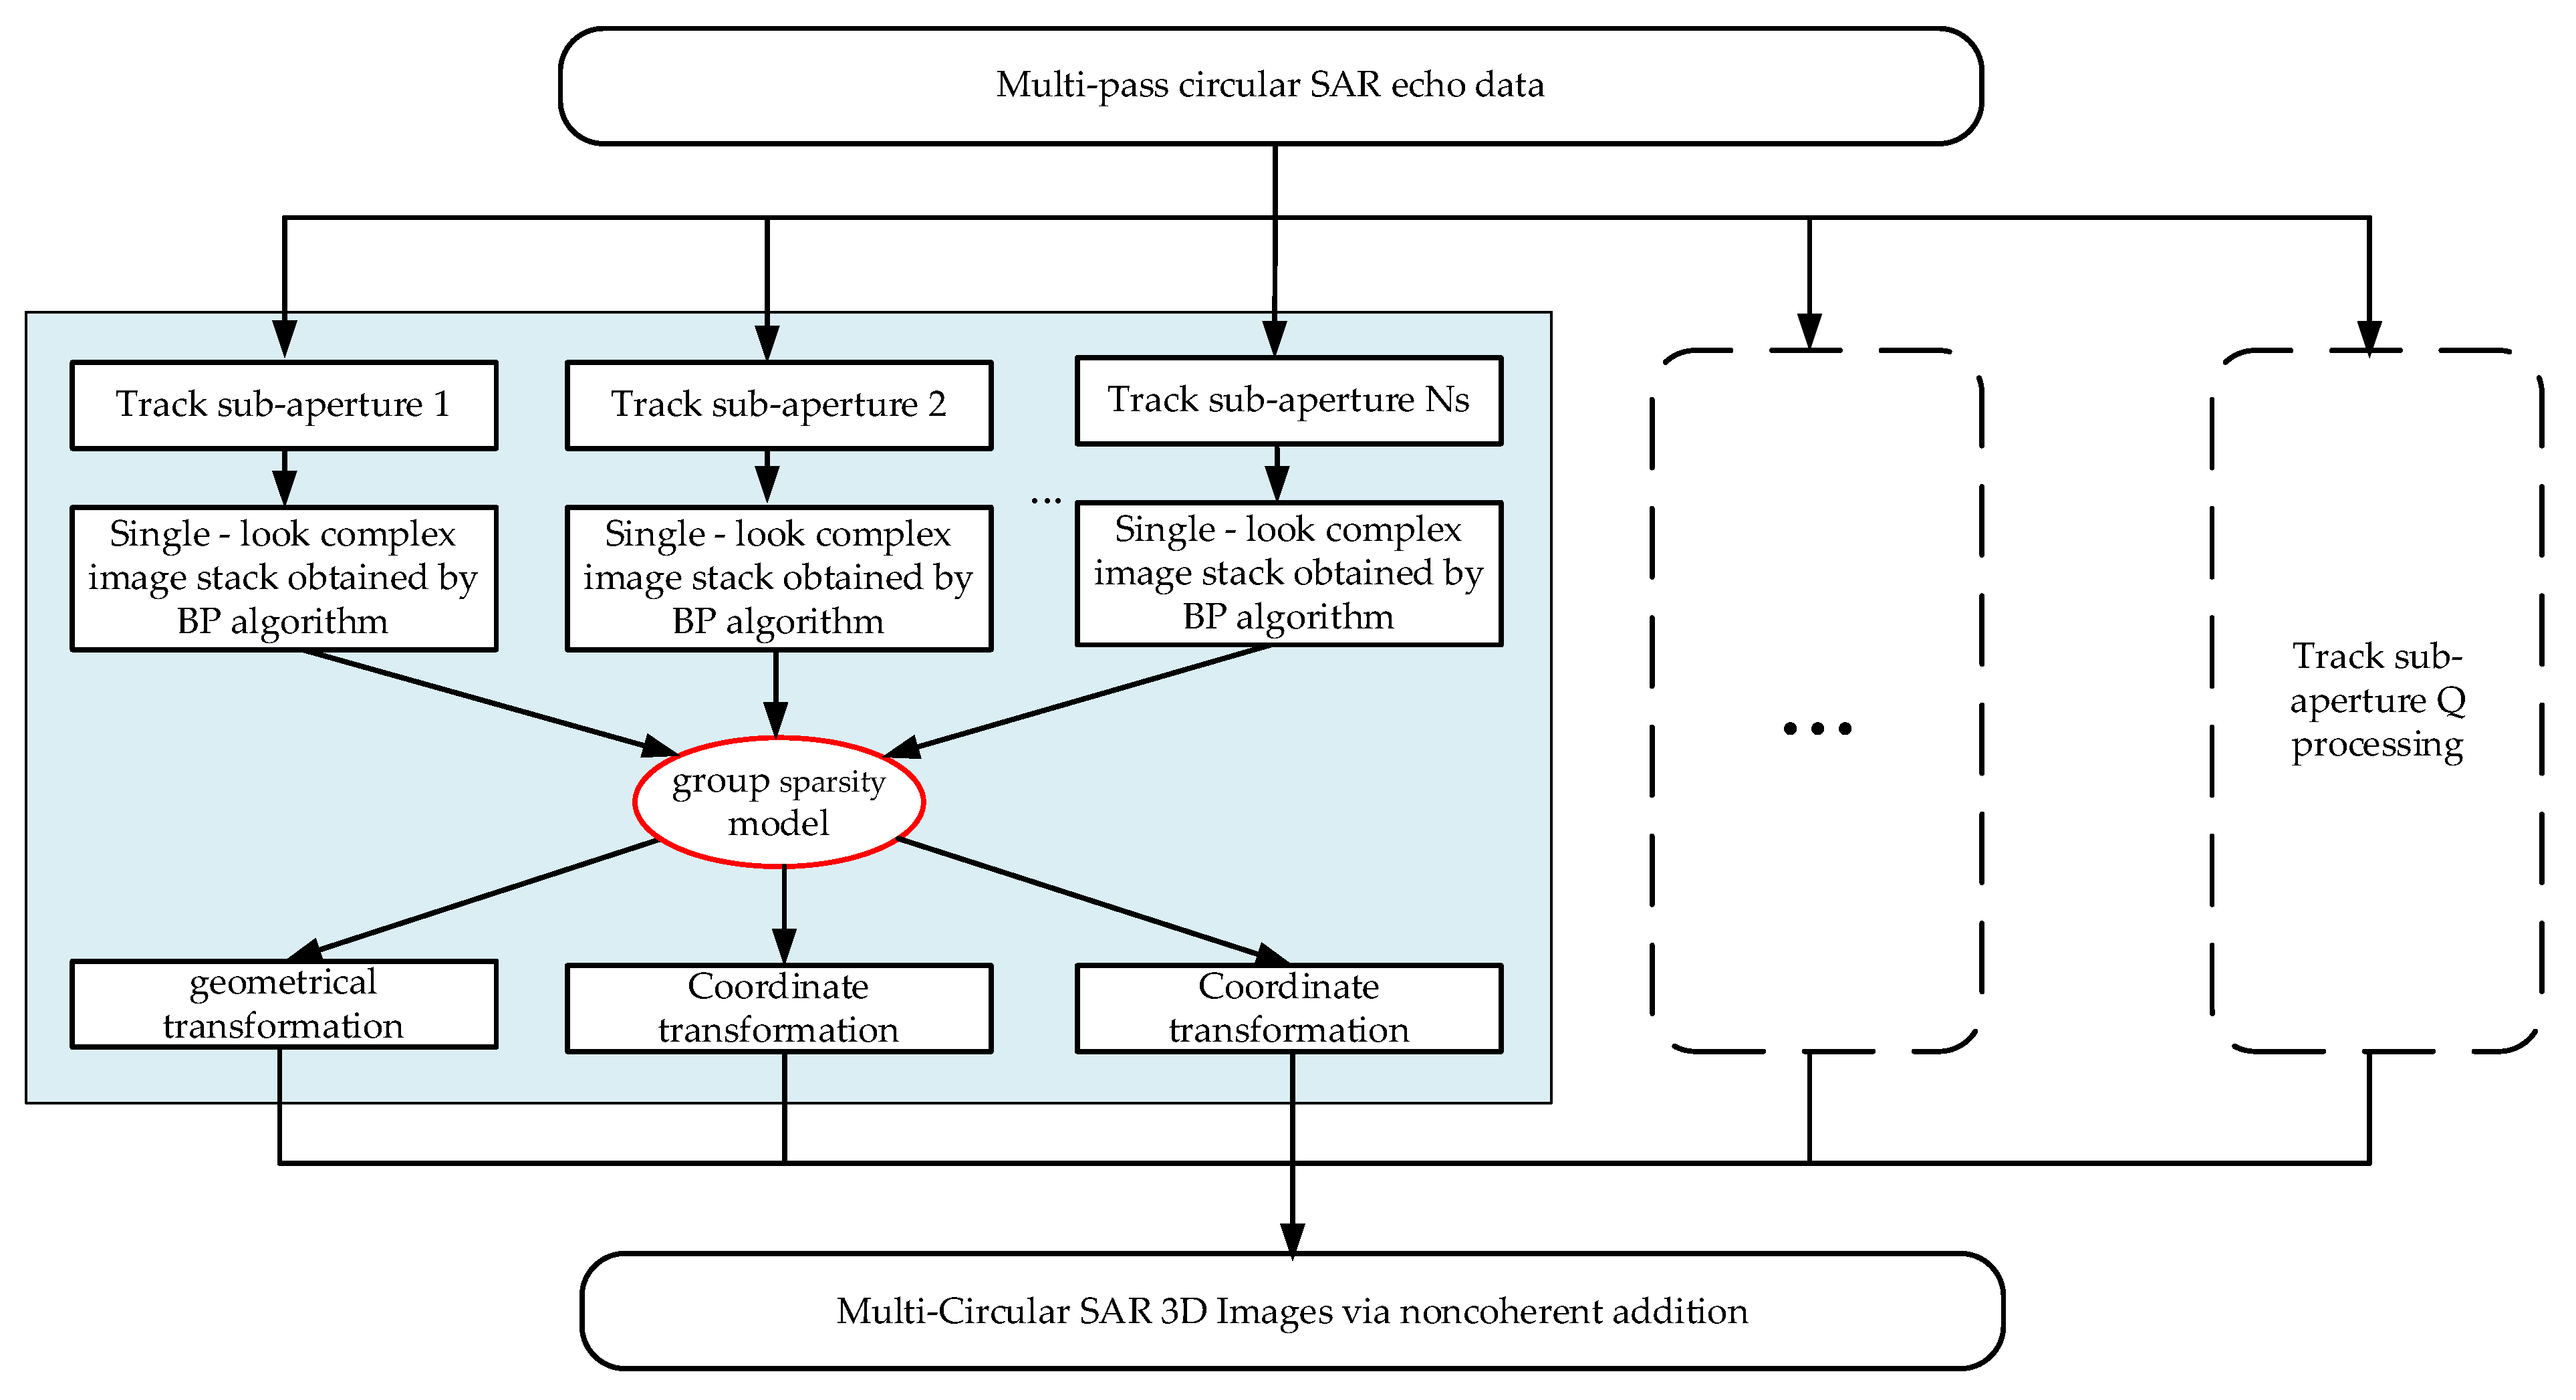
3. The Solution Method of Group Sparse Constraint between Adjacent Sub-Apertures

3.1. L1-Norm Constraint Problem

For different positions of scattering points along the elevation direction of each pixel unit in the sub-aperture image stack, in order to solve the model shown in Equation (4), the L0-norm constraint could be carried out on the target reflectivity coefficient along the elevation direction:
arg min g A g - I 2 2 + λ g 0
where λ denotes the regularization parameter. The L0-norm constraint is NP-hard problem. Under the condition of sparsity, the general solution is approximated as L1 norm regularization problem [18]. The iterative shrinkage thresholding (IST) [19] method is an efficient L1 norm problem solving method, which could obtain stable sparse solution when the observation value is small.
For the elevation direction of each pixel unit in the sub-aperture image stack, the thresholding shrinkage solution sequence of the L1-norm constraint problem could be expressed as follows:
g t + 1 = η 1 , λ 1 μ g t + μ A H I A g t
where t denotes the number of iterations, η 1 , λ 1 μ denotes the soft thresholding operator. The traditional IST algorithm requires many iterations. In order to obtain the stable sparse solution more quickly, the acceleration operator is generally used to accelerate:
γ t + 1 = 1 + 1 + 4 γ t 2 2 g ( t + 1 ) = g ( t ) + γ t 1 γ t + 1 g ( t ) g ( t 1 )
The specific reconstruction process using the IST algorithm to reconstruct the target in elevation is as follows:
Initialization: g0 = 0, regularization parameter λ1, iteration parameter μ, acceleration operator initial value: γ1 = 1, maximum iteration number Tmax.
For each pixel units in the sub-aperture image stack, in t iteration:
Step 1: Acceleration operator: γ t + 1 = 1 + 1 + 4 γ t 2 2 , g ( t ) = g ( t ) + γ t 1 γ t + 1 g ( t ) g ( t 1 ) .
Step 2: Estimate the residual of the sparse solution in step t: Δ r ( t ) = I A g ( t ) .
Step 3: The soft thresholding operator is used to calculate the sparse solution estimated value in the t+1 iteration: g ( t + 1 ) = η 1 , λ 1 μ g ( t ) + μ A H Δ r ( t ) .
Step 4: When the maximum iterations number Tmax is reached, the solution of sparse reconstruction is output: g ^ = g ( t + 1 ) .
In the entire iteration process, there are two important parameters: regularization parameter λ1 and iterative parameter μ. The iterative parameter μ controls the convergence speed of the algorithm. When the μ value increases, the convergence speed increases, but the reconstruction accuracy decreases. In the actual solution process, it is necessary to select the appropriate iterative parameter value. The regularization parameter λ1 is determined according to the sparsity of the reconstruction target.

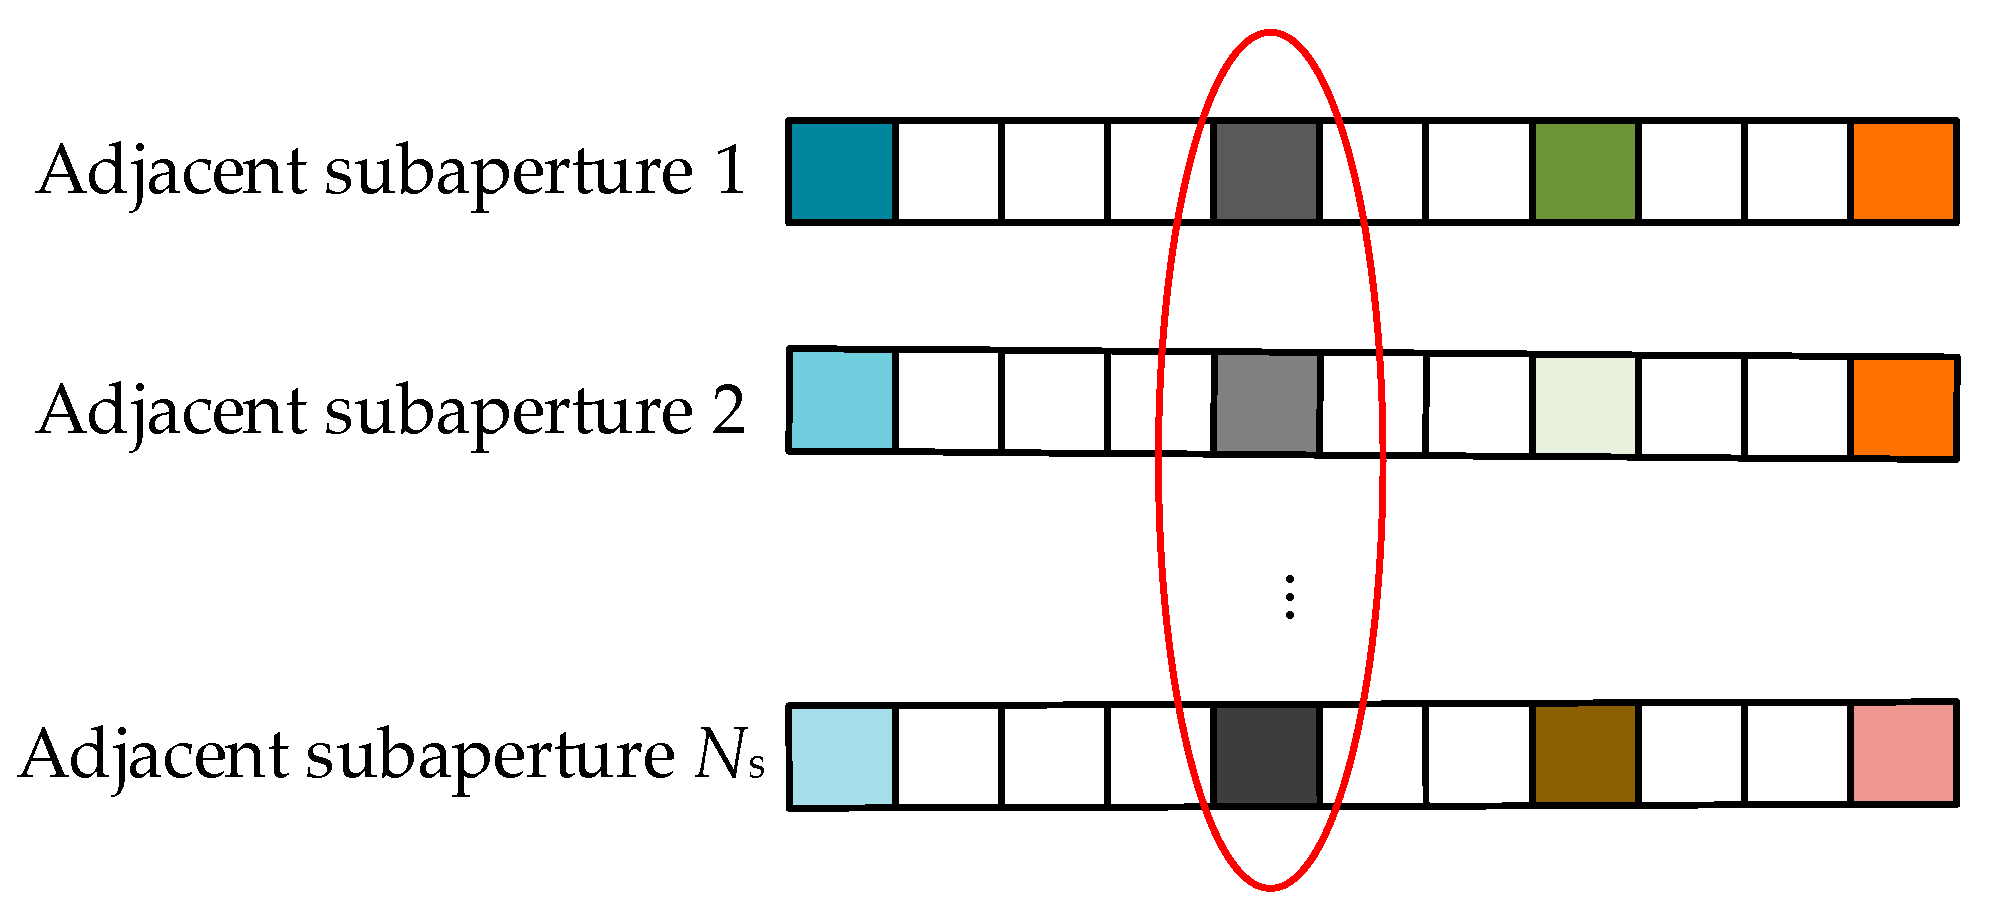
3.2. The Group Sparsity between Adjacent Sub-Apertures

By solving the L1-norm regularization constraint problem, a target reconstructed image along the elevation direction in each pixel cell could be obtained, but the correlation between the adjacent sub-apertures is not considered, and the target reconstruction results are not ideal. Related studies have shown that the strong scattering characteristics of the edges and angles of man-made objects could remain relatively stable in the rotation angle from 10° to 20° [20]. The circular SAR realizes omni-directional observation. When the circular track is divided into multiple sub-apertures, there is a certain correlation in several adjacent sub-apertures, which could be described by group sparsity constraints. The group sparsity constraint means that the elements in the reconstruction vector appear in groups, and the elements in the same group are zero or not zero at the same time. In Section 2, the observed target could be composed of multiple ideal scattering centers. The target scattering coefficient changes with the azimuth angle, but the scattering center position coincides with the large probability when the azimuth angle has little change, so the group sparsity could be introduced to improve the reconstruction performance.
In this paper, the multi-circular SAR sub-aperture group sparsity constraint is proposed, which refers to the construction of the same pixel unit in the adjacent sub-aperture complex image into a group sparsity constraint. Assuming that the maximum number of Ns adjacent sub-apertures form a group sparsity constraint, the group sparsity characteristic of the same pixel unit is shown in Figure 2. As shown in Figure 2, when the azimuth angle experiences small changes, the amplitude and phase of the strong point scattering information between adjacent sub-apertures may change, but the position along the elevation direction remains the same, and, consequently, the strong scattering points of the same pixel unit in different sub-aperture images appear at the same position along the elevation direction, which could be constrained by the group sparsity characteristics.
The flow chart of the multi-circular SAR incoherent 3D imaging method, based on the adjacent sub-apertures group sparsity, is shown in Figure 3. Firstly, the complete multi-circular trajectory is divided into non-overlapping sub-apertures, and the back projection (BP) focusing algorithm is used to obtain the sub-aperture complex image stack. Then, the group sparsity constraint optimization problem of adjacent Ns sub-aperture is solved to obtain each sub-aperture 3D target image. Finally, the coordinate transformation in each sub-aperture is carried out to obtain the target scattering point’s real position in XYZ coordinates. All sub-apertures are incoherently integrated to obtain the 3D holographic target image observed by multi-circular SAR.
The group sparsity of the same pixel unit between adjacent sub-apertures could be characterized by L2,1 mixed norm constraint:
arg min g A g - I 2 2 + λ g 2 , 1 1
where, the L2,1 mixed norm reflects the group sparsity characteristics, which is defined as follows [21]:
g 2 , 1 = l = 1 L n = 1 N s g n l 2 1 2
where, g n l denotes the l-th element in g n and L denotes the length of vector g n . The group sparsity model guarantees the sparse constraint condition between groups, and the elements in the same group are not all zero, so the sparse constraint could be further carried out on the elements in the same group.
The group sparsity constraints are used between groups, and the traditional sparse constraints within the group are hierarchical sparse constraints [22]. For the 3D target imaging of multi-circular SAR sub-apertures, the hierarchical sparse constraint problem is adopted, which not only considers the target sparsity along the elevation direction in the sub-aperture, but also achieves the group sparsity of the same pixel unit between the adjacent sub-apertures. When reconstructing the target in elevation with multi-circular SAR data, L1 norm regularization is used to characterize the sparsity in the sub-aperture, and L2,1 mixed norm is used to characterize the group sparsity of the same pixel unit in adjacent sub-apertures:
arg min g A g - I 2 2 + λ 2 g 2 , 1 + λ 1 g 1
where, λ1 and λ2 are regularization parameters, λ1 constrains the sparsity in subapertures, and λ2 characterizes the group sparsity between sub-apertures.

3.3. Sparse Group Thresholding Iterative Solving

The group sparsity constraint problem could be solved using sparse group thresholding iterative [22]:
g t + 1 = arg min g n ( t ) - u ¯ n ( t ) 2 + λ 2 g 2 , 1 + λ 1 g 1 = H 2 | 1 , λ 2 u u ¯ 1 ( t ) , u ¯ 2 ( t ) , , u ¯ N s ( t )
where, μ is the iterative step size control convergence speed, u ¯ 1 ( t ) , u ¯ 2 ( t ) , , u ¯ N s ( t ) is the same pixel unit in Ns adjacent sub-apertures. H(•) is the sparse group thresholding function:
H 2 | 1 , λ 2 u u ¯ 1 ( t ) , u ¯ 2 ( t ) , , u ¯ N s ( t ) = u ¯ 1 ( t ) , u ¯ 2 ( t ) , , u ¯ N s ( t ) · max 1 λ 2 u U g ( t ) 2 , 0
where λ 2 = U g ( t ) K + 1 μ . U g ( t ) K + 1 denotes the (K+1)th largest element of the amplitude U g ( t ) . U g ( t ) denotes group vector as follows:
U g ( t ) = n = 1 N s u ¯ n ( t ) 2
where u ¯ ( t ) = η 1 , λ 1 μ g ( t 1 ) + μ A H I A g ( t 1 ) denotes the (t)th iteration in the pixel unit with the IST algorithm. Through the sparse group thresholding iterative process for each pixel unit, the sparse reconstruction along the elevation direction of all pixel units in the sub-aperture is ensured, and the group sparsity between adjacent sub-apertures is ensured.
The sparse group thresholding iterative processes for adjacent sub-apertures to target reconstruction is as follows:
Initialization: g(0) = 0; t = 0; iterative parameter: μ; The sparsity in elevation: K; maximum number of iterations: Tmax
The following target reconstruction process in elevation is carried out for the same pixel unit in Ns adjacent sub-aperture complex images:
For t = 0 to Tmax do
  For n = 1 to Ns do
    Update gradient direction: G n ( t + 1 ) = g n ( t + 1 ) + μ A H I A g n ( t )
    Calculation of L1 norm regularization parameter: λ 1 = G n ( t + 1 ) K + 1 / μ
    Iterative soft thresholding update: u ¯ n ( t + 1 ) = η 1 , λ 1 μ G n ( t + 1 )
  End For
    Construction of group vector: U g ( t + 1 ) = n = 1 N s u ¯ n ( t + 1 ) 2
    Calculation of L2,1 norm regularization parameter: λ 2 = U g ( t + 1 ) K + 1 / μ
    Group thresholding iterative update: g 1 ( t + 1 ) , g 2 ( t + 1 ) , , g N s ( t + 1 ) = u ¯ 1 ( t + 1 ) , u ¯ 2 ( t + 1 ) , , u ¯ N s ( t + 1 ) · max 1 λ 2 u U g ( t + 1 ) 2 , 0
  When t > Tmax: g ^ n = g n ( t )
End For
Each pixel unit in each sub-aperture is iteratively solved to obtain the 3D target reconstruction image. According to the corresponding flight geometry, the 3D coordinate transformation of each sub-aperture 3D image is carried out to transform the 3D target image from the radar coordinate system to the ground coordinate system. The final 3D holographic target reconstruction result is obtained by non-coherently integrating all the individual sub-aperture 3D images.

3.4. Computational Complexity Analysis

The hierarchical sparsity constraint method in multi-circular SAR 3D target reconstruction is proposed in this paper, the L1-norm regularization is used in elevation of the sub-aperture, and the L2,1-regularization-based group sparsity constraint is adopted in elevation of the adjacent sub-aperture. The L1-norm regularization is solved by ISTA. Its computational complexity concentrates on multiplication of matrix and vector, and the computational complexity is O(N2). The L2,1-norm regularization is solved by the mixed norm thresholding function, which only involves the scalar multiplication of vector, and the computational complexity is O(N). The computational complexity of the proposed algorithm is not high.

4. Experimental Analysis

In order to verify the effectiveness of the proposed method, simulation data and real observed MCSAR data were used to analyze the effectiveness of the proposed method. The real observed MCSAR dataset used GOTCHA Volumetric SAR Data Set [23,24]. This dataset consisted of full-polarization CSAR data from pass 1–pass 8. The average elevation angle baselines of the eight passes were between 43.06° and 45.66°. However, the actual flight path was not perfectly circular, as shown in Figure 4. The elevation angle baselines of the first three sub-apertures in the GOTCHA data set were selected in the simulation data analysis.

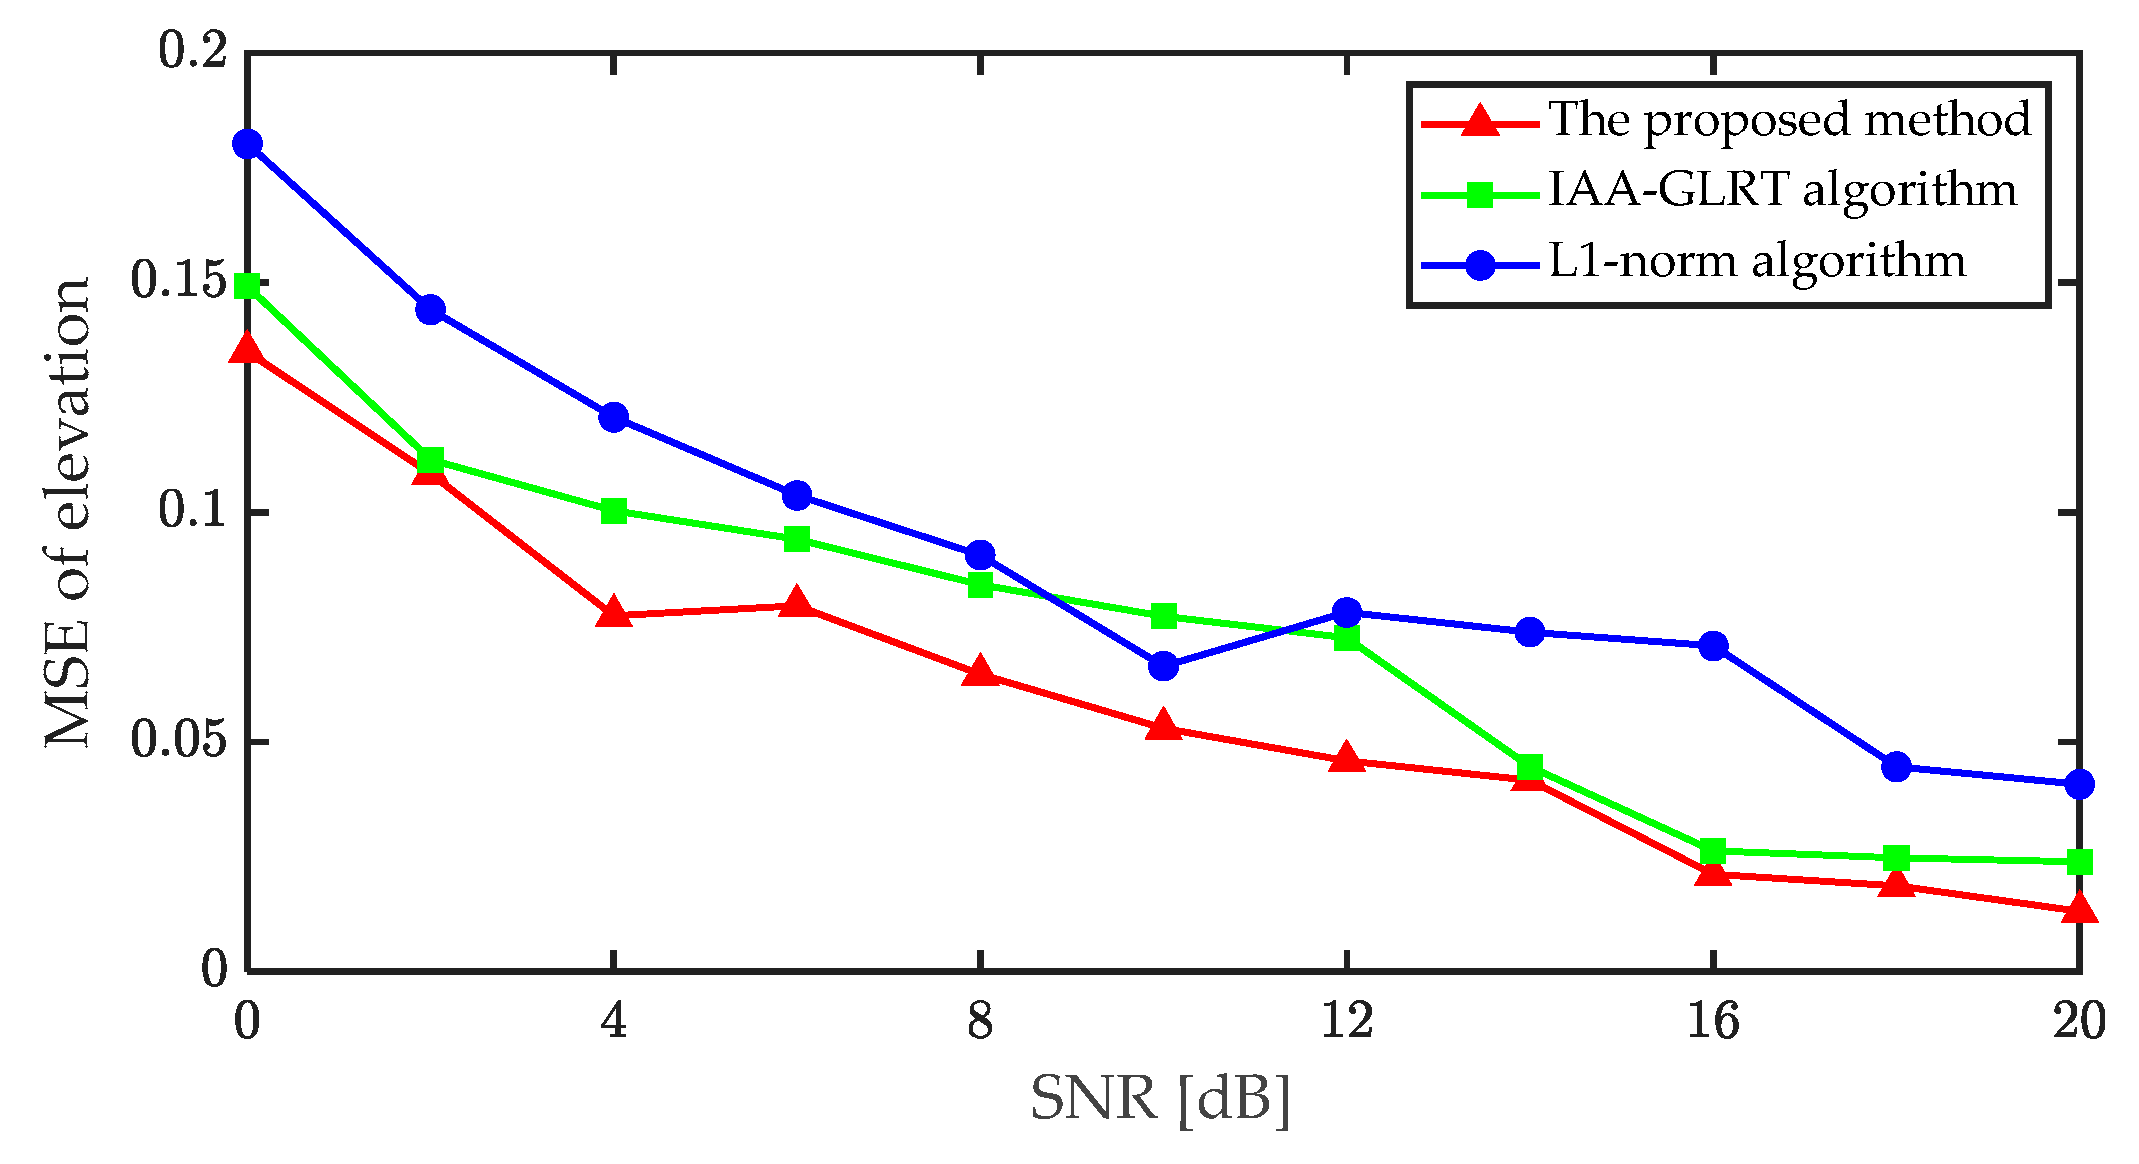
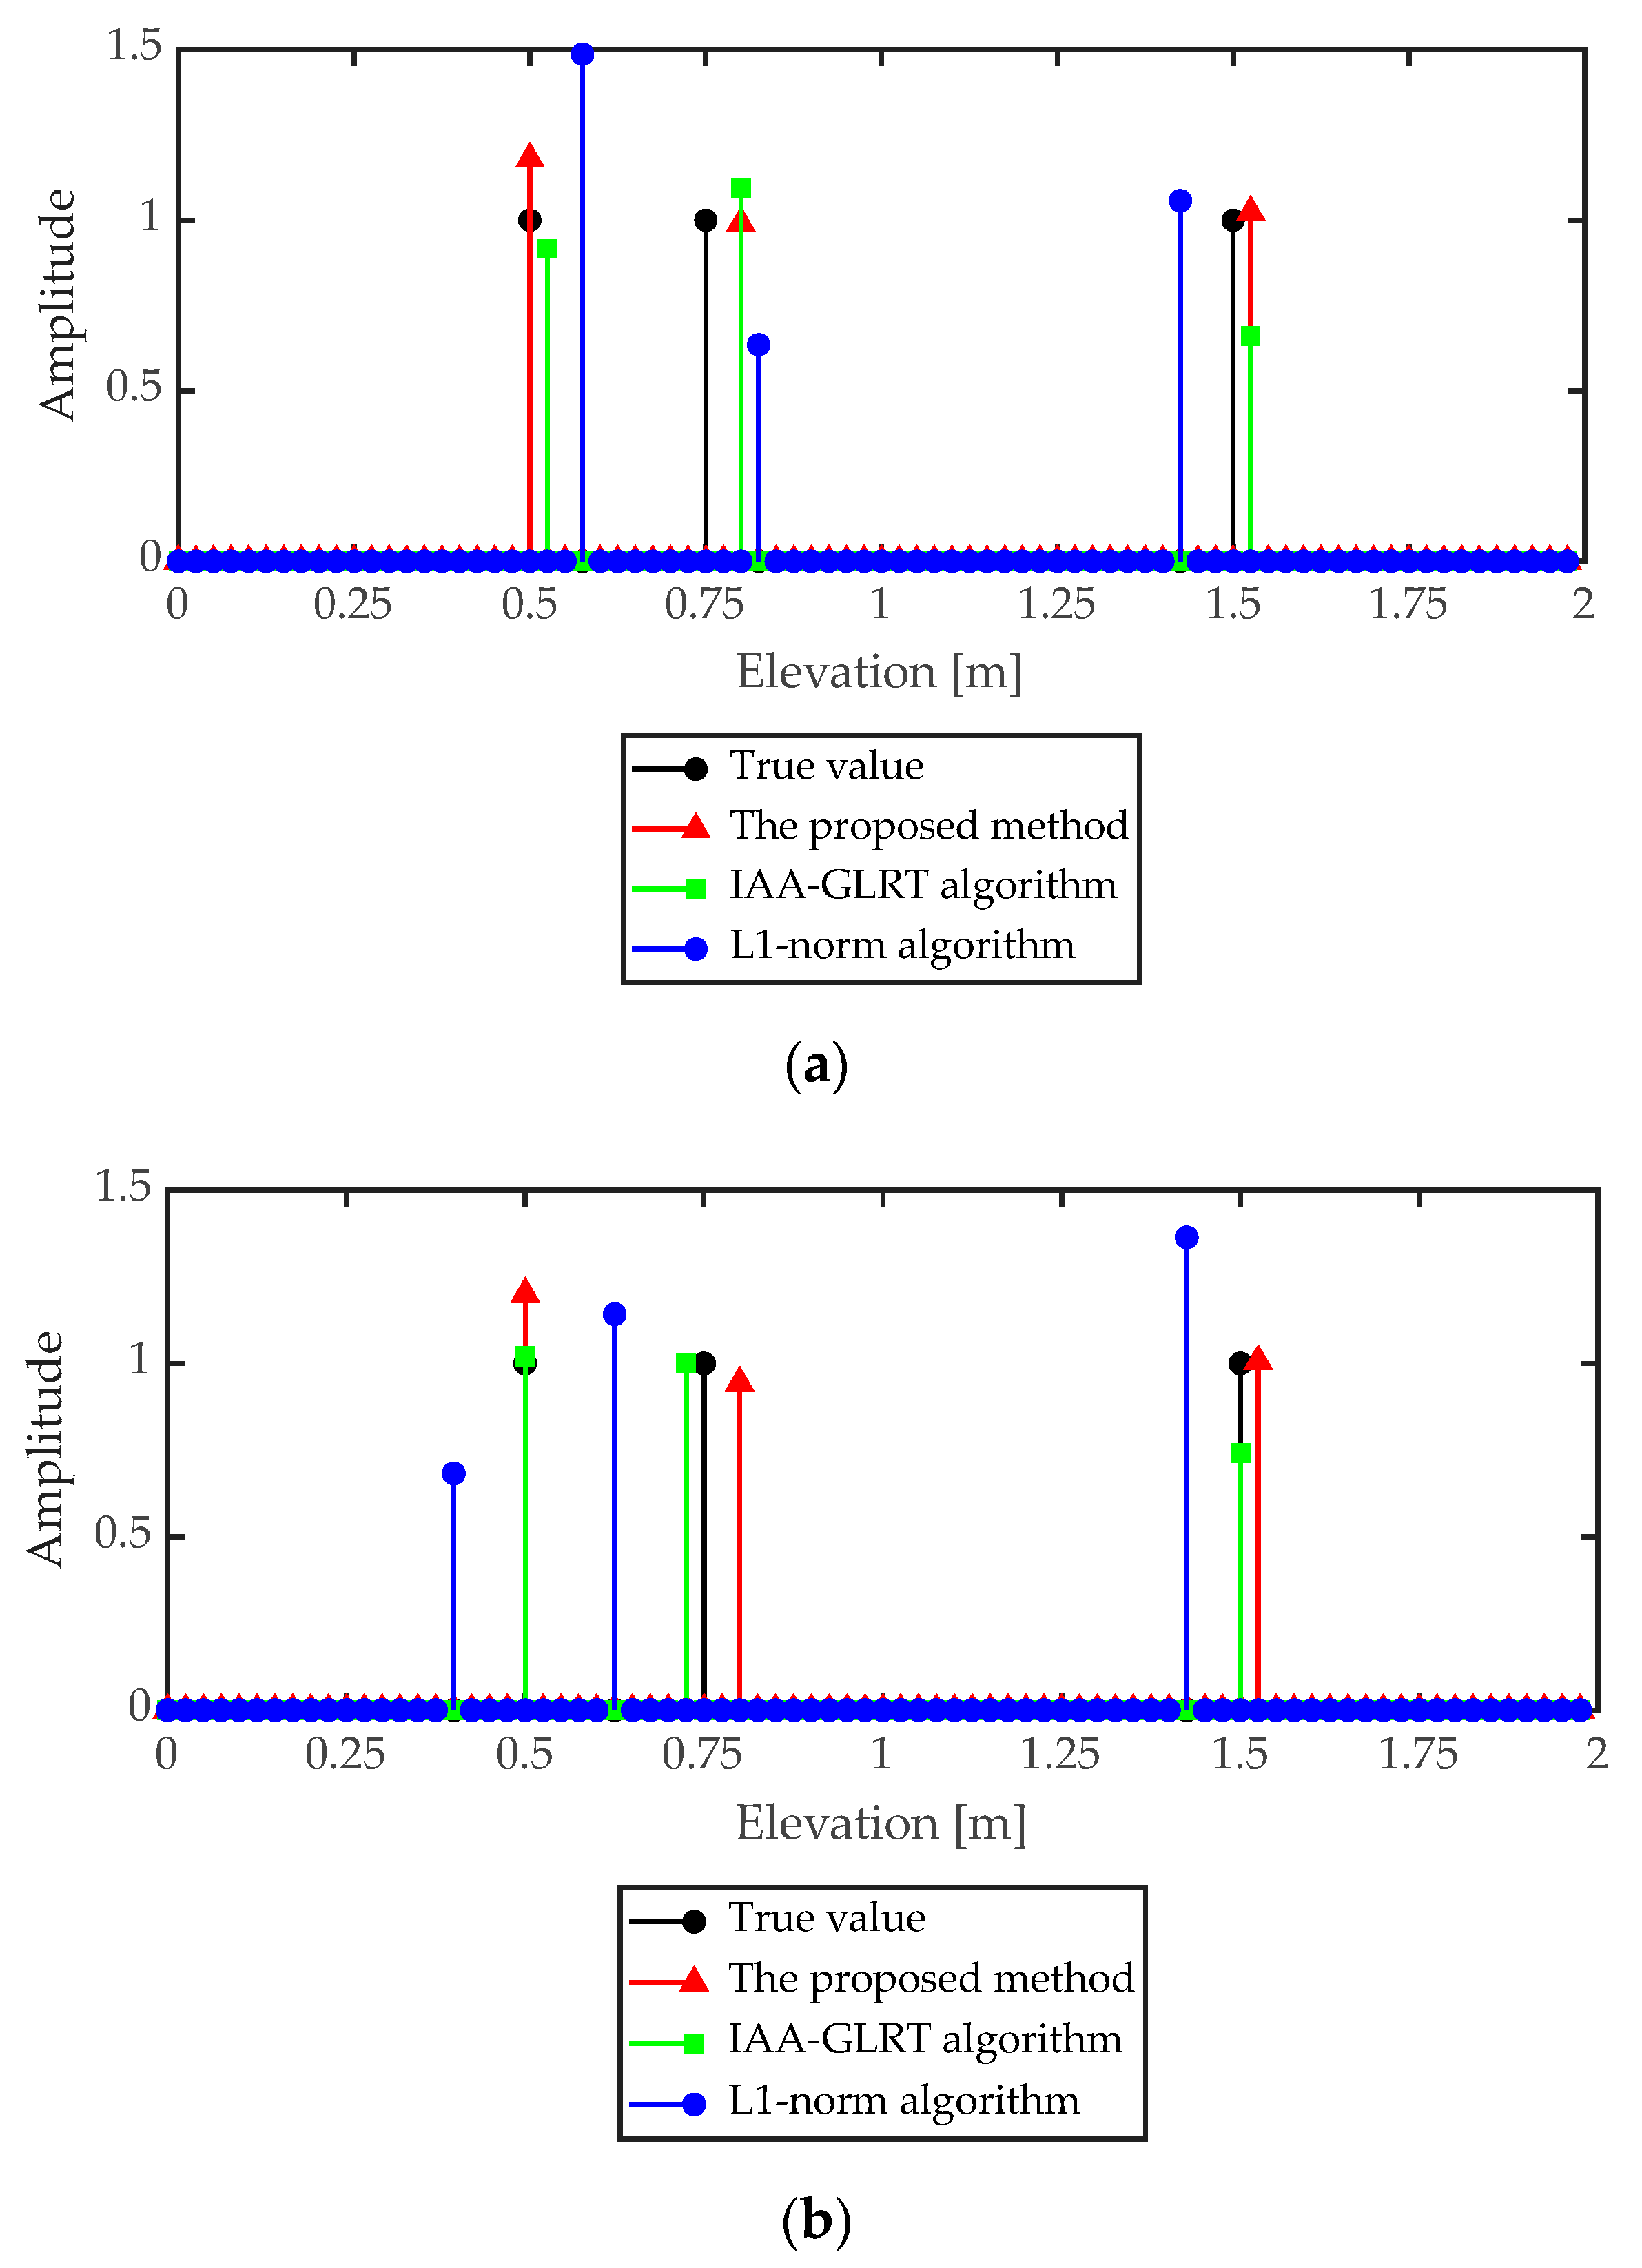
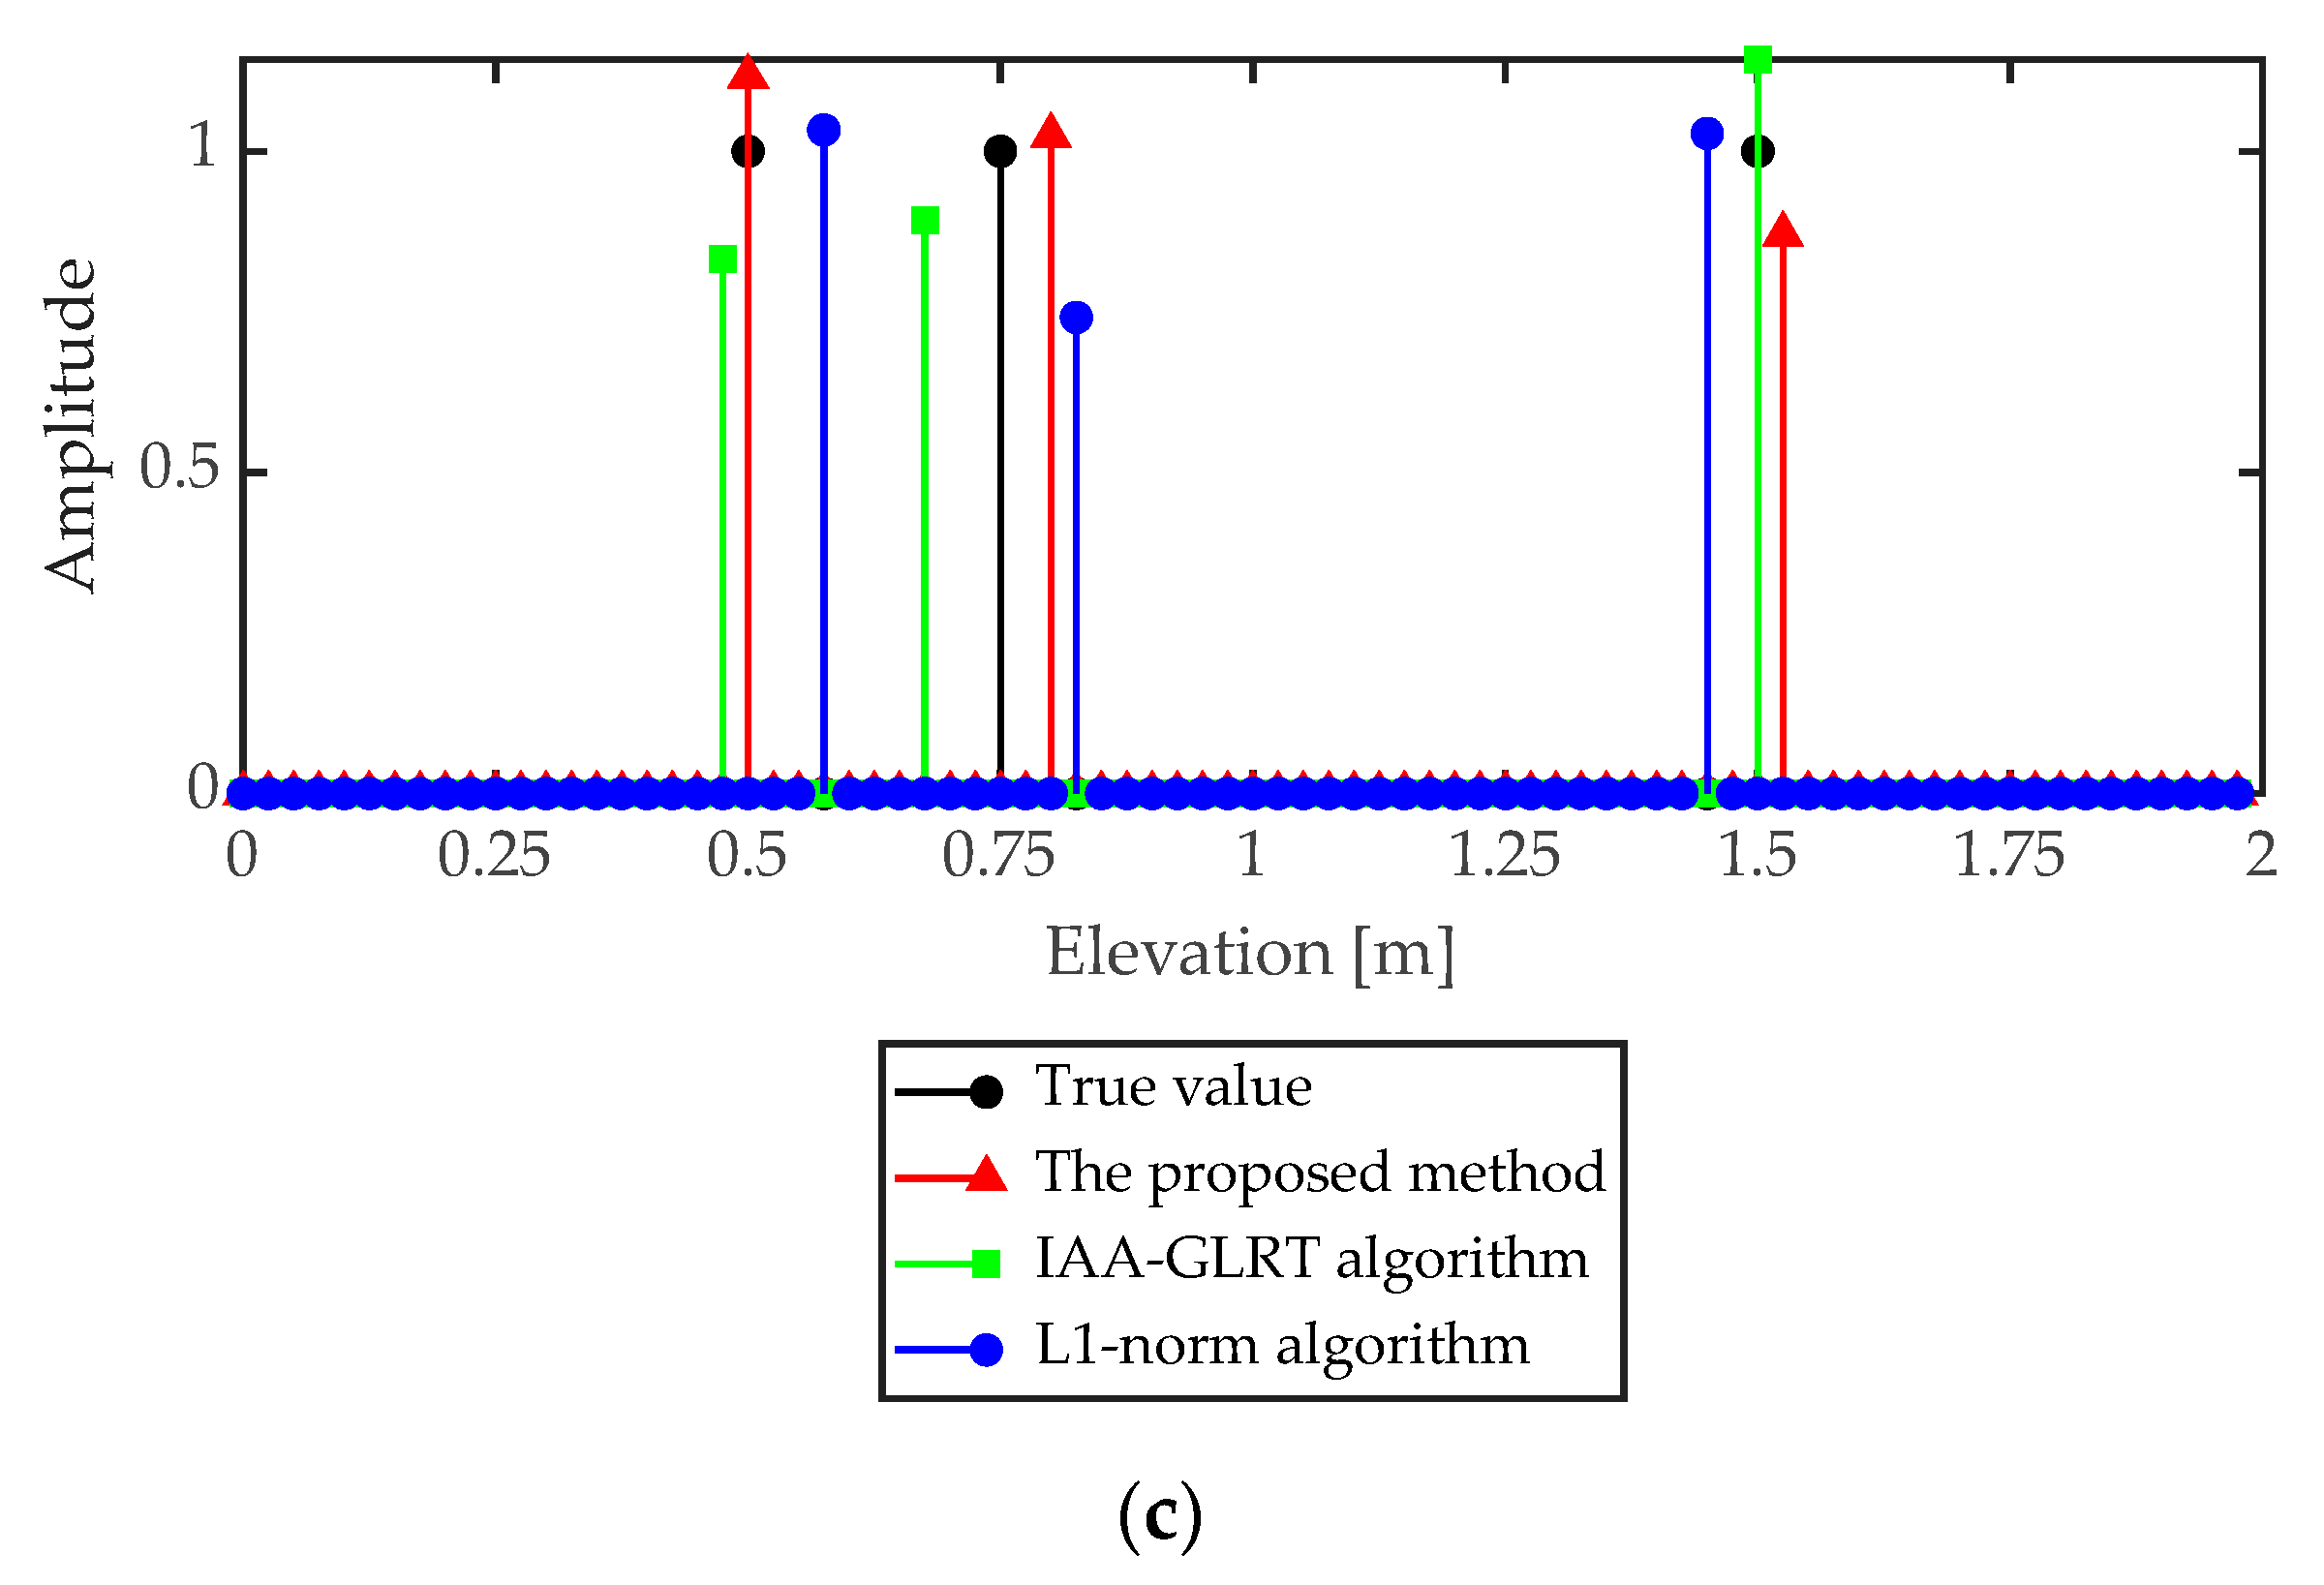
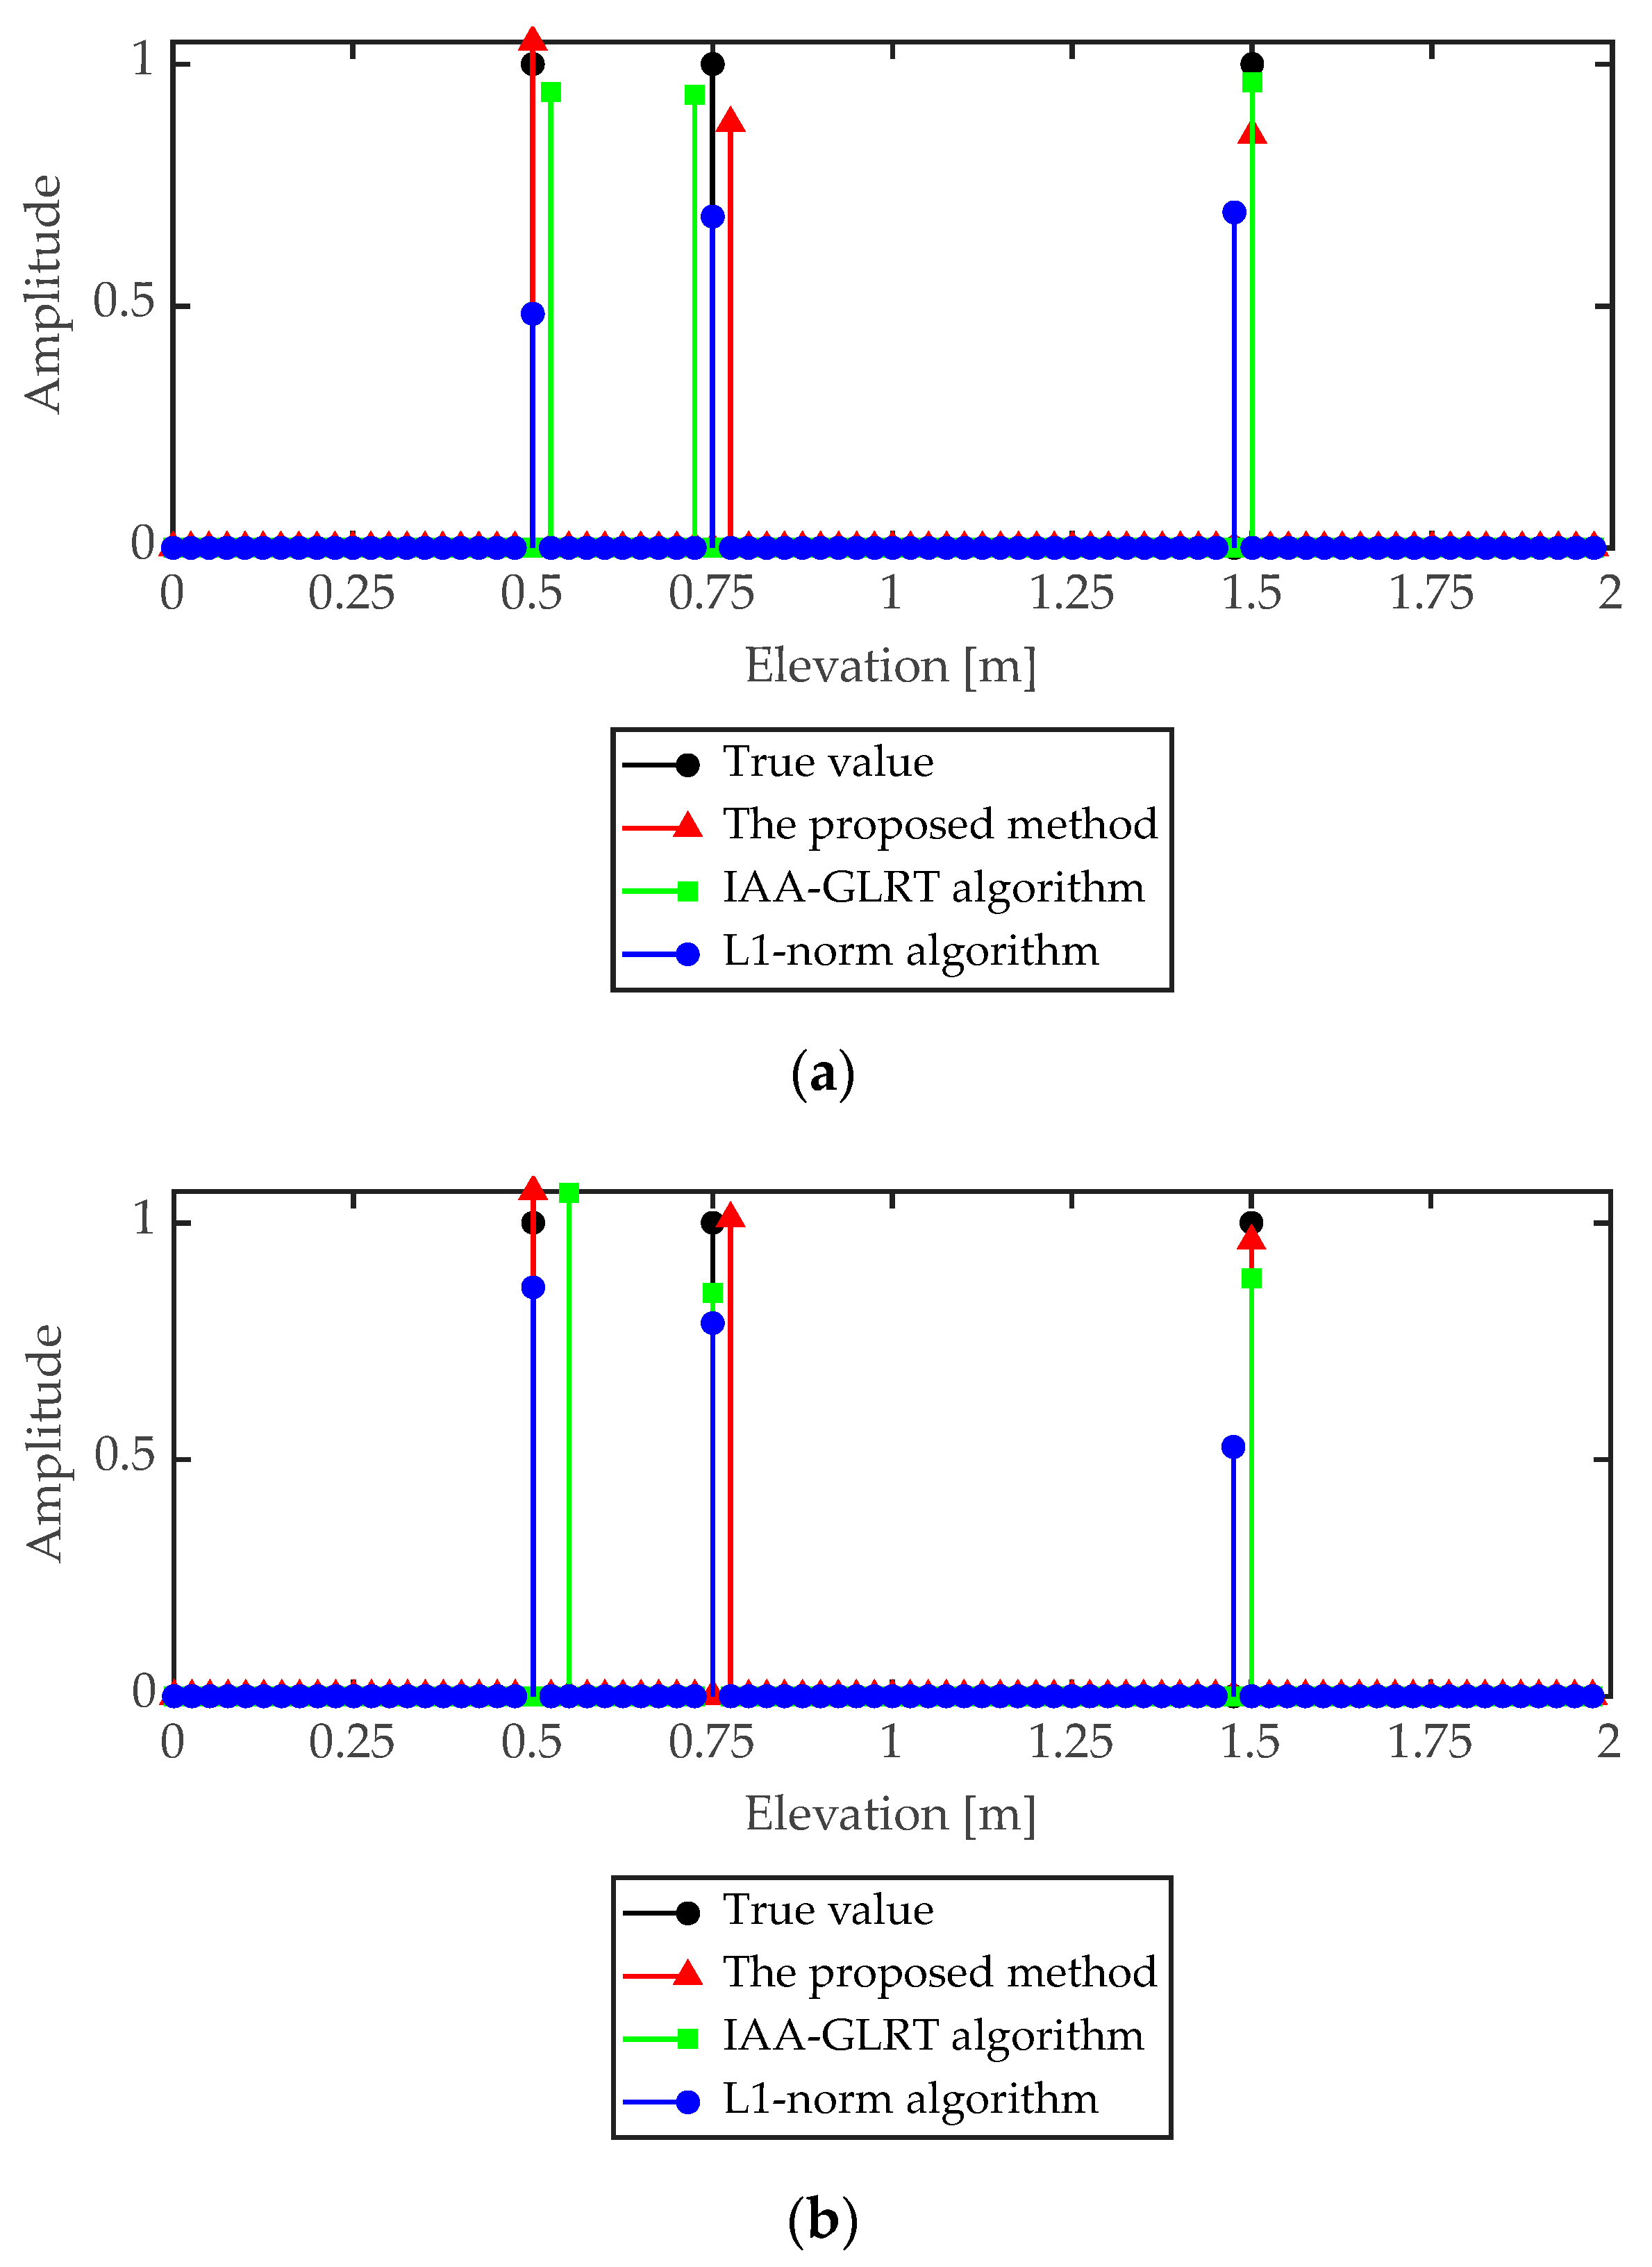
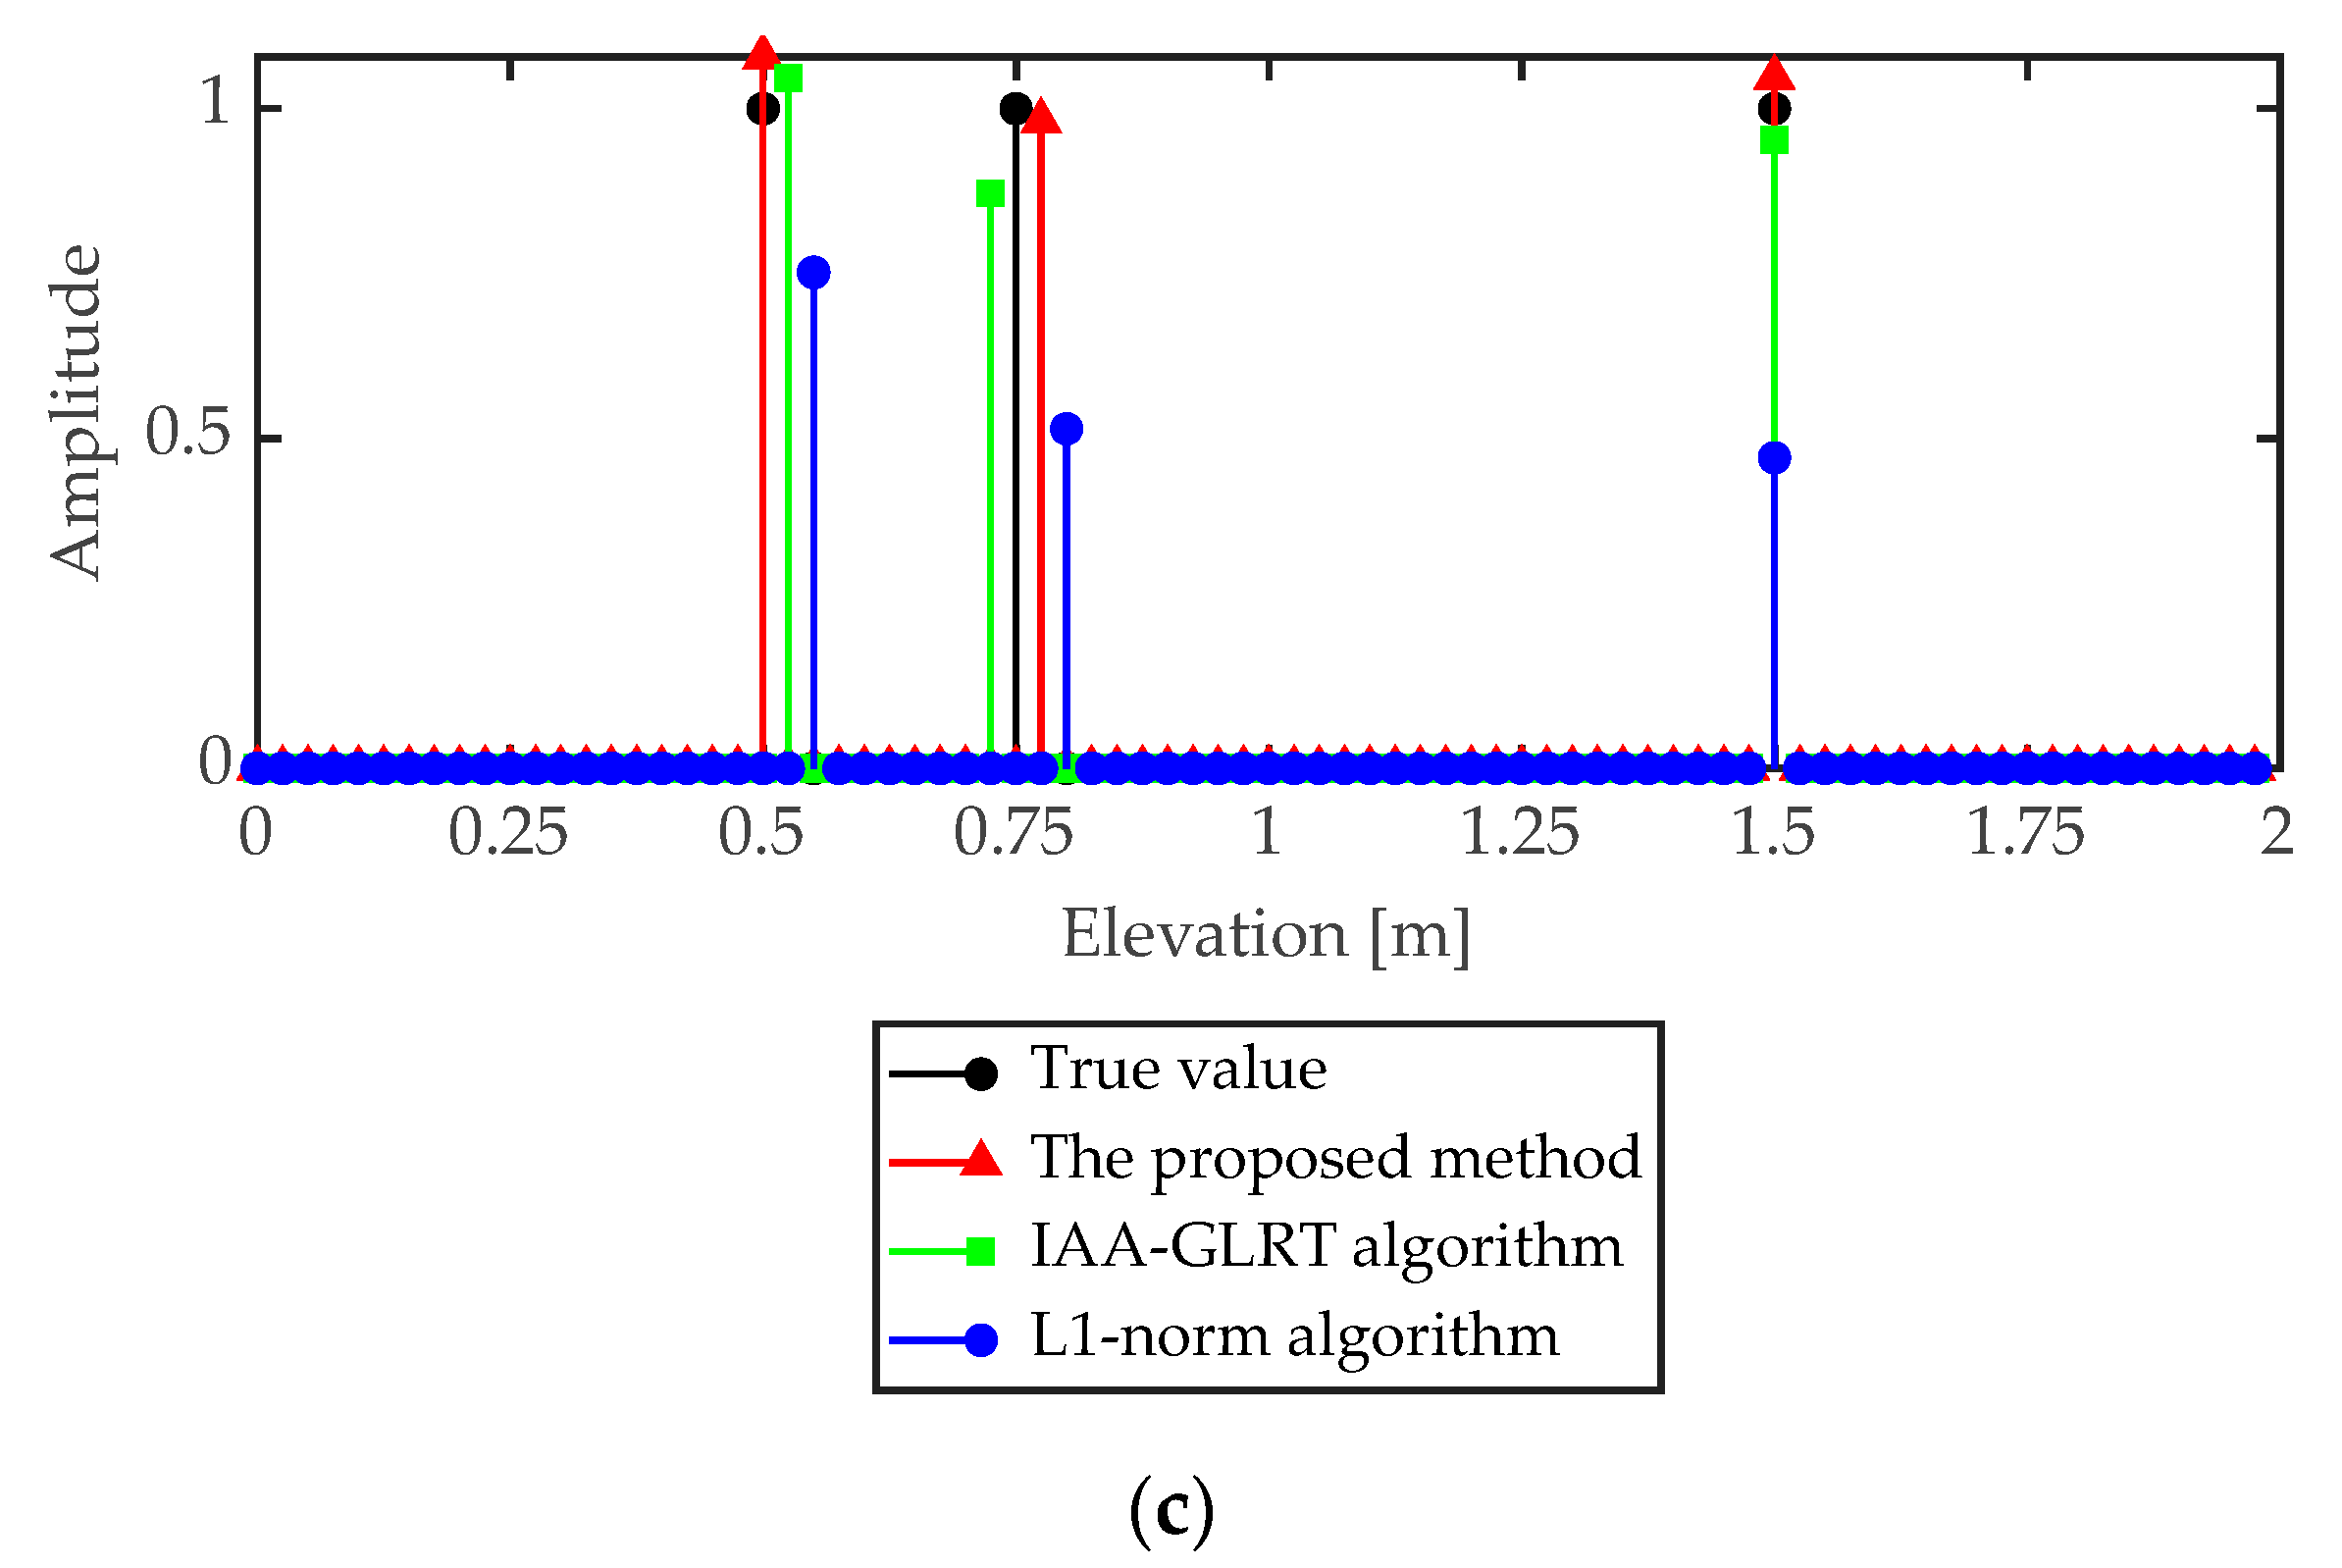
4.1. Simulation Data Analysis

In order to illustrate the effectiveness of the proposed method, the point target simulation data was used to analyze the reconstruction error. In the simulation data, there were three scattering points with different elevations in the pixel unit. The radar collected data at eight different elevation angles, and each sub-aperture had eight baselines. In point target simulation, three adjacent sub-apertures were used to form group vectors, and the system parameters are shown in Table 1. According to the baseline data, the Rayleigh resolution in elevation was 0.52 m.
When there were three different scattering points in the pixel unit, the structure of the pixel unit along the elevation direction in different sub-aperture was consistent, which formed group sparsity constraints, which could strengthen the structure information and reduce the reconstruction error. After 1000 Monte Carlo simulations, at different signal-to-noise ratio (SNR), the mean square error (MSE) of elevation is shown in Figure 5. With the SNR increased, the MSE of the three different methods tended to decrease, and the method proposed in this paper had smaller MSE.
When SNR was 10 dB and 20 dB, respectively, the reconstruction results of the three targets in the pixel unit are shown in Figure 6 and Figure 7. As shown in Figure 6 and Figure 7, the L1 norm regularization method, the IAA-GLRT algorithm and the proposed method achieved reconstruction of three targets. However, in the L1 norm regularization method and IAA-GLRT algorithm, the same target had different height positions in different sub-apertures. Since the proposed method added the group sparsity constraint between the sub-apertures, the target reconstruction position in the three sub-apertures was the same. The target interval being less than the Rayleigh resolution (z1 = 0.5 m, z2 = 0.75 m) was also well separated.

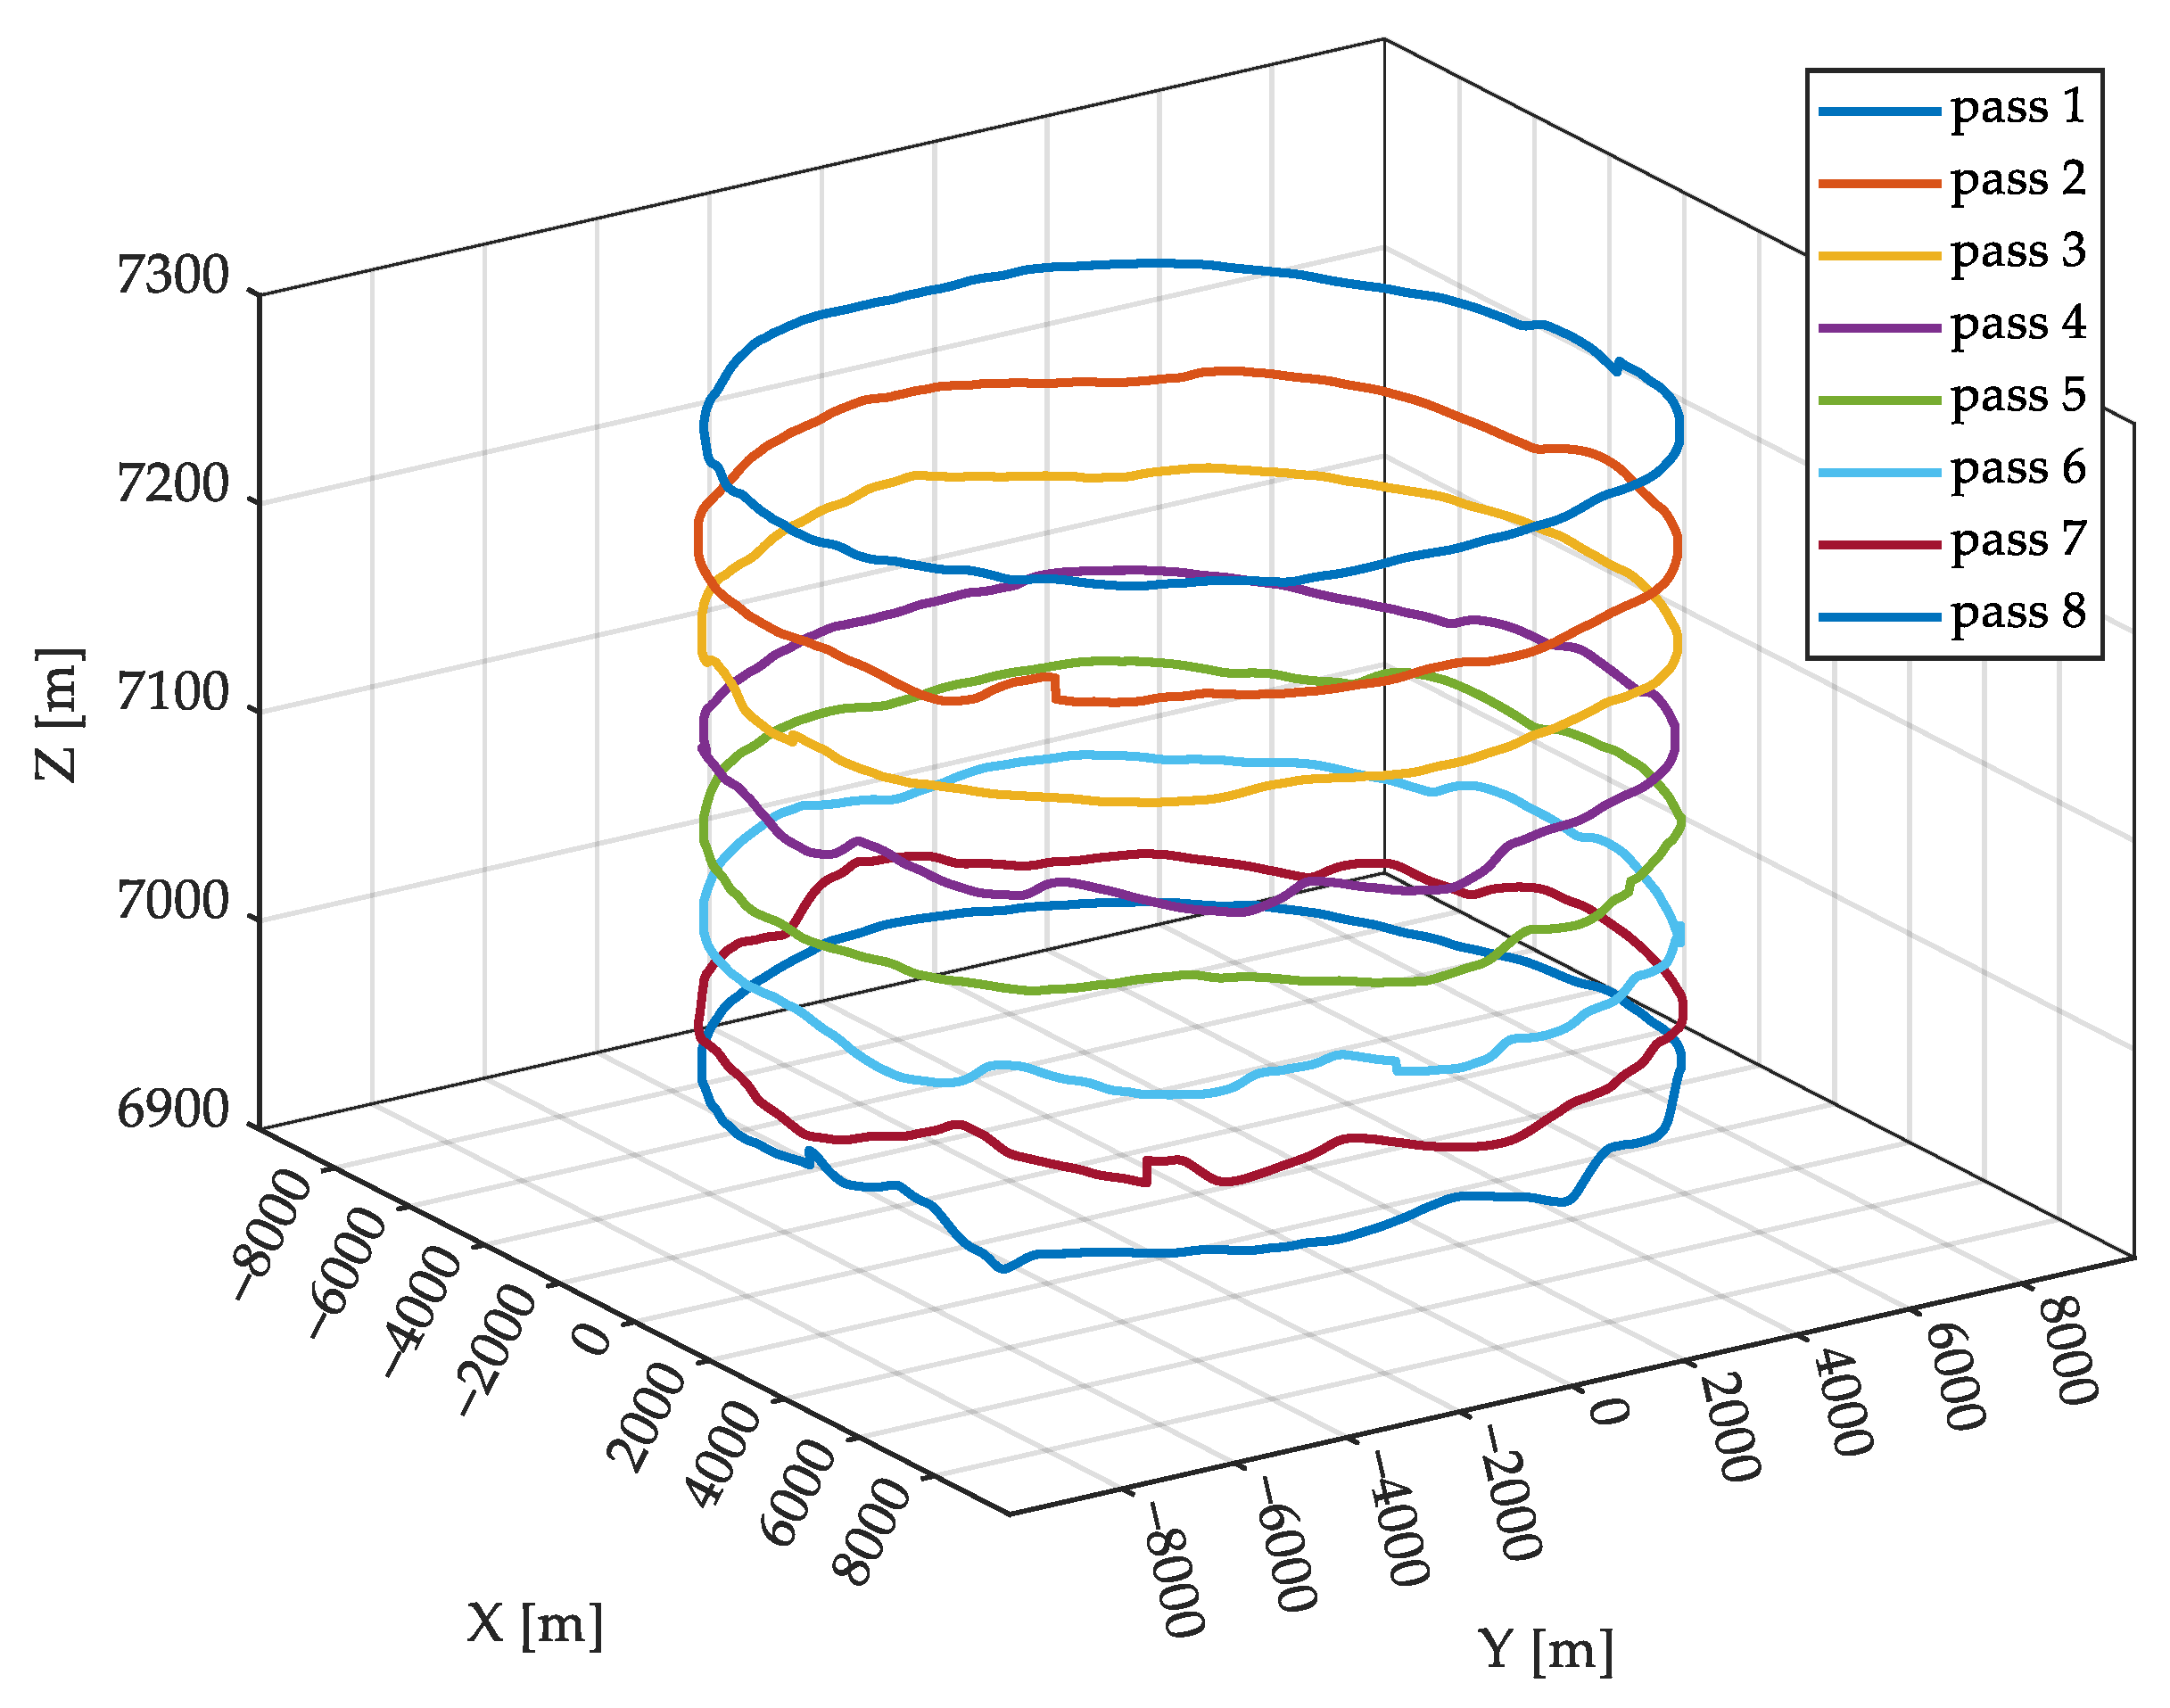
4.2. MCSAR Data Analysis

The GOTCHA dataset published by the Air Force Research Laboratory is a set of full-polarization SAR datasets with eight complete circular passes with different elevation angles, which conducts spotlight observation on civilian vehicles in parking lots. The entire 360° circular passes are divided into 90 non-overlapping sub-apertures, each of which accounts for 4° azimuth angle. Each sub-aperture image stack has eight 2D complex images observed at different elevation angles.
The observed area of 105 m × 60 m in the parking lot was selected to be discretized into grids, and each grid unit size was 0.05 m × 0.05 m. The circular SAR data of HH polarization and VV polarization in pass 1 were selected for 2D imaging. Firstly, the BP algorithm was used to focus the sub-aperture data, and then 90 sub-apertures were incoherently integrated to obtain 2D imaging results. The incoherent 2D imaging results of the parking lot with pass 1 data are shown in Figure 8.
Considering that the main observation targets in the parking lot were civilian vehicles, when the group sparsity feature constraint was set between adjacent sub-apertures, three adjacent sub-apertures were selected for group sparse constraint, namely the adjacent sub-aperture area with 12° azimuth angle.

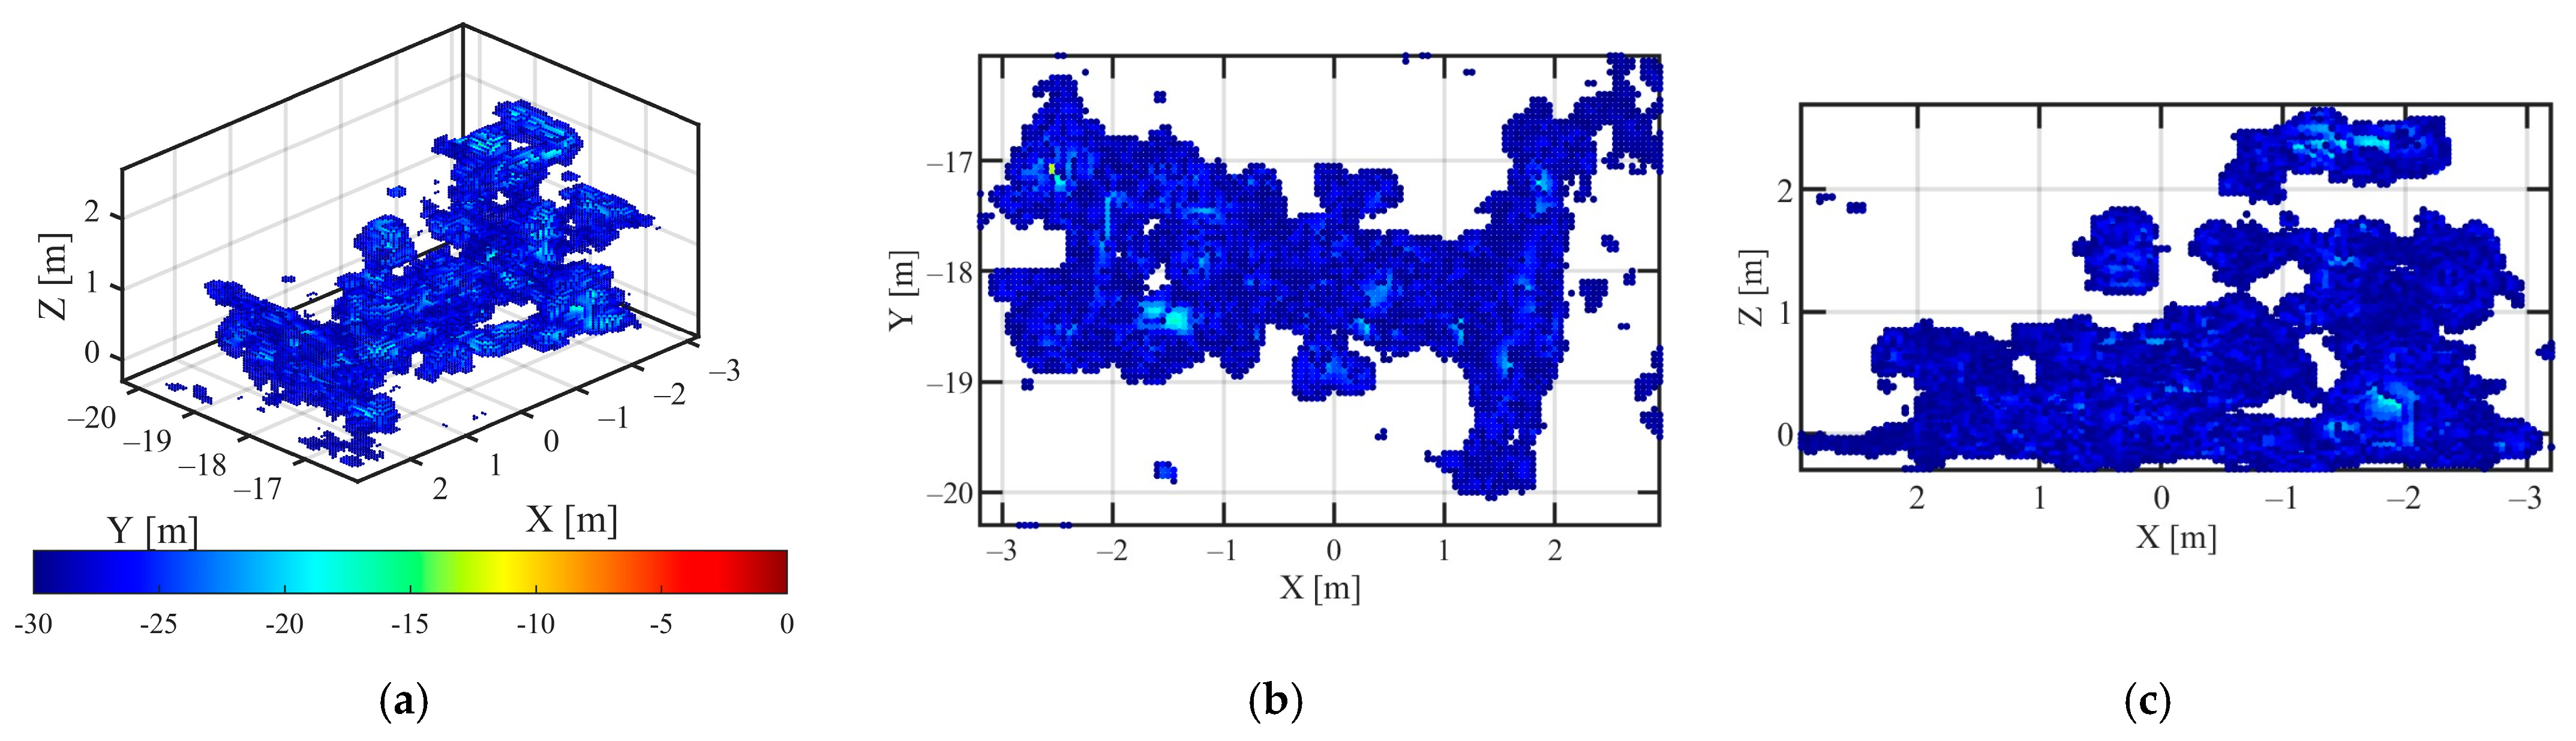
4.2.1. Select the Tractor C1 Region, and Use the Proposed Method to Reconstruct the 3D Target Image

In Figure 8, the red rectangular box is the vehicle C1 2D CSAR imaging result. The optical photo of tractor C1 is shown in Figure 9. It can be seen from the photos that tractor C1 was composed of complex structures. In circular SAR 2D imaging, the scattering points of different heights were projected to different positions in the 2D imaging plane. The complex scattering points brought difficulties to the 3D reconstruction.
Using the method proposed in this paper, the whole circular pass was divided into 90 non-overlapping sub-aperture image stacks, and the adjacent three sub-apertures were reconstructed by the sparse group thresholding iterative reconstruction. Finally, all the sub-aperture 3D target images were converted from a slant elevation coordinate system to an XYZ coordinate system, and the holographic 3D image of the observed target was obtained by incoherently integrating all the individual sub-aperture 3D images.
The HH, VV polarization data of vehicle C1, the 3D point cloud reconstruction results using the proposed method are shown in Figure 10 and Figure 11. The dynamic range of 3D point cloud in Figure 10 was −35 dB~0 dB, and the dynamic range of 3D point cloud in Figure 11 was −40 dB~0 dB. The HH, VV polarization data of vehicle C1, and the 3D point cloud results using L1-norm regularization solution are shown in Figure 12 and Figure 13. The 3D point cloud results of vehicle C1 with HH and VV polarization data solved by the IAA-GLRT algorithm are shown in Figure 14 and Figure 15, respectively. In Figure 12, Figure 13, Figure 14 and Figure 15, the 3D point cloud display dynamic range was: −30 dB~0 dB.
Compared with the 3D point cloud results, shown in Figure 10, Figure 11, Figure 12, Figure 13, Figure 14 and Figure 15, with the HH polarization data and VV polarization data, the L2,1 mixed norm constraint method proposed in this paper could obtain better point cloud shape, the number of noise points and desultory points along the elevation direction was less, and the 3D point cloud had the higher dynamic range. The point cloud image was clearer, and a high-quality holographic 3D target image could be obtained.

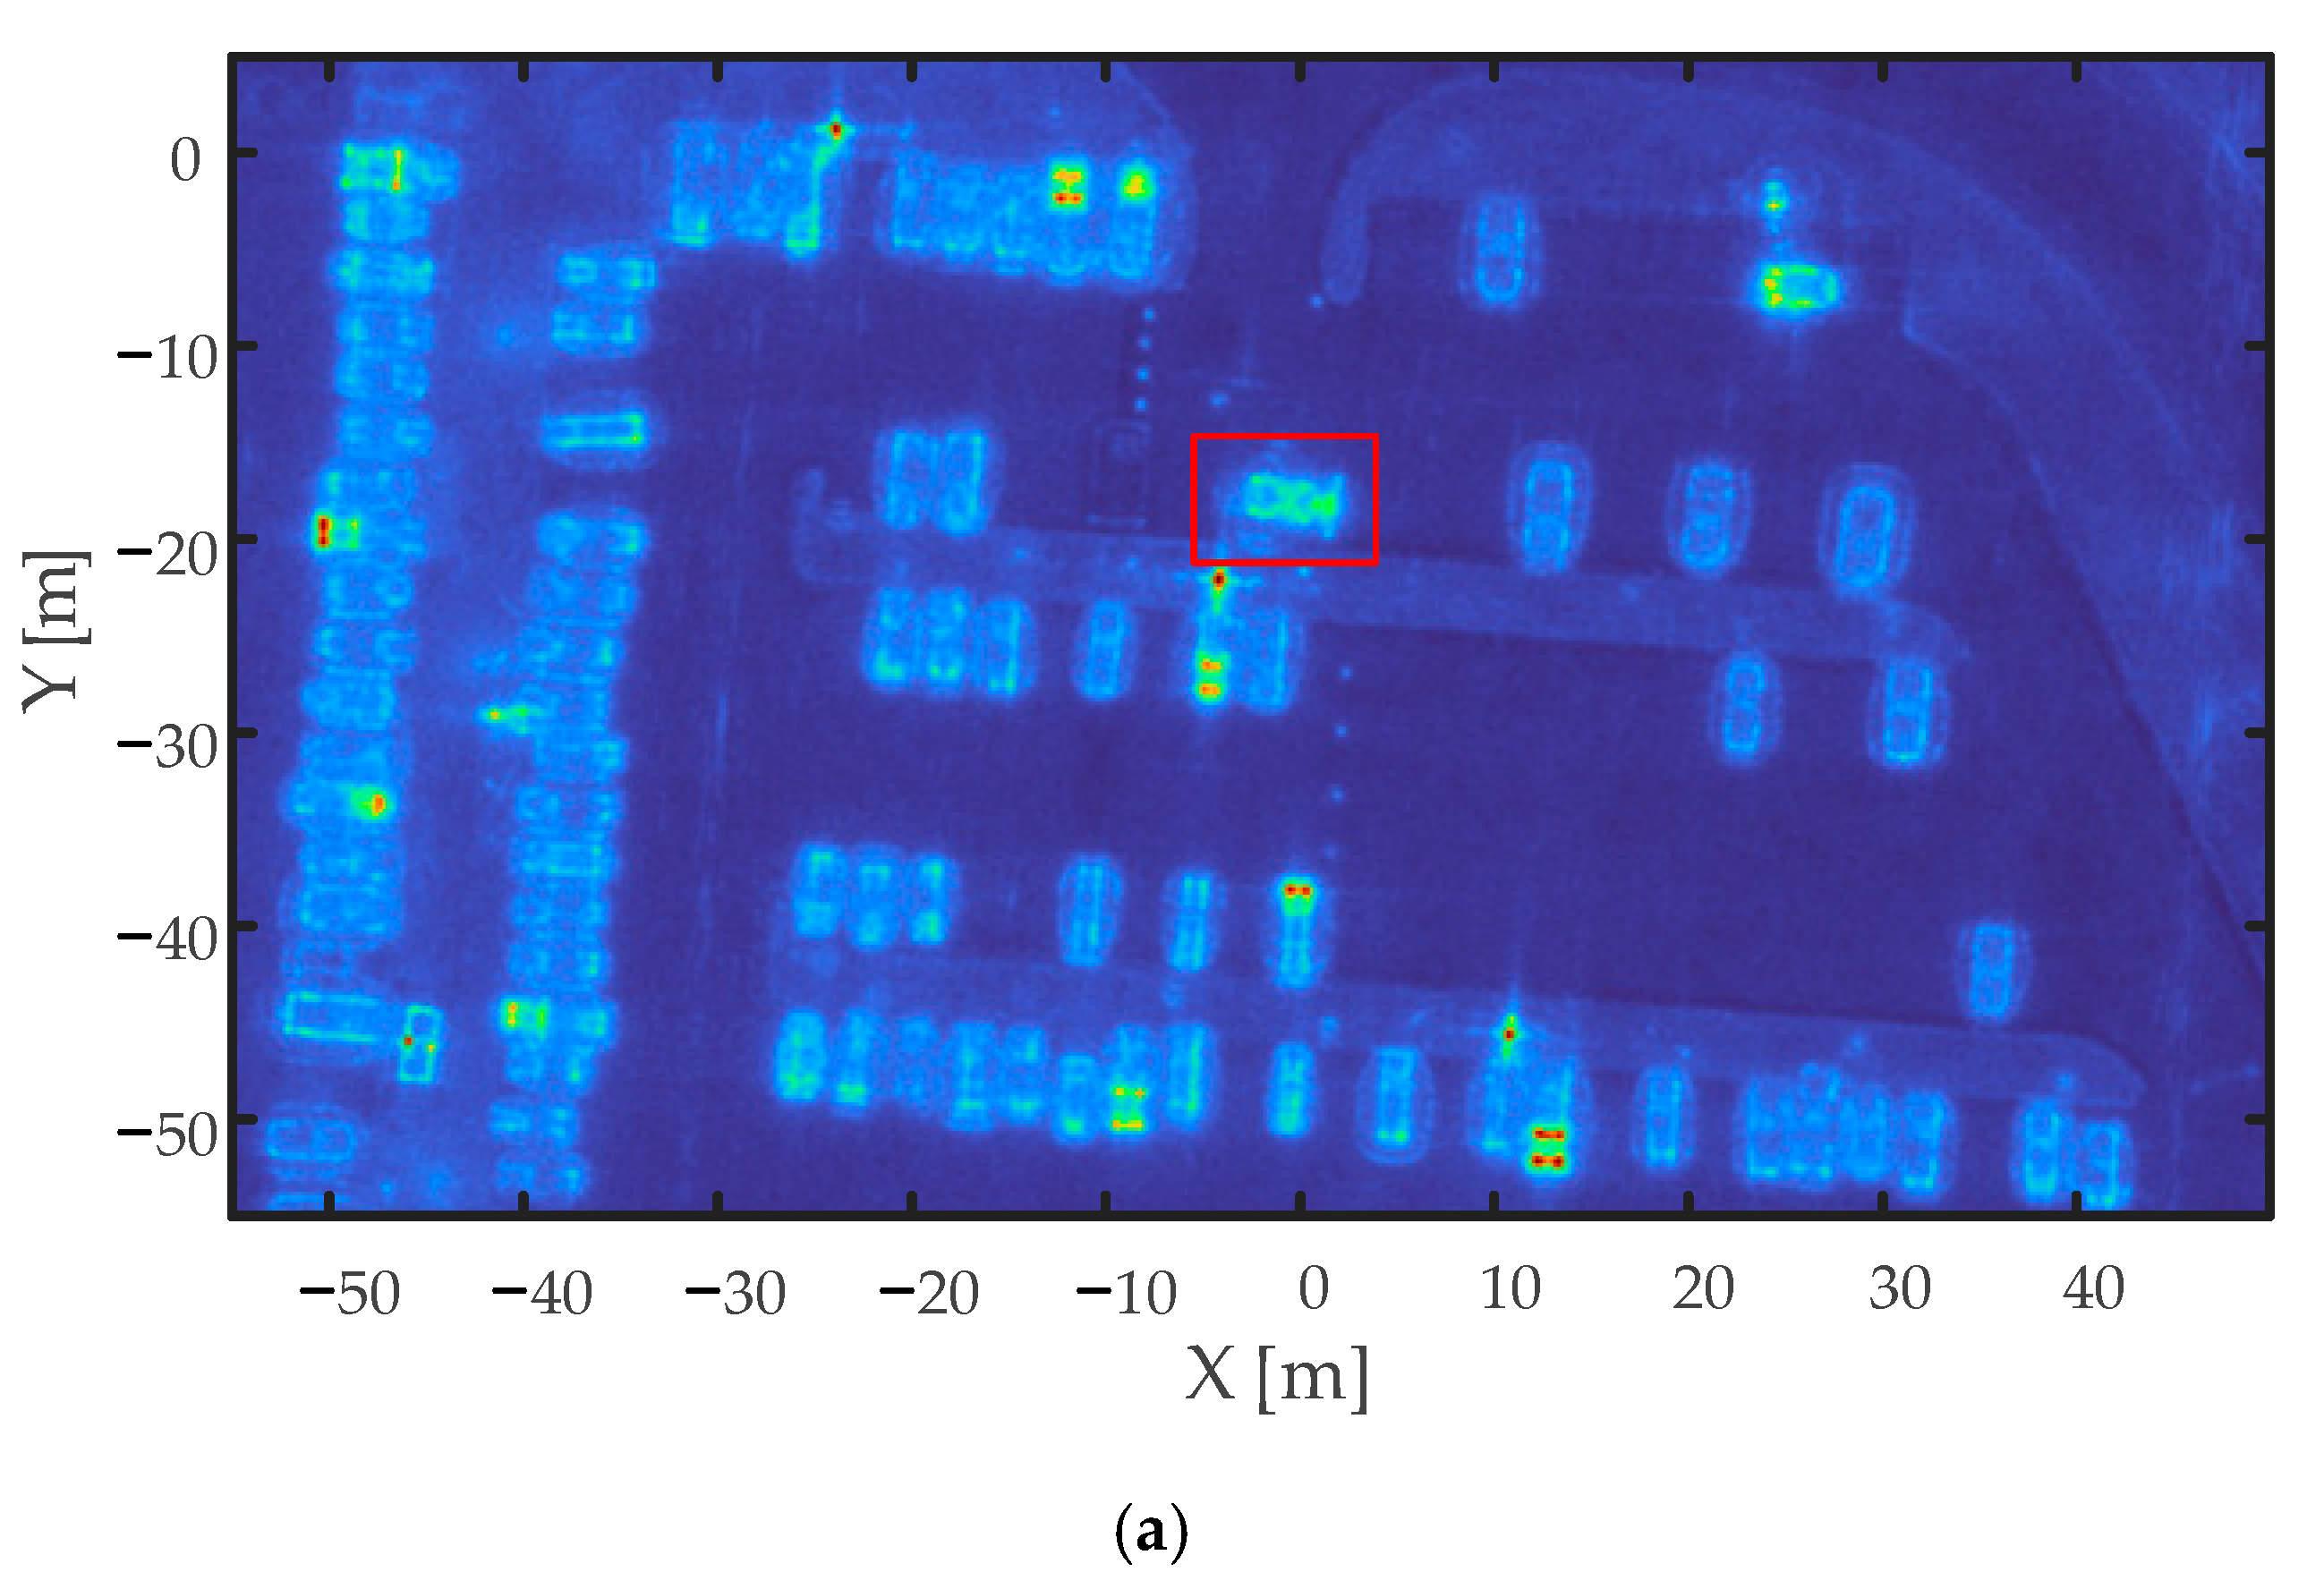
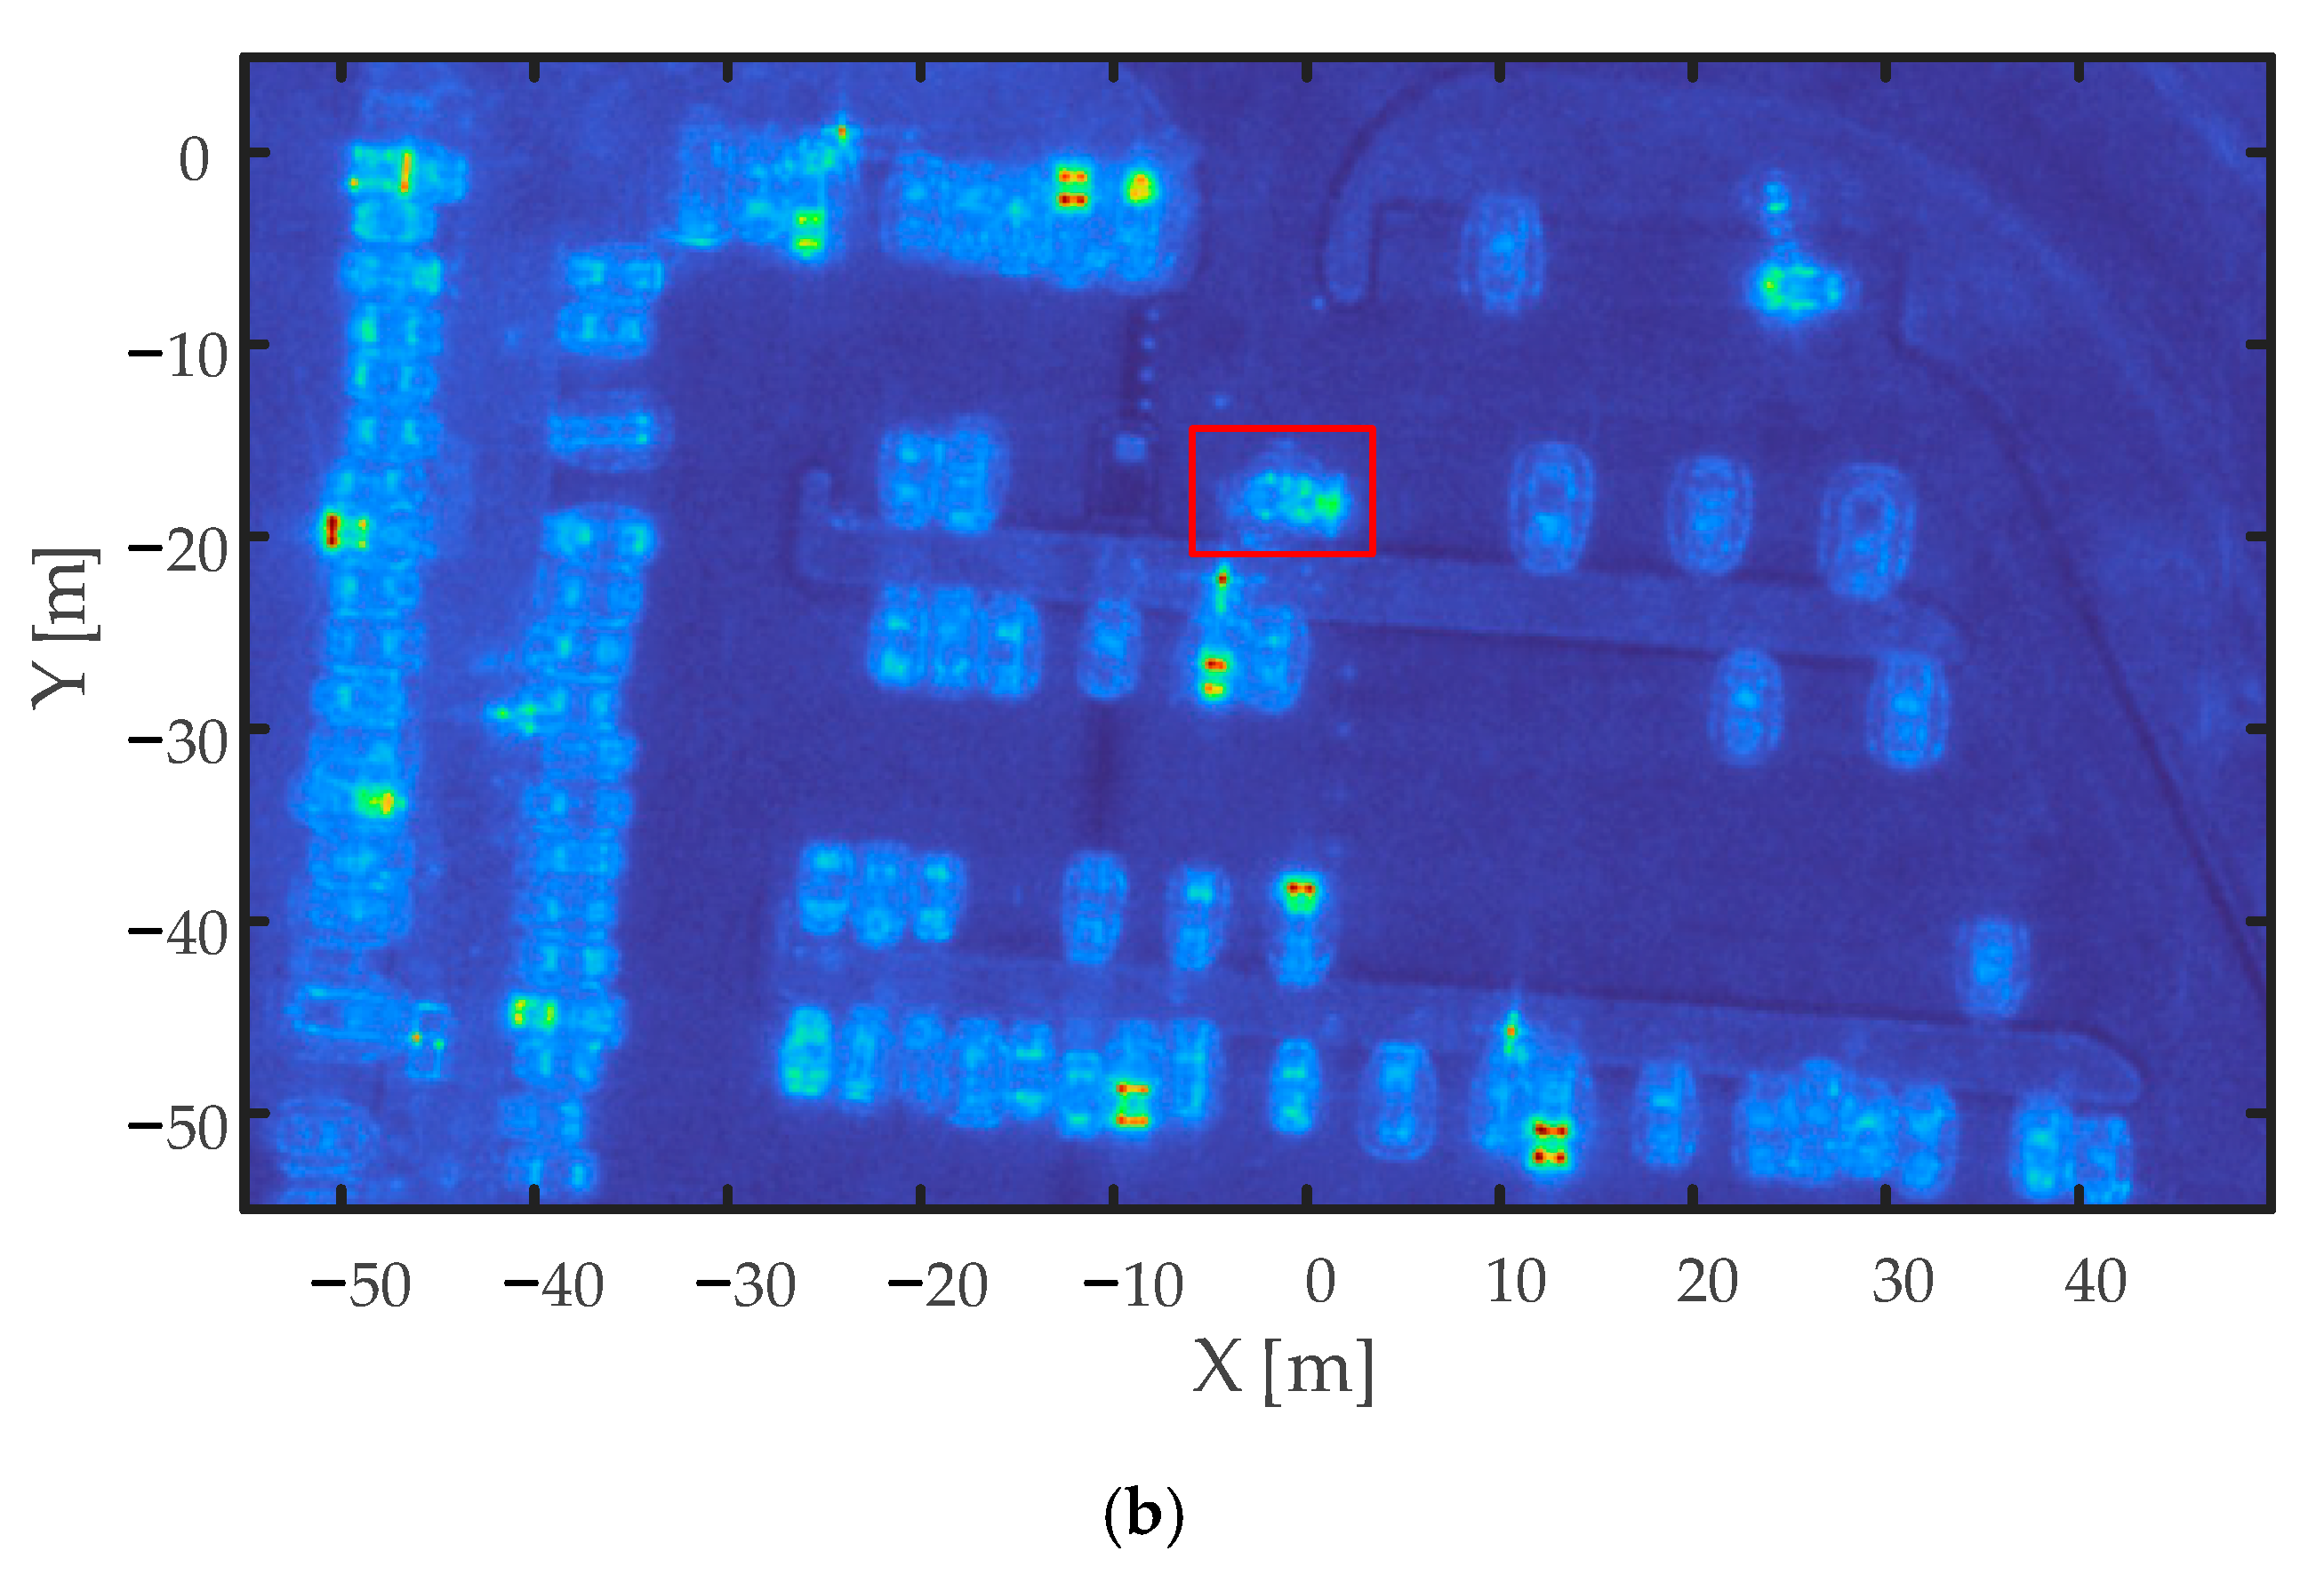
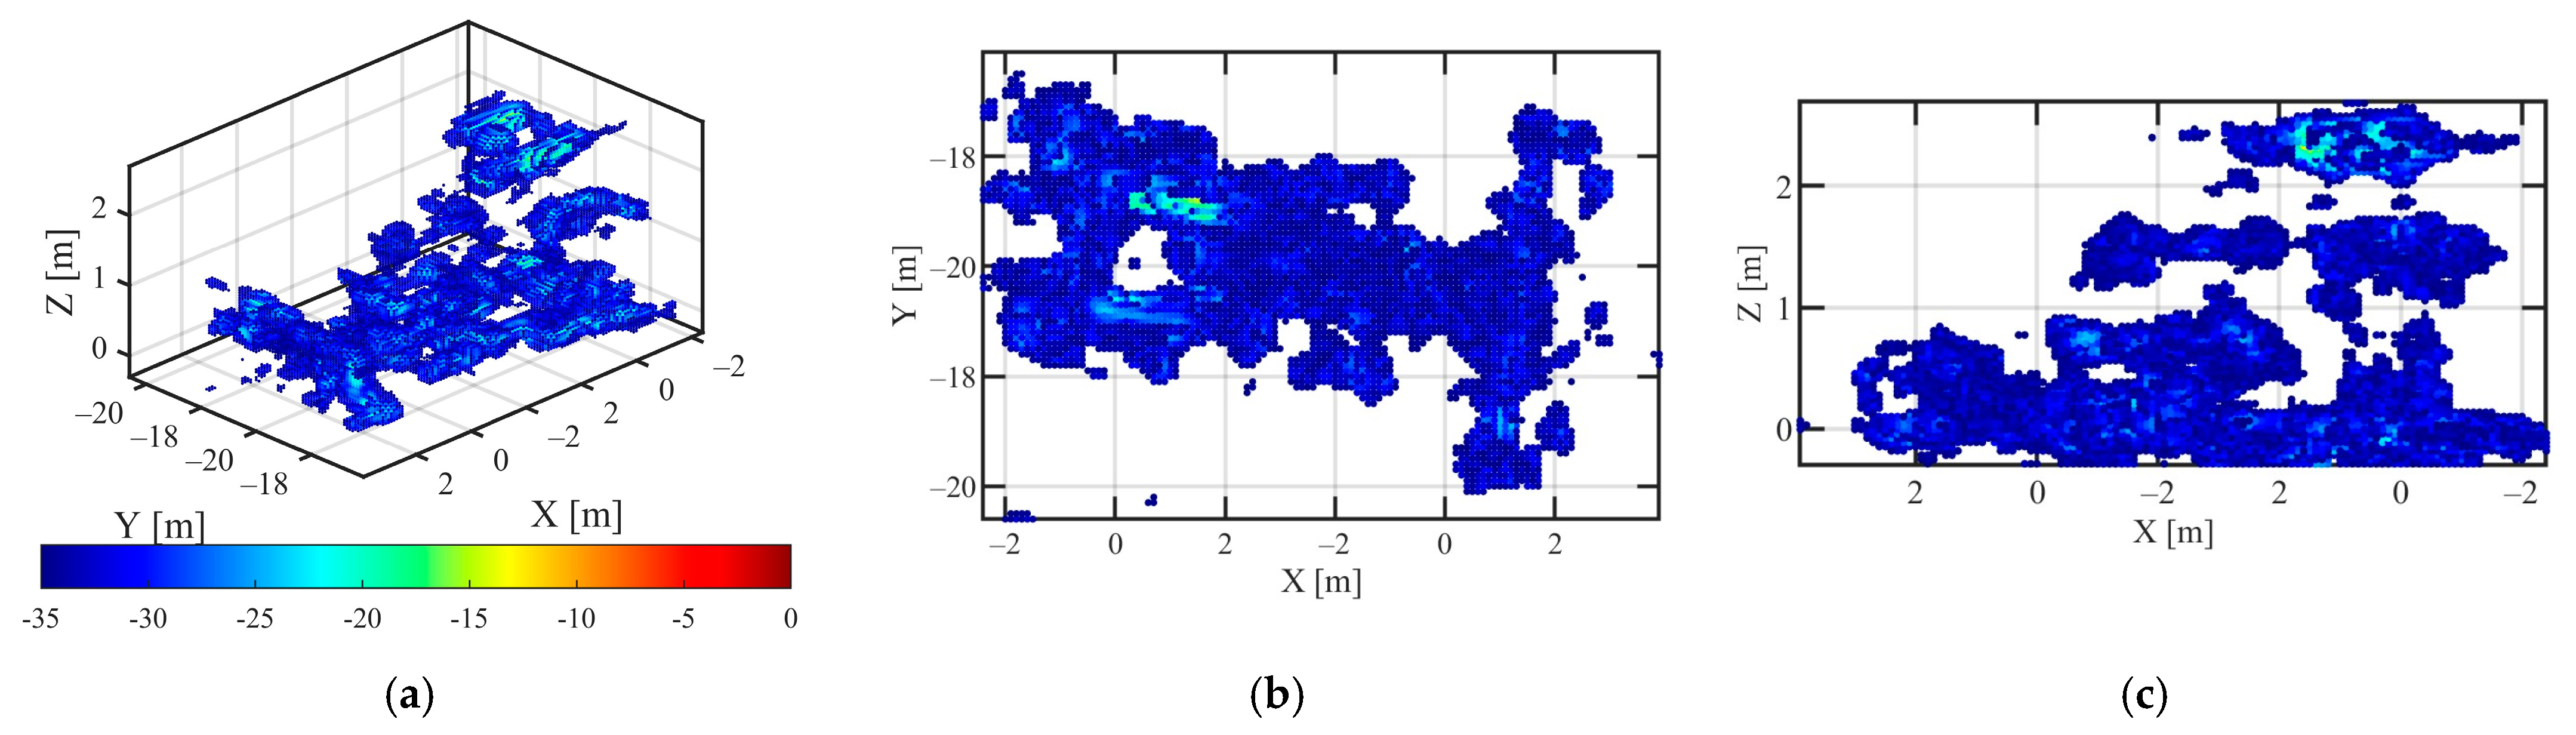
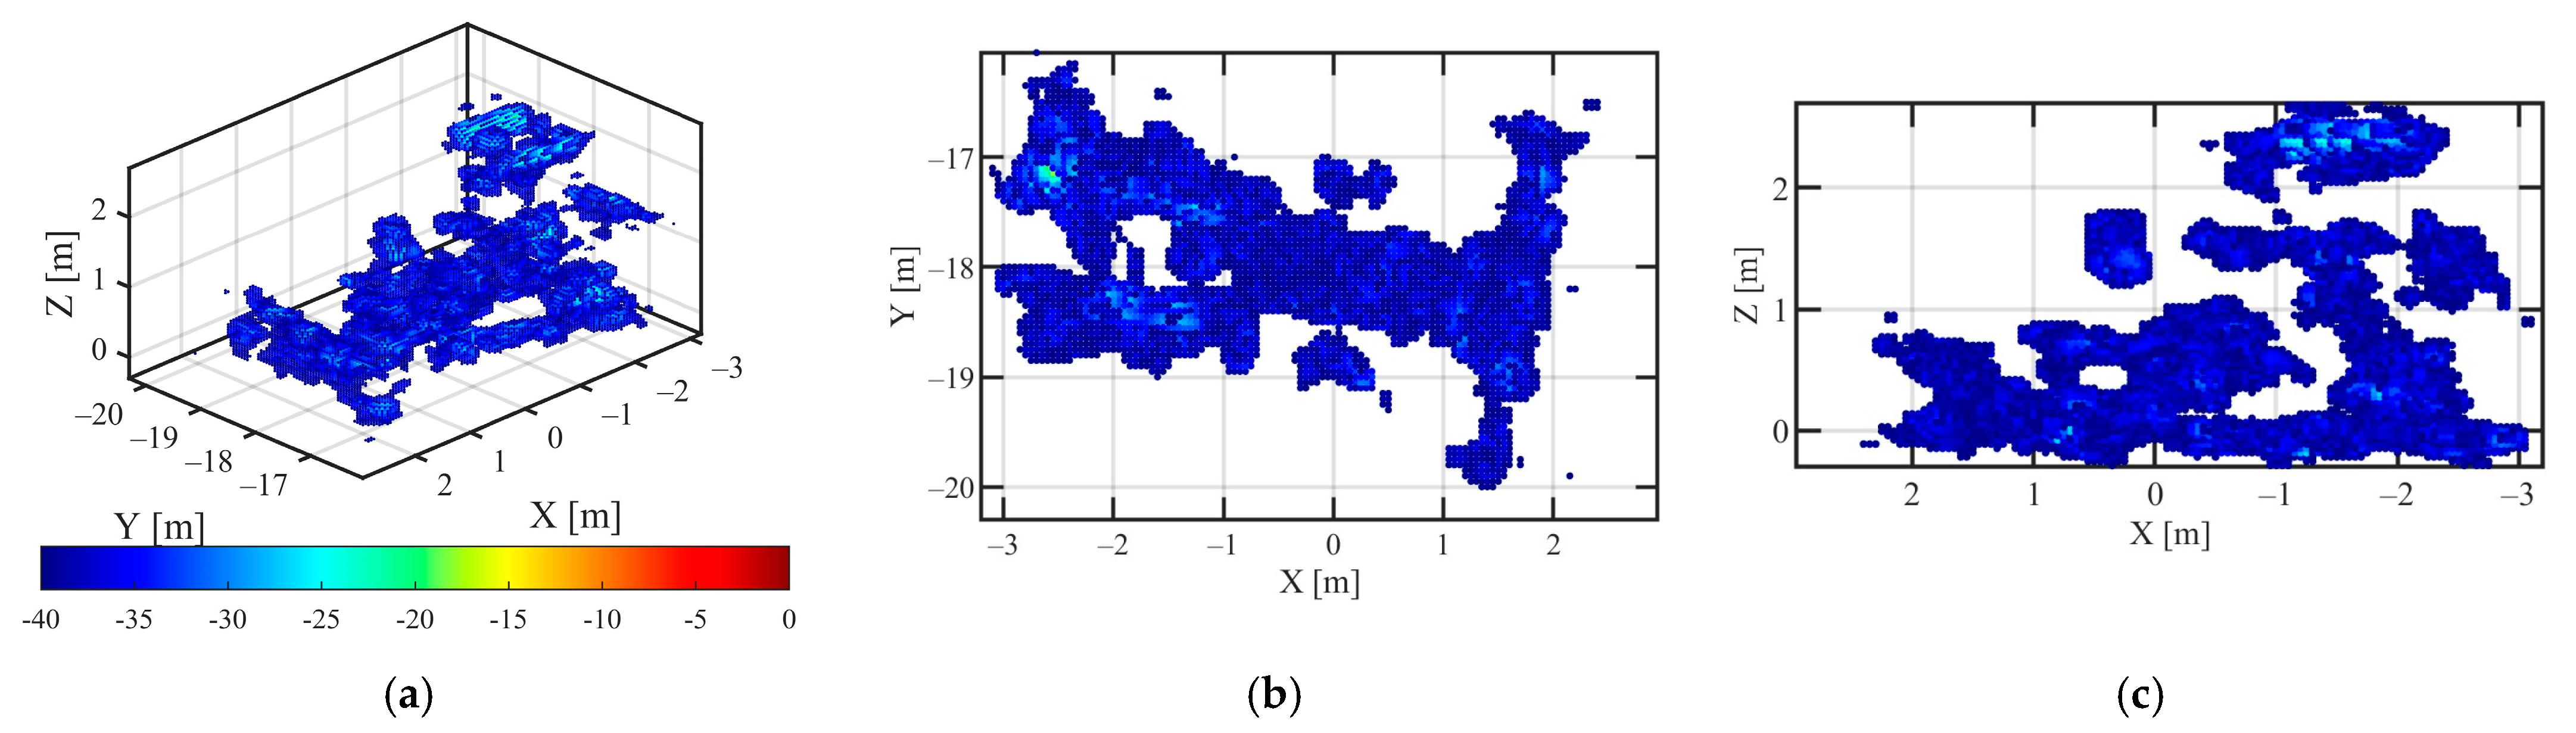
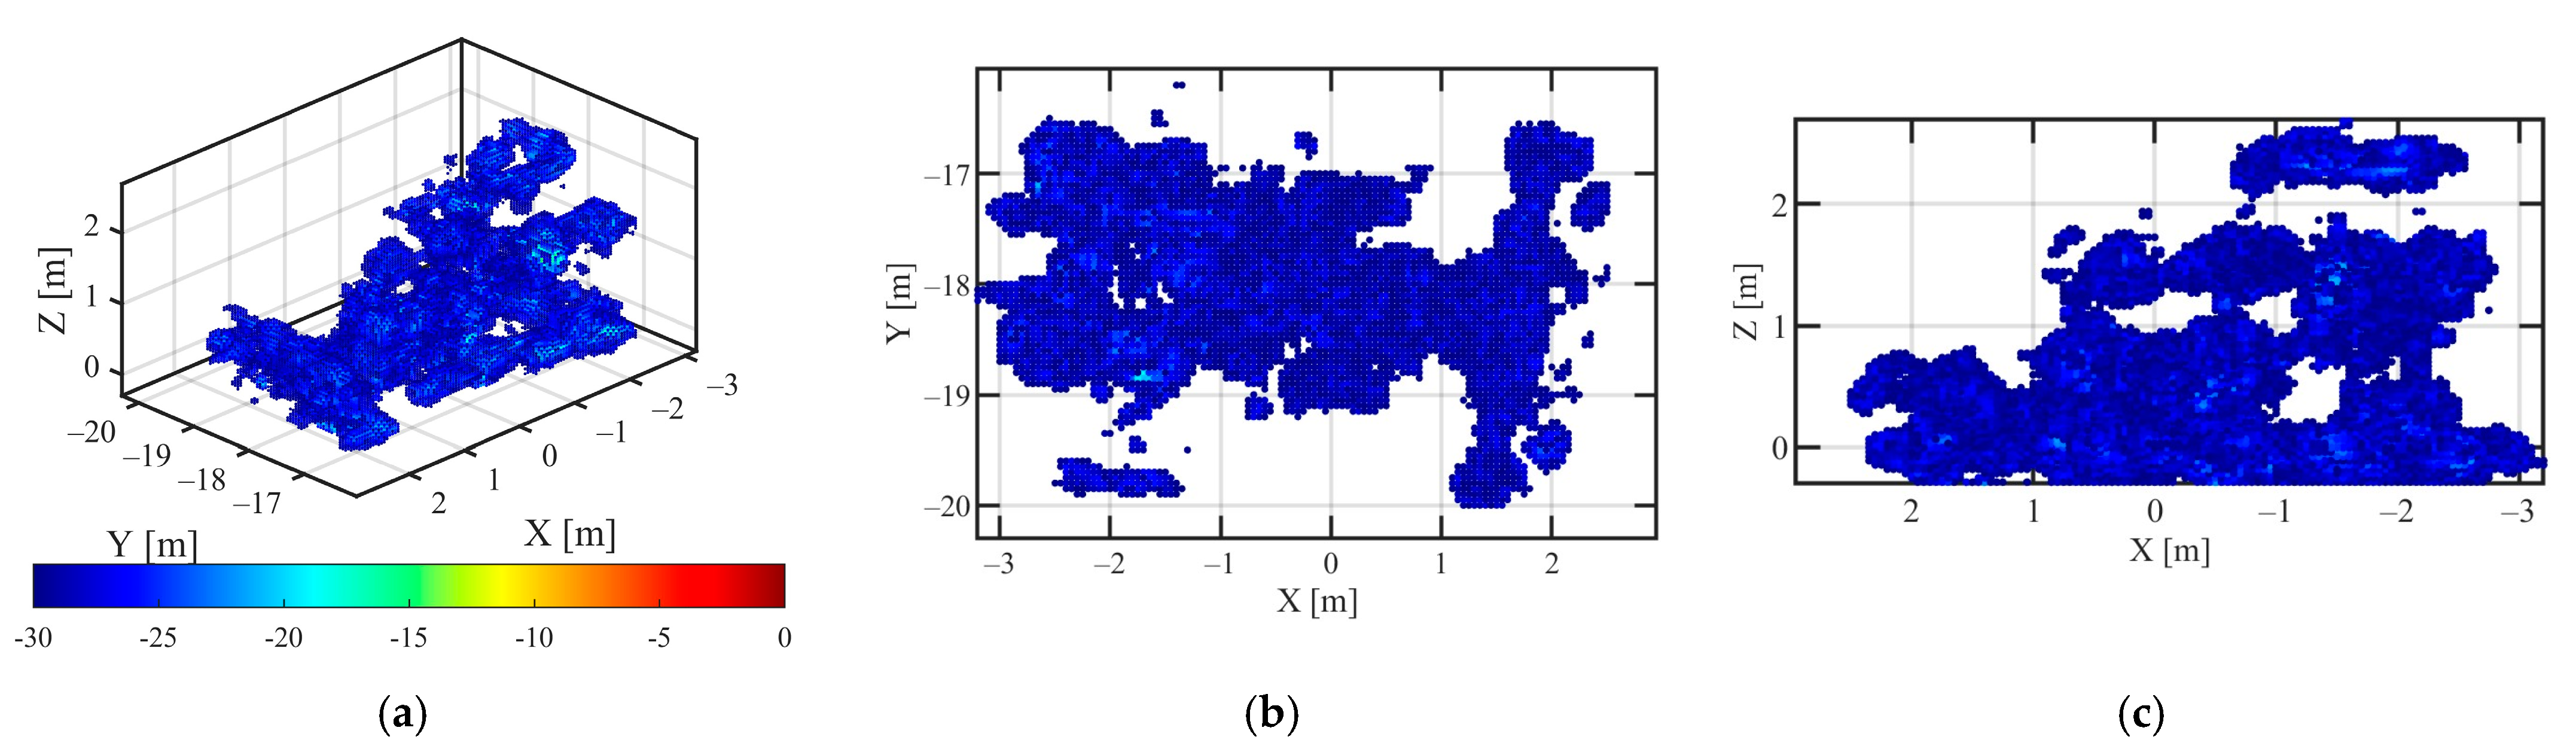
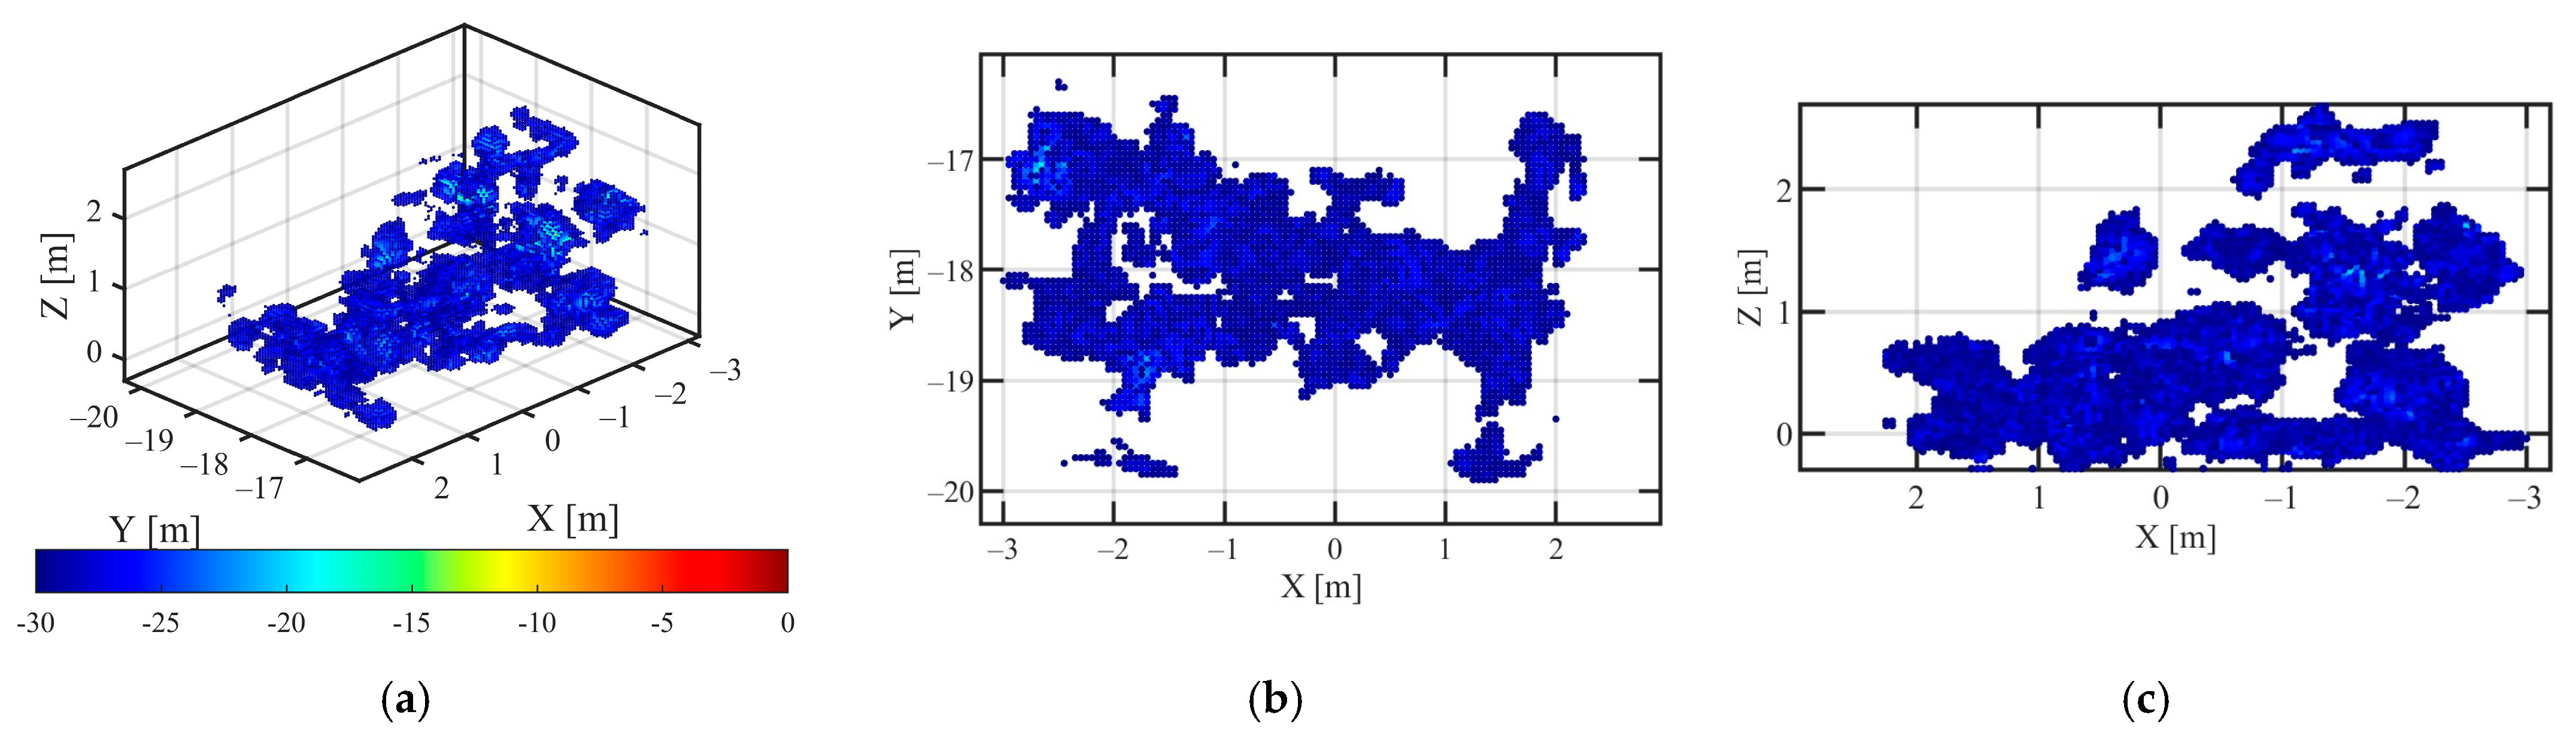
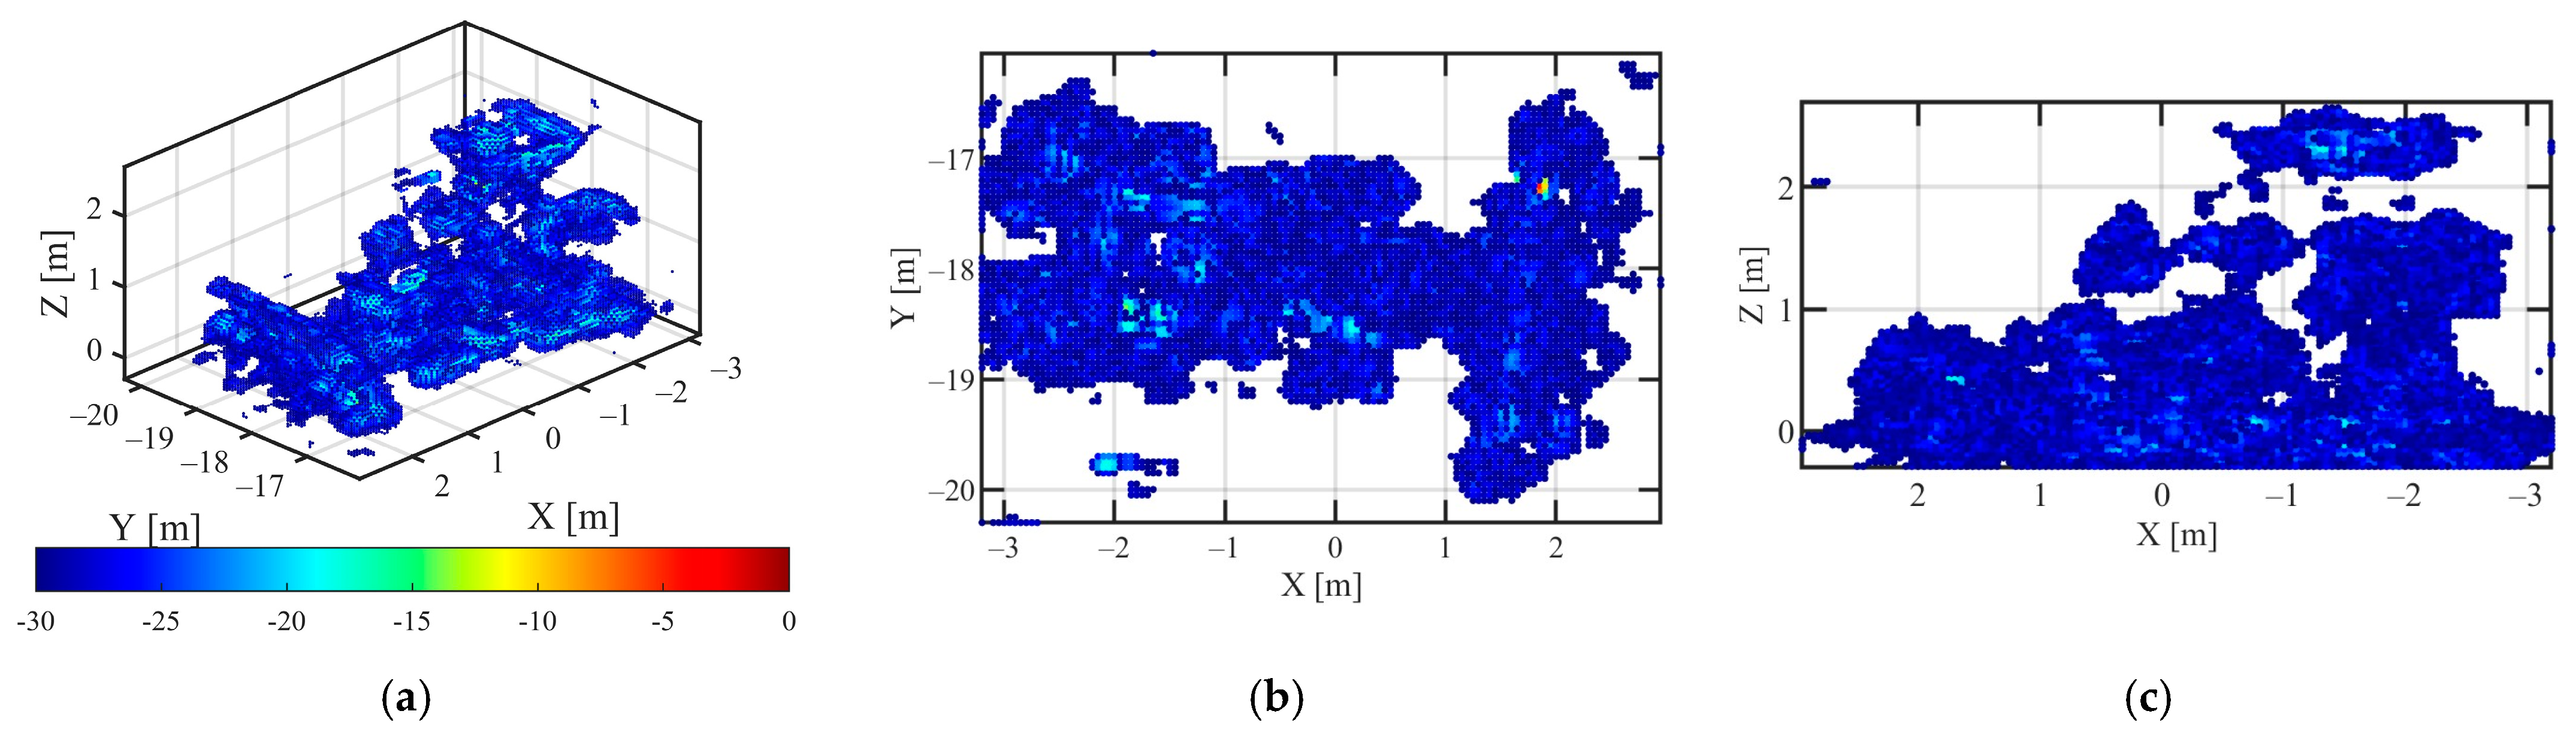
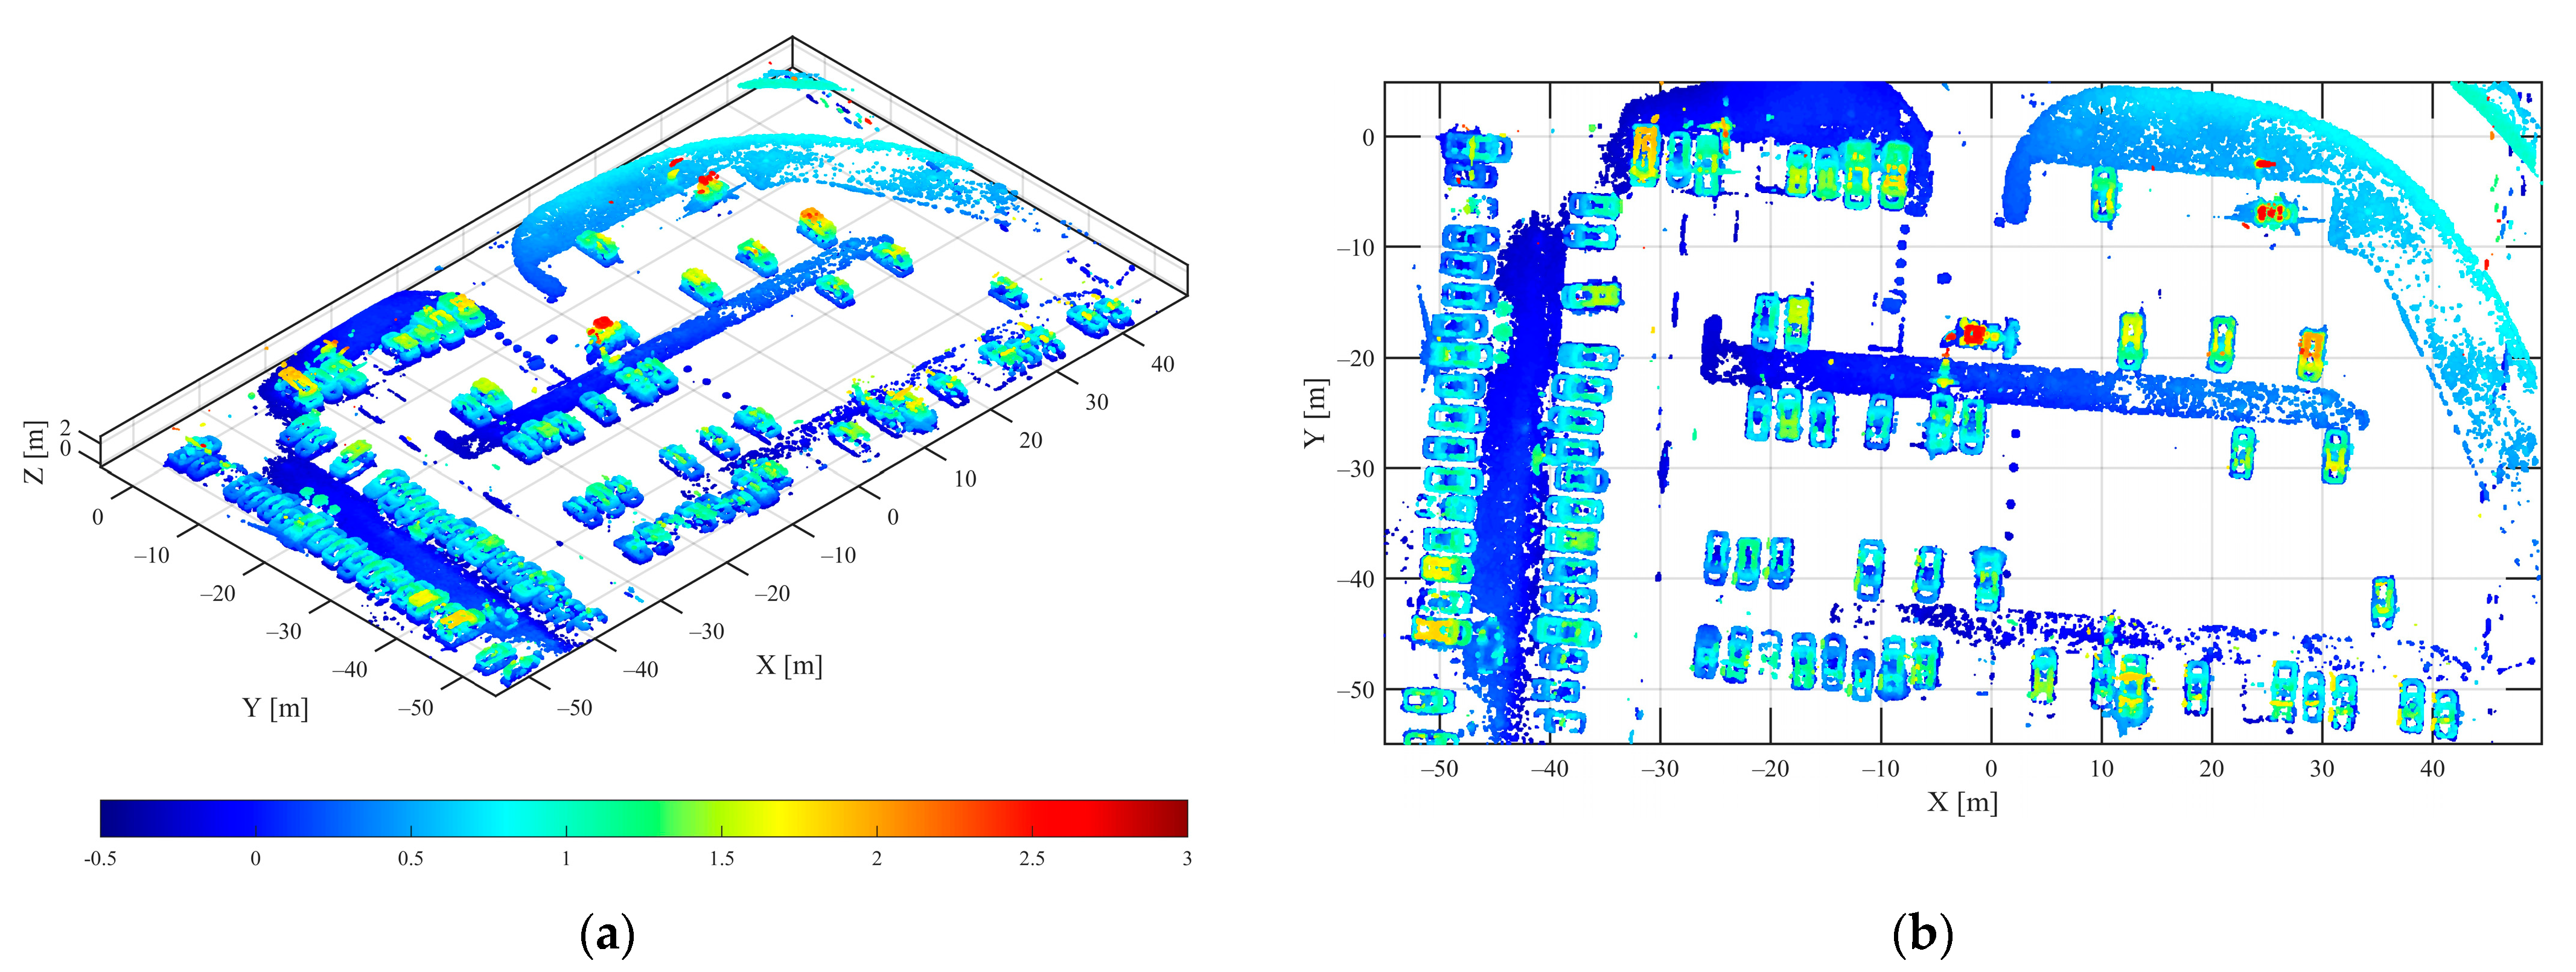
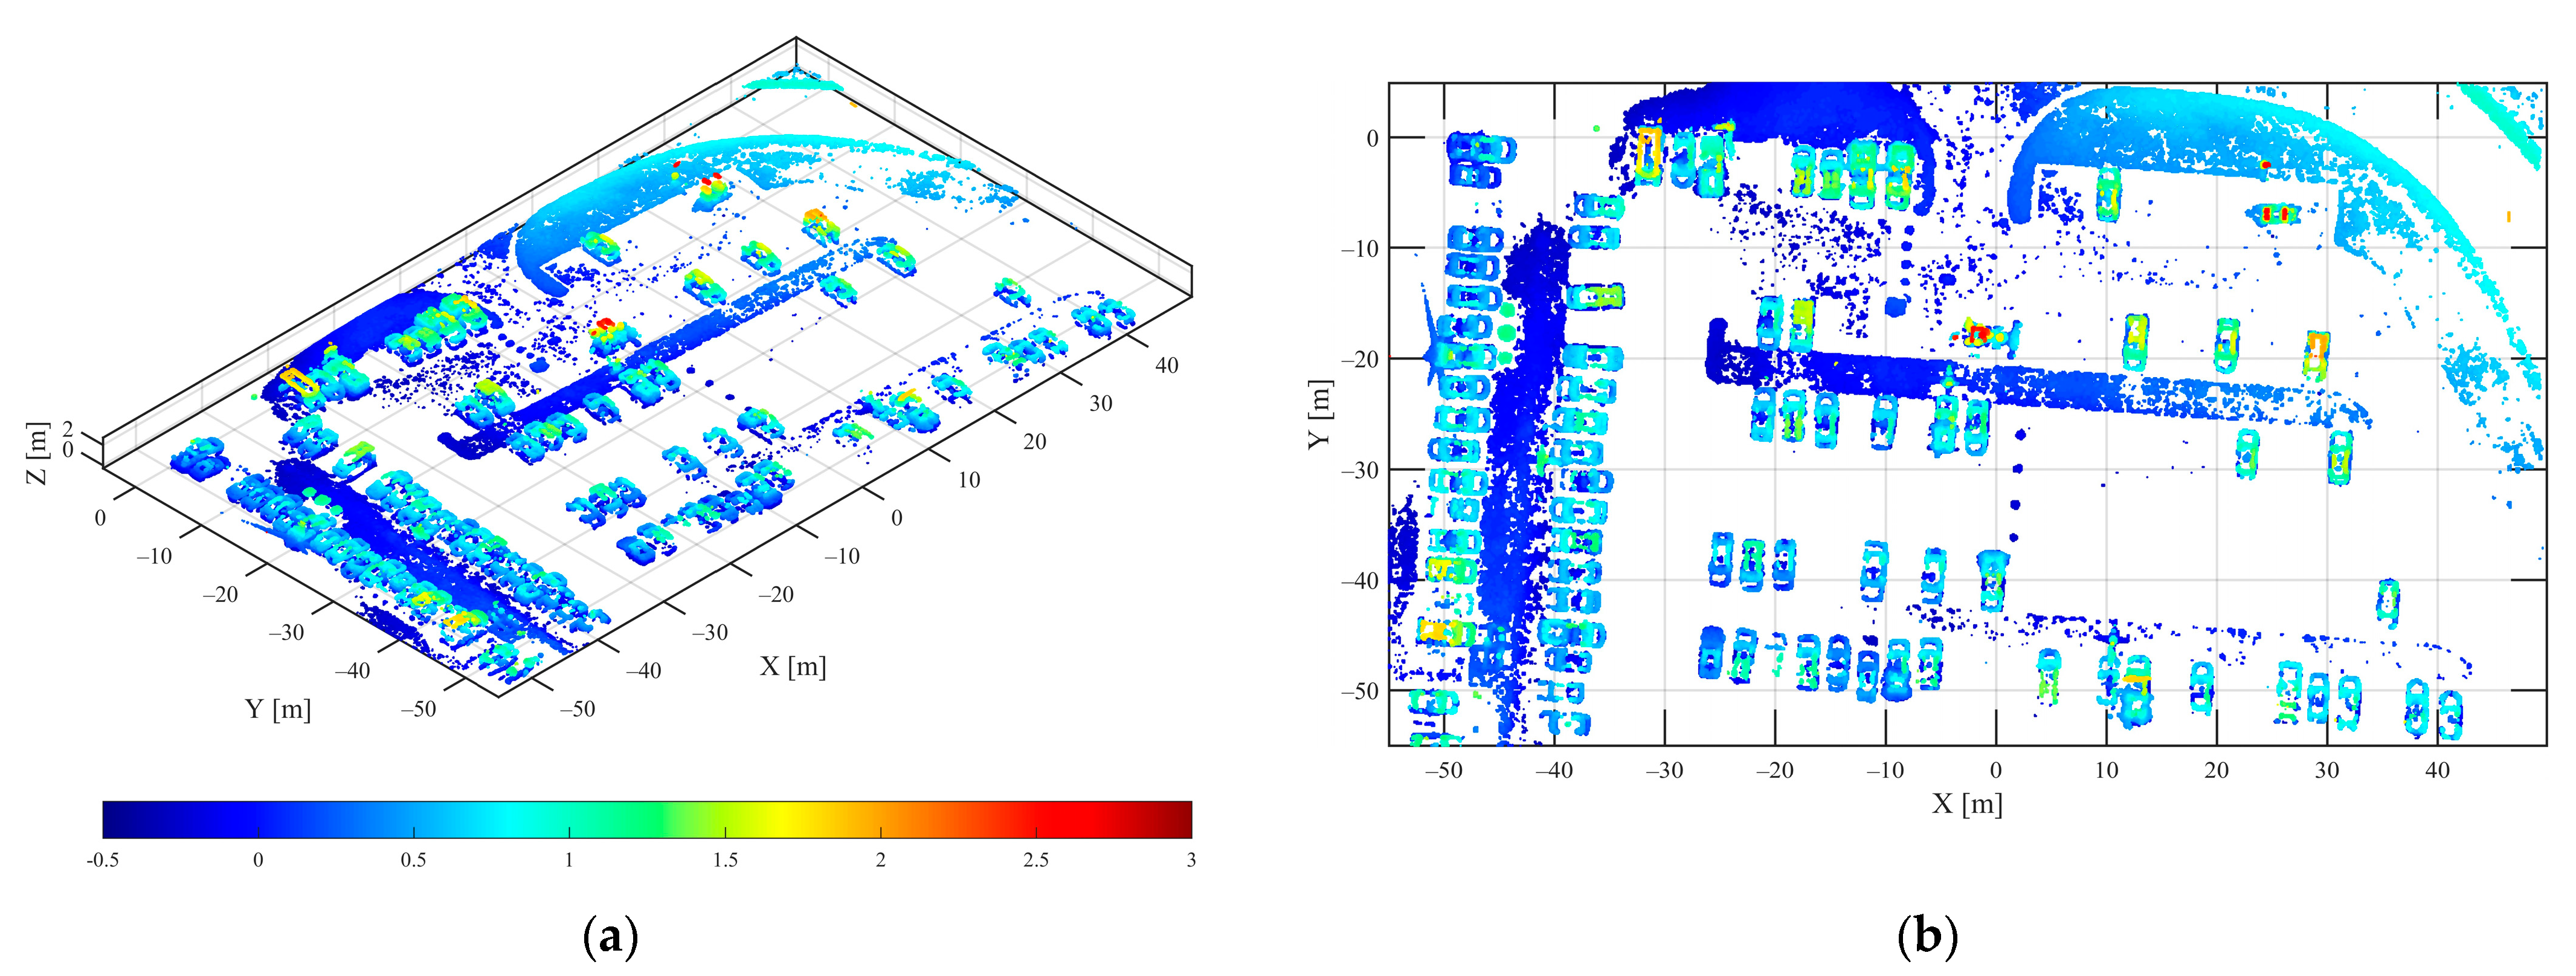
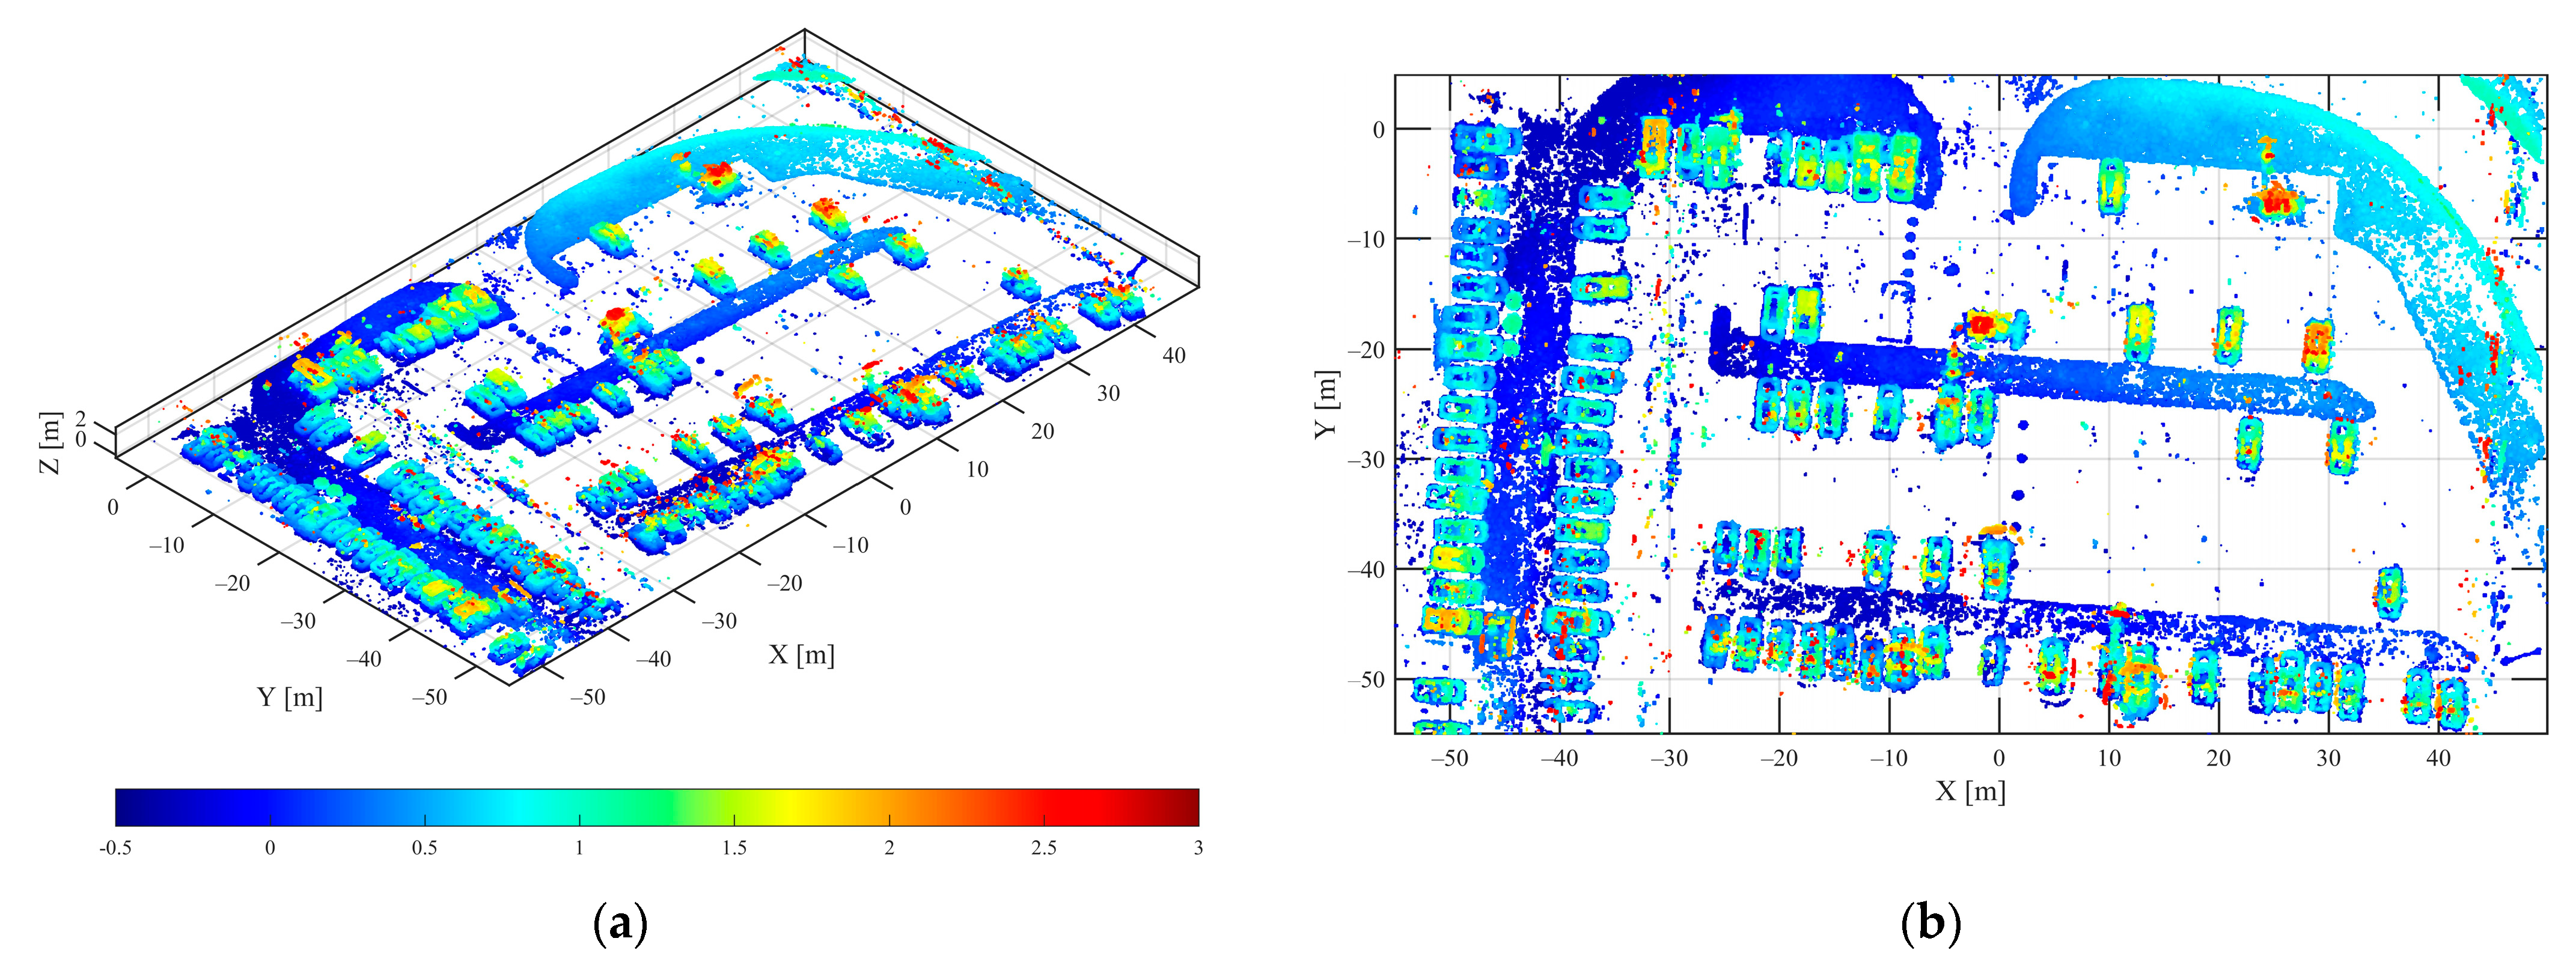
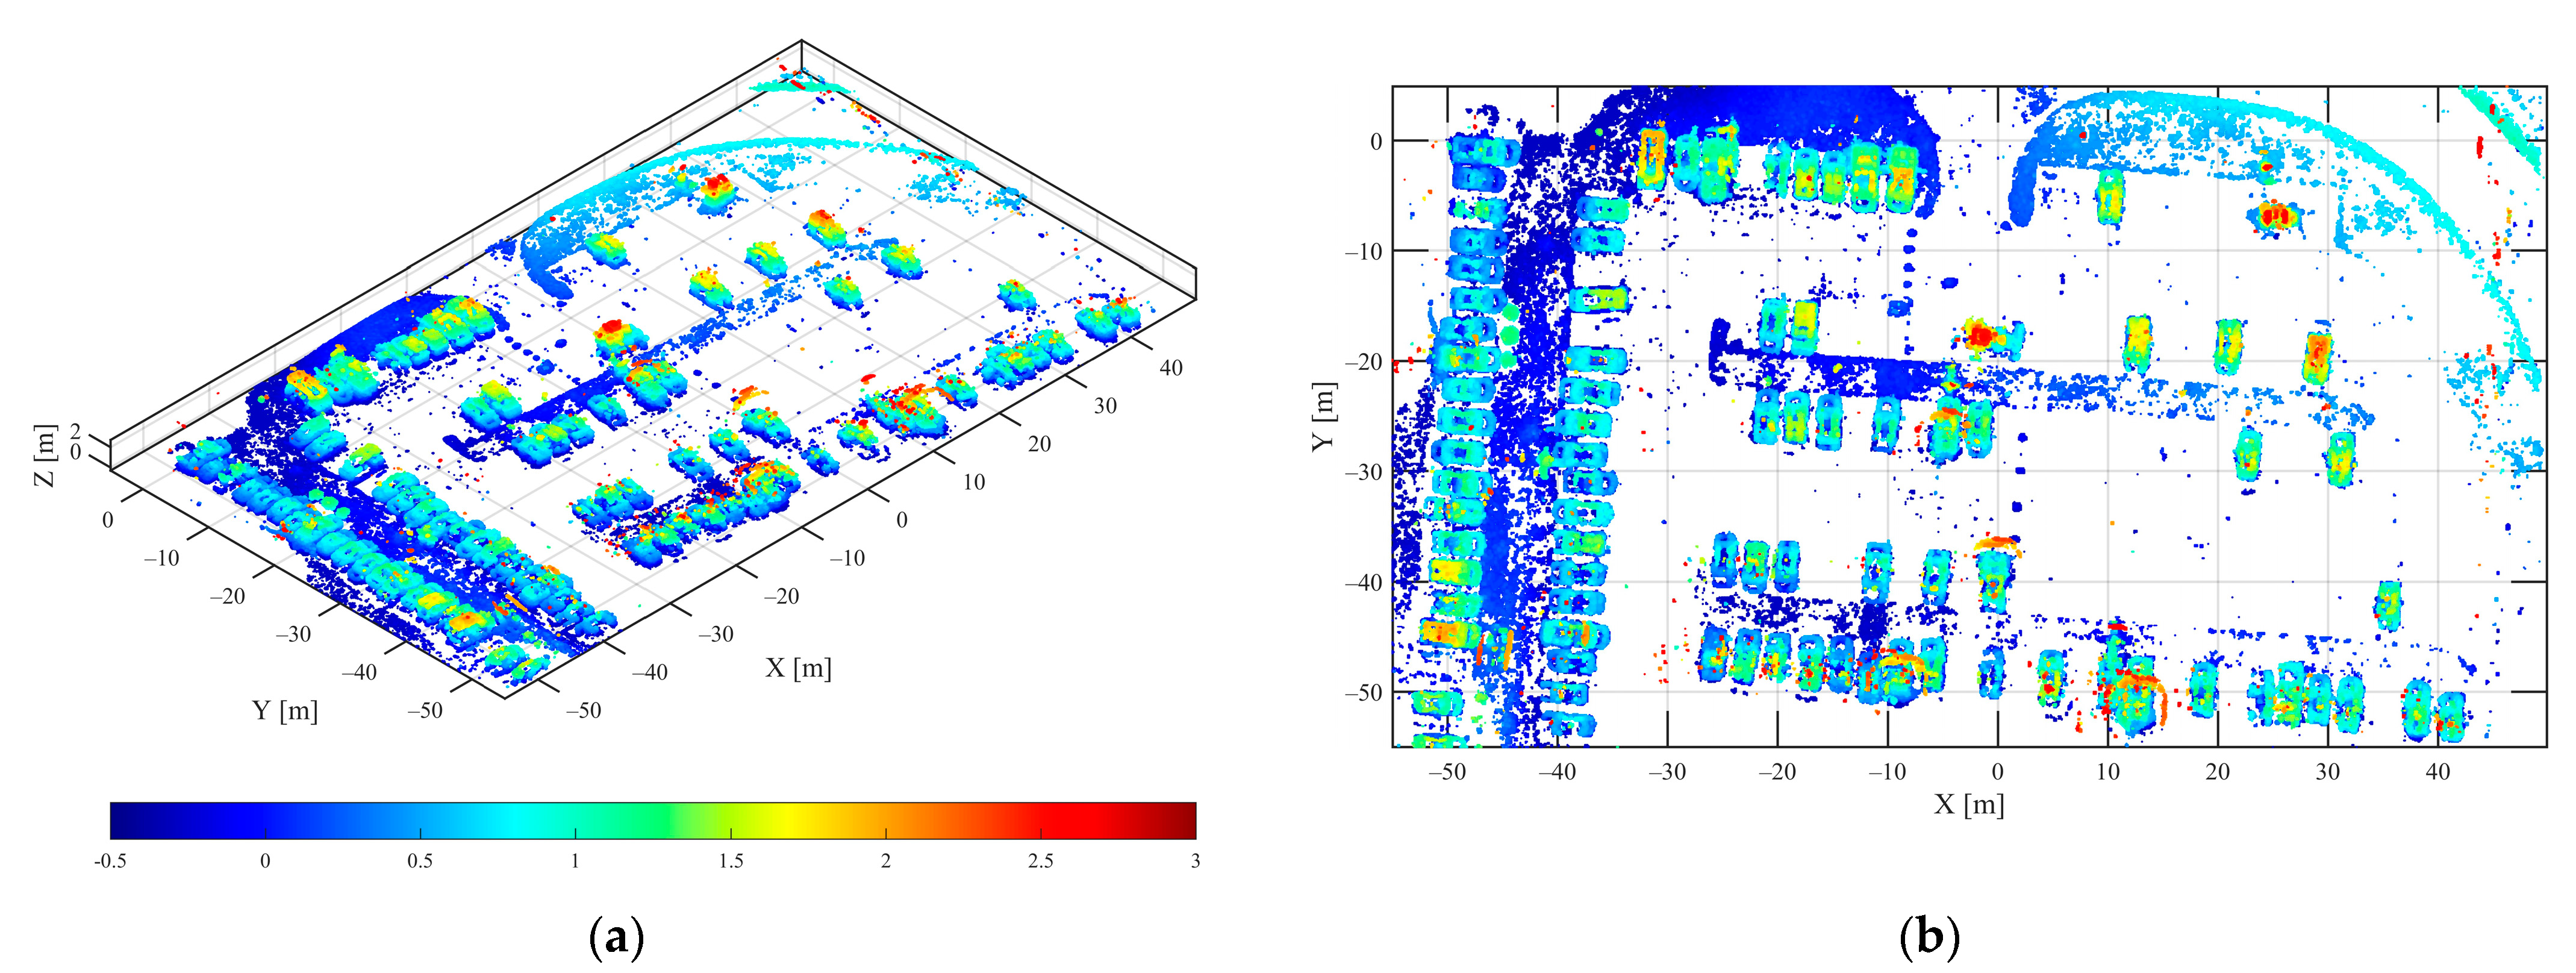
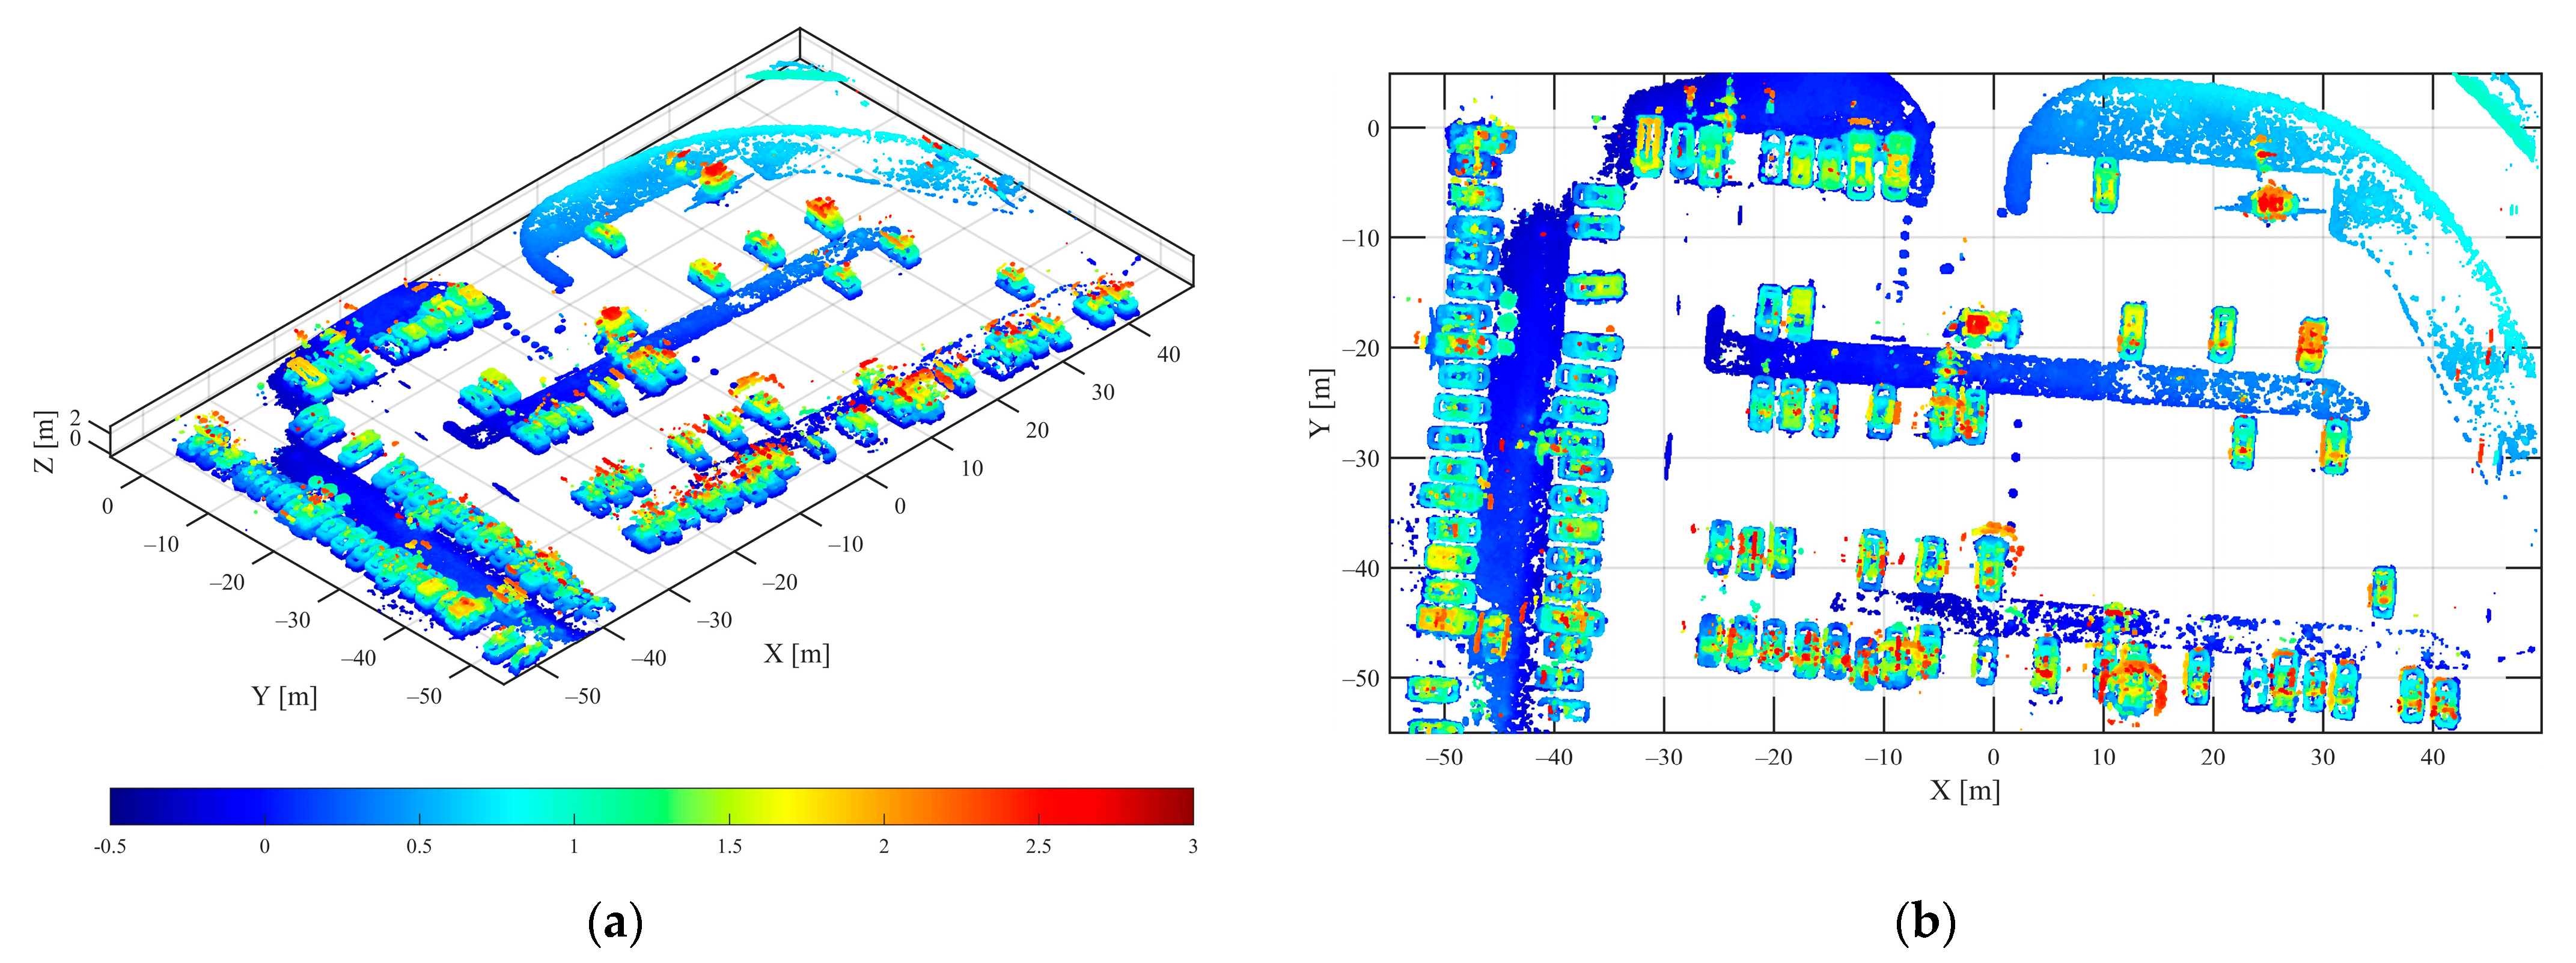
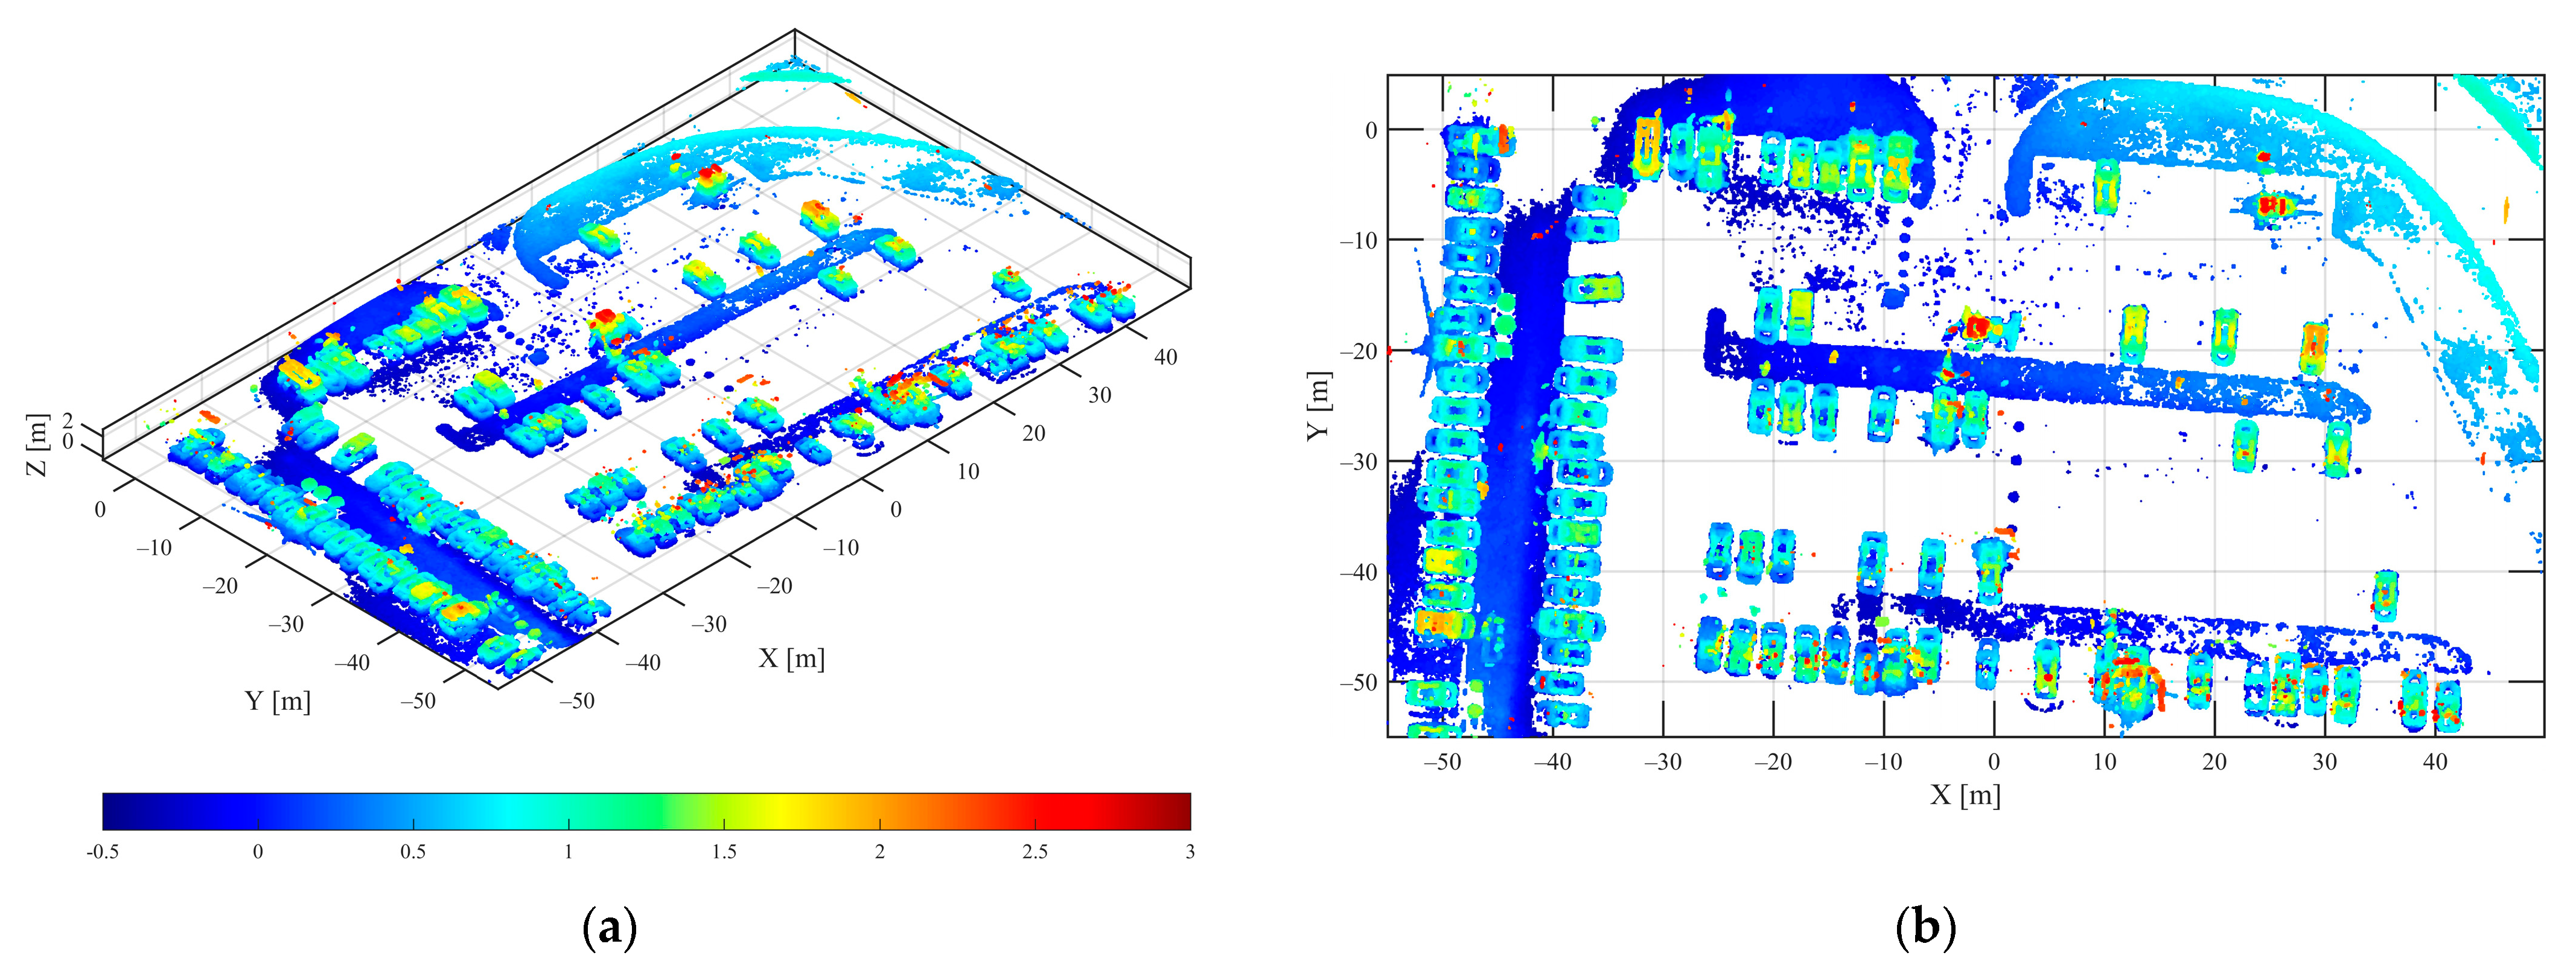
4.2.2. Select the Area of 105 m × 60 m in the Parking Lot, and Use the Proposed Method to Reconstruct the Civil Vehicles 3D Image

The 2D incoherent imaging results in Figure 8 show that there were a large number of civilian vehicles in the observed area of the parking lot. In the single pass circular incoherent imaging results of the vehicle target, there were two contours, the inner contour was the bottom of the vehicle and the outer contour was the top of the vehicle. Due to the selection of BP imaging plane, the bottom of the vehicle was focused and the top of the vehicle was defocused on the ground plane.
Using the L2,1 mixed norm constraint method proposed in this paper, the adjacent three sub-apertures were grouped, and the group sparsity characteristics were considered between adjacent sub-apertures. The 3D point cloud results, reconstructed with HH polarization and VV polarization data using the method proposed in this paper, are shown in Figure 16 and Figure 17. The 3D point clouds reconstructed by the L1 norm regularization method are shown in Figure 18 and Figure 19, respectively. The 3D point clouds reconstructed by the IAA-GLRT algorithm are shown in Figure 20 and Figure 21, respectively.
Compared with Figure 16, Figure 17, Figure 18, Figure 19, Figure 20 and Figure 21, the results of the three different methods of 3D reconstruction show that the proposed method had better 3D reconstruction imaging of all vehicle targets in the parking lot. Due to the group sparsity feature constraints along the elevation direction between the sub-apertures, the spatial shape of the vehicle was clearer, and the noise points around the vehicle and the elevation direction were less. A better 3D target reconstruction was achieved in both vehicle dense and vehicle sparse distribution areas. In the 3D point cloud, the red part denotes the higher vehicle top contour and the blue part denotes the lower vehicle bottom contour. The proposed method could clearly reconstruct the vehicle bottom and vehicle top parts, and obtained high-quality holographic 3D vehicle target images.
The focusing quality of point cloud images reconstructed by different algorithms was evaluated by 3D image entropy. The definition of point cloud 3D image entropy was as follows:
IE = i = 1 N x j = 1 N y k = 1 N z g i , j , k ln g i , j , k
where g i , j , k denotes the scattering intensity density of the point cloud image, which is defined as:
g i , j , k = S i , j , k 2 i = 1 N x j = 1 N y k = 1 N z S i , j , k 2
where S i , j , k denotes the intensity of each point in the point cloud image and Nx, Ny, and Nz are 3D point cloud sizes.
For a point cloud image, the smaller the 3D image entropy, the better the focusing quality, and the clearer the image. The point cloud 3D image entropy by different algorithms is shown in Table 2. Comparing the 3D image entropy values of reconstructed point cloud images by different algorithms, it was observed that the 3D image entropy by the proposed method was smaller and the point cloud image was clearer. The proposed method could obtain high-quality point cloud images.
The proposed method added the group sparsity features L2,1 mixed norm constraint between adjacent sub-apertures, and the computational complexity increased, compared with the target reconstruction in elevation with only L1 norm constraint. However, the results were better. Among them, when the MATLAB program was used on the 2.5 GHz processor and a computer with memory of 16 GB, for each sub-aperture image stack, the average calculation time of the proposed method was 242.39 s for the reconstruction of vehicle C1 with 200 × 200 pixel cell, the average time of L1 norm regularization was 235.12 s, and the average time of the IAA-GLRT method was 247.49 s. Although the L1 norm regularization method was fast, the reconstructed 3D point cloud was poor. Therefore, the proposed method could effectively achieve high-quality 3D target imaging of multi-circular SAR observation targets.

5. Conclusions

Due to the structural complexity and scattering anisotropy of observed targets, 3D target image formation with multi-circular SAR data is a challenging problem. In view of the shortcomings of the traditional incoherent 3D imaging strategy of multi-circular SAR combined with tomographic SAR inversion, the L1 norm regularization constraint in sub-aperture and the L2,1 norm regularization group sparsity constraint between multiple adjacent sub-apertures is proposed in the paper. The sparse group thresholding iterative is used to reconstruct the target along the elevation direction with multi-circular SAR data. The proposed method could strengthen the observed target spatial structure and obtain better holographic 3D target images. In simulation data analysis, the proposed method maintained low reconstruction error at low SNR. In the real multi-circular SAR observation data processing, compared with the traditional reconstruction method, that only considers the sparsity along the elevation direction inner the sub-aperture, the proposed method produced a clearer 3D point cloud, and the desultory points around the vehicle target were fewer. High-quality holographic 3D vehicle target images could be obtained in the parking lot.
In future research work, the polarization information could be added to the target reconstruction process of MCSAR elevation, and the polarization SAR tomography with MCSAR data further studied. Different polarization scattering characteristics of targets have important research value. In target reconstruction in tomographic SAR elevation, increasing polarization information could obtain more detailed target structure information, which is the focus of future research.

Author Contributions

Conceptualization, W.Y. and D.Z.; Data curation, W.Y.; Formal analysis, W.Y. and D.Z.; Methodology, W.Y.; Project administration, D.Z.; writing—original draft preparation, W.Y.; Writing—review and editing, W.Y. and D.Z. All authors have read and agreed to the published version of the manuscript.

Funding

This research received no external funding.

Data Availability Statement

Not applicable.

Acknowledgments

The authors would like to thank the Air Force Research Laboratory for providing the Gotcha Volumetric SAR Data Set.

Conflicts of Interest

The authors declare no conflict of interest.

References

  1. Ponce, O.; Prats-Iraola, P.; Scheiber, R.; Reigber, A.; Moreira, A.; Aguilera, E. Polarimetric 3-D Reconstruction from Multicircular SAR at P-Band. IEEE Geosci. Remote Sens. Lett. 2014, 11, 803–807. [Google Scholar] [CrossRef]
  2. Zelnio, E.G.; Ferrara, M.; Garber, F.D.; Jackson, J.A.; Austin, C. Enhancement of multi-pass 3D circular SAR images using sparse reconstruction techniques. In Proceedings of the Algorithms for Synthetic Aperture Radar Imagery XVI, Orlando, FL, USA, 16–17 April 2009. [Google Scholar]
  3. Ponce, O.; Prats, P.; Scheiber, R.; Reigber, A.; Moreira, A. Study of the 3-D Impulse Response Function of Holographic SAR Tomography with Multicircular Acquisitions. In Proceedings of the EUSAR 2014, 10th European Conference on Synthetic Aperture Radar, Berlin, Germany, 3–5 June 2014; pp. 1–4. [Google Scholar]
  4. Moses, R.L.; Potter, L.C. Noncoherent 2D and 3D SAR reconstruction from wide-angle measurements. In Proceedings of the 13th Annual Adaptive Sensor Array Processing Workshop, Lexington, MA, USA, 7–8 June 2005. [Google Scholar]
  5. Reigber, A.; Moreira, A. First demonstration of airborne SAR tomography using multibaseline L-band data. IEEE Trans. Geosci. Remote Sens. 2000, 38, 2142–2152. [Google Scholar] [CrossRef]
  6. Zelnio, E.G.; Ertin, E.; Garber, F.D.; Moses, R.L.; Potter, L.C. Multibaseline IFSAR for 3D target reconstruction. In Proceedings of the Algorithms for Synthetic Aperture Radar Imagery XV, Orlando, FL, USA, 17–18 March 2008. [Google Scholar]
  7. Ponce, O.; Prats-Iraola, P.; Scheiber, R.; Reigber, A.; Moreira, A. First Airborne Demonstration of Holographic SAR Tomography with Fully Polarimetric Multicircular Acquisitions at L-Band. IEEE Trans. Geosci. Remote Sens. 2016, 54, 6170–6196. [Google Scholar] [CrossRef]
  8. Feng, D.; An, D.; Chen, L.; Huang, X. Holographic SAR Tomography 3-D Reconstruction Based on Iterative Adaptive Approach and Generalized Likelihood Ratio Test. IEEE Trans. Geosci. Remote Sens. 2021, 59, 305–315. [Google Scholar] [CrossRef]
  9. Sugavanam, N.; Ertin, E. Models of anisotropic scattering for 3D SAR reconstruction. In Proceedings of the 2022 IEEE Radar Conference (RadarConf22), New York, NY, USA, 21–25 March 2022; pp. 1–6. [Google Scholar]
  10. Ash, J.; Ertin, E.; Potter, L.C.; Zelnio, E. Wide-Angle Synthetic Aperture Radar Imaging: Models and algorithms for anisotropic scattering. IEEE Signal Process. Mag. 2014, 31, 16–26. [Google Scholar] [CrossRef]
  11. Çetin, M.; Stojanović, I.; Önhon, N.Ö.; Varshney, K.; Samadi, S.; Karl, W.C.; Willsky, A.S. Sparsity-Driven Synthetic Aperture Radar Imaging: Reconstruction, autofocusing, moving targets, and compressed sensing. IEEE Signal Process. Mag. 2014, 31, 27–40. [Google Scholar] [CrossRef]
  12. Stojanovic, I.; Cetin, M.; Karl, W. Joint space aspect reconstruction of wide-angle SAR exploiting sparsity. In Proceedings of the SPIE—The International Society for Optical Engineering; International Society for Optical Engineering, Bellingham, WA, USA, 16–20 March 2008. [Google Scholar] [CrossRef]
  13. Duarte, M.F.; Eldar, Y.C. Structured Compressed Sensing: From Theory to Applications. IEEE Trans. Signal Process. 2011, 59, 4053–4085. [Google Scholar] [CrossRef]
  14. Aguilera, E.; Nannini, M.; Reigber, A. Multisignal Compressed Sensing for Polarimetric SAR Tomography. IEEE Geosci. Remote Sens. Lett. 2012, 9, 871–875. [Google Scholar] [CrossRef]
  15. Austin, C.D.; Ertin, E.; Moses, R.L. Sparse Signal Methods for 3-D Radar Imaging. IEEE J. Sel. Top. Signal Process. 2011, 5, 408–423. [Google Scholar] [CrossRef]
  16. Ertin, E.; Moses, R.L.; Potter, L.C. Interferometric methods for three-dimensional target reconstruction with multipass circular SAR. IET Radar Sonar Navig. 2010, 4, 464–473. [Google Scholar] [CrossRef]
  17. Zelnio, E.G.; Austin, C.D.; Garber, F.D.; Ertin, E.; Moses, R.L. Sparse multipass 3D SAR imaging: Applications to the GOTCHA data set. In Proceedings of the Algorithms for Synthetic Aperture Radar Imagery XVI, Orlando, FL, USA, 16–17 April 2009. [Google Scholar]
  18. Candes, E.J.; Wakin, M.B. An Introduction to Compressive Sampling. IEEE Signal Process. Mag. 2008, 25, 21–30. [Google Scholar] [CrossRef]
  19. Daubechies, I.; Defrise, M.; De Mol, C. An iterative thresholding algorithm for linear inverse problems with a sparsity constraint. Commun. Pure Appl. Math. 2004, 57, 1413–1457. [Google Scholar] [CrossRef]
  20. Dudgeon, D.; Lacoss, R.; Lazott, C.; Verly, J. Use of persistent scatterers for model-based recognition. In Proceedings of the SPIE—The International Society for Optical Engineering; International Society for Optical Engineering, Bellingham, WA, USA, 4–8 April 1994. [Google Scholar] [CrossRef]
  21. Cai, T.T.; Zhang, A.R.; Zhou, Y. Sparse Group Lasso: Optimal Sample Complexity, Convergence Rate, and Statistical Inference. IEEE Trans. Inf. Theory 2022. [Google Scholar] [CrossRef]
  22. Sprechmann, P.; Ramirez, I.; Sapiro, G.; Eldar, Y.C. C-HiLasso: A Collaborative Hierarchical Sparse Modeling Framework. IEEE Trans. Signal Process. 2011, 59, 4183–4198. [Google Scholar] [CrossRef]
  23. Ertin, E.; Austin, C.D.; Sharma, S.; Moses, R.L.; Potter, L.C. GOTCHA experience report: Three-dimensional SAR imaging with complete circular apertures. In Proceedings of the Algorithms for Synthetic Aperture Radar Imagery XIV, Orlando, FL, USA, 10–11 April 2008; pp. 9–20. [Google Scholar]
  24. Zelnio, E.G.; Casteel, J.C.H.; Garber, F.D.; Gorham, L.A.; Minardi, M.J.; Scarborough, S.M.; Naidu, K.D.; Majumder, U.K. A challenge problem for 2D/3D imaging of targets from a volumetric data set in an urban environment. In Proceedings of the Algorithms for Synthetic Aperture Radar Imagery XIV, Orlando, FL, USA, 10–11 April 2008. [Google Scholar]
Figure 1. MCSAR flight geometry diagram.
Remotesensing 14 03945 g001
Figure 2. The schematic diagram of group sparsity characteristics of the same pixel unit in Ns adjacent sub-apertures.
Remotesensing 14 03945 g002
Figure 3. The flow chart of incoherent 3D imaging using group sparsity between adjacent sub-apertures.
Remotesensing 14 03945 g003
Figure 4. The flight trajectory of radar platform in GOTCHA dataset.
Remotesensing 14 03945 g004
Figure 5. Mean square error of each algorithm at different SNR.
Remotesensing 14 03945 g005
Figure 6. Reconstruction results by different algorithms in three sub-apertures when SNR = 10 dB (a) Sub-aperture 1 (b) Sub-aperture 2 (c) Sub-aperture 3.
Remotesensing 14 03945 g006aRemotesensing 14 03945 g006b
Figure 7. Reconstruction results by different algorithms in three sub-apertures when SNR = 20 dB (a) Sub-aperture 1 (b) Sub-aperture 2 (c) Sub-aperture 3.
Remotesensing 14 03945 g007aRemotesensing 14 03945 g007b
Figure 8. The incoherent 2D imaging of parking lot (a) HH polarization (b) VV polarization.
Remotesensing 14 03945 g008aRemotesensing 14 03945 g008b
Figure 9. The Photographs of tractor C1.
Remotesensing 14 03945 g009
Figure 10. The Point Cloud Image of Vehicle C1 in HH Polarization via the proposed method (a) 3D view (b) top view (c) side view.
Remotesensing 14 03945 g010
Figure 11. The Point Cloud Image of Vehicle C1 in VV Polarization via the proposed method (a) 3D view (b) top view (c) side view.
Remotesensing 14 03945 g011
Figure 12. The Point Cloud Image of Vehicle C1 in HH Polarization via L1 norm regularization method (a) 3D view (b) top view (c) side view.
Remotesensing 14 03945 g012
Figure 13. The Point Cloud Image of Vehicle C1 in VV Polarization via L1 norm regularization method (a) 3D view (b) top view (c) side view.
Remotesensing 14 03945 g013
Figure 14. The Point Cloud Image of Vehicle C1 in HH Polarization via IAA-GLRT algorithm (a) 3D view (b) top view (c) side view.
Remotesensing 14 03945 g014
Figure 15. The Point Cloud Image of Vehicle C1 in VV Polarization via IAA-GLRT algorithm (a) 3D view (b) top view (c) side view.
Remotesensing 14 03945 g015
Figure 16. The 3D point cloud of parking lot in HH polarization via the proposed method (a) 3D view (b) top view.
Remotesensing 14 03945 g016
Figure 17. The 3D point cloud of parking lot in VV polarization via the proposed method (a) 3D view (b) top view.
Remotesensing 14 03945 g017
Figure 18. The 3D point cloud of parking lot in HH polarization via L1 norm regularization method (a) 3D view (b) top view.
Remotesensing 14 03945 g018
Figure 19. The 3D point cloud of parking lot in VV polarization via L1 norm regularization method (a) 3D view (b) top view.
Remotesensing 14 03945 g019
Figure 20. The 3D point cloud of parking lot in HH polarization via IAA-GLRT method (a) 3D view (b) top view.
Remotesensing 14 03945 g020
Figure 21. The 3D point cloud of parking lot in VV polarization via IAA-GLRT method (a) 3D view (b) top view.
Remotesensing 14 03945 g021
Table 1. Point target simulation parameters.
ParameterParameter Value
Carrier frequency10 GHz
Slant range10 Km
Height of three scattering points0.5 m, 0.75 m, 1.5 m
Sub-aperture 1 baseline44.23°, 44.55°, 44.83°, 45.00°, 45.07°, 45.32°, 45.67°, 45.88°
Sub-aperture 2 baseline44.25°, 44.40°, 44.67°, 44.94°, 45.22°, 45.58°, 45.77°, 45.93°
Sub-aperture 3 baseline44.31°, 44.41°, 44.64°, 44.78°, 45.27°, 45.55°, 45.77°, 45.90°
Table 2. Comparison of 3D image entropy by different algorithms.
3D Image Entropy
HH PolarizationVV Polarization
The Vehicle C1the proposed method6.48926.9249
L1 norm regularization method9.720510.3100
IAA-GLRT method8.43618.6431
The parking lotthe proposed method9.188811.0834
L1 norm regularization method11.941413.0783
IAA-GLRT method11.652212.8253
Publisher’s Note: MDPI stays neutral with regard to jurisdictional claims in published maps and institutional affiliations.

