
Forest Damage by Super Typhoon Rammasun and Post-Disturbance Recovery Using Landsat Imagery and the Machine-Learning Method

 , and
, and
Abstract
:
1. Introduction
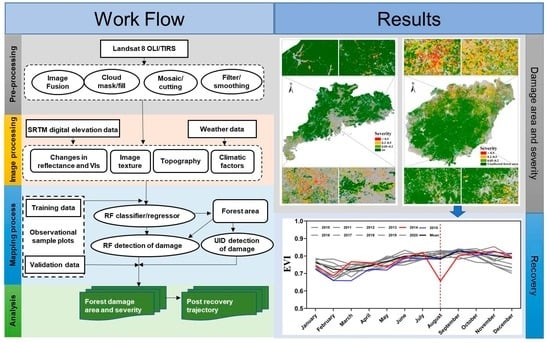
2. Methods
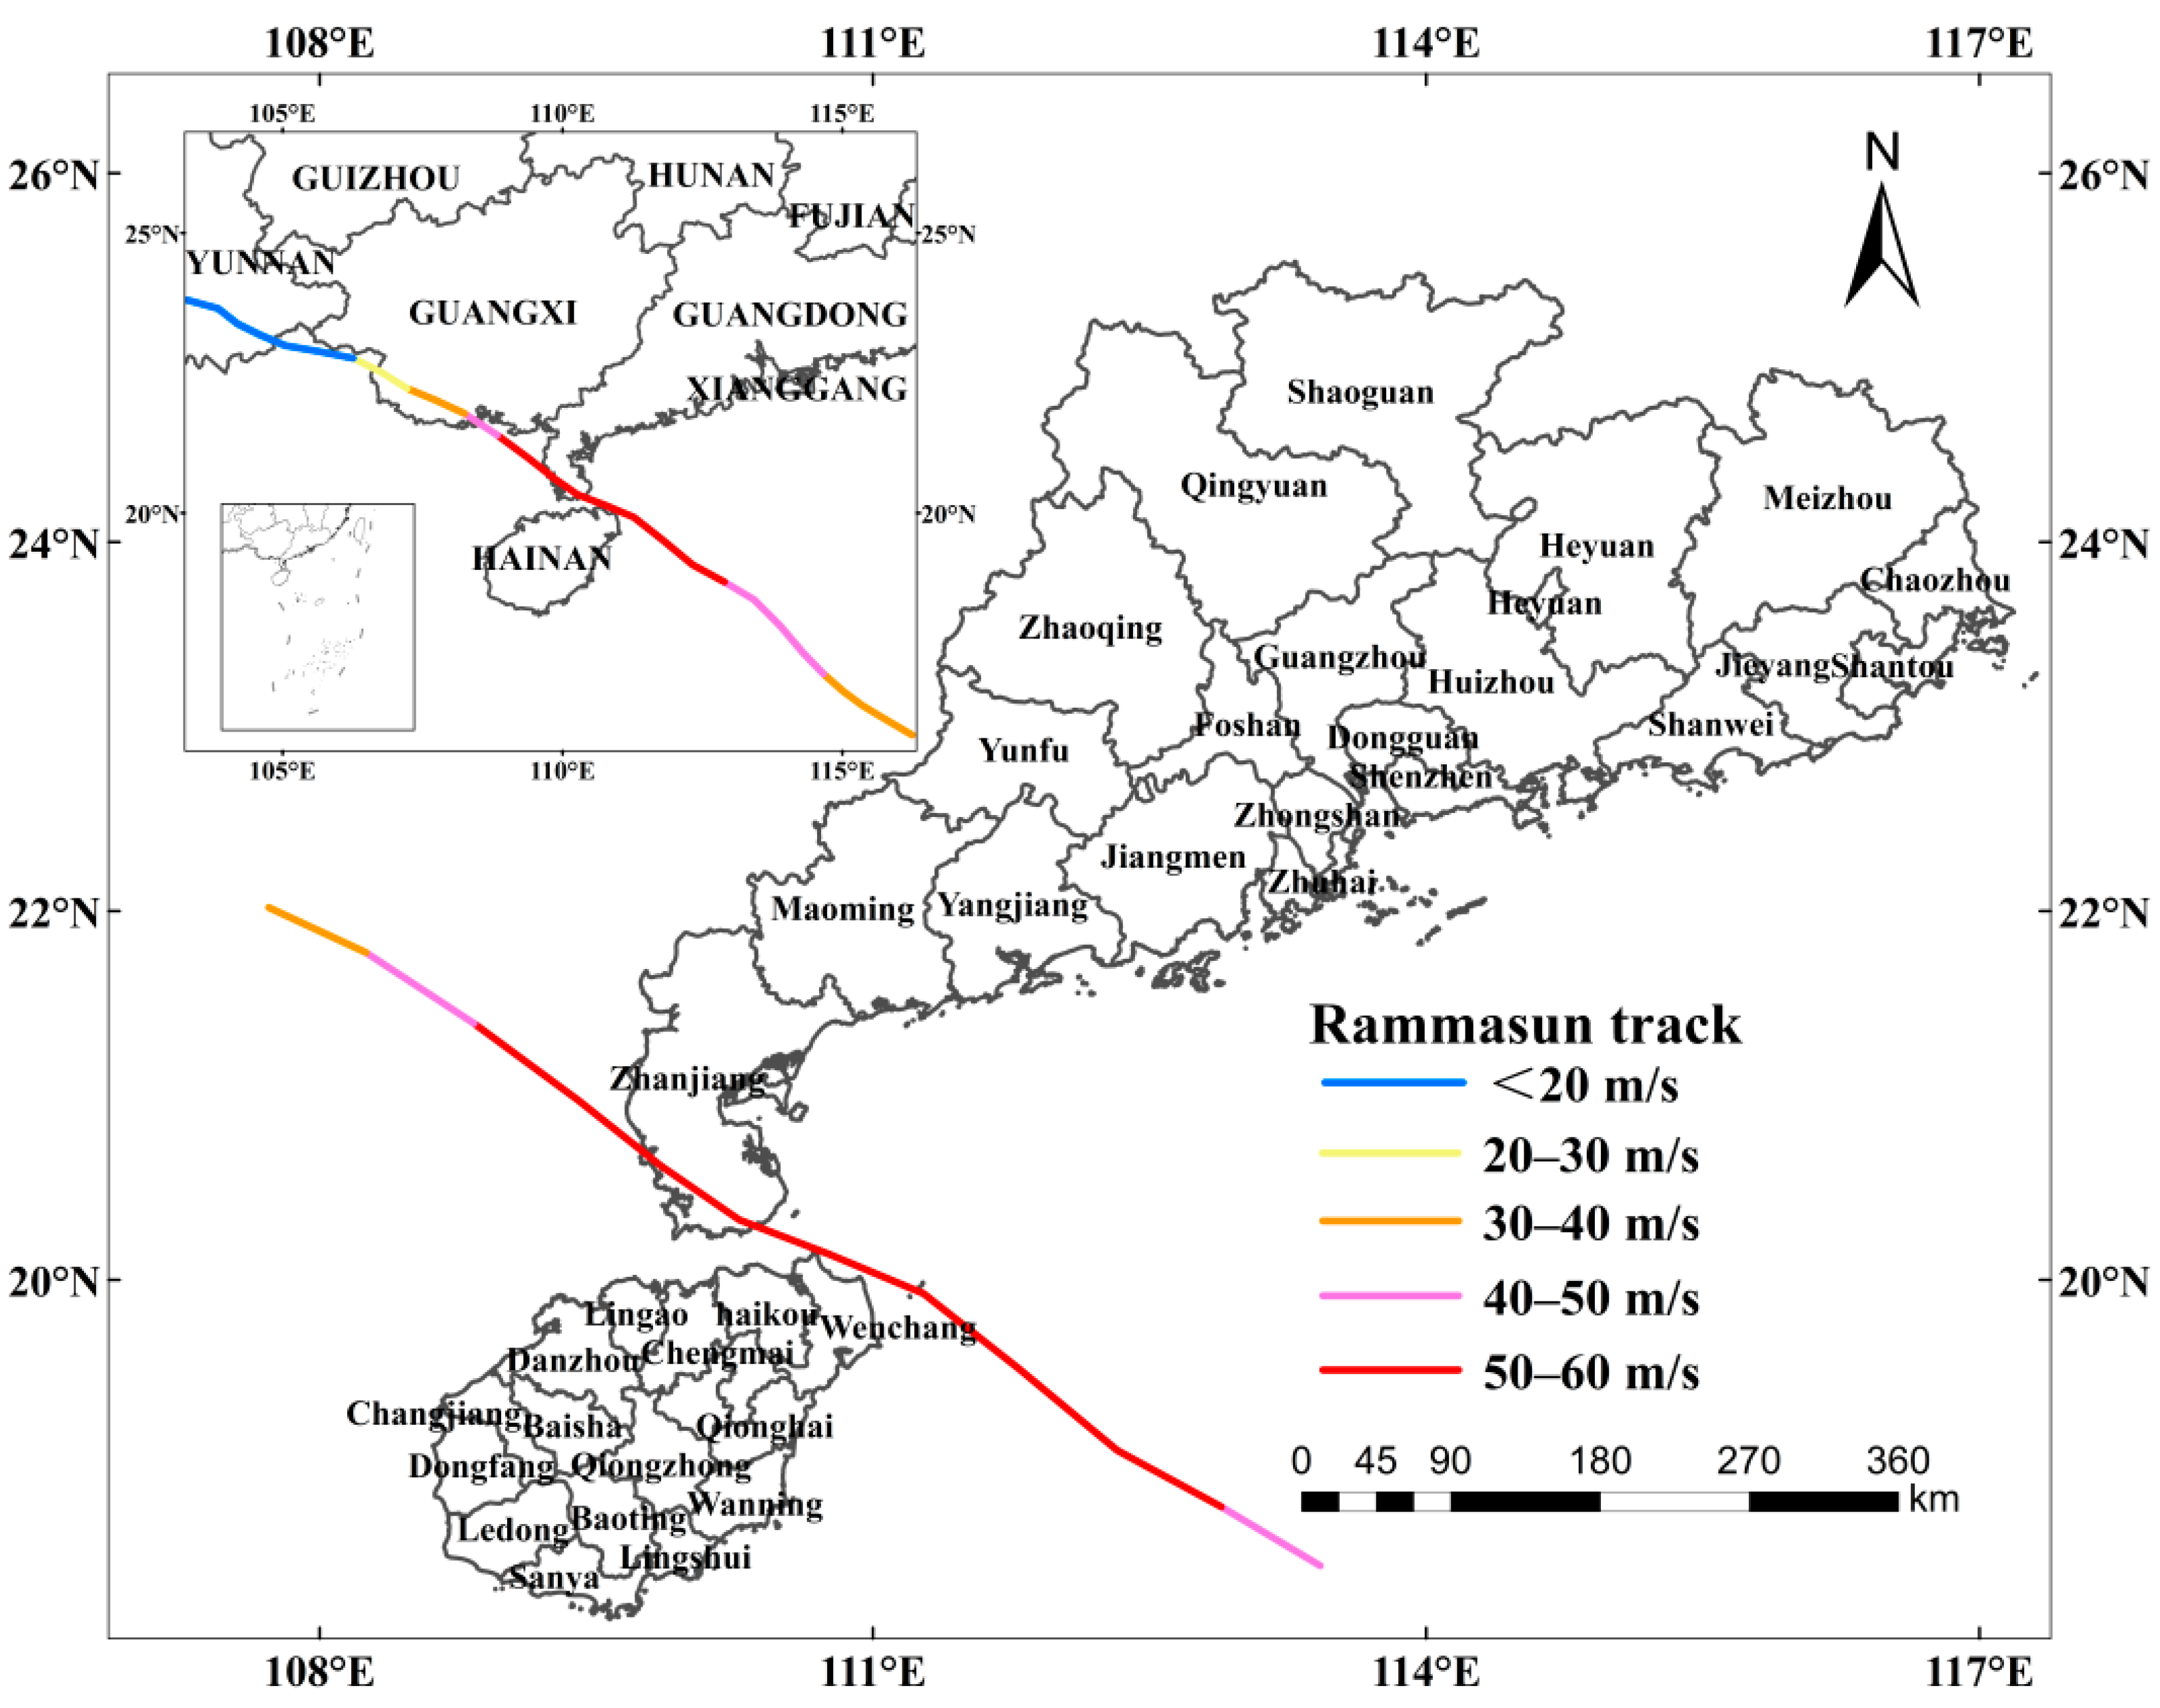
2.1. Characteristics of Typhoon Rammasun
2.2. Study Region
2.3. Data Sources and Descriptions
2.3.1. Satellite Data
2.3.2. Training and Validation Plot Data Collection
2.3.3. Other Auxiliary Data
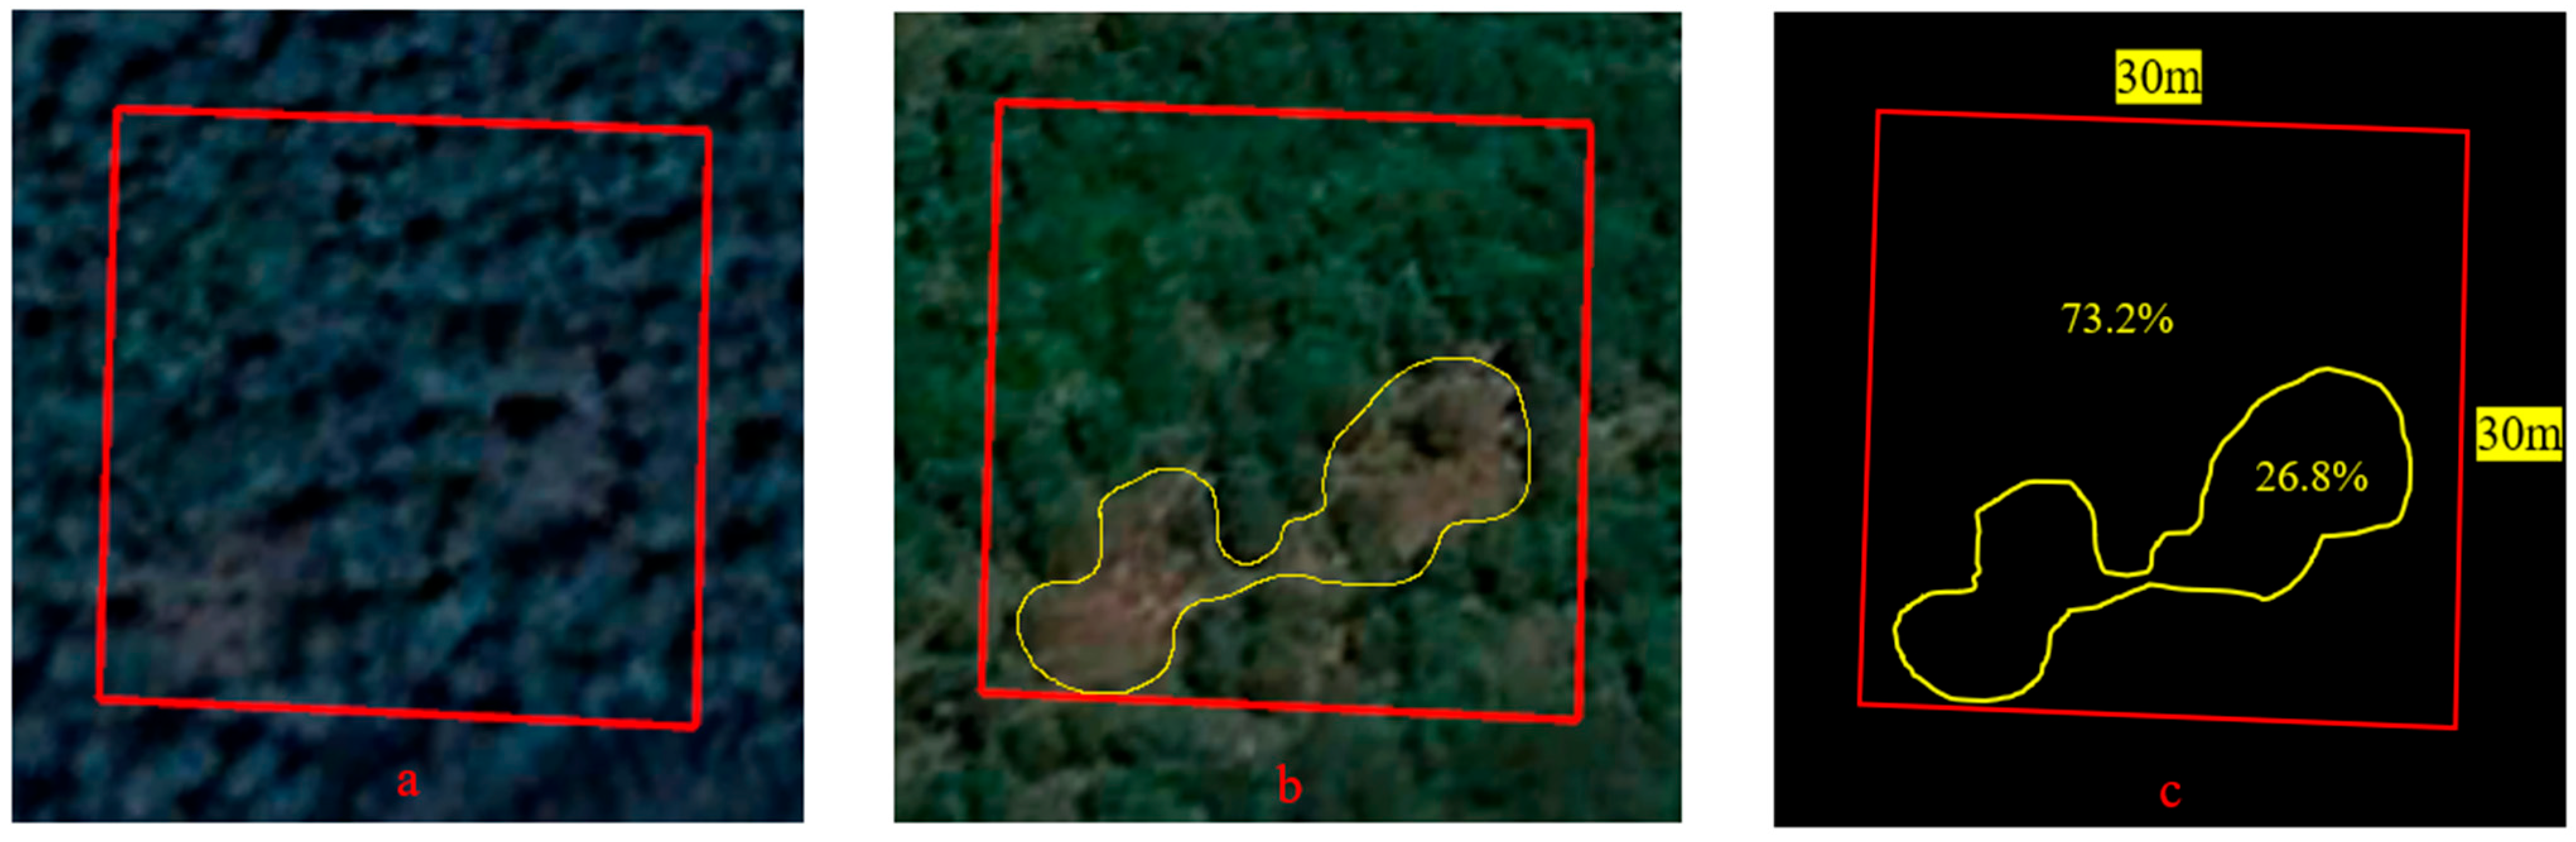
2.4. Methods for Detecting Forest Damage Area and Severity
- (1)
- Mask of forest areas
- (2)
- The calculations of VIs and image texture variables
- (3)
- Implementations of the UID method
- (4)
- Mapping damaged forest area and severity using RF classifier/regressor algorithms
2.5. Methods for Monitoring Forest Canopy Recovery
2.6. Evaluations of Classification Results
2.7. Analysis Methods
3. Results
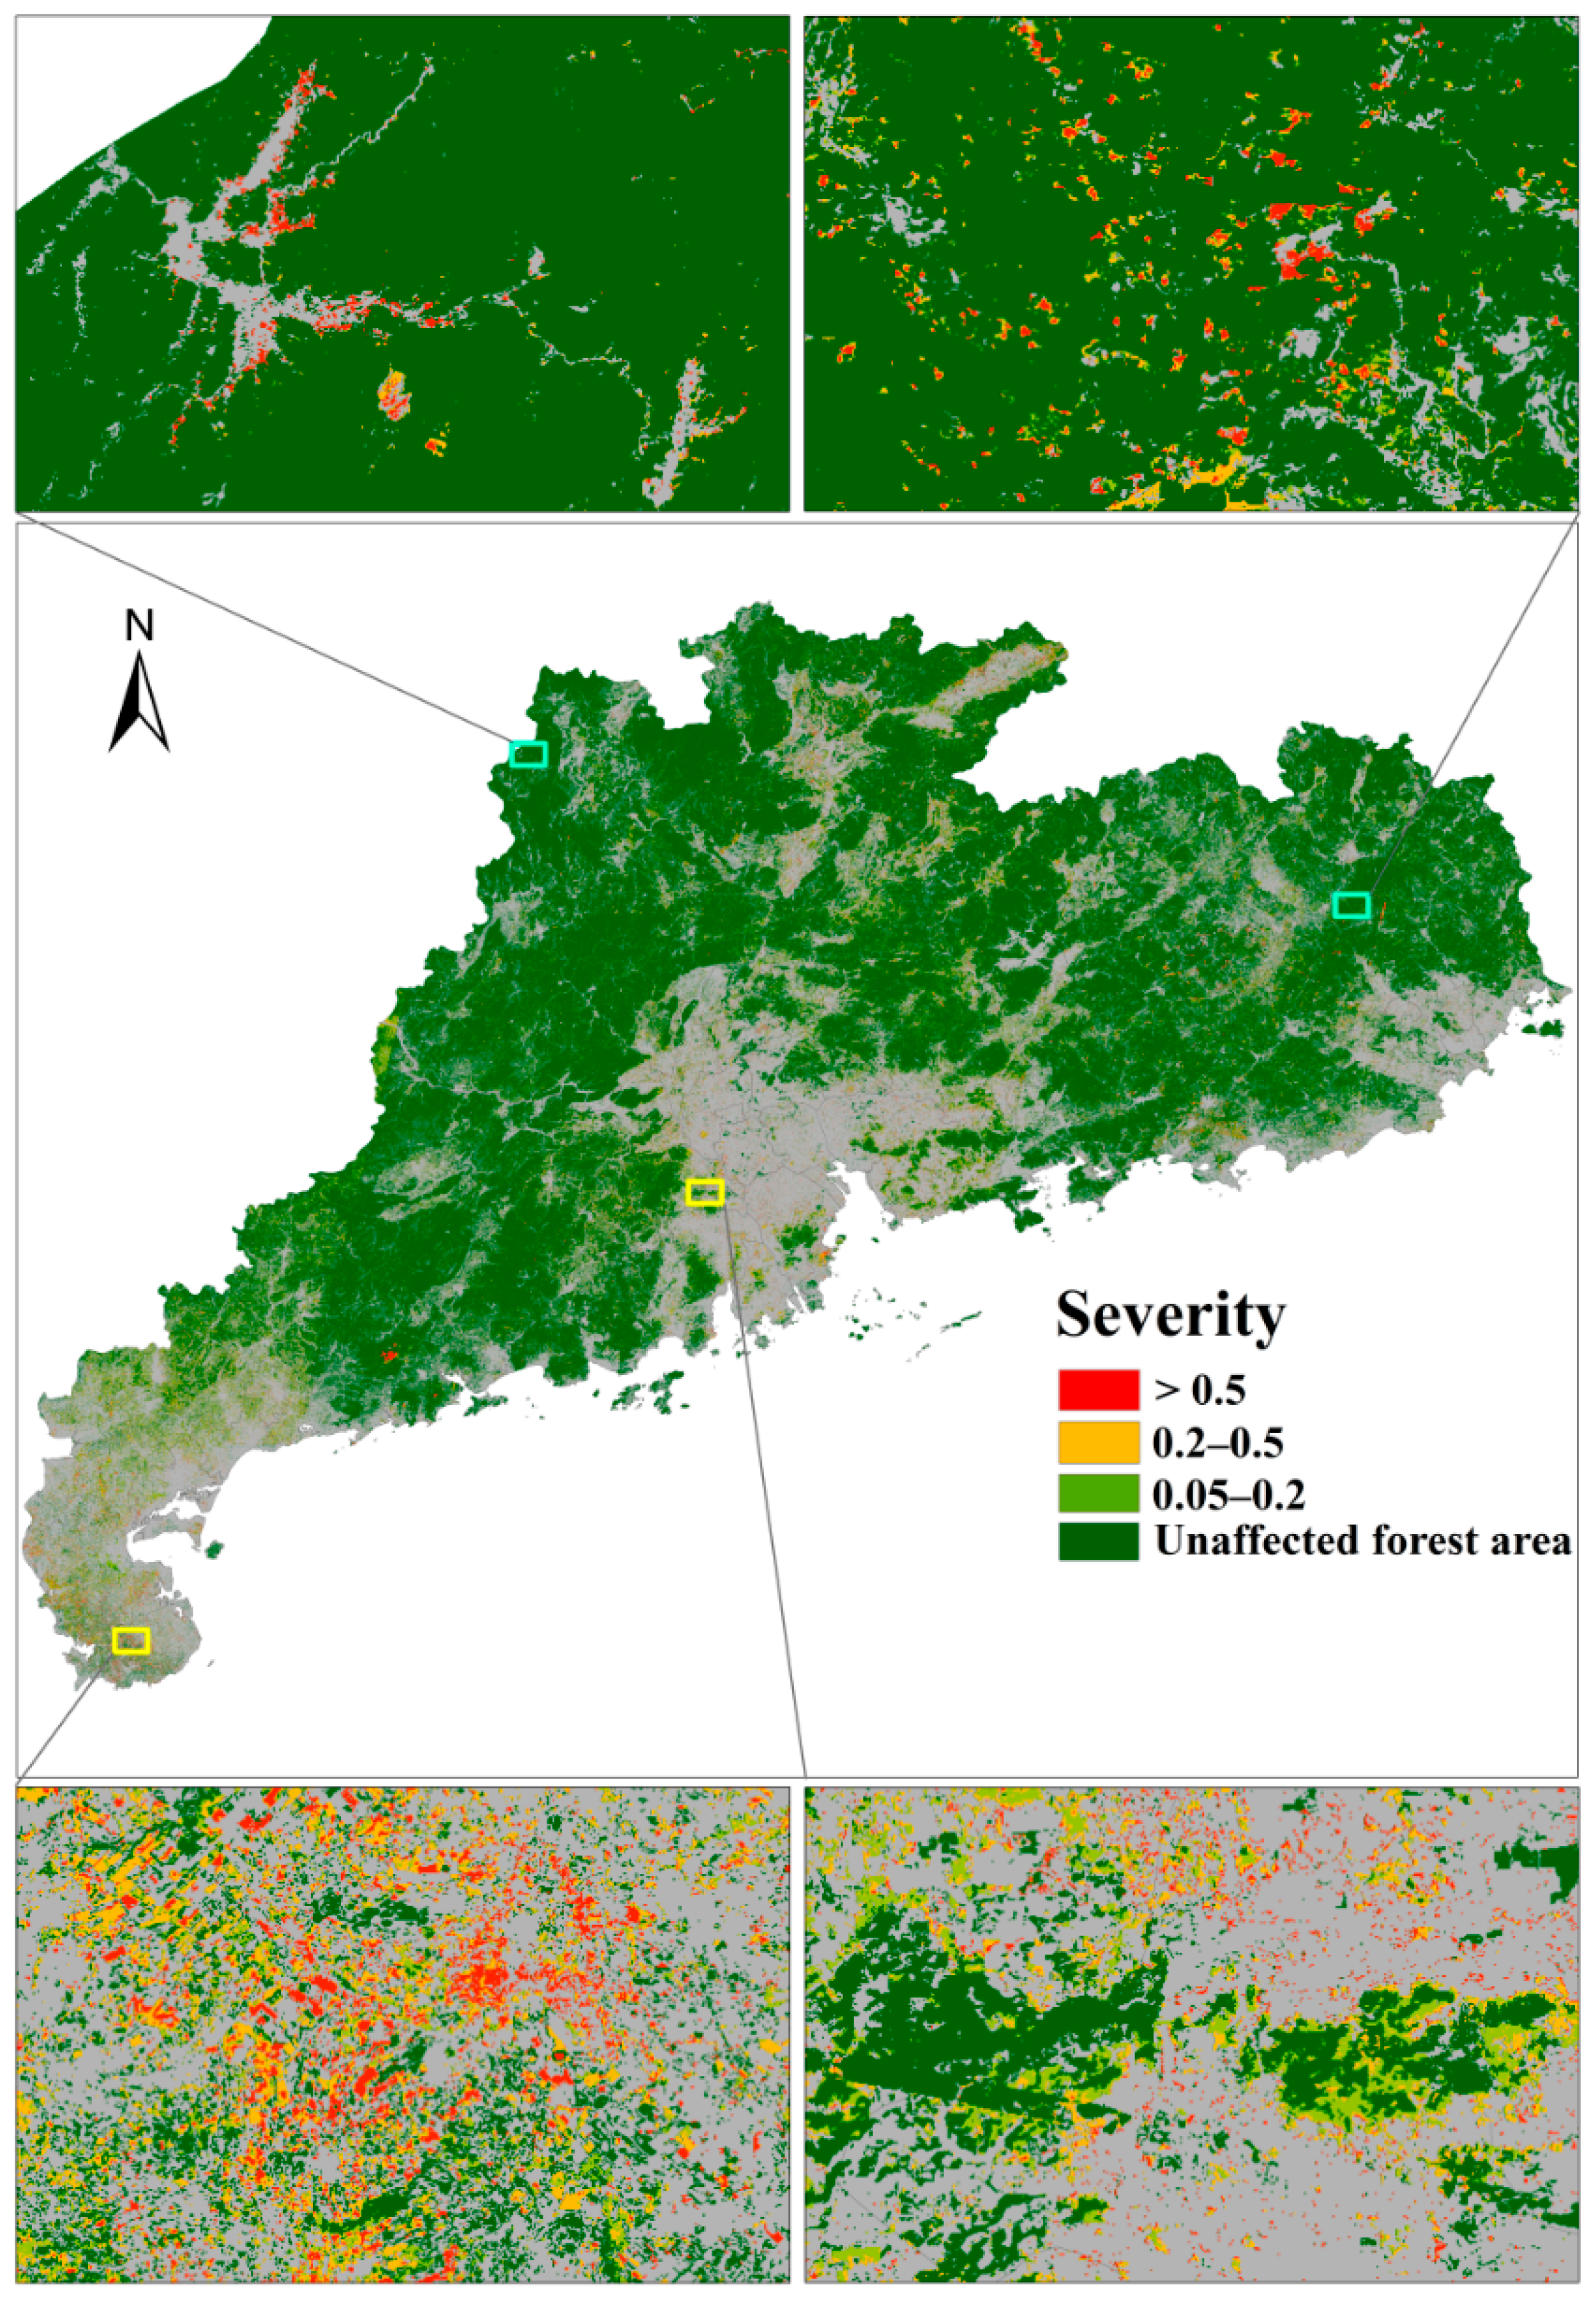
3.1. Affected Forest Area and Spatial Patterns
3.2. Forest Damage Severity and Spatial Patterns
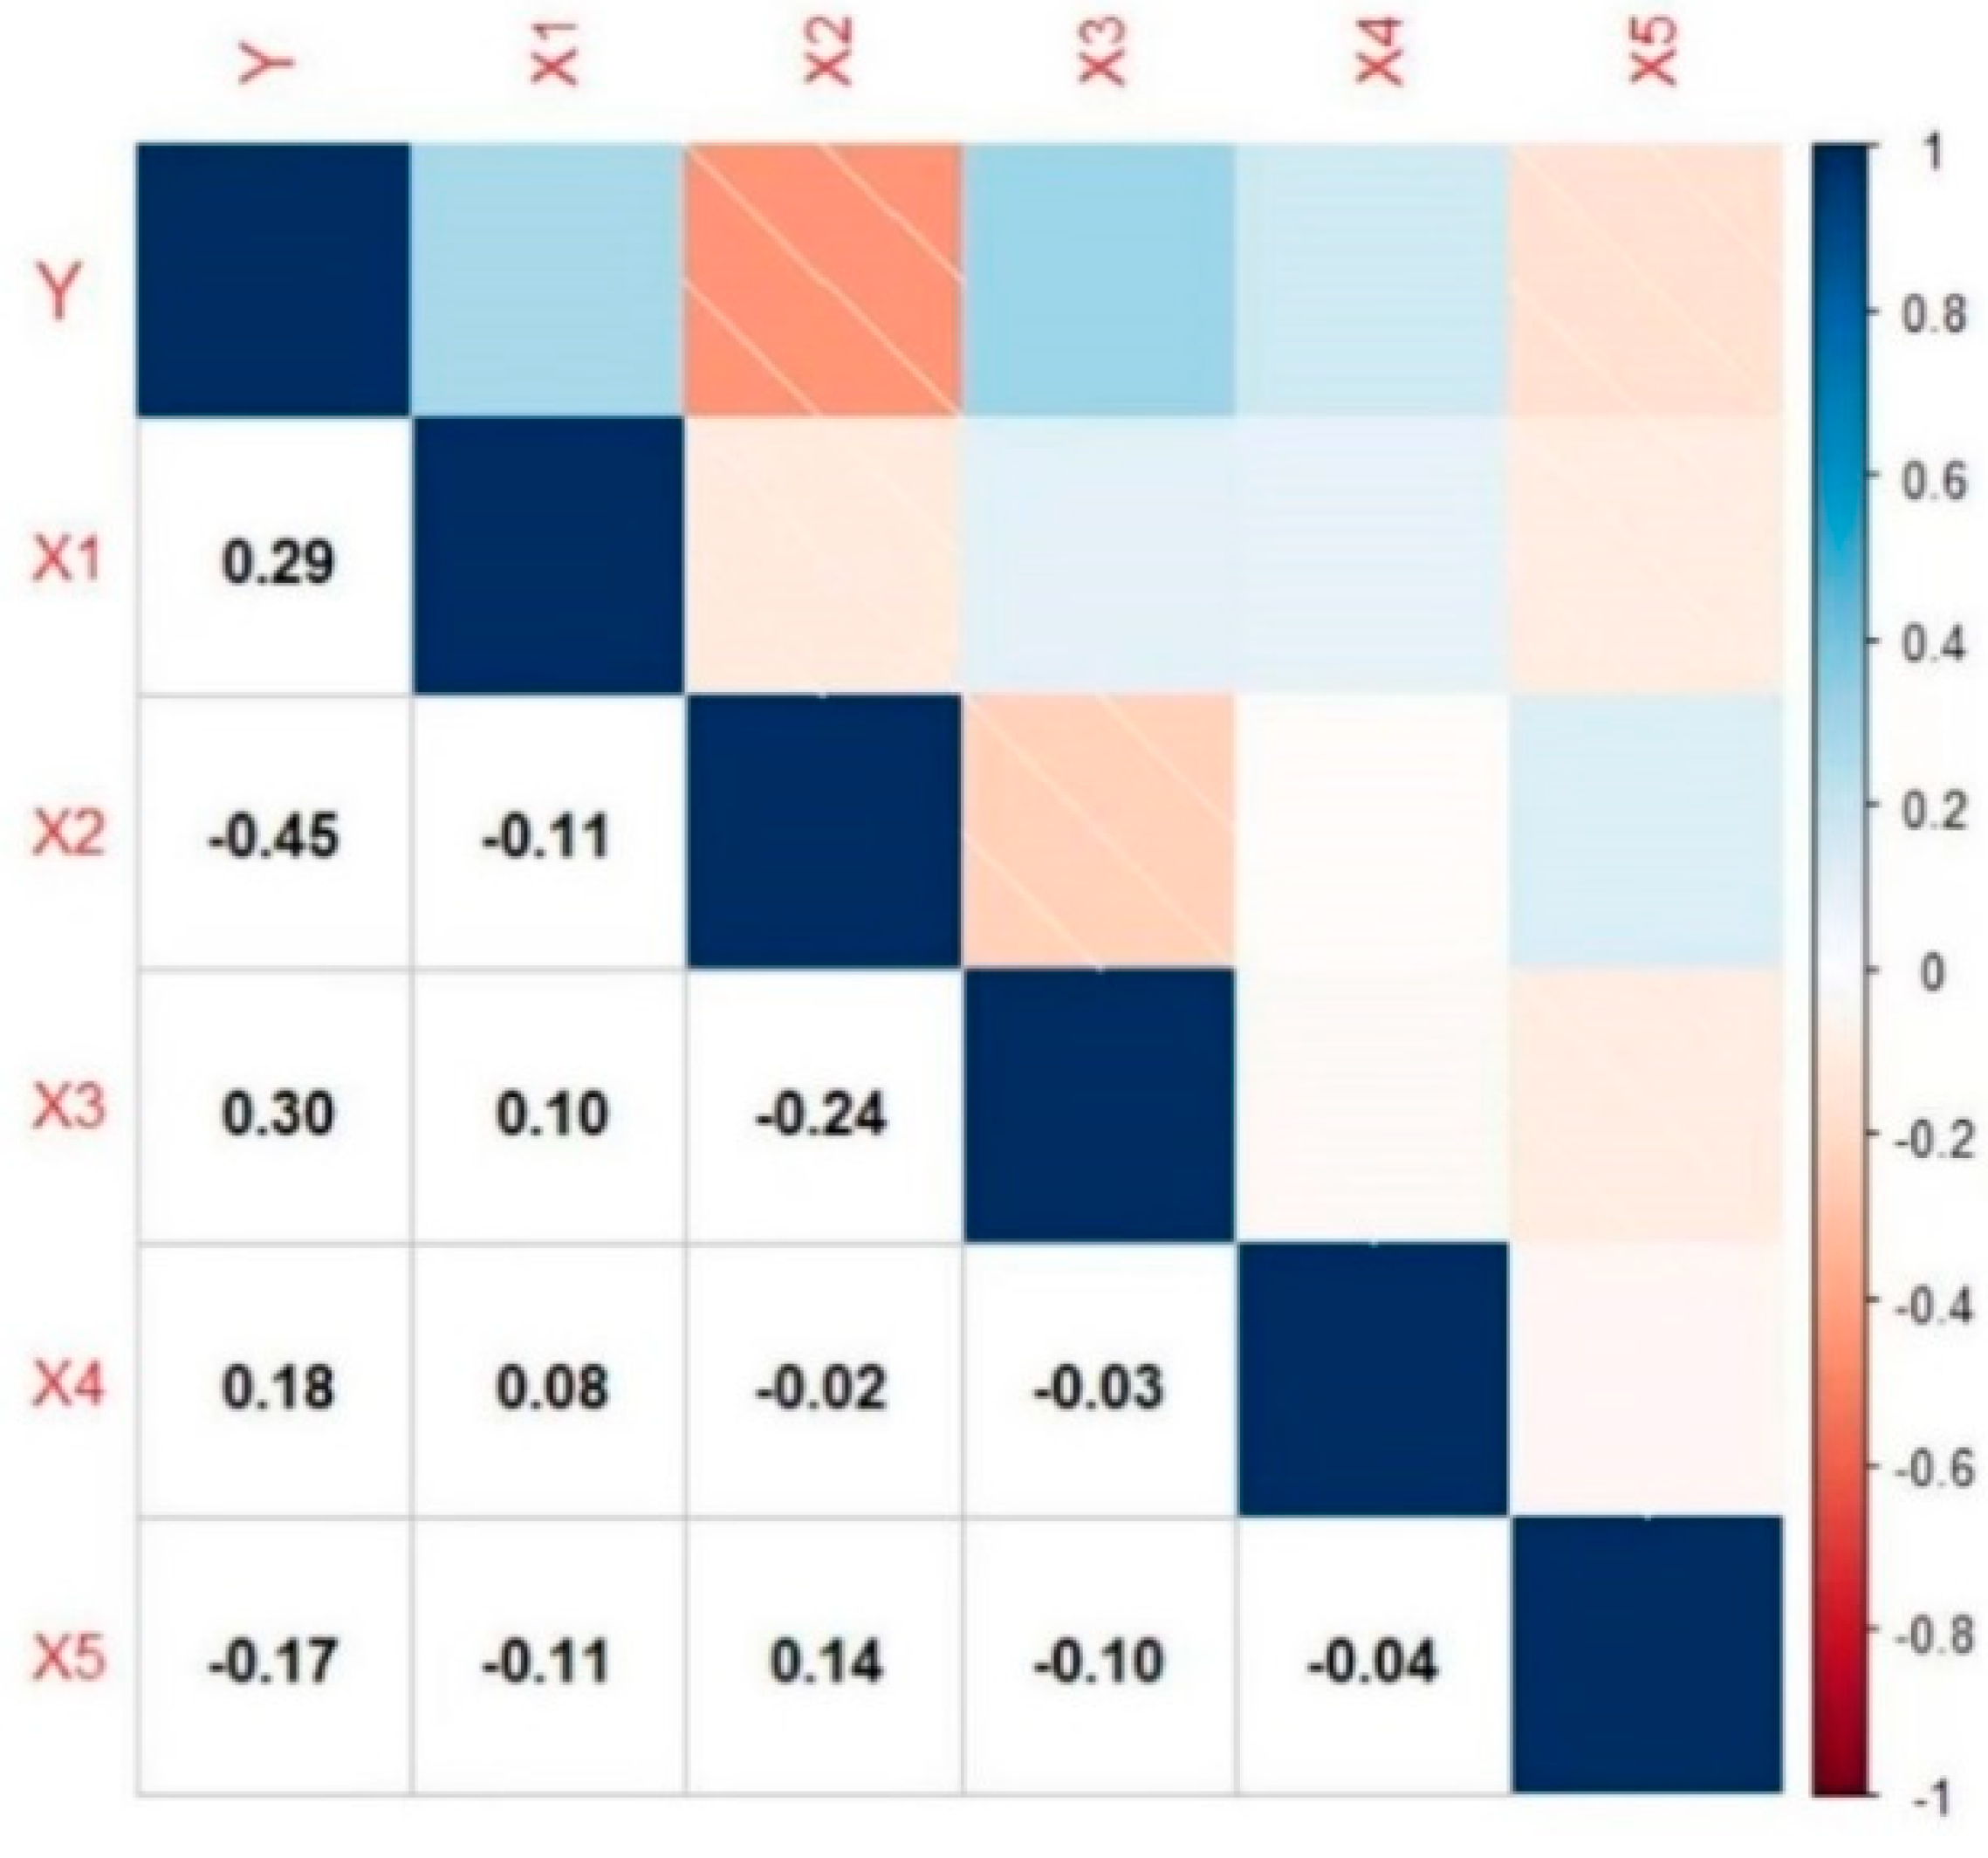
3.3. Controlling Factor Analysis
3.4. Forest Canopy Greenness Recovery after Typhoon Rammasun
4. Discussion
4.1. Comparisons between Different Detection Methods
4.2. Comparisons with Other Studies for Damage from Rammasun
4.3. Factors Controlling Forest Damage Severity and Management Implications
4.4. Vegetation Resilience to Wind Damage and Management Implications
4.5. Uncertainties
5. Conclusions
Author Contributions
Funding
Data Availability Statement
Conflicts of Interest
References
- Yan, J.; Lin, M. Thinking on the disaster caused by super typhoon “Saomai”. J. Fujian Meteorol. 2006, 5, 58–59. [Google Scholar]
- Wang, M.; Xu, H. Remote sensing-based assessment of vegetation damage by a strong typhoon (Meranti) in Xiamen island, China. Nat. Hazards 2018, 93, 1231–1249. [Google Scholar] [CrossRef]
- Gu, X.; Qian, Y.; Zhou, W.; Wu, B.; Wang, X. Study on disaster risk of typhoon Lekima and benefit of corresponding meteorological service. J. Trop. Meteorol. 2022, 38, 35–42. [Google Scholar]
- Zhang, J.; Zhang, M.; Zhang, Y.; Che, J. Disaster assessment of 1409 super typhoon “Rammasun” on rubber plantation in Hainan Island. Adv. Meteorol. Sci. Technol. 2020, 10, 93–95. [Google Scholar]
- Liu, S. Gales-based typhoon disaster assessment modelling for rubber plantations in Hainan, China. Chin. J. Trop. Agric. 2017, 37, 51–55. [Google Scholar]
- Gang, C.; Pan, S.; Tian, H.; Wang, Z.; Xu, R.; Bian, Z.; Pan, N.; Yao, Y.; Shi, H. Satellite observations of forest resilience to hurricanes along the northern gulf of Mexico. For. Ecol. Manag. 2020, 472, 118243. [Google Scholar] [CrossRef]
- Liu, S.; Zhang, J.; He, Z.W. Analysis of the effects on rubber plant by typhoon based on remote sensing and GIS. Guangdong Agric. Sci. 2010, 37, 191–193. [Google Scholar]
- Chambers, J.Q.; Fisher, J.I.; Zeng, H.; Chapman, E.L.; Baker, D.B.; Hurtt, G.C. Hurricane Katrina’s carbon footprint on U.S. Gulf Coast forests. Science 2007, 318, 1107. [Google Scholar] [CrossRef] [Green Version]
- Ramsey, E.; Chappell, D.; Jacobs, D.M.; Sapkota, S.; Baldwin, D. Resource management of forested wetlands: Hurricane impact and recovery mapped by combining Landsat TM and NOAA AVHRR data. Photogramm. Eng. Remote Sens. 1998, 64, 733–738. [Google Scholar]
- Zhang, C.; Durgan, S.D.; Lagomasino, D. Modeling risk of mangroves to tropical cyclones: A case study of Hurricane Irma. Estuar. Coast. Shelf Sci. 2019, 224, 108–116. [Google Scholar] [CrossRef]
- Cohen, W.B.; Yang, Z.; Healey, S.P.; Kennedy, R.E.; Gorelick, N. A LandTrendr multispectral ensemble for forest disturbance detection. Remote Sens. Environ. 2018, 205, 131–140. [Google Scholar] [CrossRef]
- Huang, C.; Goward, S.N.; Masek, J.G.; Thomas, N.; Zhu, Z.; Vogelmann, J.E. An automated approach for reconstructing recent forest disturbance history using dense landsat time series stacks. Remote Sens. Environ. 2010, 114, 183–198. [Google Scholar] [CrossRef]
- Verbesselt, J.; Hyndman, R.; Newnham, G.; Culvenor, D. Detecting trend and seasonal changes in satellite image time series. Remote Sens. Environ. 2010, 114, 106–115. [Google Scholar] [CrossRef]
- Wang, F.; Xu, Y.J. Comparison of remote sensing change detection techniques for assessing hurricane damage to forests. Environ. Monit. Assess. 2010, 162, 311–326. [Google Scholar] [CrossRef]
- Wang, W.; Qu, J.J.; Hao, X.; Liu, Y.; Stanturf, J.A. Post-hurricane forest damage assessment using satellite remote sensing. Agric. For. Meteorol. 2010, 150, 122–132. [Google Scholar] [CrossRef]
- Schultz, M.; Clevers, J.G.P.W.; Carter, S.; Verbesselt, J.; Avitabile, V.; Quang, H.V.; Herold, M. Performance of vegetation indices from landsat time series in deforestation monitorin. Int. J. Appl. Earth Obs. Geoinf. 2016, 52, 318–327. [Google Scholar]
- Charrua, A.B.; Padmanaban, R.; Cabral, P.; Bandeira, S.; Romeiras, M.M. Impacts of the tropical cyclone idai in Mozambique: A multi-temporal Landsat satellite imagery analysis. Remote Sens. 2021, 13, 201. [Google Scholar] [CrossRef]
- De Beurs, K.M.; McThompson, N.S.; Owsley, B.C.; Henebry, G.M. Hurricane damage detection on four major Caribbean islands. Remote Sens. Environ. 2019, 229, 1–13. [Google Scholar] [CrossRef]
- Long, J.; Giri, C.; Primavera, J.; Trivedi, M. Damage and recovery assessment of the philippines’ mangroves following Super Typhoon Haiyan. Mar. Pollut. Bull. 2016, 109, 734–743. [Google Scholar] [CrossRef]
- Rogan, J.; Schneider, L.; Christman, Z.; Millones, M.; Lawrence, D.; Schmook, B. Hurricane disturbance mapping using MODIS EVI data in the southeastern Yucatán, Mexico. Remote Sens. Lett. 2011, 2, 259–267. [Google Scholar] [CrossRef]
- Einzmann, K.; Immitzer, M.; Böck, S.; Bauer, O.; Schmitt, A.; Atzberger, C. Windthrow detection in European forests with very high-resolution optical data. Forests 2017, 8, 21. [Google Scholar] [CrossRef] [Green Version]
- Zhang, X.; Chen, G.; Cai, L.; Jiao, H.; Hua, J.; Luo, X.; Wei, X. Impact assessments of Typhoon Lekima on forest damages in subtropical china using machine learning methods and Landsat 8 OLI imagery. Sustainability 2021, 13, 4893. [Google Scholar] [CrossRef]
- McCarthy, M.J.; Jessen, B.; Barry, M.J.; Figueroa, M.; McIntosh, J.; Murray, T.; Schmid, J.; Muller-Karger, F.E. Mapping hurricane damage: A comparative analysis of satellite monitoring methods. Int. J. Appl. Earth Obs. Geoinf. 2020, 91, 102134. [Google Scholar] [CrossRef]
- Furukawa, F.; Morimoto, J.; Yoshimura, N.; Kaneko, M. Comparison of conventional change detection methodologies using high-resolution imagery to find forest damage caused by typhoons. Remote Sens. 2020, 12, 3242. [Google Scholar] [CrossRef]
- Hamdi, Z.; Brandmeier, M.; Straub, C. Forest damage assessment using deep learning on high resolution remote sensing data. Remote Sens. 2019, 17, 1976. [Google Scholar] [CrossRef] [Green Version]
- Xue, Y.; Yang, Z.; Chen, Y.; Wang, X.; Wu, G.; Huang, G.; Lin, Z. Typhoon ‘Rammasun’ impact on forest ecosystem in Hainan. Trop. For. 2014, 42, 34–38. [Google Scholar]
- Yang, D.; Wang, J.; Chen, H.; Wang, B.; Yuan, X.; Zhang, T. Typhoon damage caused by Rammasun to trees in Haikou and its prevention measures. J. Fujian For. Sci. Technol. 2015, 42, 159–163. [Google Scholar]
- Qiu, M.; Wang, R.; Ding, D.; Mao, J.; Liao, B. Impact of “Rammasun” on mangrove communities in Dongzhaigang, Hainan. Ecol. Sci. 2016, 35, 118–122. [Google Scholar]
- Masek, J.G.; Vermote, E.F.; Saleous, N.E.; Wolfe, R.; Hall, F.G.; Huemmrich, K.F.; Gao, F.; Kutler, J.; Lim, T.K. A Landsat surface reflectance dataset for North America, 1990–2000. IEEE Geosci. Remote Sens. Lett. 2006, 3, 68–72. [Google Scholar] [CrossRef]
- Vermote, E.; Justice, C.; Claverie, M.; Franch, B. Preliminary analysis of the performance of the Landsat 8/OLI land surface reflectance product. Remote Sens. Environ. 2016, 185, 46–56. [Google Scholar] [CrossRef]
- Tassi, A.; Gigante, D.; Modica, G.; Di Martino, L.; Vizzari, M. Pixel- vs. object-based Landsat 8 data classification in Google Earth Engine using Random Forest: The case study of Maiella National Park. Remote Sens. 2021, 13, 2299. [Google Scholar] [CrossRef]
- Abbas, S.; Nichol, J.E.; Fischer, G.A.; Wong, M.S.; Irteza, S.M. Impact assessment of a super-typhoon on Hong Kong’s secondary vegetation and recommendations for restoration of resilience in the forest succession. Agric. For. Meteorol. 2020, 280, 107784. [Google Scholar] [CrossRef]
- Zimmerman, J.K.; Covich, A.P. Damage and recovery of riparian sierra palms after Hurricane Georges: Influence of topography and biotic characteristics. Biotropica 2007, 39, 43–49. [Google Scholar] [CrossRef]
- Xi, W. Synergistic effects of tropical cyclones on forest ecosystems: A global synthesis. J. For. Res. 2015, 26, 1–21. [Google Scholar] [CrossRef]
- Cortés-Ramos, J.; Farfán, L.M.; Herrera-Cervantes, H. Assessment of tropical cyclone damage on dry forests using multispectral remote sensing: The case of Baja California Sur, Mexico. J. Arid Environ. 2020, 178, 104171. [Google Scholar] [CrossRef]
- Rossi, E.; Rogan, J.; Schneider, L. Mapping forest damage in Northern Nicaragua after Hurricane Felix (2007) using MODIS enhanced vegetation index data. GISci. Remote Sens. 2013, 50, 385–399. [Google Scholar] [CrossRef]
- Huete, A.; Didan, K.; Miura, T.; Rodriguez, E.P.; Gao, X.; Ferreira, L.G. Overview of the radiometric and biophysical performance of the MODIS vegetation indices. Remote Sens. Environ. 2002, 83, 195–213. [Google Scholar] [CrossRef]
- Huete, A.R.; Didan, K.; Shimabukuro, Y.E.; Ratana, P.; Saleska, S.R.; Hutyra, L.R.; Yang, W.; Nemani, R.R.; Myneni, R. Amazon rainforests green-up with sunlight in dry season. Geophys. Res. Lett. 2006, 33, L06405. [Google Scholar] [CrossRef] [Green Version]
- Rezatofighi, H.; Tsoi, N.; Gwak, J.; Sadeghian, A.; Reid, I.; Savarese, S. Generalized intersection over union: A metric and a loss for bounding box regression. In Proceedings of the IEEE/CVF Conference on Computer Vision and Pattern Recognition, Long Beach, CA, USA, 15–20 June 2019; pp. 658–666. [Google Scholar]
- Olofsson, P.; Foody, G.; Herold, M.; Stehman, S.V.; Woodcock, C.E.; Wulder, M.A. Good practices for estimating area and assessing accuracy of land change. Remote Sens. Environ. 2014, 148, 42–57. [Google Scholar] [CrossRef]
- Olofsson, P.; Foody, G.M.; Stehman, S.V.; Woodcock, C.E. Making better use of accuracy data in land change studies: Estimating accuracy and area and quantifying uncertainty using stratified estimation. Remote Sens. Environ. 2013, 129, 122–131. [Google Scholar] [CrossRef]
- Feng, Y.; Negrón-Juárez, R.I.; Chambers, J.Q. Remote sensing and statistical analysis of the effects of Hurricane María on the forests of Puerto Rico. Remote Sens. Environ. 2020, 247, 111940. [Google Scholar] [CrossRef]
- Hall, J.; Muscarella, R.; Quebbeman, A.; Arellano, G.; Thompson, J.; Zimmerman, J.K.; Uriarte, M. Hurricane-induced rainfall is a stronger predictor of tropical forest damage in Puerto Rico than maximum wind speeds. Sci. Rep. 2020, 10, 4318. [Google Scholar] [CrossRef] [PubMed]
- Chen, J.; Tao, Z.; Qiu, Y.; Qi, D. Relationship between topography and wind damages to rubber plantation: A wind damage survey of Typhoon Ramasun in hainan in 2014. J. Trop. Biol. 2015, 6, 467–473. [Google Scholar]
- Baldwin, A.; Egnotovich, M.; Ford, M.; Platt, W. Regeneration in fringe mangrove forests damaged by Hurricane Andrew. Plant Ecol. 2001, 157, 151–164. [Google Scholar] [CrossRef]
- Everham, E.M.; Brokaw, N.V. Forest damage and recovery from catastrophic wind. Bot. Rev. 1996, 62, 113–185. [Google Scholar] [CrossRef]
- Lugo, A.E. Visible and invisible effects of hurricanes on forest ecosystems: An international review. Austral Ecol. 2008, 33, 368–398. [Google Scholar] [CrossRef]
- Tanner, E.V.; Rodriguez-Sanchez, F.; Healey, J.R.; Holdaway, R.J.; Bellingham, P.J. Long-term hurricane damage effects on tropical forest tree growth and mortality. Ecology 2014, 95, 2974–2983. [Google Scholar] [CrossRef] [Green Version]
- Sánchez-Rivera, G.; Gómez-Mendoza, L. Tropical cyclone effects on vegetation resilience in the Yucatan Peninsula, México, between 2000–2012. Investig. Geogr. 2021, 77, 203–220. [Google Scholar] [CrossRef]
- Parker, G.; Martínez-Yrízar, A.; Álvarez-Yépiz, J.C.; Maass, M.; Araiza, S. Effects of hurricane disturbance on a tropical dry forest canopy in Western Mexico. For. Ecol. Manag. 2018, 426, 39–52. [Google Scholar] [CrossRef]
- Imbert, D. Hurricane disturbance and forest dynamics in East Caribbean mangroves. Ecosphere 2018, 9, e02231. [Google Scholar] [CrossRef] [Green Version]
- Han, X.; Feng, L.; Hu, C.; Kramer, P. Hurricane-induced changes in the Everglades National Park mangrove forest: Landsat observations between 1985 and 2017. J. Geophys. Res. Biogeosci. 2018, 123, 3470–3488. [Google Scholar] [CrossRef]
- Hirschmugl, M.; Gallaun, H.; Dees, M.; Datta, P.; Deutscher, J.; Koutsias, N.; Schardt, M. Methods for mapping forest disturbance and degradation from optical earth observation data: A review. Curr. For. Rep. 2017, 3, 32–45. [Google Scholar] [CrossRef] [Green Version]


| Methods | Consumer Accuracy (%) | Producer Accuracy (%) | Overall Accuracy (%) | Kappa Coefficient |
|---|---|---|---|---|
| RF | 93 | 95 | 94 | 0.92 |
| NDVI | 91 | 91 | 90 | 0.86 |
| EVI | 90 | 91 | 89 | 0.85 |
| NDII | 87 | 88 | 87 | 0.82 |
| Categories | Overlap | Diff1 | Diff2 | Union | IoU |
|---|---|---|---|---|---|
| RF to NDVI (a *) | 2.95 × 10⁶ | 1.29 × 10⁶ | 6.14 × 10⁴ | 4.30 × 10⁶ | 0.69 |
| RF to NDVI (b) | 2.04 × 10⁷ | 6.14 × 10⁴ | 1.29 × 10⁶ | 2.18 × 10⁷ | 0.94 |
| RF to EVI (a) | 2.97 × 10⁶ | 1.36 × 10⁶ | 7.42 × 10⁵ | 5.08 × 10⁶ | 0.59 |
| RF to EVI (b) | 2.01 × 10⁷ | 7.42 × 10⁵ | 1.36 × 10⁶ | 2.22 × 10⁷ | 0.91 |
| RF to NDII (a) | 3.16 × 10⁶ | 1.38 × 10⁶ | 1.51 × 10⁶ | 6.05 × 10⁶ | 0.52 |
| RF to NDII (b) | 1.93 × 10⁷ | 1.51 × 10⁶ | 1.38 × 10⁶ | 2.22 × 10⁷ | 0.87 |
| Class | 0 | 1 | 2 | 3 | Total | Map Area (105 km2) | Areaadj (105 km2) | ME (95% CI) | UA | PA | OA | |
|---|---|---|---|---|---|---|---|---|---|---|---|---|
| 0 | 111 | 2 | 0 | 0 | 113 | 11.94 | 0.87 | 11.80 | 0.30 | 0.98 | 0.95 | |
| 1 | 6 | 65 | 21 | 7 | 99 | 0.96 | 0.07 | 0.93 | 0.31 | 0.66 | ||
| 2 | 3 | 20 | 95 | 5 | 123 | 0.42 | 0.03 | 0.56 | 0.09 | 0.77 | ||
| 3 | 2 | 5 | 9 | 99 | 115 | 0.37 | 0.03 | 0.40 | 0.06 | 0.86 | ||
| Total | 122 | 92 | 125 | 111 | 450 | 13.69 | 1.0 | 13.69 |
| City/County | Forest Area (km2) | Affected Area (km2) | Fraction (%) | Light (%) | Moderate (%) | Severe (%) |
|---|---|---|---|---|---|---|
| Shenzhen | 770 | 261.48 | 33.96 | 67.26 | 23.27 | 9.48 |
| Yangjiang | 4955 | 294.29 | 5.94 | 49.20 | 27.31 | 23.49 |
| Shaoguan | 10,939 | 1568.17 | 14.34 | 56.72 | 25.09 | 18.18 |
| Zhuhai | 354 | 184.67 | 52.20 | 62.96 | 24.45 | 12.59 |
| Shanwei | 2257 | 368.53 | 16.33 | 52.52 | 24.70 | 22.78 |
| Guangzhou | 2922 | 521.71 | 17.86 | 59.57 | 24.98 | 15.45 |
| Heyuan | 8094 | 999.06 | 12.34 | 51.08 | 27.00 | 21.92 |
| Huizhou | 6137 | 966.30 | 15.74 | 55.50 | 26.31 | 18.20 |
| Jiangmen | 4574 | 789.11 | 17.25 | 61.09 | 23.71 | 15.20 |
| Shantou | 358 | 79.54 | 22.24 | 45.70 | 28.61 | 25.70 |
| Zhongshan | 352 | 130.66 | 37.10 | 65.59 | 21.46 | 12.95 |
| Foshan | 1069 | 283.78 | 26.54 | 74.02 | 18.41 | 7.57 |
| Qingyuan | 13,152 | 1092.32 | 8.31 | 51.24 | 26.34 | 22.42 |
| Zhaoqing | 11,629 | 759.96 | 6.53 | 48.34 | 29.55 | 22.11 |
| Dongguan | 529 | 202.34 | 38.25 | 70.08 | 19.87 | 10.04 |
| Meizhou | 10,418 | 1010.86 | 9.70 | 45.84 | 25.94 | 28.22 |
| Maoming | 7013 | 1332.87 | 19.01 | 39.29 | 33.22 | 27.50 |
| Zhanjiang | 3263 | 1704.28 | 52.24 | 52.29 | 28.14 | 19.58 |
| Chaozhou | 1894 | 161.50 | 8.53 | 50.81 | 24.27 | 24.93 |
| Jieyang | 2196 | 357.43 | 16.27 | 46.13 | 27.86 | 26.01 |
| Yunfu | 5372 | 487.47 | 9.07 | 38.27 | 33.46 | 28.27 |
| Sum | 98,248 | 13,556 | 13.80 | 52.20 | 26.95 | 20.85 |
| City/County | Forest Area (km2) | Affected Area (km2) | Fraction (%) | Light (%) | Moderate (%) | Severe (%) |
|---|---|---|---|---|---|---|
| Wenchang | 1042 | 306.04 | 29.37 | 72.02 | 9.47 | 18.50 |
| Dunchang | 1021 | 145.66 | 14.27 | 66.25 | 9.25 | 24.50 |
| Sanya | 1015 | 67.54 | 6.65 | 58.25 | 23.52 | 18.23 |
| Qiongzhong | 2461 | 124.54 | 5.06 | 61.43 | 19.08 | 19.49 |
| Dingan | 814 | 353.99 | 43.47 | 71.83 | 6.73 | 21.44 |
| Dongfang | 1100 | 82.76 | 7.52 | 48.82 | 34.29 | 16.88 |
| Haikou | 837 | 597.32 | 71.34 | 64.45 | 10.65 | 24.90 |
| Danzhou | 2079 | 545.29 | 26.23 | 74.68 | 10.46 | 14.86 |
| Chengmai | 920 | 371.93 | 40.43 | 59.86 | 13.47 | 26.67 |
| Qionghai | 1222 | 258.89 | 21.18 | 63.63 | 14.29 | 22.08 |
| Changjiang | 926 | 68.13 | 7.36 | 60.61 | 18.81 | 20.58 |
| Lingshui | 579 | 70.99 | 12.26 | 60.02 | 21.59 | 18.39 |
| Baoting | 1932 | 71.39 | 3.69 | 65.78 | 14.62 | 19.59 |
| Lingao | 480 | 381.32 | 79.39 | 57.05 | 16.82 | 26.12 |
| Baisha | 1908 | 181.34 | 9.50 | 67.06 | 13.91 | 19.02 |
| Ledong | 1567 | 100.88 | 6.44 | 62.14 | 19.50 | 18.37 |
| Wanning | 1258 | 185.77 | 14.77 | 54.13 | 27.19 | 18.68 |
| Sum | 21,162 | 3914 | 18.49 | 64.90 | 13.80 | 21.30 |
Publisher’s Note: MDPI stays neutral with regard to jurisdictional claims in published maps and institutional affiliations. |
© 2022 by the authors. Licensee MDPI, Basel, Switzerland. This article is an open access article distributed under the terms and conditions of the Creative Commons Attribution (CC BY) license (https://creativecommons.org/licenses/by/4.0/).
Share and Cite
Zhang, X.; Jiao, H.; Chen, G.; Shen, J.; Huang, Z.; Luo, H. Forest Damage by Super Typhoon Rammasun and Post-Disturbance Recovery Using Landsat Imagery and the Machine-Learning Method. Remote Sens. 2022, 14, 3826. https://doi.org/10.3390/rs14153826
Zhang X, Jiao H, Chen G, Shen J, Huang Z, Luo H. Forest Damage by Super Typhoon Rammasun and Post-Disturbance Recovery Using Landsat Imagery and the Machine-Learning Method. Remote Sensing. 2022; 14(15):3826. https://doi.org/10.3390/rs14153826
Chicago/Turabian StyleZhang, Xu, Hongbo Jiao, Guangsheng Chen, Jianing Shen, Zihao Huang, and Haiyan Luo. 2022. "Forest Damage by Super Typhoon Rammasun and Post-Disturbance Recovery Using Landsat Imagery and the Machine-Learning Method" Remote Sensing 14, no. 15: 3826. https://doi.org/10.3390/rs14153826