Article

Monitoring Land Subsidence Using PS-InSAR Technique in Rawalpindi and Islamabad, Pakistan

1
Faculty of Engineering, China University of Geosciences (Wuhan), Wuhan 430074, China
2
School of Geography and Information Engineering, China University of Geosciences (Wuhan), Wuhan 430074, China
3
National Center of Excellence in Geology, University of Peshawar, Peshawar 25130, Pakistan
*
Author to whom correspondence should be addressed.
Remote Sens. 2022, 14(15), 3722; https://doi.org/10.3390/rs14153722
Submission received: 12 June 2022 / Revised: 25 July 2022 / Accepted: 28 July 2022 / Published: 3 August 2022

Abstract

:
Land subsidence is a major concern in vastly growing metropolitans worldwide. The most serious risks in this scenario are linked to groundwater extraction and urban development. Pakistan’s fourth-largest city, Rawalpindi, and its twin Islamabad, located at the northern edge of the Potwar Plateau, are witnessing extensive urban expansion. Groundwater (tube-wells) is residents’ primary daily water supply in these metropolitan areas. Unnecessarily pumping and the local inhabitant’s excessive demand for groundwater disturb the sub-surface’s viability. The Persistent Scatterer Interferometry Synthetic Aperture Radar (PS-InSAR) approach, along with Sentinel-1 Synthetic Aperture Radar (SAR) imagery, were used to track land subsidence in Rawalpindi-Islamabad. The SARPROZ application was used to study a set of Sentinel-1 imagery obtained from January 2019 to June 2021 along descending and ascending orbits to estimate ground subsidence in the Rawalpindi-Islamabad area. The results show a significant increase (−25 to −30 mm/yr) in subsidence from −69 mm/yr in 2019 to −98 mm/yr in 2020. The suggested approach effectively maps, detects, and monitors subsidence-prone terrains and will enable better planning, surface infrastructure building designs, and risk management related to subsidence.

1. Introduction

Ground deformation is described as a sudden sinking or gradual settling of the ground surface [1,2,3]. It is a major concern of the authorities responsible for handling global geohazard threats [4]. Urban subsidence can result from natural and human causes, for instance, excessive groundwater extraction [5], structural loads [6,7], seismic activity [7,8], subsurface architecture, and mining [9,10]. Each of these factors may have a distinct influence on ground subsidence. Globally, people are moving from rural to urban regions to seek greater job opportunities and contemporary conveniences. These unregulated and unplanned regional developments impact natural resources. The daily demand for water consumption is increasing, resulting in unsustainable groundwater removal, and causing ground subsidence [11,12,13,14]. Therefore, monitoring the spatial and temporal distribution of ground subsidence is becoming an important concern. Traditional point-based tracking approaches, such as GPS and ground levelling approaches, were unable to deliver the necessary samples for land subsidence mapping [15]. Rather than relying on ground-based observations, researchers are shifting toward space-based observations, which benefit from collecting more data in a shorter period of time at a lower cost and are not affected by weather conditions.
Remote Sensing (RS) technology, such as Synthetic Aperture Radar Interferometry (InSAR) has shown substantial capability in a variety of disciplines over the last two decades, in particular landslide analysis [16], subsidence influenced by over-extraction of groundwater [17], measuring deformation caused by an earthquake [18], and the management of urban growth. This method was successfully employed with significant accuracy and effectiveness, covering hundreds to thousands of square kilometers [19]. The principle of InSAR is the acquisition of SAR images of the targeted region to obtain ground surface information and its patterns of deformation. SAR Interferometry can be employed for a variety of land-based applications. Information is extracted from the signals transmitted by the SAR system to the surface, and is scattered back from various objects on the surface. The phase (distance between a satellite antenna and target object) and amplitude (determined from surface roughness, terrain slopes, etc.) of reflected signals are used to calculate information about various objects on the surface [16,20]. Several advanced techniques, such as the Small Baselines Subset Approach (SBAS) [21], Parallel Small Baseline Subset (P-SBAS) [22], Spatio Temporal Unwrapping Network [23], Persistent Scatterers Interferometric Synthetic Aperture Radar (PS-InSAR) [24], and the Interferometric Point Target Analysis [25], have recently been established.
In previous studies, Differential Interferometry Synthetic Aperture Radar (D-InSAR) has been employed successfully to detect regional-scale ground subsidence with a cm to mm precision [10,19,26]. This technology has been frequently employed in measuring seismic deformation due to its all-weather capabilities of receiving deformation details [18,27], monitoring and detecting landslides [28,29], and quantifying and mapping metropolitan surface subsidence [30]. InSAR approaches have been regarded as efficient techniques for monitoring and predicting catastrophes [31]. Nevertheless, D-InSAR is vulnerable to environmental delay as well as spatial and temporal decorrelation, limiting its capability for long-term period surface detection with high accuracy.
The PS-InSAR technology has now been launched to resolve the disadvantages of the D-InSAR approach [24]. A multi-image framework can be utilized to generate a feasible deformation map based on the spatial-temporal development of so-called Persistent Scatterers (PS) [24]. The PS-InSAR technique uses unique characteristics of anomalies caused by atmospheric delay and backscattering of certain PS on the surface to improve conventional InSAR deformation analysis accuracy. Therefore, PS-InSAR can modify and improve the measurement of deformations, from 10–20 to 2–3 mm [24]. PS-InSAR has a wide range of applications in monitoring geohazards, such as mapping displacements induced by seismic activities, landslides, volcanic swelling, ground subsidence caused by groundwater extraction, underground mining activities, and subway tunnel construction [9,32,33]. Similar research has been widely conducted in urban areas using the PS-InSAR technique to monitor ground subsidence using Sentinel-1 data in Algeria [34], Beijing [7,35], London [36], Los Angeles [37], Mashhad (Iran) [38], coastal areas of Africa [39], Spain [40], etc.
Rawalpindi is a historic and Pakistan’s fourth-largest metropolitan city and a center of industrial, commercial activity, and military headquarters. Its twin city Islamabad is the national capital and the administrative center for all government agencies [41]. Rawalpindi and Islamabad’s population has grown significantly due to immense migration from the countryside to metropolitan regions. Water crises in the study region may be more common in the future due to significant urbanization and heavy construction [42]. The demand for natural resources has grown due to the fast population growth, adversely affecting the environment [41]. There are several serious environmental concerns in the Rawalpindi-Islamabad area, such as the risk of building foundation, subsidence due to loess instability, extraction of the enhanced quantity of groundwater, extensive contamination of surface water and groundwater by improperly disposing of solid and fluid waste, effects of limestone, sand, gravel, clay, mining, and earthquake hazards [41].
For this approach, Sentinel-1 radar data from the Alaska Satellite Facility (ASF) were used. Various investigations have been performed in which the PS-InSAR approach was used in conjunction with Sentinel-1 data to monitor land surface deformations. Crosetto et al. [43] were among the first to use Sentinel-1 data using the PS-InSAR approach. Although the study time was relatively shorter, from October 2014 to April 2015, they produced encouraging findings. Recent research has been carried out by some researchers, such as Del Soldato et al. [44] and Roccheggiani et al. [45]. Initially, three hundred Sentinel-1 photographs were employed in three trials over 2 to 3 years of study to examine the pace of subsidence in a region of central Italy. Afterwards, around 320 photographs were used throughout a three-year research period to examine land subsidence caused by subsurface mining. Aside from monitoring the earth’s surface, Sentinel-1 imagery can also be employed in PS-InSAR studies for other purposes, such as estimating the deformation of major foundations such as dams and bridges [46,47,48].
This research investigates the ground subsidence of the twin-cities area using Sentinal-1 radar imagery from 7 January 2019 to 25 June 2021 and from 8 January 2019 to 21 May 2021 with ascending and descending tracks, respectively, using the SARPROZ software. As per our knowledge, there have been no previous studies on land subsidence in the Rawalpindi-Islamabad area using the advanced PS-InSAR technique.
Therefore, the primary objective of this investigation is to create a deformation map of the Rawalpindi-Islamabad area to comprehend the continuing various deformations and to identify hazard zones with a comparatively greater subsidence rate. In addition, this research investigates the capability of PS-InSAR to analyze land subsidence in a metropolitan area. The findings will enable more effective planning, surface infrastructure building, and risk management related to subsidence in the research area.

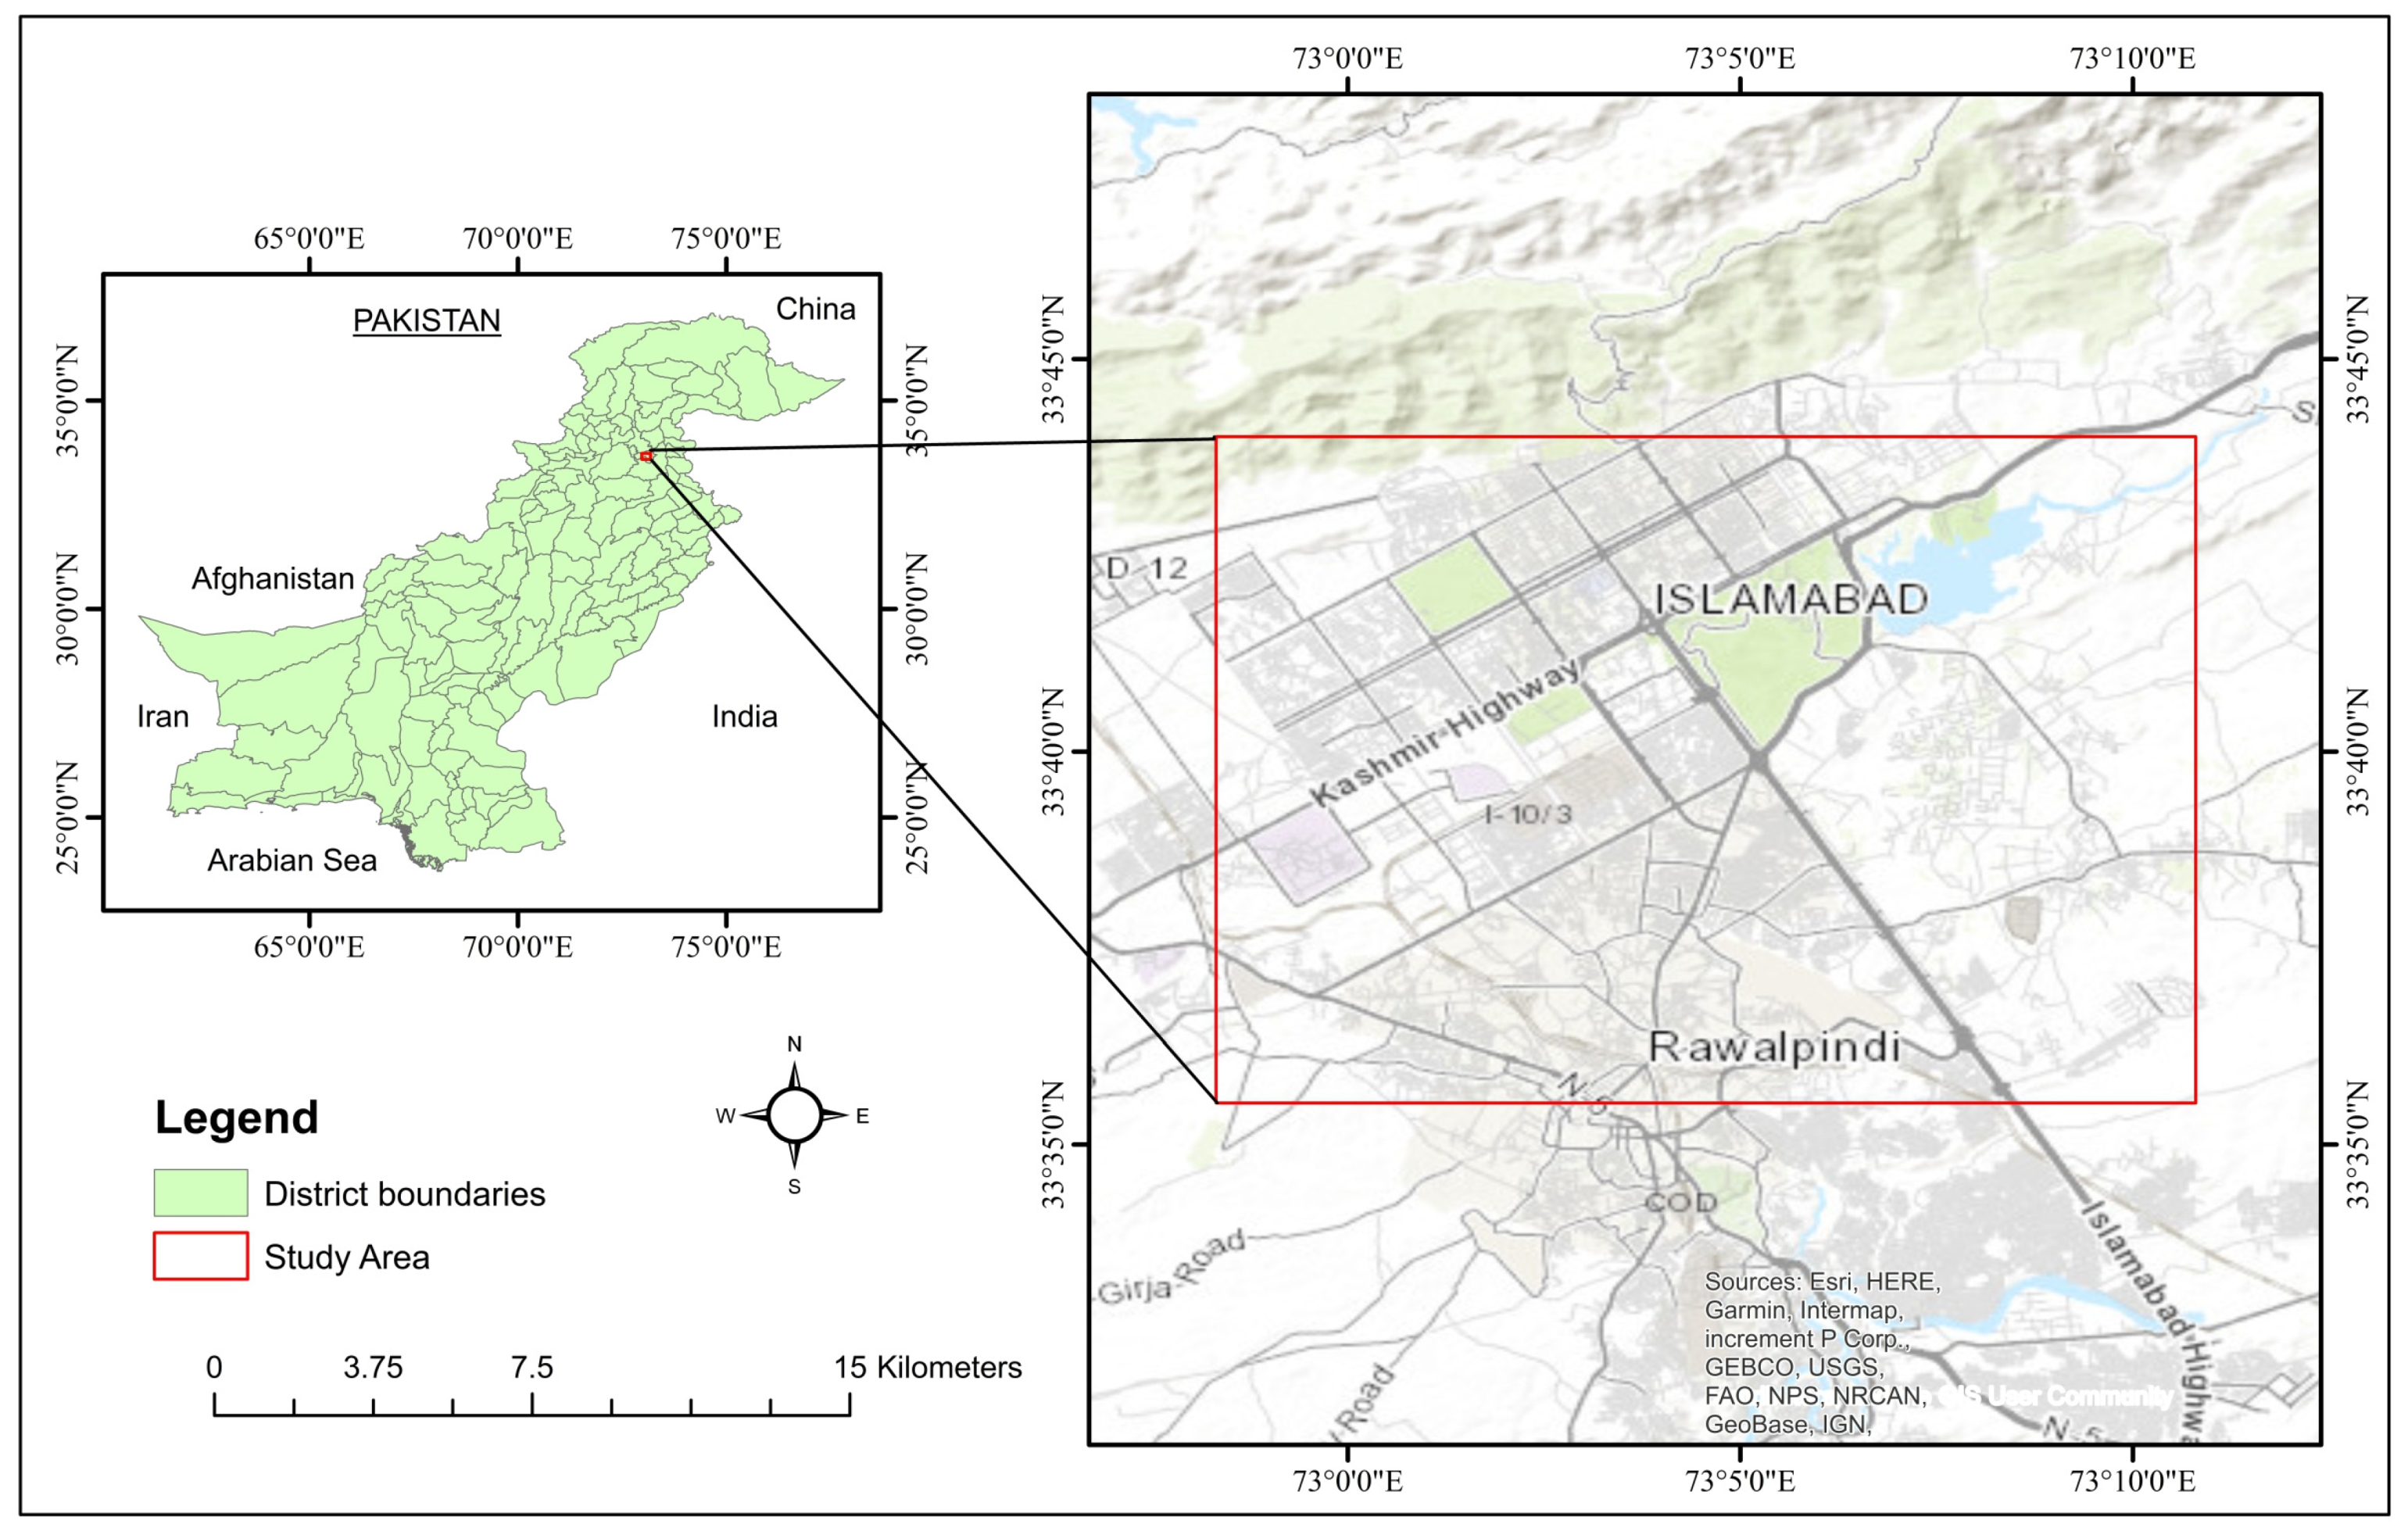
2. Description of the Research Area

2.1. Geographical Position of the Research Area

The research area is located between the longitudes of 72°58′ and 73°11′E and the latitudes of 33°35′ and 33°44′N (Figure 1 and Figure 2). The twin cities located at the northern edge of the Potwar Plateau are overlain by Main Boundary Thrust (MBT), creating multiple faults, namely Murree Thrust, Jhelum Fault, and Rawat Fault [49]. The geography of the Rawalpindi-Islamabad region includes mountains and plains that rise over 1175 m [41]. The area is climatically described as a semi-arid to subtropical continental zone with substantial seasonal variations, with temperatures ranging from 0 to 48 °C [50]. In Rawalpindi, the average annual rainfall is 1000 mm (39.3 in), and Islamabad’s average annual rainfall is 1012 mm (39.8 in) [50].

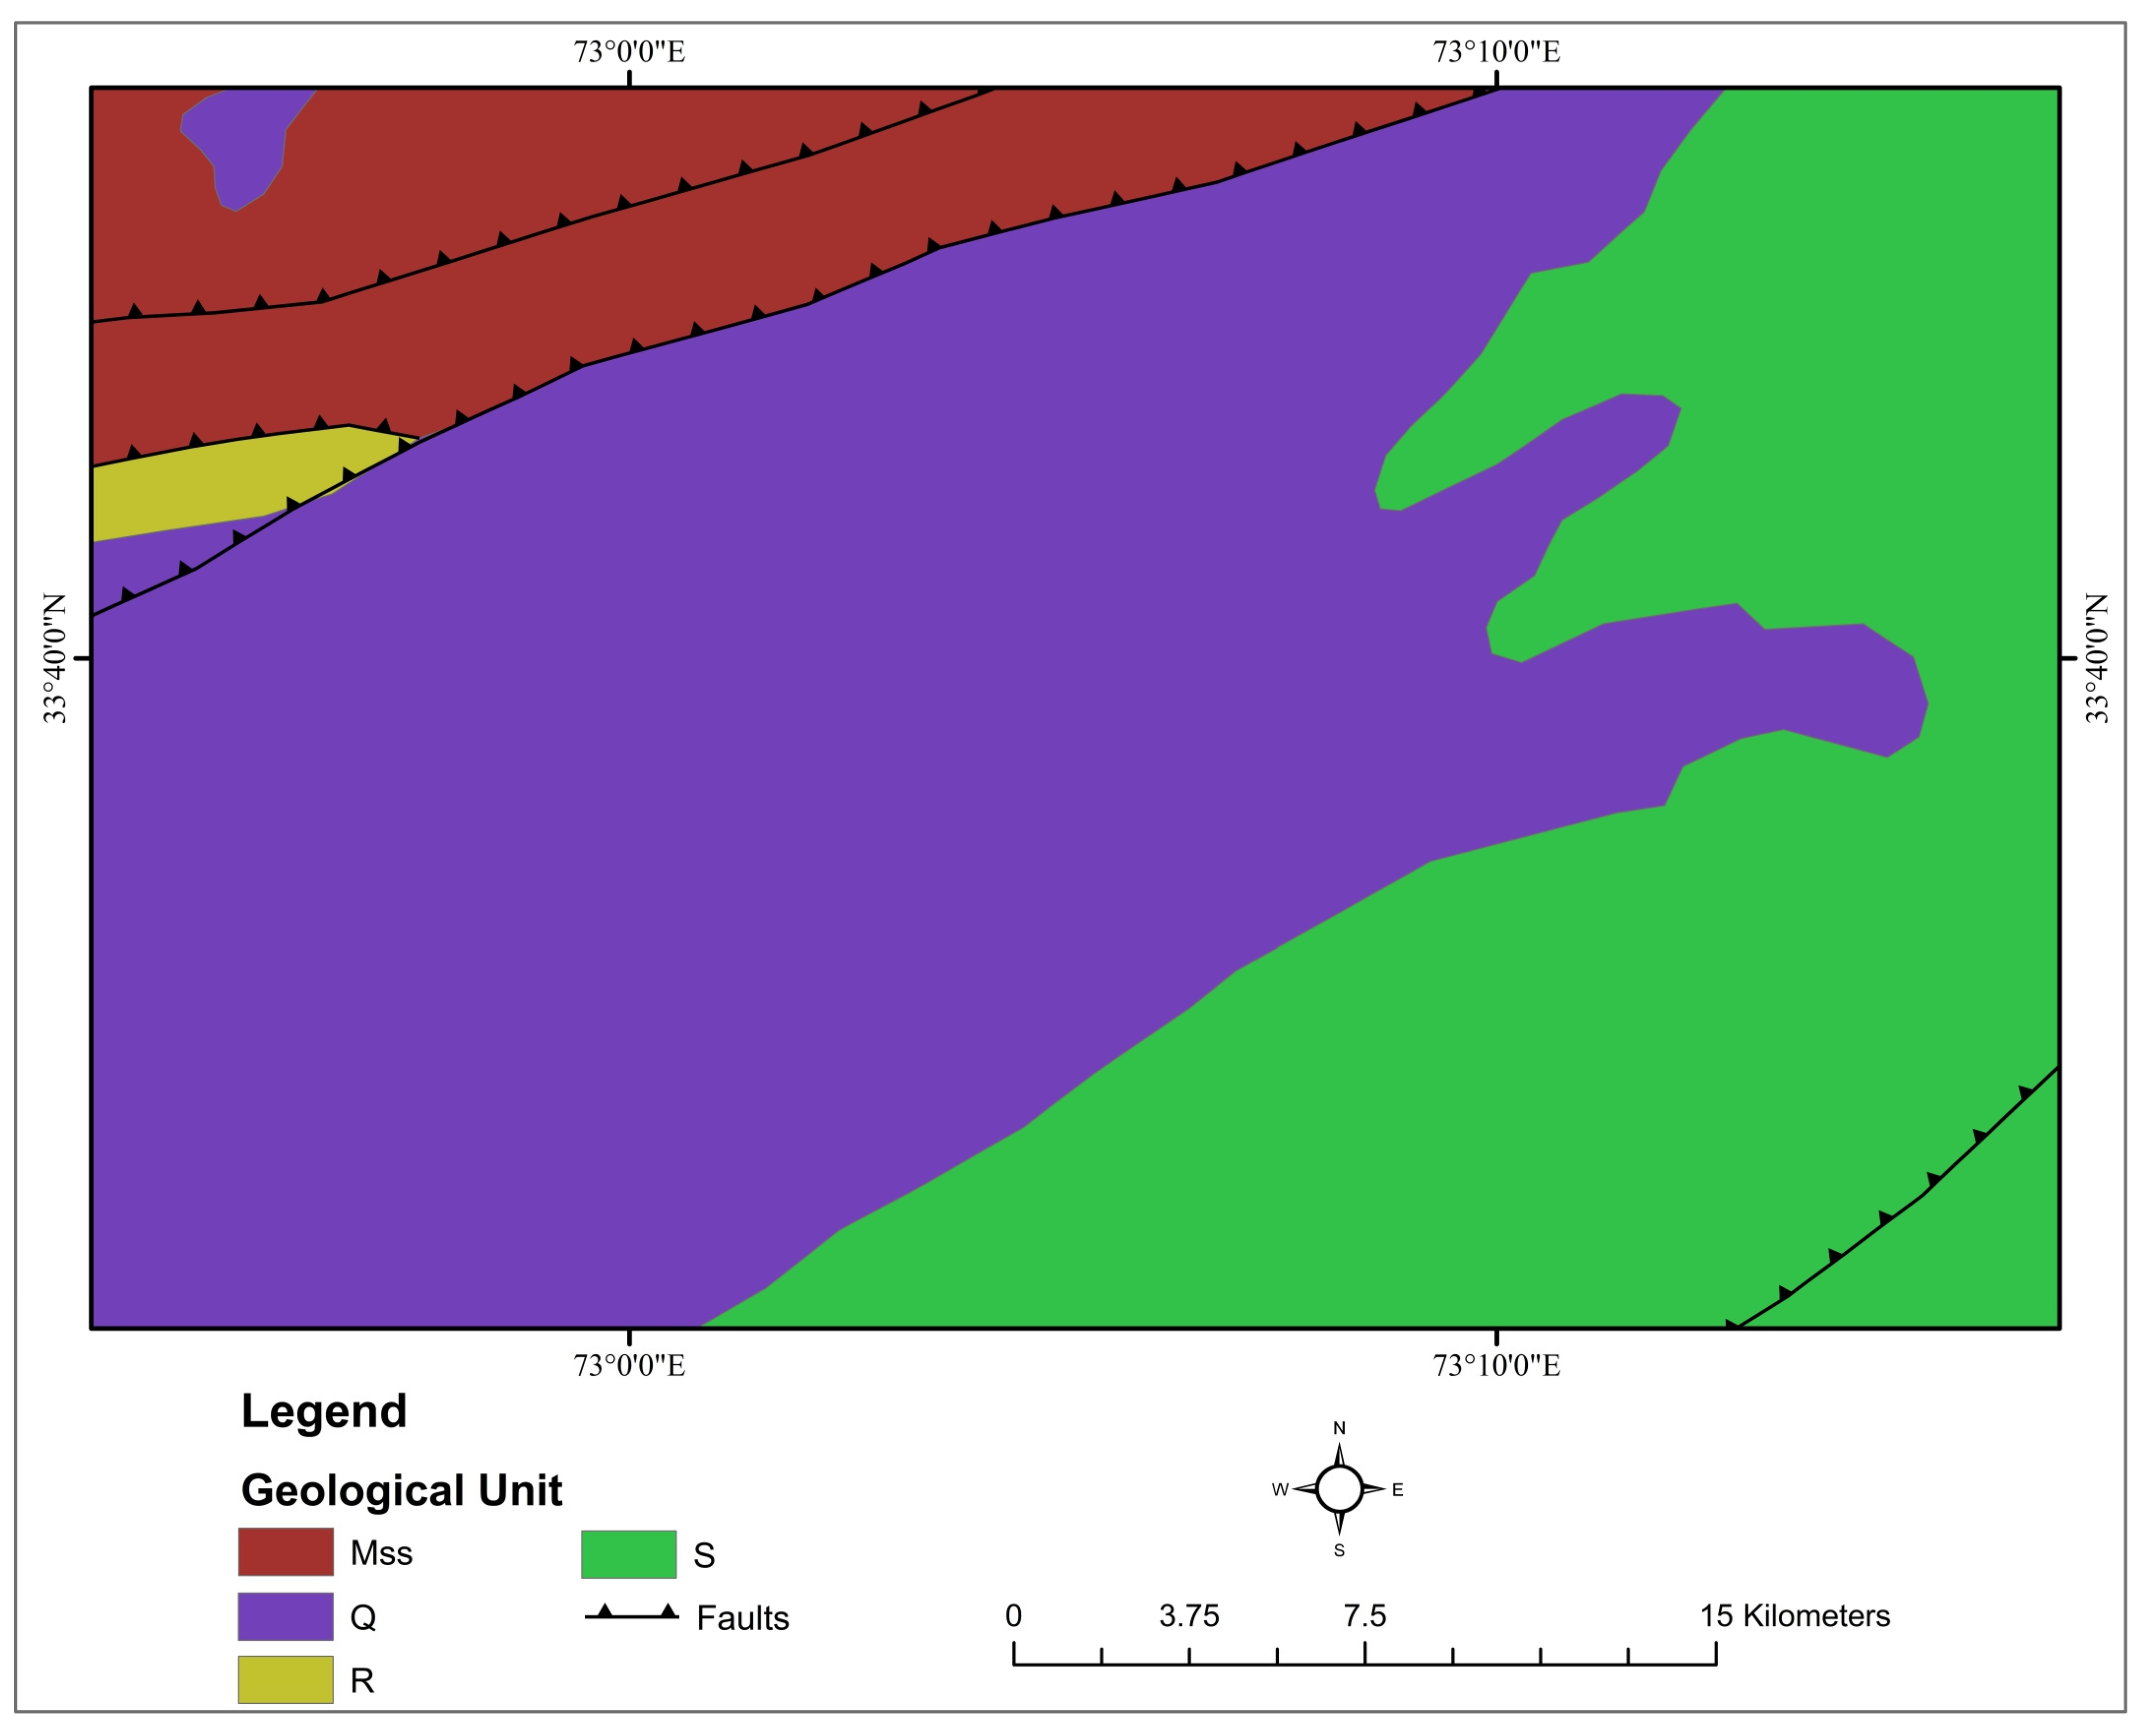
2.2. Geological Setting and Background of the Research Area

Geologically, the Rawalpindi-Islamabad area is a segment of the Sub-Himalayas [51], which in Pakistan is determined by the Potwar Plateau and the Salt Ranges [52]. As the section of the Himalayan belt and located at the northern edges of the Potwar Plateau, the research area underlies extensive Himalayan fold and fault structures [53].
The study area is covered by sedimentary rocks, including Mesozoic sedimentary rocks, Rawalpindi group, Siwalik group, and the Quaternary alluvium deposits [54]. Figure 3 depicts a geological map of the study area.

2.2.1. Mesozoic Sedimentary Rocks

The sequence of Mesozoic sedimentary rocks consists of Triassic marl, dolomite, and limestone of the Mianwali formation. Jurassic sandstone, quartzite, shale, and marl of the Datta formation are also present in the Mesozoic sedimentary rocks.

2.2.2. Rawalpindi Group

Murree and Kamlial formations make up the Rawalpindi group.

Murree Formation

The age of the Murree formation is lower Miocene. Rock consists of continental claystone and sandstone. Sandstone is reddish-grey, medium-grained, and claystone is purple to dark red. The thickness of Murree formation in the research region ranges from 2000 to 2895 m.

Kamlial Formation

The age of the Kamlial formation is middle to late Miocene. The rock units consist of claystone and sandstone. Sandstone is grey, purple, and coarse-grained. Interbeds of hard purple claystone are present in the research region. Kamlial formation thickness in the study area ranges from 1200 to 1600 m.

2.2.3. Siwalik Group

The Siwalik group consists of conglomerate, sandstone, siltstone, and mudstone; sym-orogenic, predominantly fluvial. Additionally, Siwaliks include Nagri, Dhok Pathan, Soan formation, and Lei conglomerates.

Nagri Formation

Upper Miocene/lower Pliocene is the age of the Nagri formation. It consists of subordinate claystone and sandstone with less amount of conglomerates. Sandstone is medium to coarse-grained and grey in color. Claystone is brown in color and consists of silt and sand. The measured thickness of the Nagri formation ranges from 500 to 900 m in the research region.

Dhok Pathan Formation

The age of Dhok Pathan formation ranges from early to middle Pliocene. It mostly consists of claystone and sandstone containing lenses of conglomerate in some parts. The measured thickness in the study area ranges from 500 to 825 m.

Soan Formation

The age of the Soan formation is from lower Pleistocene to Pliocene. It consists of subordinate claystone, siltstone, sandstone, and conglomerate interbeds. The exposed thickness of the Soan formation ranges from 200 to 300 m.

Lei Conglomerates

Lei conglomerates comprise 93% subangular limestone clasts intercalated with weakly consolidated clay, silt, and sand. The 5% clasts from Siwalik group sedimentary rocks consist of the Lei conglomerates, 2% quartzite, and a trace amount of igneous rocks.

2.2.4. Quaternary Alluvium

The quaternary alluvium in the research area consists of unconsolidated conglomerate, sandstone, siltstone, and loess deposits.

3. Dataset and Methodology
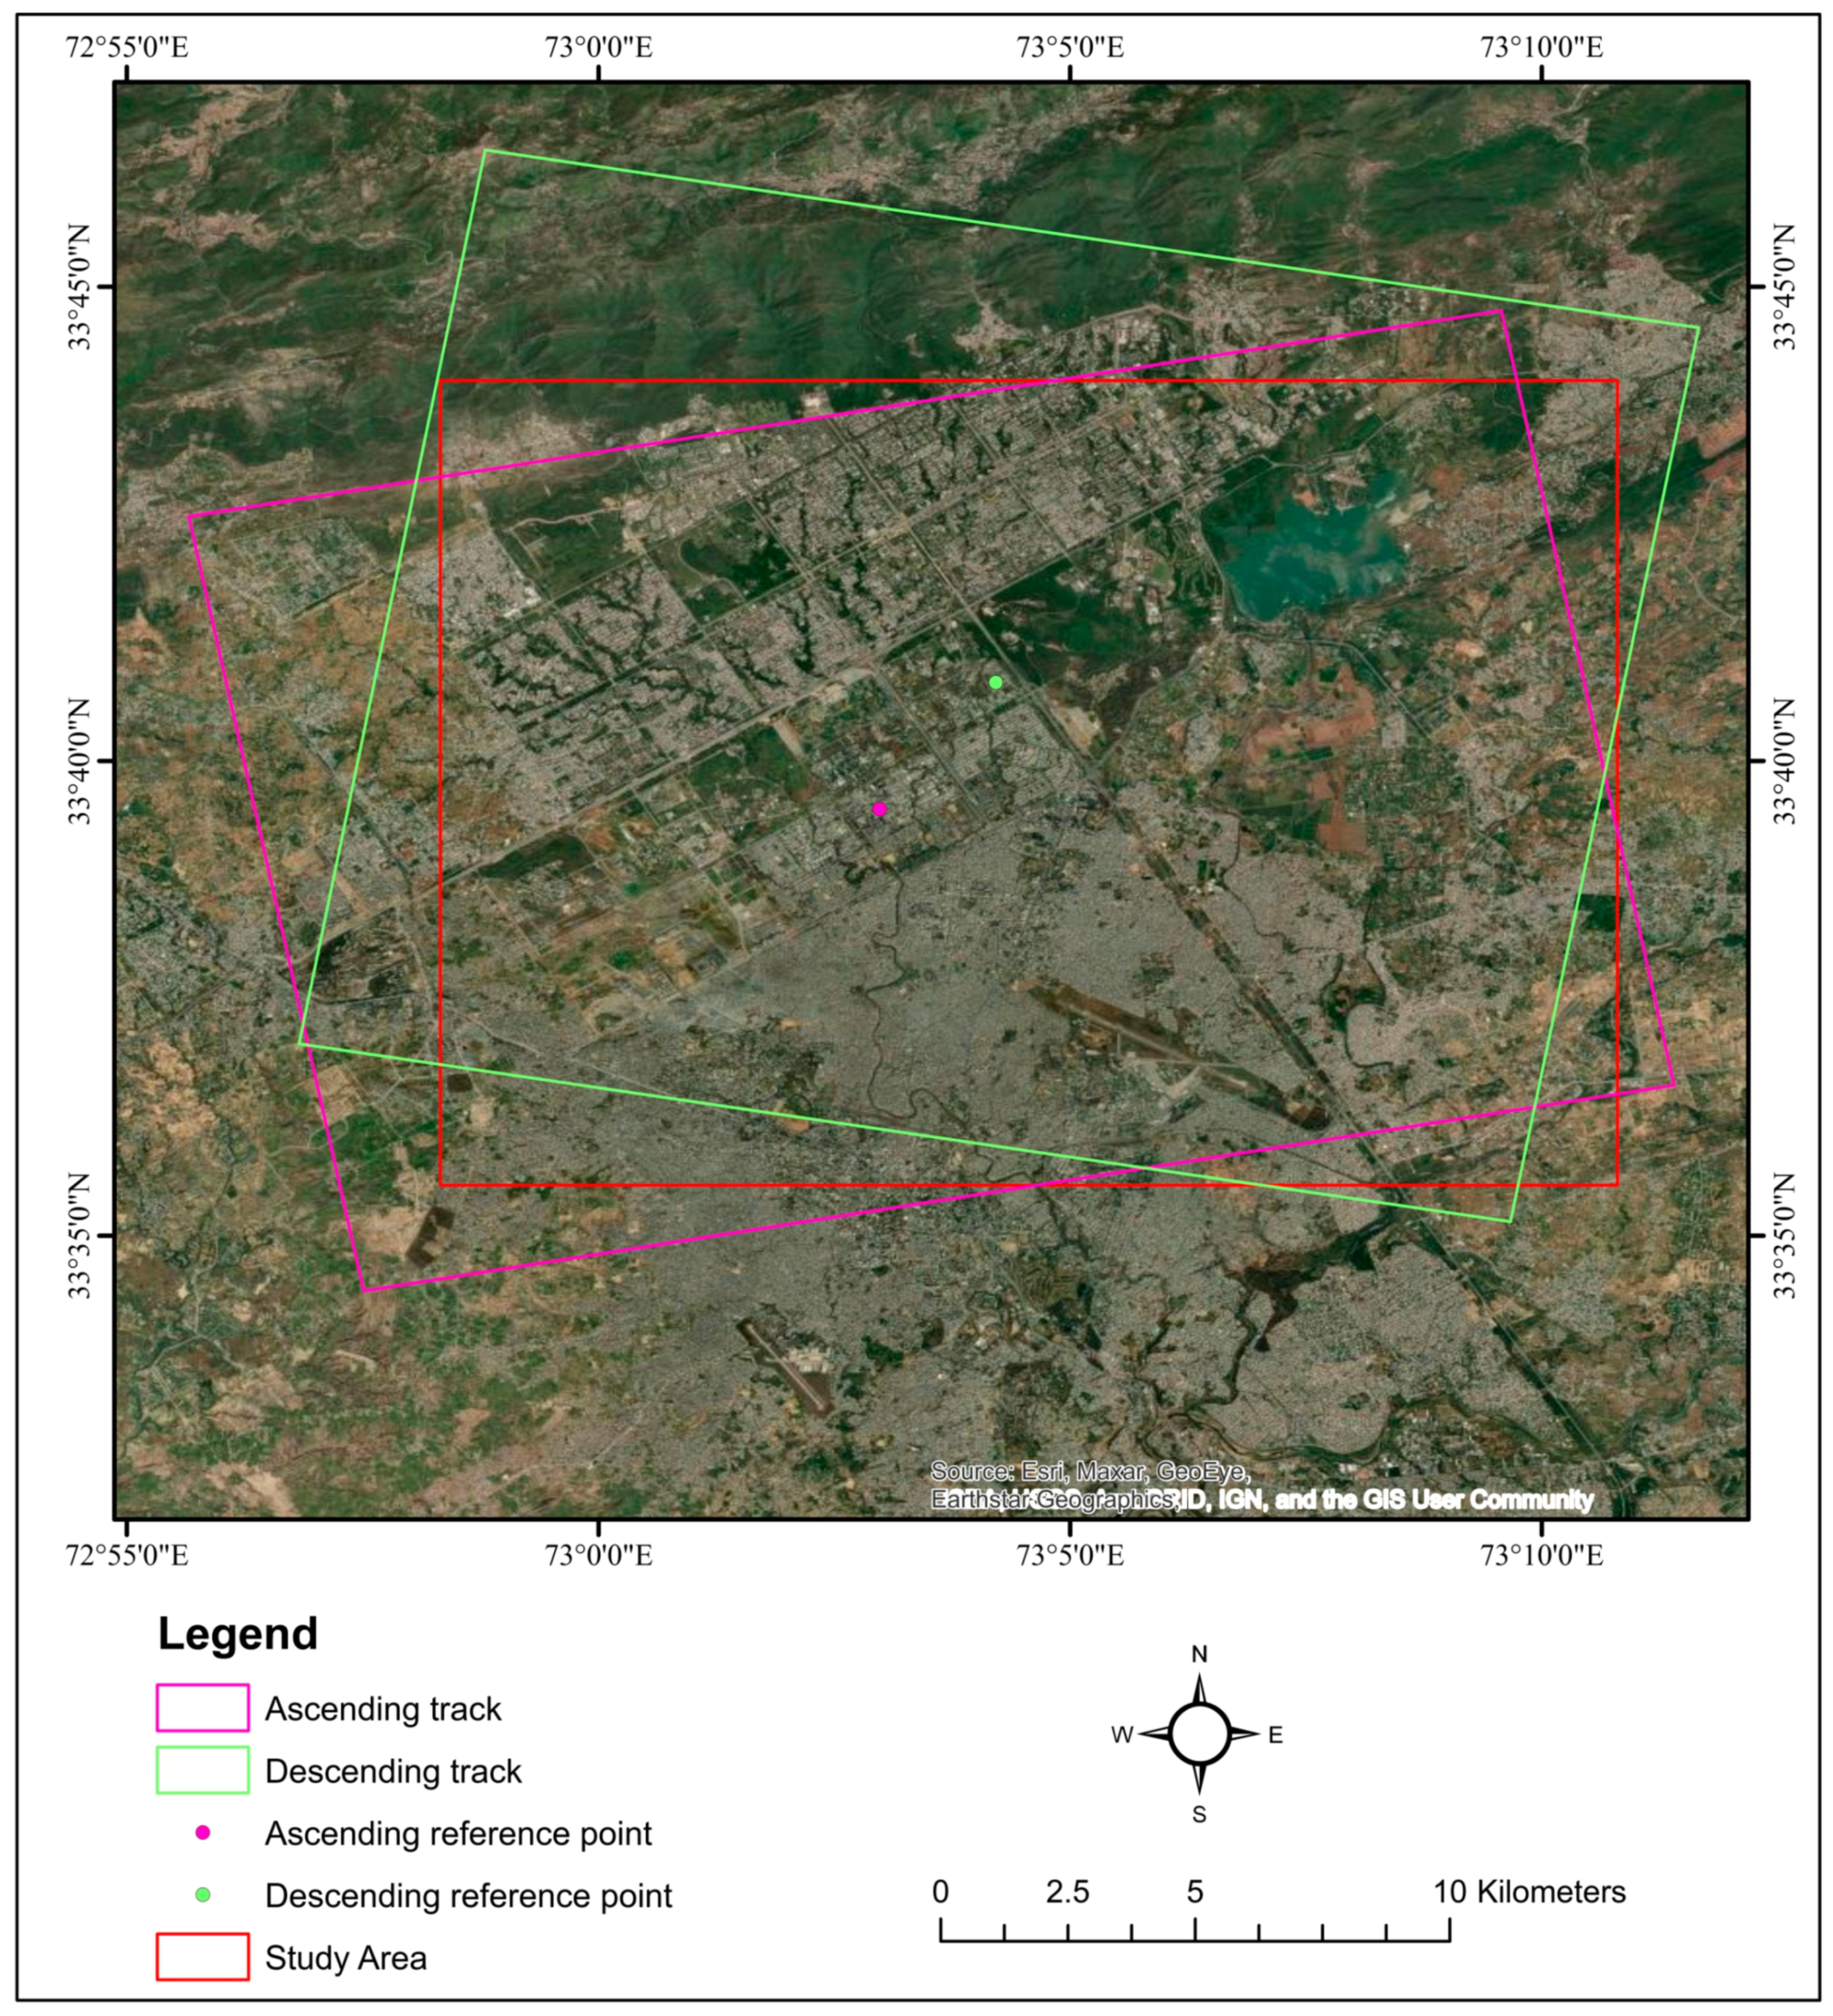
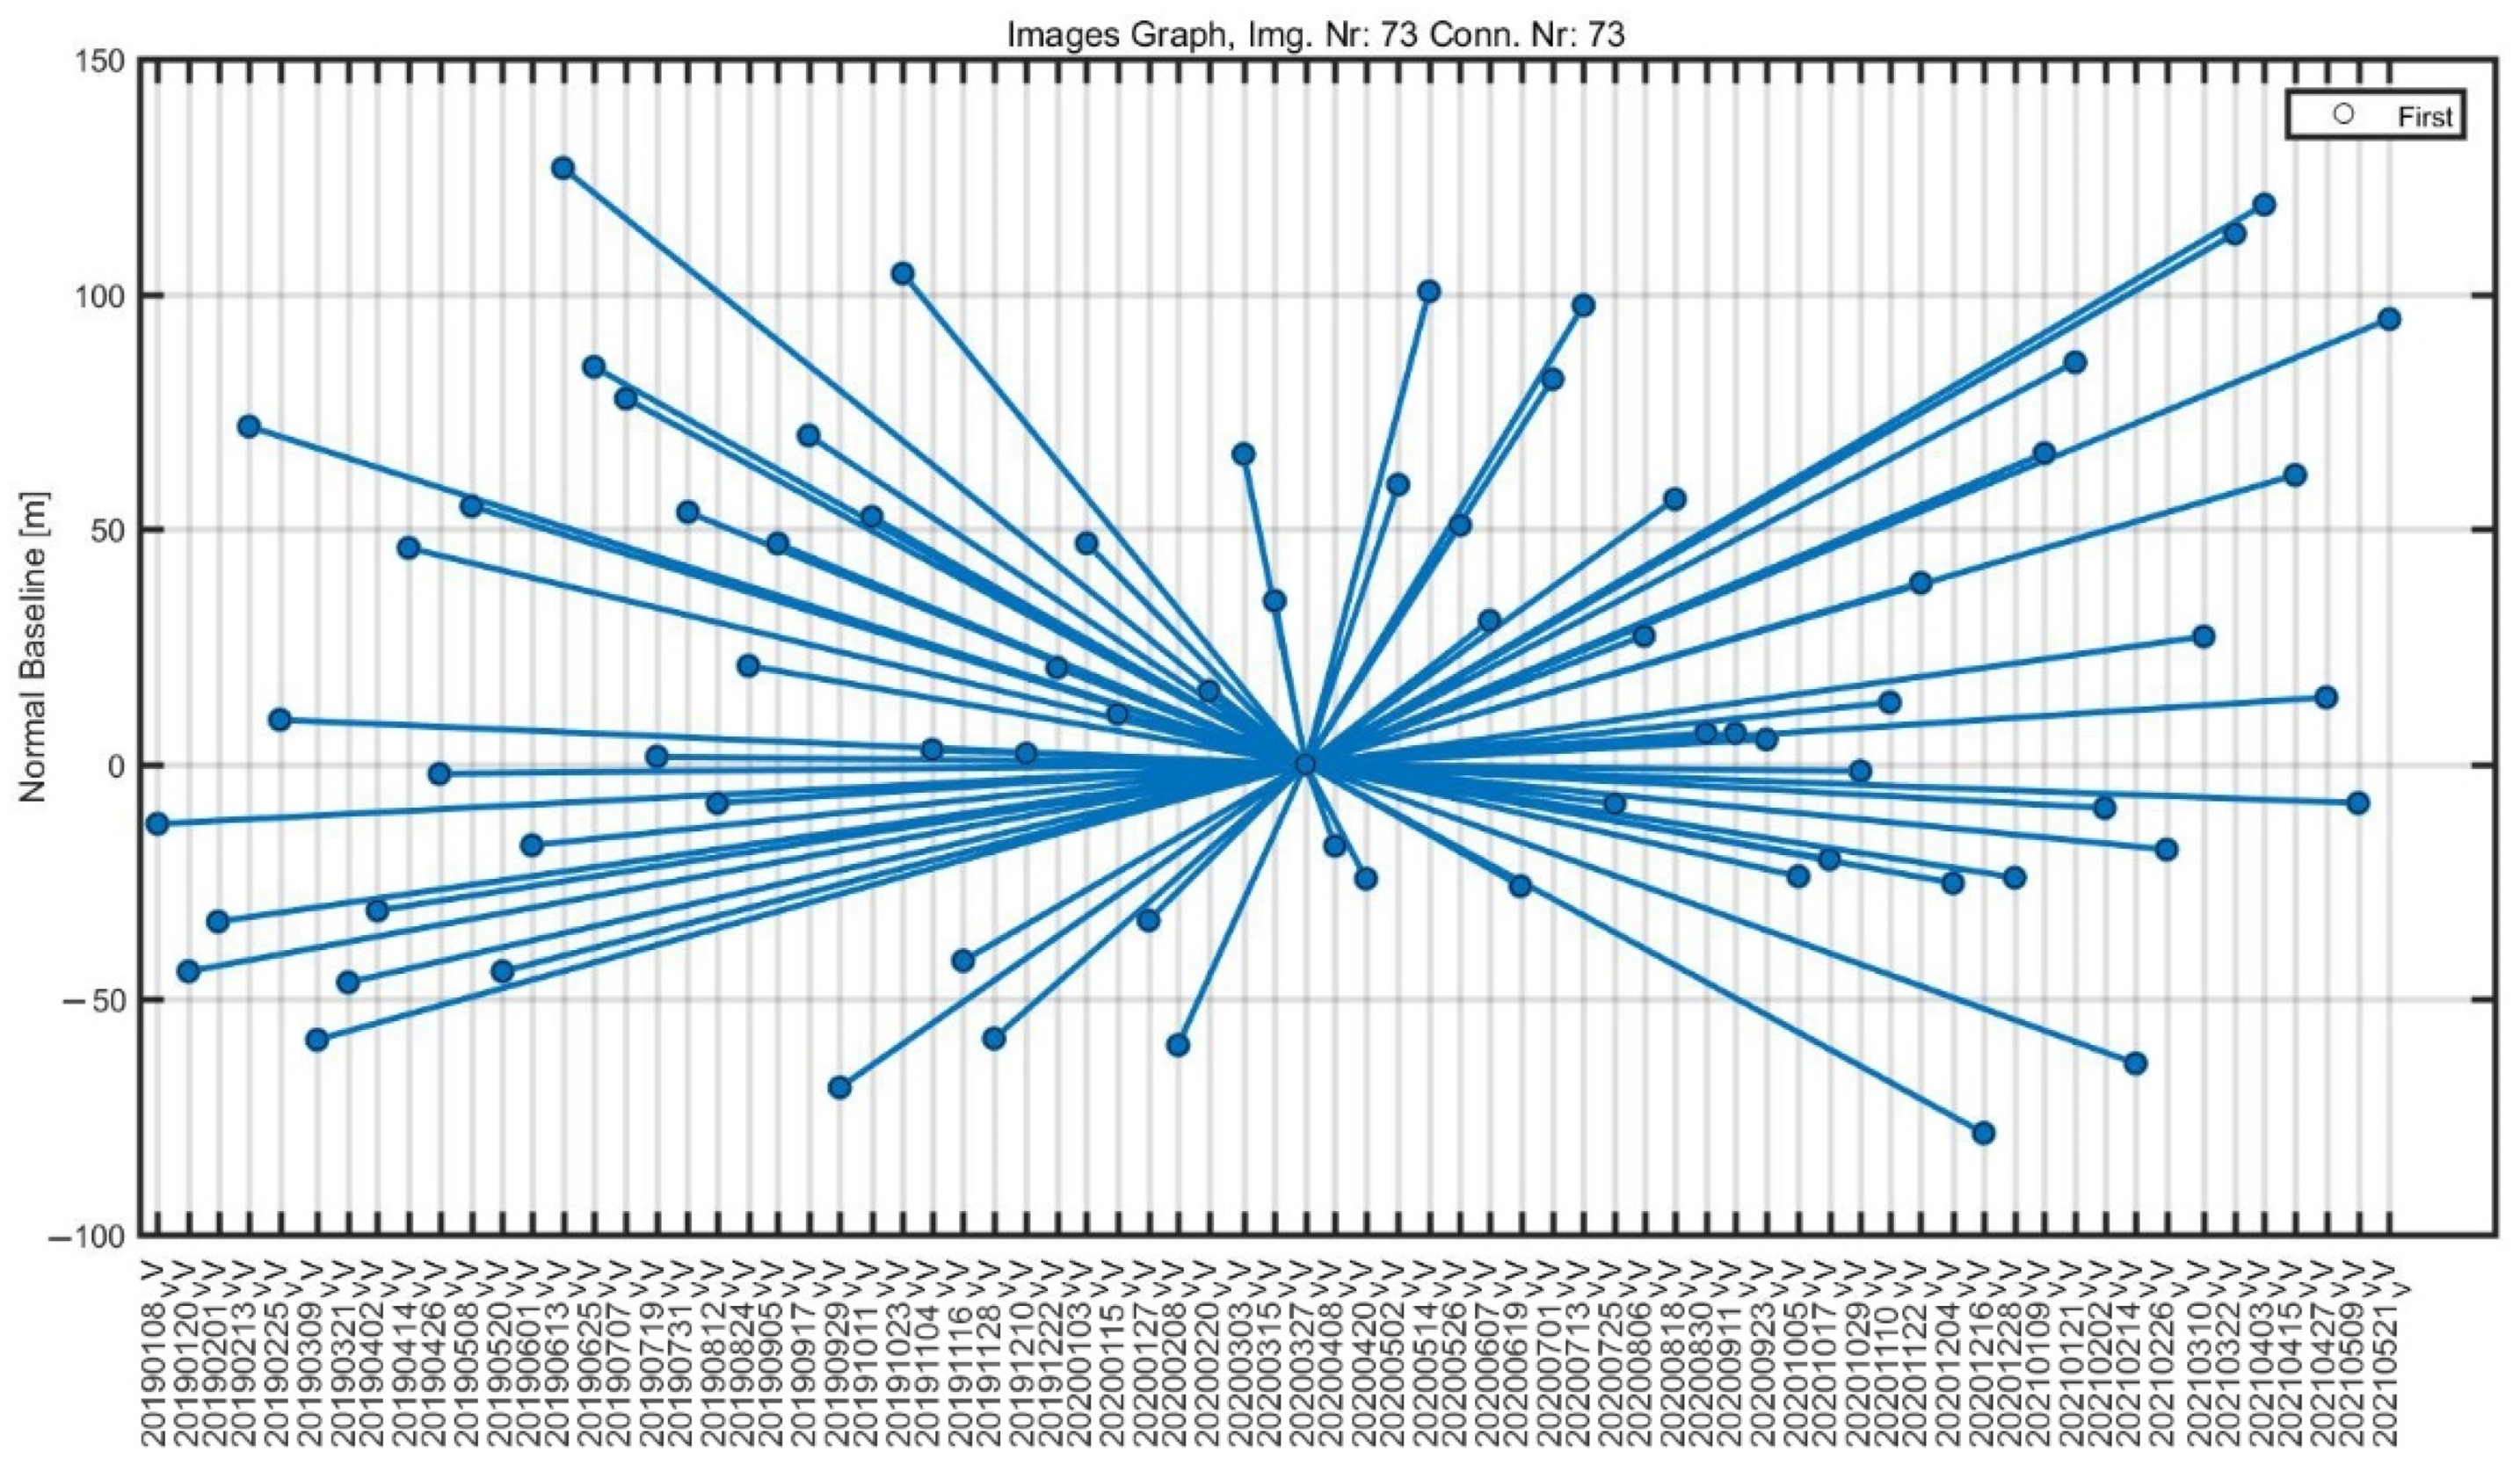
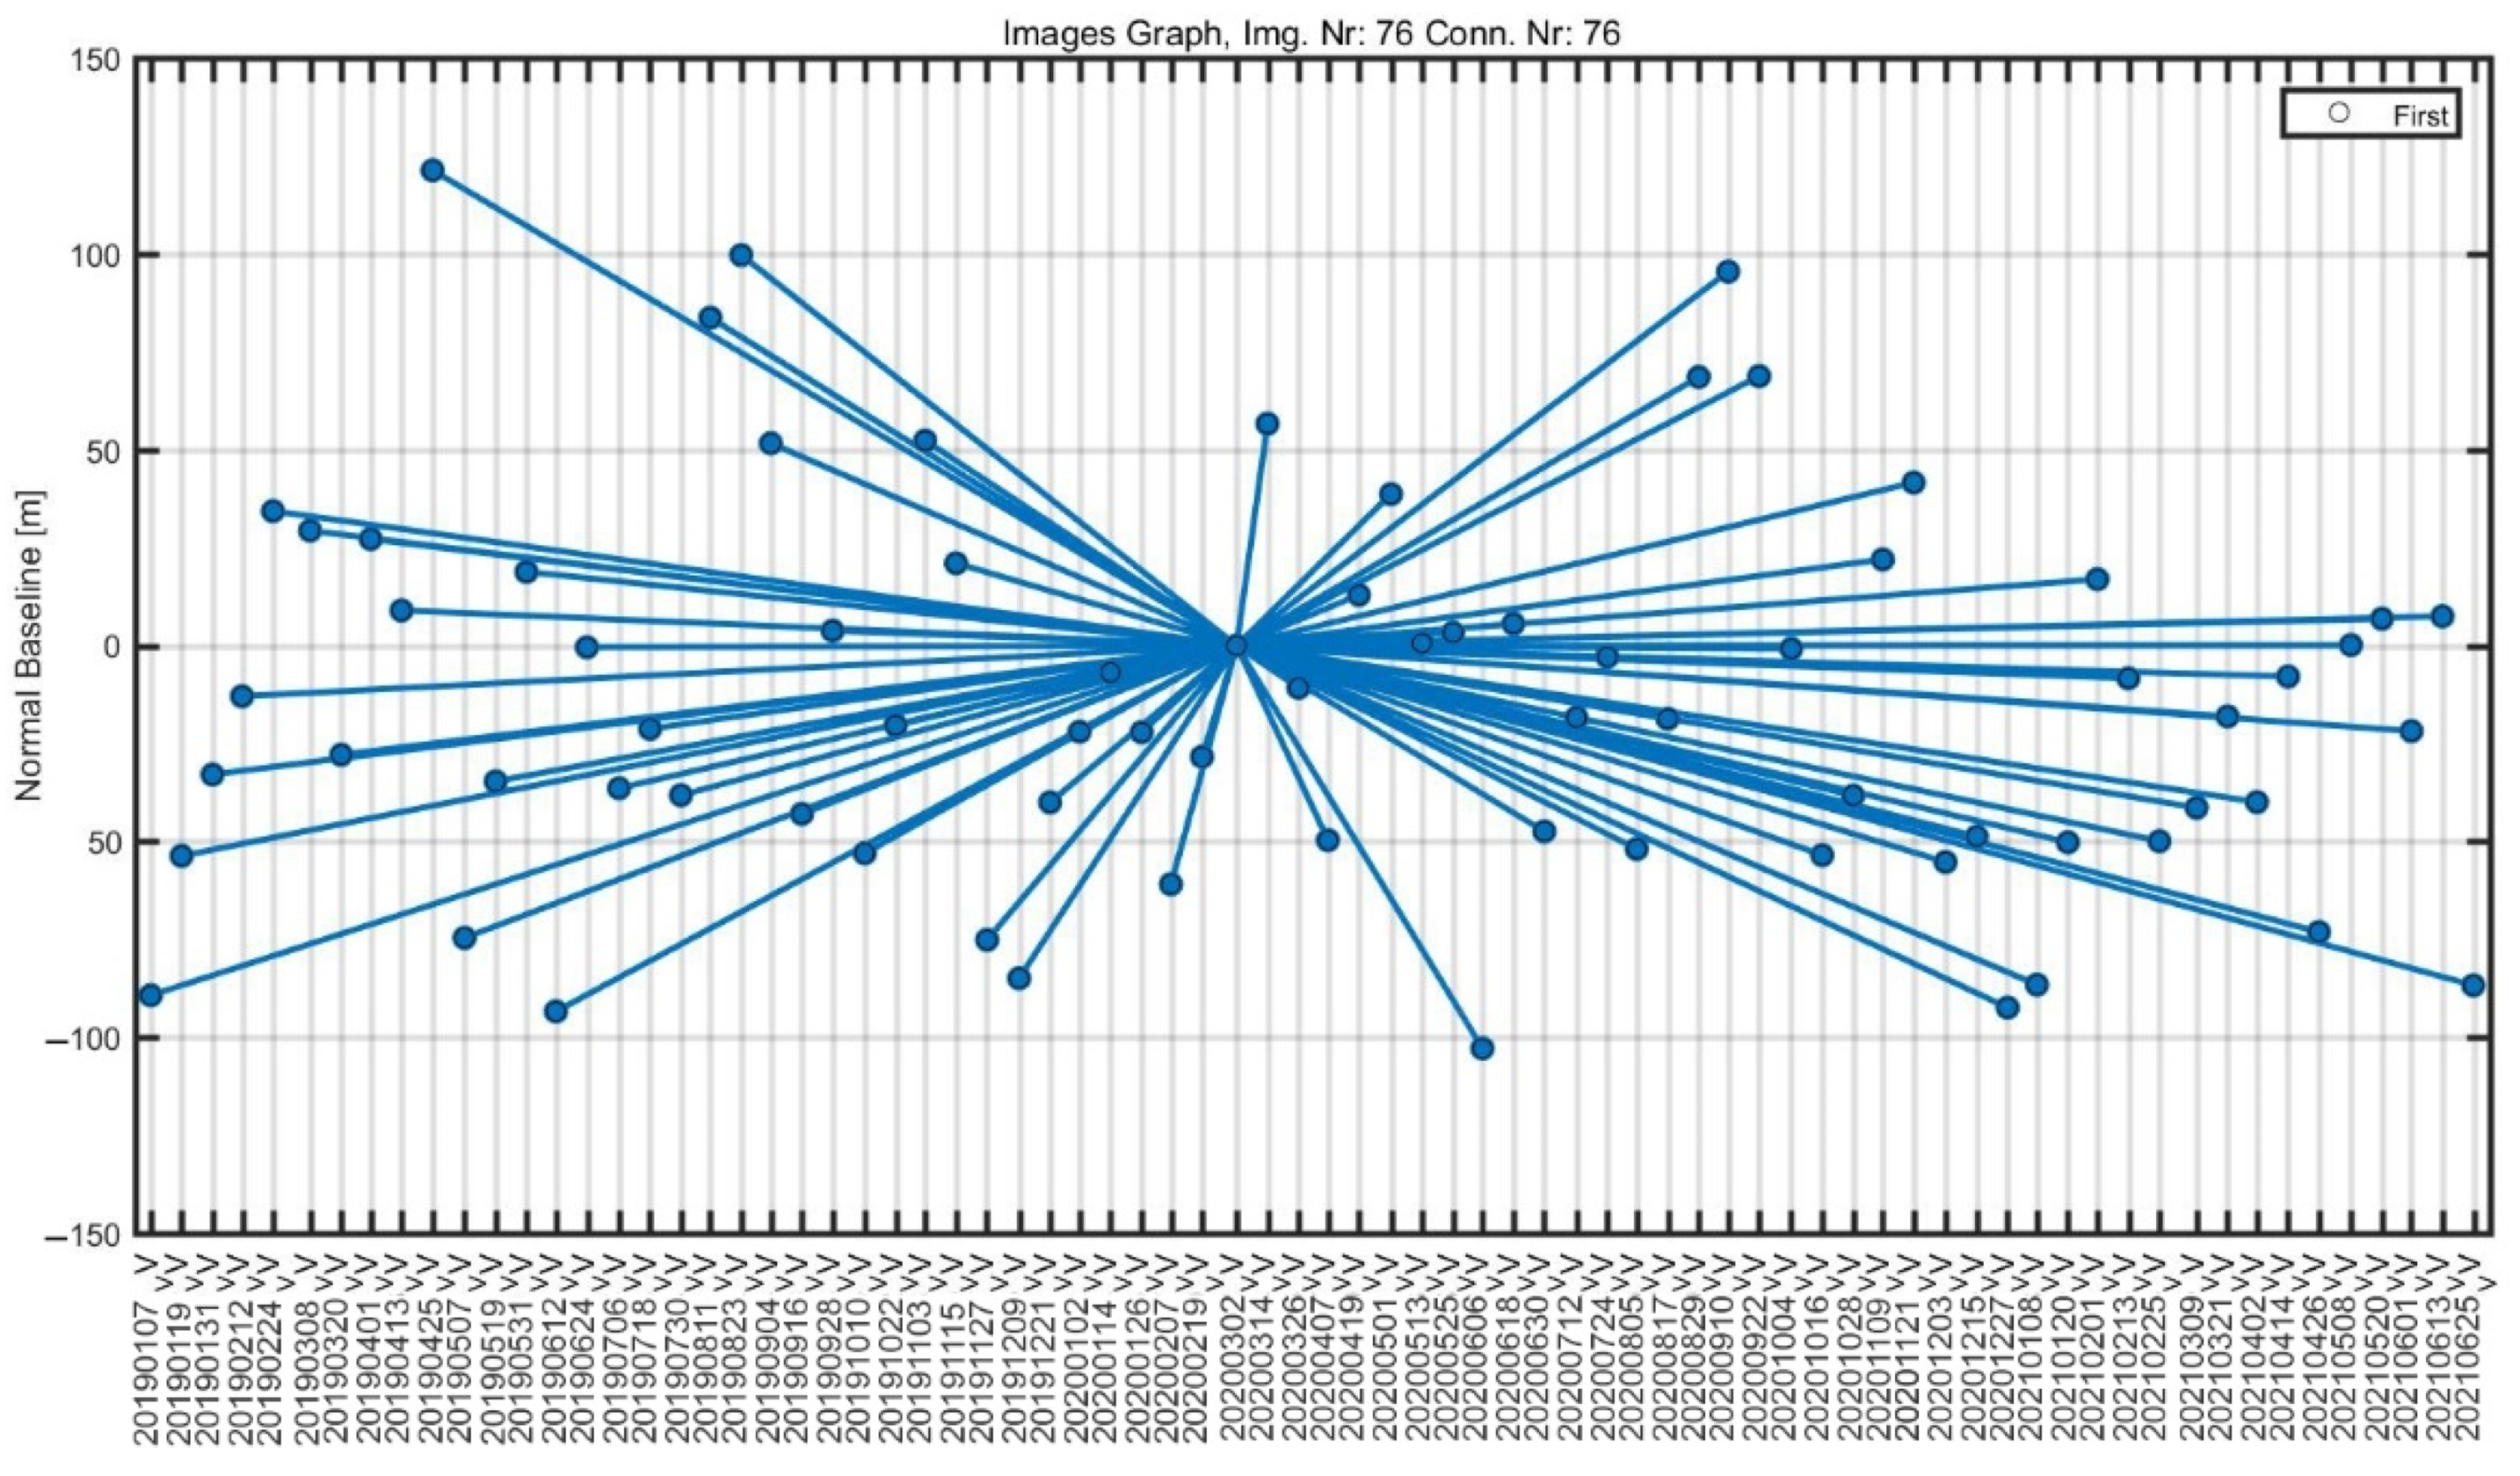
3.1. Dataset

To estimate land subsidence with the help of PS-InSAR technique, we examined Sentinel-1 (C-band) SAR images from Alaska Satellite Facility (ASF) along both descending and ascending orbit paths. PS-InSAR [55] needs at least 20 Synthetic Aperture Radar images [56] to achieve the C-band data analysis. PS-InSAR measures land subsidence over a month or year, considering environmental effects, signal noise, and topographic factors. Furthermore, this sensor is capable of various acquisition modes, such as wave, interferometric wide, extra-wide swath, and strip map. In total, 76 images from the ascending path (7 January 2019–25 June 2021) and 73 images from the descending path (8 January 2019–21 May 2021) were used for this analysis. The properties of Sentinel-1 (descending and ascending) datasets and the parameters employed in this investigation are detailed in Table 1.
For this approach, the SARPROZ software was used, which is useful for InSAR data research and commercial application [34]. SARPROZ has been effectively employed by Qin et al. [57], for example, to build a subsidence map of Hong Kong that illustrates the PSI’s millimeter-level precision. It applies the ideas mentioned in the PS-InSAR technique [24,58].

3.2. Methodology

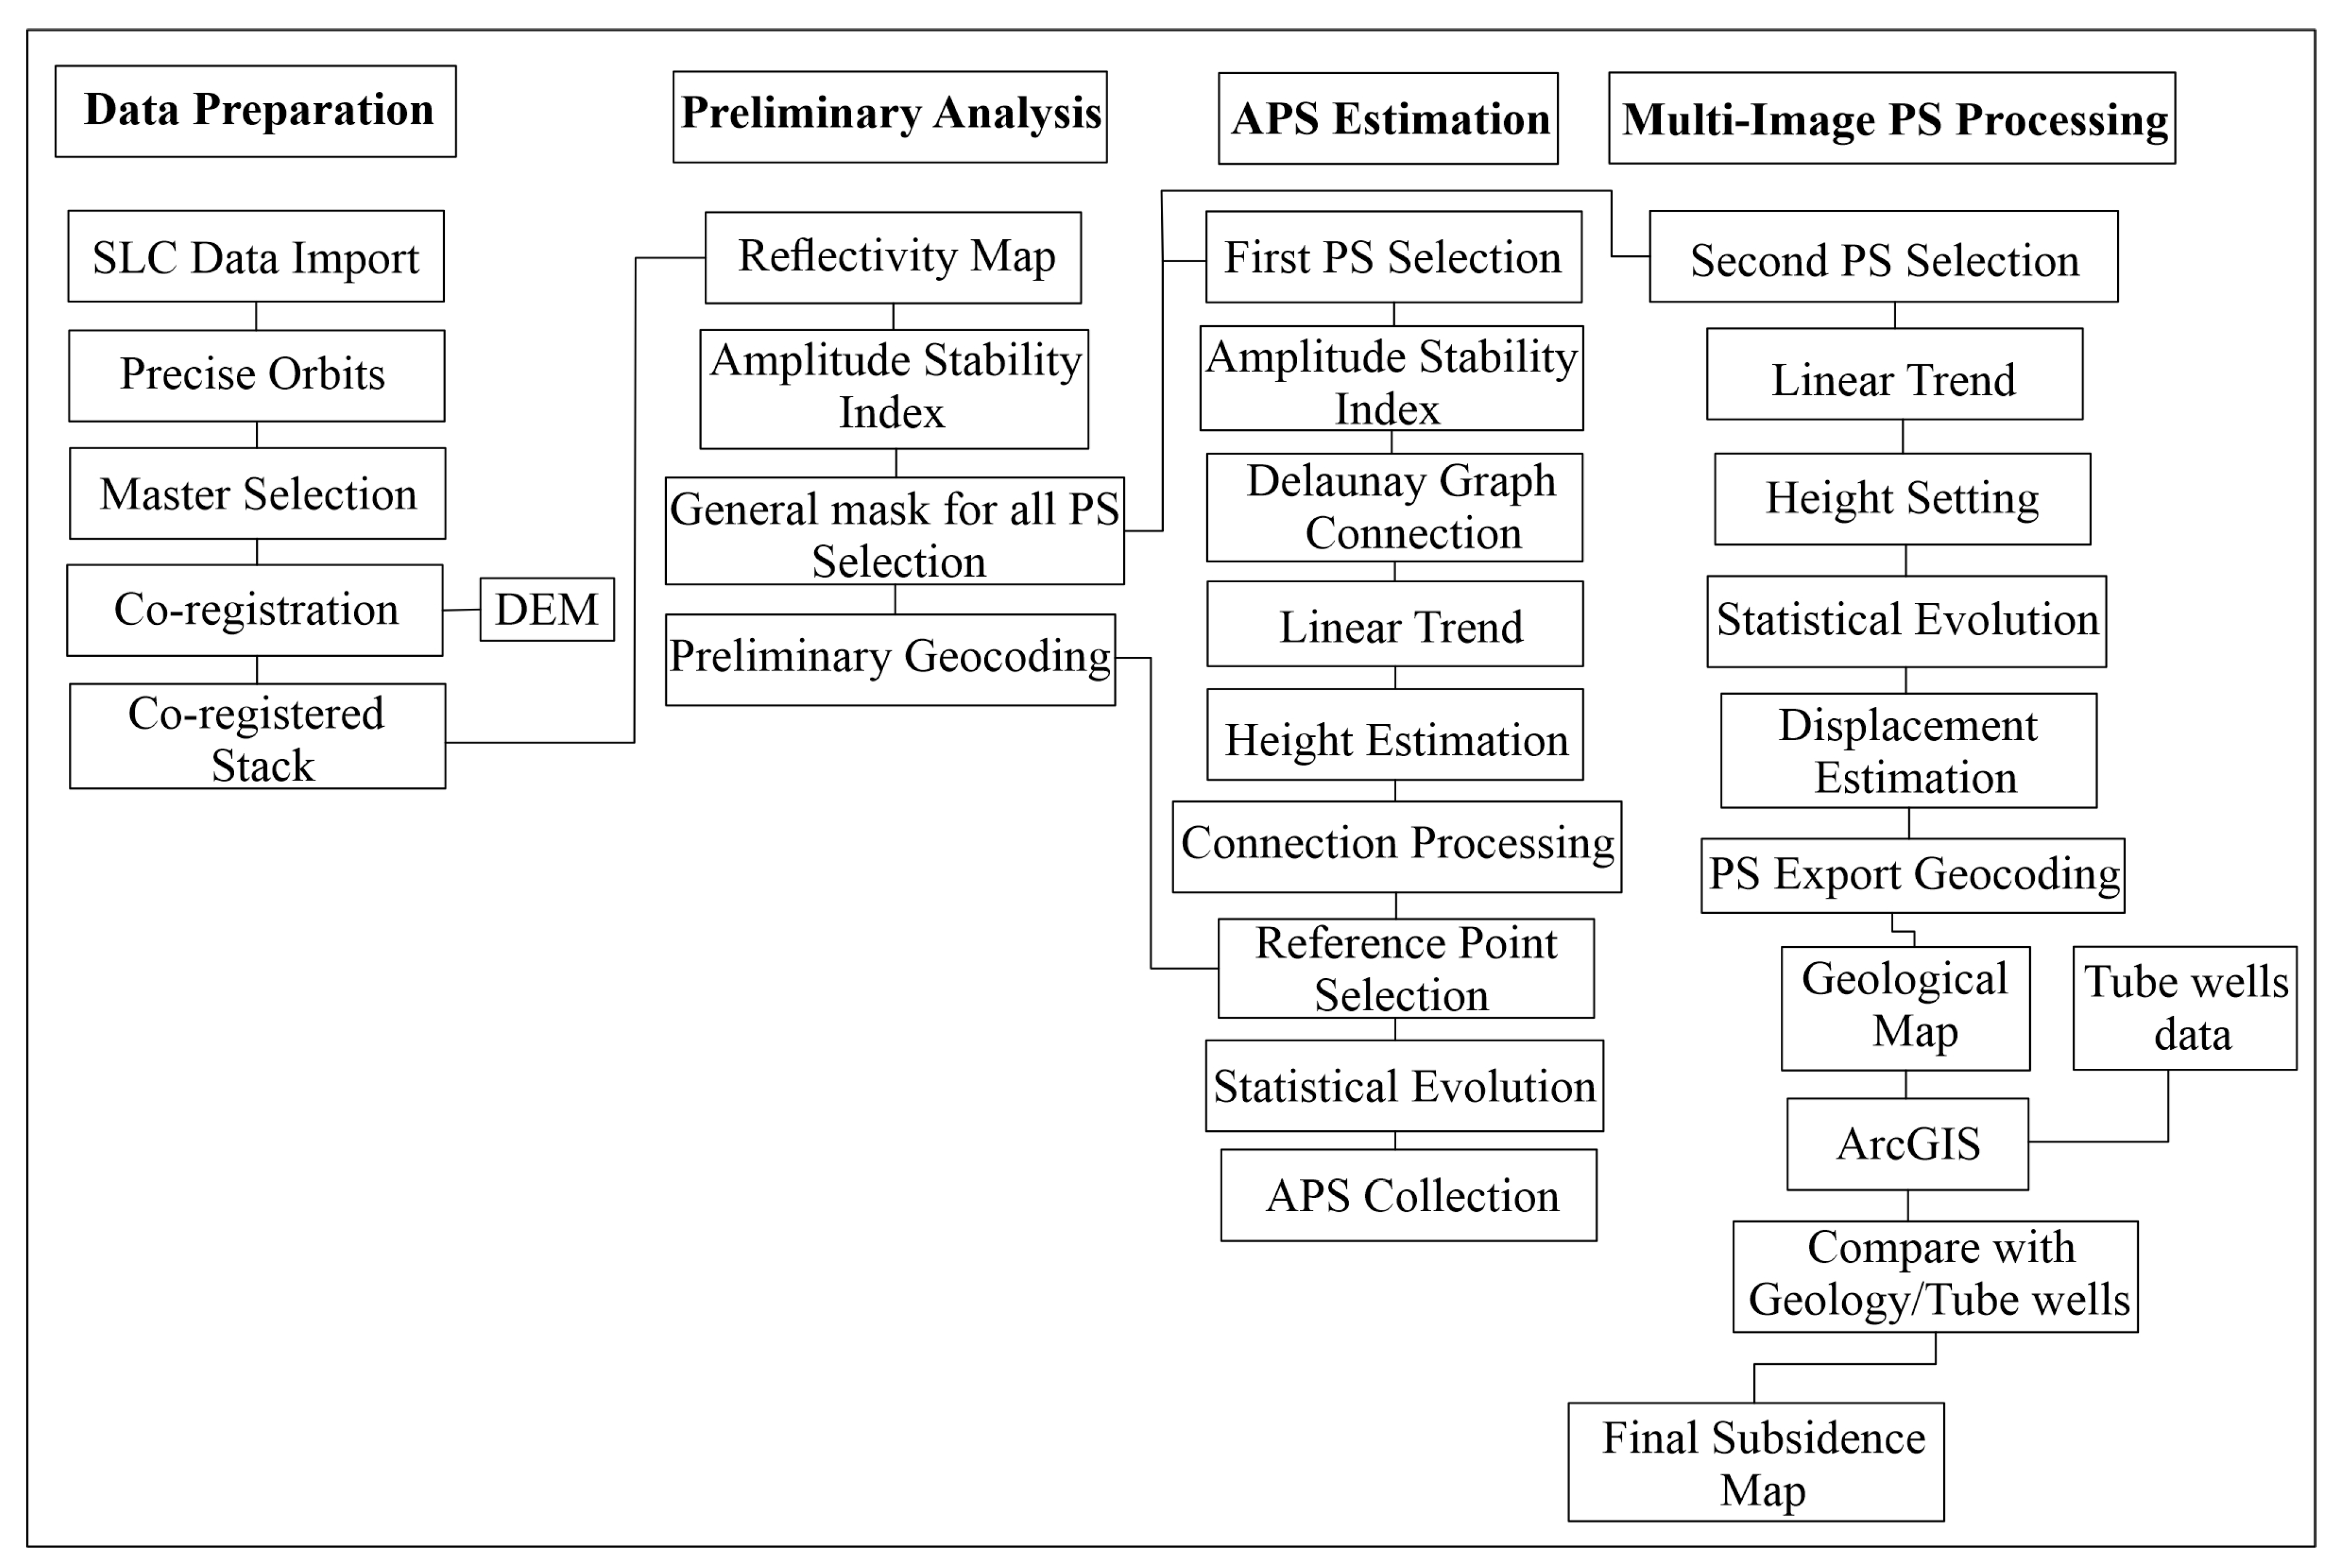
3.2.1. Workflow of PS-InSAR

The PS-InSAR approach requires data preparation and analysis, Atmospheric Phase Screen (APS) Removal and Estimation, and Multi-Image Sparse Point (MISP) Processing. The study’s research methods can be seen in (Figure 4).

3.2.2. PS-InSAR’s Processing

The PS-InSAR approach analyzes SAR data time-series. The technique focuses on steady, point-like scatterers that are speckle-free and provide a definitive response. These are Persistent Scatterers (PS), which provide a steady phase history across the acquisition time range [24,59,60]. The PS phases are stable over time and do not exhibit temporal decorrelation, allowing for long-term observation and deformation monitoring. The interferometric phase φ I n t of SAR signal of wavelength lambda (λ) between two distinct images is represented as:
φ I n t = φ t o p o g r a p h y + φ m o v e m e n t + φ o r b i t + φ a t m o s p h e r e + φ n o i s e
where φ t o p o g r a p h y is the variation in phase caused by height errors, φ m o v e m e n t is the component generated by terrain displacement in the Line Of Sight (LOS) path in between two SAR acquisitions, φ o r b i t is the error produced due to phase triggered by errors due to orbit estimation, φ a t m o s p h e r e is the phase component as a result of variations in atmospheric phase delay. Finally, φ n o i s e refers to phase noise, including thermal noise and other error components.

3.2.3. Preparation of Data

Importing a Single Look Complex dataset with precise paths is one of the computation phases in data research. For this investigation, the images used had the same rotations with ascending and descending orbits. Nevertheless, both ascending and descending images cannot be evaluated together. Thereafter, the polarization was calculated via orbit data, and slave and master images were taken. Initially, extracting the study area’s master images was necessary before moving on to slave images that covered an area similar to the master images. In these conditions, a star graph was plotted between the slave and master images for both orbital directions (descending and ascending) (Figure 5 and Figure 6). During the co-registration step, a specific area was analyzed and co-registered [34].

3.2.4. Preliminary Examination

Parameters such as the orbital errors, APS, and other considerations were estimated and eliminated. Afterwards, the phase stability was measured. Absolute amplitude scales were largely unconcerned about causing processing disturbances [61]. As a result, it was recommended that the pixels in all of these acquisitions had identical amplitudes and lower phase dispersions. In the SARPROZ software process, PS was chosen based on the Amplitude Stability Index (ASI).

3.2.5. Atmospheric Phase Screen (APS) Removal and Estimation

Several atmospheric phase delays that influence SAR images during collection and signal disruptions, such as radar signals disrupted by aerosol particles, are common [34]. To avoid these interruptions in the dataset, the atmospheric phase screen is computed using multiple spatial-temporal filtrations [62]. At this phase, the results of the atmospheric phase screen are eliminated, and the advanced steps are used to estimate topographical height effects and linear displacement velocities [34]. For this purpose, an adequate criterion of ASI > 0.75 is suggested as a guideline for choosing the first PSs [24]. Our study selected PSs based on ASI values greater than 0.7. This constraint parameter estimate is satisfied by permitting a restricted amount of persistent scatterer points, which is required to compute the correct APS. Regarding the selection of the primary persistent scatterer, a reference network must be built by linking persistent scatterers using Delaunay triangulation at this stage. The derived linear model (linear deformation velocities and residual height) is then removed, and APS is estimated from the phase residual using a reverse network. Moreover, it is necessary to determine a single reference spot and calculate the object’s velocity. Pursuing graph inversion and atmospheric phase screen removal, the temporal coherence of persistent scatterers was evaluated to determine atmospheric phase screen integrity, producing a satisfactory result with a coherence larger than 0.70 (Figure 7).

3.2.6. MISP Processing

The second-order persistent scatterer points were picked in the Multi-Image Sparse Point (MISP) step. ASI > 0.6 criteria were applied at this phase to produce denser PS points [61]. The same criteria and reference points used to calculate the APS estimate were used to remove APS. Finally, all persistent scatterer points were geocoded and plotted on google earth, and only persistent scatterer points with a coherence of higher than 0.7 were included in the subsidence map [61].

3.2.7. Post-Processing Analysis
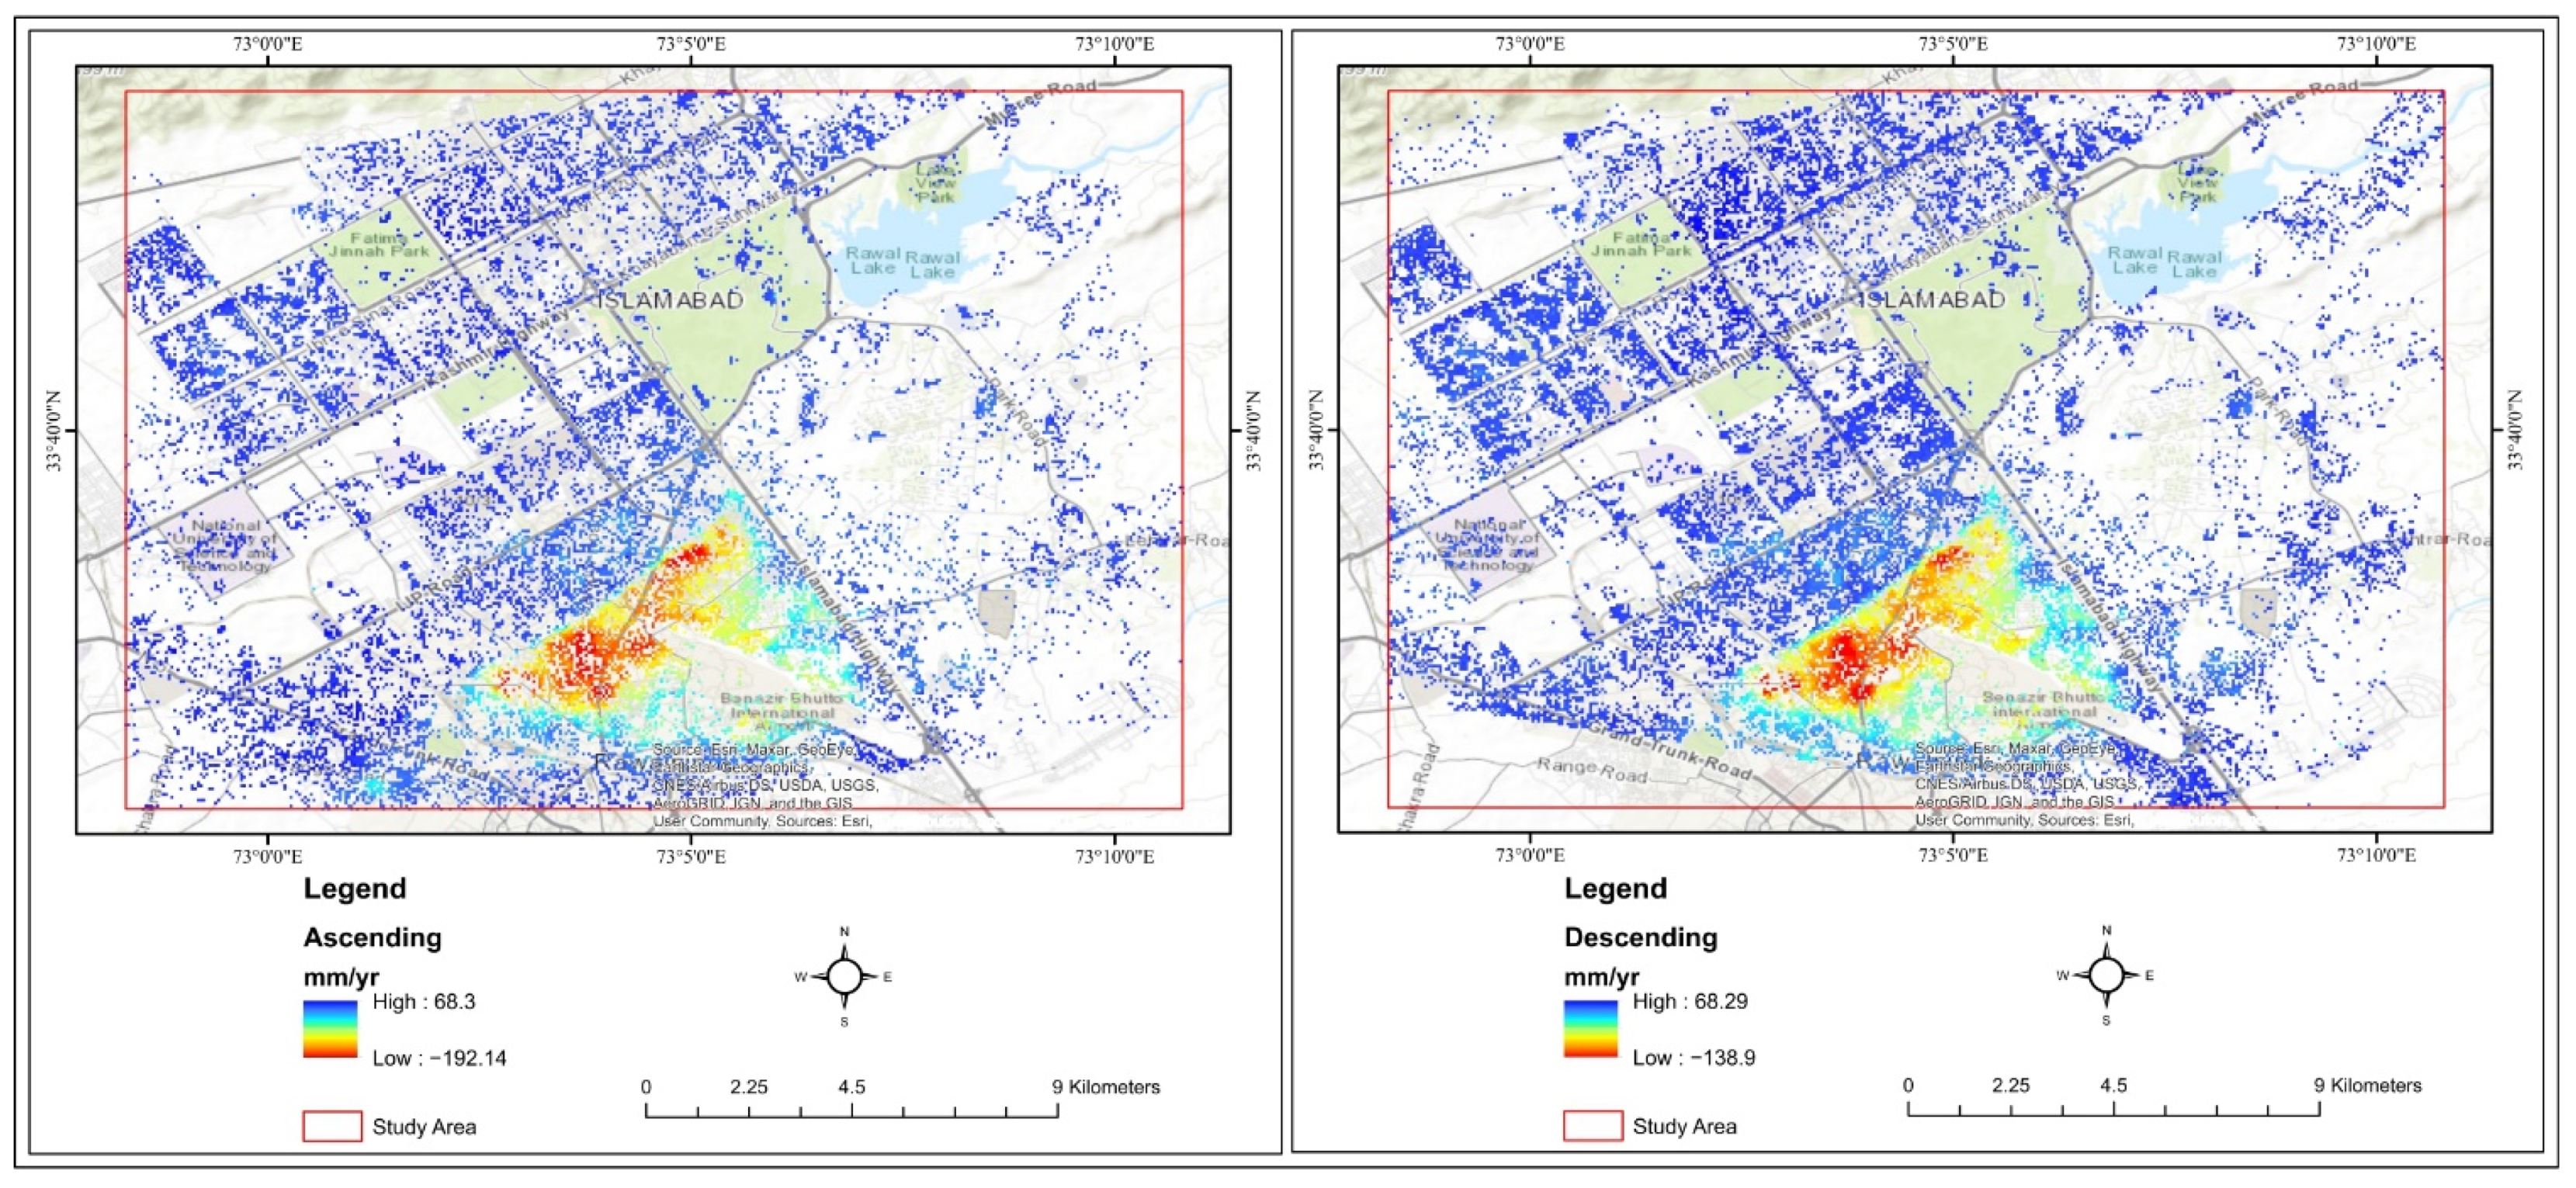
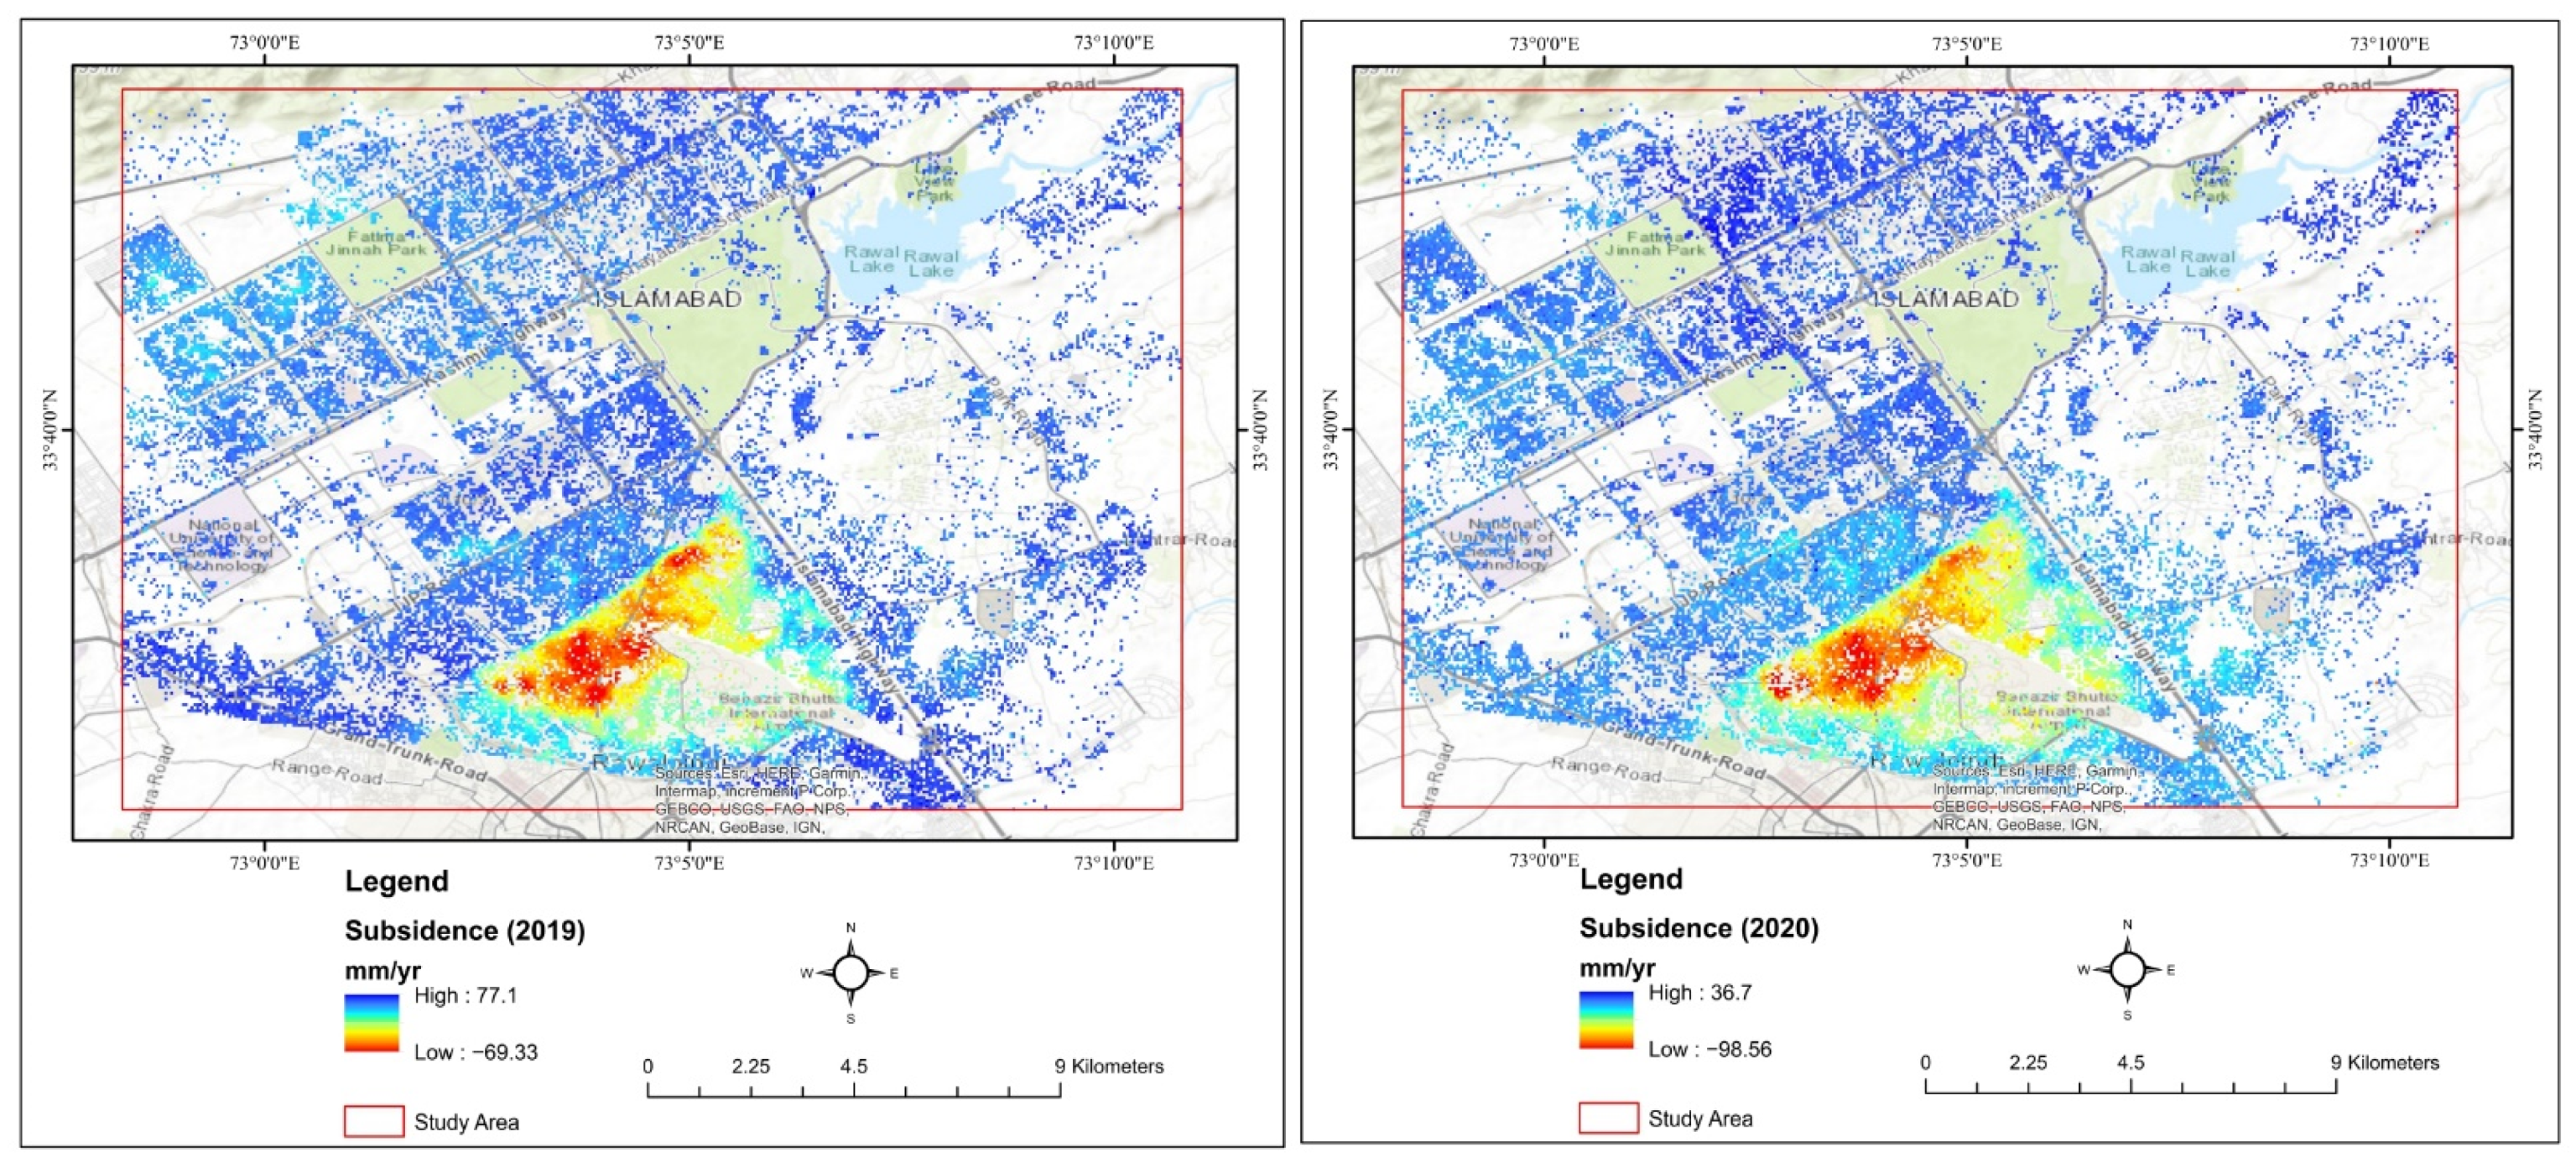
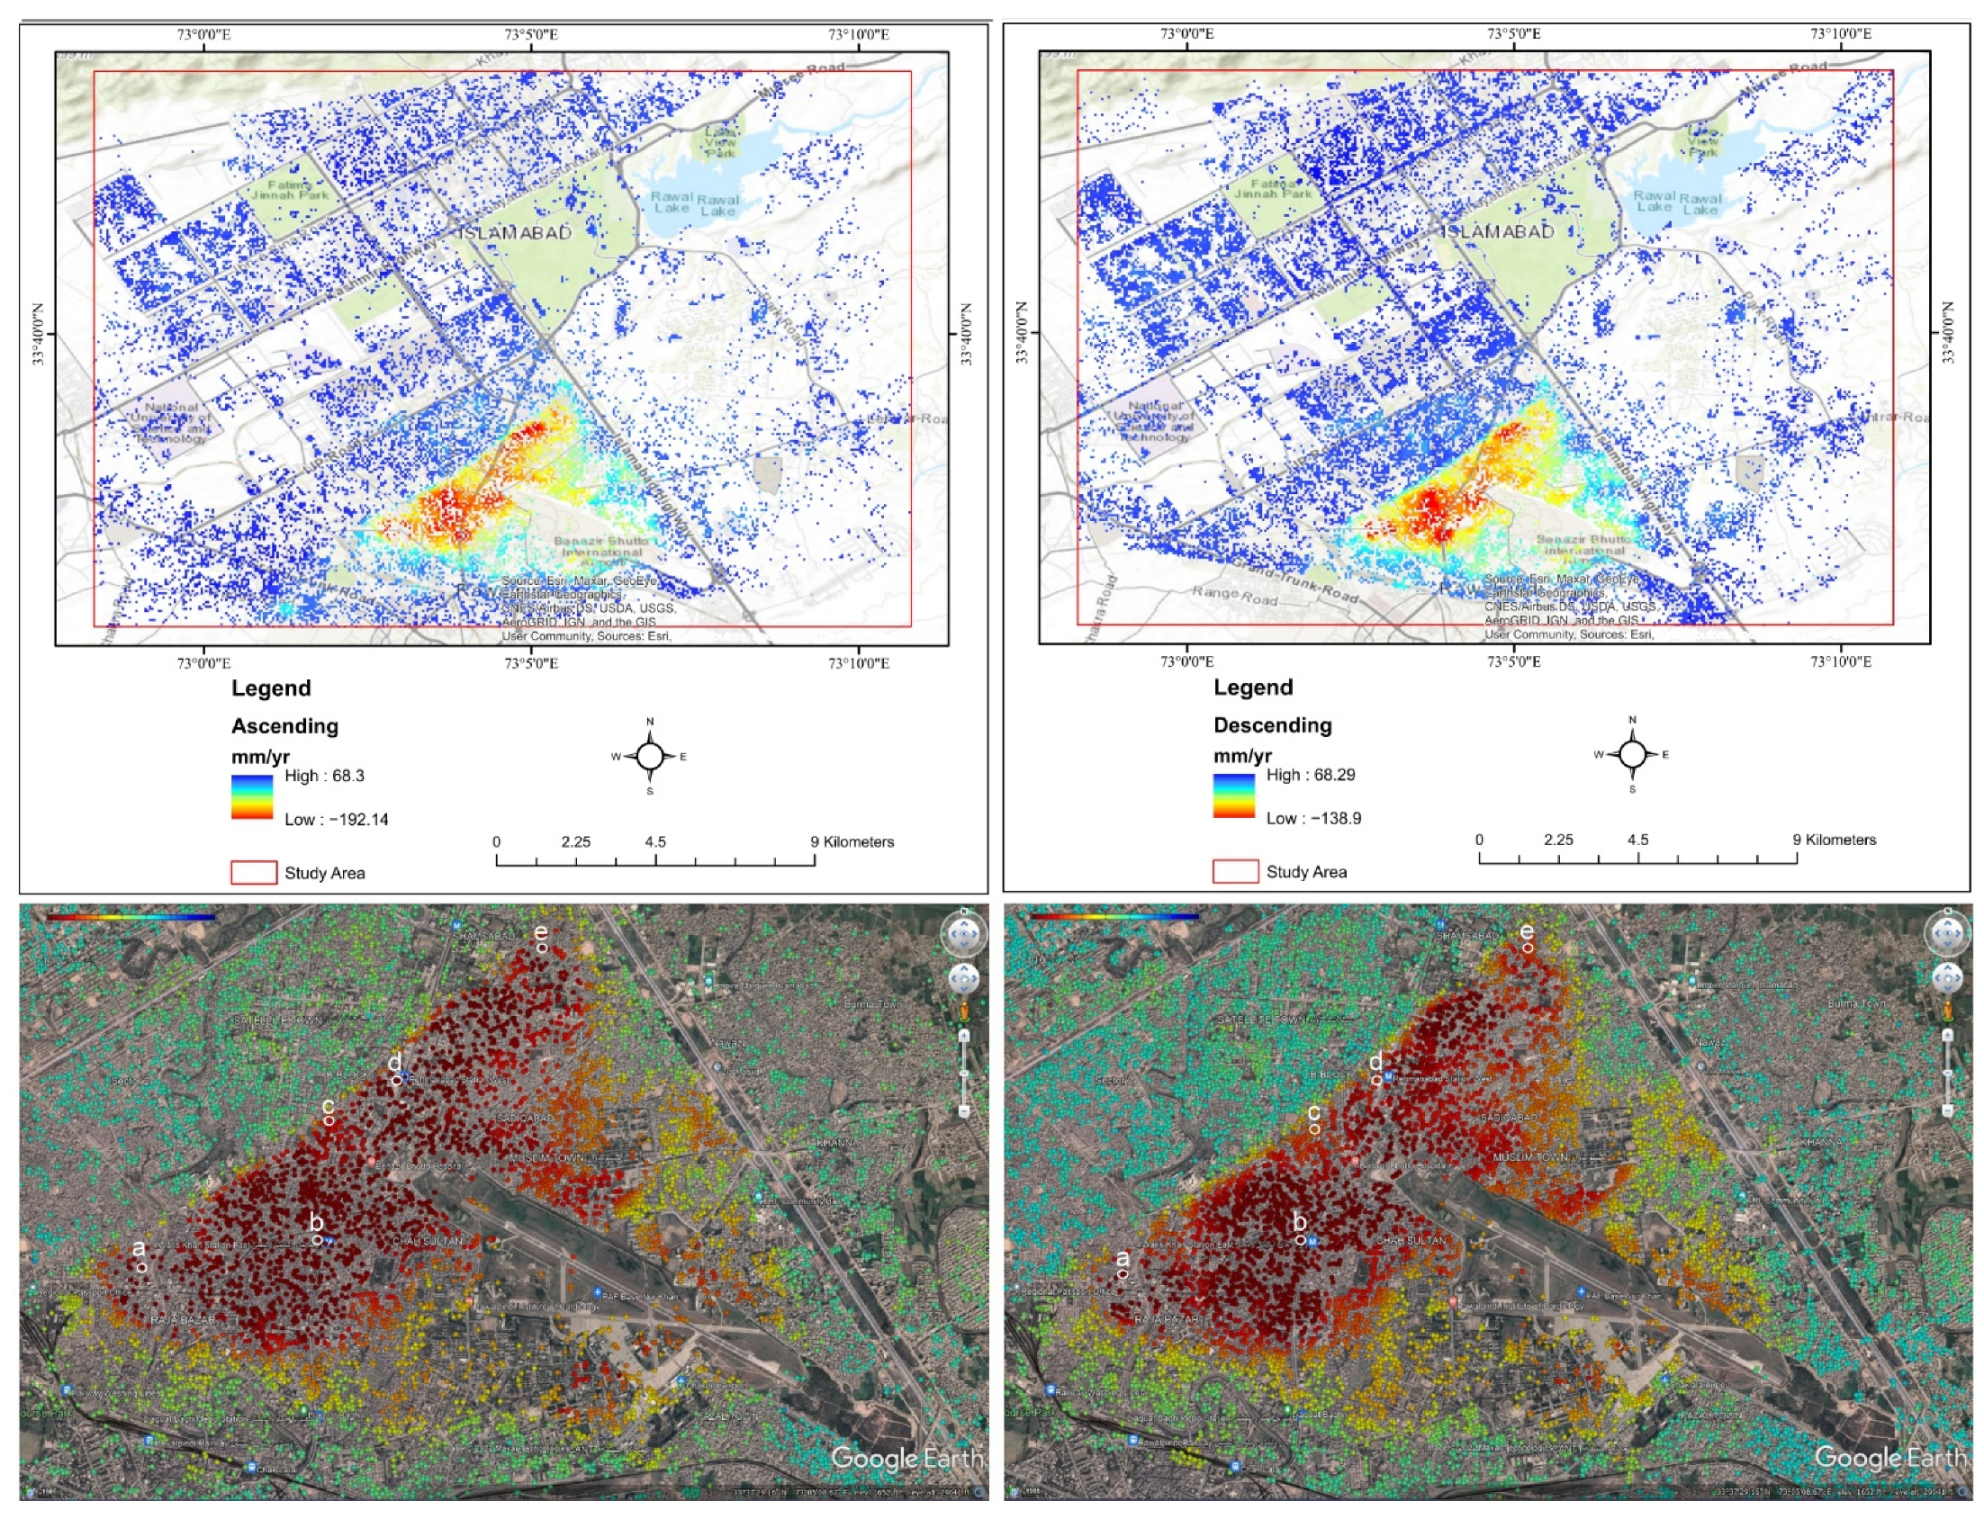
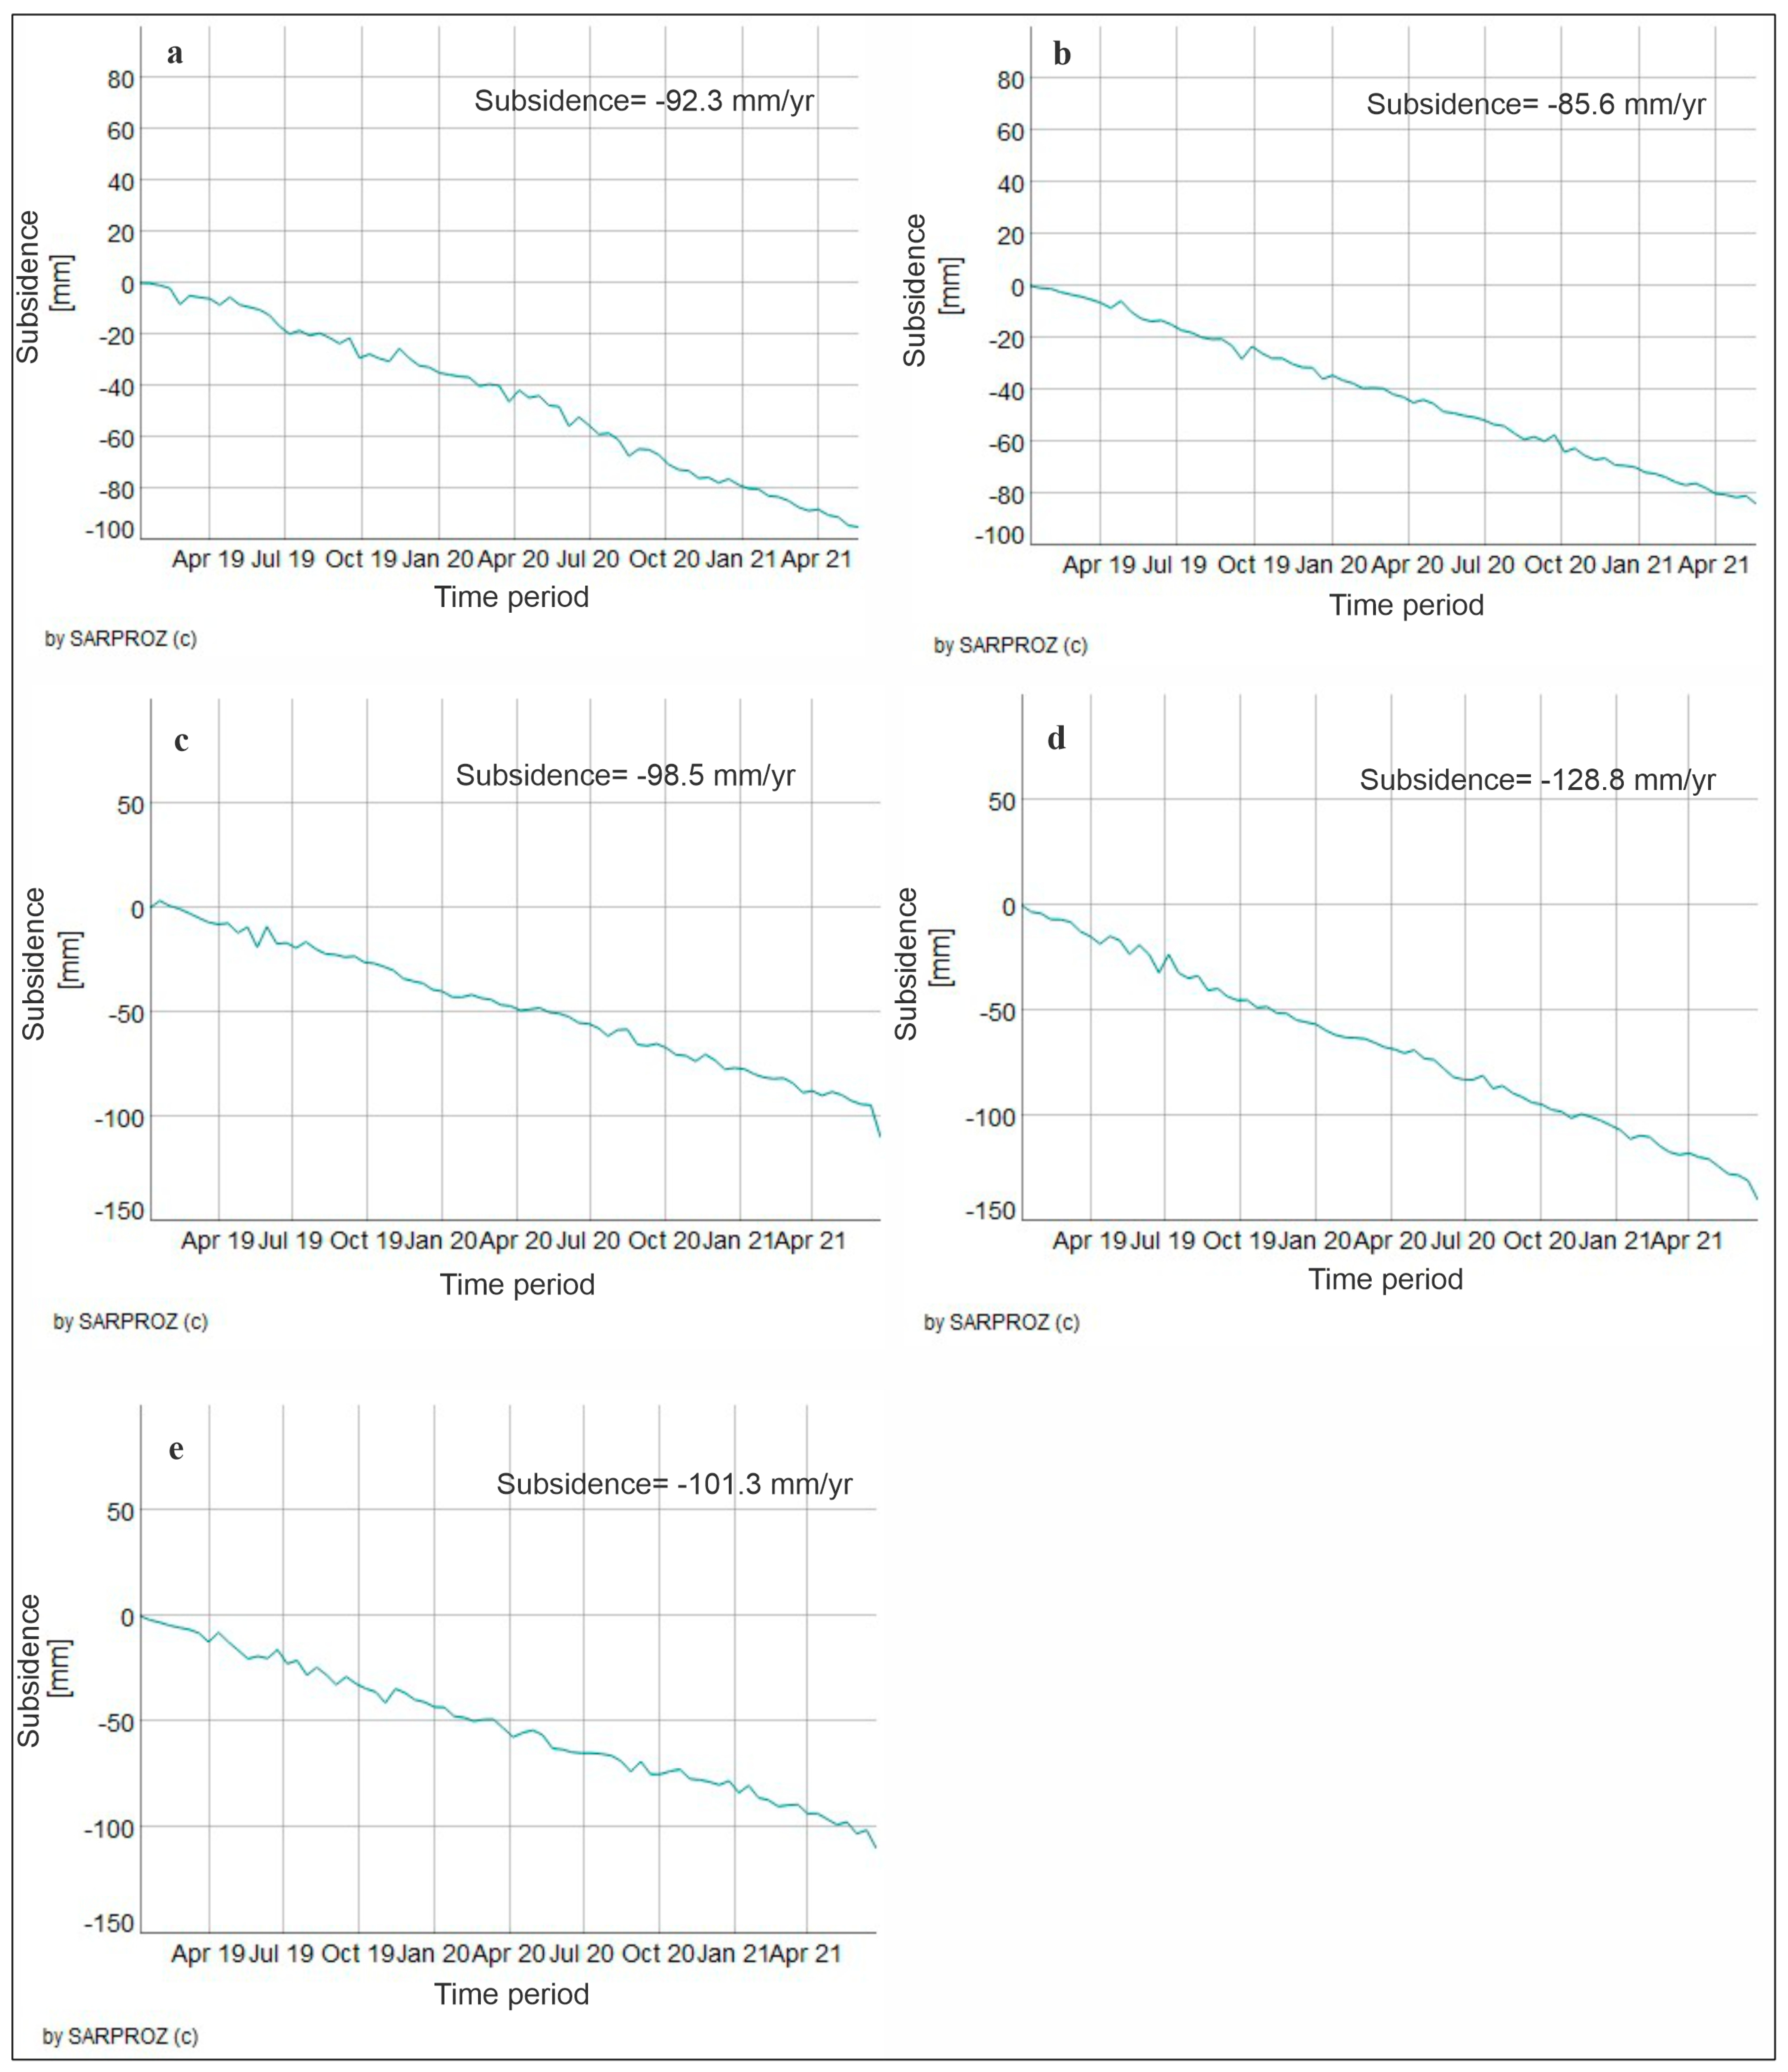
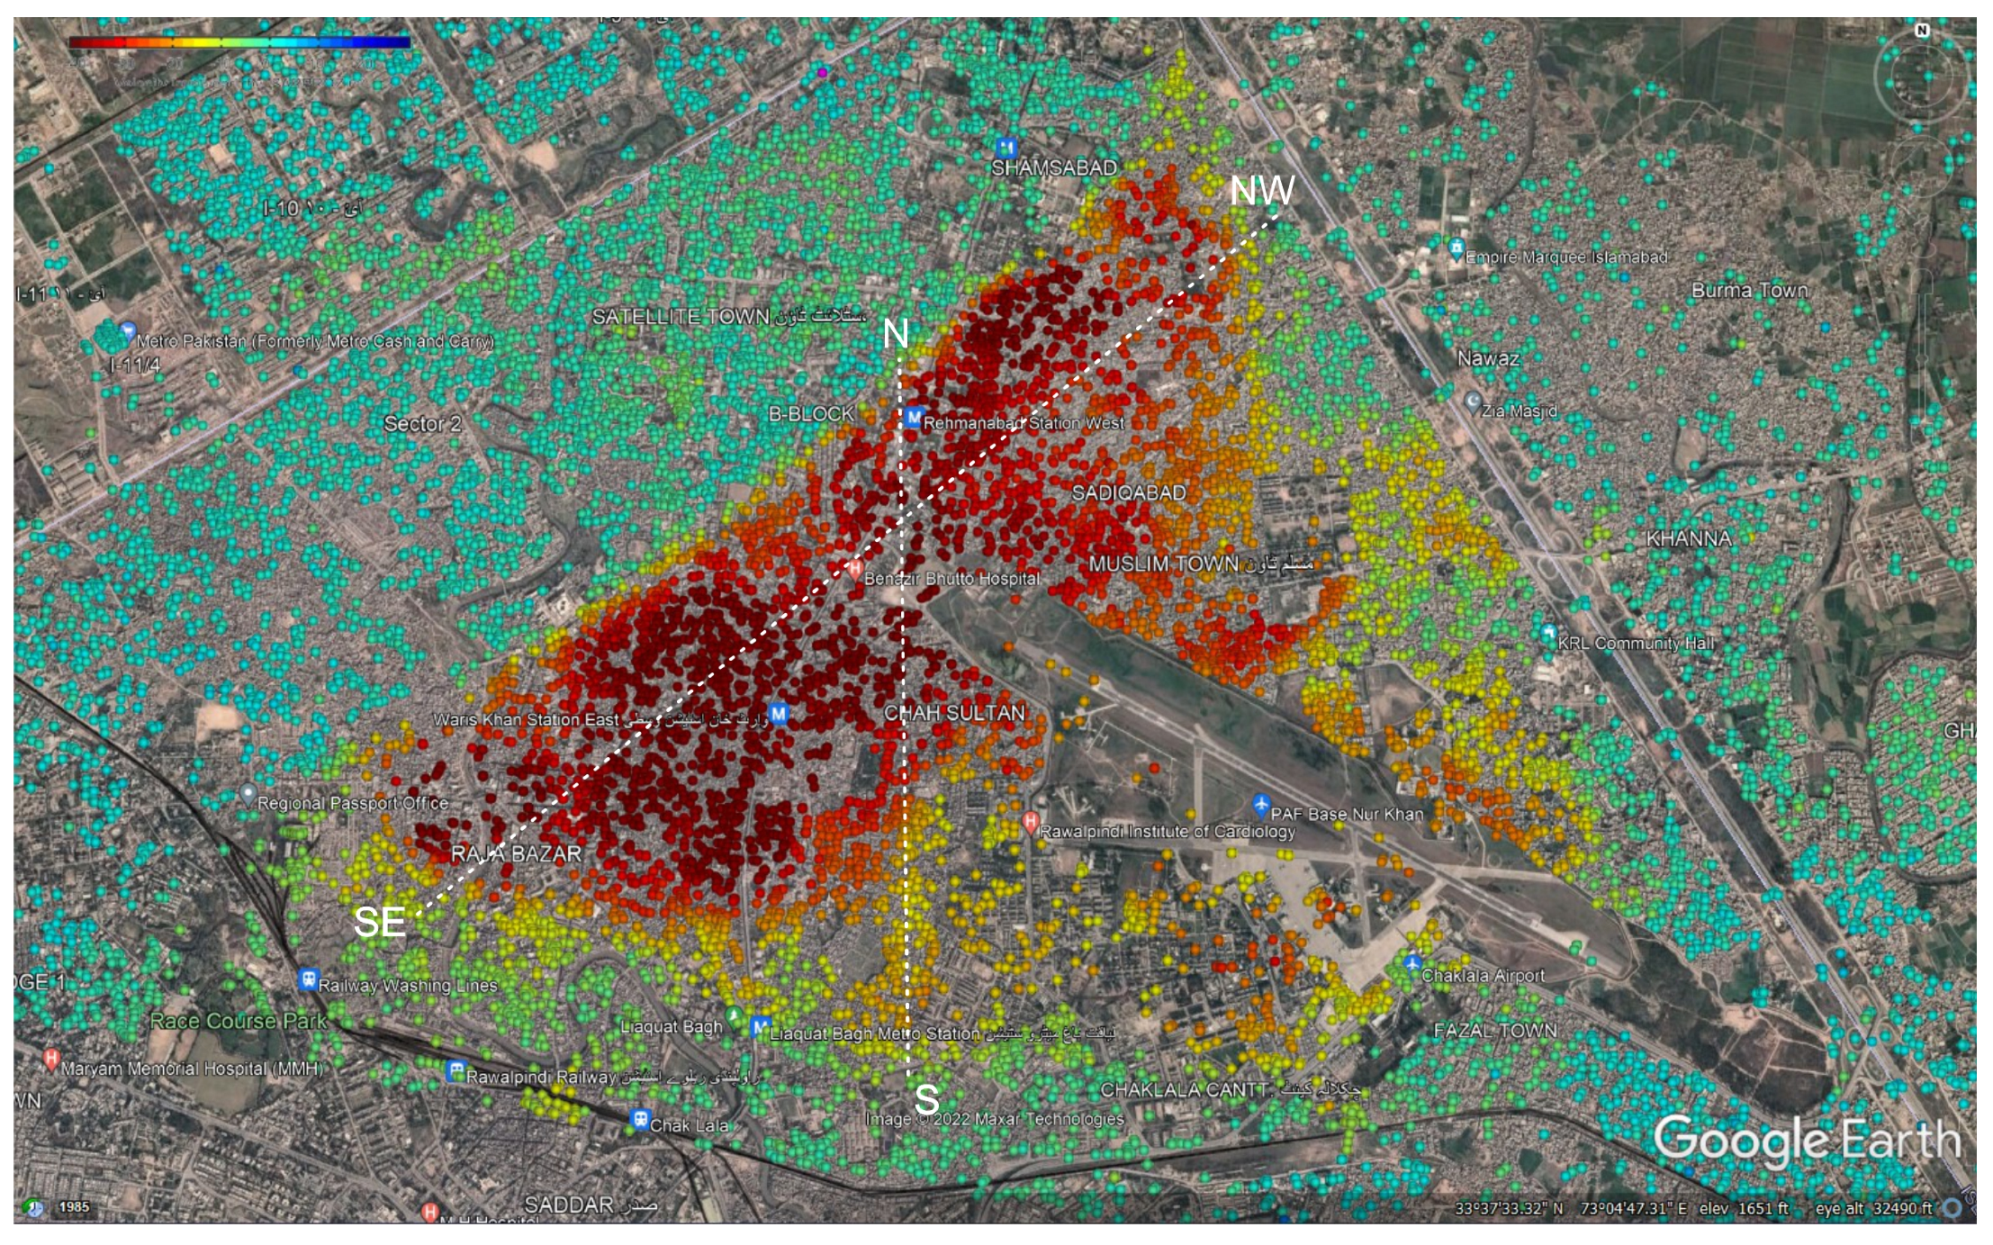
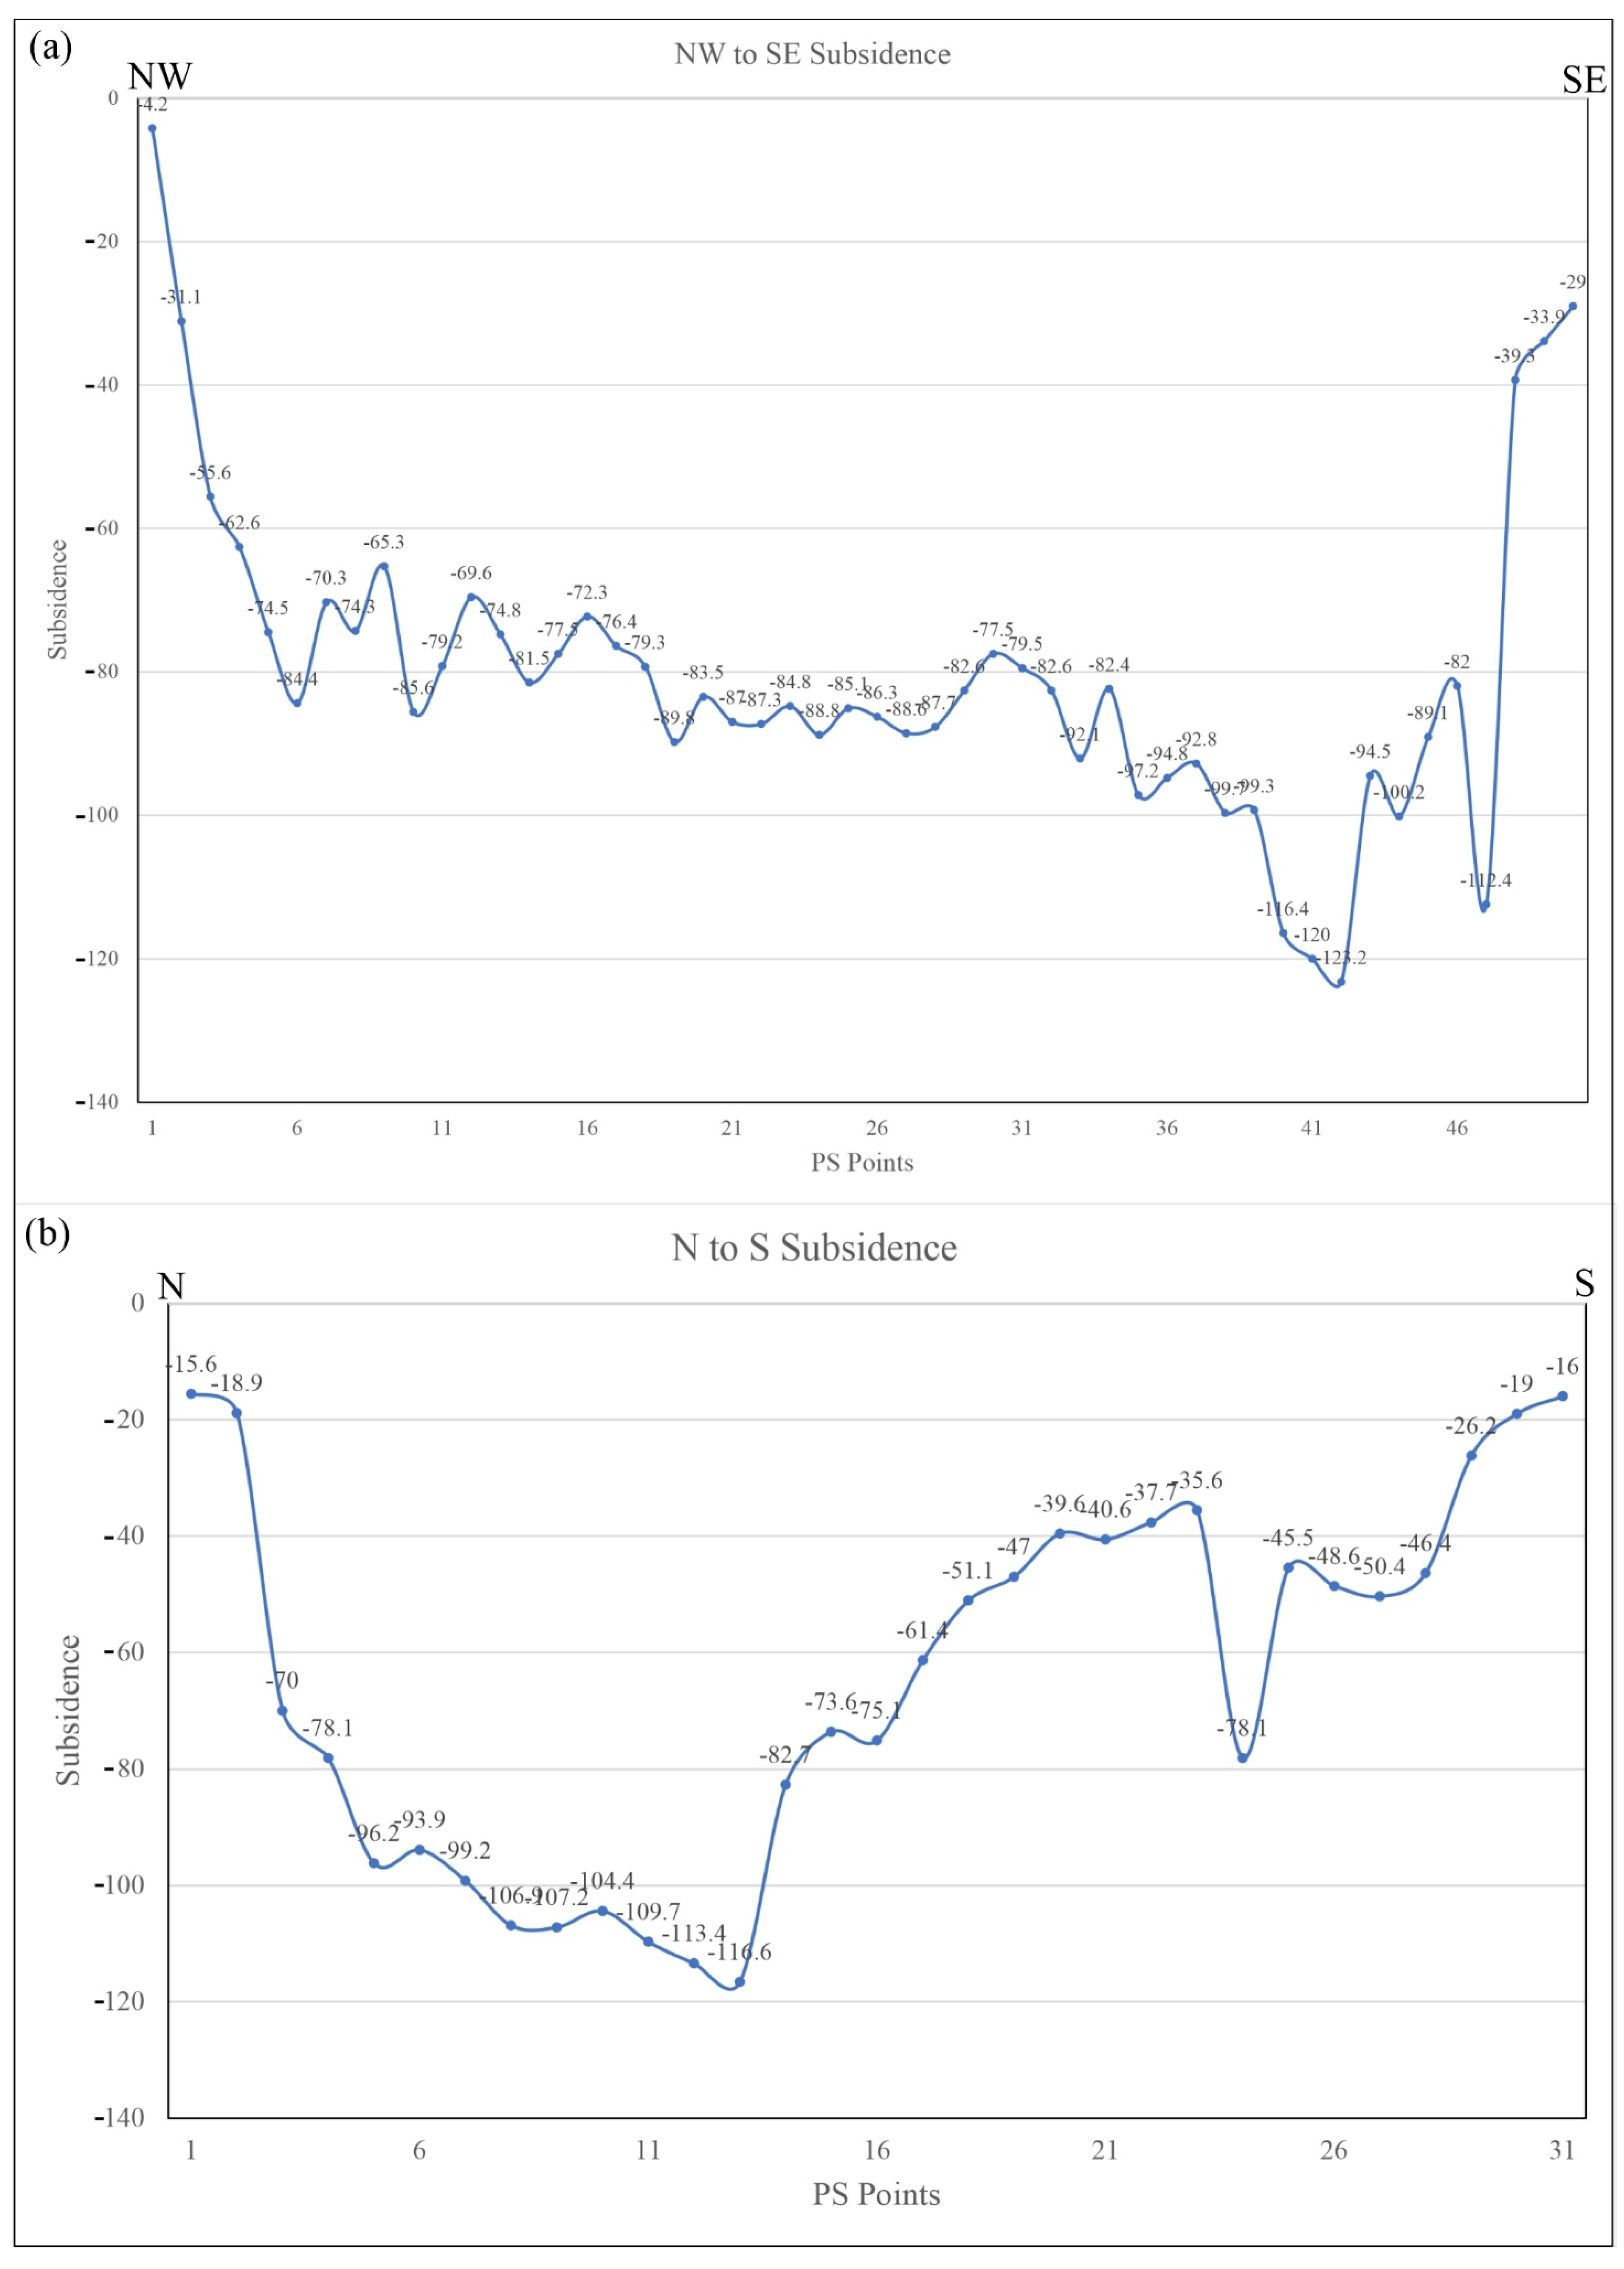
Ultimately, the deformation zones found were transformed into geographical coordinates. The resultant ground deformation map and geological map superimpose were imported into a GIS for additional analysis. The GIS study combined PS-InSAR outcomes with geology and groundwater removal [63] to estimate and verify the detected subsidence zones, then conducted an examination in Rawalpindi-Islamabad geological setting. The previous processes’ outcomes were combined with different information layers in ArcGIS. These layers were used to assess the research area’s groundwater removal and geological formations and their relationship to PS-InSAR-estimated subsidence.

4. Results

As previously stated, we used the PS-InSAR technique, which was applied in SARPROZ software, for displacement observation in the investigated area, allowing us to identify deformation zones in the Rawalpindi-Islamabad area. The greenish color shows the stable locations defined by a stability threshold range (from −10 to 10 mm/yr). PS-InSAR calculates and identifies movements in the region using a point of reference. Therefore, a steady point is selected as a point of reference to correlate with the movements of other points in the region. Temporal coherence must be acceptable for further estimation when utilizing this approach. Persistent scatterer points with a temporal coherence higher than 0.70 were regarded as satisfactory and had a lower chance of inaccuracy [34].
When using PS points to measure movement along the LOS, it was observed that motion in the opposite direction of the sensor was negative, as illustrated in red. Other steady spots inside the investigated area show substantially no movements, as shown in Figure 6. Sites with comparable considerable movement relative to the blue dots are labelled as yellow and orange colors. In the research area, the subsidence was estimated between −25 and −40 mm/yr (Figure 8). The scatter plot data showed severe subsidence in the Rawalpindi area. In contrast, the Islamabad area showed minimal ground movement. One possibility is that Rawalpindi is located on a thicker (softer) alluvium. The other possibility is that it is densely populated with more water extraction and heavy weight of densely constructed buildings.
The subsidence map obtained from both descending (path 107) and ascending (path 173) pathways indicated a substantial number of persistent scatterer sites in the analyzed area over the analysis period (Figure 9). The rectangular part of ascending and descending scatter plots is positioned on google earth in the investigated area. Figure 8 demonstrates dense cloud spots in the research area; the results in both the ascending and descending directions reveal that most places are steady (marked in blue), predominantly uplands or mountains. While the primary population places along the main route are displayed in red, there is a severe subsidence zone. The color ramp indicates the movement and relative stability of the persistent scatterer points (red = severe, light blue = stable, yellow/green = minimal).
The finalized subsidence map was obtained from 2019 and 2020 to investigate subsidence in the study area yearly to evaluate the subsidence rate of different PS sites over the research time interval (Figure 10). As illustrated in Figure 10, a huge fluctuation was found in the subsidence values from 2019 to 2020; the subsidence value in 2019 ranged from −69.33 to 77.1 mm/yr, while the subsidence value in 2020 ranged from −98.56 to 36.7 mm/yr.
Five PS spots (a, b, c, d, and e) from the subsidence zone were selected from the research area’s ascending and descending findings (Figure 11). In this scenario, the PS points indicate the relative displacement and stability (red = severe, blue = stable, yellow = minimal) compared with the surroundings. Subsidence analyses and these five PS positions are shown in Figure 12.
Red dots indicate the subsidence zone, as shown in Figure 11. The acquired data reveal that ground deformation varies from point to point over the research duration. Figure 12 illustrates the deformation along with PS spots b, c, and d, which are in the research area’s North to South section of the investigated area, where subsidence reached −85.6, −98.5, and −128.8 mm/yr, respectively. While PS points “a” and “e” are in the North-Western and South-Eastern part of the research area, where subsidence attained −92.3 mm/yr (PS point “a”) and −101.3 mm/yr (PS point “e”), accordingly, during the study interval. According to the evidence, subsidence was considerably higher in the southern region of the study area, whereas it was lower in the northern part of the research area.
The subsidence along these five persistent scatterer points was examined, and the final outcomes indicate a huge number of subsidence fluctuations from January 2019 to June 2021. Figure 11 demonstrates the visual illustrations of these five points. The graphs show that points “d” and “e” have more subsidence values and are situated in the southern part of the study zone, whereas points a, b, and c have slightly lower subsidence values as compared with the southernmost part of the research area, as noted during this study.
A white line was constructed from North-West to South-East and North to South to investigate the subsidence profile in the study area (Figure 13). The graph in Figure 14a,b shows that subsidence is very severe in the southernmost parts of the research area. In contrast, on the northernmost side of the research area, the subsidence is very minimal. The areas that experienced severe subsidence are the (Raja Bazar, Waris Khan Metro Station, Rahmanabad Metro Station, Sadiqabad, Shah Sultan, Benazir Bhutto Hospital, and Muslim town areas). This investigation demonstrates that subsidence is noticeable in the southernmost region of the study area from January 2019 to June 2021.
The white line in Figure 13 depicts the North-West to South-East subsidence profile. In contrast, Figure 14a depicts the North-West to South-East subsidence profile’s variation graph (x-axis indicates PS points, y-axis indicates subsidence).
Similarly, a white line (Figure 13) depicts the North to South subsidence profile to investigate the research area’s North to South subsidence behavior. This subsidence profile indicates that subsidence was overwhelmingly increasing from North to South, while Figure 14b depicts the North to South subsidence profile’s variation graph (x-axis indicates PS points, y-axis indicates subsidence).

5. Discussion

According to the findings of this research, various causes contribute to and are explainable for land subsidence in the Rawalpindi-Islamabad area. These include extensive overexploitation to meet human demands and loss of soil during wet seasons, and natural consolidation of quaternary alluvium, along with uncontrolled building development. A brief description is provided in the following subsections.

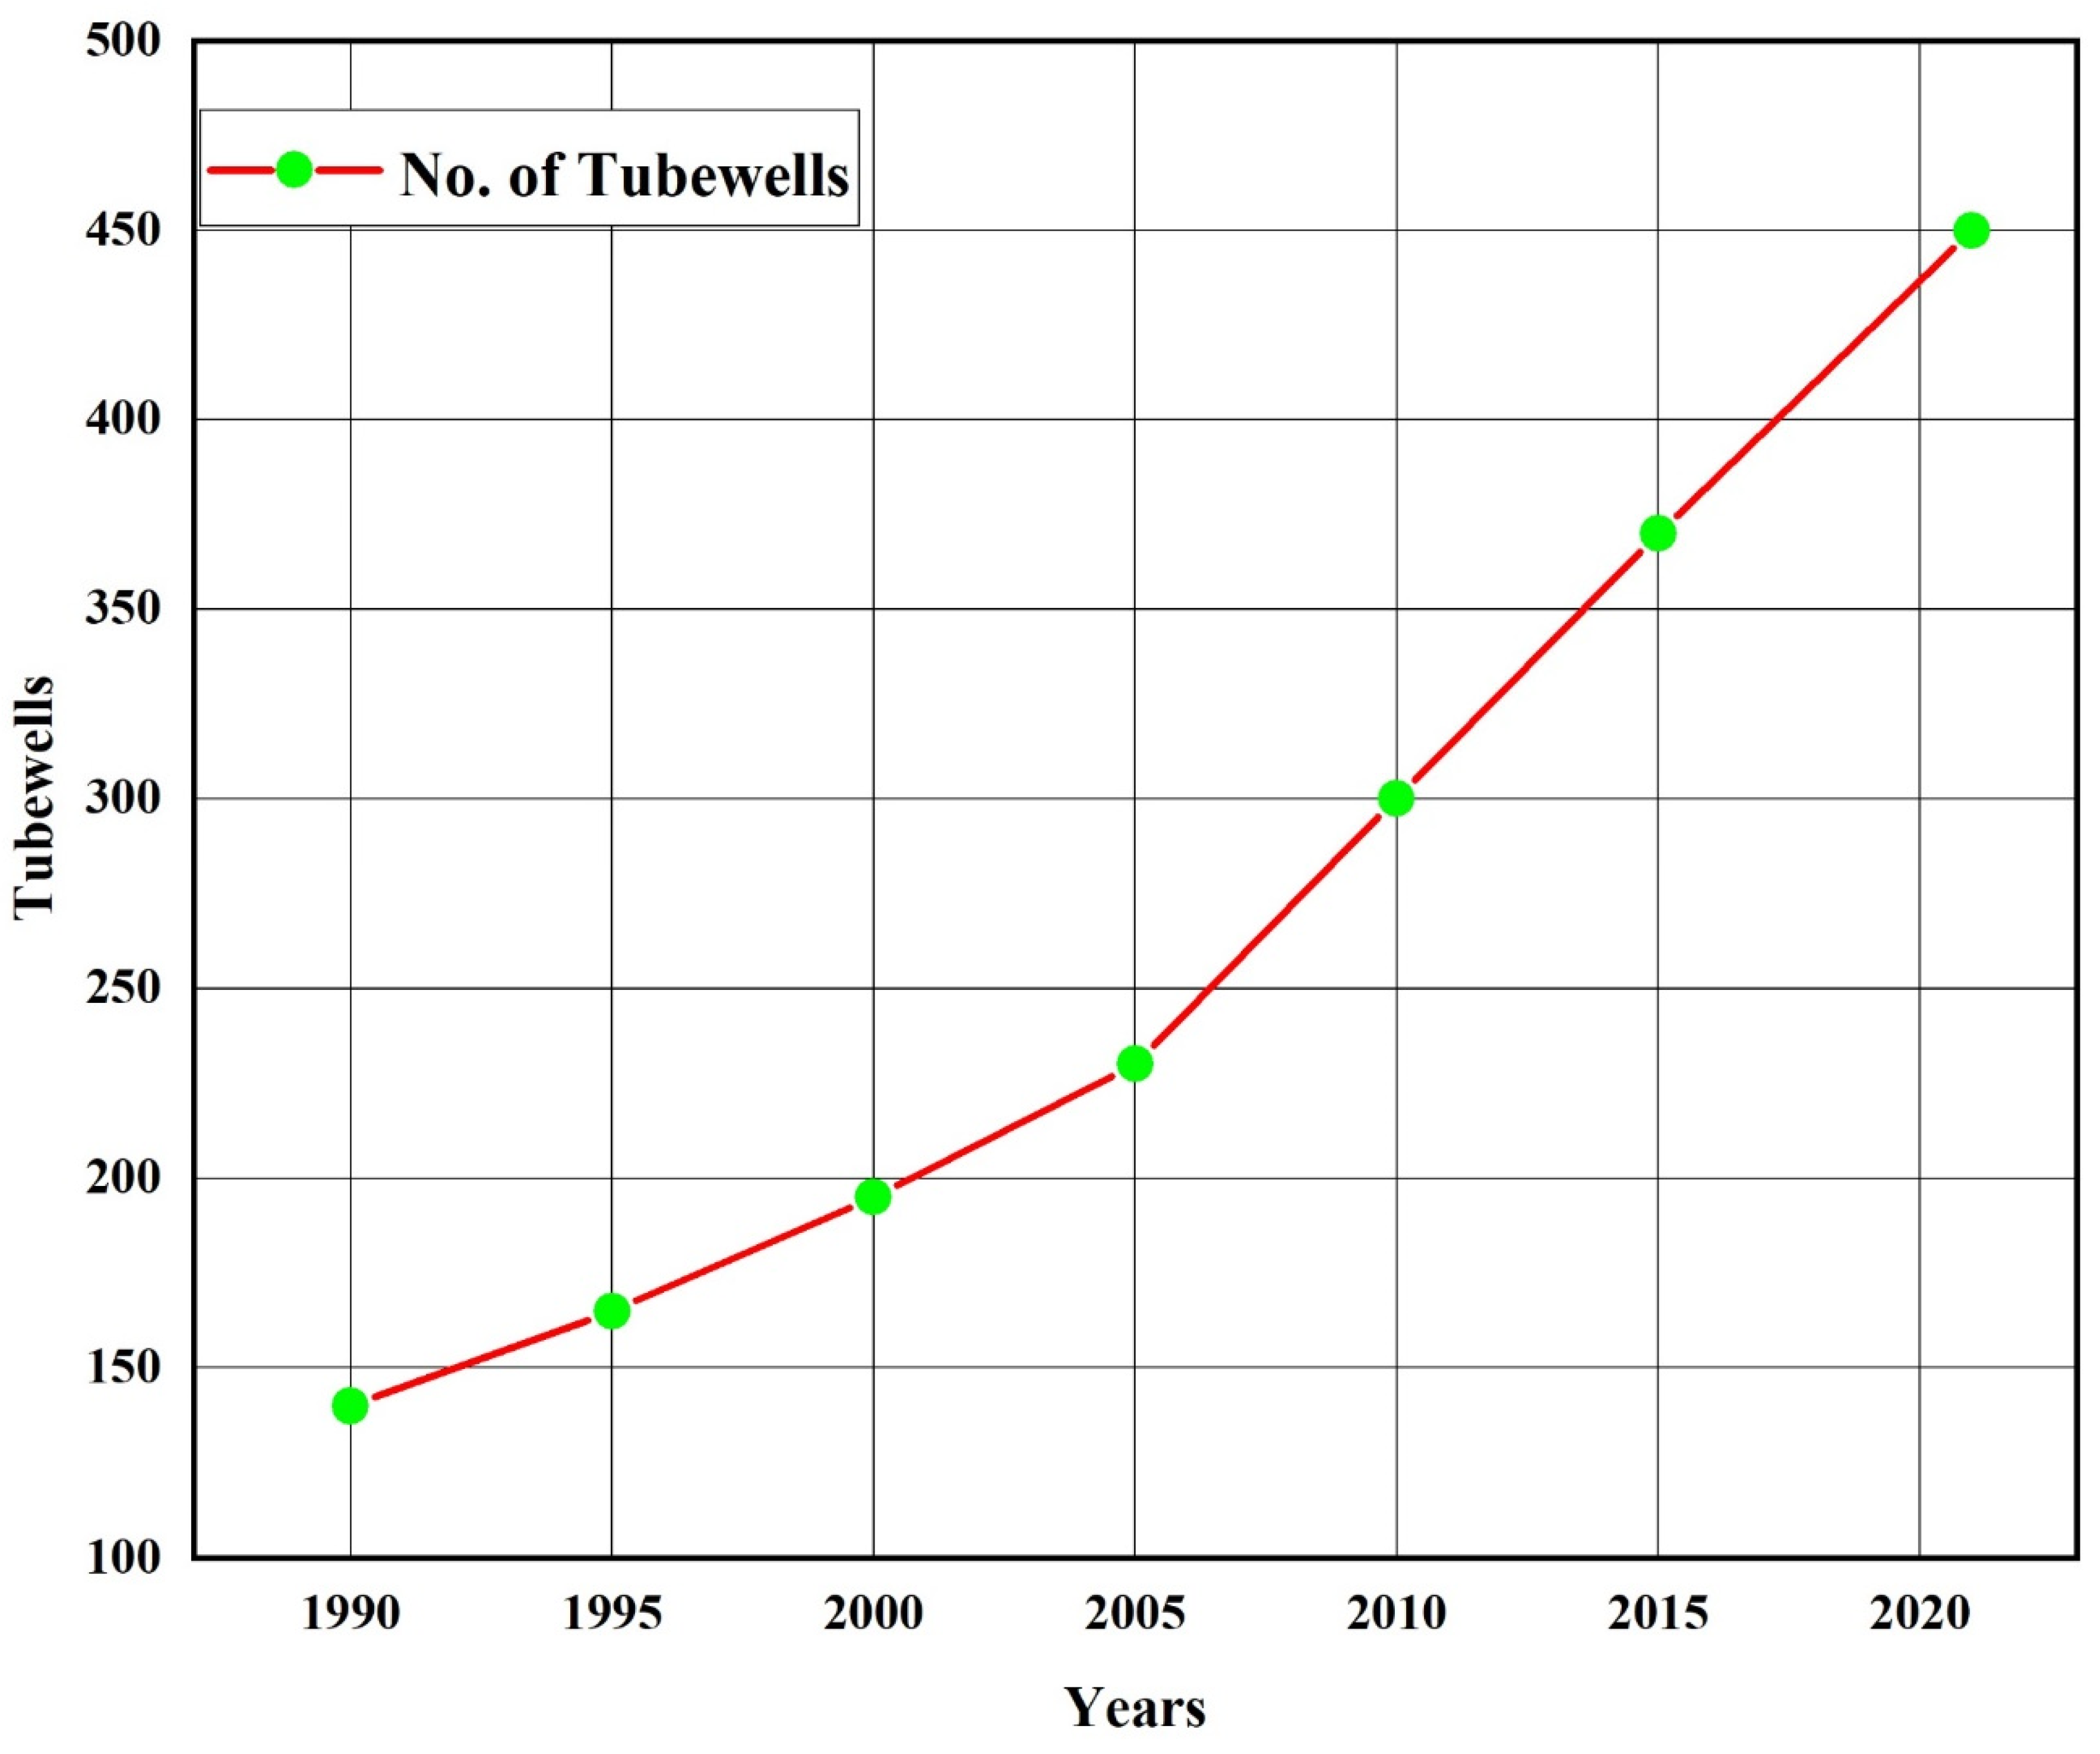
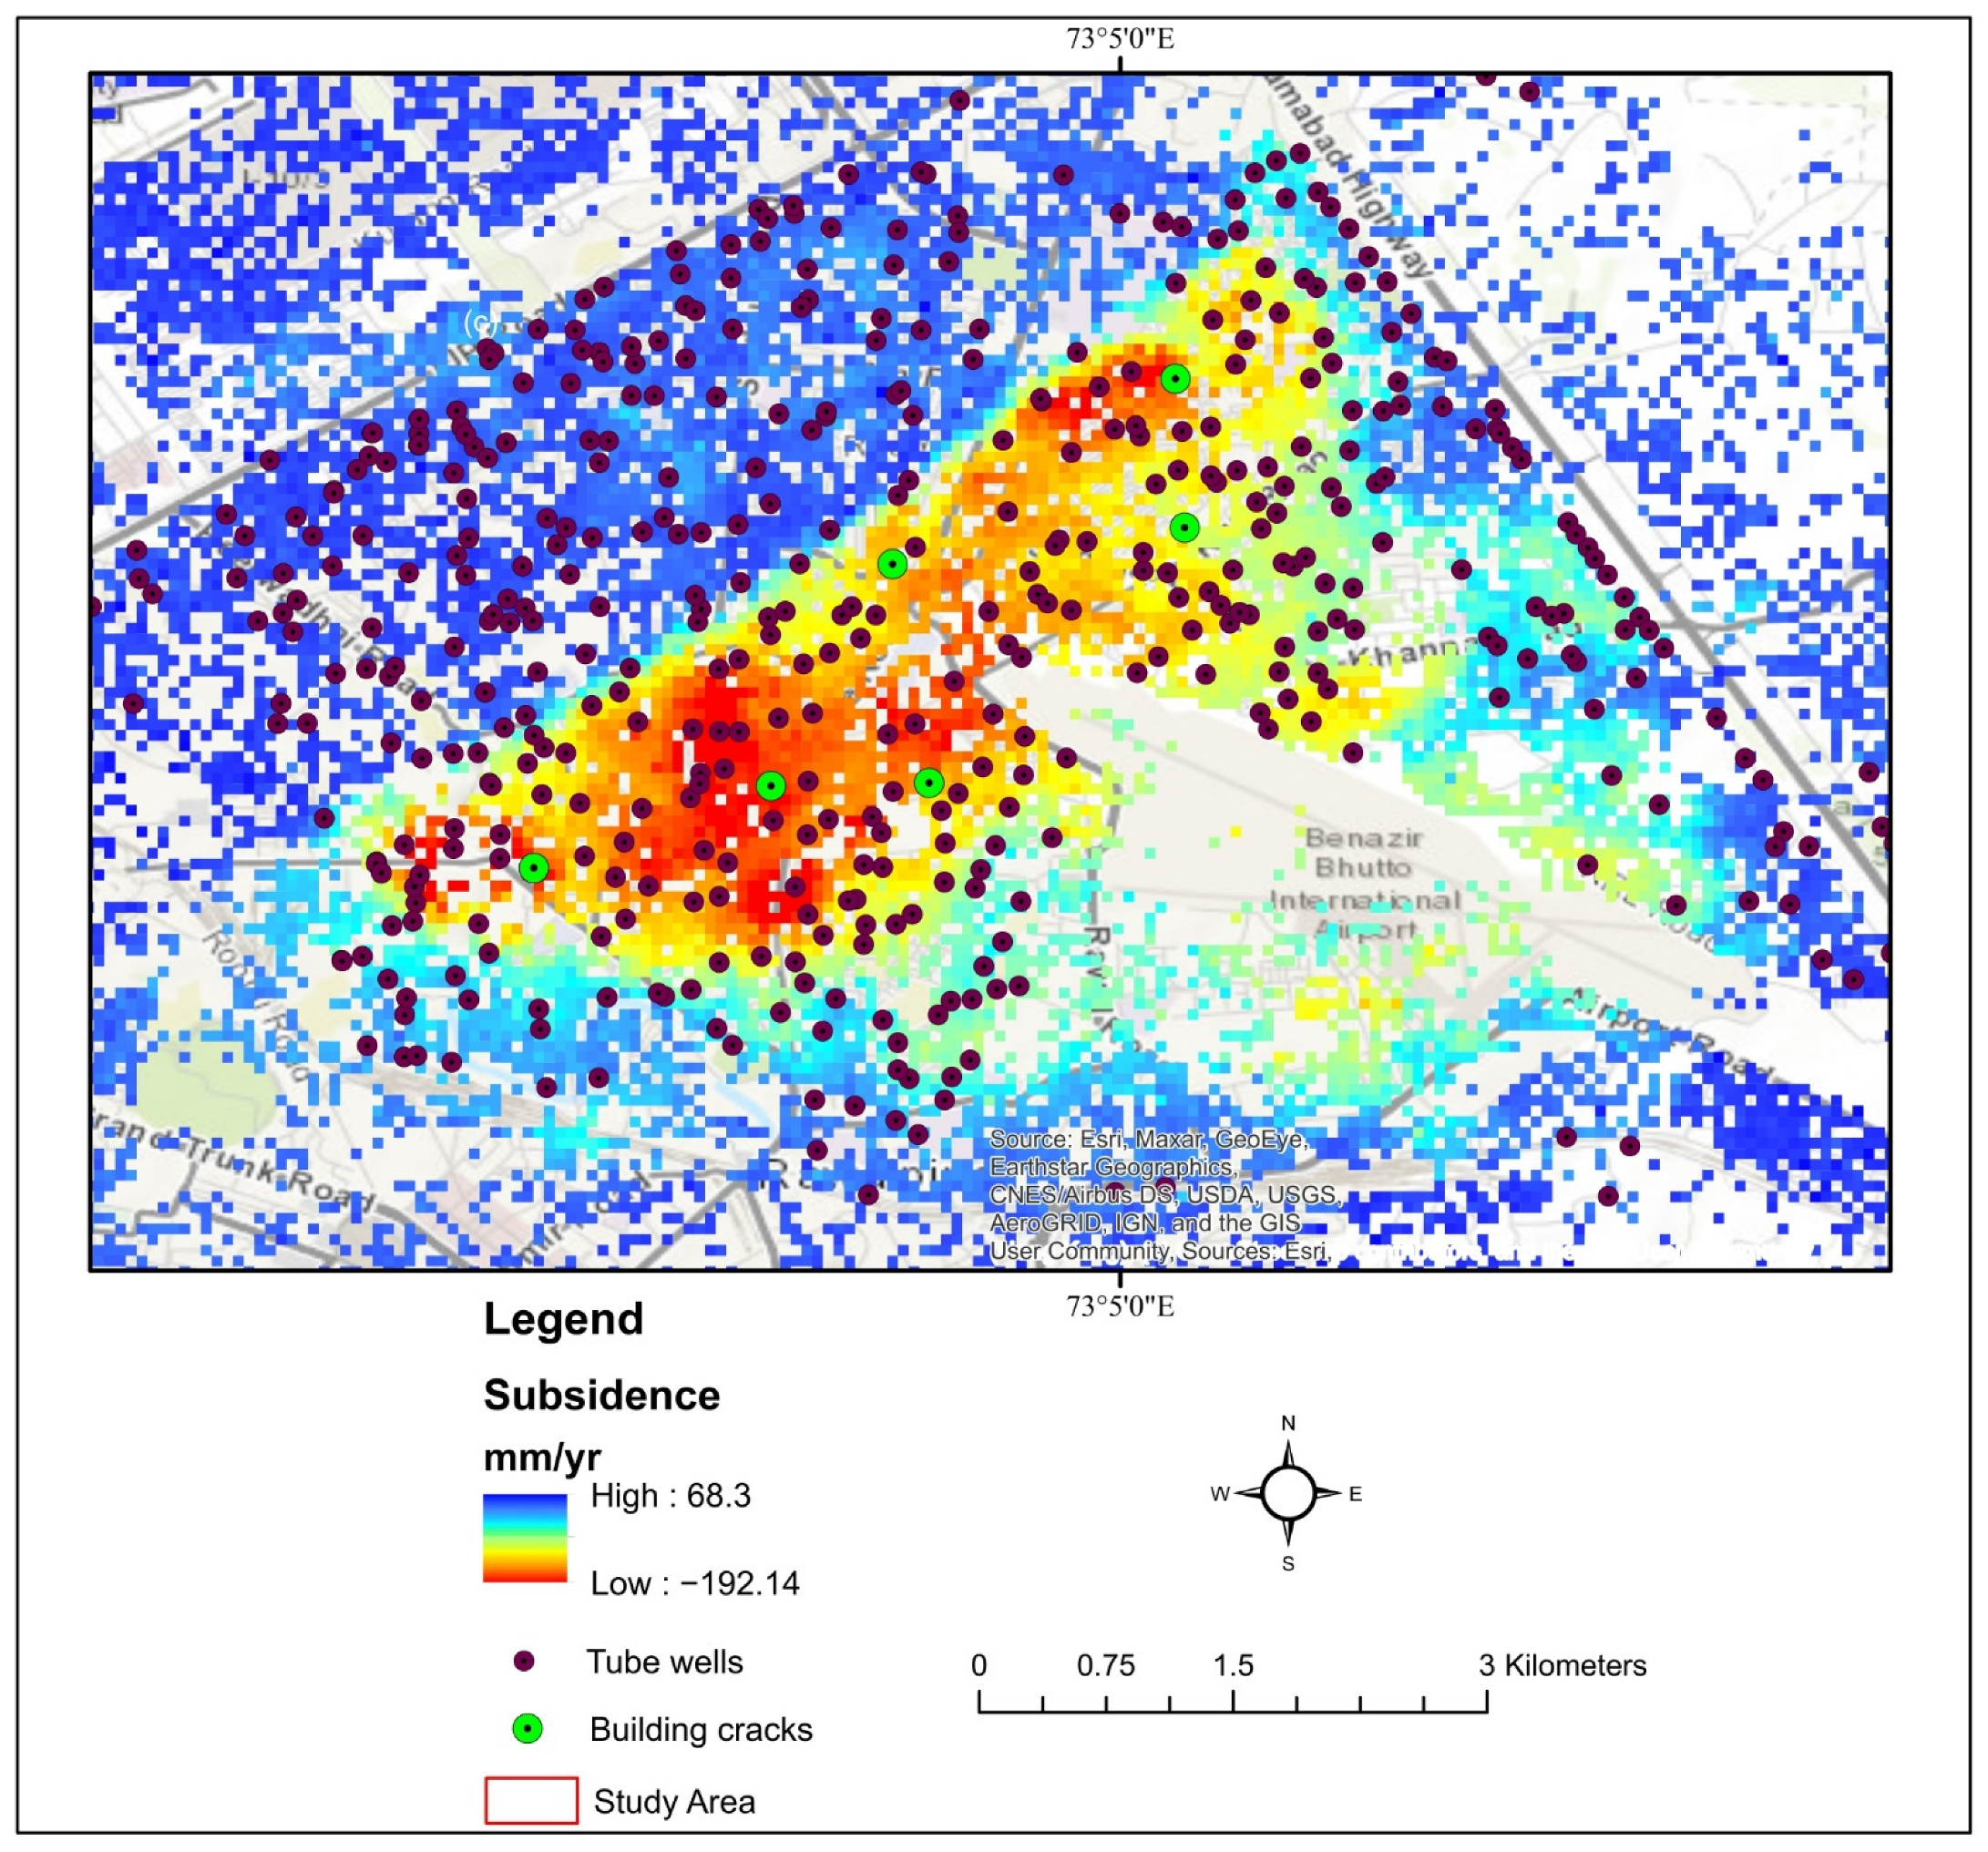
5.1. Uncontrolled Groundwater Extraction

Groundwater is a crucial freshwater resource for the country’s long-term viability. Its consumption varies from home to industry across every area of the economy, making it a vital resource [64]. Overexploitation of groundwater is the principal reason for subsidence, as described in [65,66,67,68,69], linked with geology (soft clay soil) in [65,68,69]. Seasonal effects have been reported in [69,70], which might be associated with hydrogeological variables and groundwater level fluctuations. The overwhelming groundwater usage for household and commercial aims is one of the potential elements that cause subsidence in the studied area. Earlier investigations revealed that overwhelming groundwater extraction is the main reason for surface deformation [71,72,73,74,75,76,77]. Pakistan has a water shortage. Therefore, tube-wells and bore-wells are the major sources of daily water utilization for residents [78]. There has been a significant rise in water consumption in main cities [59] as a result of uncontrolled and unplanned settlement growth. To satisfy their needs, the majority of homes have constructed a bore-well.
Rawalpindi (Twin City of Federal Capital, Islamabad) primarily depends on groundwater, accessed by more than 450 tube-wells (Water and Sanitation Agency, Rawalpindi: https://wasarwp.punjab.gov.pk/ (accessed on 20 April 2021)) (Figure 15), out of which over 100 tube-wells produce biologically polluted water. The subsidence fluctuation graph in Figure 14a,b shows that surface subsidence is more common in the southern region of the research area due to overpopulation, and one likely explanation is the existence of tube-wells. The tube-well location map in Figure 16 illustrates that the southern part of our research area has experienced more subsidence since having more tube-wells result in excessive land subsidence.
In Figure 17a–f, several places are represented in the research region displaying fractures in the walls of local buildings. Cracks discovered in local buildings indicate that the research area witnessed subsidence.

5.2. Water Table Depletion in the Study Area

The combination of urbanization and population expansion can be a major factor driving greater groundwater demand and consumption [79]. Demand for freshwater has grown rapidly in recent decades due to fast population growth and industrialization, resulting in groundwater depletion, particularly in developing nations and metropolitan areas [80]. According to [81], declining water levels can cause many other issues, such as seawater intrusion, ground subsidence, effects on surface water bodies, quality deterioration, etc.
Rawalpindi is Pakistan’s fourth-largest metropolis, and the city’s urbanized area is growing as the population grows. Over a period of three decades (1991–2017), the urban area grew by a whopping 37.89% [82]. Due to poor management, urban migration, and rapid population expansion in the investigated area, the gap between water requirement and supply is expanding daily (Table 2). A persistent decline in groundwater levels was noticed in the study area as a result of excessive water extraction. People are extracting the groundwater to a large extent, resulting in a significant decrease in our study area’s yearly groundwater table, which has fallen from 10 to 73 m in the last two decades. According to [50], groundwater levels dropped by 10–14 m between 1998 and 2003 and 5 m between 2003 and 2007. While from 2017 to 2021, the groundwater level dropped significantly from 58 to 73 m (Water and Sanitation Agency, Rawalpindi). The population increased from 1.8 to 2.3 million with an increasing rate of 1.97% in the last 10 years, as shown in Figure 18.

5.3. Geological Considerations

Soil consolidating properties have been discovered as a major source of subsidence around the globe [73]. It was discovered that a large portion of the Rawalpindi-Islamabad area was found to be built upon quaternary alluvium deposits [83]. The alluvium is mainly composed of unconsolidated conglomerates, clay, sand, silt, loess, and gravel deposits [83]. The study area includes houses of many academic and research institutions, large to small government buildings, military headquarters and cantonment, and other commercial and residential facilities built on the top of alluvium deposits.
On top, the study area is located in seismically active regions where earthquakes, faulting, and folding have been common in the recent geologic history [41], due to its proximity to the Main Boundary Thrust (MBT) in the North and the Salt Range Thrust (SRT) in the South, where earthquakes have been recorded [83]. All across the map region, quaternary sediments have undergone tectonic deformation [41].
Historical seismic activity statistics indicate that earthquakes with intensity ranging from VII to VIII on the Modified Mercalli Intensity (MMI) scale have repeatedly been felt in Rawalpindi-Islamabad [83]. The largest earthquakes documented near the study area are the 25AD Taxila earthquake with a maximum estimated intensity of IX on the (MMI) [84]; the 1974 Pattan earthquake with an estimated intensity of VIII on the MMI scale [85,86]; and the 1977 Rawalpindi earthquake with an estimated intensity of VII on the (MMI) [87]. Furthermore, the study area experienced a massive earthquake with a magnitude of (Ms 7.6) in 2005, which was caused by a portion of (MBT) regional boundary fault in the Kashmir area northeast of Islamabad [88,89,90]. It is worthwhile to mention that during the 2005 earthquake, the Rawalpindi-Islamabad area suffered significant structural damage, including the collapse of a massive 16-story apartment complex (Margala Tower), which led to the death of over 70 civilians (https://tribune.com.pk/story/269546/earthquake-2005-faulty-towers-cursed-by-nature-haunted-byapathy (accessed on 15 May 2021)). Another significant fault, known as the Riwat Thrust, runs near the southwest corner of the study area [91]. Along this fault, the most recent earthquake on 24 July 2015 was recorded with the epicentral location of 33.8840°N, 73.2250°E with a magnitude of 5.1 km and a 19-km focal depth. Additionally, 2–3 cm of ground displacement was observed in the direction of fault lines. Moreover, Riwat Fault is an active fault in the regime which is a part of the Jhelum Fault, and can cause further ground deformation in the study area.
The photographs in Figure 19 were taken at different intervals throughout the rainy season and showed flooding in different places adjacent to the research area.
Furthermore, the relationship between precipitation and subsidence has been demonstrated in [92]; extreme precipitation, on the other hand, disrupts the balance of underground aquifers. Subsidence may be influenced by this large quantity of rainfall and other contributory factors. The climate of Rawalpindi is relatively similar to its twin city, Islamabad. The monsoon rains typically begin in June, reach their maximum peak in August, and stop toward the end of September [41]. The highest recorded rainfall in 2013 was 1988 mm (78.3 in), primarily due to an extremely wet monsoon season.
Figure 20 shows the persistent scatterer points overlaid on a geological map of the research area. It indicates that places with significant subsidence are covered with clay [41] deposits. Structures on other deposits appeared to be substantially more stable. The red area, in this scenario, highlights the subsidence zone, which is clear in the quaternary alluvium deposits. The research area had adequate scatterers to determine ground subsidence.

5.4. Uncertainties and Gaps

Several anthropogenic and natural processes contribute to ground subsidence at various spatiotemporal scales [36]. Nevertheless, determining the significance of each element requires many sources of in situ data, which were not accessible for this approach. We only looked at subsurface deposit types and discovered an interesting association between them and higher surface deforming zones.
Identifying validation pairings was challenging due to the PS-InSAR’s analysis insufficient spatial resolution. As a result, it was unclear which section of a building was the primary reflector. Additionally, the PS points were georeferenced to the earth’s surface, yet buildings are three-dimensional, and satellites observe the globe from the sides. These considerations must be considered while examining the PS points upon the buildings. The geocoding of the SAR data sets was also a source of uncertainty due to the relatively poor spatial resolution of C-band Sentinel-1 data.
However, despite these uncertainties, our results accurately identified subsidence events in the study area by validating our results with groundwater level data, soil consolidation, subsurface geology, and past seismic activity in the research area. Although, it can be significantly improved using other alternative methodologies, such as Stable Points Network (SPN), Quasi-PS, and SBAS techniques with precise levelling in the research area. Finally, well log data and geotechnical investigation will be necessary to calculate a more precise subsidence rate in the future.

6. Conclusions

The present study concludes that PS-InSAR is a very reliable and efficient technique for tracking urban structure failure, land subsidence, landslides, and other phenomena. In the current study, we take a look at land subsidence in the Rawalpindi-Islamabad region from January 2019 to June 2021, demonstrating the ability of PS-InSAR to detect time-series subsidence. Groundwater removal on a large scale, and other issues have been investigated. The deformation map in the research area indicates that the area is experiencing severe ground subsidence. The results also suggest that subsidence is increasing substantially in the southernmost part of the research area compared with the considerably lower northern and western parts of the study area.
In the research area, the cumulative deformation varies from −192.14 to 68.29 mm/yr. The subsidence was −69 mm/yr in 2019, while in 2020, it reached −98 mm/yr. The results show a significant increase in subsidence from 2019 to 2020. There are several clear causes for this, the most evident of which is the rapid population growth that has occurred in recent years, along with groundwater removal due to the increasing demand for use in industrial and domestic sectors.
Moreover, unlawful construction loads, drainage systems, and subsurface geology with insufficient outflow are important causes of land subsidence in the examined location. Furthermore, multi-scale studies are suggested to be conducted to thoroughly investigate land subsidence in the future and avoid significant damage in the area.

Author Contributions

Conceptualization, J.K.; methodology, J.K.; software, J.K.; validation, M.A.H.; formal analysis, M.A.H.; investigation, M.Q.J.; resources, X.R.; data curation, M.A.H.; writing—original draft preparation, J.K.; writing—review and editing, M.Q.J.; visualization, X.R.; supervision, X.R.; project administration, X.R.; funding acquisition, X.R. All authors have read and agreed to the published version of the manuscript.

Funding

Support for this research was provided by Major International (Regional) Joint Research Project of the NSFC (42020104006).

Data Availability Statement

The data presented in the study are available on request from the first and corresponding author. The data are not publicly available due to the thesis that is being prepared from these data.

Conflicts of Interest

The authors declare no conflict of interest.

References

  1. Bianchini, S.; Moretti, S. Analysis of recent ground subsidence in the Sibari plain (Italy) by means of satellite SAR interferometry-based methods. Int. J. Remote Sens. 2015, 36, 4550–4569. [Google Scholar] [CrossRef]
  2. Du, Z.; Ge, L.; Ng, A.H.-M.; Zhu, Q.; Yang, X.; Li, L. Correlating the subsidence pattern and land use in Bandung, Indonesia with both Sentinel-1/2 and ALOS-2 satellite images. Int. J. Appl. Earth Obs. Geoinf. 2018, 67, 54–68. [Google Scholar] [CrossRef]
  3. Deng, Z.; Ke, Y.; Gong, H.; Li, X.; Li, Z. Land subsidence prediction in Beijing based on PS-InSAR technique and improved Grey-Markov model. GIScience Remote Sens. 2017, 54, 797–818. [Google Scholar] [CrossRef]
  4. Erkens, G.; Sutanudjaja, E. Towards a global land subsidence map. Proc. Int. Assoc. Hydrol. Sci. 2015, 372, 83–87. [Google Scholar] [CrossRef] [Green Version]
  5. Castellazzi, P.; Arroyo-Domínguez, N.; Martel, R.; Calderhead, A.I.; Normand, J.C.; Gárfias, J.; Rivera, A. Land subsidence in major cities of Central Mexico: Interpreting InSAR-derived land subsidence mapping with hydrogeological data. Int. J. Appl. Earth Obs. Geoinf. 2016, 47, 102–111. [Google Scholar] [CrossRef]
  6. Chen, G.; Zhang, Y.; Zeng, R.; Yang, Z.; Chen, X.; Zhao, F.; Meng, X. Detection of land subsidence associated with land creation and rapid urbanization in the chinese loess plateau using time series insar: A case study of Lanzhou new district. Remote Sens. 2018, 10, 270. [Google Scholar] [CrossRef] [Green Version]
  7. Yang, Q.; Ke, Y.; Zhang, D.; Chen, B.; Gong, H.; Lv, M.; Zhu, L.; Li, X. Multi-scale analysis of the relationship between land subsidence and buildings: A case study in an eastern Beijing Urban Area using the PS-InSAR technique. Remote Sens. 2018, 10, 1006. [Google Scholar] [CrossRef] [Green Version]
  8. Stanley, J.-D. Growth faults, a distinct carbonate-siliciclastic interface and recent coastal evolution, NW Nile Delta, Egypt. J. Coast. Res. 2005, 309–318. [Google Scholar]
  9. Hussain, M.A.; Chen, Z.; Wang, R.; Shoaib, M. PS-InSAR-Based Validated Landslide Susceptibility Mapping along Karakorum Highway, Pakistan. Remote Sens. 2021, 13, 4129. [Google Scholar] [CrossRef]
  10. Xu, Y.-S.; Shen, S.-L.; Ren, D.-J.; Wu, H.-N. Analysis of factors in land subsidence in Shanghai: A view based on a strategic environmental assessment. Sustainability 2016, 8, 573. [Google Scholar] [CrossRef] [Green Version]
  11. Tosi, L.; Teatini, P.; Strozzi, T. Natural versus anthropogenic subsidence of Venice. Sci. Rep. 2013, 3, 2710. [Google Scholar] [CrossRef] [PubMed] [Green Version]
  12. Arangio, S.; Calò, F.; Di Mauro, M.; Bonano, M.; Marsella, M.; Manunta, M. An application of the SBAS-DInSAR technique for the assessment of structural damage in the city of Rome. Struct. Infrastruct. Eng. 2014, 10, 1469–1483. [Google Scholar] [CrossRef]
  13. Shahzad, N.; Ding, X.; Wu, S.; Liang, H. Ground deformation and its causes in abbottabad city, pakistan from sentinel-1a data and mt-insar. Remote Sens. 2020, 12, 3442. [Google Scholar] [CrossRef]
  14. Yu, X.; Hu, J.; Sun, Q. Estimating actual 2D ground deformations induced by underground activities with cross-heading InSAR measurements. J. Sens. 2017, 2017, 3170506. [Google Scholar] [CrossRef] [Green Version]
  15. Luo, Q.; Perissin, D.; Lin, H.; Zhang, Y.; Wang, W. Subsidence monitoring of Tianjin suburbs by TerraSAR-X persistent scatterers interferometry. IEEE J. Sel. Top. Appl. Earth Obs. Remote Sens. 2013, 7, 1642–1650. [Google Scholar] [CrossRef]
  16. Hussain, M.A.; Chen, Z.; Zheng, Y.; Shoaib, M.; Shah, S.U.; Ali, N.; Afzal, Z. Landslide susceptibility mapping using machine learning algorithm validated by persistent scatterer In-SAR technique. Sensors 2022, 9, 3119. [Google Scholar] [CrossRef]
  17. Hilley, G.E.; Burgmann, R.; Ferretti, A.; Novali, F.; Rocca, F. Dynamics of slow-moving landslides from permanent scatterer analysis. Science 2004, 304, 1952–1955. [Google Scholar] [CrossRef] [PubMed] [Green Version]
  18. Gahalaut, V.K. Coulomb stress change due to 2005 Kashmir earthquake and implications for future seismic hazards. J. Seismol. 2009, 13, 379–386. [Google Scholar] [CrossRef]
  19. Prati, C.; Ferretti, A.; Perissin, D. Recent advances on surface ground deformation measurement by means of repeated space-borne SAR observations. J. Geodyn. 2010, 49, 161–170. [Google Scholar] [CrossRef] [Green Version]
  20. Bürgmann, R.; Rosen, P.A.; Fielding, E.J. Synthetic aperture radar interferometry to measure Earth’s surface topography and its deformation. Annu. Rev. Earth Planet. Sci. 2000, 28, 169–209. [Google Scholar] [CrossRef]
  21. Lanari, R.; Casu, F.; Manzo, M.; Zeni, G.; Berardino, P.; Manunta, M.; Pepe, A. An Overview of the Small BAseline Subset Algorithm: A DInSAR Technique for Surface Deformation Analysis. In Deformation and Gravity Change: Indicators of Isostasy, Tectonics, Volcanism, and Climate Change; Wolf, D., Fernández, J., Eds.; Pageoph Topical Volumes; Birkhäuser: Basel, Switzerland, 2007. [Google Scholar] [CrossRef]
  22. Cigna, F.; Tapete, D. Sentinel-1 big data processing with P-SBAS InSAR in the geohazards exploitation platform: An experiment on coastal land subsidence and landslides in Italy. Remote Sens. 2021, 13, 885. [Google Scholar] [CrossRef]
  23. Kampes, B.; Adam, N. The STUN algorithm for persistent scatterer interferometry. Proc. FRINGE 2005, SP-610, 1–14. [Google Scholar]
  24. Ferretti, A.; Prati, C.; Rocca, F. Permanent scatterers in SAR interferometry. IEEE Trans. Geosci. Remote Sens. 2001, 39, 8–20. [Google Scholar] [CrossRef]
  25. Zhang, Y.; Zhang, J.; Wu, H.; Lu, Z.; Guangtong, S. Monitoring of urban subsidence with SAR interferometric point target analysis: A case study in Suzhou, China. Int. J. Appl. Earth Obs. Geoinf. 2011, 13, 812–818. [Google Scholar] [CrossRef]
  26. Gabriel, A.K.; Goldstein, R.M.; Zebker, H.A. Mapping small elevation changes over large areas: Differential radar interferometry. J. Geophys. Res. Solid Earth 1989, 94, 9183–9191. [Google Scholar] [CrossRef]
  27. Li, Z.; Elliott, J.R.; Feng, W.; Jackson, J.A.; Parsons, B.E.; Walters, R.J. The 2010 MW 6.8 Yushu (Qinghai, China) earthquake: Constraints provided by InSAR and body wave seismology. J. Geophys. Res. Solid Earth 2011, 116. [Google Scholar] [CrossRef] [Green Version]
  28. Schlögel, R.; Doubre, C.; Malet, J.-P.; Masson, F. Landslide deformation monitoring with ALOS/PALSAR imagery: A D-InSAR geomorphological interpretation method. Geomorphology 2015, 231, 314–330. [Google Scholar] [CrossRef]
  29. Zhao, C.; Lu, Z.; Zhang, Q.; de La Fuente, J. Large-area landslide detection and monitoring with ALOS/PALSAR imagery data over Northern California and Southern Oregon, USA. Remote Sens. Environ. 2012, 124, 348–359. [Google Scholar] [CrossRef]
  30. Raucoules, D.; Le Mouélic, S.; Carnec, C.; Maisons, C.; King, C. Urban subsidence in the city of Prato (Italy) monitored by satellite radar interferometry. Int. J. Remote Sens. 2003, 24, 891–897. [Google Scholar] [CrossRef]
  31. Necsoiu, M.; Hooper, D.M. Use of Emerging InSAR and LiDAR Remote Sensing Technologies to Anticipate and Monitor Critical Natural Hazards. In Building Safer Communities. Risk Governance, Spatial Planning and Responses to Natural Hazards; Fra Paleo, U., Ed.; IOS Press: Amsterdam, The Netherlands, 2009; pp. 246–267. [Google Scholar]
  32. Ma, J.; Xia, D.; Guo, H.; Wang, Y.; Niu, X.; Liu, Z.; Jiang, S. Metaheuristic-based support vector regression for landslide displacement prediction: A comparative study. Landslides 2022, 19, 1–23. [Google Scholar] [CrossRef]
  33. Ma, J.; Xia, D.; Wang, Y.; Niu, X.; Jiang, S.; Liu, Z.; Guo, H. A comprehensive comparison among metaheuristics (MHs) for geohazard modeling using machine learning: Insights from a case study of landslide displacement prediction. Eng. Appl. Artif. Intell. 2022, 114, 105150. [Google Scholar] [CrossRef]
  34. Beladam, O.; Balz, T.; Mohamadi, B.; Abdalhak, M. Using ps-insar with sentinel-1 images for deformation monitoring in northeast Algeria. Geosciences 2019, 9, 315. [Google Scholar] [CrossRef] [Green Version]
  35. Gao, M.; Gong, H.; Chen, B.; Zhou, C.; Chen, W.; Liang, Y.; Shi, M.; Si, Y. InSAR time-series investigation of long-term ground displacement at Beijing Capital International Airport, China. Tectonophysics 2016, 691, 271–281. [Google Scholar] [CrossRef]
  36. Milillo, P.; Giardina, G.; DeJong, M.J.; Perissin, D.; Milillo, G. Multi-temporal InSAR structural damage assessment: The London crossrail case study. Remote Sens. 2018, 10, 287. [Google Scholar] [CrossRef] [Green Version]
  37. Khorrami, M.; Alizadeh, B.; Ghasemi Tousi, E.; Shakerian, M.; Maghsoudi, Y.; Rahgozar, P. How groundwater level fluctuations and geotechnical properties lead to asymmetric subsidence: A PSInSAR analysis of land deformation over a transit corridor in the Los Angeles metropolitan area. Remote Sens. 2019, 11, 377. [Google Scholar] [CrossRef] [Green Version]
  38. Khorrami, M.; Abrishami, S.; Maghsoudi, Y.; Alizadeh, B.; Perissin, D. Extreme subsidence in a populated city (Mashhad) detected by PSInSAR considering groundwater withdrawal and geotechnical properties. Sci. Rep. 2020, 10, 11357. [Google Scholar] [CrossRef]
  39. Cian, F.; Blasco, J.M.D.; Carrera, L. Sentinel-1 for monitoring land subsidence of coastal cities in Africa using PSInSAR: A methodology based on the integration of SNAP and StaMPS. Geosciences 2019, 9, 124. [Google Scholar] [CrossRef] [Green Version]
  40. Mateos, R.M.; Ezquerro, P.; Luque-Espinar, J.A.; Béjar-Pizarro, M.; Notti, D.; Azañón, J.M.; Montserrat, O.; Herrera, G.; Fernández-Chacón, F.; Peinado, T. Multiband PSInSAR and long-period monitoring of land subsidence in a strategic detrital aquifer (Vega de Granada, SE Spain): An approach to support management decisions. J. Hydrol. 2017, 553, 71–87. [Google Scholar] [CrossRef]
  41. Sheikh, I.M.; Pasha, M.K.; Williams, V.S.; Raza, S.Q.; Khan, K.S.A. Environmental Geology of the Islamabad-Rawalpindi Area, Northern Pakistan; U.S. Department of the Interior, U.S. Geological Survey: Washington, DC, USA, 2007; Volume 1, p. 2078.
  42. Zafar, R.; Bashir, S.; Nabi, D.; Arshad, M. Occurrence and quantification of prevalent antibiotics in wastewater samples from Rawalpindi and Islamabad, Pakistan. Sci. Total Environ. 2021, 764, 142596. [Google Scholar] [CrossRef] [PubMed]
  43. Crosetto, M.; Monserrat, O.; Devanthéry, N.; Cuevas González, M.; Barra, A.; Crippa, B. Persistent scatterer interferometry using Sentinel-1 data. In Proceedings of the International Archives of the Photogrammetry, Remote Sensing and Spatial Information Sciences Congress (ISPRS), Nice, France, 12–19 July 2016; pp. 835–839. [Google Scholar]
  44. Del Soldato, M.; Farolfi, G.; Rosi, A.; Raspini, F.; Casagli, N. Subsidence evolution of the Firenze–Prato–Pistoia plain (Central Italy) combining PSI and GNSS data. Remote Sens. 2018, 10, 1146. [Google Scholar] [CrossRef] [Green Version]
  45. Roccheggiani, M.; Piacentini, D.; Tirincanti, E.; Perissin, D.; Menichetti, M. Detection and monitoring of tunneling induced ground movements using Sentinel-1 SAR interferometry. Remote Sens. 2019, 11, 639. [Google Scholar] [CrossRef] [Green Version]
  46. Ruiz-Armenteros, A.M.; Lazecky, M.; Hlaváčová, I.; Bakoň, M.; Delgado, J.M.; Sousa, J.J.; Lamas-Fernández, F.; Marchamalo, M.; Caro-Cuenca, M.; Papco, J. Deformation monitoring of dam infrastructures via spaceborne MT-InSAR. The case of La Viñuela (Málaga, southern Spain). Procedia Comput. Sci. 2018, 138, 346–353. [Google Scholar] [CrossRef]
  47. Huang, Q.; Crosetto, M.; Monserrat, O.; Crippa, B. Displacement monitoring and modelling of a high-speed railway bridge using C-band Sentinel-1 data. ISPRS J. Photogramm. Remote Sens. 2017, 128, 204–211. [Google Scholar] [CrossRef]
  48. Borghero, C. Feasibility Study of Dam Deformation Monitoring in Northern Sweden Using Sentinel1 SAR Interferometry. Master’s Thesis, Faculty of Engineering and Sustainable Development, University of Gävle, Gävle, Sweden, 2018. [Google Scholar]
  49. Khurram, S.; Gondal, M.M.I.; Ali, S.A.; Zia, U. Cracking and Causes of Ground Displacement in Rawat Rawalpindi Pakistan (Causes and Effect Report). Int. J. Earth Sci. Knowl. Appl. 2022, 4, 19–25. [Google Scholar]
  50. Abbas, I.; Rafique, H.; Sohl, M.A.; Falak, A.; Mahmood, S.; Imran, M.; Al-Zaghayer, Y.; Al-Awadi, A.; Mahmood, A. Spatio-temporal analysis of groundwater regime within Rawalpindi Municipal Jurisdiction, Pakistan. Desalination Water Treat. 2014, 52, 1472–1483. [Google Scholar] [CrossRef]
  51. Gansser, A. Geology of the Himalayas; Wiley InterScience: New York, NY, USA, 1964. [Google Scholar]
  52. Gee, E.; Gee, D. Overview of the geology and structure of the Salt Range, with observations on related areas of northern Pakistan. Geol. Soc. Am. Spec. Pap. 1989, 232, 95–112. [Google Scholar]
  53. Khan, S.; Khan, M.A. Seismic microzonation of Islamabad–Rawalpindi metropolitan area, Pakistan. Pure Appl. Geophys. 2018, 175, 149–164. [Google Scholar] [CrossRef]
  54. Searle, M.; Khan, M.A.; Fraser, J.; Gough, S.; Jan, M.Q. The tectonic evolution of the Kohistan—Karakoram collision belt along the Karakoram Highway transect, north Pakistan. Tectonics 1999, 18, 929–949. [Google Scholar] [CrossRef] [Green Version]
  55. Mora, O.; Mallorqui, J.J.; Broquetas, A. Linear and nonlinear terrain deformation maps from a reduced set of interferometric SAR images. IEEE Trans. Geosci. Remote Sens. 2003, 41, 2243–2253. [Google Scholar] [CrossRef]
  56. Crosetto, M.; Devanthéry, N.; Cuevas-González, M.; Monserrat, O.; Crippa, B. Exploitation of the full potential of PSI data for subsidence monitoring. Proc. Int. Assoc. Hydrol. Sci. 2015, 372, 311–314. [Google Scholar] [CrossRef] [Green Version]
  57. Qin, Y.; Perissin, D. Monitoring ground subsidence in Hong Kong via spaceborne Radar: Experiments and validation. Remote Sens. 2015, 7, 10715–10736. [Google Scholar] [CrossRef] [Green Version]
  58. Ferretti, A.; Prati, C.; Rocca, F. Nonlinear subsidence rate estimation using permanent scatterers in differential SAR interferometry. IEEE Trans. Geosci. Remote Sens. 2000, 38, 2202–2212. [Google Scholar] [CrossRef] [Green Version]
  59. Hooper, A.; Bekaert, D.; Spaans, K.; Arıkan, M. Recent advances in SAR interferometry time series analysis for measuring crustal deformation. Tectonophysics 2012, 514, 1–13. [Google Scholar] [CrossRef]
  60. Hooper, A. A multi-temporal InSAR method incorporating both persistent scatterer and small baseline approaches. Geophys. Res. Lett. 2008, 35. [Google Scholar] [CrossRef] [Green Version]
  61. Fárová, K.; Jelének, J.; Kopačková-Strnadová, V.; Kycl, P. Comparing DInSAR and PSI techniques employed to Sentinel-1 data to monitor highway stability: A case study of a massive Dobkovičky landslide, Czech Republic. Remote Sens. 2019, 11, 2670. [Google Scholar] [CrossRef] [Green Version]
  62. Perissin, D. Interferometric SAR multitemporal processing: Techniques and applications. In Multitemporal Remote Sensing; Springer: Berlin/Heidelberg, Germany, 2016; pp. 145–176. [Google Scholar]
  63. Amin, G.; Shahzad, M.I.; Jaweria, S.; Zia, I. Measuring land deformation in a mega city Karachi-Pakistan with Sentinel SAR Interferometry. Geocarto Int. 2021, 1–15. [Google Scholar] [CrossRef]
  64. Qureshi, A.S.; Gill, M.A.; Sarwar, A. Sustainable groundwater management in Pakistan: Challenges and opportunities. Irrig. Drain.: J. Int. Comm. Irrig. Drain. 2010, 59, 107–116. [Google Scholar] [CrossRef]
  65. Osmanoğlu, B.; Dixon, T.H.; Wdowinski, S.; Cabral-Cano, E.; Jiang, Y. Mexico City subsidence observed with persistent scatterer InSAR. Int. J. Appl. Earth Obs. Geoinf. 2011, 13, 1–12. [Google Scholar] [CrossRef]
  66. Heleno, S.I.; Oliveira, L.G.; Henriques, M.J.; Falcão, A.P.; Lima, J.N.; Cooksley, G.; Ferretti, A.; Fonseca, A.M.; Lobo-Ferreira, J.P.; Fonseca, J.F. Persistent scatterers interferometry detects and measures ground subsidence in Lisbon. Remote Sens. Environ. 2011, 115, 2152–2167. [Google Scholar] [CrossRef] [Green Version]
  67. Zhao, Q.; Lin, H.; Jiang, L.; Chen, F.; Cheng, S. A study of ground deformation in the Guangzhou urban area with persistent scatterer interferometry. Sensors 2009, 9, 503–518. [Google Scholar] [CrossRef] [PubMed]
  68. Ge, D.; Wang, Y.; Zhang, L.; Li, M.; Guo, X. Integrating medium and high resolution psinsar data to monitor terrain motion along large scale manmade linear features-A case study in shanghai. In Proceedings of the 2013 IEEE International Geoscience and Remote Sensing Symposium-IGARSS, Melbourne, Australia, 21–26 July 2013; pp. 4034–4037. [Google Scholar]
  69. Jo, M.-J.; Won, J.-S.; Kim, S.-W. A time-series observation of ground subsidence at Ulsan area using SAR interferometry. In Proceedings of the 2011 3rd International Asia-Pacific Conference on Synthetic Aperture Radar (APSAR), Seoul, Korea, 26–30 September 2011; pp. 1–3. [Google Scholar]
  70. Wang, S.; Gong, H.; Du, Z.; Ren, Y.; Gu, Z. The response of land subsidence by over-exploitation using PSInSAR—A case study of Huairou, Beijing, China. In Proceedings of the 2011 19th International Conference on Geoinformatics, Shanghai, China, 24–26 June 2011; pp. 1–4. [Google Scholar]
  71. Khan, A.S.; Khan, S.D.; Kakar, D.M. Land subsidence and declining water resources in Quetta Valley, Pakistan. Environ. Earth Sci. 2013, 70, 2719–2727. [Google Scholar] [CrossRef]
  72. Cigna, F.; Osmanoğlu, B.; Cabral-Cano, E.; Dixon, T.H.; Ávila-Olivera, J.A.; Garduño-Monroy, V.H.; DeMets, C.; Wdowinski, S. Monitoring land subsidence and its induced geological hazard with Synthetic Aperture Radar Interferometry: A case study in Morelia, Mexico. Remote Sens. Environ. 2012, 117, 146–161. [Google Scholar] [CrossRef]
  73. Holzer, T.L.; Johnson, A.I. Land subsidence caused by ground water withdrawal in urban areas. GeoJournal 1985, 11, 245–255. [Google Scholar] [CrossRef]
  74. Abidin, H.; Gumilar, I.; Andreas, H.; Sidiq, P.; Fukuda, Y. Study on Causes and Impacts of Land Subsidence in Bandung Basin, Indonesia. In Proceedings of the FIG Working Week Bridging the Gap between Cultures, Marrakech, Morocco, 18–22 May 2011. [Google Scholar]
  75. Huang, J.; Khan, S.D.; Ghulam, A.; Crupa, W.; Abir, I.A.; Khan, A.S.; Kakar, D.M.; Kasi, A.; Kakar, N. Study of subsidence and earthquake swarms in the Western Pakistan. Remote Sens. 2016, 8, 956. [Google Scholar] [CrossRef] [Green Version]
  76. Castellazzi, P.; Longuevergne, L.; Martel, R.; Rivera, A.; Brouard, C.; Chaussard, E. Quantitative mapping of groundwater depletion at the water management scale using a combined GRACE/InSAR approach. Remote Sens. Environ. 2018, 205, 408–418. [Google Scholar] [CrossRef]
  77. Da Lio, C.; Teatini, P.; Strozzi, T.; Tosi, L. Understanding land subsidence in salt marshes of the Venice Lagoon from SAR Interferometry and ground-based investigations. Remote Sens. Environ. 2018, 205, 56–70. [Google Scholar] [CrossRef]
  78. Hussain, M.A.; Chen, Z.; Shoaib, M.; Shah, S.U.; Khan, J.; Ying, Z. Sentinel-1A for monitoring land subsidence of coastal city of Pakistan using Persistent Scatterers In-SAR technique. Sci. Rep. 2022, 12, 5294. [Google Scholar] [CrossRef]
  79. Hazarika, N.; Nitivattananon, V. Strategic assessment of groundwater resource exploitation using DPSIR framework in Guwahati city, India. Habitat Int. 2016, 51, 79–89. [Google Scholar] [CrossRef]
  80. Shankar, K.; Aravindan, S.; Rajendran, S. GIS based groundwater quality mapping in Paravanar river sub-basin, Tamil Nadu, India. Int. J. Geomat. Geosci. 2010, 1, 282–296. [Google Scholar]
  81. McMillian, A. Salinas Valley Water Table Elevations: A Visualization Using GIS. Bachelor’s Thesis, California State University, Seaside, CA, USA, 2003. [Google Scholar]
  82. Naeem, U.A.; Gabriel, H.F.; Khan, N.M.; Ahmad, I.; Ur Rehman, H.; Zafar, M.A. Impact of urbanization on groundwater levels in Rawalpindi City, Pakistan. Pure Appl. Geophys. 2021, 178, 491–500. [Google Scholar]
  83. Khan, S.; Waseem, M.; Khan, M.A. A Seismic Hazard Map Based on Geology and Shear-wave Velocity in Rawalpindi-Islamabad, Pakistan. Acta Geol. Sin. 2021, 95, 659–673. [Google Scholar] [CrossRef]
  84. Quittmeyer, R.C.; Farah, A.; Jacob, K.H. The seismicity of Pakistan and its relation to surface faults. Geodyn. Pak. 1979, 58, 271–284. [Google Scholar]
  85. Ambraseys, N.; Lensen, G.; Moinfar, A.; Pennington, W. The Pattan (Pakistan) earthquake of 28 December 1974: Field observations. Q. J. Eng. Geol. Hydrogeol. 1981, 14, 1–16. [Google Scholar] [CrossRef]
  86. Mona, L. Seismic Hazard Assessment of District Mansehra, Khyber Pakhtoonkhawa, Pakistan. Acta Geol. Sin. 2014, 88, 1157–1168. [Google Scholar] [CrossRef]
  87. Adhami, N.; Ilyas, M.; Ahmad, M. Seismotectonic Studies of the Rawalpindi Region: Islamabad; National Engineering Services of Pakistan (NESPAK) Limited, Pakistan Atomic Energy Commission: Islamabad, Pakistan, 1980; 139 p. [Google Scholar]
  88. Bendick, R.; Bilham, R.; Khan, M.A.; Khan, S.F. Slip on an active wedge thrust from geodetic observations of the 8 October 2005 Kashmir earthquake. Geology 2007, 35, 267–270. [Google Scholar] [CrossRef]
  89. Kaneda, H.; Nakata, T.; Tsutsumi, H.; Kondo, H.; Sugito, N.; Awata, Y.; Akhtar, S.S.; Majid, A.; Khattak, W.; Awan, A.A. Surface rupture of the 2005 Kashmir, Pakistan, earthquake and its active tectonic implications. Bull. Seismol. Soc. Am. 2008, 98, 521–557. [Google Scholar] [CrossRef]
  90. Sayab, M.; Khan, M.A. Temporal evolution of surface rupture deduced from coseismic multi-mode secondary fractures: Insights from the October 8, 2005 (Mw 7.6) Kashmir earthquake, NW Himalaya. Tectonophysics 2010, 493, 58–73. [Google Scholar] [CrossRef]
  91. Jadoon, I.A.; Frisch, W. Hinterland-vergent tectonic wedge below the Riwat thrust, Himalayan foreland, Pakistan: Implications for hydrocarbon exploration. AAPG Bull. 1997, 81, 1320–1336. [Google Scholar]
  92. Zhang, Y.; Liu, Y.; Jin, M.; Jing, Y.; Liu, Y.; Liu, Y.; Sun, W.; Wei, J.; Chen, Y. Monitoring land subsidence in Wuhan city (China) using the SBAS-InSAR method with radarsat-2 imagery data. Sensors 2019, 19, 743. [Google Scholar] [CrossRef] [PubMed] [Green Version]
Figure 1. The geographical setting of the examined area.
Remotesensing 14 03722 g001
Figure 2. Examined area (in red) with footprints, reference points, and the master area (ascending and descending).
Remotesensing 14 03722 g002
Figure 3. Geological formations in the investigated area. Mss: Mesozoic sedimentary rocks, R: Rawalpindi group, S: Siwalik group, Q: Quaternary alluvium.
Remotesensing 14 03722 g003
Figure 4. Data processing steps in methodology.
Remotesensing 14 03722 g004
Figure 5. Star graphs showing the descending dataset’s temporal baseline distribution (path number 107).
Remotesensing 14 03722 g005
Figure 6. Star graphs showing the ascending dataset’s temporal baseline distribution (path number 173).
Remotesensing 14 03722 g006
Figure 7. The graphs between the connections and temporal coherence for descending track on the right and ascending track data on the left side.
Remotesensing 14 03722 g007
Figure 8. The scatter plots of descending on the right and ascending tracks on the left side.
Remotesensing 14 03722 g008
Figure 9. Land subsidence in the research area from ascending and descending paths.
Remotesensing 14 03722 g009
Figure 10. Comparison between subsidence values from the year 2019 to 2020.
Remotesensing 14 03722 g010
Figure 11. Land subsidence in the study area at different points (a, b, c, d, and e) from both ascending and descending tracks.
Remotesensing 14 03722 g011
Figure 12. Subsidence along with PS points (ae) (x-axis is the time from 2019–2021; y-axis represents subsidence).
Remotesensing 14 03722 g012
Figure 13. Showing the subsidence profile from North to South and North-West to South-East.
Remotesensing 14 03722 g013
Figure 14. (a) North-West to South-East subsidence trend graph (January 2019–June 2021; (b) North to South subsidence trend graph (January 2019–June 2021).
Remotesensing 14 03722 g014
Figure 15. Temporal expansion of tube-wells in the study area.
Remotesensing 14 03722 g015
Figure 16. Tube-well location map of the investigated area.
Remotesensing 14 03722 g016
Figure 17. Cracks in the walls of different buildings within the research area. (a) Cracks in the pillars of metro track at Committee Chowk, (bf) Cracks in walls of local houses in Raja Bazar, Waris khan, Rehmanabad, and Sadiqabad areas.
Remotesensing 14 03722 g017
Figure 18. Changes in groundwater level with the rise in population overtime.
Remotesensing 14 03722 g018
Figure 19. Water on roads in the research area during rain.
Remotesensing 14 03722 g019
Figure 20. Subsidence along the geological map in the research area.
Remotesensing 14 03722 g020
Table 1. Properties of Sentinel-1 (ascending and descending) datasets and their parameters.
Data InformationAscendingDescending
No. of images7673
Period of Acquisition7 January 2019–25 June 20218 January 2019–21 May 2021
Track no. 173107
ParametersDescription
Product typeSentinel-1 IW SLC
PolarizationVV + VH
BandC
Coverage (km2)250
Return frequency (day)12
Range (m)5
Azimuth resolution (m)20
Incident angle (degree)Vertical (23), Horizontal (45)
Table 2. Overview of water demand, usage, and accessibility in the study area.
ParametersPopulation
Total water demand67 MGD
Total water production51 MGD
Deficit16 MGD
Population2.3 million
Publisher’s Note: MDPI stays neutral with regard to jurisdictional claims in published maps and institutional affiliations.

